HYDRODYNAMIC CHARACTERISTIC STUDY OF A THREE PHASE CO-CURRENT TRICKLE-BED SYSTEM A thesis submitted in partial fulfillment of the requirements for the degree of Bachelor of Technology in Chemical Engineering by Nitish Kumar Singh Roll No. 110CH0506 Under the guidance of Dr. H. M. Jena DEPARTMENT OF CHEMICAL ENGINEERING NATIONAL INSTITUTE OF TECHNOLOGY, ROURKELA ORISSA -769 008, INDIA 2014

Welcome message from author
This document is posted to help you gain knowledge. Please leave a comment to let me know what you think about it! Share it to your friends and learn new things together.
Transcript
HYDRODYNAMIC CHARACTERISTIC STUDY OF A
THREE PHASE CO-CURRENT TRICKLE-BED SYSTEM
A thesis submitted in partial fulfillment of the requirements for the degree of
Bachelor of Technology
in
Chemical Engineering
by
Nitish Kumar Singh
Roll No. 110CH0506
Under the guidance of
Dr. H. M. Jena
DEPARTMENT OF CHEMICAL ENGINEERING
NATIONAL INSTITUTE OF TECHNOLOGY, ROURKELA
ORISSA -769 008, INDIA 2014

i
CERTIFICATE
This is to certify that the thesis entitled “Hydrodynamic Characteristic Study of a Three
Phase Co-current Trickle-Bed Reactor” being submitted by Nitish Kumar Singh
(110CH0506) as an academic project in the Department of Chemical Engineering, National
Institute of Technology, Rourkela, is a record of bonafide work carried out by him under my
guidance and supervision.
Place: Dr. H. M. Jena
Date: Department of Chemical Engineering
National Institute of Technology
Rourkela - 769008
INDIA

ii
ACKNOWLEDGEMENT
I wish to express my sincere thanks and gratitude to Prof. Dr. H. M. Jena (Project Guide) for
suggesting me the topic and providing me the guidance, motivation and constructive criticism
throughout the course of the project.
I also express my sincere gratitude to Prof. Dr. R. K. Singh, Head and Project Coordinator
of Department of Chemical Engineering, National Institute of Technology, Rourkela, for
their valuable guidance and timely suggestions during the entire duration of my project work,
without which this work would not have been possible. I am also grateful to Department,
Chemical Engineering for providing me the necessary opportunities for the completion of my
project.
Nitish Kumar Singh
110CH0506

iii
ABSTRACT
Trickle-bed has been extensively used in chemical process industries mainly in petrochemical
and refinery process since it provide flexibility and simplicity of operation as well as high
throughputs. The basic parameter which is used in the design, scale-up and operations of a
trickle bed reactor are the pressure gradient and liquid saturation. Knowledge of these
hydrodynamics parameters and prevailing flow regime is the fundamental parameters for the
design and performance evaluation of the reactor. But trickle bed reactor involves complex
interaction of gas and liquid phase with packed solid which is very difficult to understand.
Many computational models have been developed and extensive computational fluid
dynamics study of hydrodynamics parameters has been done in last few decades to
understand the behavior of trickle bed reactor.
In the present study experiments have been carried out in a concurrent downflow air water
trickle bed reactor to investigate the pressure drop and dynamic liquid saturation in trickle
flow and pulse flow regime. In trickle flow regime it is found that dynamic liquid saturation
increases with increase in liquid flow rate followed by decrease when transition to pulse flow
regime begins. However, in the pulse flow regime a dip in the dynamic liquid saturation curve
is found. A sudden rise in pressure drop is observed when transition from trickle to pulse flow
regime occurs.
Keywords: Hydrodynamics, Trickle-bed reactor, Dynamic liquid saturation, Pressure Drop

iv
CONTENTS
Acknowledgement ii
Abstract iii
Contents iv
List of tables v
List of Figures vi
Nomenclature v
1. Introduction 1
1.1. Trickle bed reactor 1
1.2. hydrodynamic of trickle flow 3
1.3. advantage and disadvantage of trickle bed 5
1.4. application of trickle bed reactor
1.5. Literature review 8
1.6. Scope 8
1.7. Experimental review 9
1.8. Objective of the project 13
2. Experimental setup 14
3. Experimental procedure 16
4. Observations 17
5. Results and Discussions 25
5.1 Pressure drop 25
5.2 Dynamic liquid saturation 26
5.3 Pressure at different points in the bed 27
5.4 comparison with literatures 28
6. Conclusion 29
7. Future scope of the project 30
8. References 31
v
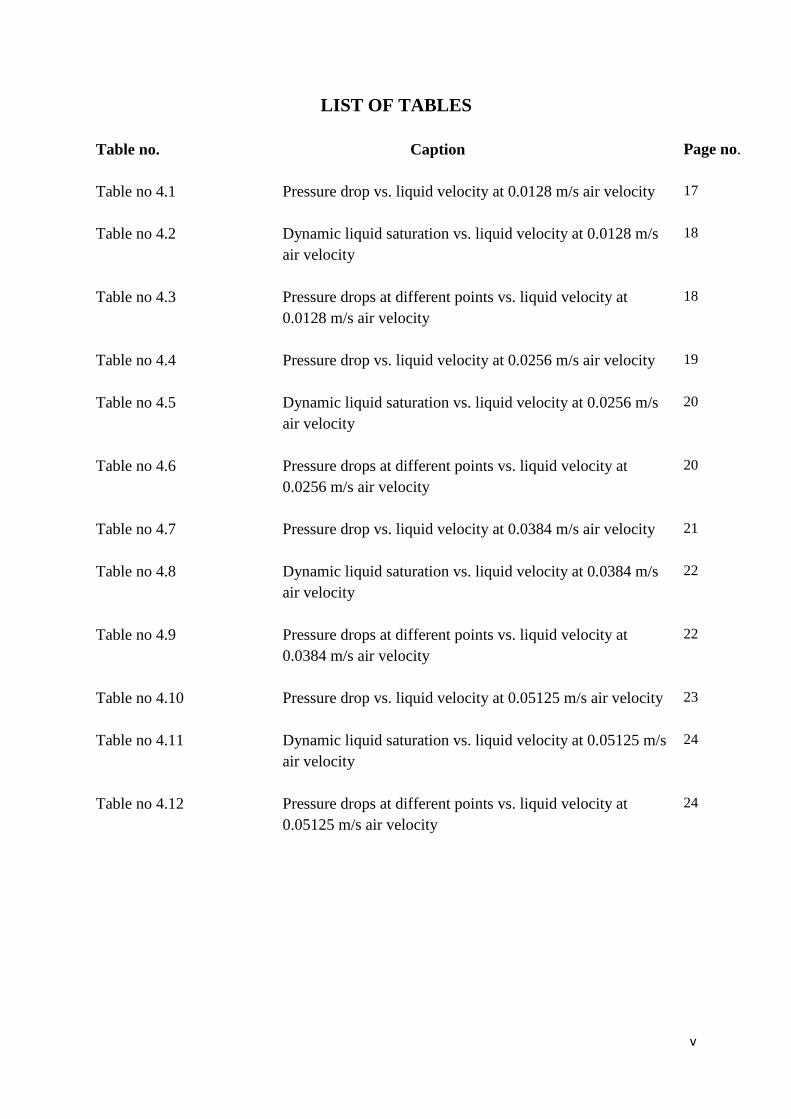
LIST OF TABLES
Table no.
Caption Page no.
Table no 4.1 Pressure drop vs. liquid velocity at 0.0128 m/s air velocity
17
Table no 4.2 Dynamic liquid saturation vs. liquid velocity at 0.0128 m/s
air velocity
18
Table no 4.3 Pressure drops at different points vs. liquid velocity at
0.0128 m/s air velocity
18
Table no 4.4 Pressure drop vs. liquid velocity at 0.0256 m/s air velocity
19
Table no 4.5 Dynamic liquid saturation vs. liquid velocity at 0.0256 m/s
air velocity
20
Table no 4.6 Pressure drops at different points vs. liquid velocity at
0.0256 m/s air velocity
20
Table no 4.7 Pressure drop vs. liquid velocity at 0.0384 m/s air velocity
21
Table no 4.8 Dynamic liquid saturation vs. liquid velocity at 0.0384 m/s
air velocity
22
Table no 4.9 Pressure drops at different points vs. liquid velocity at
0.0384 m/s air velocity
22
Table no 4.10 Pressure drop vs. liquid velocity at 0.05125 m/s air velocity
23
Table no 4.11 Dynamic liquid saturation vs. liquid velocity at 0.05125 m/s
air velocity
24
Table no 4.12 Pressure drops at different points vs. liquid velocity at
0.05125 m/s air velocity
24
vi
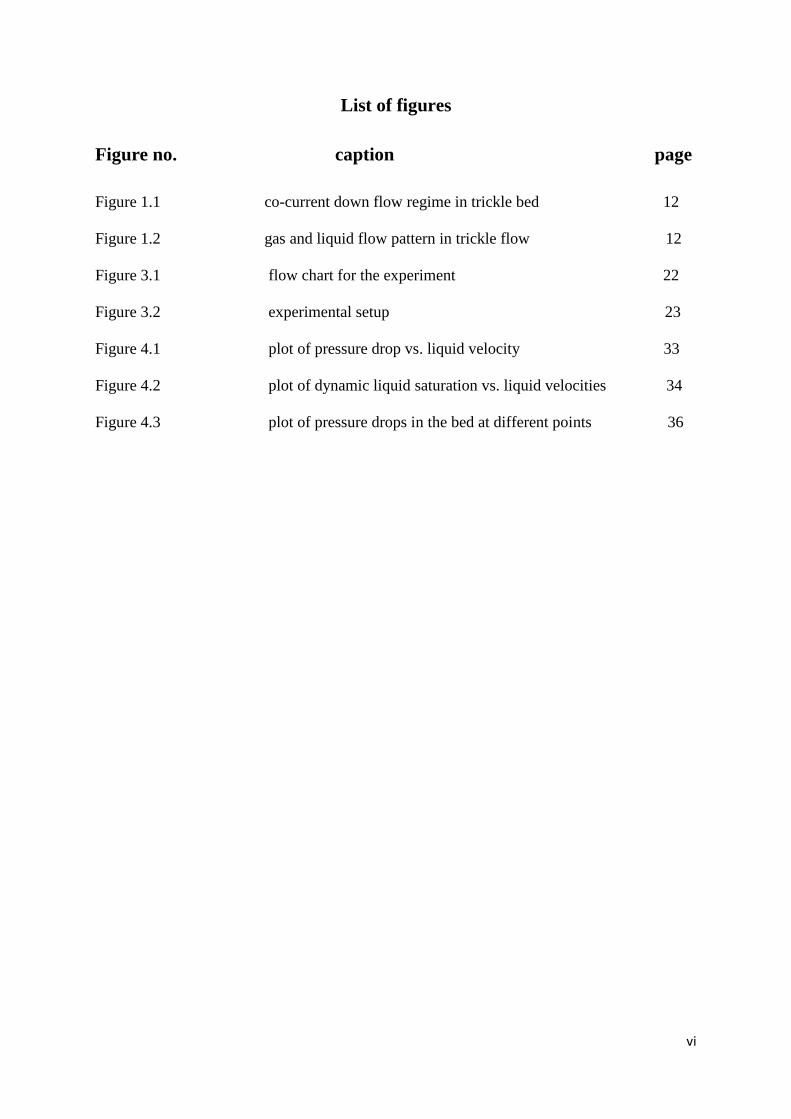
List of figures
Figure no. caption page
Figure 1.1 co-current down flow regime in trickle bed 12
Figure 1.2 gas and liquid flow pattern in trickle flow 12
Figure 3.1 flow chart for the experiment 22
Figure 3.2 experimental setup 23
Figure 4.1 plot of pressure drop vs. liquid velocity 33
Figure 4.2 plot of dynamic liquid saturation vs. liquid velocities 34
Figure 4.3 plot of pressure drops in the bed at different points 36

1
Chapter 1
INTRODUCTION
1.1 Trickle Bed Reactor:
A trickle bed reactor is commonly known as a packed bed of stationary particle that are
subjected to co-current gas and liquid flow at relatively low fluid superficial velocities. It is
the simplest reactor for performing catalytic reactions. Trickle bed reactor has various use in
petroleum refining, in chemical and process industries, in pollution control and biochemical
industries. For chemical engineers the major challenges of trickle bed reactor are the design
and scale up of the reactors. The elementary mathematical representation of trickle flow
dynamics has not been accomplished. The design and scale-up of trickle bed reactors depend
on key hydrodynamic variables such as liquid volume fraction (dynamic liquid saturation),
particle wetting and overall gas–liquid distribution. Some of the important aspects for design
of Trickle-bed reactor are: (Sie and Krishna, 1998)
1. Pressure Drop
2. Liquid and Gas Holdups
3. Catalyst Contacting
4. Axial and Radial Dispersion of liquid and gas
5. Mass Transfer
6. Heat Transfer
7. Thermal stability
The interactions between these has been poorly understood. Even though many
experimental studies have been reported in measurement of these variables, but no coherent
and conclusive methodology for doing so has yet been obtained. In order to explain the
hydrodynamics of trickle bed reactor many models and approaches has been proposed by the
authors.
In trickle bed reactor Hydrodynamics is classified in terms of hydrodynamics
parameter like pressure drop, liquid holdup, gas holdup, liquid mal-distribution which are
related in some way to the gas-liquid-solid contacting effectiveness and operational efficiency
of the reactor column. A phenomenon that greatly complicates the mathematical description
of trickle bed reactor is that these hydrodynamic variables are path variable, which depend on
the history of the operation.
Factors which affect the performance of a trickle bed reactor are:
• Porosity
2
• Particle size
• Liquid density
• Liquid viscosity
• Surface tension
• Liquid superficial velocity
• Gas superficial velocity
• Pressure (gas density)
1.2 Hydrodynamics of trickle flow:
The performance of the trickle flow column is mainly depended on the hydrodynamics of
trickle flow. We will come across some generally used parameters like holdup of the liquid
and pressure drop, the holdup of the gas is a roughly symbolic of the liquid-solid contact
efficiency. The overall operating cost will also depended on the pressure drop, sometimes it is
an implication of degree of gas-solid interaction. The external liquid-solid mass transfer area
is also proportional to the wetting efficiency (Satterfield, 1975).
1.2.1 Flow Regimes
Depending upon the operating conditions and gas and liquid velocities a number of flow
regimes can be seen in the trickle bed reactor. Trickle flow regime is mainly determined by
superficial velocities of liquid and gas. For downward co-current flow of gas and liquid
flowing through the bed of solid particles four types of regime can be distinguished (Sie &
Krishna, 1998).
1. Trickle flow (gas continuous)
2. Pulse flow (unstable regime with partly gas continuous and partly liquid continuous)
3. Dispersed bubble flow
4. Spray flow (gas continuous, highly dispersed liquid)

3
Figure 1.1 Co-current down flow regime in a trickle bed reactor
The increase of operating pressure plays an important role in the shifting flow regime
between the trickle-flow and pulse-flow regime (Wammes et al, 1990). The region of stable
trickle flow also extends to higher velocity as the pressure increases. The catalyst particle
tends to be covered by a film of liquid of varying thickness, in trickle flow whereas gas tends
to flow through interstitial space which is not occupied by the liquid. In the figure 1.2 it is
clearly shown.
Figure 1.2. Gas and liquid flow pattern in a Trickle-Flow
1.3 Advantages and Dis-advantages of Trickle-Bed Reactor:
The main advantages of trickle-bed reactors are as follows:
• Inside a trickle-bed reactor the flow is closed to plug flow of liquid phase and gas phase.
Gas

4
• There is no problem of flooding as occurs in counter-current flow Because of co-current flow
of gas and liquid.
• The Trickle bed construction is simple and easy to operate with fixed beds. If the reaction is
exothermic in this case, there will be an excessive rise in temperature it can be limited by gas
or liquid recycle.
The main Dis-advantages of trickle-bed reactors are as follows:
• Mal-distribution, channeling and incomplete catalyst wetting occurs at low liquid velocities.
• For high gas-liquid interaction counter-current operation is a preferred mode of operation, but
usually not possible at practical velocities due to flooding.
• The radial dispersion of heat and mass is a problem in the case of trickle-bed. For highly
endothermic or exothermic reactions multi-tubular or internally cooled fixed beds are
necessary.
1.4 Application of Trickle-Bed Reactor:
Trickle bed reactors have been commonly used in the petroleum industry for many years and
are now gaining wild use in several other fields from electrochemical and bio chemical
industries to the repetition of surface and underground water resources, being also recognized
for its applications in advanced wastewaters treatments (Rodrigo et al, 2009). In a large number
of processes in a refineries for operations such as fine chemicals and biochemical operations
the packed bed reactors with multiphase flow have been preferred. The effective scale up of
packed bed reactors in the development of new processes and scale down of the commercial
units in the improvement of existing processes have become major tasks in the research and
development section of many companies ( Sie& Krishna, 1998). Various processes using
trickle bed reactor are:
• Hydro-desulfurization of gas-oil, vacuum gas-oil and residues.
• Hydro-de-nitrogenation of gas-oil and Vacuum gas-oil.
• Hydro cracking of cat-cracked gas-oil and vacuum gas-oil.
• FCC feed Hydro-treating.
• Hydro-metallization of residual oil.
• Hydro-cracking of residual oil.
• Hydro-cracking/Hydro-fining of lubeoils
• Hydro-processing of shale oils Paraffin Synthesis by Fischer-Tropsch.
• Oxidative Treatment of Waste water.
• Synthesis of diols.

5
• 1.5 Literature Review
Most of the experimental studies on Trickle-bed hydrodynamics were restricted to trickle and
pulse flow regimes. Several aspects of hydrodynamics including flow pattern, gas and liquid
holdup, wetting efficiency etc. were thoroughly studied by Satterfield and co-workers.
(Satterfield, 1975). The effect of boundary on trickle bed reactor hydrodynamics is studied by
Sundaresan. They examined the effect of boundaries and effect on the hysteresis by taking four
different beds with different packing. He studied the effect of superficial liquid and gas
velocities on the pressure drop of the column (Sundaresan et al 1991).
The influence of the gas density on the liquid holdup, the pressure drop, and the
transition between trickle and pulse flow has been investigated in a trickle-bed reactor at high
pressure with nitrogen or helium as the gas phase was investigated by Wammes,(Wammes et al
1991).CO absorption from C02/N2 gas mixtures into amine solutions are used to determine the
gas-liquid interfacial areas. The gas-liquid interfacial area increases when operating at higher
gas densities. They showed that the gas density has a strong influence on the liquid holdup.
To determine the flow regime in a trickle bed reactor latifi used micro-electrode in
a non-conducting wall and analyzed the wall wetting by Probability Density Function. He also
identified the trickling-pulsing, trickling-dispersed and dispersed-pulsing regime transition
(Latifi et al 1992).
To examine the influence of various parameters on pressure drop hysteresis Wang
conducted experimental work with three different gas-liquid systems and three kinds of
pickings. (Wang et al 1995).The most important factors that influence the behavior of
hysteresis in the packed reactor, and liquid flow rate are the gas and liquid flow rates, physical
properties of liquid and operation modes. They found that the hysteresis is not so pronounced
for columns packed with large particles and it disappears in the pulsing flow regime and the
mechanism responsible for hysteretic behavior resides in the variable uniformity of gas-liquid
flow in the packed section. A parallel zone model for pressure drop in the trickling flow
regime was established on the basis of experimental facts and analysis of flow structure.
Extensive experimental work on hysteresis in a concurrent gas–liquid up flow
packed bed was carried out with three kinds of packing and the air–water system done by
Mao,(Mao et al 2001). Two more liquids with different liquid properties were employed to
further examine the influence of parameters on pressure drop hysteresis.
(Kundu et al 2001) studied the radial distribution in a trickle bed reactor with five
different size of catalytic packing with uniformly distributed liquid inlet.

6
(Trivizadakis et al 2004) worked on two types of catalytic particle packing i. e.
spherical and cylindrical extrudes to study co-current down flow in steady state trickling and
induced liquid-pulsing mode operation and predicted the mechanical characteristics of trickle
bed reactor.
Experimental and theoretical study of forced unsteady-state operation of trickle-
bed reactors in comparison to the steady-state operation is done by Lange. In their study a
forced periodic operation of a trickle-bed reactor an unsteady-state technique was used in
which the catalyst bed was contacted periodically with different liquid flow rates.(Lange et al
2004) The unsteady-state operation was considered as square-waves cycling liquid flow rate
at the reactor inlet. They demonstrated that the liquid flow variation has a strong influence on
the liquid hold-up oscillation and on the catalyst wetting efficiency.
(Gunjal et al 2005) used wall pressure fluctuation measurements to identify
prevailing flow regime in trickle beds. Experiments were carried out on two scales of columns
(of diameter 10 cm and 20 cm) with two sets of particles (3 mm and 6 mm diameter spherical
particles). Effects of pre-wetted and un-wetted bed conditions on pressure drop and liquid
holdup were reported for a range of operating conditions.
(Maiti et al 2006) made a concise review of the hysteresis in co-current down-flow
trickle bed reactors (TBRs). The effects of several factors on the hysteresis, such as the type of
particles (porous/nonporous), the size of the particles, the operating flow ranges, and the start-
up conditions (wet/dry) were studied. Also effects of other factors, such as addition of wetting
agents (surfactants) and inlet liquid distribution, are also determined. Empirical and
theoretical models were developed to predict hysteresis. An attempt was made to understand
the comprehensive hysteretic behavior of both porous and nonporous particles with the
conceptual framework of hysteresis.
(Saroha & Nandi 2008) performed experiment to study the effect of liquid and gas
velocity, liquid surface tension, liquid viscosity and particle diameter of the packing in two
phase pressure drop hysteresis. An understanding of the hydrodynamics of trickle bed reactors
(TBR) is essential for their design and prediction of their performance was made by
The Flow variables, packing characteristics, physical properties of fluids and operation modes
influence the behavior of the trickle bed reactors.
The existence of multiple hydrodynamic states or hysteresis (pressure drop, liquid
holdup, catalyst wetting gas--liquid mass transfer) due to the different flow structures in the
packed bed was studied, (Saroha et al 2008). Experiments were performed to study the effect
of liquid and gas velocity, liquid surface tension, liquid viscosity and the particle diameter of

7
the packing on two-phase pressure drop hysteresis. He developed the parallel zone model for
pressure drop hysteresis in the trickling flow was for analysis of experimental data and flow
structure.
Trickle bed has been found useful in production of H2O2 in E- Fenton process
(Yangming et. al.). To avoid electrolyte leakage and gas bubbles in the E- Fenton reactors,
trickle bed cathode is used by coating a layer composed of C- PTFE onto graphite chips
instead of carbon cloth.
There are many uses of trickle bed reactors in the petroleum industry, as well as
in the chemical process industry (Saroha and Nigam, 1996). Studies about the hydrodynamics
of trickle flow using foaming liquids is still an orphan research topic in comparison to many
literature related to the non- foaming systems. Foams play important role in petroleum,
pharmaceuticals and food industries (Bartelmus and janecki, 2004). The foams in industries is
used to lower the surface tension. There are a lot of literatures available on foaming liquids
but literature are very less regarding the hydrodynamics of two- phase flow fixed bed reactors
using (non-)Newtonian foaming fluids. Thus far few experimental studies on foaming fluids
have been published (Larkins et al. 1961; Weekman and Myers, 1964; Sai, 1997). These
author recognize that the value of liquid holdup for foaming liquids are much lower than those
in non-foaming systems.
1.6 scope
Trickle-bed reactors (TBR) are one of the most extensively used three-phase reactors. A
fundamental understanding of the hydrodynamics of trickle-bed reactors can not be forgotten
in their design scale-up and performance. In each flow regime the hydrodynamics of the
trickle bed are affected differently in the three-phase reactors (Gas-Liquid-Solid) and gaseous
phases have various applications, especially in the petroleum industry for hydro-processing of
oils (e.g. hydro-treating, hydro cracking). With the prospects of developing more efficient
TBR units in the future, for meeting strict environmental and profitability targets, it is crucial
that we know about the flow patterns in beds to match the demands made by the kinetics of
these reaction processes. One of the problem industries encounter in the efficient use of TBRs
is the understanding and prediction of liquid mal-distribution. With current interest in
technologies of "deep" processing, such as Deep hydrodesulphurization, the need to be able to
predict liquid misdistribution accurately is even more important, since small variations in
liquid distribution can cause significant loss in activity in trickle-bed reactors.

8
1.7 Objective of the work
The aim of the present work includes:
• The hydrodynamic study of three phase co-current Trickle bed.
• The determination of dynamic liquid and phase holdup in a gas-liquid-solid Trickle bed.
• Analysis of the liquid holdup behavior and various parameters that affect the holdup.
• Examining the effect of superficial gas and liquid velocity on the individual liquid holdup.
The present work is concentrated on understanding the liquid holdup and pressure drop
behaviors in a three phase co-current Trickle bed. Trickle bed of height 128 cm with diameter
of 0.1 m has been fabricated. Raschig ring of diameter 6.2 mm are used as the solid packing.
Gas (Air) is taken as the continuous phase. Liquid (water) and Gas (air) has been injected at
the top with different superficial velocities. In all the cases the Solid (raschig ring) volume
fraction is taken to be 0.63 with the superficial velocity of gas varying from 0.0128-0.05125
m/s and that of liquid ranging from 0.00128-0.0153 m/s.

9
Chapter 3
Experimental setup and Technique
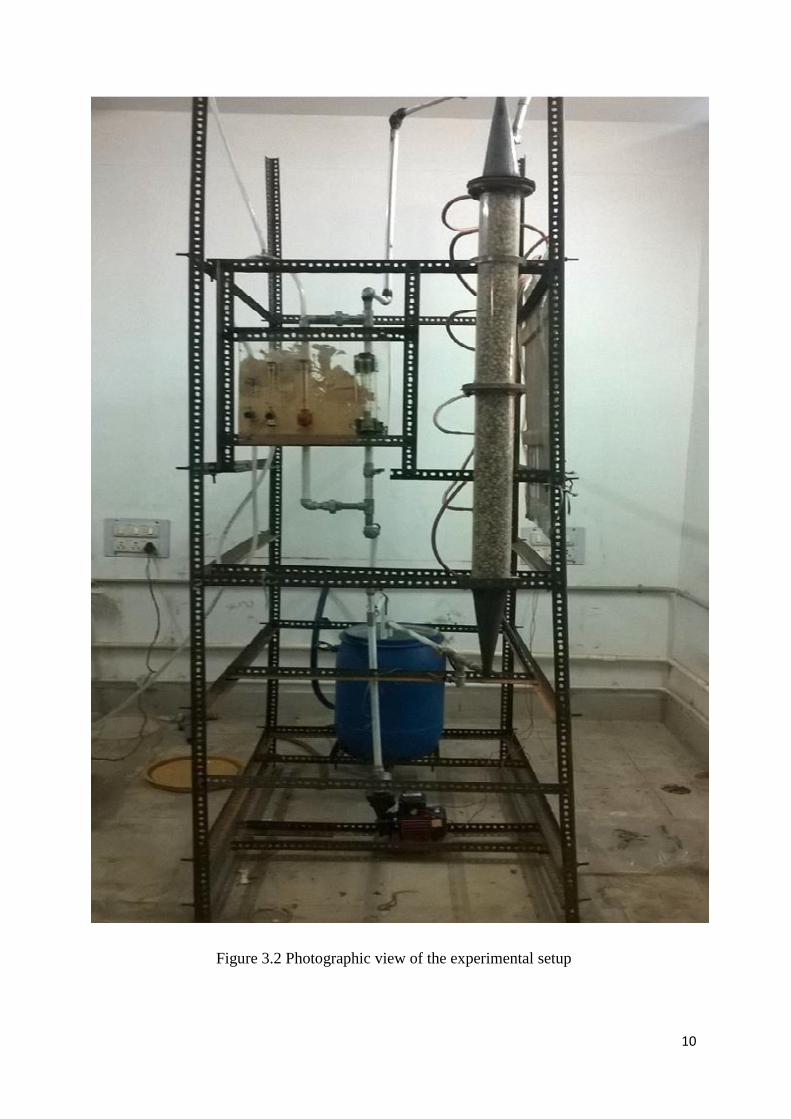
Experiments were carried out on a glass column whose internal diameter is 91 mm and outer
diameter is 100 mm. the height of the column is 128 cm. Glass column was packed with raschig
ring having length 11.5 mm and diameter is 6.2 mm. Schematic diagram is shown in figure.
Entry for air and water is provided at the top of the column. The packing in the column is
supported on a thick wire mesh. The whole setup was supported on the slaughtered angle. A
distributor is placed on the top of the column with 120 holes having 3 mm diameter. There is a
compressor which provides necessary air flow rate into the column through air flow rotameter.
There is a motor connected to the tank that supplies necessary water to the column via water
flow rotameter. At several points in the column, a monometer is connected to measure the
pressure drop.
Figure 3.1 Schematic representation of the experimental setup
10
Figure 3.2 Photographic view of the experimental setup

11
Experimental Procedure
The column is initially flooded with water alone to completely wet the packing.
Then it is drained and again liquid is flown into the column at 0.00128 m/s.
Air velocity is set at 0.0128 m/s.
Column is left for 30 minutes for uniform wetting and to attain the steady state.
We observe the liquid flow pattern and write down the readings of manometer.
Then gas and liquid flow rate is stopped and outlet and inlet valves of the reactor are shut off.
The column is again left for 30 minutes to attain the steady state. After 30 minute outlet valve is
opened and water is allowed to drain. That water is collected in the flask and measured.
Keeping the air velocity constant at 0.0128 m/s liquid velocity is increased to 0.00256 m/s.
Repeat the same process for 0.0256 m/s and readings of manometer and volume of water
collected in the flask after the drainage is taken.
Now change the air velocity to 0.0384 m/s and then 0.05145 m/s and at different liquid velocity
manometer readings and volume of water collected is taken.
Equipment Characteristics
Column Specification
Height of the column 128 cm
Column inner diameter 9.1 cm
Column outer diameter 10 cm
Area of the column 65.038 cm2
Volume of the empty column
8.2 liter
Distributor
Material used Mild steel
Thickness of the distributor 1 mm
No. of holes 120
Hole diameter
3 mm
Pipe Specification
Pipe used PVC pipe
Pipe diameter
½ inch
Packing material
Material used Raschig ring
Raschig ring outer diameter 6.25 mm
Voidage 0.63
Manometer used U-tube manometer
Valve used
Gate valve
Operating conditions
Air superficial velocity 0.0128-0.05125 m/s
liquid superficial velocity 0.00128-0.0153 m/s
12
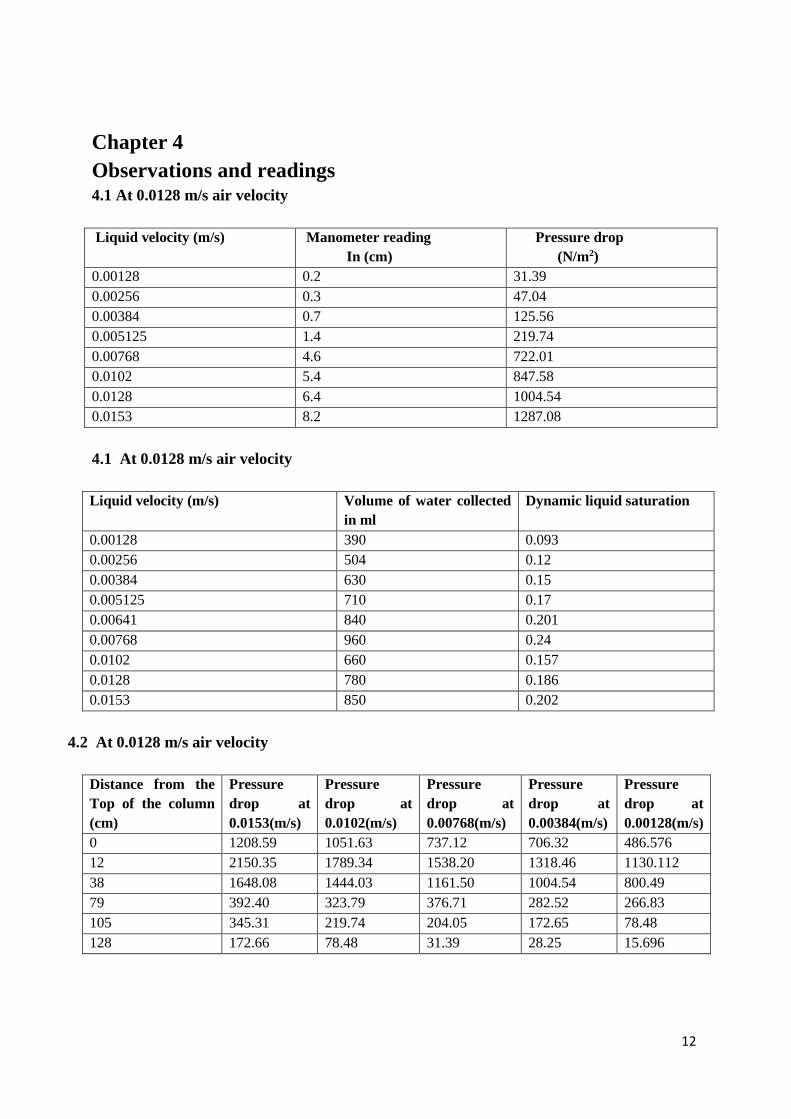
Chapter 4
Observations and readings 4.1 At 0.0128 m/s air velocity
Liquid velocity (m/s) Manometer reading
In (cm)
Pressure drop
(N/m2)
0.00128 0.2 31.39
0.00256 0.3 47.04
0.00384 0.7 125.56
0.005125 1.4 219.74
0.00768 4.6 722.01
0.0102 5.4 847.58
0.0128 6.4 1004.54
0.0153 8.2 1287.08
4.1 At 0.0128 m/s air velocity
Liquid velocity (m/s) Volume of water collected
in ml
Dynamic liquid saturation
0.00128 390 0.093
0.00256 504 0.12
0.00384 630 0.15
0.005125 710 0.17
0.00641 840 0.201
0.00768 960 0.24
0.0102 660 0.157
0.0128 780 0.186
0.0153 850 0.202
4.2 At 0.0128 m/s air velocity
Distance from the
Top of the column
(cm)
Pressure
drop at
0.0153(m/s)
Pressure
drop at
0.0102(m/s)
Pressure
drop at
0.00768(m/s)
Pressure
drop at
0.00384(m/s)
Pressure
drop at
0.00128(m/s)
0 1208.59 1051.63 737.12 706.32 486.576
12 2150.35 1789.34 1538.20 1318.46 1130.112
38 1648.08 1444.03 1161.50 1004.54 800.49
79 392.40 323.79 376.71 282.52 266.83
105 345.31 219.74 204.05 172.65 78.48
128 172.66 78.48 31.39 28.25 15.696
13
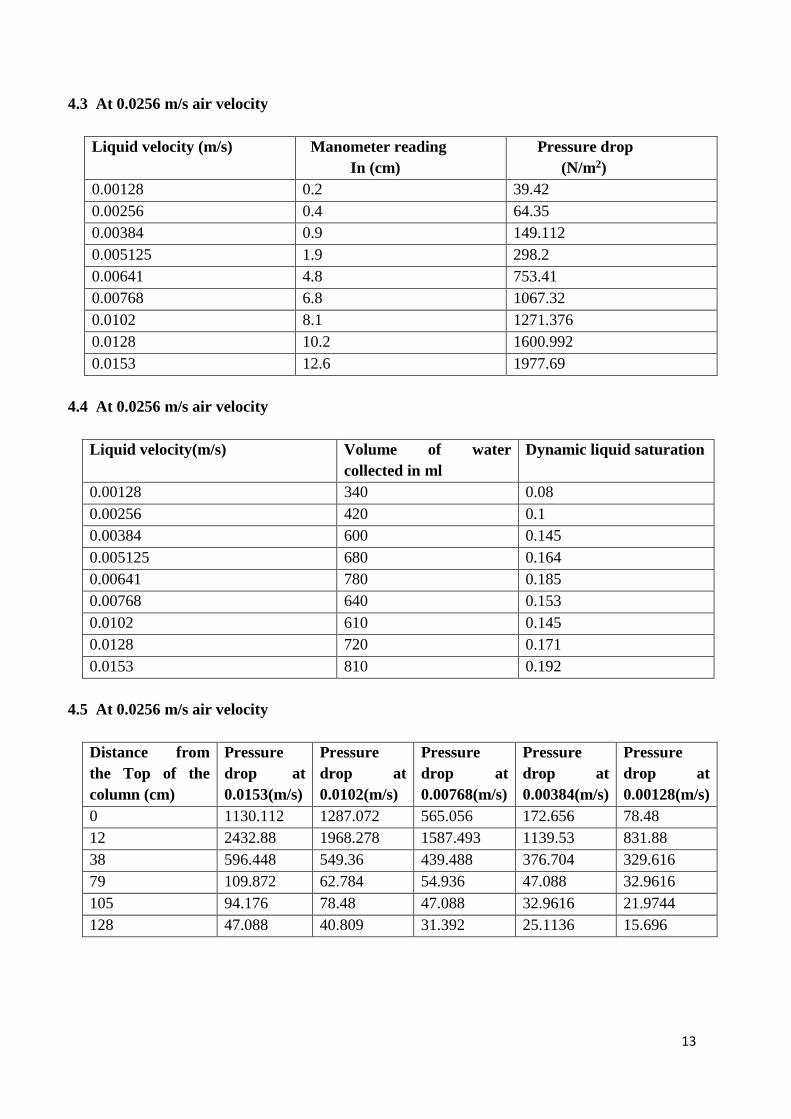
4.3 At 0.0256 m/s air velocity
Liquid velocity (m/s) Manometer reading
In (cm)
Pressure drop
(N/m2)
0.00128 0.2 39.42
0.00256 0.4 64.35
0.00384 0.9 149.112
0.005125 1.9 298.2
0.00641 4.8 753.41
0.00768 6.8 1067.32
0.0102 8.1 1271.376
0.0128 10.2 1600.992
0.0153 12.6 1977.69
4.4 At 0.0256 m/s air velocity
Liquid velocity(m/s) Volume of water
collected in ml
Dynamic liquid saturation
0.00128 340 0.08
0.00256 420 0.1
0.00384 600 0.145
0.005125 680 0.164
0.00641 780 0.185
0.00768 640 0.153
0.0102 610 0.145
0.0128 720 0.171
0.0153 810 0.192
4.5 At 0.0256 m/s air velocity
Distance from
the Top of the
column (cm)
Pressure
drop at
0.0153(m/s)
Pressure
drop at
0.0102(m/s)
Pressure
drop at
0.00768(m/s)
Pressure
drop at
0.00384(m/s)
Pressure
drop at
0.00128(m/s)
0 1130.112 1287.072 565.056 172.656 78.48
12 2432.88 1968.278 1587.493 1139.53 831.88
38 596.448 549.36 439.488 376.704 329.616
79 109.872 62.784 54.936 47.088 32.9616
105 94.176 78.48 47.088 32.9616 21.9744
128 47.088 40.809 31.392 25.1136 15.696

14
4.6 At 0.0384 m/s air velocity
Liquid velocity (m/s) Manometer reading
In (cm)
Pressure drop
(N/m2)
0.00128 0.4 62.70
0.00256 1.2 188.352
0.00384 2.1 329.616
0.005125 5.8 910.36
0.00641 8.2 1287.07
0.00768 10.5 1657.49
0.0102 11.8 1852.12
0.0128 12.6 1977.69
0.0153 14.2 2228.832
4.7 At 0.0384 m/s air velocity
Liquid velocity (m/s) Volume of water
collected in ml
Dynamic liquid saturation
0.00128 310 0.074
0.00256 340 0.08
0.00384 550 0.131
0.005125 640 0.152
0.00641 530 0.126
0.00768 550 0.132
0.0102 570 0.13
0.0128 630 0.15
0.0153 670 0.16
4.8 At 0.0384 m/s air v3elocity
Distance from
the Top of the
column (cm)
Pressure
drop at
0.0153(m/s)
Pressure
drop at
0.0102(m/s)
Pressure
drop at
0.00768(m/s)
Pressure
drop at
0.00384(m/s)
Pressure
drop at
0.00128(m/s)
0 3233.376 1805.04 910.368 125.568 109.872
12 4112.352 2448.576 1600.992 1145.808 1067.328
38 690.624 580.752 643.536 533.664 439.488
79 520.272 439.488 235.44 219.744 141.264
105 219.744 204.048 188.352 172.656 125.568
128 67.784 54.936 47.088 40.8096 23.544

15
4.10 At 0.05125 m/s air velocity
Liquid velocity (m/s) Manometer reading
In (cm)
Pressure drop
(N/m2)
0.00128 0.5 81.62
0.00256 1.8 282.52
0.00384 5.3 831.88
0.005125 7.9 1250.81
0.00641 9.8 1553.25
0.00768 11.8 1866.25
0.0102 13.2 2071.18
0.0128 14.6 2291.61
0.0153 15.5 2684.02
4.11 At 0.05125 m/s air velocity
Liquid velocity(m/s) Volume of water
collected in ml
Dynamic liquid
saturation
.00128 210 0.05
0.00256 250 0.06
0.00384 530 0.126
0.005125 450 0.107
0.00641 430 0.102
0.00768 380 0.09
0.0102 460 0.11
0.0128 500 0.12
0.0153 550 0.132
4.12 At 0.05125 m/s air velocity
Distance from
the Top of the
column (cm)
Pressure
drop at
0.0153(m/s)
Pressure
drop at
0.0102(m/s)
Pressure
drop at
0.00768(m/s)
Pressure
drop at
0.00384(m/s)
Pressure
drop at
0.00128(m
/s)
0 2417.184 1224.288 847.584 753.408 486.576
12 4269.312 1946.304 1192.896 988.848 910.368
38 2919.456 1585.296 973.152 800.496 655.232
79 816.192 722.016 596.448 376.704 266.832
105 188.352 94.176 81.6192 62.784 31.392
128 50.227 43.948 31.392 28.2528 15.696

16
Chapter 5
Results and discussion 5.1 Pressure Drop:
Figure shows the relationship between pressure drop in the bed and the liquid velocity at a
various gas flow rate. It has been observed that as we increase the flow rate of the liquid in the
column keeping the air flow rate constant the pressure drop in the bed increases. But at a
particular liquid flow rate a steep rise in the pressure drop is noticed and that is the onset of
transition region from the trickle flow to pulse flow.
Figure 5.1 Plot of pressure drop vs. liquid velocity at different air velocity
When we increase the air velocity, we observe that the transition from trickle flow to pulse flow
occurs at a lower liquid flow rate. At higher air flow rate, transition starts early and there is a
much increment in pressure drops.
0
500
1000
1500
2000
2500
3000
0 0.005 0.01 0.015 0.02
air velocity
0.0128 m/s
0.0256 m/s
0.0384 m/s
0.05125 m/s
Pre
sure
dro
p(N
/m2
)
liquid velocity (m/s)

17
5.2 Dynamic Liquid Saturation:
Figure 6 shows the plot of dynamic liquid saturation vs. liquid flow rate at various gas flow
rates.
Figure 5.2 Plot of Dynamic liquid saturation vs. liquid velocity
5.2.1 Effects of liquid flow rate:
In the trickle flow regime the dynamic liquid saturation increases with increase in liquid flow
rate at constant air flow rate. On increasing the liquid flow rate a point will reach where some
small bubbles will begin to form in the bed and here starts the transition from trickle flow to
pulse flow. In transition reason dynamic liquid saturation decreases with increase in liquid
velocity. Further increase in liquid flow rate causes the bed to be filled with bubbles and it
results in the lowest dynamic liquid saturation. The reason for this is that during the bubble
formation space is occupied by the bubbles which is otherwise occupied by the liquid in trickle
regime. After this point increase in the liquid flow rate causes dynamic liquid saturation to
increase.
0
0.05
0.1
0.15
0.2
0.25
0.3
0 0.005 0.01 0.015 0.02
Air velocity
0.0128 m/s
0.0256 m/s
0.0384 m/s
0.05125 m/s
liquid velocity (m/s)
Dyn
amic
Liq
uid
Sa
tura
tio
n

18
5.2.2 Effect of Air flow rate:
From the above figure it is clear that with increase in the air flow rate dynamic liquid saturation
decreases and the lowest dynamic saturation point shifts toward lower liquid flow rate. At
higher air flow rate more and more spaces will be occupied by the air and thus dynamic liquid
saturation decreases. The lowest dynamic saturation point suggests that at higher air flow rate
the transition starts at lower liquid flow rate.
5.3 Comparison of literatures with present dynamic liquid saturation Data
References Dynamic liquid saturation for packed bed with
raschig ring
Larkins et al.(1961) 0.668
Hochman and Effron(1969) 0.476
Otake and okada(1953) 0.722
Fu et al.(1996) 0.245
Present work 0.241
It was observed that the present dynamic liquid saturation is found to be close to the result
obtained by the Fu et al. at 0.0128 m/s air velocity and 0.00128 m/s liquid velocity. The reason
of variations from the other authors may be the different conditions and experimental errors.
5.4 Pressure drops at different points in the bed:
It is observed that at constant air flow rate the pressure drop decreases as we move down along
the bed. But at higher liquid velocity theses pressure drops are higher than that at lower liquid
velocities. At the top of the column pressure drop is low because that point is just below the
distributor and there is fluctuation in pressure drop. Otherwise at the second point i.e. at 12 cm
from the top the pressure is high and it decreases as we go down.

19
Figure 5.3 Pressure drop at different points in the bed
0
500
1000
1500
2000
2500
0 20 40 60 80 100 120 140
liquid velocity
0.00128 m/s
0.00384 m/s
0.00768 m/s
0.0102 m/s
0.0153 m/s
Pre
suu
re d
rop
(N/m
2)
Distance From the top of the column(cm)
At 0.0128 m/s air velocity (point pressure drop)

20
Chapter 6
Conclusions:
Based on the above results and discussion we can draw following conclusions.
1. The pressure drop in the column increases as we increase the liquid or air flow rate.
2. When Transition from trickle to pulse flow occurs then there is a sudden increase in the pressure
drop.
3. At higher air flow rate these transitions occur at lower liquid flow rate.
4. The dynamic liquid saturation increases with increase in liquid flow rate but from transition
point it begins to decrease till pulse flow regime and due to that there is a dip in the dynamic
liquid saturation curve.
5. At higher air flow rate the dynamic liquid saturation curve is lower than that at lower air flow
rate and the peak of the curve also occurs at lower liquid flow rate.
6. The pressure drop at different point in the bed decreases as we move down along the bed.
Future scope of the project
The future work of this project includes
1. The comparison of pressure drops and dynamic liquid saturation for different types of foaming
and non-foaming liquids to study the effect of viscosity.
2. In petroleum industries there are many foaming liquids used in the column for separation or for
catalytic reactions. There could be a study of mass transfer, heat transfer effect in the bed for the
trickle flow regime.
3. The wetting efficiency of the particle and different particle size how affect the pressure drop is a
major topic in this field.

21
References
Al-Dahhan M. H., Khadilkar M.R., Wu Y., and Dudokovic M.P., Prediction of pressure drop
and liquid holdup in high pressure trickle bed reactors, Ind. Eng. Chem. Res, 37, 793-798, 1998
Al-Dahhan M.H., Larachi F., Dudukovic M. P., and Laurent A., High pressure trickle bed
reactors, A review. Ind. Eng. Chem. Res. 36, 3292-3314, 1997.
Bansal A., Wanchoo R.K., Sharma R. K., Dynamic liquid saturation in a trickle bed reactor
involving Newtonian /non-Newtonian liquid phase, IECS, 48 3341-3350, 2009.
Fu, M.S. Chung Snag Tan, Liquid holdup and axial dispersion in trickle bed reactors, Chemical
Engineering Science, 51, 5357, 1996.
Gianetto A., Baldi G., Specchia V., Sicardi S., Hydrodynamics and solid liquid contacting
effectiveness in trickle bed reactor, AIChE Journal, 24,1087-1104, 1978.
Hochman, J.M., Effron E., Two phase co current downflow in packed beds. Ind. Eng. Chem.
Fund. 8, 63, 1969.
Iliuta Ion, Larachi F., Trickle bed mechanistic model for (non-) Newtonian power low foaming
liquids, Chemical Engineering Science, 64, 1654-1664, 2009.
Kundu A., Saroha A.K., Nigam K. D. P, Liquid distribution studies in trickle bed reactors,
Chemical Engineering Science, 56, 5963-5967, 2001
Lappalainen K., Alopaeus V., Manninen M. and Aittamaa J, Improved hydrodynamic model for
wetting efficiency, pressure drop and liquid holdup in trickle bed reactors, Ind. Eng. Chem.
Res., 47, 8436-8444, 2008.
Larkins R. P., White R. R., Jeffery D. W., Two phase concurrent flow in packed beds. AIChE
Journal, 7, 231,1961.
Lei Yangming, Liu Hong, Shen Z., Wang W., Development of a trickle bed reactor of a electro-
fenton process for waste water treatment, Journal of Hazards Materials, 261, 570-576, 2013.
Lopes R. J. G., Ferreira R.M.Q., Turbulence modelling of multiphase flow in high pressure
trickle bed reactors, Chemical Engineering Science, 64, 1806-1819, 2009.
Maiti R., Khanna R., and Nigam K. D. P., Hysteresis in trickle bed reactors: A review, Ind. Eng.
Chem. Res, 45,5185-5198, 2006.
Mao Z., Hong-bin X. H., Experimental investigation of pressure drop hysteresis in a concurrent
gas- liquid up flow packed bed, The Chinese journal of process Engineering, 1, 1476-8186,
2001.
Otake T., Okada K., Liquid holdup in packed towers, operating holdup without gas flow,
Kagakn Kogakn, 17, 176, 1953.

22
Saroha A. K., Nandi I., Pressure drop hysteresis in trickle bed reactors, Chemical Engineering
Science, 63, 3114-3119, 2008
Satterfield C. N., Trickle bed reactors, AIChE Journal, 21, 209-228, 1975.
Sie S.T., Krishna R., Process development and scale up: III. Scale up and scale down of trickle
bed process, Rev. Chem. Eng. 149(3), 203-252, 1998.
Souadina A., Latifi M. A., Analysis of two phase flow distribution in trickle bed reactors,
Chemical Engineering Science, 56, 5977-5985, 2001.
Stanek V., Szekely J., Three dimensional flow of fluids through non- uniform packed beds,
AIChE Journal, 37, 1237-1241, 1991.
Trivizadakis M., Giakoumakis D., and Karabelas A., The effect of packing particle type on fluid
mechanical characteristics of trickle bed reactors, Workshop of CPERI, 2004.
Wammes W. J. A., Middelkamp J., Huisman W. J., and Westerterp K. R., Hydrodynamics in a
co- current gas- liquid trickle bed at elevated pressures, AIChE Journal, 37, 1849-1862, 1991.
Wammes W. J. A., Mechielsen S. J., and Westerterf K. R., The transition between trickle flow
and pulse flow in a co-currrent gas- liquid trickle bed reactor at elevated pressures, Chemical
Engineering Science, 45, 3149-3158, 1990.
Wang R., Mao Z., and Chen J., Experimental and theoretical studies of pressure drop hysteresis
in trickle bed reactors, Chemical Engineering Science, 50, 2321-2328, 1995.
Related Documents