Welcome message from author
This document is posted to help you gain knowledge. Please leave a comment to let me know what you think about it! Share it to your friends and learn new things together.
Transcript
HYDRODYNAMIC AND SEDIMENT TRANSPORT MODELLING IN THE
PADAS ESTUARY
MOHAMMAD SADEQ ASADI
A project report submitted in partial fulfillment of the requirements for the award of
the degree of Master of Engineering (Civil – Hydraulics and Hydrology)
Faculty of Civil Engineering
Universiti Teknologi Malaysia
MAY 2011

I declare that this thesis entitled “Hydrodynamic and Sediment Transport Modeling
in the Padas Estuary” is the result of my own research except as cited in the
references. The thesis has not been accepted for any degree and is not concurrently
submitted in candidature of any other degree.
Signature : ……………………………………….
Name : MOHAMMAD SADEQ ASADI
Date : 11 MAY 2011

iii
ACKNOWLEDGEMENT
Praises to Allah SWT, the Most gracious and Most Merciful, Who has
created the mankind with knowledge, wisdom and power. Being the best creation of
Allah, one still has to depend on others for many aspects directly and indirectly. In
preparing this dissertation, the author was indebted to many personnel, academics
and practitioners. They have contributed towards my understanding and thoughts.
Therefore, I would like to thank all those who gave me the possibility to complete
this dissertation.
First and foremost, I would like to express my sincere gratitude to my
supervisor, Professor Hadibah Binti Ismail who has supported me with her guidance,
encouragement, patience and knowledge throughout the accomplishment of this
thesis. My gratitude also been extended to all personnel of the Coastal and Offshore
Engineering Institute (COEI) for their support, cooperation and constructive
criticisms during the research period.

iv
ABSTRACT
The quantification and monitoring of sediment dynamics in estuaries has received
plenty of attention in recent years due to both economic and environmental interest.
Accurate prediction of sediment transport in the Padas Estuary is essential for
optimum location of jetty and navigation channel. A numerical model has been
applied to predict the morphodynamic evolution in this area. The hydrodynamic and
sediment transport in the Padas estuary was estimated by means of a two-
dimensional hydrodynamic model (TELEMAC) coupled to a morphodynamic model
(SISYPHE). Hydrodynamic characteristics calculated with the numerical model
were compared to field measured data. The model calibration was achieved by
comparing speed and direction at several stations in the sea, and comparing free
surface water elevation (tidal) along the river. Model results and field data were
generally in good agreement. The differences between model results and observed
data were from 1.95% to 23% for current speeds, 5% to 15% for current directions
and 4.6% to 14.5% for water level. Based on the results of hydrodynamic and
morphodynamic models the following outcome have been achieved. The maximum
water surface elevation is equal to 2.8 m and this occurred during flood tide. On the
other hand, the minimum water surface elevation (1.5 m) occurred during ebb tide. It
is observed that currents during ebb tide are stronger than those during flood tide
and the deposition is a dominant phenomenon throughout the Padas estuary whereas
erosion has been observed to occur only in a few places. The data resulting from this
study could be used to determine the optimum location for jetty and navigation
channel.

v
ABSTRAK
Pengaggaran dan pemantauan pergerakan sedimen di muara telah menerima banyak
perhatian sejak akhir-akhir ini kerana kepentingan ekonomi dan persekitaran.
Ramalan yang tepat mengenai pengangkutan sedimen di Muara Sg.Padas adalah
penting untuk menentukan lokasi optimum jeti dan laluan kapal dikawasan itu. Di
dalam kajian ini, model berangka telah dibina untuk meramalkan kadar pemendapan
dengan menggunakan model hidrodinamik dua-dimensi (TELEMAC-2D)
digabungkan dengan model pemendapan (SISYPHE). Ciri-ciri hidrodinamik
daripada model berangka ini telah dibandingkan dengan data yang diambil di
kawasan kajian. Kalibrasi model dicapai dengan membandingkan kelajuan dan arah
arus di beberapa stesen di dalam kawasan kajian, dan membandingkan aras
permukaan air (pasangsurut) di 2 buah lokasi. Keputusan model pada umumnya
hampir kepada data lapangan. Perbezaan antara hasil model dan data yang diperolehi
adalah antara 1.95% hingga 23% untuk kelajuan arus, 5% hingga 15% untuk arah
arus dan 4.6% hingga 14.5% untuk aras permukaan air. Berdasarkan hasil model
hidrodinamik dan pemendapan ini, keputusan berikut telah dicapai: Aras permukaan
air maksimum adalah setinggi 2.8 m dan ini terjadi pada saat air pasang. Manakala,
aras permukaan air minimum (1.5 m) terjadi pada saat air surut. Telah diperhatikan
juga bahawa arus semasa air surut lebih kuat daripada arus semasa air pasang dan
pemendapan adalah satu fenomena yang dominan di Muara Padas sedangkan
hakisan hanya berlaku di beberapa tempat sahaja. Seterusnya, data yang dihasilkan
daripada kajian ini boleh digunakan untuk menentukan lokasi optimum jeti dan
laluan kapal di kawasan Muara Padas ini.
TABLE OF CONTENTS
CHA
PTER
TITLE PAGE
TITLE PAGE i
DECLARATION ii
ACKNOWLEDGEMENT iii
ABSTRACT iv
ABSTRAK v
TABLE OF CONTENTS
vi
LIST OF FIGURES xi
LIST OF TABLES xiv
LIST OF APPENDICES xv
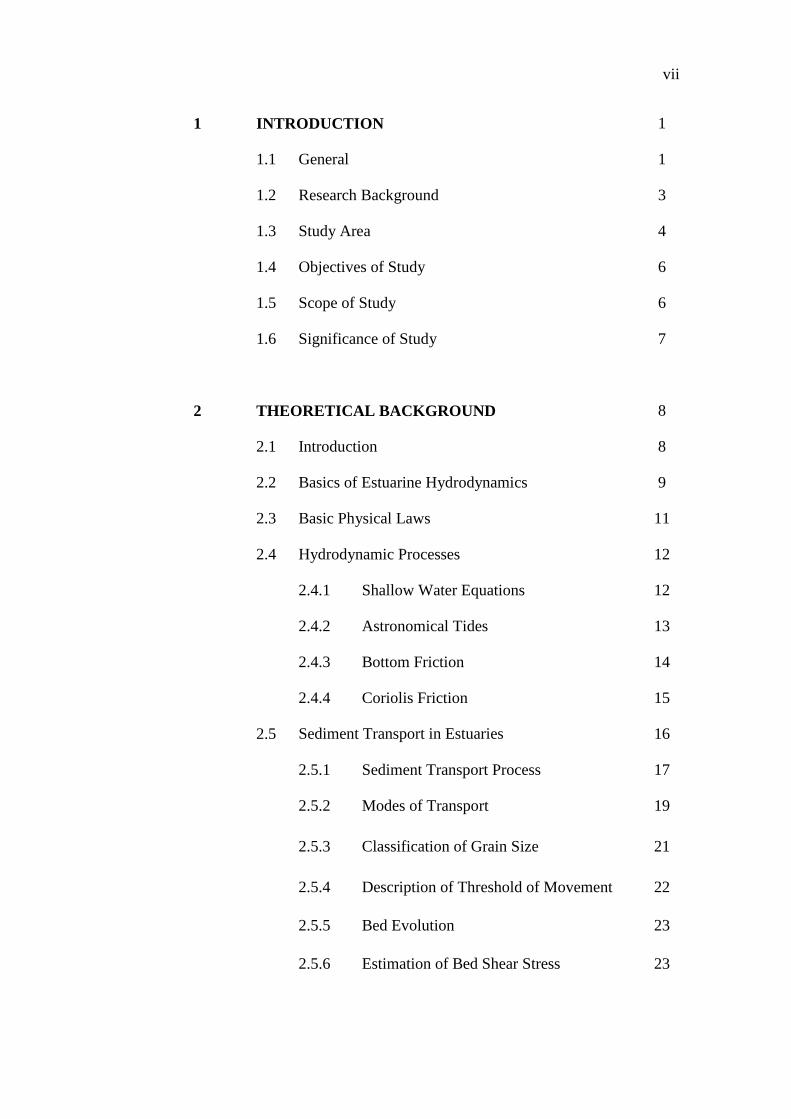
vii
1
INTRODUCTION 1
1.1 General 1
1.2 Research Background 3
1.3 Study Area 4
1.4 Objectives of Study 6
1.5 Scope of Study 6
1.6 Significance of Study 7
2 THEORETICAL BACKGROUND
8
2.1 Introduction 8
2.2 Basics of Estuarine Hydrodynamics 9
2.3 Basic Physical Laws 11
2.4 Hydrodynamic Processes 12
2.4.1 Shallow Water Equations 12
2.4.2 Astronomical Tides 13
2.4.3 Bottom Friction 14
2.4.4 Coriolis Friction 15
2.5 Sediment Transport in Estuaries 16
2.5.1 Sediment Transport Process 17
2.5.2 Modes of Transport 19
2.5.3 Classification of Grain Size 21
2.5.4 Description of Threshold of Movement 22
2.5.5 Bed Evolution 23
2.5.6 Estimation of Bed Shear Stress 23

viii
2.5.7 Sediment Transport by Currents 24
2.6 Numerical Modelling 25
2.6.1 Finite Element, Finite Volume and
Finite Difference Method
25
2.6.2 General Information for TELEMAC and
its Application
28
2.6.3 The Hydrodynamic Model TELEMAC-2D 28
2.6.4 The Morphodynamic model SISYPHE 29
3 METHODOLOGY 30
3.1 Introduction 30
3.2 Model Domain for the Hydrodynamics of Padas
Estuary
30
3.3 Application of MATTISE 32
3.3.1 General Concept of MATTISE Software 32
3.3.2 Boundary Conditions 34
3.3.3 Input and Output of MATTISE 34
3.4 Application of TELEMAC 35
3.4.1 General Concept of TELEMAC 2-D
Software
35
3.4.2 Input and Output of TELEMAC 2-D 36
3.5 Application of SISYPHE 38
3.5.1 General Concept of SISYPHE 2-D
Software
38
3.5.2 Coupling Hydrodynamics and
Morphodynamics model
40
3.5.3 Input and Output of SISYPHE 41

ix
3.5.4 Steering File 42
3.5.5 Sand Transport Formula 42
4 DATA ANALYSIS AND RESULTS 44
4.1 Introduction 44
4.2 Hydrodynamic Model Calibration 47
4.2.1 The Calibration Curve for Speed and
Direction at Station CM1
48
4.2.2 The Calibration Curve for Speed and
Direction at Station CM2
50
4.2.3 The Calibration Curve for Speed and
Direction at Station CM3
51
4.2.4 The Calibration Curve for Water Level
at Station TG1
53
4.2.5 The Calibration Curve for Water Level
at Station TG2
54
4.2.6 Summary of Calibration results 55
4.3 Simulation Runs for the Hydrodynamic Model 57
4.3.1 Water Surface Elevation 57
4.3.2 Current Vectors 60
4.3.3 Speeds and Directions of Currents at
two stations
63
4.4 Morphodynamic Model Simulation 68
4.4.1 Bed Evolution in the Padas Estuary 69
4.4.2 Bed Evolution at Two Points 72
4.4.3 Bed Evolution across the River 74

x
4.5 Appraisal of the Modelling Results 77
5 CONCLUSIONS 78
5.1 Introduction 78
5.2 Recommendations 79
5.3 Conclusions 80
REFERENCES 81
APPENDICES A – E 85-110

xi
LIST OF FIGURES
FIGURE NO.
FIGURE
NO.
TITLE PAGE
1.1 Map of Malaysia Coastline 2
1.2 Study Area Location 5
1.3 Location of The Sungai Padas Estuary 5
2.1 Sediment Transport Process 18
2.2 Bed Load and Suspended Load Transport 19
2.3 Fluid Forces Causing Sediment Movement 22
3.1 Model Domain for the Hydrodynamic Modelling in
Padas Estuary
31
3.2 The Domain of Previous Hydrodynamic Model 32
3.3 Model Mesh Discretization for the Existing Mesh 33
3.4 Bed Bathymetry For Existing Condition 37
3.5 The Sequence of TELEMAC Module Simulation 39
3.6 SISYPHE Model Computing Environment 41
4.1 The Location of Points in Previous Hydrodynamic
Model
45
4.2 Comparison between Free Surface Water Elevations
along New Boundary
46
4.3 Location of Points along the New Tidal Boundary 46
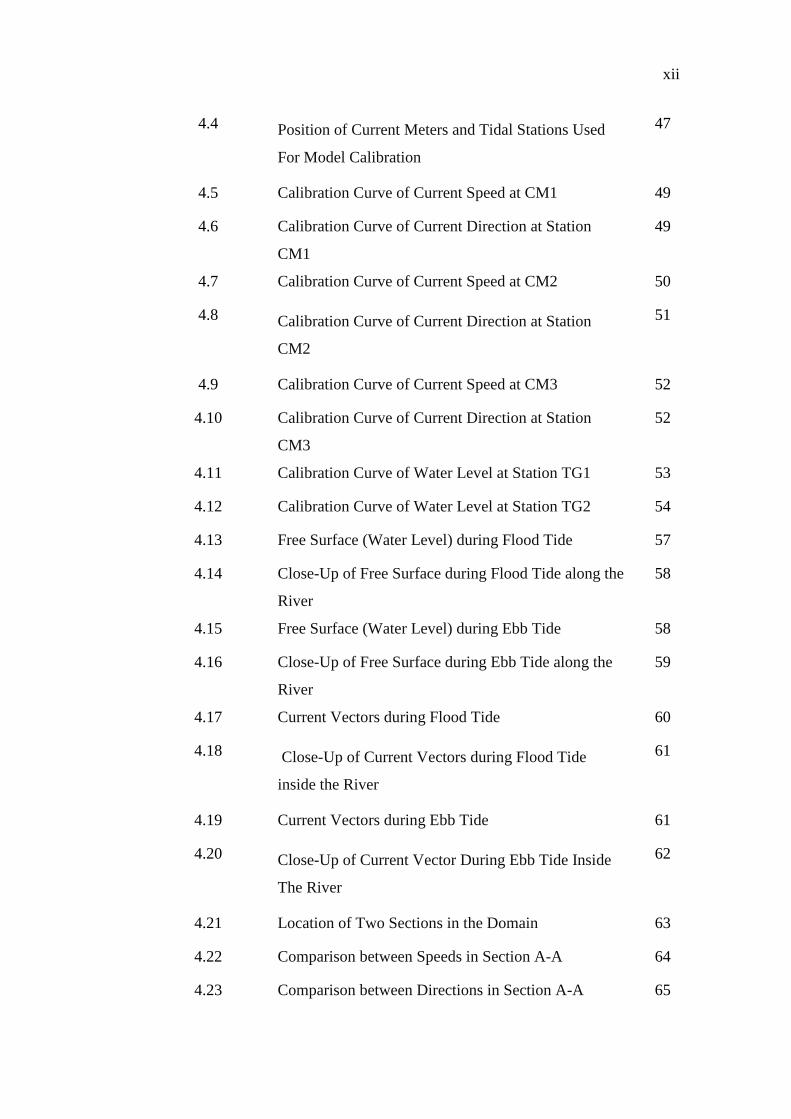
xii
4.4 Position of Current Meters and Tidal Stations Used
For Model Calibration
47
4.5 Calibration Curve of Current Speed at CM1 49
4.6 Calibration Curve of Current Direction at Station
CM1
49
4.7 Calibration Curve of Current Speed at CM2 50
4.8 Calibration Curve of Current Direction at Station
CM2
51
4.9 Calibration Curve of Current Speed at CM3 52
4.10 Calibration Curve of Current Direction at Station
CM3
52
4.11 Calibration Curve of Water Level at Station TG1 53
4.12 Calibration Curve of Water Level at Station TG2 54
4.13 Free Surface (Water Level) during Flood Tide 57
4.14 Close-Up of Free Surface during Flood Tide along the
River
58
4.15 Free Surface (Water Level) during Ebb Tide 58
4.16 Close-Up of Free Surface during Ebb Tide along the
River
59
4.17 Current Vectors during Flood Tide 60
4.18 Close-Up of Current Vectors during Flood Tide
inside the River
61
4.19 Current Vectors during Ebb Tide 61
4.20 Close-Up of Current Vector During Ebb Tide Inside
The River
62
4.21 Location of Two Sections in the Domain 63
4.22 Comparison between Speeds in Section A-A 64
4.23 Comparison between Directions in Section A-A 65

xiii
4.24 Comparison between Speeds in Section B-B 66
4.25 Comparison between Directions in Section B-B 67
4.26 The Output of First Run for Bed Evolution 68
4.27 The Output of Second Run for Bed Evolution 68
4.28 The Output of Third Run for Bed Evolution 68
4.29 The Output of Fourth Run for Bed Evolution 68
4.30 Bed Evolution in the Padas Estuary, First Run after
Stability
69
4.31 Bed Evolution in the Padas Estuary, Second Run after
Stability
70
4.32 Bed Evolution in the Padas Estuary, Third Run after
Stability
70
4.33 Bed Evolution in the Padas Estuary, Fourth Run after
Stability
71
4.34 The Locations of Two Points in Morphodynamic
Model
72
4.35 Bed Evolution at Point A 73
4.36 Bed Evolution at Point B 73
4.37 Location of Three Sections in the Domain 74
4.38 Bed Evolution across the River at Section A-A 75
4.39 Bed Evolution across the River at Section B-B 76
4.40 Bed Evolution across the River at Section C-C 76
5.1 Proposed Location of Jetty and Navigation Channel 79

xiv
LIST OF TABLES
TABLE NO.
TABLE
NO.
TITLE PAGE
2.1 Sediment Particle Classification 21
3.1 Validity Range of The Sand Transport Formula
Programmed in SISYPHE
43
4.1 The Difference between Observed and Model Current
Speed
55
4.2 The Difference between Observed and Model Current
direction
55
4.3 The Difference between Observed and Model Water
Level
56

xv
LIST OF APPENDICES
APPENDIX
APPENDIX
TITLE PAGE
A The Boundary Condition File
85
B The Steering File for TELEMAC
89
C The Liquid Boundary File
91
D The Steering File for SISYPHE
96
E Data for each Point along the New Boundary
99

CHAPTER 1
INTRODUCTION
1.1 General
The world’s coastline has been engineered for many centuries, initially for the
development of ports and maritime trade or fishing harbors to support local
communities, for example, the Port of A-ur built on the Nile prior to 3000BC and nearby
the open coast the Port of Pharos around 2000BC.
Malaysia is a coastal nation with a coastline of 4809 km and rich in biodiversity
and natural resources. The country is divided into two landmasses by the South China
Sea. Peninsular Malaysia is located to the west of South China Sea with a coastline of
2031 km and the other part is East Malaysia, consisting of Sabah and Sarawak. The
Federal Territory of Labuan is located in the northwestern coast of Borneo island.
Sabah has a coastline of 1743 km while Sarawak has a coastline of 1035 km. A map of
the Malaysia coastline is shown in Figure 1.1.
2
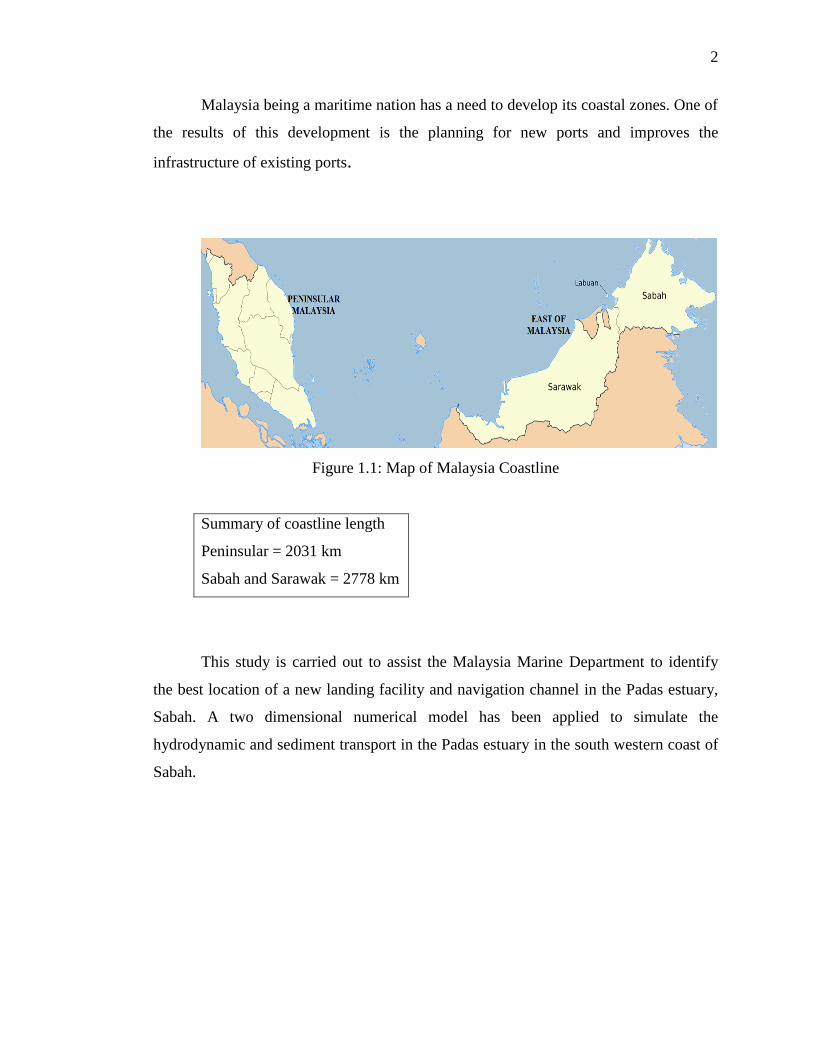
Malaysia being a maritime nation has a need to develop its coastal zones. One of
the results of this development is the planning for new ports and improves the
infrastructure of existing ports.
Figure 1.1: Map of Malaysia Coastline
Summary of coastline length
Peninsular = 2031 km
Sabah and Sarawak = 2778 km
This study is carried out to assist the Malaysia Marine Department to identify
the best location of a new landing facility and navigation channel in the Padas estuary,
Sabah. A two dimensional numerical model has been applied to simulate the
hydrodynamic and sediment transport in the Padas estuary in the south western coast of
Sabah.

3
1.2 Research Background
An old timber jetty was found to be abandoned 20 years ago due to river mouth
sedimentation which restricts navigation traffic from the inland area to the sea. There is
a need to construct a new jetty in the area to transport building materials in order to
support development in the inland area along Sungai Padas especially the area to the
south of the river bank. Therefore it is important to understand the behaviour of the
hydrodynamics and morphodynamics of the Padas estuary. By considering the sediment
and hydrodynamic characteristics the optimum location for the proposed landing facility
and navigational channel could be determined.
Sediment transport plays a vital role in many aspects of river, coastal and
offshore engineering. The dynamics of sediment influences the construction of
infrastructures (bridges, dams), embankments, harbours and approach channels, power
stations, the integrity of beaches, dredging and dumping activities, the safety of offshore
platforms and pipelines, and many other activities. Moreover, sediment dynamics have
a large impact on biodiversity. Despite its importance, the study and prediction of
sediment dynamics still remains a challenging discipline where the margins of
uncertainties are still very high. The difficulty of this discipline arises from many
different reasons.
Sediment characteristics are often scarcely known and their spatial variability
too high to be correctly represented by a limited number of variables. The moving
agents of sediments (currents and waves) besides varying in time and space interact
with each other and with the sediments at the bottom. This makes the relationship
between flow properties and sediment dynamics not straightforward, even for very
simple situations.

4
Predicting the rate of sedimentation in a domain can be difficult and inexact due
to the complexity of the nature of sediment transport process and especially because
parameter for calculating sediment transport is changeable due to time and space. The
important variables to consider include: (1) hydrodynamic characteristics such as
velocity, tidal fluctuation, and wave, and (2) sediment characteristics such as suspended
sediment concentration, particle size, fall velocity, and sediment type (i.e., sand, silt,
clay, etc.).
For understanding the behavior of a coastal area for construction of port or
navigation channel or other important issues, it is compulsory to have plenty of data.
Because the procedure of data collection is costly most of the time it is not possible to
have enough data for this purpose. Nowadays for simulation of coastal area several
computer codes have been used to overcome the sparcity of data and thus become more
economical to study the behavior of the area.
1.3 Study Area
Sungai Padas is situated on the western coast of Sabah. The river mouth is about
15 km to the south-west of the town of Beaufort in Sabah which is about 90 km south of
the Sabah state capital, Kota Kinabalu.
The Padas River is a relatively long river, about 200 km long, originating in the
mountain in the middle of Sabah state and flowing into the South China Sea. The
location of Padas estuary and origin of the river is presented in Figure 1.2.

5
Figure 1.2: Study Area Location
The upper reaches of this 200 km river is one of the most popular destination
for white water rafting (COEI, 2010). The lower reach passes through low lying marshy
land that is inaccessible by land. The site location of Sungai Padas estuary and river
system is illustrated in Figure 1.3 below. The upper reaches of Sungai Padas especially
area close to Beaufort are prone to floods. The nearest town to Sungai Padas estuary is
Weston. It is located 3 hours by road from Kota Kinabalu and 6 km from the river.
From field observation, it is noted that the river mouth area is fringed by mangrove and
other wetland species of fauna.
Figure 1.3 Location of the Sungai Padas estuary
SABAH SOUTH
CHINA SEA
BRUNEI BAY
LABUAN

6
1.4 Objectives of Study
The main objective of this study is to simulate the hydrodynamic and
morphological behavior of the Padas estuary, by using a two dimensional computer
code for numerical modeling. The specific objectives are described as follows:
i. To apply, calibrate and run a two dimensional hydrodynamic computer
code on Padas estuary and to use the result of the model to provide a
better understanding of the estuarine hydrodynamics.
ii. To find an approach and apply a two dimensional computer code to
create a reliable and accurate model in order to describe the sediment
transport behavior in the domain of study.
1.5 Scope of Study
The scope of this study can best be described as follows:
i. To choose a suitable domain around Padas estuary for numerical
modeling.
ii. To construct the meshing elements for the domain using MATISSE
programme.
7
iii. To conduct the hydrodynamic modelling by using TELEMAC2D
programme and calibrate the model by available field data.
iv. To execute SISYPHE programme for the simulation of sediment
transport.
1.6 Significance of Study
The findings from this study are expected to provide:
The hydrodynamic characteristics such as velocity, water level and direction of
flow at every time step.
The sediment characteristics such as suspended load, bed load and bed evolution
and by considering these parameters, the optimum location for navigation
channel can be obtained.
Considering the above, the optimum location for the proposed landing facility
and alignment of the navigational channel could be determined. Thereupon the
maintenance cost for navigation channel and jetty area may be reduced.
Related Documents