NOAA Water Level and Meteorological Data Report HURRICANE IRENE Silver Spring, Maryland October 14, 2011 noaa National Oceanic and Atmospheric Administration U.S. DEPARTMENT OF COMMERCE National Ocean Service Center for Operational Oceanographic Products and Services Photo Credit: NOAA National Environmental Satellite, Data & Information Service GOES Imagery

Welcome message from author
This document is posted to help you gain knowledge. Please leave a comment to let me know what you think about it! Share it to your friends and learn new things together.
Transcript
NOAA Water Level and Meteorological Data Report
HURRICANE IRENE
Silver Spring, Maryland
October 14, 2011
noaa National Oceanic and Atmospheric Administration
U.S. DEPARTMENT OF COMMERCE
National Ocean Service
Center for Operational Oceanographic Products and Services
Photo Credit: NOAA National Environmental Satellite, Data & Information Service GOES Imagery
NOAA Water Level and Meteorological Data Report
HURRICANE IRENE
Colleen Fanelli, Paul Fanelli October 14, 2011
noaa National Oceanic and Atmospheric Administration
U.S. DEPARTMENT National Oceanic and National Ocean Service OF COMMERCE Atmospheric Administration David Kennedy Gary Locke Dr. Jane Lubchenco Assistant Administrator Secretary Administrator
Center for Operational Oceanographic Products and Services Director, Richard Edwing
NOAA NOS Hurricane Irene Water Level & Meteorological Data Report 1
Overview The National Oceanic and Atmospheric Administration (NOAA) Center for Operational
Oceanographic Products and Services (CO-OPS) maintains a network of oceanographic and meteorological stations along the United States coastlines and Great Lakes to monitor water levels, winds (speed, direction and gusts), barometric pressure, and air/water temperature. CO-OPS also operates stations in partnership with the National Estuarine Research Reserve (NERR) and the Puerto Rico Seismic Network (PRSN). This report documents the elevated water levels, high winds and reduced barometric pressures recorded at stations along the coast of Puerto Rico and the U.S. Virgin Islands as well as the east coast of the U.S. from Florida to Maine during Hurricane Irene.
Station information and locations are contained in Figures 1 & 2a-2d and Appendices 1 & 2. Tidal stations are referenced to the standard chart datum of Mean Lower Low Water (MLLW), based on the National Tidal Datum Epoch 1983-2001 (Appendix 3). In addition, at many locations along the East Coast of the U.S., water levels are provided relative to a geodetic reference datum, the North American Vertical Datum of 1988 (NAVD88), to assist in relating water levels to coastal inundation estimates.
Table 1 provides storm tide elevations and predicted tide elevations for stations affected by Hurricane Irene by geographic region. Where available, water level elevations relative to NAVD88 are also presented, along with the residuals at the time of the maximum storm tides. Maximum storm surge levels are summarized in Table 3, ranked by amplitude. Storm tides are the maximum water level elevations during a storm passage. Residuals are the elevation differences between observed and predicted tides. Storm surge is the residual caused directly by the storm during its passage. Table 2 provides maximum wind speeds, wind gusts, and minimum barometric pressures observed at the stations during Hurricane Irene.
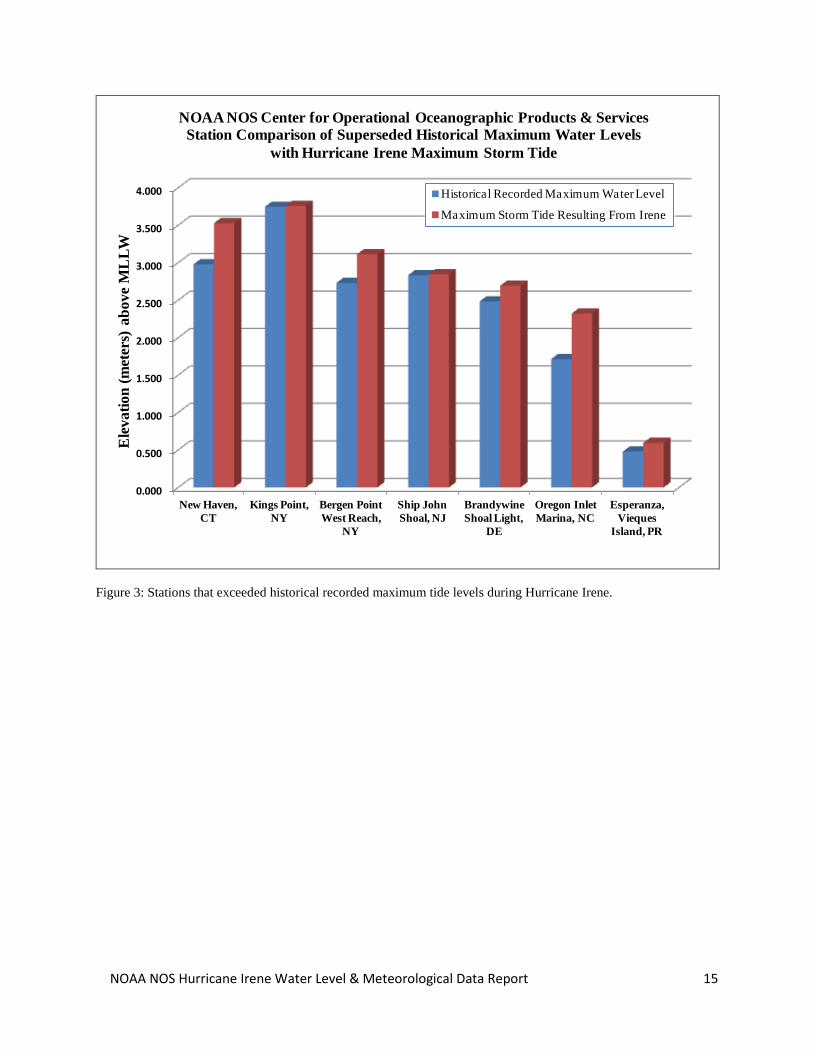
In addition, the report highlights stations which have exceeded historical recorded maximum water levels as a result of Irene (Figure 3). The historical recorded maximum water levels are the maximum water elevation measured by a water level station with a continuous time series throughout a high tide cycle for the entire historical period. A complete cycle is required to calculate the maximum tide elevation, applying a best fit curve to the observations. These historical records may not have included the highest water levels measured at a station during an event if a complete high tide cycle was not measured due to station/sensor damage (Appendix 3).
Individual time series graphs are provided for each station (Figures 4 – 88). For comparison and context, the historical recorded maximum water levels are displayed on the graphs, where available. The Highest Astronomical Tide (HAT) datum is also displayed to illustrate the elevation of the highest predicted astronomical tide expected to occur at a specific tide station over the 1983-2001 National Tidal Datum Epoch.
NOAA NOS Hurricane Irene Water Level & Meteorological Data Report 2
Summary Irene initially struck eastern Puerto Rico as a strong Tropical Storm on August 22, 2011. A few
hours following this landfall, Irene strengthened into the first hurricane of the 2011 Atlantic season. While passing to the north of Hispanola and over the Bahamas, Irene slowly strengthened, reaching Category 3 strength with winds of 104 knots (120 mph) on August 24, 2011. After this, Irene began to slowly weaken as it passed off the southeastern U.S. coast. The initial east coast landfall of Irene was near Cape Lookout, NC on August 27 at 1130 GMT as a category 1 hurricane with winds of 74 knots (85 mph). Irene re-emerged over the Atlantic Ocean on August 27 2300 GMT just to the southeast of Norfolk, VA and moved parallel to the mid-Atlantic coast before making a secondary landfall along the coast of New Jersey near Little Egg Inlet on August 28 0935 GMT as a weak Category 1 hurricane with winds of 65 knots (75 mph). After the second landfall, Irene continued on a rapid northeasterly track through New England, weakening to a tropical storm before moving into Canada near the intersection of New Hampshire and Maine.
As Irene passed over Puerto Rico, the maximum storm tide measured was 0.787 m (2.58 ft) at Fajardo, PR on August 22 0530 GMT. The maximum storm surge recorded was 0.495 m (1.62 ft) at Esperanza, Vieques Island, PR on August 22, 0506 GMT. Maximum storm surge/residuals along the coast of Puerto Rico and the U.S. Virgin Islands ranged from 0.12 to 0.50 m (0.4 to 1.6 ft).
Along the east coast of the U.S., a noticeable storm surge was observed from northern Florida to Maine. Storm surge residuals from Florida to South Carolina generally ranged from 0.30 to 1.02 m (1.0 to 3.3 ft). Along the North Carolina coast, storm surge/residuals ranged between 0.76 and 2.16 m (2.5 and 7.1 ft). The highest storm surge/residual measured along the Atlantic coast of the U.S. was 2.161 m (7.09 ft) at Oregon Inlet Marina, NC on August 28, 0354 GMT, several hours after Irene re-emerged over the Atlantic Ocean after traversing the Outer Banks of North Carolina. Along the southern Chesapeake Bay, storm surge residuals ranged between 0.75 and 1.48 m (2.5 and 4.9 ft) with higher values near the mouth of the bay. The northern half of Chesapeake Bay did not exhibit a significant storm surge from Hurricane Irene. Within the Delaware River and Bay, water level residuals included both storm surge and abnormally high river flow due to storm-induced runoff in the Delaware River Basin and ranged from 0.89 and 2.69 m (2.9 and 8.8 ft), with the highest residual of 2.694 m (8.84 ft) recorded at Newbold, PA on August 28, 1324 GMT. Along the mid-Atlantic coast from Virginia to New York City, storm surge residuals ranged between 1.00 and 1.44 m (3.2 and 4.7 ft). Along the coast of New England, storm surge residuals ranged between 0.42 and 1.45 m (1.4 and 4.8 ft) with the highest storm surge values along the southern New England coast bordering Long Island Sound.
The highest wind speed recorded at CO-OPS and partnership stations, corresponding to the initial landfall of Irene along the east coast of Puerto Rico was 50.5 knots (mph) at Esperanza, Vieques Island, PR on August 22, 0536 GMT. The highest wind gust of 65.9 kts (mph) occurred at the same location on August 22, 0506 GMT. The minimum barometric pressure corresponding to Puerto Rico landfall was 992.7 mb at San Juan, PR on August 22, 0742 GMT. At CO-OPS and partnership stations along the east coast of the U.S., the highest wind speed recorded as Irene moved up the coast was 60.8 knots (mph) at Duck, NC on August 27, 2106 GMT. The highest wind gust of 72.7 kts (mph) occurred at the same location on August 27, 2112 GMT. The minimum barometric pressure recorded along the east coast of the U.S. was 950.6 mb, also at Duck, NC on August 27, 2112 GMT.
More information, data and storm reports can be found at the CO-OPS website, http://tidesandcurrents.noaa.gov. Storm reports are located under the Publications section of the webpage.
NOAA NOS Hurricane Irene Water Level & Meteorological Data Report 3
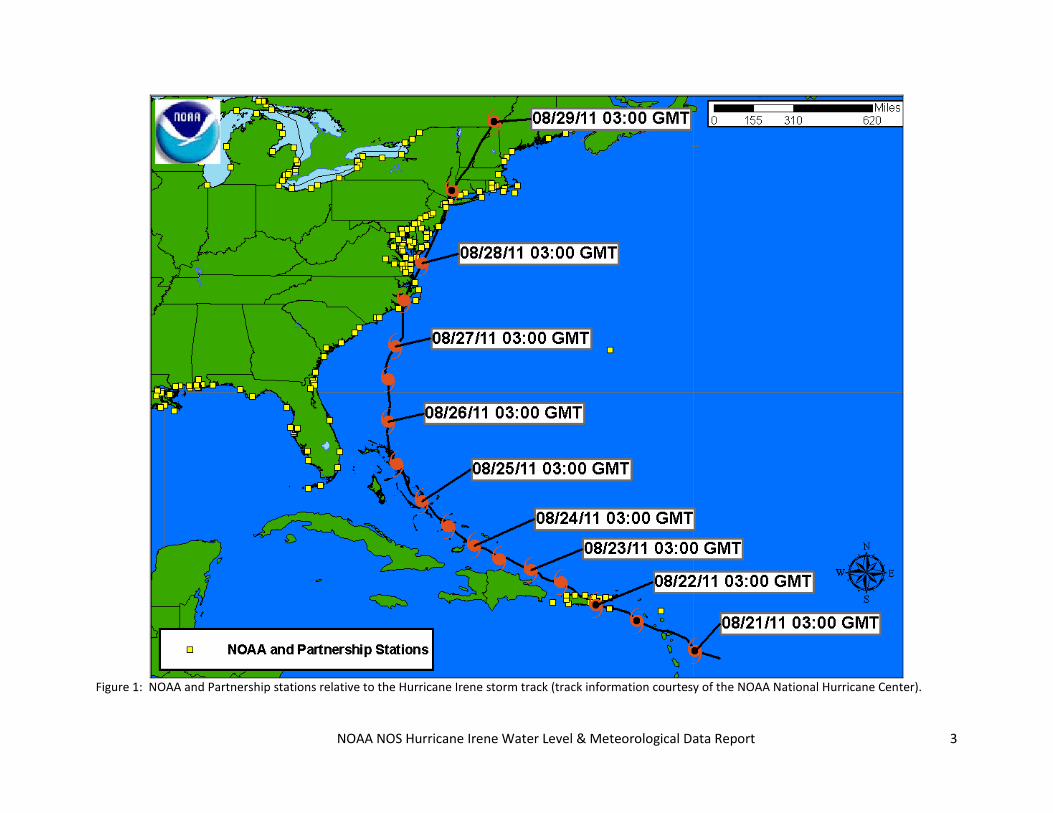
Figure 1: NOAA and Partnership stations relative to the Hurricane Irene storm track (track information courtesy of the NOAA National Hurricane Center).
NOAA NOS Hurricane Irene Water Level & Meteorological Data Report 4
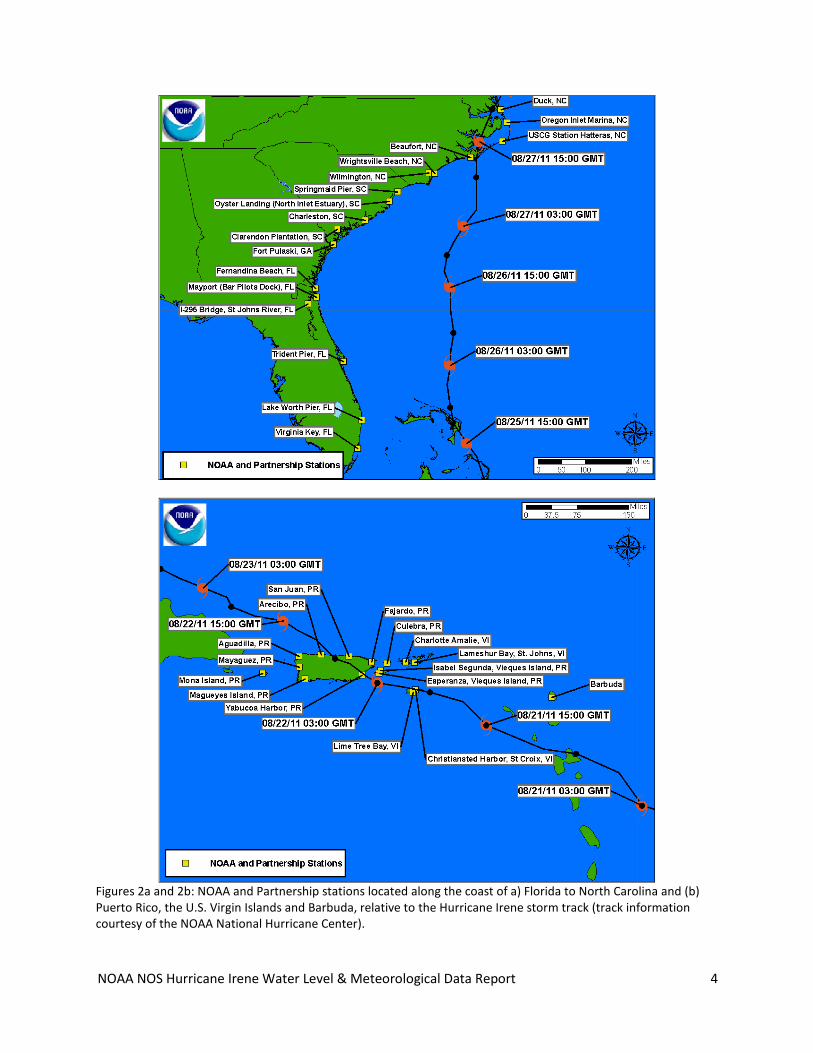
Figures 2a and 2b: NOAA and Partnership stations located along the coast of a) Florida to North Carolina and (b) Puerto Rico, the U.S. Virgin Islands and Barbuda, relative to the Hurricane Irene storm track (track information courtesy of the NOAA National Hurricane Center).
NOAA NOS Hurricane Irene Water Level & Meteorological Data Report 5
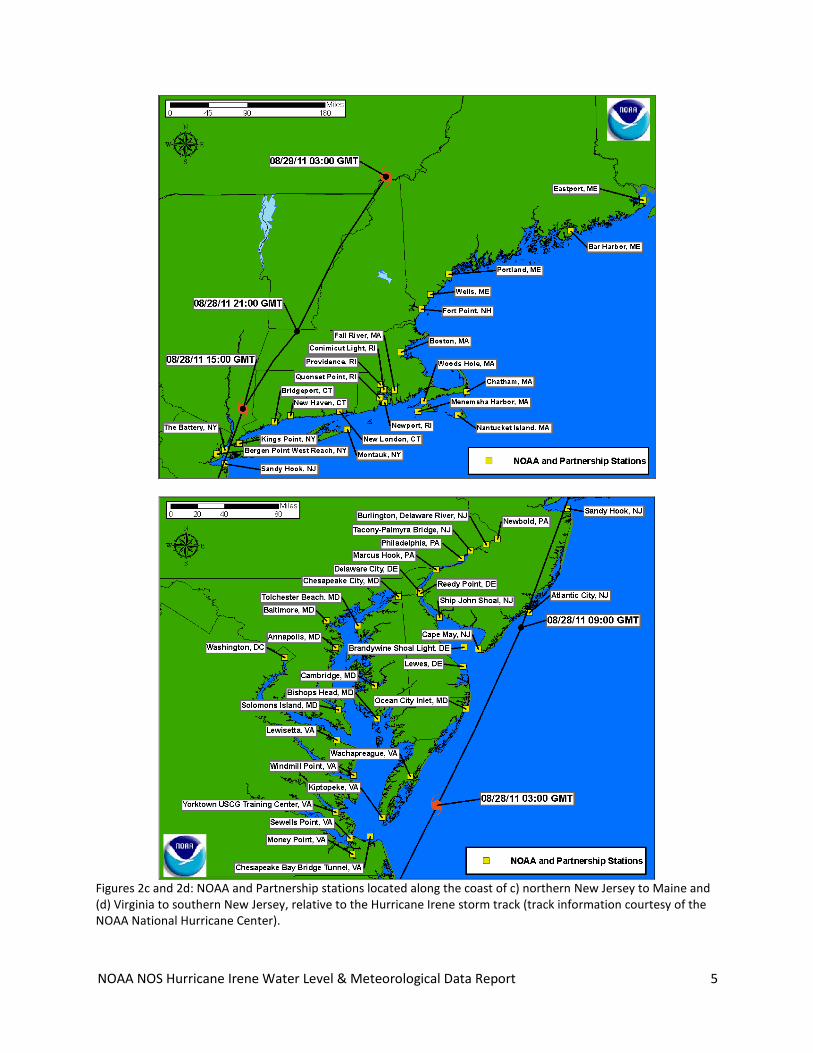
Figures 2c and 2d: NOAA and Partnership stations located along the coast of c) northern New Jersey to Maine and (d) Virginia to southern New Jersey, relative to the Hurricane Irene storm track (track information courtesy of the NOAA National Hurricane Center).
NOAA NOS Hurricane Irene Water Level & Meteorological Data Report 6
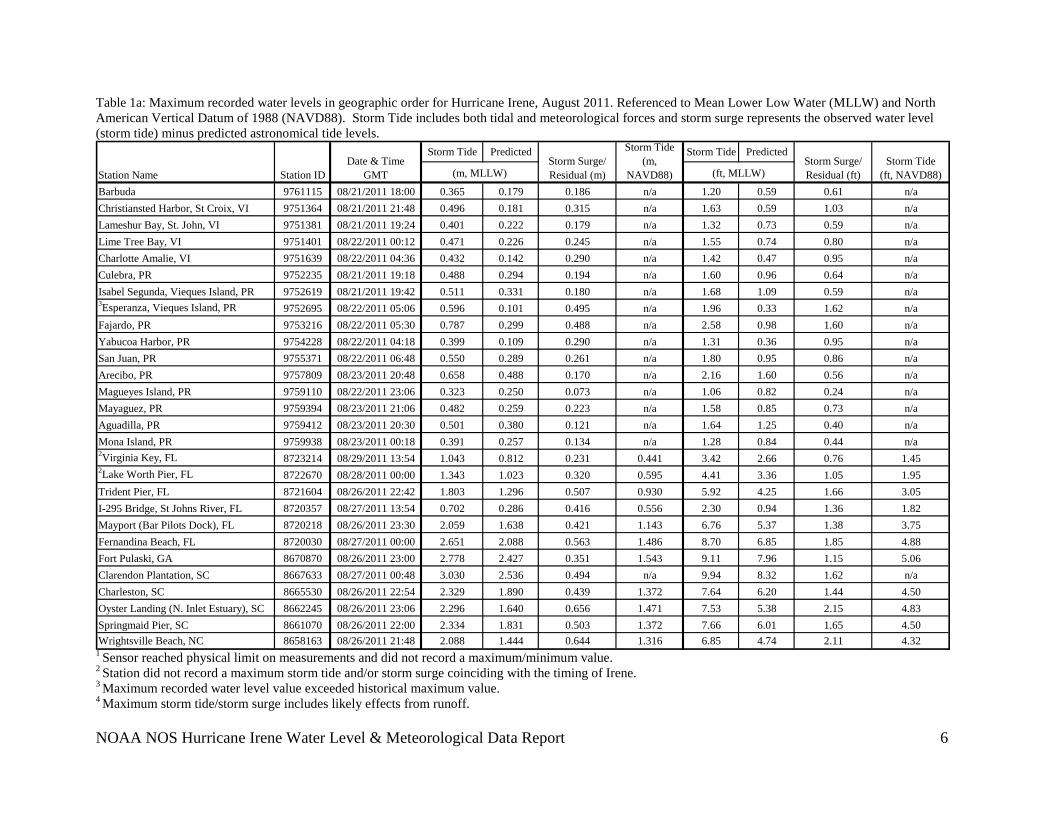
Table 1a: Maximum recorded water levels in geographic order for Hurricane Irene, August 2011. Referenced to Mean Lower Low Water (MLLW) and North American Vertical Datum of 1988 (NAVD88). Storm Tide includes both tidal and meteorological forces and storm surge represents the observed water level (storm tide) minus predicted astronomical tide levels.
Storm Tide Predicted Storm Tide Predicted
Barbuda 9761115 08/21/2011 18:00 0.365 0.179 0.186 n/a 1.20 0.59 0.61 n/aChristiansted Harbor, St Croix, VI 9751364 08/21/2011 21:48 0.496 0.181 0.315 n/a 1.63 0.59 1.03 n/aLameshur Bay, St. John, VI 9751381 08/21/2011 19:24 0.401 0.222 0.179 n/a 1.32 0.73 0.59 n/aLime Tree Bay, VI 9751401 08/22/2011 00:12 0.471 0.226 0.245 n/a 1.55 0.74 0.80 n/aCharlotte Amalie, VI 9751639 08/22/2011 04:36 0.432 0.142 0.290 n/a 1.42 0.47 0.95 n/aCulebra, PR 9752235 08/21/2011 19:18 0.488 0.294 0.194 n/a 1.60 0.96 0.64 n/aIsabel Segunda, Vieques Island, PR 9752619 08/21/2011 19:42 0.511 0.331 0.180 n/a 1.68 1.09 0.59 n/a3Esperanza, Vieques Island, PR 9752695 08/22/2011 05:06 0.596 0.101 0.495 n/a 1.96 0.33 1.62 n/aFajardo, PR 9753216 08/22/2011 05:30 0.787 0.299 0.488 n/a 2.58 0.98 1.60 n/aYabucoa Harbor, PR 9754228 08/22/2011 04:18 0.399 0.109 0.290 n/a 1.31 0.36 0.95 n/aSan Juan, PR 9755371 08/22/2011 06:48 0.550 0.289 0.261 n/a 1.80 0.95 0.86 n/aArecibo, PR 9757809 08/23/2011 20:48 0.658 0.488 0.170 n/a 2.16 1.60 0.56 n/aMagueyes Island, PR 9759110 08/22/2011 23:06 0.323 0.250 0.073 n/a 1.06 0.82 0.24 n/aMayaguez, PR 9759394 08/23/2011 21:06 0.482 0.259 0.223 n/a 1.58 0.85 0.73 n/aAguadilla, PR 9759412 08/23/2011 20:30 0.501 0.380 0.121 n/a 1.64 1.25 0.40 n/aMona Island, PR 9759938 08/23/2011 00:18 0.391 0.257 0.134 n/a 1.28 0.84 0.44 n/a2Virginia Key, FL 8723214 08/29/2011 13:54 1.043 0.812 0.231 0.441 3.42 2.66 0.76 1.452Lake Worth Pier, FL 8722670 08/28/2011 00:00 1.343 1.023 0.320 0.595 4.41 3.36 1.05 1.95Trident Pier, FL 8721604 08/26/2011 22:42 1.803 1.296 0.507 0.930 5.92 4.25 1.66 3.05I-295 Bridge, St Johns River, FL 8720357 08/27/2011 13:54 0.702 0.286 0.416 0.556 2.30 0.94 1.36 1.82Mayport (Bar Pilots Dock), FL 8720218 08/26/2011 23:30 2.059 1.638 0.421 1.143 6.76 5.37 1.38 3.75Fernandina Beach, FL 8720030 08/27/2011 00:00 2.651 2.088 0.563 1.486 8.70 6.85 1.85 4.88Fort Pulaski, GA 8670870 08/26/2011 23:00 2.778 2.427 0.351 1.543 9.11 7.96 1.15 5.06Clarendon Plantation, SC 8667633 08/27/2011 00:48 3.030 2.536 0.494 n/a 9.94 8.32 1.62 n/aCharleston, SC 8665530 08/26/2011 22:54 2.329 1.890 0.439 1.372 7.64 6.20 1.44 4.50Oyster Landing (N. Inlet Estuary), SC 8662245 08/26/2011 23:06 2.296 1.640 0.656 1.471 7.53 5.38 2.15 4.83Springmaid Pier, SC 8661070 08/26/2011 22:00 2.334 1.831 0.503 1.372 7.66 6.01 1.65 4.50Wrightsville Beach, NC 8658163 08/26/2011 21:48 2.088 1.444 0.644 1.316 6.85 4.74 2.11 4.32
Storm Surge/Residual (ft)
Storm Tide(ft, NAVD88)(ft, MLLW)Station Name Station ID
Date & TimeGMT
Storm Surge/Residual (m)
Storm Tide(m,
NAVD88)(m, MLLW)
1 Sensor reached physical limit on measurements and did not record a maximum/minimum value. 2 Station did not record a maximum storm tide and/or storm surge coinciding with the timing of Irene. 3 Maximum recorded water level value exceeded historical maximum value. 4 Maximum storm tide/storm surge includes likely effects from runoff.
NOAA NOS Hurricane Irene Water Level & Meteorological Data Report 7
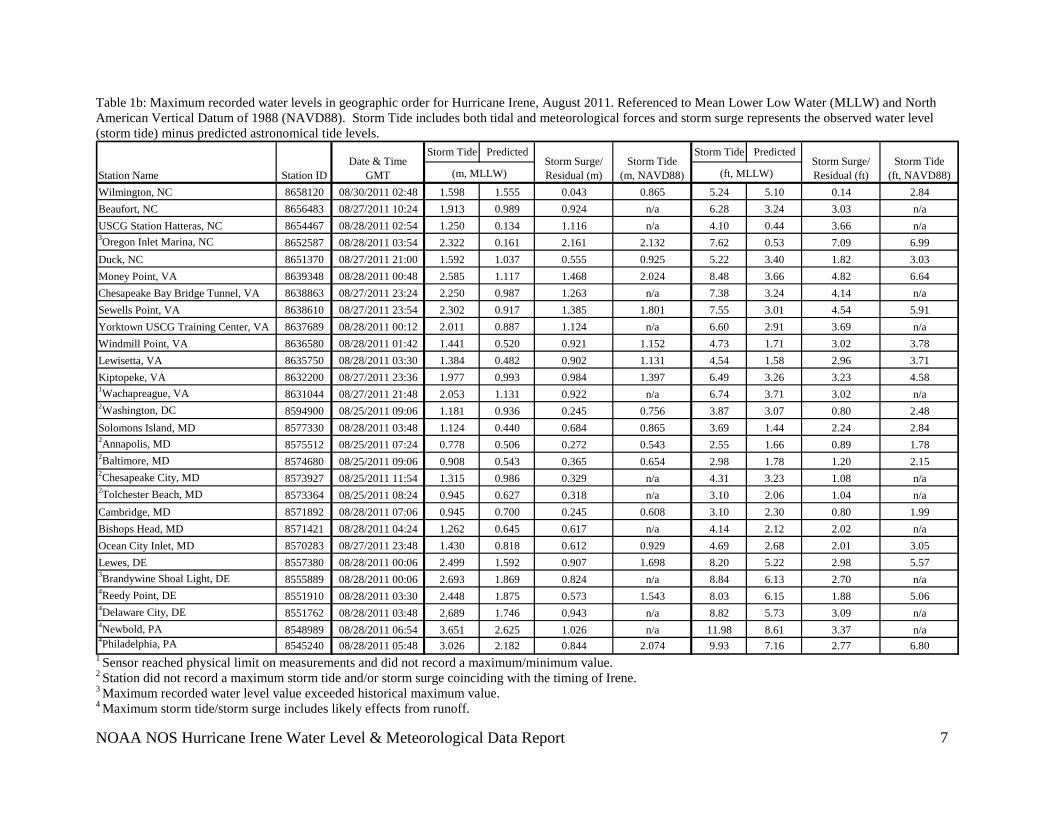
Table 1b: Maximum recorded water levels in geographic order for Hurricane Irene, August 2011. Referenced to Mean Lower Low Water (MLLW) and North American Vertical Datum of 1988 (NAVD88). Storm Tide includes both tidal and meteorological forces and storm surge represents the observed water level (storm tide) minus predicted astronomical tide levels.
Storm Tide Predicted Storm Tide Predicted
Wilmington, NC 8658120 08/30/2011 02:48 1.598 1.555 0.043 0.865 5.24 5.10 0.14 2.84Beaufort, NC 8656483 08/27/2011 10:24 1.913 0.989 0.924 n/a 6.28 3.24 3.03 n/aUSCG Station Hatteras, NC 8654467 08/28/2011 02:54 1.250 0.134 1.116 n/a 4.10 0.44 3.66 n/a3Oregon Inlet Marina, NC 8652587 08/28/2011 03:54 2.322 0.161 2.161 2.132 7.62 0.53 7.09 6.99Duck, NC 8651370 08/27/2011 21:00 1.592 1.037 0.555 0.925 5.22 3.40 1.82 3.03Money Point, VA 8639348 08/28/2011 00:48 2.585 1.117 1.468 2.024 8.48 3.66 4.82 6.64Chesapeake Bay Bridge Tunnel, VA 8638863 08/27/2011 23:24 2.250 0.987 1.263 n/a 7.38 3.24 4.14 n/aSewells Point, VA 8638610 08/27/2011 23:54 2.302 0.917 1.385 1.801 7.55 3.01 4.54 5.91Yorktown USCG Training Center, VA 8637689 08/28/2011 00:12 2.011 0.887 1.124 n/a 6.60 2.91 3.69 n/aWindmill Point, VA 8636580 08/28/2011 01:42 1.441 0.520 0.921 1.152 4.73 1.71 3.02 3.78Lewisetta, VA 8635750 08/28/2011 03:30 1.384 0.482 0.902 1.131 4.54 1.58 2.96 3.71Kiptopeke, VA 8632200 08/27/2011 23:36 1.977 0.993 0.984 1.397 6.49 3.26 3.23 4.581Wachapreague, VA 8631044 08/27/2011 21:48 2.053 1.131 0.922 n/a 6.74 3.71 3.02 n/a2Washington, DC 8594900 08/25/2011 09:06 1.181 0.936 0.245 0.756 3.87 3.07 0.80 2.48Solomons Island, MD 8577330 08/28/2011 03:48 1.124 0.440 0.684 0.865 3.69 1.44 2.24 2.842Annapolis, MD 8575512 08/25/2011 07:24 0.778 0.506 0.272 0.543 2.55 1.66 0.89 1.782Baltimore, MD 8574680 08/25/2011 09:06 0.908 0.543 0.365 0.654 2.98 1.78 1.20 2.152Chesapeake City, MD 8573927 08/25/2011 11:54 1.315 0.986 0.329 n/a 4.31 3.23 1.08 n/a2Tolchester Beach, MD 8573364 08/25/2011 08:24 0.945 0.627 0.318 n/a 3.10 2.06 1.04 n/aCambridge, MD 8571892 08/28/2011 07:06 0.945 0.700 0.245 0.608 3.10 2.30 0.80 1.99Bishops Head, MD 8571421 08/28/2011 04:24 1.262 0.645 0.617 n/a 4.14 2.12 2.02 n/aOcean City Inlet, MD 8570283 08/27/2011 23:48 1.430 0.818 0.612 0.929 4.69 2.68 2.01 3.05Lewes, DE 8557380 08/28/2011 00:06 2.499 1.592 0.907 1.698 8.20 5.22 2.98 5.573Brandywine Shoal Light, DE 8555889 08/28/2011 00:06 2.693 1.869 0.824 n/a 8.84 6.13 2.70 n/a4Reedy Point, DE 8551910 08/28/2011 03:30 2.448 1.875 0.573 1.543 8.03 6.15 1.88 5.064Delaware City, DE 8551762 08/28/2011 03:48 2.689 1.746 0.943 n/a 8.82 5.73 3.09 n/a4Newbold, PA 8548989 08/28/2011 06:54 3.651 2.625 1.026 n/a 11.98 8.61 3.37 n/a4Philadelphia, PA 8545240 08/28/2011 05:48 3.026 2.182 0.844 2.074 9.93 7.16 2.77 6.80
Storm Surge/Residual (ft)
Storm Tide(ft, NAVD88)(ft, MLLW)Station Name Station ID
Date & TimeGMT
Storm Surge/Residual (m)
Storm Tide(m, NAVD88)(m, MLLW)
1 Sensor reached physical limit on measurements and did not record a maximum/minimum value. 2 Station did not record a maximum storm tide and/or storm surge coinciding with the timing of Irene. 3 Maximum recorded water level value exceeded historical maximum value. 4 Maximum storm tide/storm surge includes likely effects from runoff.
NOAA NOS Hurricane Irene Water Level & Meteorological Data Report 8
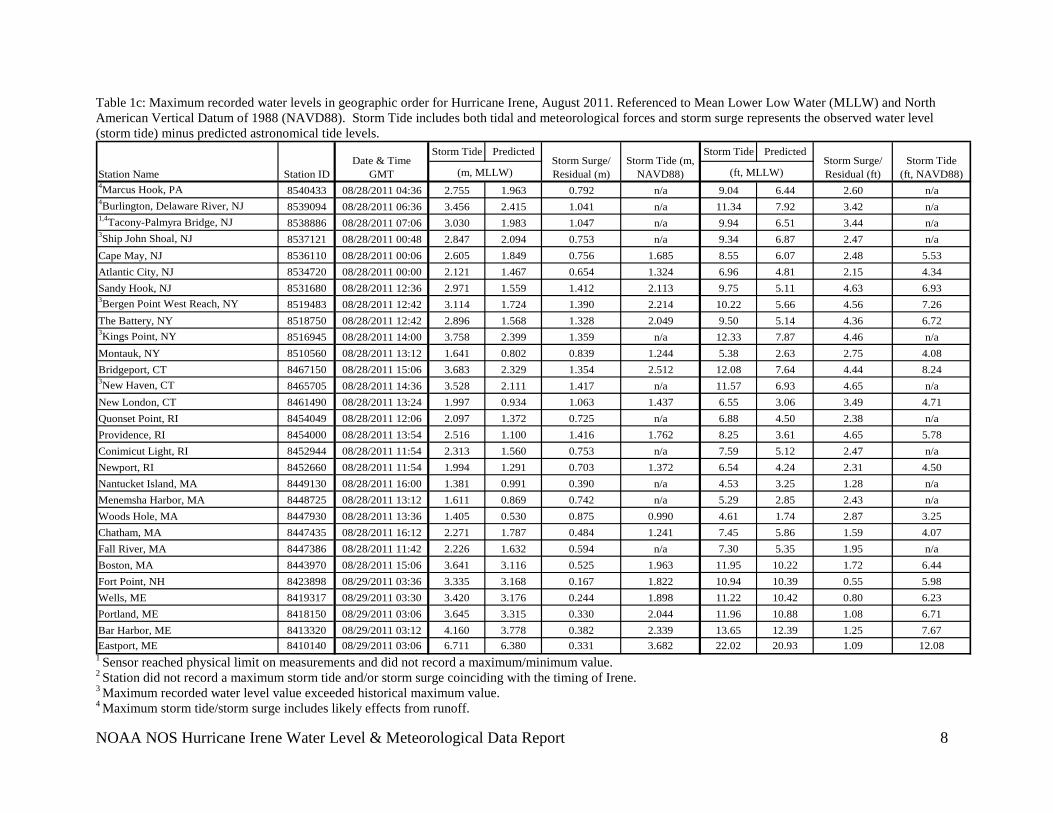
Table 1c: Maximum recorded water levels in geographic order for Hurricane Irene, August 2011. Referenced to Mean Lower Low Water (MLLW) and North American Vertical Datum of 1988 (NAVD88). Storm Tide includes both tidal and meteorological forces and storm surge represents the observed water level (storm tide) minus predicted astronomical tide levels.
Storm Tide Predicted Storm Tide Predicted
4Marcus Hook, PA 8540433 08/28/2011 04:36 2.755 1.963 0.792 n/a 9.04 6.44 2.60 n/a4Burlington, Delaware River, NJ 8539094 08/28/2011 06:36 3.456 2.415 1.041 n/a 11.34 7.92 3.42 n/a1,4Tacony-Palmyra Bridge, NJ 8538886 08/28/2011 07:06 3.030 1.983 1.047 n/a 9.94 6.51 3.44 n/a3Ship John Shoal, NJ 8537121 08/28/2011 00:48 2.847 2.094 0.753 n/a 9.34 6.87 2.47 n/aCape May, NJ 8536110 08/28/2011 00:06 2.605 1.849 0.756 1.685 8.55 6.07 2.48 5.53Atlantic City, NJ 8534720 08/28/2011 00:00 2.121 1.467 0.654 1.324 6.96 4.81 2.15 4.34Sandy Hook, NJ 8531680 08/28/2011 12:36 2.971 1.559 1.412 2.113 9.75 5.11 4.63 6.933Bergen Point West Reach, NY 8519483 08/28/2011 12:42 3.114 1.724 1.390 2.214 10.22 5.66 4.56 7.26The Battery, NY 8518750 08/28/2011 12:42 2.896 1.568 1.328 2.049 9.50 5.14 4.36 6.723Kings Point, NY 8516945 08/28/2011 14:00 3.758 2.399 1.359 n/a 12.33 7.87 4.46 n/aMontauk, NY 8510560 08/28/2011 13:12 1.641 0.802 0.839 1.244 5.38 2.63 2.75 4.08Bridgeport, CT 8467150 08/28/2011 15:06 3.683 2.329 1.354 2.512 12.08 7.64 4.44 8.243New Haven, CT 8465705 08/28/2011 14:36 3.528 2.111 1.417 n/a 11.57 6.93 4.65 n/aNew London, CT 8461490 08/28/2011 13:24 1.997 0.934 1.063 1.437 6.55 3.06 3.49 4.71Quonset Point, RI 8454049 08/28/2011 12:06 2.097 1.372 0.725 n/a 6.88 4.50 2.38 n/aProvidence, RI 8454000 08/28/2011 13:54 2.516 1.100 1.416 1.762 8.25 3.61 4.65 5.78Conimicut Light, RI 8452944 08/28/2011 11:54 2.313 1.560 0.753 n/a 7.59 5.12 2.47 n/aNewport, RI 8452660 08/28/2011 11:54 1.994 1.291 0.703 1.372 6.54 4.24 2.31 4.50Nantucket Island, MA 8449130 08/28/2011 16:00 1.381 0.991 0.390 n/a 4.53 3.25 1.28 n/aMenemsha Harbor, MA 8448725 08/28/2011 13:12 1.611 0.869 0.742 n/a 5.29 2.85 2.43 n/aWoods Hole, MA 8447930 08/28/2011 13:36 1.405 0.530 0.875 0.990 4.61 1.74 2.87 3.25Chatham, MA 8447435 08/28/2011 16:12 2.271 1.787 0.484 1.241 7.45 5.86 1.59 4.07Fall River, MA 8447386 08/28/2011 11:42 2.226 1.632 0.594 n/a 7.30 5.35 1.95 n/aBoston, MA 8443970 08/28/2011 15:06 3.641 3.116 0.525 1.963 11.95 10.22 1.72 6.44Fort Point, NH 8423898 08/29/2011 03:36 3.335 3.168 0.167 1.822 10.94 10.39 0.55 5.98Wells, ME 8419317 08/29/2011 03:30 3.420 3.176 0.244 1.898 11.22 10.42 0.80 6.23Portland, ME 8418150 08/29/2011 03:06 3.645 3.315 0.330 2.044 11.96 10.88 1.08 6.71Bar Harbor, ME 8413320 08/29/2011 03:12 4.160 3.778 0.382 2.339 13.65 12.39 1.25 7.67Eastport, ME 8410140 08/29/2011 03:06 6.711 6.380 0.331 3.682 22.02 20.93 1.09 12.08
Storm Surge/Residual (ft)
Storm Tide(ft, NAVD88)(ft, MLLW)Station Name Station ID
Date & TimeGMT
Storm Surge/Residual (m)
Storm Tide (m, NAVD88)(m, MLLW)
1 Sensor reached physical limit on measurements and did not record a maximum/minimum value. 2 Station did not record a maximum storm tide and/or storm surge coinciding with the timing of Irene. 3 Maximum recorded water level value exceeded historical maximum value. 4 Maximum storm tide/storm surge includes likely effects from runoff.
NOAA NOS Hurricane Irene Water Level & Meteorological Data Report 9
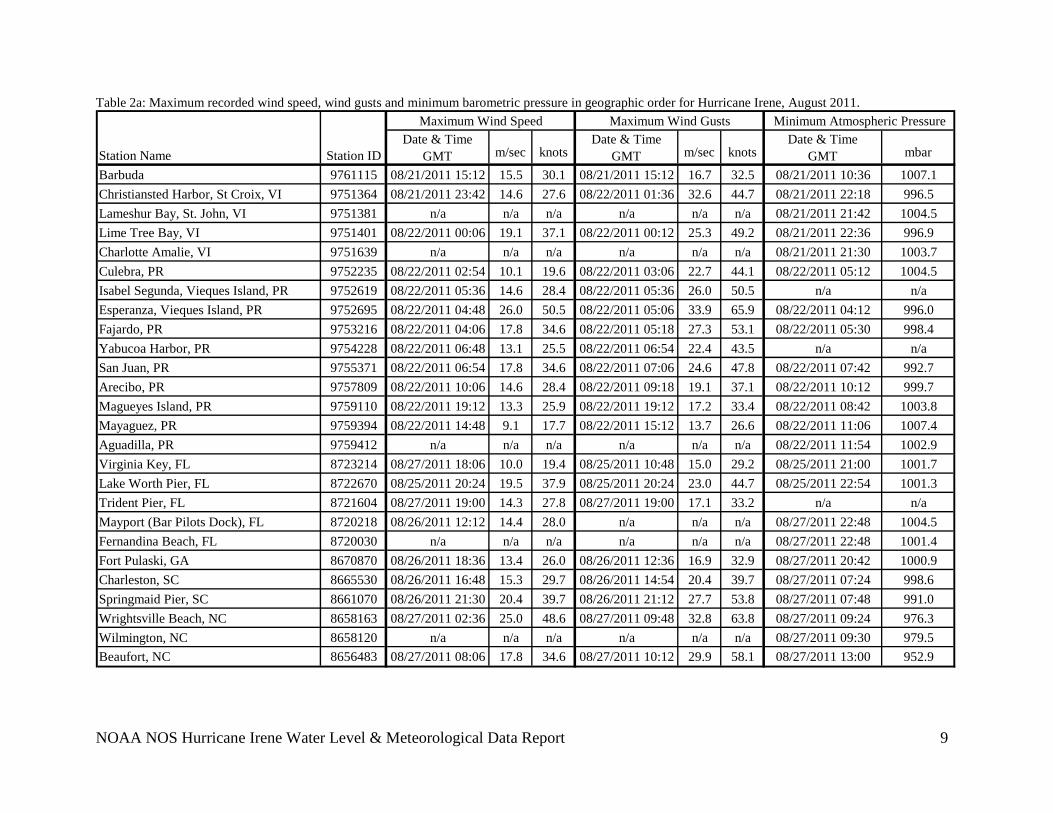
Table 2a: Maximum recorded wind speed, wind gusts and minimum barometric pressure in geographic order for Hurricane Irene, August 2011.
Date & TimeGMT m/sec knots
Date & TimeGMT m/sec knots
Date & TimeGMT mbar
Barbuda 9761115 08/21/2011 15:12 15.5 30.1 08/21/2011 15:12 16.7 32.5 08/21/2011 10:36 1007.1Christiansted Harbor, St Croix, VI 9751364 08/21/2011 23:42 14.6 27.6 08/22/2011 01:36 32.6 44.7 08/21/2011 22:18 996.5Lameshur Bay, St. John, VI 9751381 n/a n/a n/a n/a n/a n/a 08/21/2011 21:42 1004.5Lime Tree Bay, VI 9751401 08/22/2011 00:06 19.1 37.1 08/22/2011 00:12 25.3 49.2 08/21/2011 22:36 996.9Charlotte Amalie, VI 9751639 n/a n/a n/a n/a n/a n/a 08/21/2011 21:30 1003.7Culebra, PR 9752235 08/22/2011 02:54 10.1 19.6 08/22/2011 03:06 22.7 44.1 08/22/2011 05:12 1004.5Isabel Segunda, Vieques Island, PR 9752619 08/22/2011 05:36 14.6 28.4 08/22/2011 05:36 26.0 50.5 n/a n/aEsperanza, Vieques Island, PR 9752695 08/22/2011 04:48 26.0 50.5 08/22/2011 05:06 33.9 65.9 08/22/2011 04:12 996.0Fajardo, PR 9753216 08/22/2011 04:06 17.8 34.6 08/22/2011 05:18 27.3 53.1 08/22/2011 05:30 998.4Yabucoa Harbor, PR 9754228 08/22/2011 06:48 13.1 25.5 08/22/2011 06:54 22.4 43.5 n/a n/aSan Juan, PR 9755371 08/22/2011 06:54 17.8 34.6 08/22/2011 07:06 24.6 47.8 08/22/2011 07:42 992.7Arecibo, PR 9757809 08/22/2011 10:06 14.6 28.4 08/22/2011 09:18 19.1 37.1 08/22/2011 10:12 999.7Magueyes Island, PR 9759110 08/22/2011 19:12 13.3 25.9 08/22/2011 19:12 17.2 33.4 08/22/2011 08:42 1003.8Mayaguez, PR 9759394 08/22/2011 14:48 9.1 17.7 08/22/2011 15:12 13.7 26.6 08/22/2011 11:06 1007.4Aguadilla, PR 9759412 n/a n/a n/a n/a n/a n/a 08/22/2011 11:54 1002.9Virginia Key, FL 8723214 08/27/2011 18:06 10.0 19.4 08/25/2011 10:48 15.0 29.2 08/25/2011 21:00 1001.7Lake Worth Pier, FL 8722670 08/25/2011 20:24 19.5 37.9 08/25/2011 20:24 23.0 44.7 08/25/2011 22:54 1001.3Trident Pier, FL 8721604 08/27/2011 19:00 14.3 27.8 08/27/2011 19:00 17.1 33.2 n/a n/aMayport (Bar Pilots Dock), FL 8720218 08/26/2011 12:12 14.4 28.0 n/a n/a n/a 08/27/2011 22:48 1004.5Fernandina Beach, FL 8720030 n/a n/a n/a n/a n/a n/a 08/27/2011 22:48 1001.4Fort Pulaski, GA 8670870 08/26/2011 18:36 13.4 26.0 08/26/2011 12:36 16.9 32.9 08/27/2011 20:42 1000.9Charleston, SC 8665530 08/26/2011 16:48 15.3 29.7 08/26/2011 14:54 20.4 39.7 08/27/2011 07:24 998.6Springmaid Pier, SC 8661070 08/26/2011 21:30 20.4 39.7 08/26/2011 21:12 27.7 53.8 08/27/2011 07:48 991.0Wrightsville Beach, NC 8658163 08/27/2011 02:36 25.0 48.6 08/27/2011 09:48 32.8 63.8 08/27/2011 09:24 976.3Wilmington, NC 8658120 n/a n/a n/a n/a n/a n/a 08/27/2011 09:30 979.5Beaufort, NC 8656483 08/27/2011 08:06 17.8 34.6 08/27/2011 10:12 29.9 58.1 08/27/2011 13:00 952.9
Station Name Station ID
Minimum Atmospheric PressureMaximum Wind Speed Maximum Wind Gusts
NOAA NOS Hurricane Irene Water Level & Meteorological Data Report 10
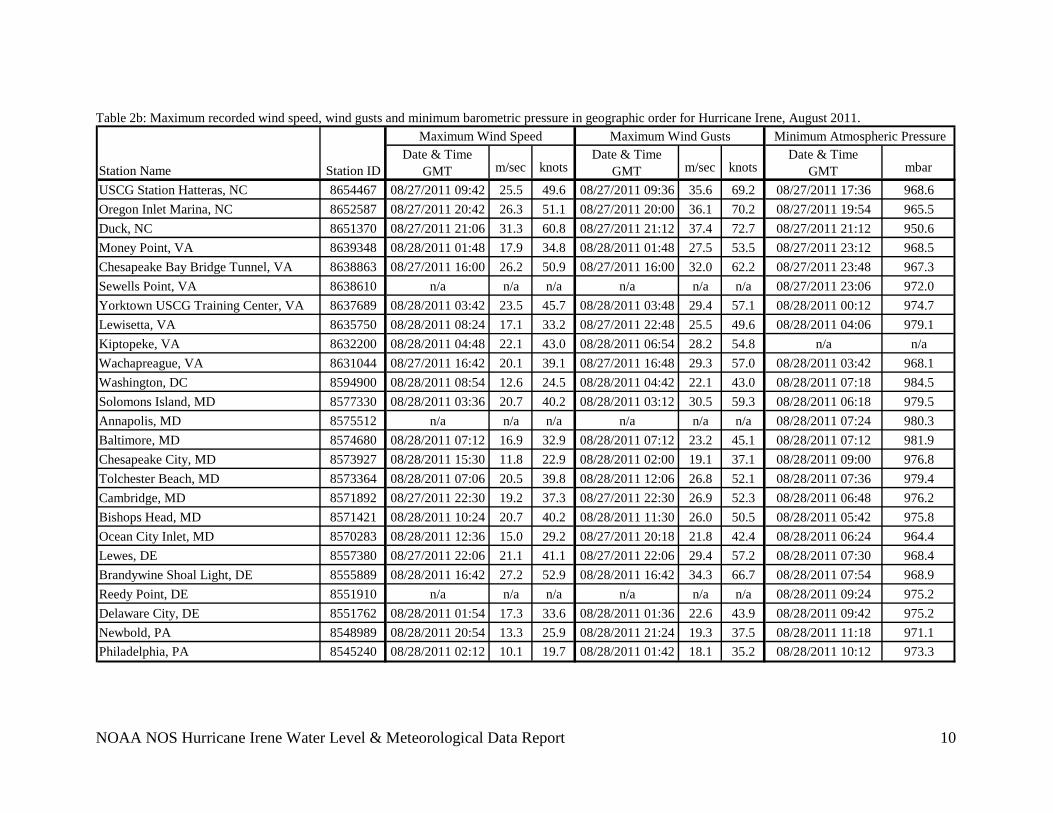
Table 2b: Maximum recorded wind speed, wind gusts and minimum barometric pressure in geographic order for Hurricane Irene, August 2011.
Date & TimeGMT m/sec knots
Date & TimeGMT m/sec knots
Date & TimeGMT mbar
USCG Station Hatteras, NC 8654467 08/27/2011 09:42 25.5 49.6 08/27/2011 09:36 35.6 69.2 08/27/2011 17:36 968.6Oregon Inlet Marina, NC 8652587 08/27/2011 20:42 26.3 51.1 08/27/2011 20:00 36.1 70.2 08/27/2011 19:54 965.5Duck, NC 8651370 08/27/2011 21:06 31.3 60.8 08/27/2011 21:12 37.4 72.7 08/27/2011 21:12 950.6Money Point, VA 8639348 08/28/2011 01:48 17.9 34.8 08/28/2011 01:48 27.5 53.5 08/27/2011 23:12 968.5Chesapeake Bay Bridge Tunnel, VA 8638863 08/27/2011 16:00 26.2 50.9 08/27/2011 16:00 32.0 62.2 08/27/2011 23:48 967.3Sewells Point, VA 8638610 n/a n/a n/a n/a n/a n/a 08/27/2011 23:06 972.0Yorktown USCG Training Center, VA 8637689 08/28/2011 03:42 23.5 45.7 08/28/2011 03:48 29.4 57.1 08/28/2011 00:12 974.7Lewisetta, VA 8635750 08/28/2011 08:24 17.1 33.2 08/27/2011 22:48 25.5 49.6 08/28/2011 04:06 979.1Kiptopeke, VA 8632200 08/28/2011 04:48 22.1 43.0 08/28/2011 06:54 28.2 54.8 n/a n/aWachapreague, VA 8631044 08/27/2011 16:42 20.1 39.1 08/27/2011 16:48 29.3 57.0 08/28/2011 03:42 968.1Washington, DC 8594900 08/28/2011 08:54 12.6 24.5 08/28/2011 04:42 22.1 43.0 08/28/2011 07:18 984.5Solomons Island, MD 8577330 08/28/2011 03:36 20.7 40.2 08/28/2011 03:12 30.5 59.3 08/28/2011 06:18 979.5Annapolis, MD 8575512 n/a n/a n/a n/a n/a n/a 08/28/2011 07:24 980.3Baltimore, MD 8574680 08/28/2011 07:12 16.9 32.9 08/28/2011 07:12 23.2 45.1 08/28/2011 07:12 981.9Chesapeake City, MD 8573927 08/28/2011 15:30 11.8 22.9 08/28/2011 02:00 19.1 37.1 08/28/2011 09:00 976.8Tolchester Beach, MD 8573364 08/28/2011 07:06 20.5 39.8 08/28/2011 12:06 26.8 52.1 08/28/2011 07:36 979.4Cambridge, MD 8571892 08/27/2011 22:30 19.2 37.3 08/27/2011 22:30 26.9 52.3 08/28/2011 06:48 976.2Bishops Head, MD 8571421 08/28/2011 10:24 20.7 40.2 08/28/2011 11:30 26.0 50.5 08/28/2011 05:42 975.8Ocean City Inlet, MD 8570283 08/28/2011 12:36 15.0 29.2 08/27/2011 20:18 21.8 42.4 08/28/2011 06:24 964.4Lewes, DE 8557380 08/27/2011 22:06 21.1 41.1 08/27/2011 22:06 29.4 57.2 08/28/2011 07:30 968.4Brandywine Shoal Light, DE 8555889 08/28/2011 16:42 27.2 52.9 08/28/2011 16:42 34.3 66.7 08/28/2011 07:54 968.9Reedy Point, DE 8551910 n/a n/a n/a n/a n/a n/a 08/28/2011 09:24 975.2Delaware City, DE 8551762 08/28/2011 01:54 17.3 33.6 08/28/2011 01:36 22.6 43.9 08/28/2011 09:42 975.2Newbold, PA 8548989 08/28/2011 20:54 13.3 25.9 08/28/2011 21:24 19.3 37.5 08/28/2011 11:18 971.1Philadelphia, PA 8545240 08/28/2011 02:12 10.1 19.7 08/28/2011 01:42 18.1 35.2 08/28/2011 10:12 973.3
Station Name Station ID
Minimum Atmospheric PressureMaximum Wind Speed Maximum Wind Gusts
NOAA NOS Hurricane Irene Water Level & Meteorological Data Report 11
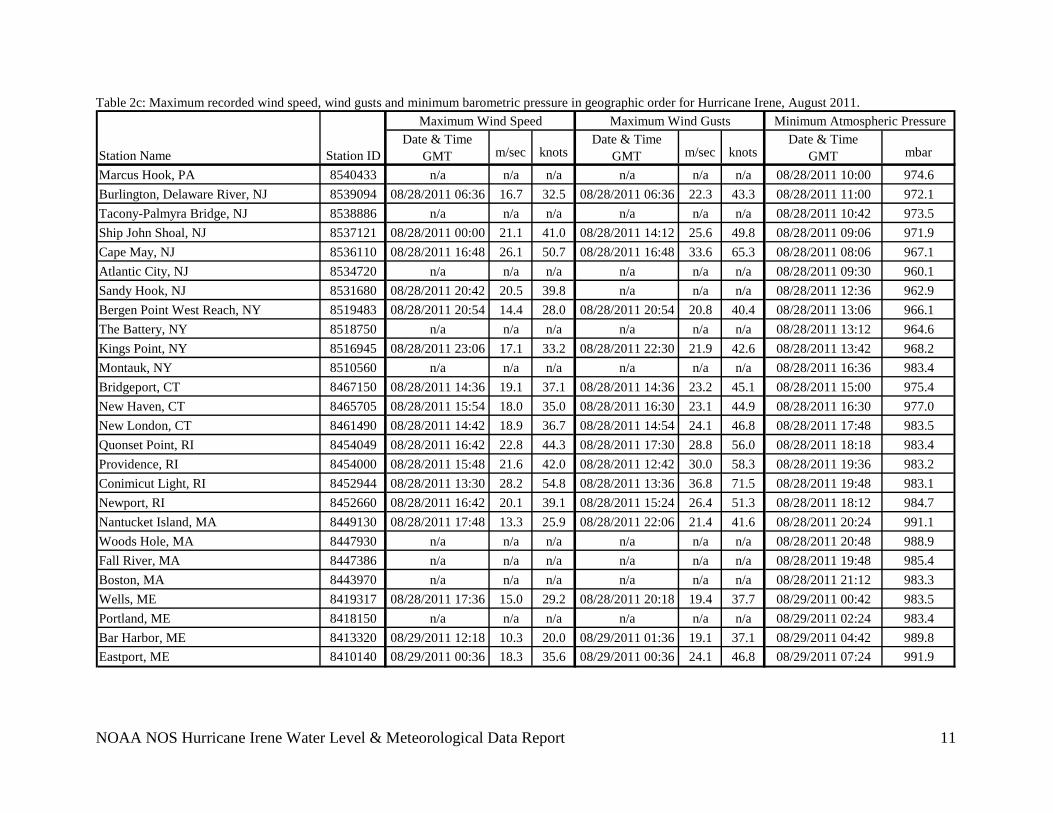
Table 2c: Maximum recorded wind speed, wind gusts and minimum barometric pressure in geographic order for Hurricane Irene, August 2011.
Date & TimeGMT m/sec knots
Date & TimeGMT m/sec knots
Date & TimeGMT mbar
Marcus Hook, PA 8540433 n/a n/a n/a n/a n/a n/a 08/28/2011 10:00 974.6Burlington, Delaware River, NJ 8539094 08/28/2011 06:36 16.7 32.5 08/28/2011 06:36 22.3 43.3 08/28/2011 11:00 972.1Tacony-Palmyra Bridge, NJ 8538886 n/a n/a n/a n/a n/a n/a 08/28/2011 10:42 973.5Ship John Shoal, NJ 8537121 08/28/2011 00:00 21.1 41.0 08/28/2011 14:12 25.6 49.8 08/28/2011 09:06 971.9Cape May, NJ 8536110 08/28/2011 16:48 26.1 50.7 08/28/2011 16:48 33.6 65.3 08/28/2011 08:06 967.1Atlantic City, NJ 8534720 n/a n/a n/a n/a n/a n/a 08/28/2011 09:30 960.1Sandy Hook, NJ 8531680 08/28/2011 20:42 20.5 39.8 n/a n/a n/a 08/28/2011 12:36 962.9Bergen Point West Reach, NY 8519483 08/28/2011 20:54 14.4 28.0 08/28/2011 20:54 20.8 40.4 08/28/2011 13:06 966.1The Battery, NY 8518750 n/a n/a n/a n/a n/a n/a 08/28/2011 13:12 964.6Kings Point, NY 8516945 08/28/2011 23:06 17.1 33.2 08/28/2011 22:30 21.9 42.6 08/28/2011 13:42 968.2Montauk, NY 8510560 n/a n/a n/a n/a n/a n/a 08/28/2011 16:36 983.4Bridgeport, CT 8467150 08/28/2011 14:36 19.1 37.1 08/28/2011 14:36 23.2 45.1 08/28/2011 15:00 975.4New Haven, CT 8465705 08/28/2011 15:54 18.0 35.0 08/28/2011 16:30 23.1 44.9 08/28/2011 16:30 977.0New London, CT 8461490 08/28/2011 14:42 18.9 36.7 08/28/2011 14:54 24.1 46.8 08/28/2011 17:48 983.5Quonset Point, RI 8454049 08/28/2011 16:42 22.8 44.3 08/28/2011 17:30 28.8 56.0 08/28/2011 18:18 983.4Providence, RI 8454000 08/28/2011 15:48 21.6 42.0 08/28/2011 12:42 30.0 58.3 08/28/2011 19:36 983.2Conimicut Light, RI 8452944 08/28/2011 13:30 28.2 54.8 08/28/2011 13:36 36.8 71.5 08/28/2011 19:48 983.1Newport, RI 8452660 08/28/2011 16:42 20.1 39.1 08/28/2011 15:24 26.4 51.3 08/28/2011 18:12 984.7Nantucket Island, MA 8449130 08/28/2011 17:48 13.3 25.9 08/28/2011 22:06 21.4 41.6 08/28/2011 20:24 991.1Woods Hole, MA 8447930 n/a n/a n/a n/a n/a n/a 08/28/2011 20:48 988.9Fall River, MA 8447386 n/a n/a n/a n/a n/a n/a 08/28/2011 19:48 985.4Boston, MA 8443970 n/a n/a n/a n/a n/a n/a 08/28/2011 21:12 983.3Wells, ME 8419317 08/28/2011 17:36 15.0 29.2 08/28/2011 20:18 19.4 37.7 08/29/2011 00:42 983.5Portland, ME 8418150 n/a n/a n/a n/a n/a n/a 08/29/2011 02:24 983.4Bar Harbor, ME 8413320 08/29/2011 12:18 10.3 20.0 08/29/2011 01:36 19.1 37.1 08/29/2011 04:42 989.8Eastport, ME 8410140 08/29/2011 00:36 18.3 35.6 08/29/2011 00:36 24.1 46.8 08/29/2011 07:24 991.9
Station Name Station ID
Minimum Atmospheric PressureMaximum Wind Speed Maximum Wind Gusts
NOAA NOS Hurricane Irene Water Level & Meteorological Data Report 12
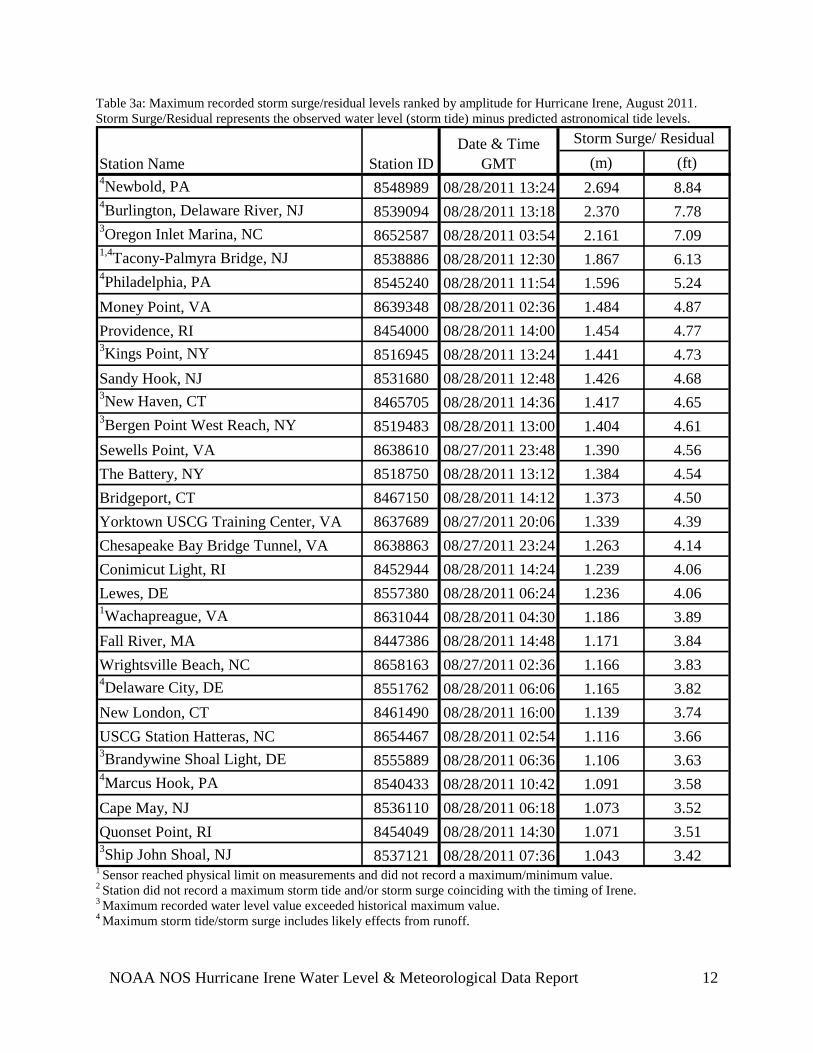
Table 3a: Maximum recorded storm surge/residual levels ranked by amplitude for Hurricane Irene, August 2011. Storm Surge/Residual represents the observed water level (storm tide) minus predicted astronomical tide levels.
(m) (ft)4Newbold, PA 8548989 08/28/2011 13:24 2.694 8.844Burlington, Delaware River, NJ 8539094 08/28/2011 13:18 2.370 7.783Oregon Inlet Marina, NC 8652587 08/28/2011 03:54 2.161 7.091,4Tacony-Palmyra Bridge, NJ 8538886 08/28/2011 12:30 1.867 6.134Philadelphia, PA 8545240 08/28/2011 11:54 1.596 5.24Money Point, VA 8639348 08/28/2011 02:36 1.484 4.87Providence, RI 8454000 08/28/2011 14:00 1.454 4.773Kings Point, NY 8516945 08/28/2011 13:24 1.441 4.73Sandy Hook, NJ 8531680 08/28/2011 12:48 1.426 4.683New Haven, CT 8465705 08/28/2011 14:36 1.417 4.653Bergen Point West Reach, NY 8519483 08/28/2011 13:00 1.404 4.61Sewells Point, VA 8638610 08/27/2011 23:48 1.390 4.56The Battery, NY 8518750 08/28/2011 13:12 1.384 4.54Bridgeport, CT 8467150 08/28/2011 14:12 1.373 4.50Yorktown USCG Training Center, VA 8637689 08/27/2011 20:06 1.339 4.39Chesapeake Bay Bridge Tunnel, VA 8638863 08/27/2011 23:24 1.263 4.14Conimicut Light, RI 8452944 08/28/2011 14:24 1.239 4.06Lewes, DE 8557380 08/28/2011 06:24 1.236 4.061Wachapreague, VA 8631044 08/28/2011 04:30 1.186 3.89Fall River, MA 8447386 08/28/2011 14:48 1.171 3.84Wrightsville Beach, NC 8658163 08/27/2011 02:36 1.166 3.834Delaware City, DE 8551762 08/28/2011 06:06 1.165 3.82New London, CT 8461490 08/28/2011 16:00 1.139 3.74USCG Station Hatteras, NC 8654467 08/28/2011 02:54 1.116 3.663Brandywine Shoal Light, DE 8555889 08/28/2011 06:36 1.106 3.634Marcus Hook, PA 8540433 08/28/2011 10:42 1.091 3.58Cape May, NJ 8536110 08/28/2011 06:18 1.073 3.52Quonset Point, RI 8454049 08/28/2011 14:30 1.071 3.513Ship John Shoal, NJ 8537121 08/28/2011 07:36 1.043 3.42
Station Name Station IDDate & Time
GMTStorm Surge/ Residual
1 Sensor reached physical limit on measurements and did not record a maximum/minimum value. 2 Station did not record a maximum storm tide and/or storm surge coinciding with the timing of Irene. 3 Maximum recorded water level value exceeded historical maximum value. 4 Maximum storm tide/storm surge includes likely effects from runoff.
NOAA NOS Hurricane Irene Water Level & Meteorological Data Report 13
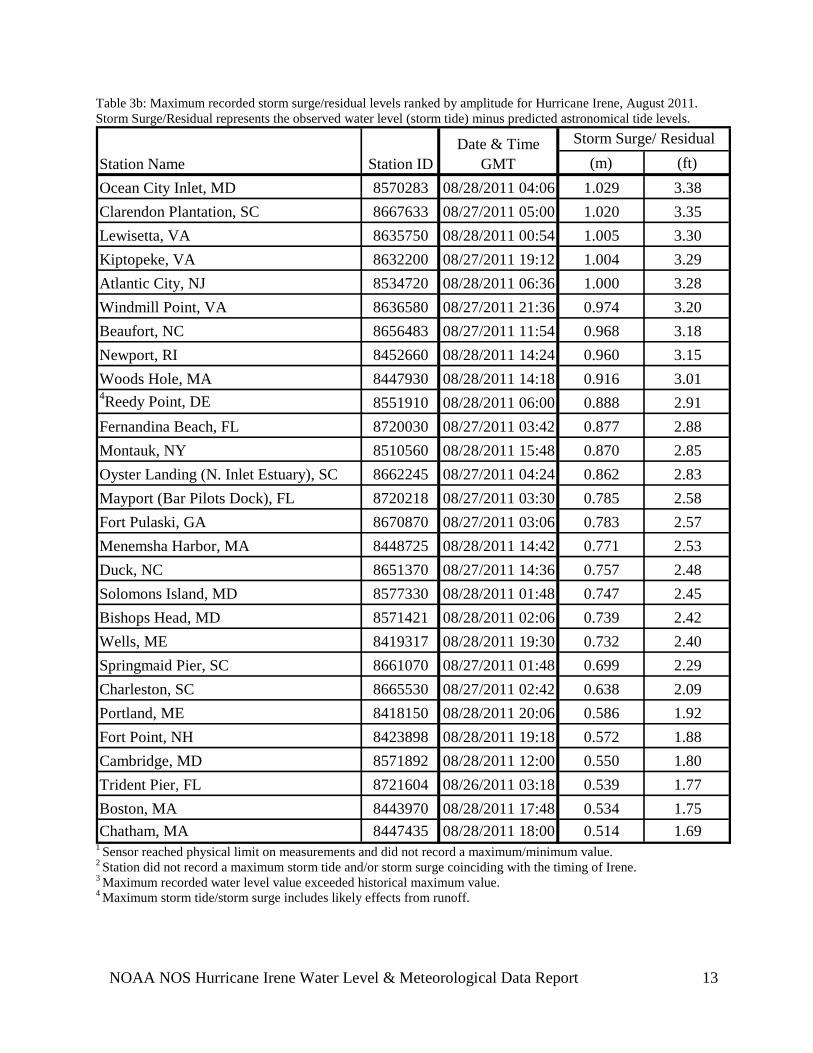
Table 3b: Maximum recorded storm surge/residual levels ranked by amplitude for Hurricane Irene, August 2011. Storm Surge/Residual represents the observed water level (storm tide) minus predicted astronomical tide levels.
(m) (ft)Ocean City Inlet, MD 8570283 08/28/2011 04:06 1.029 3.38Clarendon Plantation, SC 8667633 08/27/2011 05:00 1.020 3.35Lewisetta, VA 8635750 08/28/2011 00:54 1.005 3.30Kiptopeke, VA 8632200 08/27/2011 19:12 1.004 3.29Atlantic City, NJ 8534720 08/28/2011 06:36 1.000 3.28Windmill Point, VA 8636580 08/27/2011 21:36 0.974 3.20Beaufort, NC 8656483 08/27/2011 11:54 0.968 3.18Newport, RI 8452660 08/28/2011 14:24 0.960 3.15Woods Hole, MA 8447930 08/28/2011 14:18 0.916 3.014Reedy Point, DE 8551910 08/28/2011 06:00 0.888 2.91Fernandina Beach, FL 8720030 08/27/2011 03:42 0.877 2.88Montauk, NY 8510560 08/28/2011 15:48 0.870 2.85Oyster Landing (N. Inlet Estuary), SC 8662245 08/27/2011 04:24 0.862 2.83Mayport (Bar Pilots Dock), FL 8720218 08/27/2011 03:30 0.785 2.58Fort Pulaski, GA 8670870 08/27/2011 03:06 0.783 2.57Menemsha Harbor, MA 8448725 08/28/2011 14:42 0.771 2.53Duck, NC 8651370 08/27/2011 14:36 0.757 2.48Solomons Island, MD 8577330 08/28/2011 01:48 0.747 2.45Bishops Head, MD 8571421 08/28/2011 02:06 0.739 2.42Wells, ME 8419317 08/28/2011 19:30 0.732 2.40Springmaid Pier, SC 8661070 08/27/2011 01:48 0.699 2.29Charleston, SC 8665530 08/27/2011 02:42 0.638 2.09Portland, ME 8418150 08/28/2011 20:06 0.586 1.92Fort Point, NH 8423898 08/28/2011 19:18 0.572 1.88Cambridge, MD 8571892 08/28/2011 12:00 0.550 1.80Trident Pier, FL 8721604 08/26/2011 03:18 0.539 1.77Boston, MA 8443970 08/28/2011 17:48 0.534 1.75Chatham, MA 8447435 08/28/2011 18:00 0.514 1.69
Station Name Station IDDate & Time
GMTStorm Surge/ Residual
1 Sensor reached physical limit on measurements and did not record a maximum/minimum value. 2 Station did not record a maximum storm tide and/or storm surge coinciding with the timing of Irene. 3 Maximum recorded water level value exceeded historical maximum value. 4 Maximum storm tide/storm surge includes likely effects from runoff.
NOAA NOS Hurricane Irene Water Level & Meteorological Data Report 14
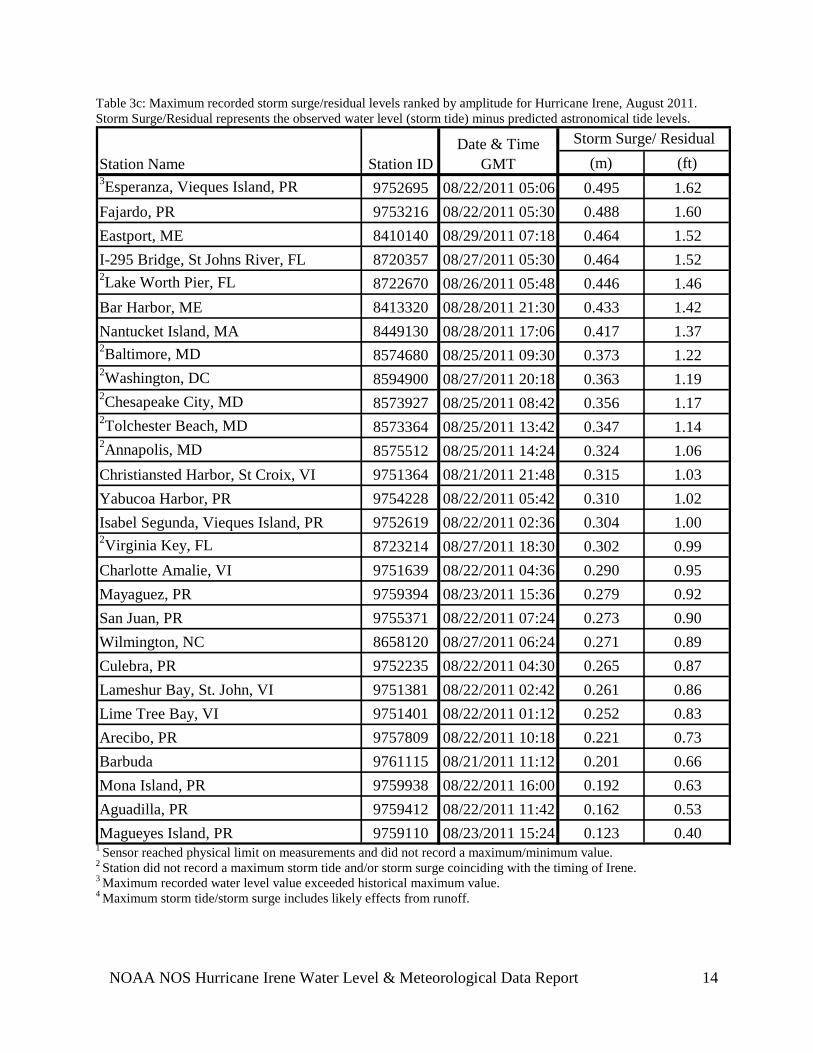
Table 3c: Maximum recorded storm surge/residual levels ranked by amplitude for Hurricane Irene, August 2011. Storm Surge/Residual represents the observed water level (storm tide) minus predicted astronomical tide levels.
(m) (ft)3Esperanza, Vieques Island, PR 9752695 08/22/2011 05:06 0.495 1.62Fajardo, PR 9753216 08/22/2011 05:30 0.488 1.60Eastport, ME 8410140 08/29/2011 07:18 0.464 1.52I-295 Bridge, St Johns River, FL 8720357 08/27/2011 05:30 0.464 1.522Lake Worth Pier, FL 8722670 08/26/2011 05:48 0.446 1.46Bar Harbor, ME 8413320 08/28/2011 21:30 0.433 1.42Nantucket Island, MA 8449130 08/28/2011 17:06 0.417 1.372Baltimore, MD 8574680 08/25/2011 09:30 0.373 1.222Washington, DC 8594900 08/27/2011 20:18 0.363 1.192Chesapeake City, MD 8573927 08/25/2011 08:42 0.356 1.172Tolchester Beach, MD 8573364 08/25/2011 13:42 0.347 1.142Annapolis, MD 8575512 08/25/2011 14:24 0.324 1.06Christiansted Harbor, St Croix, VI 9751364 08/21/2011 21:48 0.315 1.03Yabucoa Harbor, PR 9754228 08/22/2011 05:42 0.310 1.02Isabel Segunda, Vieques Island, PR 9752619 08/22/2011 02:36 0.304 1.002Virginia Key, FL 8723214 08/27/2011 18:30 0.302 0.99Charlotte Amalie, VI 9751639 08/22/2011 04:36 0.290 0.95Mayaguez, PR 9759394 08/23/2011 15:36 0.279 0.92San Juan, PR 9755371 08/22/2011 07:24 0.273 0.90Wilmington, NC 8658120 08/27/2011 06:24 0.271 0.89Culebra, PR 9752235 08/22/2011 04:30 0.265 0.87Lameshur Bay, St. John, VI 9751381 08/22/2011 02:42 0.261 0.86Lime Tree Bay, VI 9751401 08/22/2011 01:12 0.252 0.83Arecibo, PR 9757809 08/22/2011 10:18 0.221 0.73Barbuda 9761115 08/21/2011 11:12 0.201 0.66Mona Island, PR 9759938 08/22/2011 16:00 0.192 0.63Aguadilla, PR 9759412 08/22/2011 11:42 0.162 0.53Magueyes Island, PR 9759110 08/23/2011 15:24 0.123 0.40
Storm Surge/ ResidualStation Name
Date & TimeGMTStation ID
1 Sensor reached physical limit on measurements and did not record a maximum/minimum value. 2 Station did not record a maximum storm tide and/or storm surge coinciding with the timing of Irene. 3 Maximum recorded water level value exceeded historical maximum value. 4 Maximum storm tide/storm surge includes likely effects from runoff.
NOAA NOS Hurricane Irene Water Level & Meteorological Data Report 15
0.000
0.500
1.000
1.500
2.000
2.500
3.000
3.500
4.000
New Haven, CT
Kings Point, NY
Bergen Point West Reach,
NY
Ship John Shoal, NJ
Brandywine Shoal Light,
DE
Oregon Inlet Marina, NC
Esperanza, Vieques
Island, PR
Ele
vatio
n (m
eter
s) a
bove
ML
LWNOAA NOS Center for Operational Oceanographic Products & ServicesStation Comparison of Superseded Historical Maximum Water Levels
with Hurricane Irene Maximum Storm Tide
Historical Recorded Maximum Water Level
Maximum Storm Tide Resulting From Irene
Figure 3: Stations that exceeded historical recorded maximum tide levels during Hurricane Irene.
NOAA NOS Hurricane Irene Water Level & Meteorological Data Report 16
-0.500
0.000
0.500
1.000
1.500
2.000
08-20 08-21 08-22 08-23 08-24
Hei
ght a
bove
ML
LW (m
)
Date & Time (GMT)
ObservedPredicted ResidualHATLandfall
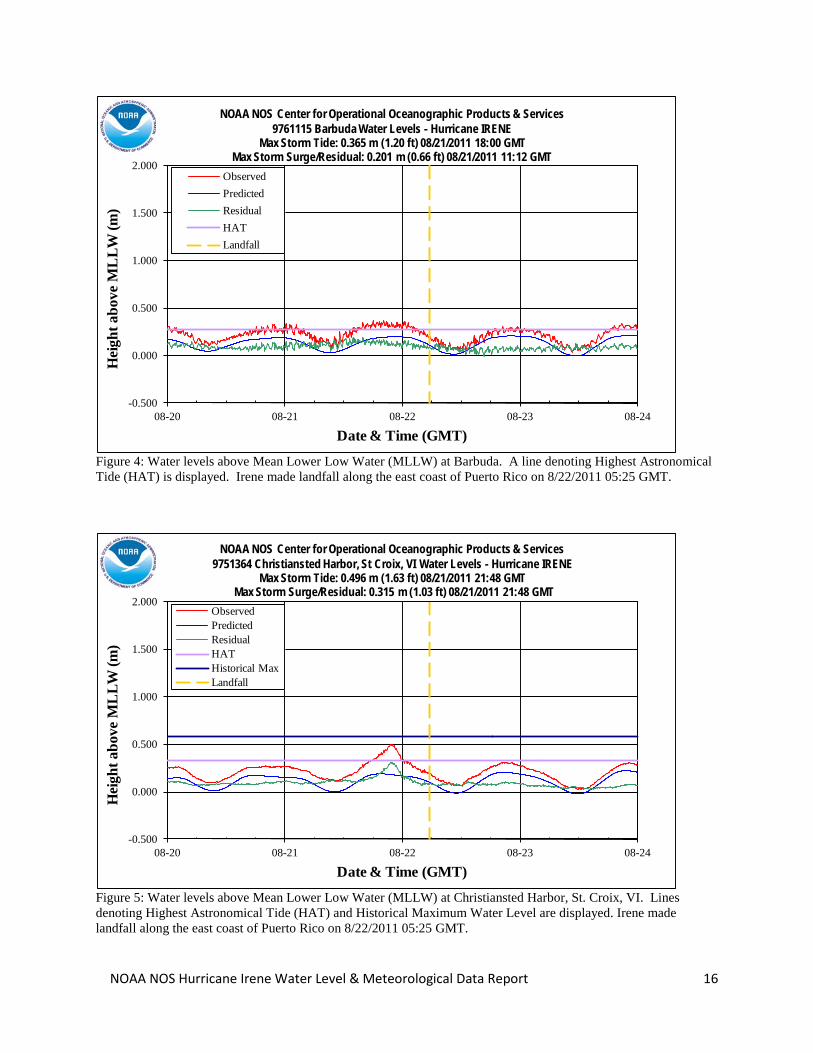
NOAA NOS Center for Operational Oceanographic Products & Services9761115 Barbuda Water Levels - Hurricane IRENE
Max Storm Tide: 0.365 m (1.20 ft) 08/21/2011 18:00 GMTMax Storm Surge/Residual: 0.201 m (0.66 ft) 08/21/2011 11:12 GMT
Figure 4: Water levels above Mean Lower Low Water (MLLW) at Barbuda. A line denoting Highest Astronomical Tide (HAT) is displayed. Irene made landfall along the east coast of Puerto Rico on 8/22/2011 05:25 GMT.
-0.500
0.000
0.500
1.000
1.500
2.000
08-20 08-21 08-22 08-23 08-24
Hei
ght a
bove
ML
LW (m
)
Date & Time (GMT)
ObservedPredicted ResidualHATHistorical MaxLandfall
NOAA NOS Center for Operational Oceanographic Products & Services9751364 Christiansted Harbor, St Croix, VI Water Levels - Hurricane IRENE
Max Storm Tide: 0.496 m (1.63 ft) 08/21/2011 21:48 GMTMax Storm Surge/Residual: 0.315 m (1.03 ft) 08/21/2011 21:48 GMT
Figure 5: Water levels above Mean Lower Low Water (MLLW) at Christiansted Harbor, St. Croix, VI. Lines denoting Highest Astronomical Tide (HAT) and Historical Maximum Water Level are displayed. Irene made landfall along the east coast of Puerto Rico on 8/22/2011 05:25 GMT.
NOAA NOS Hurricane Irene Water Level & Meteorological Data Report 17
-0.500
0.000
0.500
1.000
1.500
2.000
08-20 08-21 08-22 08-23 08-24
Hei
ght a
bove
ML
LW (m
)
Date & Time (GMT)
ObservedPredicted ResidualHATHistorical MaxLandfall
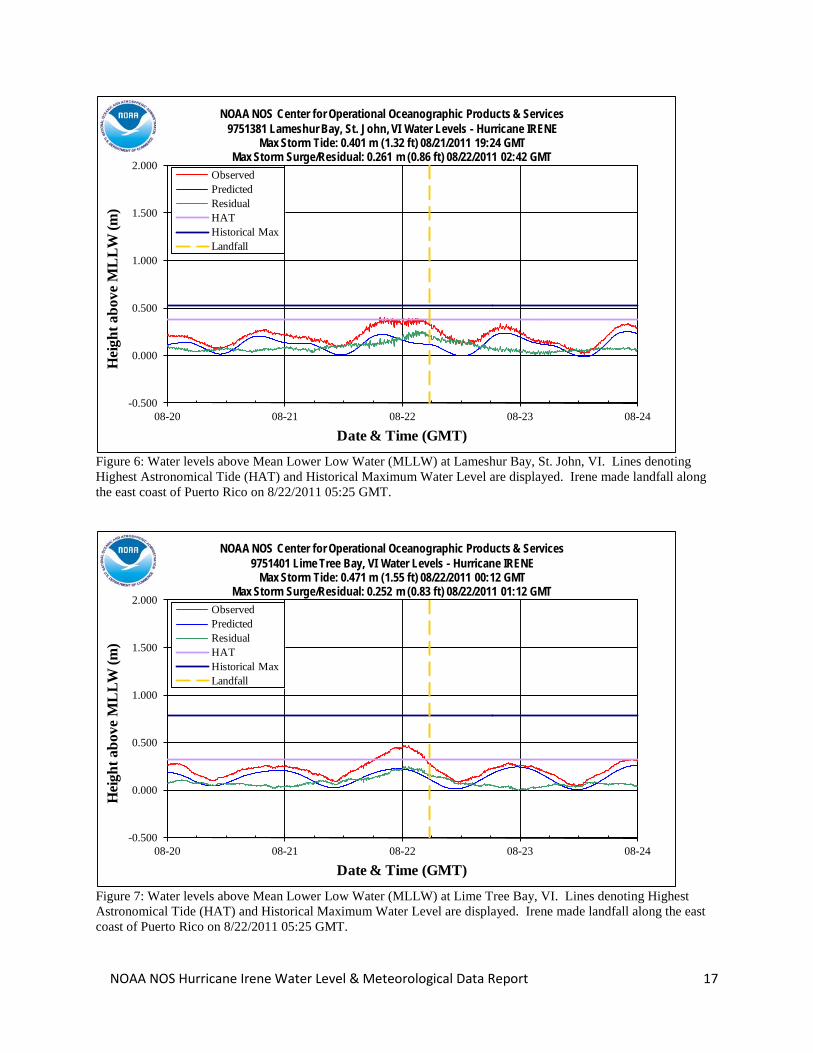
NOAA NOS Center for Operational Oceanographic Products & Services9751381 Lameshur Bay, St. John, VI Water Levels - Hurricane IRENE
Max Storm Tide: 0.401 m (1.32 ft) 08/21/2011 19:24 GMTMax Storm Surge/Residual: 0.261 m (0.86 ft) 08/22/2011 02:42 GMT
Figure 6: Water levels above Mean Lower Low Water (MLLW) at Lameshur Bay, St. John, VI. Lines denoting Highest Astronomical Tide (HAT) and Historical Maximum Water Level are displayed. Irene made landfall along the east coast of Puerto Rico on 8/22/2011 05:25 GMT.
-0.500
0.000
0.500
1.000
1.500
2.000
08-20 08-21 08-22 08-23 08-24
Hei
ght a
bove
ML
LW (m
)
Date & Time (GMT)
ObservedPredicted ResidualHATHistorical MaxLandfall
NOAA NOS Center for Operational Oceanographic Products & Services9751401 Lime Tree Bay, VI Water Levels - Hurricane IRENE
Max Storm Tide: 0.471 m (1.55 ft) 08/22/2011 00:12 GMTMax Storm Surge/Residual: 0.252 m (0.83 ft) 08/22/2011 01:12 GMT
Figure 7: Water levels above Mean Lower Low Water (MLLW) at Lime Tree Bay, VI. Lines denoting Highest Astronomical Tide (HAT) and Historical Maximum Water Level are displayed. Irene made landfall along the east coast of Puerto Rico on 8/22/2011 05:25 GMT.
NOAA NOS Hurricane Irene Water Level & Meteorological Data Report 18
-0.500
0.000
0.500
1.000
1.500
2.000
08-20 08-21 08-22 08-23 08-24
Hei
ght a
bove
ML
LW (m
)
Date & Time (GMT)
ObservedPredicted ResidualHATHistorical MaxLandfall
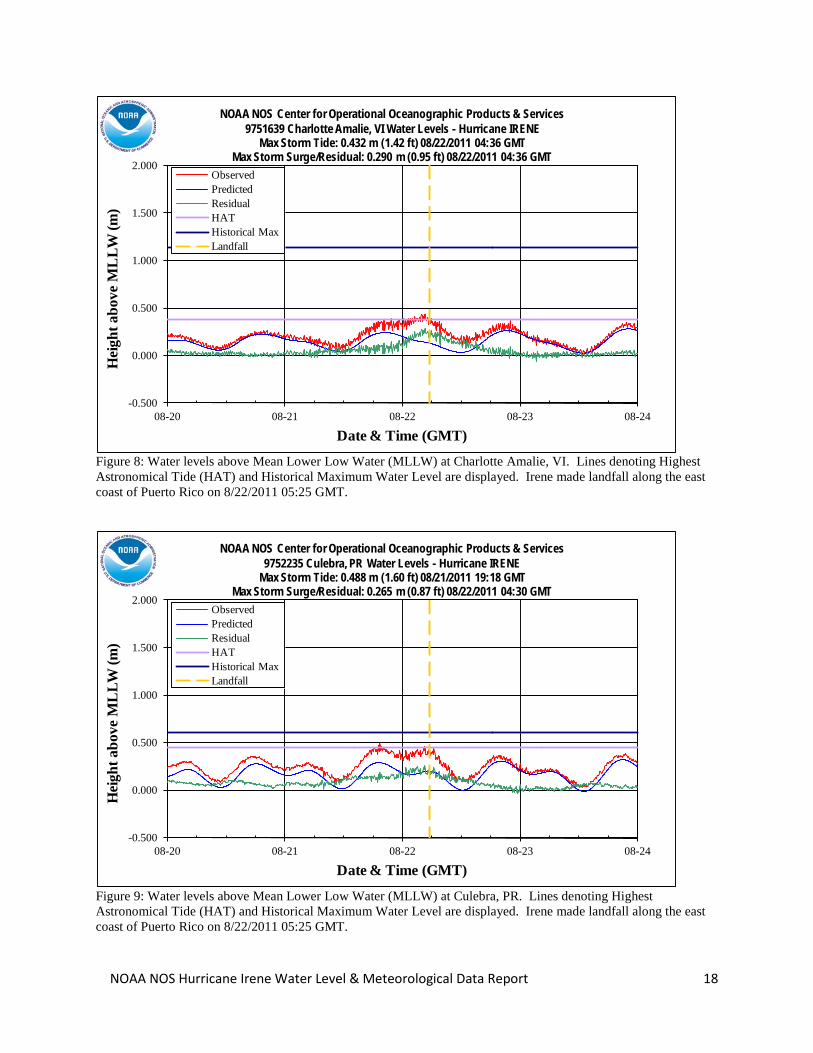
NOAA NOS Center for Operational Oceanographic Products & Services9751639 Charlotte Amalie, VI Water Levels - Hurricane IRENE
Max Storm Tide: 0.432 m (1.42 ft) 08/22/2011 04:36 GMTMax Storm Surge/Residual: 0.290 m (0.95 ft) 08/22/2011 04:36 GMT
Figure 8: Water levels above Mean Lower Low Water (MLLW) at Charlotte Amalie, VI. Lines denoting Highest Astronomical Tide (HAT) and Historical Maximum Water Level are displayed. Irene made landfall along the east coast of Puerto Rico on 8/22/2011 05:25 GMT.
-0.500
0.000
0.500
1.000
1.500
2.000
08-20 08-21 08-22 08-23 08-24
Hei
ght a
bove
ML
LW (m
)
Date & Time (GMT)
ObservedPredicted ResidualHATHistorical MaxLandfall
NOAA NOS Center for Operational Oceanographic Products & Services9752235 Culebra, PR Water Levels - Hurricane IRENE
Max Storm Tide: 0.488 m (1.60 ft) 08/21/2011 19:18 GMTMax Storm Surge/Residual: 0.265 m (0.87 ft) 08/22/2011 04:30 GMT
Figure 9: Water levels above Mean Lower Low Water (MLLW) at Culebra, PR. Lines denoting Highest Astronomical Tide (HAT) and Historical Maximum Water Level are displayed. Irene made landfall along the east coast of Puerto Rico on 8/22/2011 05:25 GMT.
NOAA NOS Hurricane Irene Water Level & Meteorological Data Report 19
-0.500
0.000
0.500
1.000
1.500
2.000
08-20 08-21 08-22 08-23 08-24
Hei
ght a
bove
ML
LW (m
)
Date & Time (GMT)
ObservedPredicted ResidualHATLandfall
NOAA NOS Center for Operational Oceanographic Products & Services9752619 Isabel Segunda, Vieques Island, PR Water Levels - Hurricane IRENE
Max Storm Tide: 0.511 m (1.68 ft) 08/21/2011 19:42 GMTMax Storm Surge/Residual: 0.304 m (1.00 ft) 08/22/2011 02:36 GMT
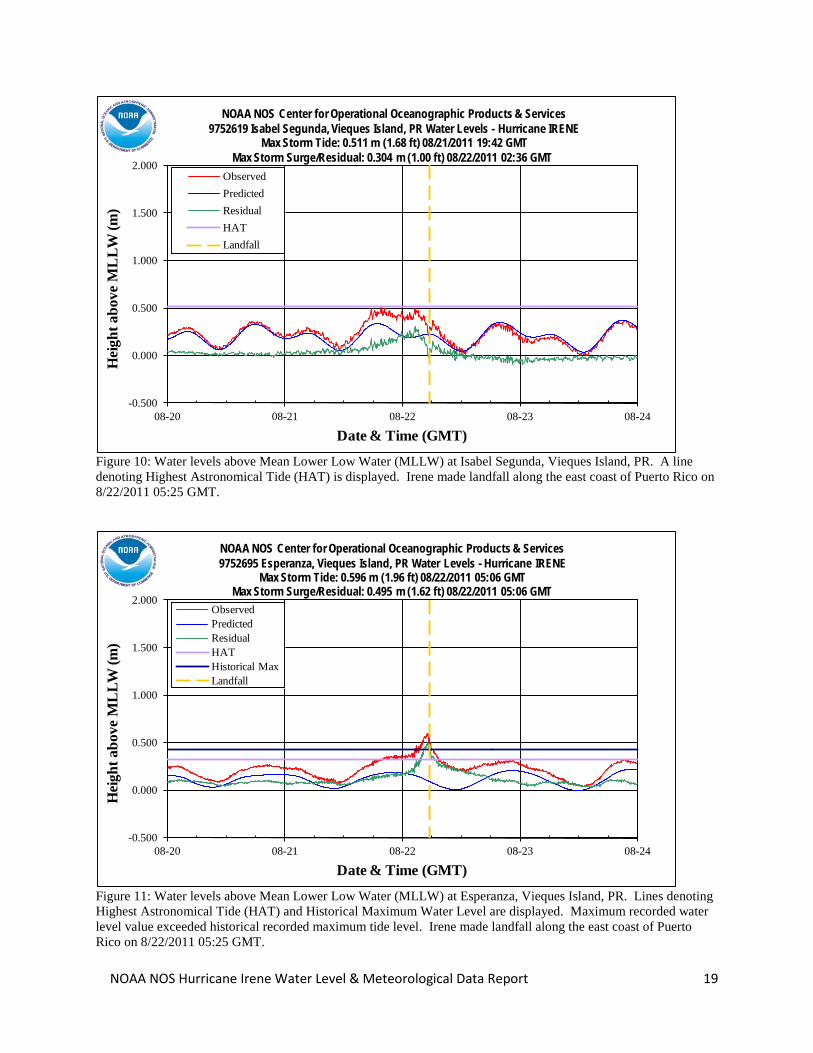
Figure 10: Water levels above Mean Lower Low Water (MLLW) at Isabel Segunda, Vieques Island, PR. A line denoting Highest Astronomical Tide (HAT) is displayed. Irene made landfall along the east coast of Puerto Rico on 8/22/2011 05:25 GMT.
-0.500
0.000
0.500
1.000
1.500
2.000
08-20 08-21 08-22 08-23 08-24
Hei
ght a
bove
ML
LW (m
)
Date & Time (GMT)
ObservedPredicted ResidualHATHistorical MaxLandfall
NOAA NOS Center for Operational Oceanographic Products & Services9752695 Esperanza, Vieques Island, PR Water Levels - Hurricane IRENE
Max Storm Tide: 0.596 m (1.96 ft) 08/22/2011 05:06 GMTMax Storm Surge/Residual: 0.495 m (1.62 ft) 08/22/2011 05:06 GMT
Figure 11: Water levels above Mean Lower Low Water (MLLW) at Esperanza, Vieques Island, PR. Lines denoting Highest Astronomical Tide (HAT) and Historical Maximum Water Level are displayed. Maximum recorded water level value exceeded historical recorded maximum tide level. Irene made landfall along the east coast of Puerto Rico on 8/22/2011 05:25 GMT.
NOAA NOS Hurricane Irene Water Level & Meteorological Data Report 20
-0.500
0.000
0.500
1.000
1.500
2.000
08-20 08-21 08-22 08-23 08-24
Hei
ght a
bove
ML
LW (m
)
Date & Time (GMT)
ObservedPredicted ResidualHATLandfall
NOAA NOS Center for Operational Oceanographic Products & Services9753216 Fajardo, PR Water Levels - Hurricane IRENE
Max Storm Tide: 0.787 m (2.58 ft) 08/22/2011 05:30 GMTMax Storm Surge/Residual: 0.488 m (1.60 ft) 08/22/2011 05:30 GMT
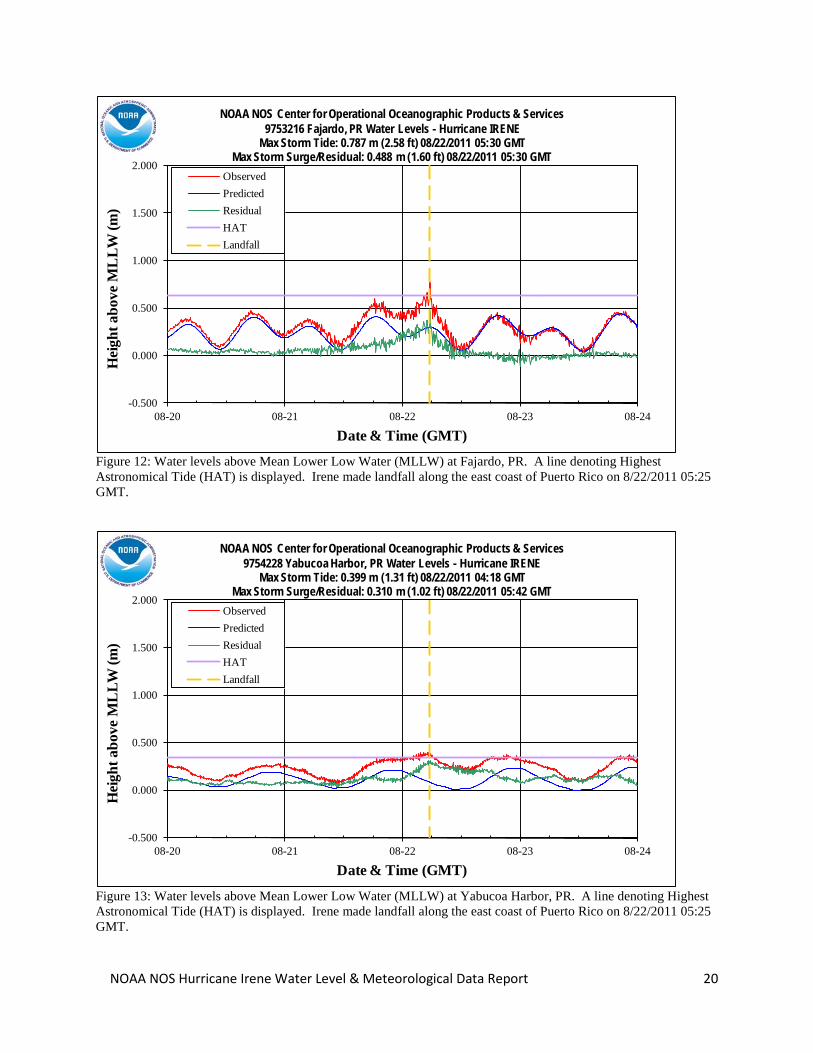
Figure 12: Water levels above Mean Lower Low Water (MLLW) at Fajardo, PR. A line denoting Highest Astronomical Tide (HAT) is displayed. Irene made landfall along the east coast of Puerto Rico on 8/22/2011 05:25 GMT.
-0.500
0.000
0.500
1.000
1.500
2.000
08-20 08-21 08-22 08-23 08-24
Hei
ght a
bove
ML
LW (m
)
Date & Time (GMT)
ObservedPredicted ResidualHATLandfall
NOAA NOS Center for Operational Oceanographic Products & Services9754228 Yabucoa Harbor, PR Water Levels - Hurricane IRENE
Max Storm Tide: 0.399 m (1.31 ft) 08/22/2011 04:18 GMTMax Storm Surge/Residual: 0.310 m (1.02 ft) 08/22/2011 05:42 GMT
Figure 13: Water levels above Mean Lower Low Water (MLLW) at Yabucoa Harbor, PR. A line denoting Highest Astronomical Tide (HAT) is displayed. Irene made landfall along the east coast of Puerto Rico on 8/22/2011 05:25 GMT.
NOAA NOS Hurricane Irene Water Level & Meteorological Data Report 21
-0.500
0.000
0.500
1.000
1.500
2.000
08-20 08-21 08-22 08-23 08-24
Hei
ght a
bove
ML
LW (m
)
Date & Time (GMT)
ObservedPredicted ResidualHATHistorical MaxLandfall
NOAA NOS Center for Operational Oceanographic Products & Services9755371 San Juan, PR Water Levels - Hurricane IRENEMax Storm Tide: 0.550 m (1.80 ft) 08/22/2011 06:48 GMT
Max Storm Surge/Residual: 0.273 m (0.90 ft) 08/22/2011 07:24 GMT
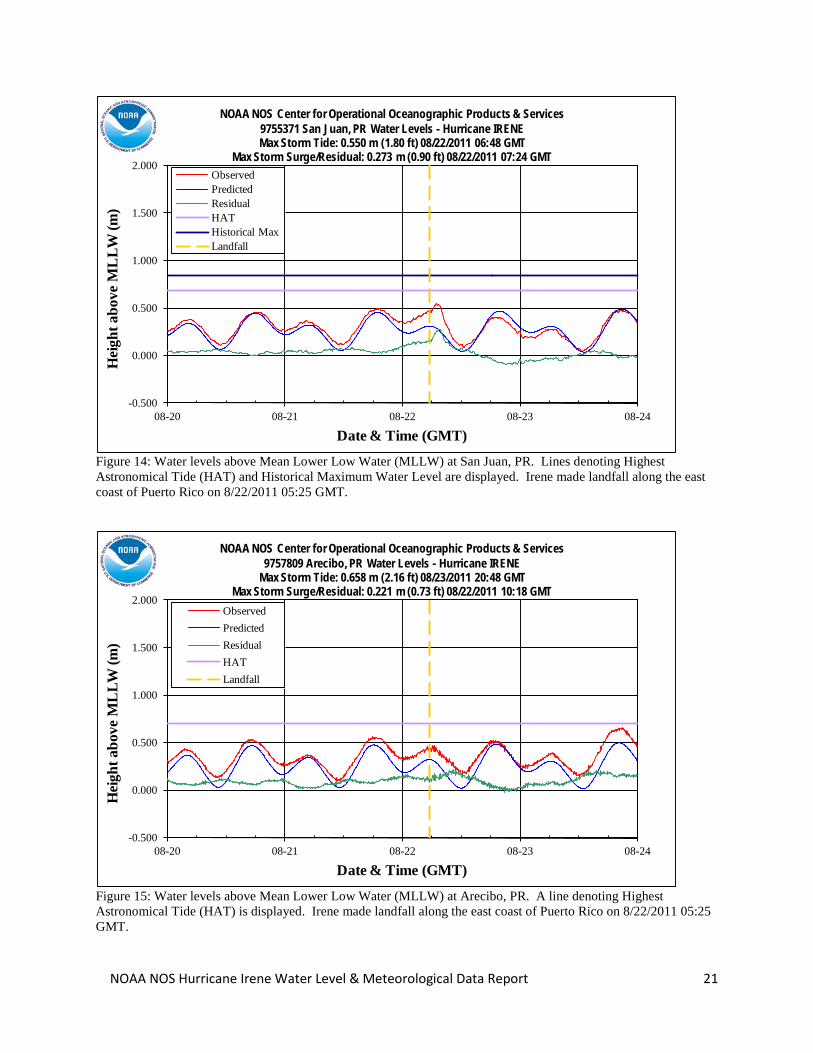
Figure 14: Water levels above Mean Lower Low Water (MLLW) at San Juan, PR. Lines denoting Highest Astronomical Tide (HAT) and Historical Maximum Water Level are displayed. Irene made landfall along the east coast of Puerto Rico on 8/22/2011 05:25 GMT.
-0.500
0.000
0.500
1.000
1.500
2.000
08-20 08-21 08-22 08-23 08-24
Hei
ght a
bove
ML
LW (m
)
Date & Time (GMT)
ObservedPredicted ResidualHATLandfall
NOAA NOS Center for Operational Oceanographic Products & Services9757809 Arecibo, PR Water Levels - Hurricane IRENE
Max Storm Tide: 0.658 m (2.16 ft) 08/23/2011 20:48 GMTMax Storm Surge/Residual: 0.221 m (0.73 ft) 08/22/2011 10:18 GMT
Figure 15: Water levels above Mean Lower Low Water (MLLW) at Arecibo, PR. A line denoting Highest Astronomical Tide (HAT) is displayed. Irene made landfall along the east coast of Puerto Rico on 8/22/2011 05:25 GMT.
NOAA NOS Hurricane Irene Water Level & Meteorological Data Report 22
-0.500
0.000
0.500
1.000
1.500
2.000
08-20 08-21 08-22 08-23 08-24
Hei
ght a
bove
ML
LW (m
)
Date & Time (GMT)
ObservedPredicted ResidualHATHistorical MaxLandfall
NOAA NOS Center for Operational Oceanographic Products & Services9759110 Magueyes Island, PR Water Levels - Hurricane IRENE
Max Storm Tide: 0.323 m (1.06 ft) 08/22/2011 23:06 GMTMax Storm Surge/Residual: 0.123 m (0.40 ft) 08/23/2011 15:24 GMT
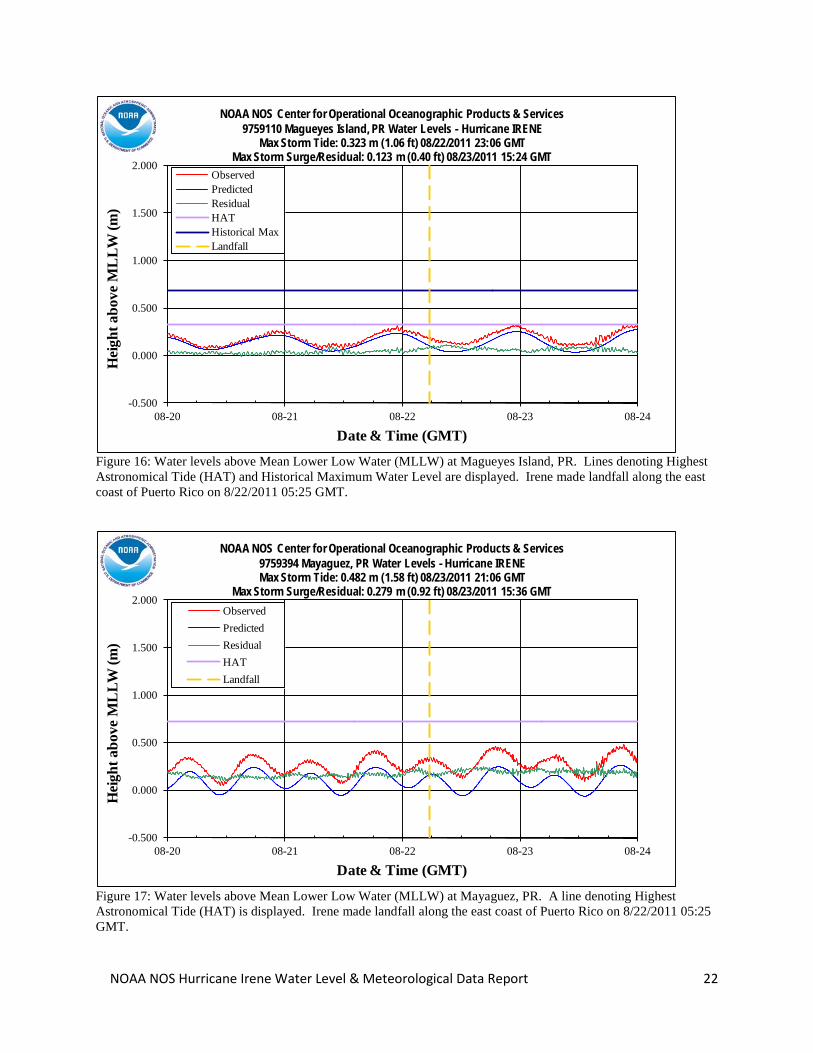
Figure 16: Water levels above Mean Lower Low Water (MLLW) at Magueyes Island, PR. Lines denoting Highest Astronomical Tide (HAT) and Historical Maximum Water Level are displayed. Irene made landfall along the east coast of Puerto Rico on 8/22/2011 05:25 GMT.
-0.500
0.000
0.500
1.000
1.500
2.000
08-20 08-21 08-22 08-23 08-24
Hei
ght a
bove
ML
LW (m
)
Date & Time (GMT)
ObservedPredicted ResidualHATLandfall
NOAA NOS Center for Operational Oceanographic Products & Services9759394 Mayaguez, PR Water Levels - Hurricane IRENEMax Storm Tide: 0.482 m (1.58 ft) 08/23/2011 21:06 GMT
Max Storm Surge/Residual: 0.279 m (0.92 ft) 08/23/2011 15:36 GMT
Figure 17: Water levels above Mean Lower Low Water (MLLW) at Mayaguez, PR. A line denoting Highest Astronomical Tide (HAT) is displayed. Irene made landfall along the east coast of Puerto Rico on 8/22/2011 05:25 GMT.
NOAA NOS Hurricane Irene Water Level & Meteorological Data Report 23
-0.500
0.000
0.500
1.000
1.500
2.000
08-20 08-21 08-22 08-23 08-24
Hei
ght a
bove
ML
LW (m
)
Date & Time (GMT)
ObservedPredicted ResidualHATHistorical MaxLandfall
NOAA NOS Center for Operational Oceanographic Products & Services9759412 Aguadilla, PR Water Levels - Hurricane IRENEMax Storm Tide: 0.501 m (1.64 ft) 08/23/2011 20:30 GMT
Max Storm Surge/Residual: 0.162 m (0.53 ft) 08/22/2011 11:42 GMT
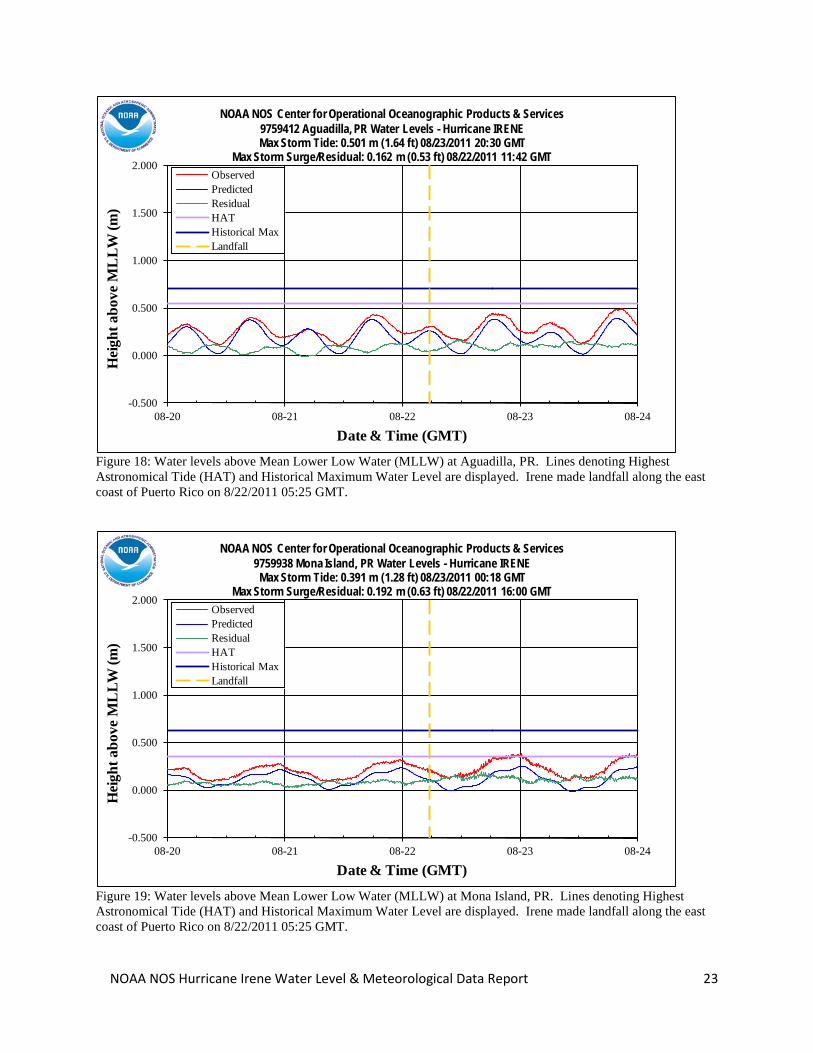
Figure 18: Water levels above Mean Lower Low Water (MLLW) at Aguadilla, PR. Lines denoting Highest Astronomical Tide (HAT) and Historical Maximum Water Level are displayed. Irene made landfall along the east coast of Puerto Rico on 8/22/2011 05:25 GMT.
-0.500
0.000
0.500
1.000
1.500
2.000
08-20 08-21 08-22 08-23 08-24
Hei
ght a
bove
ML
LW (m
)
Date & Time (GMT)
ObservedPredicted ResidualHATHistorical MaxLandfall
NOAA NOS Center for Operational Oceanographic Products & Services9759938 Mona Island, PR Water Levels - Hurricane IRENE
Max Storm Tide: 0.391 m (1.28 ft) 08/23/2011 00:18 GMTMax Storm Surge/Residual: 0.192 m (0.63 ft) 08/22/2011 16:00 GMT
Figure 19: Water levels above Mean Lower Low Water (MLLW) at Mona Island, PR. Lines denoting Highest Astronomical Tide (HAT) and Historical Maximum Water Level are displayed. Irene made landfall along the east coast of Puerto Rico on 8/22/2011 05:25 GMT.
NOAA NOS Hurricane Irene Water Level & Meteorological Data Report 24
-1.000
0.000
1.000
2.000
3.000
4.000
5.000
6.000
7.000
8.000
08-25 08-26 08-27 08-28 08-29 08-30 08-31
Hei
ght a
bove
ML
LW (m
)
Date & Time (GMT)
ObservedPredicted ResidualHATHistorical MaxLandfall
NOAA NOS Center for Operational Oceanographic Products & Services8723214 Virginia Key, FL Water Levels - Hurricane IRENEMax Storm Tide: 1.043 m (3.42 ft) 08/29/2011 13:54 GMT
Max Storm Surge/Residual: 0.302 m (0.99 ft) 08/27/2011 18:30 GMT
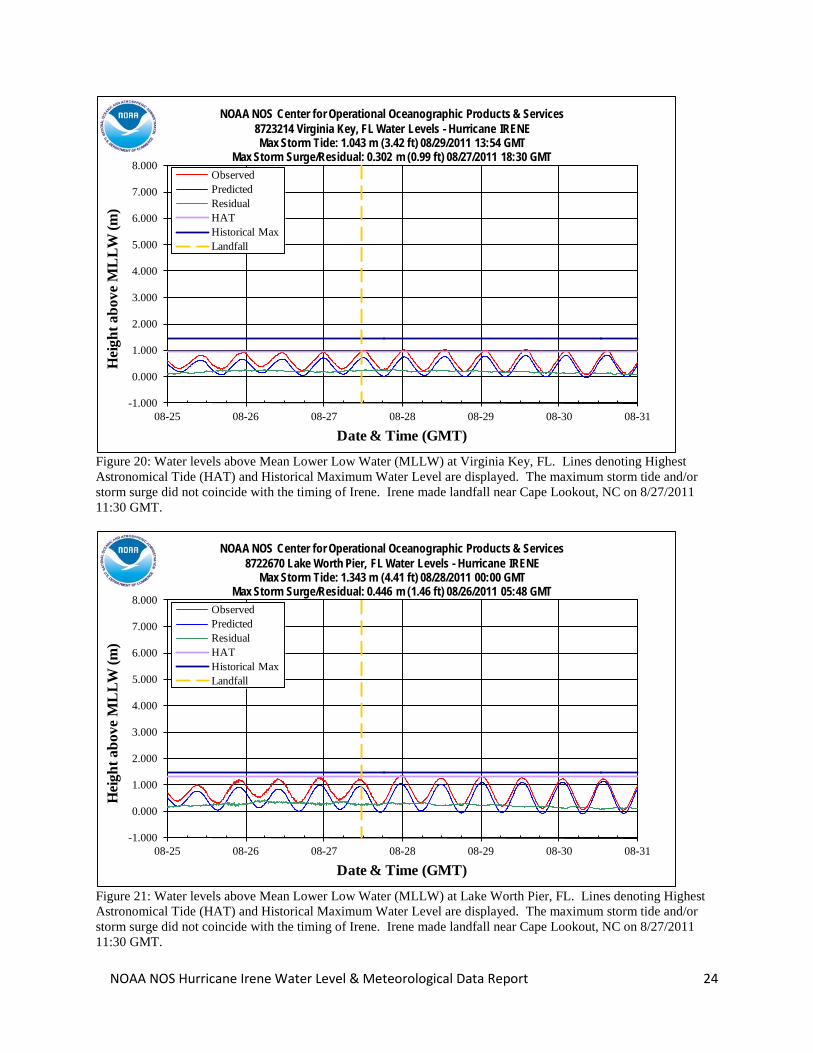
Figure 20: Water levels above Mean Lower Low Water (MLLW) at Virginia Key, FL. Lines denoting Highest Astronomical Tide (HAT) and Historical Maximum Water Level are displayed. The maximum storm tide and/or storm surge did not coincide with the timing of Irene. Irene made landfall near Cape Lookout, NC on 8/27/2011 11:30 GMT.
-1.000
0.000
1.000
2.000
3.000
4.000
5.000
6.000
7.000
8.000
08-25 08-26 08-27 08-28 08-29 08-30 08-31
Hei
ght a
bove
ML
LW (m
)
Date & Time (GMT)
ObservedPredicted ResidualHATHistorical MaxLandfall
NOAA NOS Center for Operational Oceanographic Products & Services8722670 Lake Worth Pier, FL Water Levels - Hurricane IRENE
Max Storm Tide: 1.343 m (4.41 ft) 08/28/2011 00:00 GMTMax Storm Surge/Residual: 0.446 m (1.46 ft) 08/26/2011 05:48 GMT
Figure 21: Water levels above Mean Lower Low Water (MLLW) at Lake Worth Pier, FL. Lines denoting Highest Astronomical Tide (HAT) and Historical Maximum Water Level are displayed. The maximum storm tide and/or storm surge did not coincide with the timing of Irene. Irene made landfall near Cape Lookout, NC on 8/27/2011 11:30 GMT.
NOAA NOS Hurricane Irene Water Level & Meteorological Data Report 25
-1.000
0.000
1.000
2.000
3.000
4.000
5.000
6.000
7.000
8.000
08-25 08-26 08-27 08-28 08-29 08-30 08-31
Hei
ght a
bove
ML
LW (m
)
Date & Time (GMT)
ObservedPredicted ResidualHATHistorical MaxLandfall
NOAA NOS Center for Operational Oceanographic Products & Services8721604 Trident Pier, FL Water Levels - Hurricane IRENEMax Storm Tide: 1.803 m (5.92 ft) 08/26/2011 22:42 GMT
Max Storm Surge/Residual: 0.539 m (1.77 ft) 08/26/2011 03:18 GMT
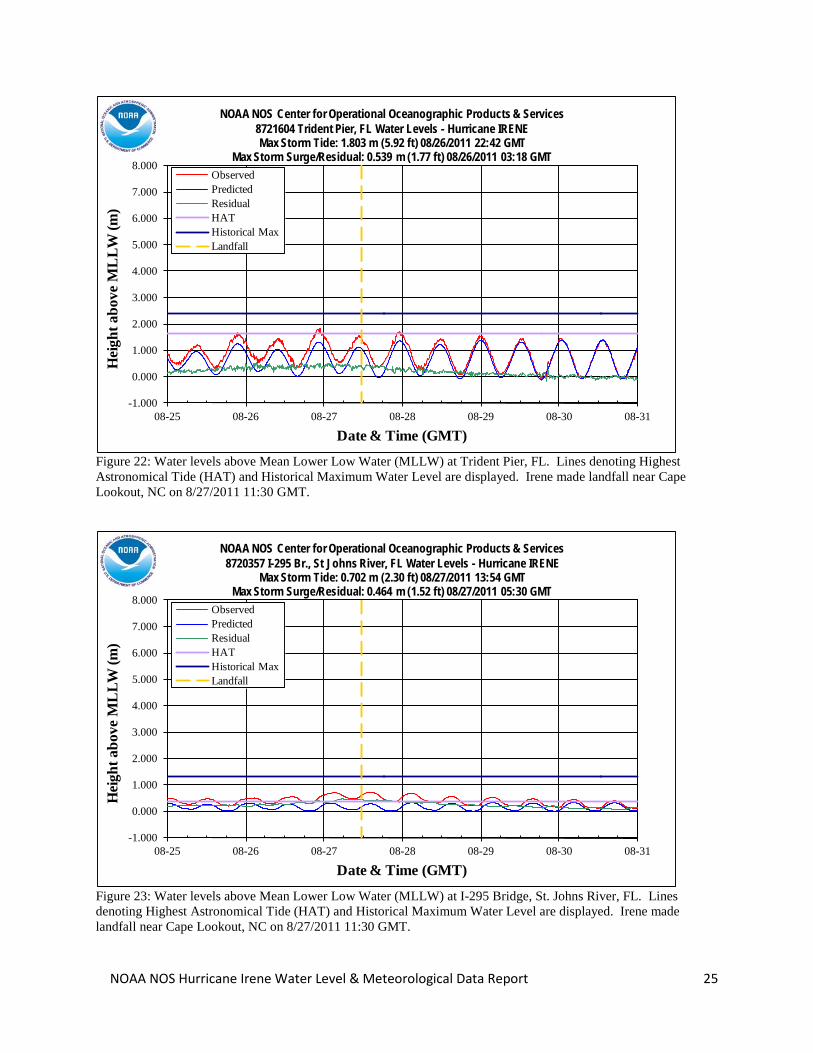
Figure 22: Water levels above Mean Lower Low Water (MLLW) at Trident Pier, FL. Lines denoting Highest Astronomical Tide (HAT) and Historical Maximum Water Level are displayed. Irene made landfall near Cape Lookout, NC on 8/27/2011 11:30 GMT.
-1.000
0.000
1.000
2.000
3.000
4.000
5.000
6.000
7.000
8.000
08-25 08-26 08-27 08-28 08-29 08-30 08-31
Hei
ght a
bove
ML
LW (m
)
Date & Time (GMT)
ObservedPredicted ResidualHATHistorical MaxLandfall
NOAA NOS Center for Operational Oceanographic Products & Services8720357 I-295 Br., St Johns River, FL Water Levels - Hurricane IRENE
Max Storm Tide: 0.702 m (2.30 ft) 08/27/2011 13:54 GMTMax Storm Surge/Residual: 0.464 m (1.52 ft) 08/27/2011 05:30 GMT
Figure 23: Water levels above Mean Lower Low Water (MLLW) at I-295 Bridge, St. Johns River, FL. Lines denoting Highest Astronomical Tide (HAT) and Historical Maximum Water Level are displayed. Irene made landfall near Cape Lookout, NC on 8/27/2011 11:30 GMT.
NOAA NOS Hurricane Irene Water Level & Meteorological Data Report 26
-1.000
0.000
1.000
2.000
3.000
4.000
5.000
6.000
7.000
8.000
08-25 08-26 08-27 08-28 08-29 08-30 08-31
Hei
ght a
bove
ML
LW (m
)
Date & Time (GMT)
ObservedPredicted ResidualHATHistorical MaxLandfall
NOAA NOS Center for Operational Oceanographic Products & Services8720218 Mayport (Bar Pilots Dock), FL Water Levels - Hurricane IRENE
Max Storm Tide: 2.059 m (6.76 ft) 08/26/2011 23:30 GMTMax Storm Surge/Residual: 0.785 m (2.58 ft) 08/27/2011 03:30 GMT
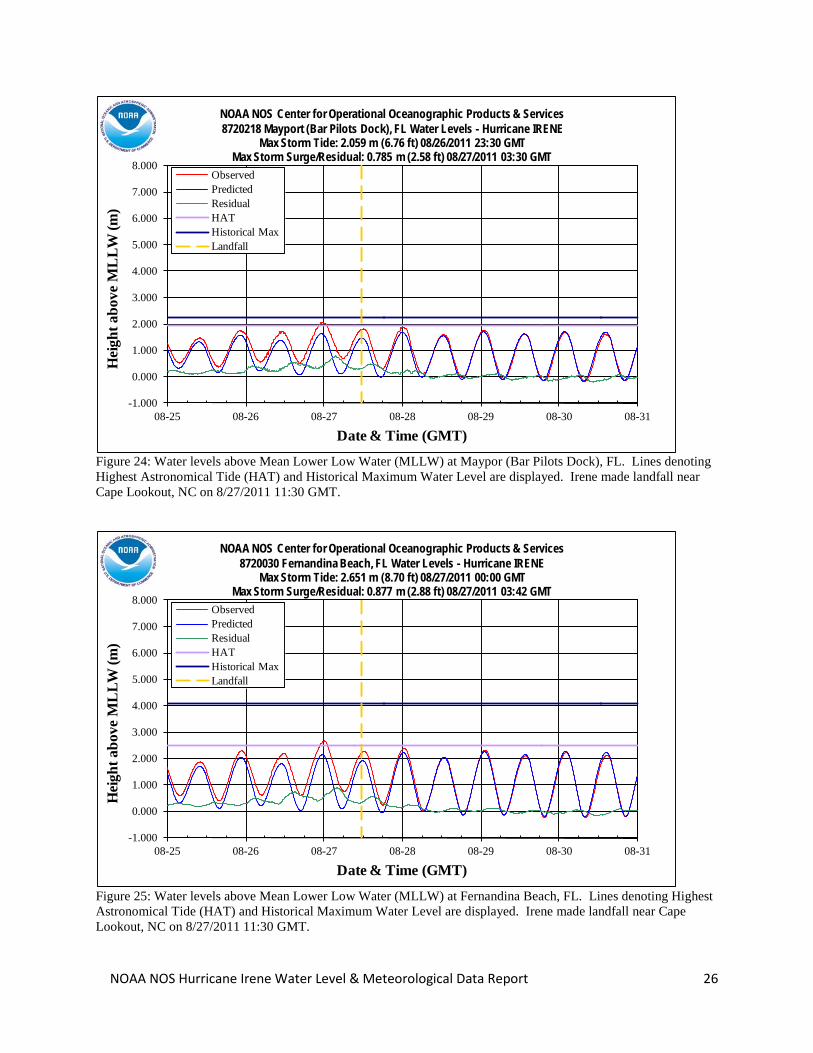
Figure 24: Water levels above Mean Lower Low Water (MLLW) at Maypor (Bar Pilots Dock), FL. Lines denoting Highest Astronomical Tide (HAT) and Historical Maximum Water Level are displayed. Irene made landfall near Cape Lookout, NC on 8/27/2011 11:30 GMT.
-1.000
0.000
1.000
2.000
3.000
4.000
5.000
6.000
7.000
8.000
08-25 08-26 08-27 08-28 08-29 08-30 08-31
Hei
ght a
bove
ML
LW (m
)
Date & Time (GMT)
ObservedPredicted ResidualHATHistorical MaxLandfall
NOAA NOS Center for Operational Oceanographic Products & Services8720030 Fernandina Beach, FL Water Levels - Hurricane IRENE
Max Storm Tide: 2.651 m (8.70 ft) 08/27/2011 00:00 GMTMax Storm Surge/Residual: 0.877 m (2.88 ft) 08/27/2011 03:42 GMT
Figure 25: Water levels above Mean Lower Low Water (MLLW) at Fernandina Beach, FL. Lines denoting Highest Astronomical Tide (HAT) and Historical Maximum Water Level are displayed. Irene made landfall near Cape Lookout, NC on 8/27/2011 11:30 GMT.
NOAA NOS Hurricane Irene Water Level & Meteorological Data Report 27
-1.000
0.000
1.000
2.000
3.000
4.000
5.000
6.000
7.000
8.000
08-25 08-26 08-27 08-28 08-29 08-30 08-31
Hei
ght a
bove
ML
LW (m
)
Date & Time (GMT)
ObservedPredicted ResidualHATHistorical MaxLandfall
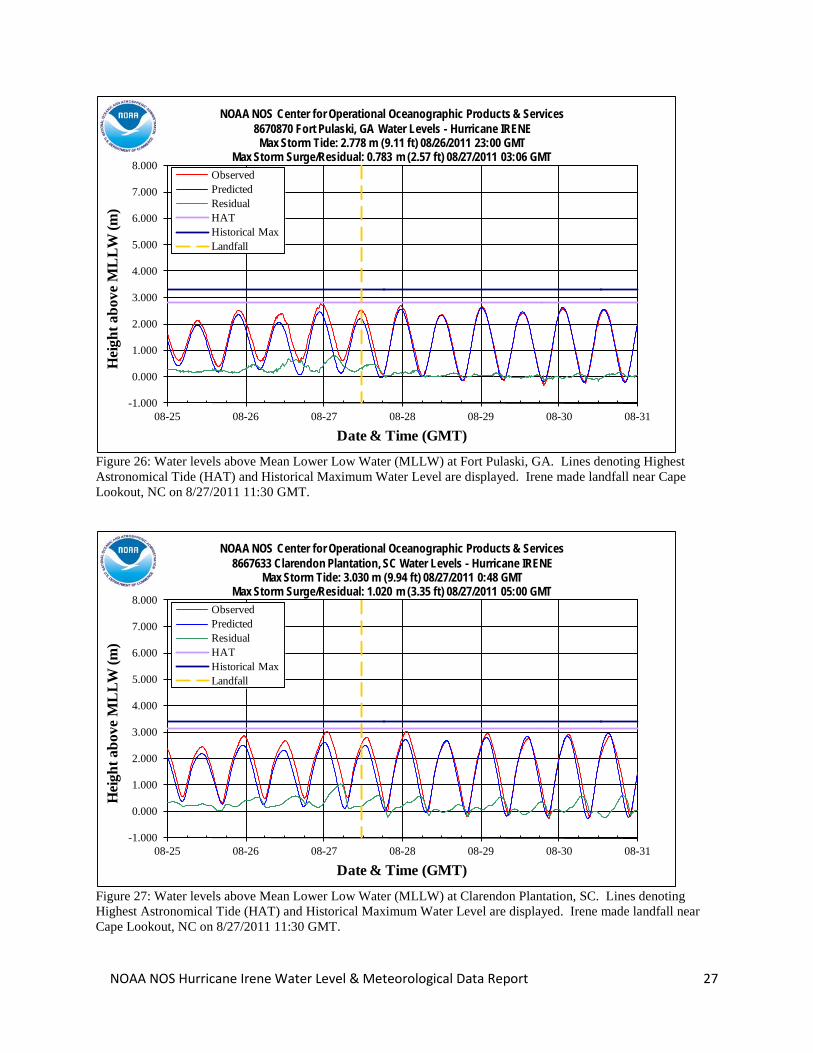
NOAA NOS Center for Operational Oceanographic Products & Services8670870 Fort Pulaski, GA Water Levels - Hurricane IRENE
Max Storm Tide: 2.778 m (9.11 ft) 08/26/2011 23:00 GMTMax Storm Surge/Residual: 0.783 m (2.57 ft) 08/27/2011 03:06 GMT
Figure 26: Water levels above Mean Lower Low Water (MLLW) at Fort Pulaski, GA. Lines denoting Highest Astronomical Tide (HAT) and Historical Maximum Water Level are displayed. Irene made landfall near Cape Lookout, NC on 8/27/2011 11:30 GMT.
-1.000
0.000
1.000
2.000
3.000
4.000
5.000
6.000
7.000
8.000
08-25 08-26 08-27 08-28 08-29 08-30 08-31
Hei
ght a
bove
ML
LW (m
)
Date & Time (GMT)
ObservedPredicted ResidualHATHistorical MaxLandfall
NOAA NOS Center for Operational Oceanographic Products & Services8667633 Clarendon Plantation, SC Water Levels - Hurricane IRENE
Max Storm Tide: 3.030 m (9.94 ft) 08/27/2011 0:48 GMTMax Storm Surge/Residual: 1.020 m (3.35 ft) 08/27/2011 05:00 GMT
Figure 27: Water levels above Mean Lower Low Water (MLLW) at Clarendon Plantation, SC. Lines denoting Highest Astronomical Tide (HAT) and Historical Maximum Water Level are displayed. Irene made landfall near Cape Lookout, NC on 8/27/2011 11:30 GMT.
NOAA NOS Hurricane Irene Water Level & Meteorological Data Report 28
-1.000
0.000
1.000
2.000
3.000
4.000
5.000
6.000
7.000
8.000
08-25 08-26 08-27 08-28 08-29 08-30 08-31
Hei
ght a
bove
ML
LW (m
)
Date & Time (GMT)
ObservedPredicted ResidualHATHistorical MaxLandfall
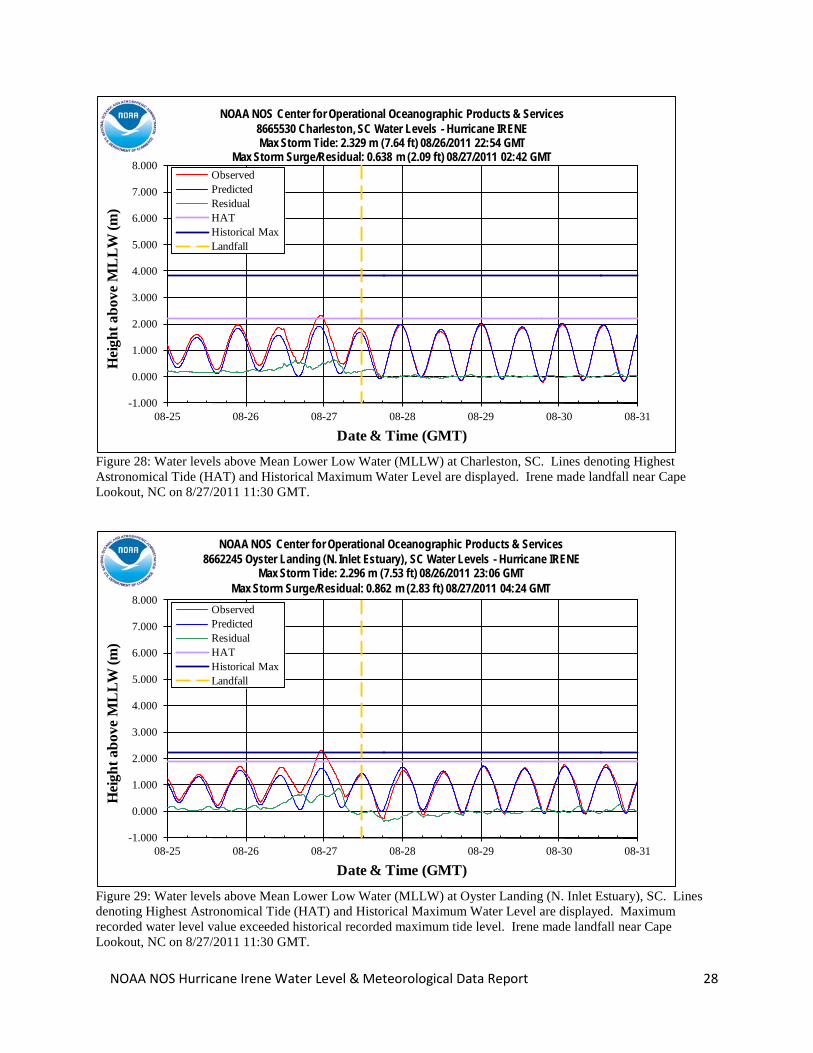
NOAA NOS Center for Operational Oceanographic Products & Services8665530 Charleston, SC Water Levels - Hurricane IRENEMax Storm Tide: 2.329 m (7.64 ft) 08/26/2011 22:54 GMT
Max Storm Surge/Residual: 0.638 m (2.09 ft) 08/27/2011 02:42 GMT
Figure 28: Water levels above Mean Lower Low Water (MLLW) at Charleston, SC. Lines denoting Highest Astronomical Tide (HAT) and Historical Maximum Water Level are displayed. Irene made landfall near Cape Lookout, NC on 8/27/2011 11:30 GMT.
-1.000
0.000
1.000
2.000
3.000
4.000
5.000
6.000
7.000
8.000
08-25 08-26 08-27 08-28 08-29 08-30 08-31
Hei
ght a
bove
ML
LW (m
)
Date & Time (GMT)
ObservedPredicted ResidualHATHistorical MaxLandfall
NOAA NOS Center for Operational Oceanographic Products & Services8662245 Oyster Landing (N. Inlet Estuary), SC Water Levels - Hurricane IRENE
Max Storm Tide: 2.296 m (7.53 ft) 08/26/2011 23:06 GMTMax Storm Surge/Residual: 0.862 m (2.83 ft) 08/27/2011 04:24 GMT
Figure 29: Water levels above Mean Lower Low Water (MLLW) at Oyster Landing (N. Inlet Estuary), SC. Lines denoting Highest Astronomical Tide (HAT) and Historical Maximum Water Level are displayed. Maximum recorded water level value exceeded historical recorded maximum tide level. Irene made landfall near Cape Lookout, NC on 8/27/2011 11:30 GMT.
NOAA NOS Hurricane Irene Water Level & Meteorological Data Report 29
-1.000
0.000
1.000
2.000
3.000
4.000
5.000
6.000
7.000
8.000
08-25 08-26 08-27 08-28 08-29 08-30 08-31
Hei
ght a
bove
ML
LW (m
)
Date & Time (GMT)
ObservedPredicted ResidualHATHistorical MaxLandfall
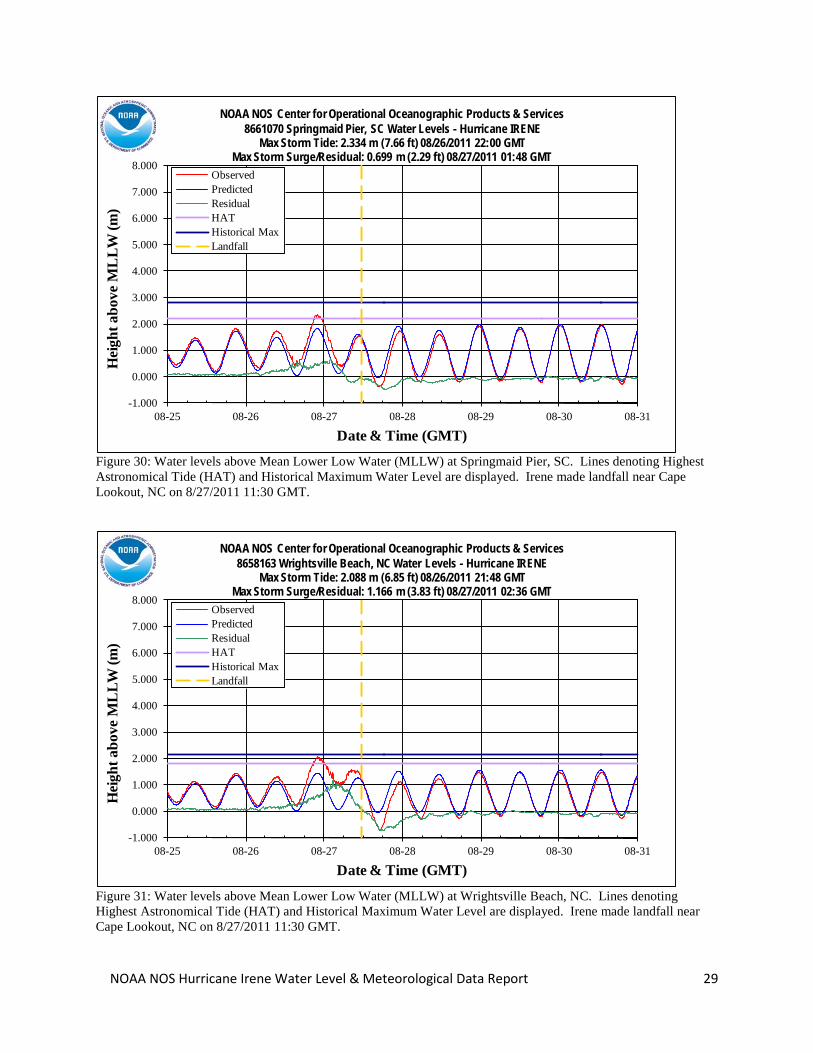
NOAA NOS Center for Operational Oceanographic Products & Services8661070 Springmaid Pier, SC Water Levels - Hurricane IRENE
Max Storm Tide: 2.334 m (7.66 ft) 08/26/2011 22:00 GMTMax Storm Surge/Residual: 0.699 m (2.29 ft) 08/27/2011 01:48 GMT
Figure 30: Water levels above Mean Lower Low Water (MLLW) at Springmaid Pier, SC. Lines denoting Highest Astronomical Tide (HAT) and Historical Maximum Water Level are displayed. Irene made landfall near Cape Lookout, NC on 8/27/2011 11:30 GMT.
-1.000
0.000
1.000
2.000
3.000
4.000
5.000
6.000
7.000
8.000
08-25 08-26 08-27 08-28 08-29 08-30 08-31
Hei
ght a
bove
ML
LW (m
)
Date & Time (GMT)
ObservedPredicted ResidualHATHistorical MaxLandfall
NOAA NOS Center for Operational Oceanographic Products & Services8658163 Wrightsville Beach, NC Water Levels - Hurricane IRENE
Max Storm Tide: 2.088 m (6.85 ft) 08/26/2011 21:48 GMTMax Storm Surge/Residual: 1.166 m (3.83 ft) 08/27/2011 02:36 GMT
Figure 31: Water levels above Mean Lower Low Water (MLLW) at Wrightsville Beach, NC. Lines denoting Highest Astronomical Tide (HAT) and Historical Maximum Water Level are displayed. Irene made landfall near Cape Lookout, NC on 8/27/2011 11:30 GMT.
NOAA NOS Hurricane Irene Water Level & Meteorological Data Report 30
-1.000
0.000
1.000
2.000
3.000
4.000
5.000
6.000
7.000
8.000
08-25 08-26 08-27 08-28 08-29 08-30 08-31
Hei
ght a
bove
ML
LW (m
)
Date & Time (GMT)
ObservedPredicted ResidualHATHistorical MaxLandfall
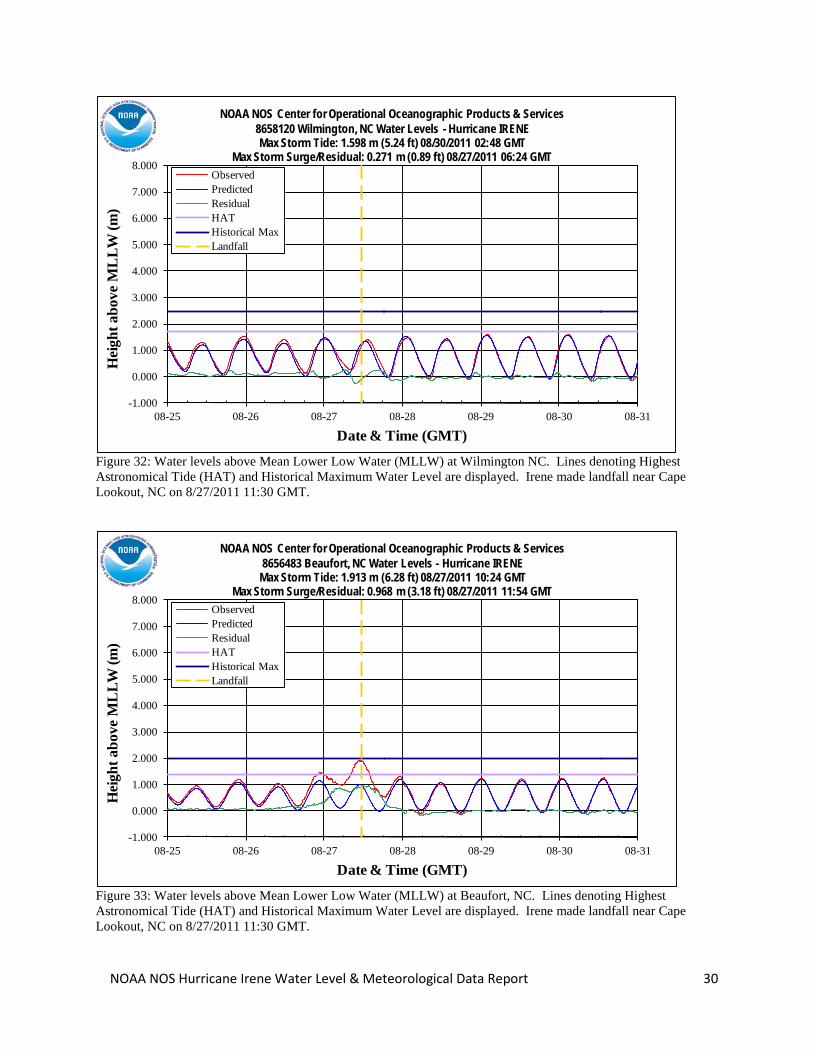
NOAA NOS Center for Operational Oceanographic Products & Services8658120 Wilmington, NC Water Levels - Hurricane IRENEMax Storm Tide: 1.598 m (5.24 ft) 08/30/2011 02:48 GMT
Max Storm Surge/Residual: 0.271 m (0.89 ft) 08/27/2011 06:24 GMT
Figure 32: Water levels above Mean Lower Low Water (MLLW) at Wilmington NC. Lines denoting Highest Astronomical Tide (HAT) and Historical Maximum Water Level are displayed. Irene made landfall near Cape Lookout, NC on 8/27/2011 11:30 GMT.
-1.000
0.000
1.000
2.000
3.000
4.000
5.000
6.000
7.000
8.000
08-25 08-26 08-27 08-28 08-29 08-30 08-31
Hei
ght a
bove
ML
LW (m
)
Date & Time (GMT)
ObservedPredicted ResidualHATHistorical MaxLandfall
NOAA NOS Center for Operational Oceanographic Products & Services8656483 Beaufort, NC Water Levels - Hurricane IRENE
Max Storm Tide: 1.913 m (6.28 ft) 08/27/2011 10:24 GMTMax Storm Surge/Residual: 0.968 m (3.18 ft) 08/27/2011 11:54 GMT
Figure 33: Water levels above Mean Lower Low Water (MLLW) at Beaufort, NC. Lines denoting Highest Astronomical Tide (HAT) and Historical Maximum Water Level are displayed. Irene made landfall near Cape Lookout, NC on 8/27/2011 11:30 GMT.
NOAA NOS Hurricane Irene Water Level & Meteorological Data Report 31
-1.000
0.000
1.000
2.000
3.000
4.000
5.000
6.000
7.000
8.000
08-25 08-26 08-27 08-28 08-29 08-30 08-31
Hei
ght a
bove
ML
LW (m
)
Date & Time (GMT)
ObservedPredicted ResidualHATLandfall
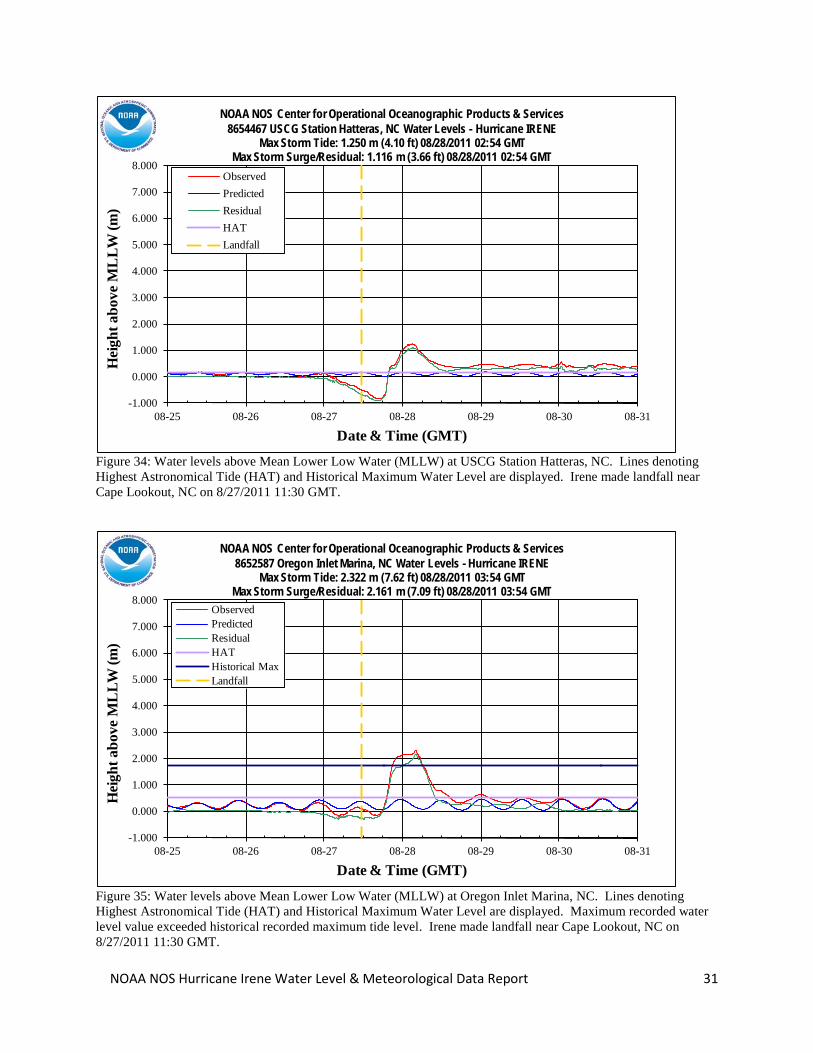
NOAA NOS Center for Operational Oceanographic Products & Services8654467 USCG Station Hatteras, NC Water Levels - Hurricane IRENE
Max Storm Tide: 1.250 m (4.10 ft) 08/28/2011 02:54 GMTMax Storm Surge/Residual: 1.116 m (3.66 ft) 08/28/2011 02:54 GMT
Figure 34: Water levels above Mean Lower Low Water (MLLW) at USCG Station Hatteras, NC. Lines denoting Highest Astronomical Tide (HAT) and Historical Maximum Water Level are displayed. Irene made landfall near Cape Lookout, NC on 8/27/2011 11:30 GMT.
-1.000
0.000
1.000
2.000
3.000
4.000
5.000
6.000
7.000
8.000
08-25 08-26 08-27 08-28 08-29 08-30 08-31
Hei
ght a
bove
ML
LW (m
)
Date & Time (GMT)
ObservedPredicted ResidualHATHistorical MaxLandfall
NOAA NOS Center for Operational Oceanographic Products & Services8652587 Oregon Inlet Marina, NC Water Levels - Hurricane IRENE
Max Storm Tide: 2.322 m (7.62 ft) 08/28/2011 03:54 GMTMax Storm Surge/Residual: 2.161 m (7.09 ft) 08/28/2011 03:54 GMT
Figure 35: Water levels above Mean Lower Low Water (MLLW) at Oregon Inlet Marina, NC. Lines denoting Highest Astronomical Tide (HAT) and Historical Maximum Water Level are displayed. Maximum recorded water level value exceeded historical recorded maximum tide level. Irene made landfall near Cape Lookout, NC on 8/27/2011 11:30 GMT.
NOAA NOS Hurricane Irene Water Level & Meteorological Data Report 32
-1.000
0.000
1.000
2.000
3.000
4.000
5.000
6.000
7.000
8.000
08-25 08-26 08-27 08-28 08-29 08-30 08-31
Hei
ght a
bove
ML
LW (m
)
Date & Time (GMT)
ObservedPredicted ResidualHATHistorical MaxLandfall
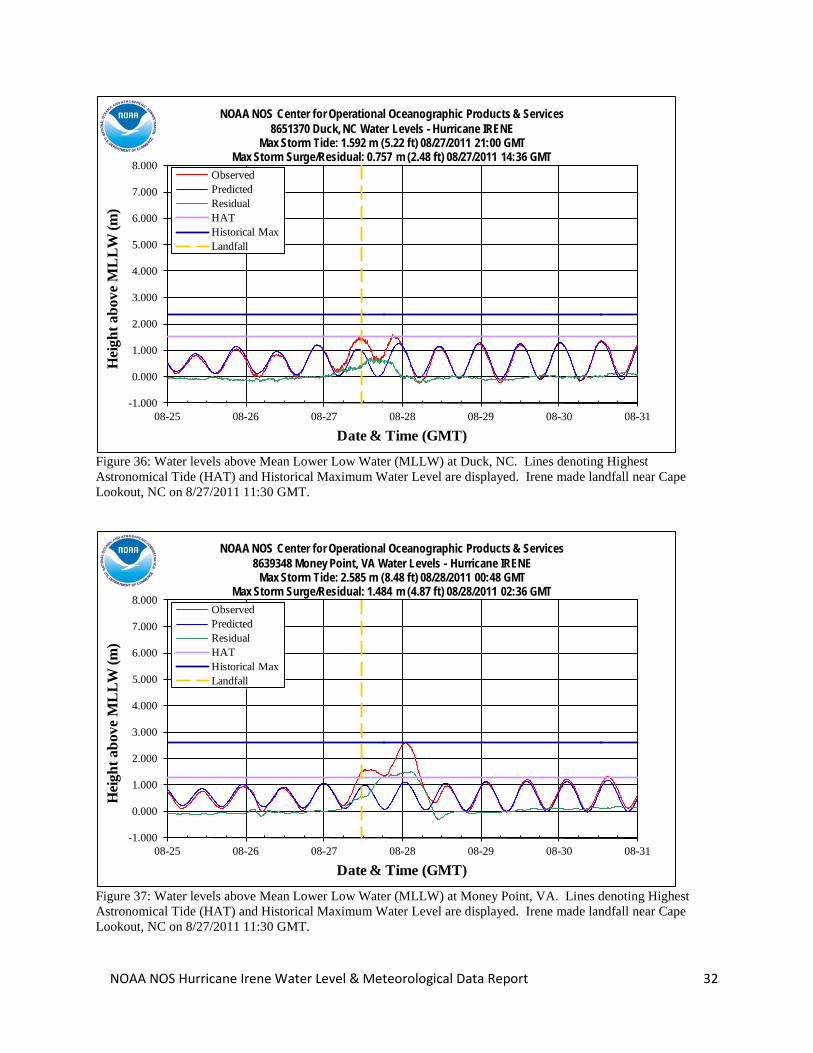
NOAA NOS Center for Operational Oceanographic Products & Services8651370 Duck, NC Water Levels - Hurricane IRENE
Max Storm Tide: 1.592 m (5.22 ft) 08/27/2011 21:00 GMTMax Storm Surge/Residual: 0.757 m (2.48 ft) 08/27/2011 14:36 GMT
Figure 36: Water levels above Mean Lower Low Water (MLLW) at Duck, NC. Lines denoting Highest Astronomical Tide (HAT) and Historical Maximum Water Level are displayed. Irene made landfall near Cape Lookout, NC on 8/27/2011 11:30 GMT.
-1.000
0.000
1.000
2.000
3.000
4.000
5.000
6.000
7.000
8.000
08-25 08-26 08-27 08-28 08-29 08-30 08-31
Hei
ght a
bove
ML
LW (m
)
Date & Time (GMT)
ObservedPredicted ResidualHATHistorical MaxLandfall
NOAA NOS Center for Operational Oceanographic Products & Services8639348 Money Point, VA Water Levels - Hurricane IRENE
Max Storm Tide: 2.585 m (8.48 ft) 08/28/2011 00:48 GMTMax Storm Surge/Residual: 1.484 m (4.87 ft) 08/28/2011 02:36 GMT
Figure 37: Water levels above Mean Lower Low Water (MLLW) at Money Point, VA. Lines denoting Highest Astronomical Tide (HAT) and Historical Maximum Water Level are displayed. Irene made landfall near Cape Lookout, NC on 8/27/2011 11:30 GMT.
NOAA NOS Hurricane Irene Water Level & Meteorological Data Report 33
-1.000
0.000
1.000
2.000
3.000
4.000
5.000
6.000
7.000
8.000
08-25 08-26 08-27 08-28 08-29 08-30 08-31
Hei
ght a
bove
ML
LW (m
)
Date & Time (GMT)
ObservedPredicted ResidualHATHistorical MaxLandfall
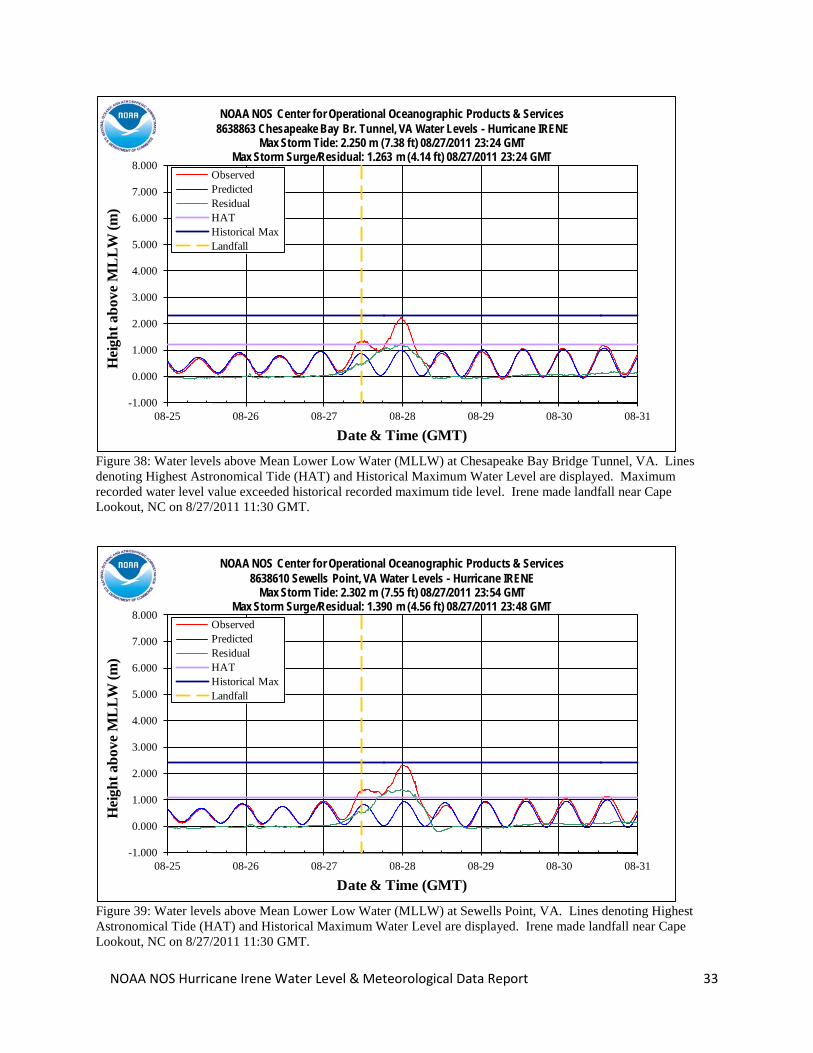
NOAA NOS Center for Operational Oceanographic Products & Services8638863 Chesapeake Bay Br. Tunnel, VA Water Levels - Hurricane IRENE
Max Storm Tide: 2.250 m (7.38 ft) 08/27/2011 23:24 GMTMax Storm Surge/Residual: 1.263 m (4.14 ft) 08/27/2011 23:24 GMT
Figure 38: Water levels above Mean Lower Low Water (MLLW) at Chesapeake Bay Bridge Tunnel, VA. Lines denoting Highest Astronomical Tide (HAT) and Historical Maximum Water Level are displayed. Maximum recorded water level value exceeded historical recorded maximum tide level. Irene made landfall near Cape Lookout, NC on 8/27/2011 11:30 GMT.
-1.000
0.000
1.000
2.000
3.000
4.000
5.000
6.000
7.000
8.000
08-25 08-26 08-27 08-28 08-29 08-30 08-31
Hei
ght a
bove
ML
LW (m
)
Date & Time (GMT)
ObservedPredicted ResidualHATHistorical MaxLandfall
NOAA NOS Center for Operational Oceanographic Products & Services8638610 Sewells Point, VA Water Levels - Hurricane IRENE
Max Storm Tide: 2.302 m (7.55 ft) 08/27/2011 23:54 GMTMax Storm Surge/Residual: 1.390 m (4.56 ft) 08/27/2011 23:48 GMT
Figure 39: Water levels above Mean Lower Low Water (MLLW) at Sewells Point, VA. Lines denoting Highest Astronomical Tide (HAT) and Historical Maximum Water Level are displayed. Irene made landfall near Cape Lookout, NC on 8/27/2011 11:30 GMT.
NOAA NOS Hurricane Irene Water Level & Meteorological Data Report 34
-1.000
0.000
1.000
2.000
3.000
4.000
5.000
6.000
7.000
8.000
08-25 08-26 08-27 08-28 08-29 08-30 08-31
Hei
ght a
bove
ML
LW (m
)
Date & Time (GMT)
ObservedPredicted ResidualHATHistorical MaxLandfall
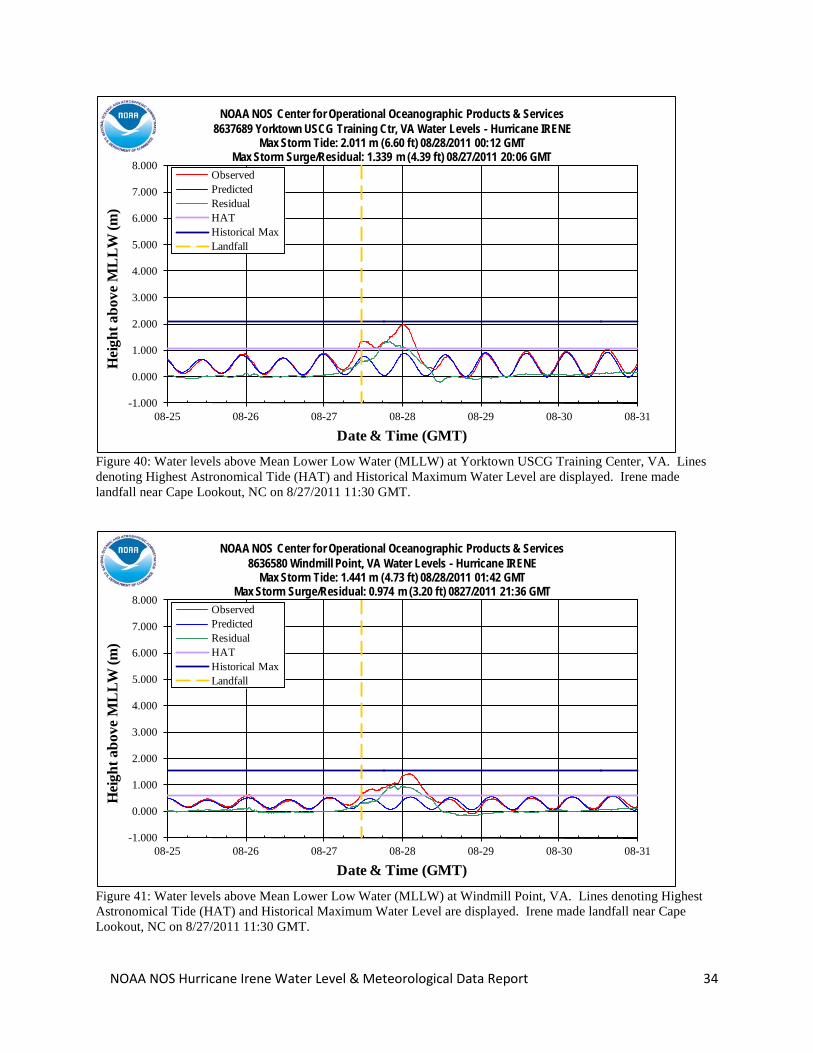
NOAA NOS Center for Operational Oceanographic Products & Services8637689 Yorktown USCG Training Ctr, VA Water Levels - Hurricane IRENE
Max Storm Tide: 2.011 m (6.60 ft) 08/28/2011 00:12 GMTMax Storm Surge/Residual: 1.339 m (4.39 ft) 08/27/2011 20:06 GMT
Figure 40: Water levels above Mean Lower Low Water (MLLW) at Yorktown USCG Training Center, VA. Lines denoting Highest Astronomical Tide (HAT) and Historical Maximum Water Level are displayed. Irene made landfall near Cape Lookout, NC on 8/27/2011 11:30 GMT.
-1.000
0.000
1.000
2.000
3.000
4.000
5.000
6.000
7.000
8.000
08-25 08-26 08-27 08-28 08-29 08-30 08-31
Hei
ght a
bove
ML
LW (m
)
Date & Time (GMT)
ObservedPredicted ResidualHATHistorical MaxLandfall
NOAA NOS Center for Operational Oceanographic Products & Services8636580 Windmill Point, VA Water Levels - Hurricane IRENE
Max Storm Tide: 1.441 m (4.73 ft) 08/28/2011 01:42 GMTMax Storm Surge/Residual: 0.974 m (3.20 ft) 0827/2011 21:36 GMT
Figure 41: Water levels above Mean Lower Low Water (MLLW) at Windmill Point, VA. Lines denoting Highest Astronomical Tide (HAT) and Historical Maximum Water Level are displayed. Irene made landfall near Cape Lookout, NC on 8/27/2011 11:30 GMT.
NOAA NOS Hurricane Irene Water Level & Meteorological Data Report 35
-1.000
0.000
1.000
2.000
3.000
4.000
5.000
6.000
7.000
8.000
08-25 08-26 08-27 08-28 08-29 08-30 08-31
Hei
ght a
bove
ML
LW (m
)
Date & Time (GMT)
ObservedPredicted ResidualHATHistorical MaxLandfall
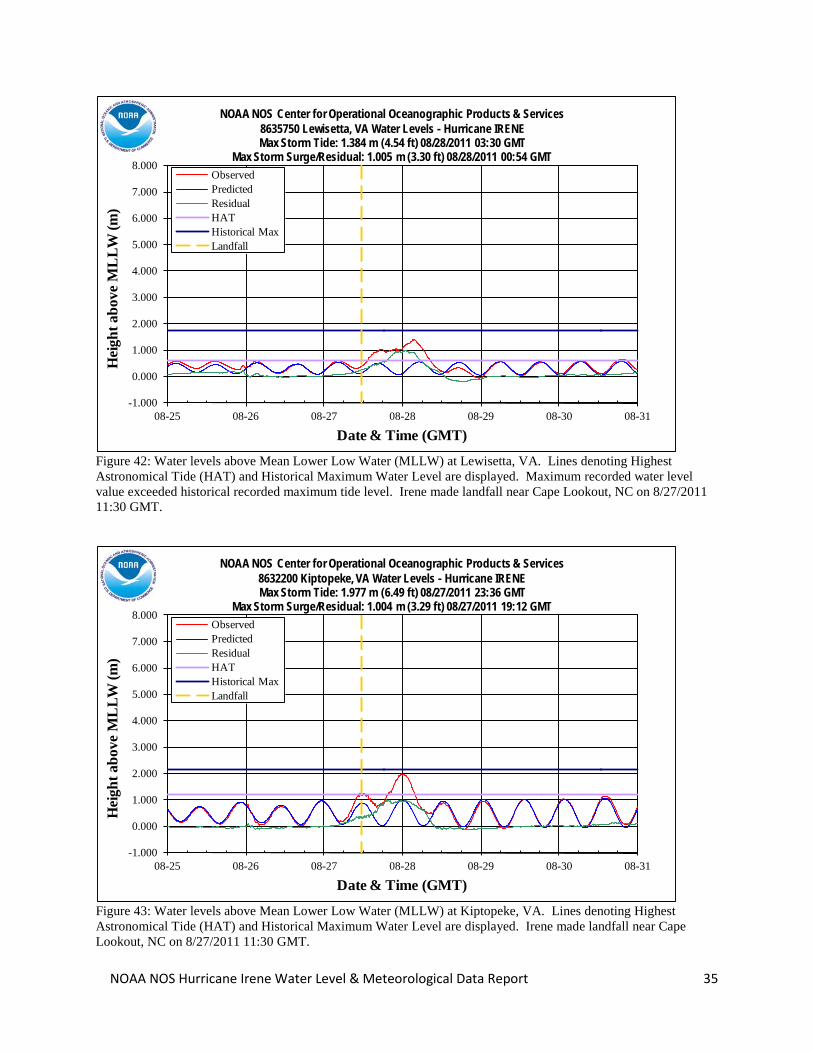
NOAA NOS Center for Operational Oceanographic Products & Services8635750 Lewisetta, VA Water Levels - Hurricane IRENEMax Storm Tide: 1.384 m (4.54 ft) 08/28/2011 03:30 GMT
Max Storm Surge/Residual: 1.005 m (3.30 ft) 08/28/2011 00:54 GMT
Figure 42: Water levels above Mean Lower Low Water (MLLW) at Lewisetta, VA. Lines denoting Highest Astronomical Tide (HAT) and Historical Maximum Water Level are displayed. Maximum recorded water level value exceeded historical recorded maximum tide level. Irene made landfall near Cape Lookout, NC on 8/27/2011 11:30 GMT.
-1.000
0.000
1.000
2.000
3.000
4.000
5.000
6.000
7.000
8.000
08-25 08-26 08-27 08-28 08-29 08-30 08-31
Hei
ght a
bove
ML
LW (m
)
Date & Time (GMT)
ObservedPredicted ResidualHATHistorical MaxLandfall
NOAA NOS Center for Operational Oceanographic Products & Services8632200 Kiptopeke, VA Water Levels - Hurricane IRENEMax Storm Tide: 1.977 m (6.49 ft) 08/27/2011 23:36 GMT
Max Storm Surge/Residual: 1.004 m (3.29 ft) 08/27/2011 19:12 GMT
Figure 43: Water levels above Mean Lower Low Water (MLLW) at Kiptopeke, VA. Lines denoting Highest Astronomical Tide (HAT) and Historical Maximum Water Level are displayed. Irene made landfall near Cape Lookout, NC on 8/27/2011 11:30 GMT.
NOAA NOS Hurricane Irene Water Level & Meteorological Data Report 36
-1.000
0.000
1.000
2.000
3.000
4.000
5.000
6.000
7.000
8.000
08-25 08-26 08-27 08-28 08-29 08-30 08-31
Hei
ght a
bove
ML
LW (m
)
Date & Time (GMT)
ObservedPredicted ResidualHATHistorical MaxLandfall
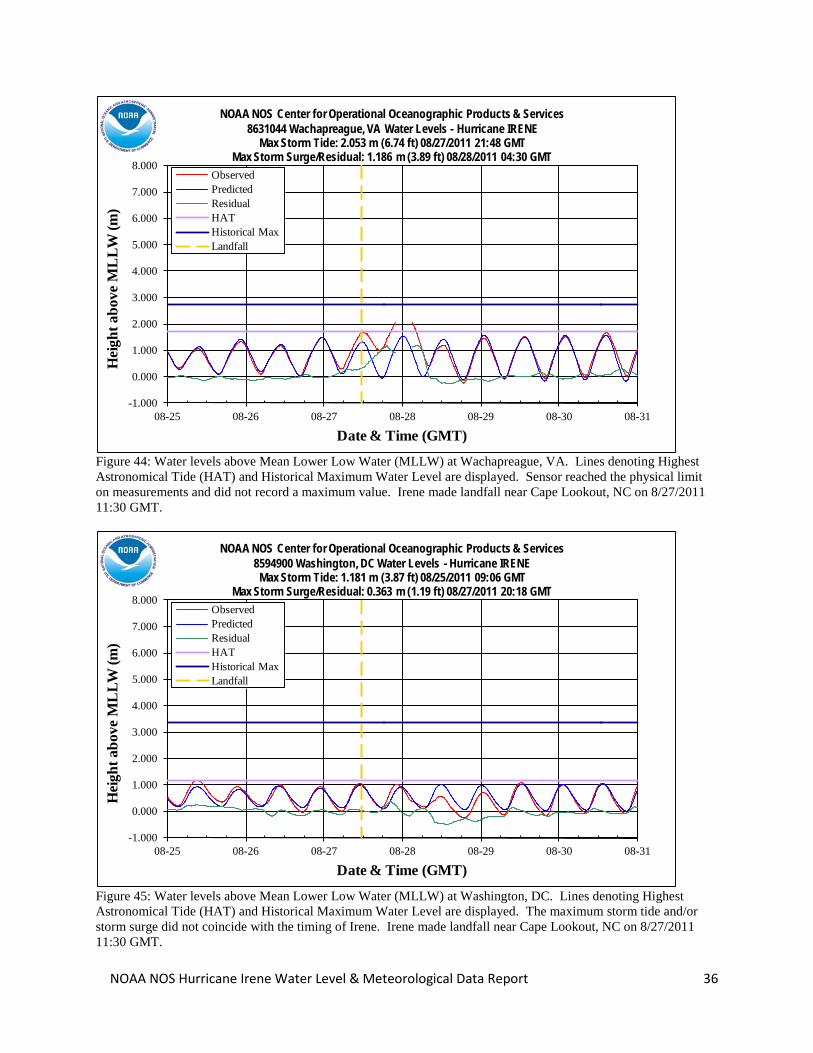
NOAA NOS Center for Operational Oceanographic Products & Services8631044 Wachapreague, VA Water Levels - Hurricane IRENE
Max Storm Tide: 2.053 m (6.74 ft) 08/27/2011 21:48 GMTMax Storm Surge/Residual: 1.186 m (3.89 ft) 08/28/2011 04:30 GMT
Figure 44: Water levels above Mean Lower Low Water (MLLW) at Wachapreague, VA. Lines denoting Highest Astronomical Tide (HAT) and Historical Maximum Water Level are displayed. Sensor reached the physical limit on measurements and did not record a maximum value. Irene made landfall near Cape Lookout, NC on 8/27/2011 11:30 GMT.
-1.000
0.000
1.000
2.000
3.000
4.000
5.000
6.000
7.000
8.000
08-25 08-26 08-27 08-28 08-29 08-30 08-31
Hei
ght a
bove
ML
LW (m
)
Date & Time (GMT)
ObservedPredicted ResidualHATHistorical MaxLandfall
NOAA NOS Center for Operational Oceanographic Products & Services8594900 Washington, DC Water Levels - Hurricane IRENE
Max Storm Tide: 1.181 m (3.87 ft) 08/25/2011 09:06 GMTMax Storm Surge/Residual: 0.363 m (1.19 ft) 08/27/2011 20:18 GMT
Figure 45: Water levels above Mean Lower Low Water (MLLW) at Washington, DC. Lines denoting Highest Astronomical Tide (HAT) and Historical Maximum Water Level are displayed. The maximum storm tide and/or storm surge did not coincide with the timing of Irene. Irene made landfall near Cape Lookout, NC on 8/27/2011 11:30 GMT.
NOAA NOS Hurricane Irene Water Level & Meteorological Data Report 37
-1.000
0.000
1.000
2.000
3.000
4.000
5.000
6.000
7.000
8.000
08-25 08-26 08-27 08-28 08-29 08-30 08-31
Hei
ght a
bove
ML
LW (m
)
Date & Time (GMT)
ObservedPredicted ResidualHATHistorical MaxLandfall
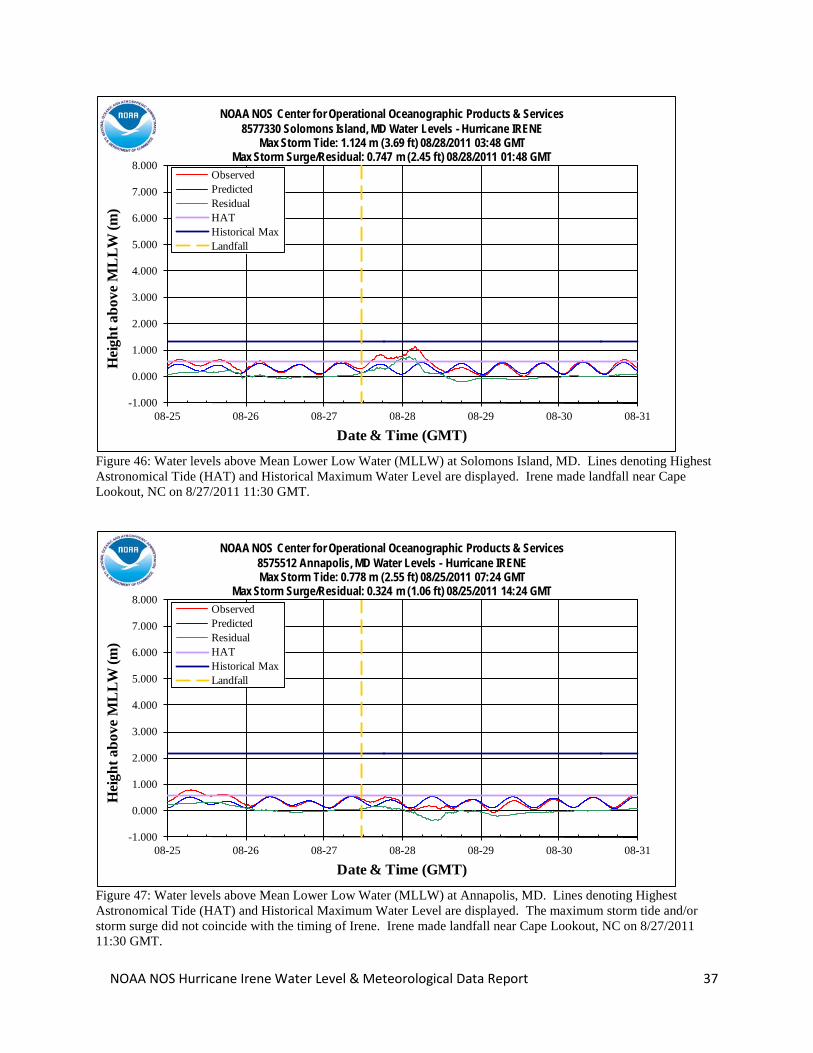
NOAA NOS Center for Operational Oceanographic Products & Services8577330 Solomons Island, MD Water Levels - Hurricane IRENE
Max Storm Tide: 1.124 m (3.69 ft) 08/28/2011 03:48 GMTMax Storm Surge/Residual: 0.747 m (2.45 ft) 08/28/2011 01:48 GMT
Figure 46: Water levels above Mean Lower Low Water (MLLW) at Solomons Island, MD. Lines denoting Highest Astronomical Tide (HAT) and Historical Maximum Water Level are displayed. Irene made landfall near Cape Lookout, NC on 8/27/2011 11:30 GMT.
-1.000
0.000
1.000
2.000
3.000
4.000
5.000
6.000
7.000
8.000
08-25 08-26 08-27 08-28 08-29 08-30 08-31
Hei
ght a
bove
ML
LW (m
)
Date & Time (GMT)
ObservedPredicted ResidualHATHistorical MaxLandfall
NOAA NOS Center for Operational Oceanographic Products & Services8575512 Annapolis, MD Water Levels - Hurricane IRENEMax Storm Tide: 0.778 m (2.55 ft) 08/25/2011 07:24 GMT
Max Storm Surge/Residual: 0.324 m (1.06 ft) 08/25/2011 14:24 GMT
Figure 47: Water levels above Mean Lower Low Water (MLLW) at Annapolis, MD. Lines denoting Highest Astronomical Tide (HAT) and Historical Maximum Water Level are displayed. The maximum storm tide and/or storm surge did not coincide with the timing of Irene. Irene made landfall near Cape Lookout, NC on 8/27/2011 11:30 GMT.
NOAA NOS Hurricane Irene Water Level & Meteorological Data Report 38
-1.000
0.000
1.000
2.000
3.000
4.000
5.000
6.000
7.000
8.000
08-25 08-26 08-27 08-28 08-29 08-30 08-31
Hei
ght a
bove
ML
LW (m
)
Date & Time (GMT)
ObservedPredicted ResidualHATHistorical MaxLandfall
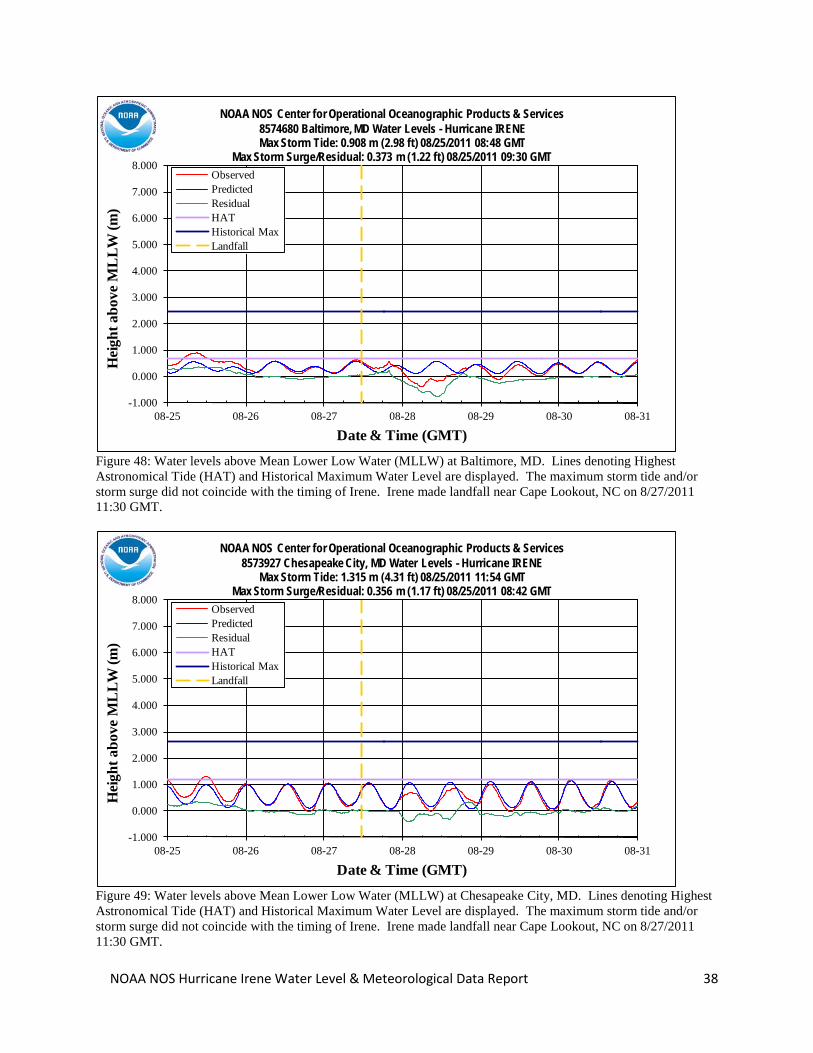
NOAA NOS Center for Operational Oceanographic Products & Services8574680 Baltimore, MD Water Levels - Hurricane IRENEMax Storm Tide: 0.908 m (2.98 ft) 08/25/2011 08:48 GMT
Max Storm Surge/Residual: 0.373 m (1.22 ft) 08/25/2011 09:30 GMT
Figure 48: Water levels above Mean Lower Low Water (MLLW) at Baltimore, MD. Lines denoting Highest Astronomical Tide (HAT) and Historical Maximum Water Level are displayed. The maximum storm tide and/or storm surge did not coincide with the timing of Irene. Irene made landfall near Cape Lookout, NC on 8/27/2011 11:30 GMT.
-1.000
0.000
1.000
2.000
3.000
4.000
5.000
6.000
7.000
8.000
08-25 08-26 08-27 08-28 08-29 08-30 08-31
Hei
ght a
bove
ML
LW (m
)
Date & Time (GMT)
ObservedPredicted ResidualHATHistorical MaxLandfall
NOAA NOS Center for Operational Oceanographic Products & Services8573927 Chesapeake City, MD Water Levels - Hurricane IRENE
Max Storm Tide: 1.315 m (4.31 ft) 08/25/2011 11:54 GMTMax Storm Surge/Residual: 0.356 m (1.17 ft) 08/25/2011 08:42 GMT
Figure 49: Water levels above Mean Lower Low Water (MLLW) at Chesapeake City, MD. Lines denoting Highest Astronomical Tide (HAT) and Historical Maximum Water Level are displayed. The maximum storm tide and/or storm surge did not coincide with the timing of Irene. Irene made landfall near Cape Lookout, NC on 8/27/2011 11:30 GMT.
NOAA NOS Hurricane Irene Water Level & Meteorological Data Report 39
-1.000
0.000
1.000
2.000
3.000
4.000
5.000
6.000
7.000
8.000
08-25 08-26 08-27 08-28 08-29 08-30 08-31
Hei
ght a
bove
ML
LW (m
)
Date & Time (GMT)
ObservedPredicted ResidualHATHistorical MaxLandfall
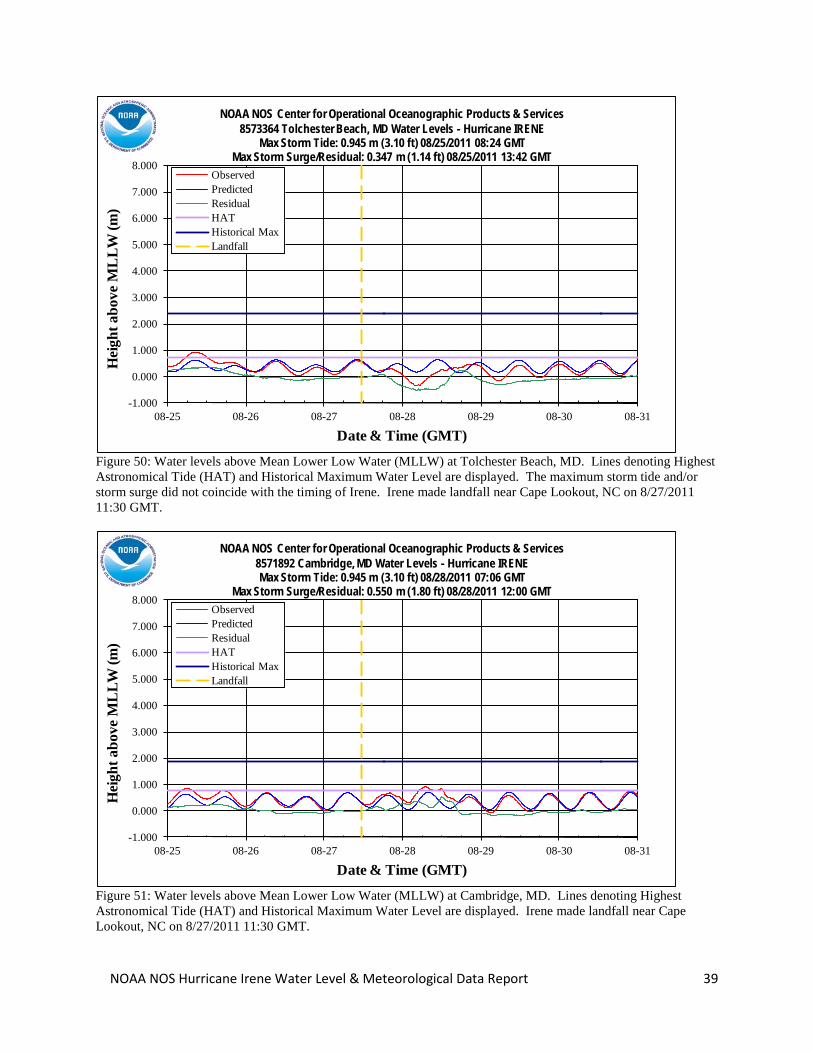
NOAA NOS Center for Operational Oceanographic Products & Services8573364 Tolchester Beach, MD Water Levels - Hurricane IRENE
Max Storm Tide: 0.945 m (3.10 ft) 08/25/2011 08:24 GMTMax Storm Surge/Residual: 0.347 m (1.14 ft) 08/25/2011 13:42 GMT
Figure 50: Water levels above Mean Lower Low Water (MLLW) at Tolchester Beach, MD. Lines denoting Highest Astronomical Tide (HAT) and Historical Maximum Water Level are displayed. The maximum storm tide and/or storm surge did not coincide with the timing of Irene. Irene made landfall near Cape Lookout, NC on 8/27/2011 11:30 GMT.
-1.000
0.000
1.000
2.000
3.000
4.000
5.000
6.000
7.000
8.000
08-25 08-26 08-27 08-28 08-29 08-30 08-31
Hei
ght a
bove
ML
LW (m
)
Date & Time (GMT)
ObservedPredicted ResidualHATHistorical MaxLandfall
NOAA NOS Center for Operational Oceanographic Products & Services8571892 Cambridge, MD Water Levels - Hurricane IRENEMax Storm Tide: 0.945 m (3.10 ft) 08/28/2011 07:06 GMT
Max Storm Surge/Residual: 0.550 m (1.80 ft) 08/28/2011 12:00 GMT
Figure 51: Water levels above Mean Lower Low Water (MLLW) at Cambridge, MD. Lines denoting Highest Astronomical Tide (HAT) and Historical Maximum Water Level are displayed. Irene made landfall near Cape Lookout, NC on 8/27/2011 11:30 GMT.
NOAA NOS Hurricane Irene Water Level & Meteorological Data Report 40
-1.000
0.000
1.000
2.000
3.000
4.000
5.000
6.000
7.000
8.000
08-25 08-26 08-27 08-28 08-29 08-30 08-31
Hei
ght a
bove
ML
LW (m
)
Date & Time (GMT)
ObservedPredicted ResidualHATHistorical MaxLandfall
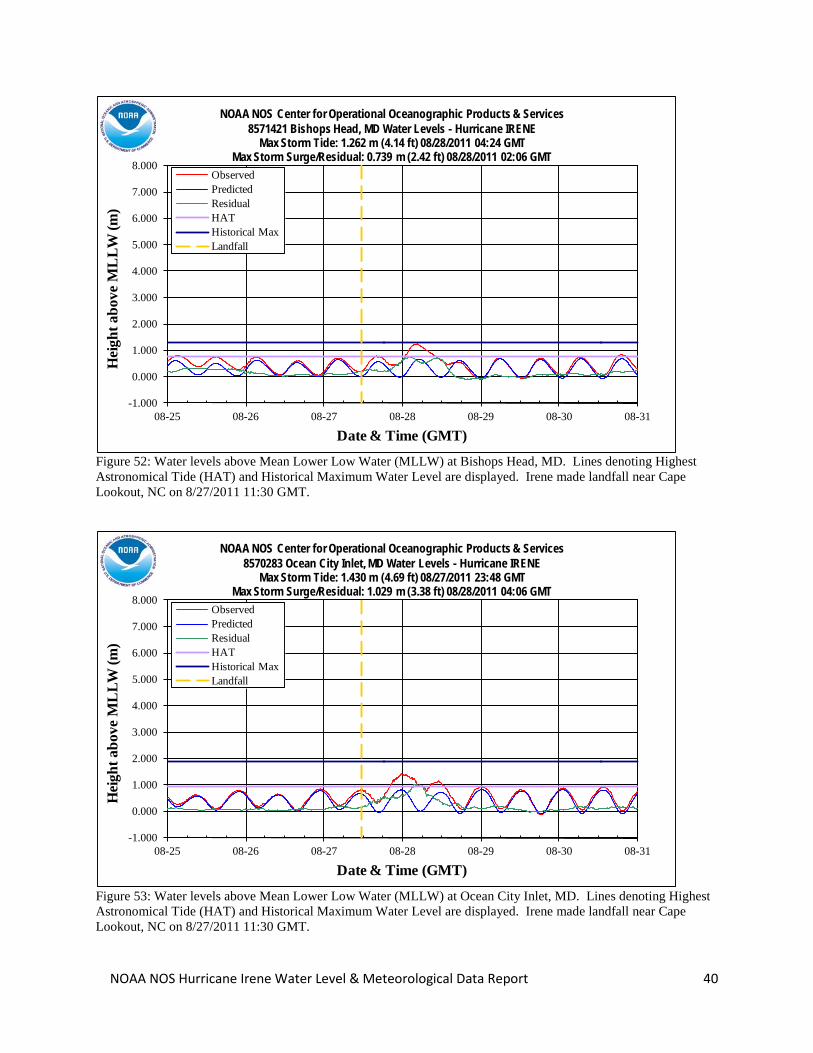
NOAA NOS Center for Operational Oceanographic Products & Services8571421 Bishops Head, MD Water Levels - Hurricane IRENE
Max Storm Tide: 1.262 m (4.14 ft) 08/28/2011 04:24 GMTMax Storm Surge/Residual: 0.739 m (2.42 ft) 08/28/2011 02:06 GMT
Figure 52: Water levels above Mean Lower Low Water (MLLW) at Bishops Head, MD. Lines denoting Highest Astronomical Tide (HAT) and Historical Maximum Water Level are displayed. Irene made landfall near Cape Lookout, NC on 8/27/2011 11:30 GMT.
-1.000
0.000
1.000
2.000
3.000
4.000
5.000
6.000
7.000
8.000
08-25 08-26 08-27 08-28 08-29 08-30 08-31
Hei
ght a
bove
ML
LW (m
)
Date & Time (GMT)
ObservedPredicted ResidualHATHistorical MaxLandfall
NOAA NOS Center for Operational Oceanographic Products & Services8570283 Ocean City Inlet, MD Water Levels - Hurricane IRENE
Max Storm Tide: 1.430 m (4.69 ft) 08/27/2011 23:48 GMTMax Storm Surge/Residual: 1.029 m (3.38 ft) 08/28/2011 04:06 GMT
Figure 53: Water levels above Mean Lower Low Water (MLLW) at Ocean City Inlet, MD. Lines denoting Highest Astronomical Tide (HAT) and Historical Maximum Water Level are displayed. Irene made landfall near Cape Lookout, NC on 8/27/2011 11:30 GMT.
NOAA NOS Hurricane Irene Water Level & Meteorological Data Report 41
-1.000
0.000
1.000
2.000
3.000
4.000
5.000
6.000
7.000
8.000
08-25 08-26 08-27 08-28 08-29 08-30 08-31
Hei
ght a
bove
ML
LW (m
)
Date & Time (GMT)
ObservedPredicted ResidualHATHistorical MaxLandfall
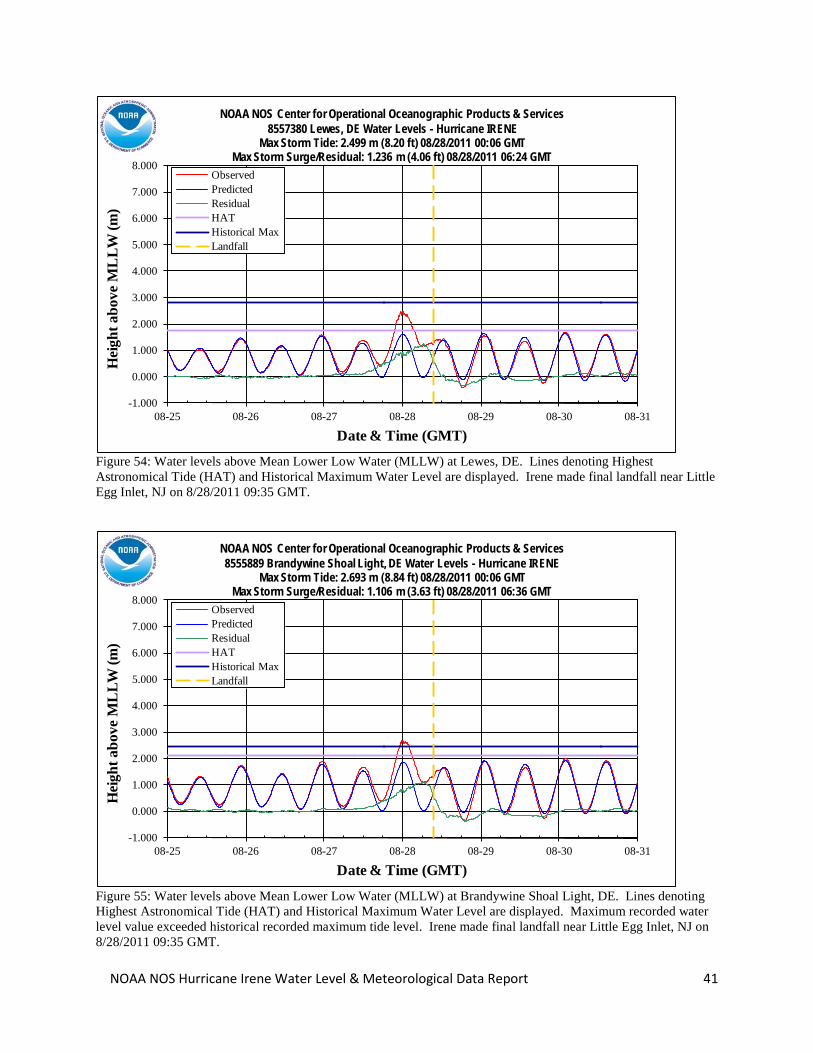
NOAA NOS Center for Operational Oceanographic Products & Services8557380 Lewes, DE Water Levels - Hurricane IRENE
Max Storm Tide: 2.499 m (8.20 ft) 08/28/2011 00:06 GMTMax Storm Surge/Residual: 1.236 m (4.06 ft) 08/28/2011 06:24 GMT
Figure 54: Water levels above Mean Lower Low Water (MLLW) at Lewes, DE. Lines denoting Highest Astronomical Tide (HAT) and Historical Maximum Water Level are displayed. Irene made final landfall near Little Egg Inlet, NJ on 8/28/2011 09:35 GMT.
-1.000
0.000
1.000
2.000
3.000
4.000
5.000
6.000
7.000
8.000
08-25 08-26 08-27 08-28 08-29 08-30 08-31
Hei
ght a
bove
ML
LW (m
)
Date & Time (GMT)
ObservedPredicted ResidualHATHistorical MaxLandfall
NOAA NOS Center for Operational Oceanographic Products & Services8555889 Brandywine Shoal Light, DE Water Levels - Hurricane IRENE
Max Storm Tide: 2.693 m (8.84 ft) 08/28/2011 00:06 GMTMax Storm Surge/Residual: 1.106 m (3.63 ft) 08/28/2011 06:36 GMT
Figure 55: Water levels above Mean Lower Low Water (MLLW) at Brandywine Shoal Light, DE. Lines denoting Highest Astronomical Tide (HAT) and Historical Maximum Water Level are displayed. Maximum recorded water level value exceeded historical recorded maximum tide level. Irene made final landfall near Little Egg Inlet, NJ on 8/28/2011 09:35 GMT.
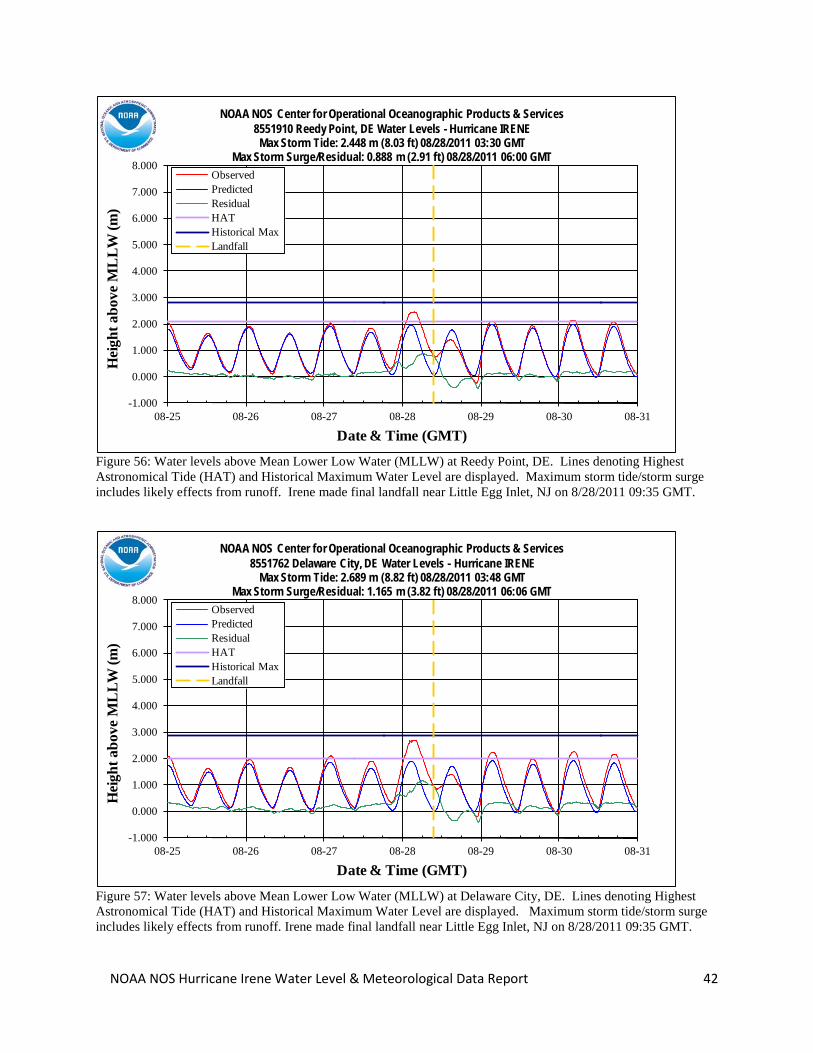
NOAA NOS Hurricane Irene Water Level & Meteorological Data Report 42
-1.000
0.000
1.000
2.000
3.000
4.000
5.000
6.000
7.000
8.000
08-25 08-26 08-27 08-28 08-29 08-30 08-31
Hei
ght a
bove
ML
LW (m
)
Date & Time (GMT)
ObservedPredicted ResidualHATHistorical MaxLandfall
NOAA NOS Center for Operational Oceanographic Products & Services8551910 Reedy Point, DE Water Levels - Hurricane IRENE
Max Storm Tide: 2.448 m (8.03 ft) 08/28/2011 03:30 GMTMax Storm Surge/Residual: 0.888 m (2.91 ft) 08/28/2011 06:00 GMT
Figure 56: Water levels above Mean Lower Low Water (MLLW) at Reedy Point, DE. Lines denoting Highest Astronomical Tide (HAT) and Historical Maximum Water Level are displayed. Maximum storm tide/storm surge includes likely effects from runoff. Irene made final landfall near Little Egg Inlet, NJ on 8/28/2011 09:35 GMT.
-1.000
0.000
1.000
2.000
3.000
4.000
5.000
6.000
7.000
8.000
08-25 08-26 08-27 08-28 08-29 08-30 08-31
Hei
ght a
bove
ML
LW (m
)
Date & Time (GMT)
ObservedPredicted ResidualHATHistorical MaxLandfall
NOAA NOS Center for Operational Oceanographic Products & Services8551762 Delaware City, DE Water Levels - Hurricane IRENE
Max Storm Tide: 2.689 m (8.82 ft) 08/28/2011 03:48 GMTMax Storm Surge/Residual: 1.165 m (3.82 ft) 08/28/2011 06:06 GMT
Figure 57: Water levels above Mean Lower Low Water (MLLW) at Delaware City, DE. Lines denoting Highest Astronomical Tide (HAT) and Historical Maximum Water Level are displayed. Maximum storm tide/storm surge includes likely effects from runoff. Irene made final landfall near Little Egg Inlet, NJ on 8/28/2011 09:35 GMT.
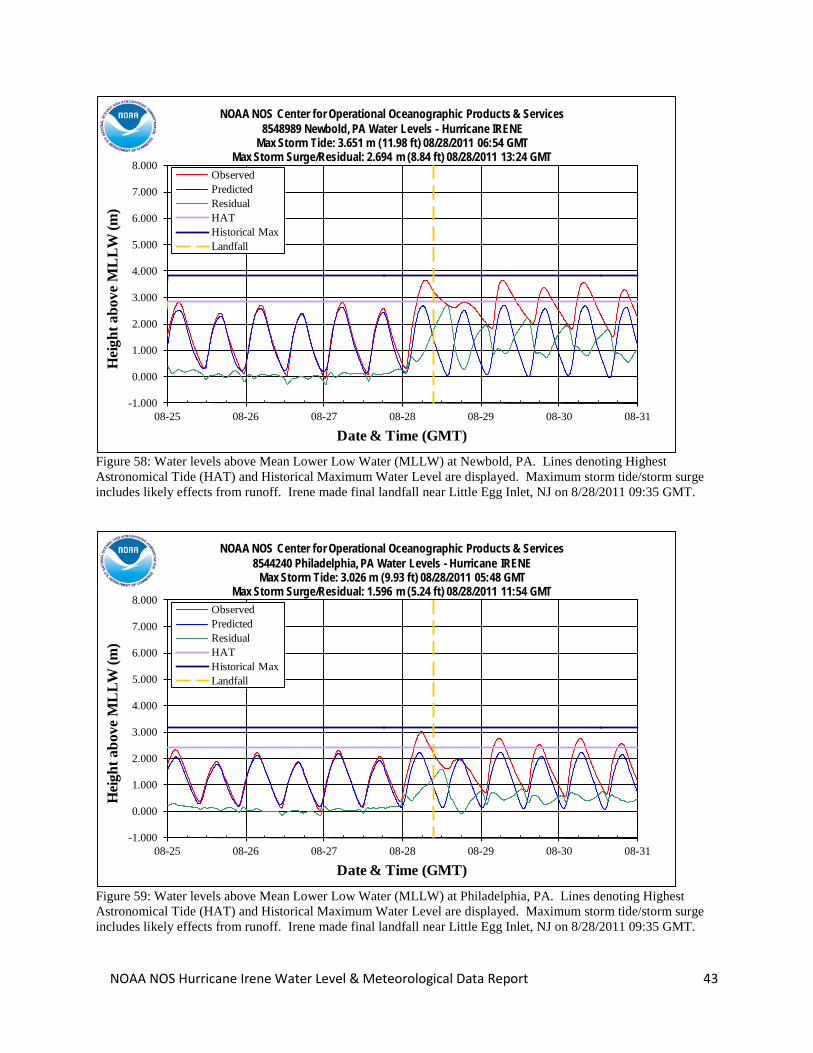
NOAA NOS Hurricane Irene Water Level & Meteorological Data Report 43
-1.000
0.000
1.000
2.000
3.000
4.000
5.000
6.000
7.000
8.000
08-25 08-26 08-27 08-28 08-29 08-30 08-31
Hei
ght a
bove
ML
LW (m
)
Date & Time (GMT)
ObservedPredicted ResidualHATHistorical MaxLandfall
NOAA NOS Center for Operational Oceanographic Products & Services8548989 Newbold, PA Water Levels - Hurricane IRENE
Max Storm Tide: 3.651 m (11.98 ft) 08/28/2011 06:54 GMTMax Storm Surge/Residual: 2.694 m (8.84 ft) 08/28/2011 13:24 GMT
Figure 58: Water levels above Mean Lower Low Water (MLLW) at Newbold, PA. Lines denoting Highest Astronomical Tide (HAT) and Historical Maximum Water Level are displayed. Maximum storm tide/storm surge includes likely effects from runoff. Irene made final landfall near Little Egg Inlet, NJ on 8/28/2011 09:35 GMT.
-1.000
0.000
1.000
2.000
3.000
4.000
5.000
6.000
7.000
8.000
08-25 08-26 08-27 08-28 08-29 08-30 08-31
Hei
ght a
bove
ML
LW (m
)
Date & Time (GMT)
ObservedPredicted ResidualHATHistorical MaxLandfall
NOAA NOS Center for Operational Oceanographic Products & Services8544240 Philadelphia, PA Water Levels - Hurricane IRENE
Max Storm Tide: 3.026 m (9.93 ft) 08/28/2011 05:48 GMTMax Storm Surge/Residual: 1.596 m (5.24 ft) 08/28/2011 11:54 GMT
Figure 59: Water levels above Mean Lower Low Water (MLLW) at Philadelphia, PA. Lines denoting Highest Astronomical Tide (HAT) and Historical Maximum Water Level are displayed. Maximum storm tide/storm surge includes likely effects from runoff. Irene made final landfall near Little Egg Inlet, NJ on 8/28/2011 09:35 GMT.
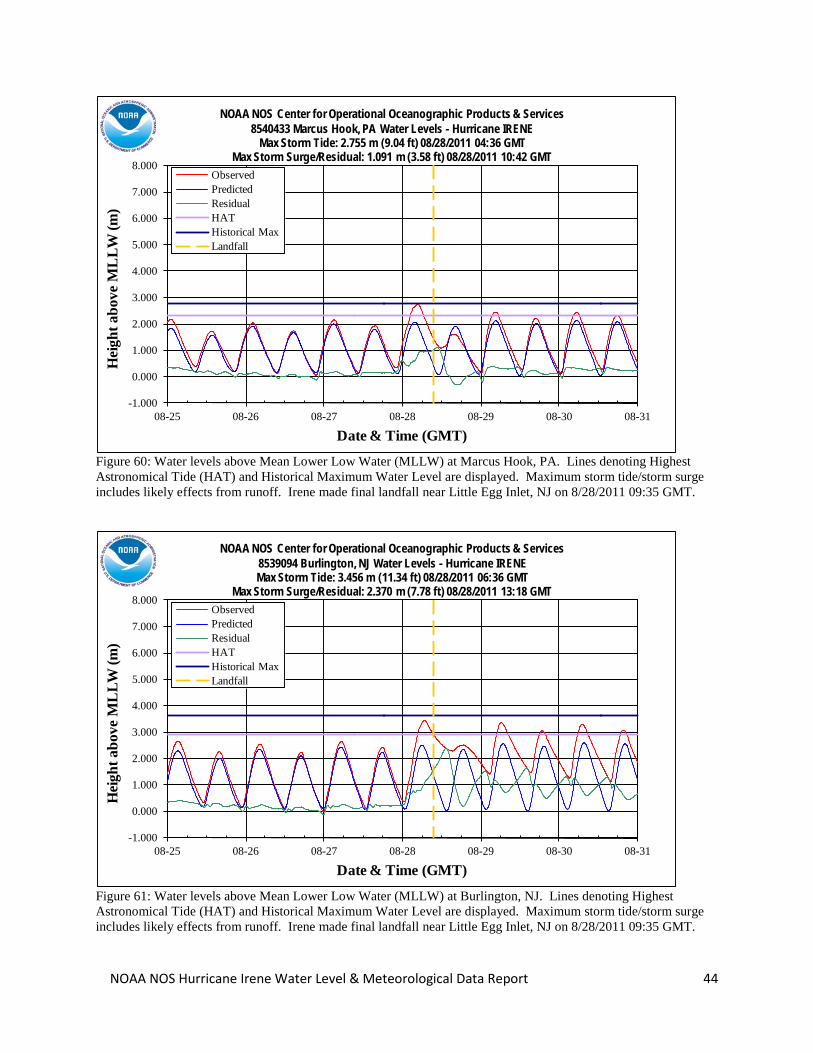
NOAA NOS Hurricane Irene Water Level & Meteorological Data Report 44
-1.000
0.000
1.000
2.000
3.000
4.000
5.000
6.000
7.000
8.000
08-25 08-26 08-27 08-28 08-29 08-30 08-31
Hei
ght a
bove
ML
LW (m
)
Date & Time (GMT)
ObservedPredicted ResidualHATHistorical MaxLandfall
NOAA NOS Center for Operational Oceanographic Products & Services8540433 Marcus Hook, PA Water Levels - Hurricane IRENE
Max Storm Tide: 2.755 m (9.04 ft) 08/28/2011 04:36 GMTMax Storm Surge/Residual: 1.091 m (3.58 ft) 08/28/2011 10:42 GMT
Figure 60: Water levels above Mean Lower Low Water (MLLW) at Marcus Hook, PA. Lines denoting Highest Astronomical Tide (HAT) and Historical Maximum Water Level are displayed. Maximum storm tide/storm surge includes likely effects from runoff. Irene made final landfall near Little Egg Inlet, NJ on 8/28/2011 09:35 GMT.
-1.000
0.000
1.000
2.000
3.000
4.000
5.000
6.000
7.000
8.000
08-25 08-26 08-27 08-28 08-29 08-30 08-31
Hei
ght a
bove
ML
LW (m
)
Date & Time (GMT)
ObservedPredicted ResidualHATHistorical MaxLandfall
NOAA NOS Center for Operational Oceanographic Products & Services8539094 Burlington, NJ Water Levels - Hurricane IRENEMax Storm Tide: 3.456 m (11.34 ft) 08/28/2011 06:36 GMT
Max Storm Surge/Residual: 2.370 m (7.78 ft) 08/28/2011 13:18 GMT
Figure 61: Water levels above Mean Lower Low Water (MLLW) at Burlington, NJ. Lines denoting Highest Astronomical Tide (HAT) and Historical Maximum Water Level are displayed. Maximum storm tide/storm surge includes likely effects from runoff. Irene made final landfall near Little Egg Inlet, NJ on 8/28/2011 09:35 GMT.
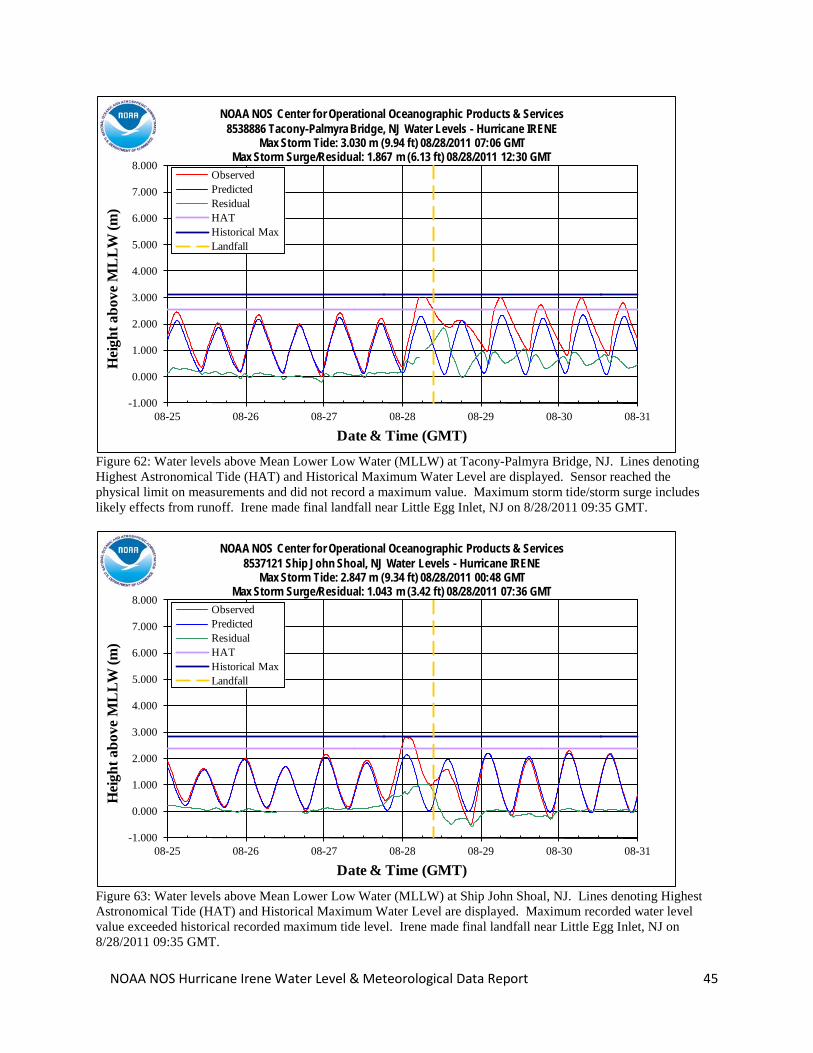
NOAA NOS Hurricane Irene Water Level & Meteorological Data Report 45
-1.000
0.000
1.000
2.000
3.000
4.000
5.000
6.000
7.000
8.000
08-25 08-26 08-27 08-28 08-29 08-30 08-31
Hei
ght a
bove
ML
LW (m
)
Date & Time (GMT)
ObservedPredicted ResidualHATHistorical MaxLandfall
NOAA NOS Center for Operational Oceanographic Products & Services8538886 Tacony-Palmyra Bridge, NJ Water Levels - Hurricane IRENE
Max Storm Tide: 3.030 m (9.94 ft) 08/28/2011 07:06 GMTMax Storm Surge/Residual: 1.867 m (6.13 ft) 08/28/2011 12:30 GMT
Figure 62: Water levels above Mean Lower Low Water (MLLW) at Tacony-Palmyra Bridge, NJ. Lines denoting Highest Astronomical Tide (HAT) and Historical Maximum Water Level are displayed. Sensor reached the physical limit on measurements and did not record a maximum value. Maximum storm tide/storm surge includes likely effects from runoff. Irene made final landfall near Little Egg Inlet, NJ on 8/28/2011 09:35 GMT.
-1.000
0.000
1.000
2.000
3.000
4.000
5.000
6.000
7.000
8.000
08-25 08-26 08-27 08-28 08-29 08-30 08-31
Hei
ght a
bove
ML
LW (m
)
Date & Time (GMT)
ObservedPredicted ResidualHATHistorical MaxLandfall
NOAA NOS Center for Operational Oceanographic Products & Services8537121 Ship John Shoal, NJ Water Levels - Hurricane IRENE
Max Storm Tide: 2.847 m (9.34 ft) 08/28/2011 00:48 GMTMax Storm Surge/Residual: 1.043 m (3.42 ft) 08/28/2011 07:36 GMT
Figure 63: Water levels above Mean Lower Low Water (MLLW) at Ship John Shoal, NJ. Lines denoting Highest Astronomical Tide (HAT) and Historical Maximum Water Level are displayed. Maximum recorded water level value exceeded historical recorded maximum tide level. Irene made final landfall near Little Egg Inlet, NJ on 8/28/2011 09:35 GMT.
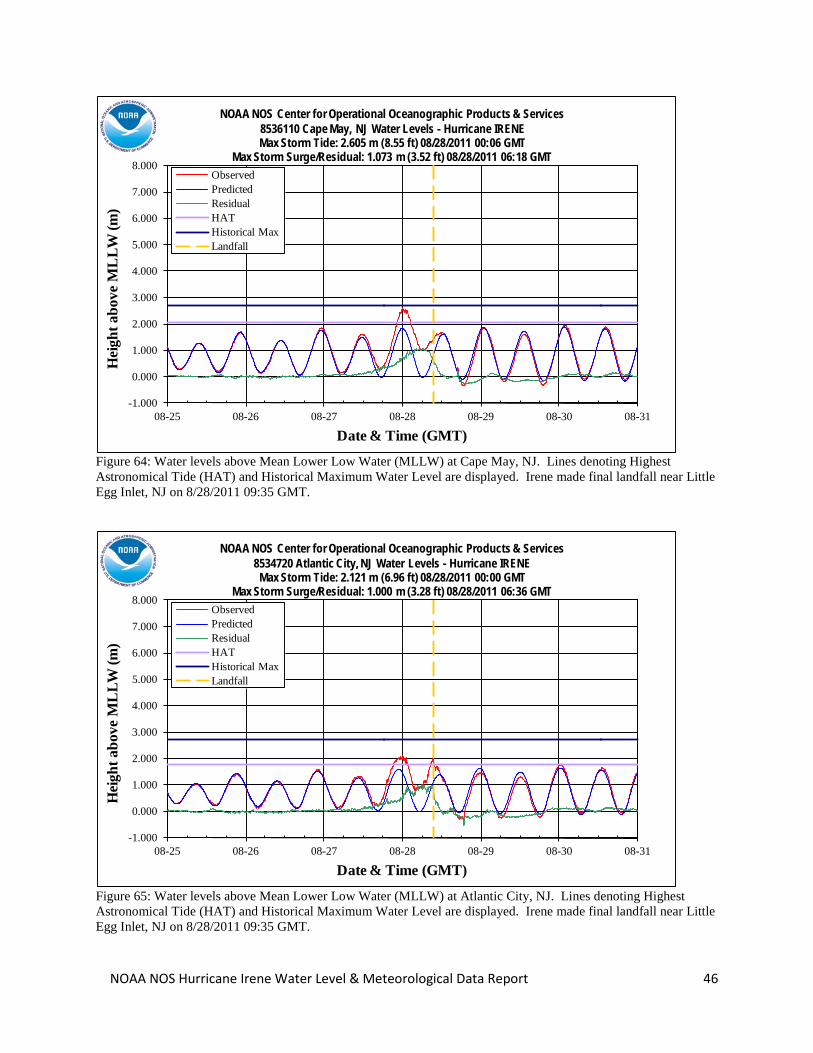
NOAA NOS Hurricane Irene Water Level & Meteorological Data Report 46
-1.000
0.000
1.000
2.000
3.000
4.000
5.000
6.000
7.000
8.000
08-25 08-26 08-27 08-28 08-29 08-30 08-31
Hei
ght a
bove
ML
LW (m
)
Date & Time (GMT)
ObservedPredicted ResidualHATHistorical MaxLandfall
NOAA NOS Center for Operational Oceanographic Products & Services8536110 Cape May, NJ Water Levels - Hurricane IRENEMax Storm Tide: 2.605 m (8.55 ft) 08/28/2011 00:06 GMT
Max Storm Surge/Residual: 1.073 m (3.52 ft) 08/28/2011 06:18 GMT
Figure 64: Water levels above Mean Lower Low Water (MLLW) at Cape May, NJ. Lines denoting Highest Astronomical Tide (HAT) and Historical Maximum Water Level are displayed. Irene made final landfall near Little Egg Inlet, NJ on 8/28/2011 09:35 GMT.
-1.000
0.000
1.000
2.000
3.000
4.000
5.000
6.000
7.000
8.000
08-25 08-26 08-27 08-28 08-29 08-30 08-31
Hei
ght a
bove
ML
LW (m
)
Date & Time (GMT)
ObservedPredicted ResidualHATHistorical MaxLandfall
NOAA NOS Center for Operational Oceanographic Products & Services8534720 Atlantic City, NJ Water Levels - Hurricane IRENE
Max Storm Tide: 2.121 m (6.96 ft) 08/28/2011 00:00 GMTMax Storm Surge/Residual: 1.000 m (3.28 ft) 08/28/2011 06:36 GMT
Figure 65: Water levels above Mean Lower Low Water (MLLW) at Atlantic City, NJ. Lines denoting Highest Astronomical Tide (HAT) and Historical Maximum Water Level are displayed. Irene made final landfall near Little Egg Inlet, NJ on 8/28/2011 09:35 GMT.
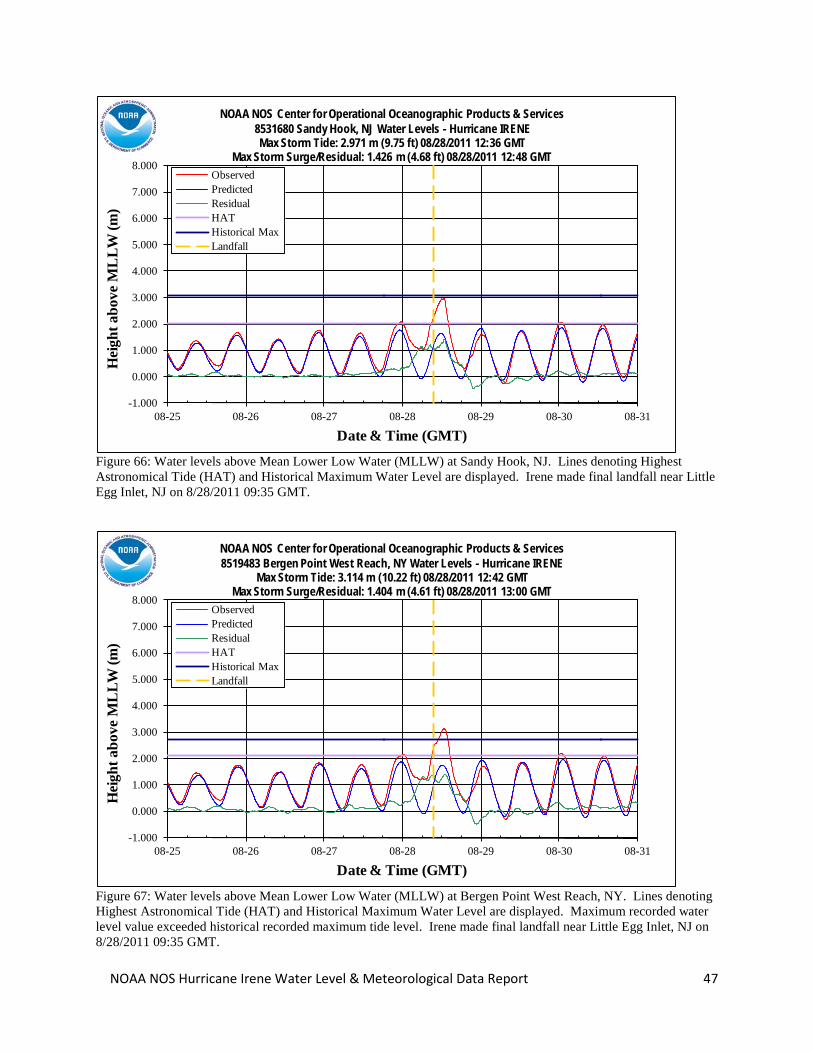
NOAA NOS Hurricane Irene Water Level & Meteorological Data Report 47
-1.000
0.000
1.000
2.000
3.000
4.000
5.000
6.000
7.000
8.000
08-25 08-26 08-27 08-28 08-29 08-30 08-31
Hei
ght a
bove
ML
LW (m
)
Date & Time (GMT)
ObservedPredicted ResidualHATHistorical MaxLandfall
NOAA NOS Center for Operational Oceanographic Products & Services8531680 Sandy Hook, NJ Water Levels - Hurricane IRENEMax Storm Tide: 2.971 m (9.75 ft) 08/28/2011 12:36 GMT
Max Storm Surge/Residual: 1.426 m (4.68 ft) 08/28/2011 12:48 GMT
Figure 66: Water levels above Mean Lower Low Water (MLLW) at Sandy Hook, NJ. Lines denoting Highest Astronomical Tide (HAT) and Historical Maximum Water Level are displayed. Irene made final landfall near Little Egg Inlet, NJ on 8/28/2011 09:35 GMT.
-1.000
0.000
1.000
2.000
3.000
4.000
5.000
6.000
7.000
8.000
08-25 08-26 08-27 08-28 08-29 08-30 08-31
Hei
ght a
bove
ML
LW (m
)
Date & Time (GMT)
ObservedPredicted ResidualHATHistorical MaxLandfall
NOAA NOS Center for Operational Oceanographic Products & Services8519483 Bergen Point West Reach, NY Water Levels - Hurricane IRENE
Max Storm Tide: 3.114 m (10.22 ft) 08/28/2011 12:42 GMTMax Storm Surge/Residual: 1.404 m (4.61 ft) 08/28/2011 13:00 GMT
Figure 67: Water levels above Mean Lower Low Water (MLLW) at Bergen Point West Reach, NY. Lines denoting Highest Astronomical Tide (HAT) and Historical Maximum Water Level are displayed. Maximum recorded water level value exceeded historical recorded maximum tide level. Irene made final landfall near Little Egg Inlet, NJ on 8/28/2011 09:35 GMT.
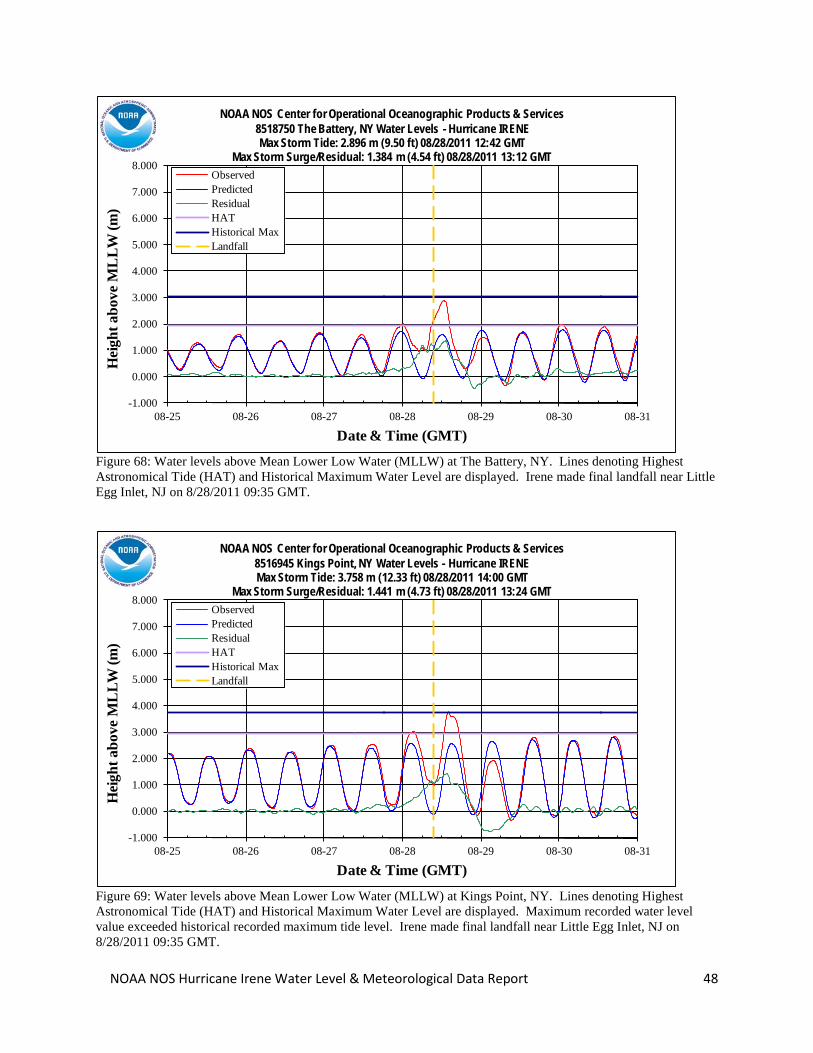
NOAA NOS Hurricane Irene Water Level & Meteorological Data Report 48
-1.000
0.000
1.000
2.000
3.000
4.000
5.000
6.000
7.000
8.000
08-25 08-26 08-27 08-28 08-29 08-30 08-31
Hei
ght a
bove
ML
LW (m
)
Date & Time (GMT)
ObservedPredicted ResidualHATHistorical MaxLandfall
NOAA NOS Center for Operational Oceanographic Products & Services8518750 The Battery, NY Water Levels - Hurricane IRENEMax Storm Tide: 2.896 m (9.50 ft) 08/28/2011 12:42 GMT
Max Storm Surge/Residual: 1.384 m (4.54 ft) 08/28/2011 13:12 GMT
Figure 68: Water levels above Mean Lower Low Water (MLLW) at The Battery, NY. Lines denoting Highest Astronomical Tide (HAT) and Historical Maximum Water Level are displayed. Irene made final landfall near Little Egg Inlet, NJ on 8/28/2011 09:35 GMT.
-1.000
0.000
1.000
2.000
3.000
4.000
5.000
6.000
7.000
8.000
08-25 08-26 08-27 08-28 08-29 08-30 08-31
Hei
ght a
bove
ML
LW (m
)
Date & Time (GMT)
ObservedPredicted ResidualHATHistorical MaxLandfall
NOAA NOS Center for Operational Oceanographic Products & Services8516945 Kings Point, NY Water Levels - Hurricane IRENEMax Storm Tide: 3.758 m (12.33 ft) 08/28/2011 14:00 GMT
Max Storm Surge/Residual: 1.441 m (4.73 ft) 08/28/2011 13:24 GMT
Figure 69: Water levels above Mean Lower Low Water (MLLW) at Kings Point, NY. Lines denoting Highest Astronomical Tide (HAT) and Historical Maximum Water Level are displayed. Maximum recorded water level value exceeded historical recorded maximum tide level. Irene made final landfall near Little Egg Inlet, NJ on 8/28/2011 09:35 GMT.

NOAA NOS Hurricane Irene Water Level & Meteorological Data Report 49
-1.000
0.000
1.000
2.000
3.000
4.000
5.000
6.000
7.000
8.000
08-25 08-26 08-27 08-28 08-29 08-30 08-31
Hei
ght a
bove
ML
LW (m
)
Date & Time (GMT)
ObservedPredicted ResidualHATHistorical MaxLandfall
NOAA NOS Center for Operational Oceanographic Products & Services8510560 Montauk, NY Water Levels - Hurricane IRENE
Max Storm Tide: 1.641 m (5.38 ft) 08/28/2011 13:12 GMTMax Storm Surge/Residual: 0.870 m (2.85 ft) 08/28/2011 15:48 GMT
Figure 70: Water levels above Mean Lower Low Water (MLLW) at Montauk, NY. Lines denoting Highest Astronomical Tide (HAT) and Historical Maximum Water Level are displayed. Irene made final landfall near Little Egg Inlet, NJ on 8/28/2011 09:35 GMT.
-1.000
0.000
1.000
2.000
3.000
4.000
5.000
6.000
7.000
8.000
08-25 08-26 08-27 08-28 08-29 08-30 08-31
Hei
ght a
bove
ML
LW (m
)
Date & Time (GMT)
ObservedPredicted ResidualHATHistorical MaxLandfall
NOAA NOS Center for Operational Oceanographic Products & Services8467150 Bridgeport, CT Water Levels - Hurricane IRENEMax Storm Tide: 3.683 m (12.08 ft) 08/28/2011 15:06 GMT
Max Storm Surge/Residual: 1.373 m (4.50 ft) 08/28/2011 14:12 GMT
Figure 71: Water levels above Mean Lower Low Water (MLLW) at Bridgeport, CT. Lines denoting Highest Astronomical Tide (HAT) and Historical Maximum Water Level are displayed. Irene made final landfall near Little Egg Inlet, NJ on 8/28/2011 09:35 GMT.
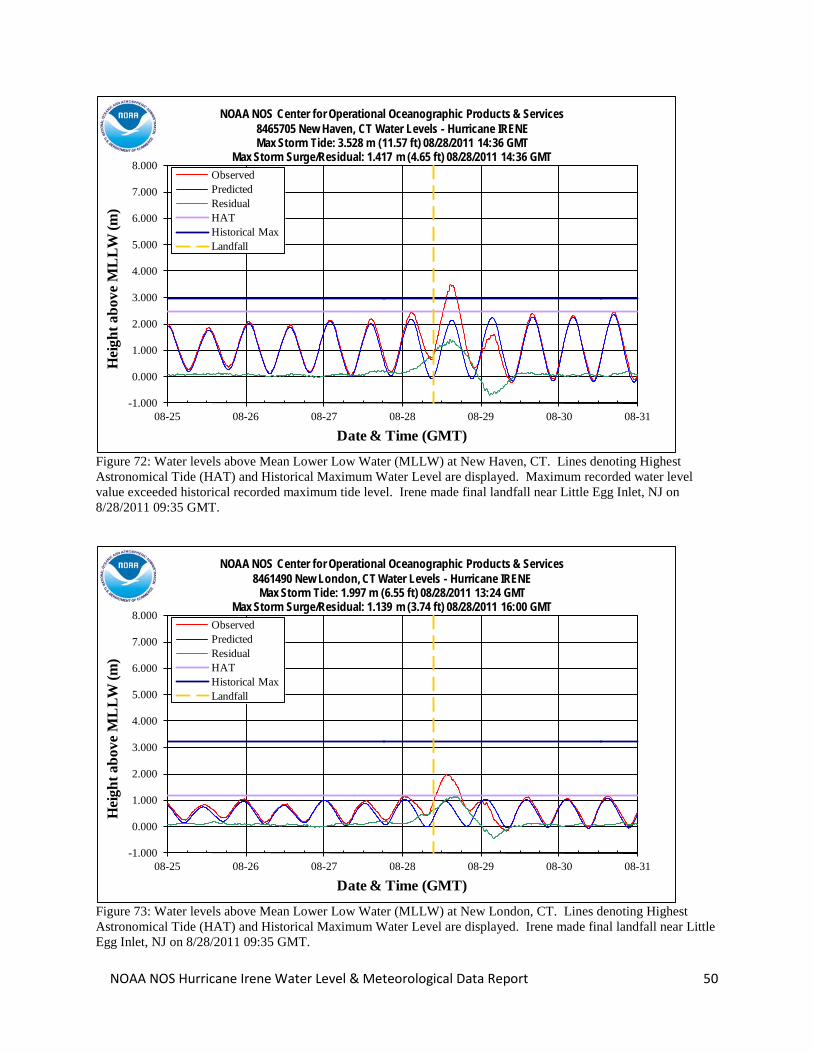
NOAA NOS Hurricane Irene Water Level & Meteorological Data Report 50
-1.000
0.000
1.000
2.000
3.000
4.000
5.000
6.000
7.000
8.000
08-25 08-26 08-27 08-28 08-29 08-30 08-31
Hei
ght a
bove
ML
LW (m
)
Date & Time (GMT)
ObservedPredicted ResidualHATHistorical MaxLandfall
NOAA NOS Center for Operational Oceanographic Products & Services8465705 New Haven, CT Water Levels - Hurricane IRENEMax Storm Tide: 3.528 m (11.57 ft) 08/28/2011 14:36 GMT
Max Storm Surge/Residual: 1.417 m (4.65 ft) 08/28/2011 14:36 GMT
Figure 72: Water levels above Mean Lower Low Water (MLLW) at New Haven, CT. Lines denoting Highest Astronomical Tide (HAT) and Historical Maximum Water Level are displayed. Maximum recorded water level value exceeded historical recorded maximum tide level. Irene made final landfall near Little Egg Inlet, NJ on 8/28/2011 09:35 GMT.
-1.000
0.000
1.000
2.000
3.000
4.000
5.000
6.000
7.000
8.000
08-25 08-26 08-27 08-28 08-29 08-30 08-31
Hei
ght a
bove
ML
LW (m
)
Date & Time (GMT)
ObservedPredicted ResidualHATHistorical MaxLandfall
NOAA NOS Center for Operational Oceanographic Products & Services8461490 New London, CT Water Levels - Hurricane IRENE
Max Storm Tide: 1.997 m (6.55 ft) 08/28/2011 13:24 GMTMax Storm Surge/Residual: 1.139 m (3.74 ft) 08/28/2011 16:00 GMT
Figure 73: Water levels above Mean Lower Low Water (MLLW) at New London, CT. Lines denoting Highest Astronomical Tide (HAT) and Historical Maximum Water Level are displayed. Irene made final landfall near Little Egg Inlet, NJ on 8/28/2011 09:35 GMT.
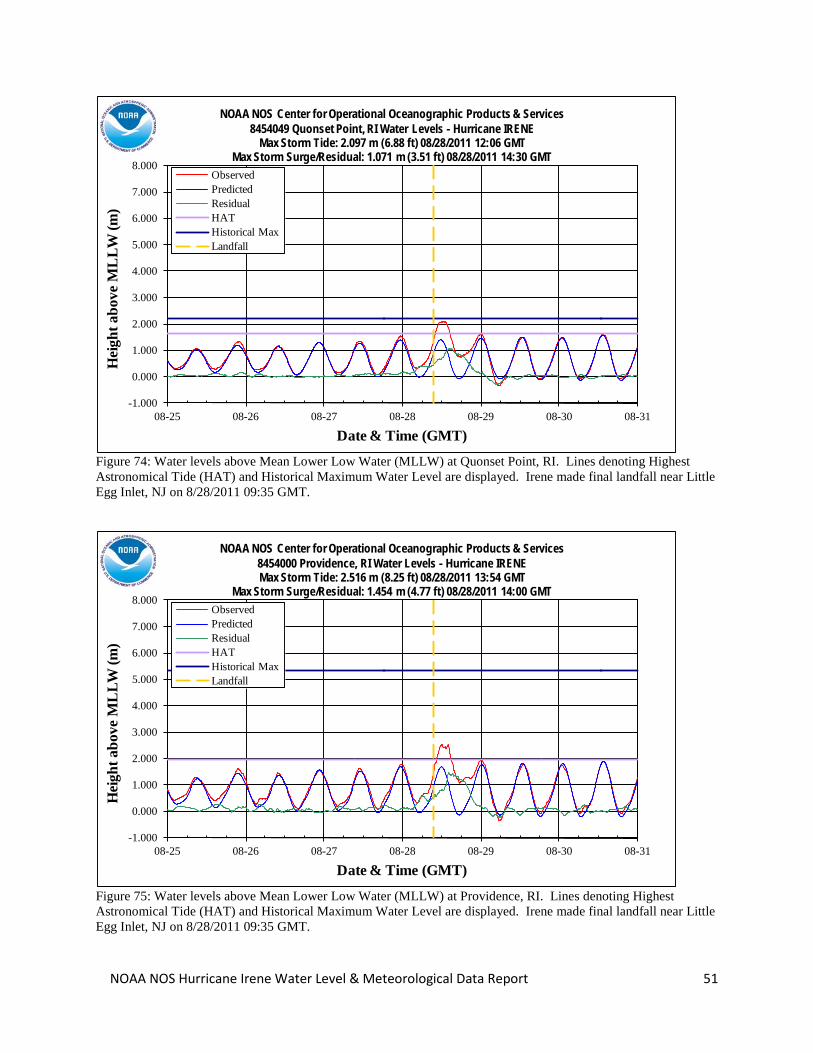
NOAA NOS Hurricane Irene Water Level & Meteorological Data Report 51
-1.000
0.000
1.000
2.000
3.000
4.000
5.000
6.000
7.000
8.000
08-25 08-26 08-27 08-28 08-29 08-30 08-31
Hei
ght a
bove
ML
LW (m
)
Date & Time (GMT)
ObservedPredicted ResidualHATHistorical MaxLandfall
NOAA NOS Center for Operational Oceanographic Products & Services8454049 Quonset Point, RI Water Levels - Hurricane IRENE
Max Storm Tide: 2.097 m (6.88 ft) 08/28/2011 12:06 GMTMax Storm Surge/Residual: 1.071 m (3.51 ft) 08/28/2011 14:30 GMT
Figure 74: Water levels above Mean Lower Low Water (MLLW) at Quonset Point, RI. Lines denoting Highest Astronomical Tide (HAT) and Historical Maximum Water Level are displayed. Irene made final landfall near Little Egg Inlet, NJ on 8/28/2011 09:35 GMT.
-1.000
0.000
1.000
2.000
3.000
4.000
5.000
6.000
7.000
8.000
08-25 08-26 08-27 08-28 08-29 08-30 08-31
Hei
ght a
bove
ML
LW (m
)
Date & Time (GMT)
ObservedPredicted ResidualHATHistorical MaxLandfall
NOAA NOS Center for Operational Oceanographic Products & Services8454000 Providence, RI Water Levels - Hurricane IRENEMax Storm Tide: 2.516 m (8.25 ft) 08/28/2011 13:54 GMT
Max Storm Surge/Residual: 1.454 m (4.77 ft) 08/28/2011 14:00 GMT
Figure 75: Water levels above Mean Lower Low Water (MLLW) at Providence, RI. Lines denoting Highest Astronomical Tide (HAT) and Historical Maximum Water Level are displayed. Irene made final landfall near Little Egg Inlet, NJ on 8/28/2011 09:35 GMT.
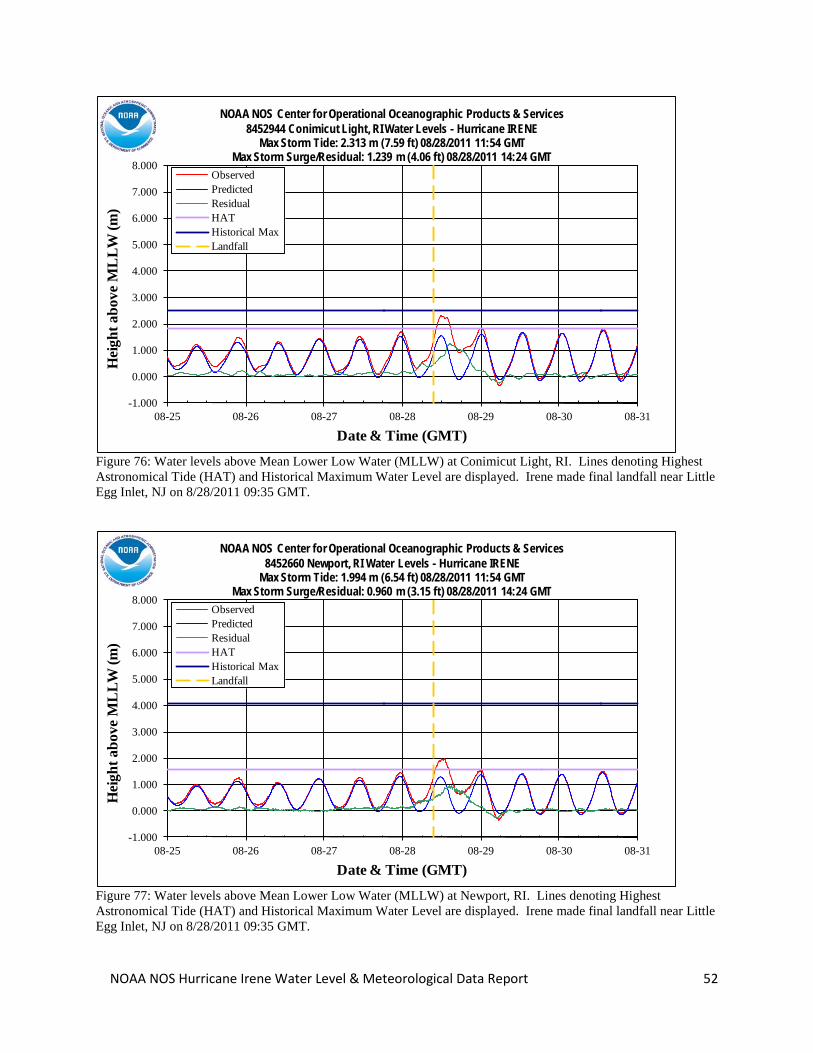
NOAA NOS Hurricane Irene Water Level & Meteorological Data Report 52
-1.000
0.000
1.000
2.000
3.000
4.000
5.000
6.000
7.000
8.000
08-25 08-26 08-27 08-28 08-29 08-30 08-31
Hei
ght a
bove
ML
LW (m
)
Date & Time (GMT)
ObservedPredicted ResidualHATHistorical MaxLandfall
NOAA NOS Center for Operational Oceanographic Products & Services8452944 Conimicut Light, RI Water Levels - Hurricane IRENE
Max Storm Tide: 2.313 m (7.59 ft) 08/28/2011 11:54 GMTMax Storm Surge/Residual: 1.239 m (4.06 ft) 08/28/2011 14:24 GMT
Figure 76: Water levels above Mean Lower Low Water (MLLW) at Conimicut Light, RI. Lines denoting Highest Astronomical Tide (HAT) and Historical Maximum Water Level are displayed. Irene made final landfall near Little Egg Inlet, NJ on 8/28/2011 09:35 GMT.
-1.000
0.000
1.000
2.000
3.000
4.000
5.000
6.000
7.000
8.000
08-25 08-26 08-27 08-28 08-29 08-30 08-31
Hei
ght a
bove
ML
LW (m
)
Date & Time (GMT)
ObservedPredicted ResidualHATHistorical MaxLandfall
NOAA NOS Center for Operational Oceanographic Products & Services8452660 Newport, RI Water Levels - Hurricane IRENE
Max Storm Tide: 1.994 m (6.54 ft) 08/28/2011 11:54 GMTMax Storm Surge/Residual: 0.960 m (3.15 ft) 08/28/2011 14:24 GMT
Figure 77: Water levels above Mean Lower Low Water (MLLW) at Newport, RI. Lines denoting Highest Astronomical Tide (HAT) and Historical Maximum Water Level are displayed. Irene made final landfall near Little Egg Inlet, NJ on 8/28/2011 09:35 GMT.
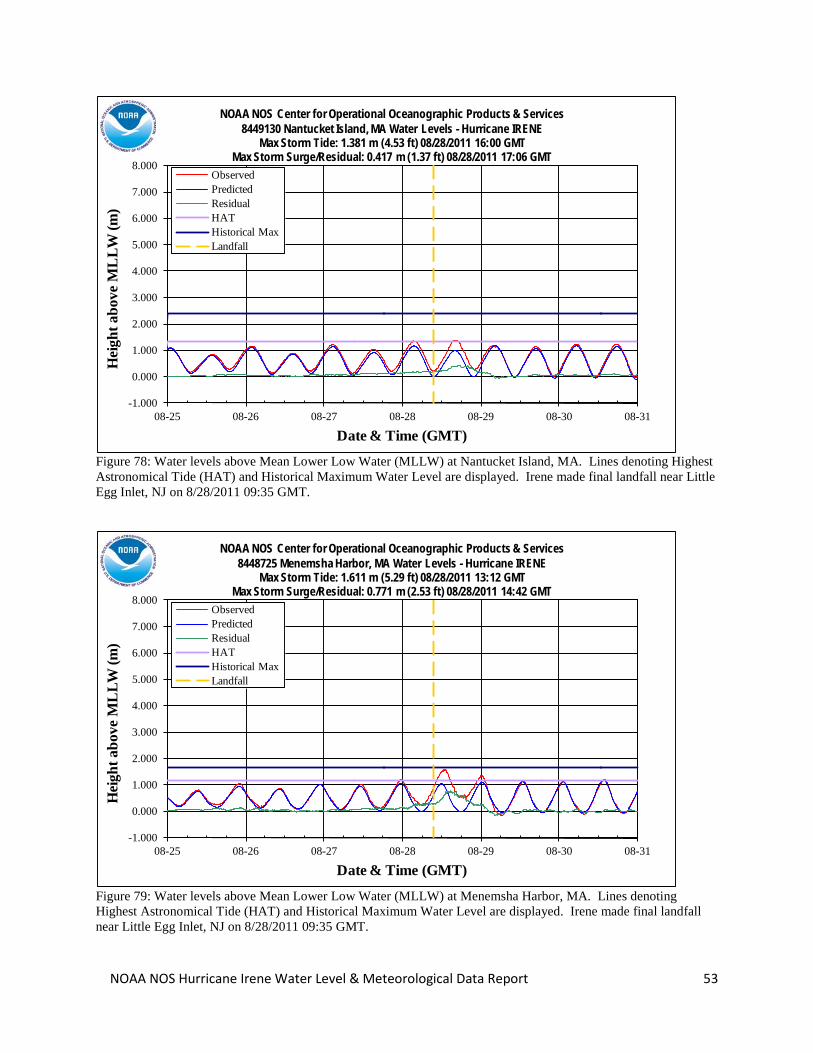
NOAA NOS Hurricane Irene Water Level & Meteorological Data Report 53
-1.000
0.000
1.000
2.000
3.000
4.000
5.000
6.000
7.000
8.000
08-25 08-26 08-27 08-28 08-29 08-30 08-31
Hei
ght a
bove
ML
LW (m
)
Date & Time (GMT)
ObservedPredicted ResidualHATHistorical MaxLandfall
NOAA NOS Center for Operational Oceanographic Products & Services8449130 Nantucket Island, MA Water Levels - Hurricane IRENE
Max Storm Tide: 1.381 m (4.53 ft) 08/28/2011 16:00 GMTMax Storm Surge/Residual: 0.417 m (1.37 ft) 08/28/2011 17:06 GMT
Figure 78: Water levels above Mean Lower Low Water (MLLW) at Nantucket Island, MA. Lines denoting Highest Astronomical Tide (HAT) and Historical Maximum Water Level are displayed. Irene made final landfall near Little Egg Inlet, NJ on 8/28/2011 09:35 GMT.
-1.000
0.000
1.000
2.000
3.000
4.000
5.000
6.000
7.000
8.000
08-25 08-26 08-27 08-28 08-29 08-30 08-31
Hei
ght a
bove
ML
LW (m
)
Date & Time (GMT)
ObservedPredicted ResidualHATHistorical MaxLandfall
NOAA NOS Center for Operational Oceanographic Products & Services8448725 Menemsha Harbor, MA Water Levels - Hurricane IRENE
Max Storm Tide: 1.611 m (5.29 ft) 08/28/2011 13:12 GMTMax Storm Surge/Residual: 0.771 m (2.53 ft) 08/28/2011 14:42 GMT
Figure 79: Water levels above Mean Lower Low Water (MLLW) at Menemsha Harbor, MA. Lines denoting Highest Astronomical Tide (HAT) and Historical Maximum Water Level are displayed. Irene made final landfall near Little Egg Inlet, NJ on 8/28/2011 09:35 GMT.

NOAA NOS Hurricane Irene Water Level & Meteorological Data Report 54
-1.000
0.000
1.000
2.000
3.000
4.000
5.000
6.000
7.000
8.000
08-25 08-26 08-27 08-28 08-29 08-30 08-31
Hei
ght a
bove
ML
LW (m
)
Date & Time (GMT)
ObservedPredicted ResidualHATHistorical MaxLandfall
NOAA NOS Center for Operational Oceanographic Products & Services8447930 Woods Hole, MA Water Levels - Hurricane IRENE
Max Storm Tide: 1.405 m (4.61 ft) 08/28/2011 13:36 GMTMax Storm Surge/Residual: 0.916 m (3.01 ft) 08/28/2011 14:18 GMT
Figure 80: Water levels above Mean Lower Low Water (MLLW) at Woods Hole, MA. Lines denoting Highest Astronomical Tide (HAT) and Historical Maximum Water Level are displayed. Irene made final landfall near Little Egg Inlet, NJ on 8/28/2011 09:35 GMT.
-1.000
0.000
1.000
2.000
3.000
4.000
5.000
6.000
7.000
8.000
08-25 08-26 08-27 08-28 08-29 08-30 08-31
Hei
ght a
bove
ML
LW (m
)
Date & Time (GMT)
ObservedPredicted ResidualHATHistorical MaxLandfall
NOAA NOS Center for Operational Oceanographic Products & Services8447435 Chatham, MA Water Levels - Hurricane IRENEMax Storm Tide: 2.271 m (7.45 ft) 08/28/2011 16:12 GMT
Max Storm Surge/Residual: 0.514 m (1.69 ft) 08/28/2011 18:00 GMT
Figure 81: Water levels above Mean Lower Low Water (MLLW) at Chatham, MA. Lines denoting Highest Astronomical Tide (HAT) and Historical Maximum Water Level are displayed. Irene made final landfall near Little Egg Inlet, NJ on 8/28/2011 09:35 GMT.

NOAA NOS Hurricane Irene Water Level & Meteorological Data Report 55
-1.000
0.000
1.000
2.000
3.000
4.000
5.000
6.000
7.000
8.000
08-25 08-26 08-27 08-28 08-29 08-30 08-31
Hei
ght a
bove
ML
LW (m
)
Date & Time (GMT)
ObservedPredicted ResidualHATHistorical MaxLandfall
NOAA NOS Center for Operational Oceanographic Products & Services8447386 Fall River, MA Water Levels - Hurricane IRENEMax Storm Tide: 2.226 m (7.30 ft) 08/28/2011 11:42 GMT
Max Storm Surge/Residual: 1.171 m (3.84 ft) 08/28/2011 14:48 GMT
Figure 82: Water levels above Mean Lower Low Water (MLLW) at Fall River, MA. Lines denoting Highest Astronomical Tide (HAT) and Historical Maximum Water Level are displayed. Irene made final landfall near Little Egg Inlet, NJ on 8/28/2011 09:35 GMT.
-1.000
0.000
1.000
2.000
3.000
4.000
5.000
6.000
7.000
8.000
08-25 08-26 08-27 08-28 08-29 08-30 08-31
Hei
ght a
bove
ML
LW (m
)
Date & Time (GMT)
ObservedPredicted ResidualHATHistorical MaxLandfall
NOAA NOS Center for Operational Oceanographic Products & Services8443970 Boston, MA Water Levels - Hurricane IRENE
Max Storm Tide: 3.641 m (11.95 ft) 08/28/2011 15:06 GMTMax Storm Surge/Residual: 0.534 m (1.75 ft) 08/28/2011 17:48 GMT
Figure 83: Water levels above Mean Lower Low Water (MLLW) at Boston, MA. Lines denoting Highest Astronomical Tide (HAT) and Historical Maximum Water Level are displayed. Irene made final landfall near Little Egg Inlet, NJ on 8/28/2011 09:35 GMT.
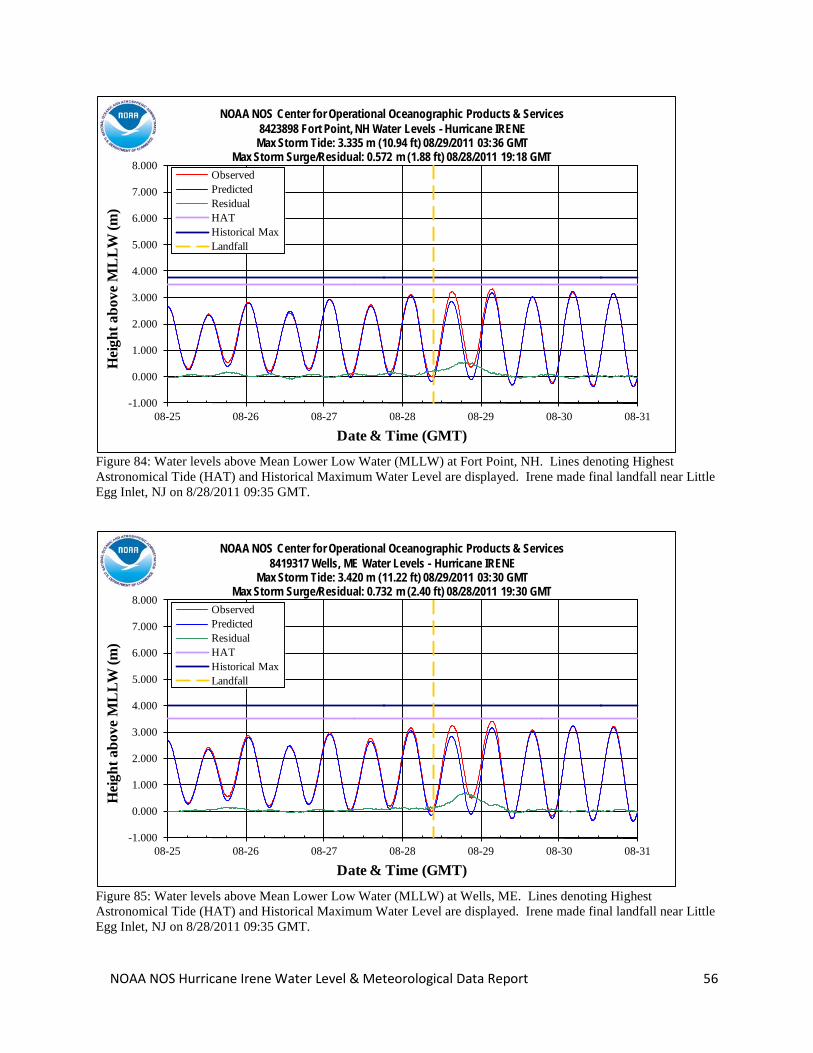
NOAA NOS Hurricane Irene Water Level & Meteorological Data Report 56
-1.000
0.000
1.000
2.000
3.000
4.000
5.000
6.000
7.000
8.000
08-25 08-26 08-27 08-28 08-29 08-30 08-31
Hei
ght a
bove
ML
LW (m
)
Date & Time (GMT)
ObservedPredicted ResidualHATHistorical MaxLandfall
NOAA NOS Center for Operational Oceanographic Products & Services8423898 Fort Point, NH Water Levels - Hurricane IRENE
Max Storm Tide: 3.335 m (10.94 ft) 08/29/2011 03:36 GMTMax Storm Surge/Residual: 0.572 m (1.88 ft) 08/28/2011 19:18 GMT
Figure 84: Water levels above Mean Lower Low Water (MLLW) at Fort Point, NH. Lines denoting Highest Astronomical Tide (HAT) and Historical Maximum Water Level are displayed. Irene made final landfall near Little Egg Inlet, NJ on 8/28/2011 09:35 GMT.
-1.000
0.000
1.000
2.000
3.000
4.000
5.000
6.000
7.000
8.000
08-25 08-26 08-27 08-28 08-29 08-30 08-31
Hei
ght a
bove
ML
LW (m
)
Date & Time (GMT)
ObservedPredicted ResidualHATHistorical MaxLandfall
NOAA NOS Center for Operational Oceanographic Products & Services8419317 Wells, ME Water Levels - Hurricane IRENE
Max Storm Tide: 3.420 m (11.22 ft) 08/29/2011 03:30 GMTMax Storm Surge/Residual: 0.732 m (2.40 ft) 08/28/2011 19:30 GMT
Figure 85: Water levels above Mean Lower Low Water (MLLW) at Wells, ME. Lines denoting Highest Astronomical Tide (HAT) and Historical Maximum Water Level are displayed. Irene made final landfall near Little Egg Inlet, NJ on 8/28/2011 09:35 GMT.

NOAA NOS Hurricane Irene Water Level & Meteorological Data Report 57
-1.000
0.000
1.000
2.000
3.000
4.000
5.000
6.000
7.000
8.000
08-25 08-26 08-27 08-28 08-29 08-30 08-31
Hei
ght a
bove
ML
LW (m
)
Date & Time (GMT)
ObservedPredicted ResidualHATHistorical MaxLandfall
NOAA NOS Center for Operational Oceanographic Products & Services8418150 Portland, ME Water Levels - Hurricane IRENE
Max Storm Tide: 3.645 m (11.96 ft) 08/29/2011 03:06 GMTMax Storm Surge/Residual: 0.586 m (1.92 ft) 08/28/2011 20:06 GMT
Figure 86: Water levels above Mean Lower Low Water (MLLW) at Portland, ME. Lines denoting Highest Astronomical Tide (HAT) and Historical Maximum Water Level are displayed. Irene made final landfall near Little Egg Inlet, NJ on 8/28/2011 09:35 GMT.
-1.000
0.000
1.000
2.000
3.000
4.000
5.000
6.000
7.000
8.000
08-25 08-26 08-27 08-28 08-29 08-30 08-31
Hei
ght a
bove
ML
LW (m
)
Date & Time (GMT)
ObservedPredicted ResidualHATHistorical MaxLandfall
NOAA NOS Center for Operational Oceanographic Products & Services8413320 Bar Harbor, ME Water Levels - Hurricane IRENEMax Storm Tide: 4.160 m (13.65 ft) 08/29/2011 03:12 GMT
Max Storm Surge/Residual: 0.433 m (1.42 ft) 08/28/2011 21:30 GMT
Figure 87: Water levels above Mean Lower Low Water (MLLW) at Bar Harbor, ME. Lines denoting Highest Astronomical Tide (HAT) and Historical Maximum Water Level are displayed. Irene made final landfall near Little Egg Inlet, NJ on 8/28/2011 09:35 GMT.
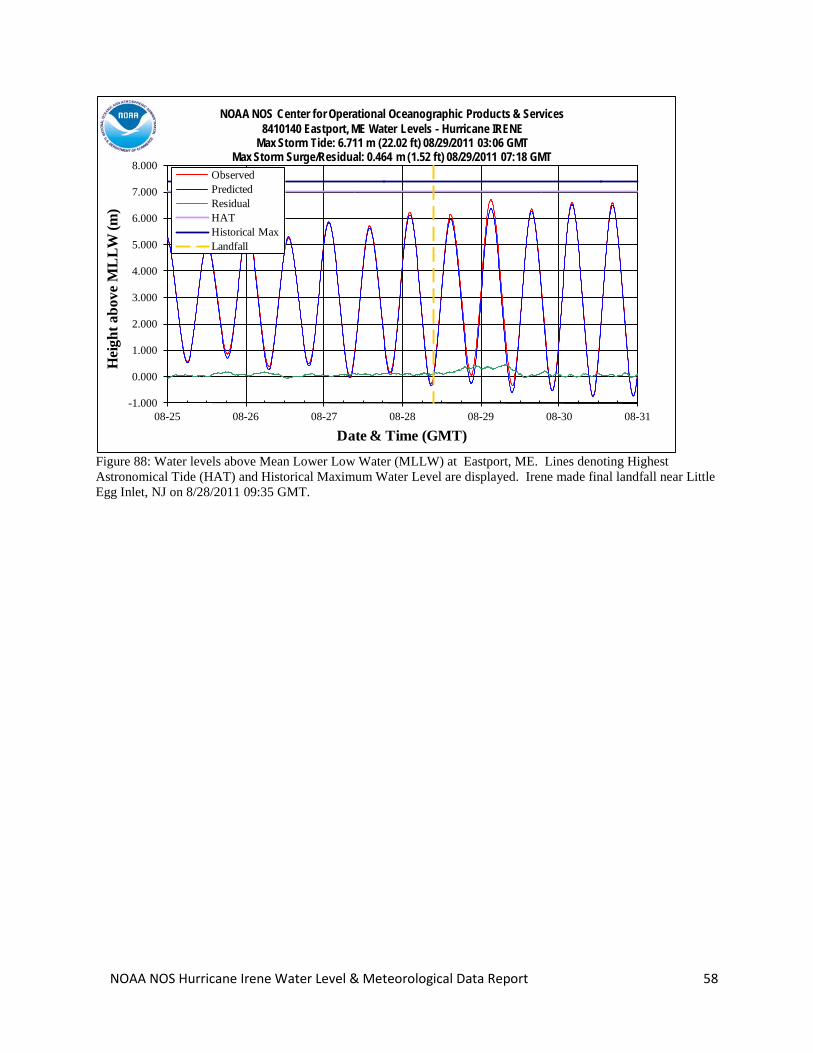
NOAA NOS Hurricane Irene Water Level & Meteorological Data Report 58
-1.000
0.000
1.000
2.000
3.000
4.000
5.000
6.000
7.000
8.000
08-25 08-26 08-27 08-28 08-29 08-30 08-31
Hei
ght a
bove
ML
LW (m
)
Date & Time (GMT)
ObservedPredicted ResidualHATHistorical MaxLandfall
NOAA NOS Center for Operational Oceanographic Products & Services8410140 Eastport, ME Water Levels - Hurricane IRENE
Max Storm Tide: 6.711 m (22.02 ft) 08/29/2011 03:06 GMTMax Storm Surge/Residual: 0.464 m (1.52 ft) 08/29/2011 07:18 GMT
Figure 88: Water levels above Mean Lower Low Water (MLLW) at Eastport, ME. Lines denoting Highest Astronomical Tide (HAT) and Historical Maximum Water Level are displayed. Irene made final landfall near Little Egg Inlet, NJ on 8/28/2011 09:35 GMT.
NOAA NOS Hurricane Irene Water Level & Meteorological Data Report 59
Appendix 1: References and Contact Information NOAA, 2008. Center For Operational Oceanographic Products & Services Specifications and Deliverables for Installation, Operation, and Removal of Water Level Stations, NOAA/NOS, March 2008. NOAA, 1991. Next Generation Water Level Measurement System (NGWLMS) Site Design, Preparation, and Installation Manual, NOAA/NOS, January 1991. Center for Operational Oceanographic Products & Services Environmental Measurement Systems Sensor Specifications and Measurement Algorithm, NOAA/NOS. For further information or updates on the Storm Technical Reports and Storm QuickLook product, contact: Storm QuickLook Center for Operational Oceanographic Products and Services (CO-OPS) 1305 East-West Highway Silver Spring, MD 20910-3281 Phone: (301) 713-2877 ext. 211 Fax: (301) 713-4437 E-mail: Storm QuickLook ([email protected])
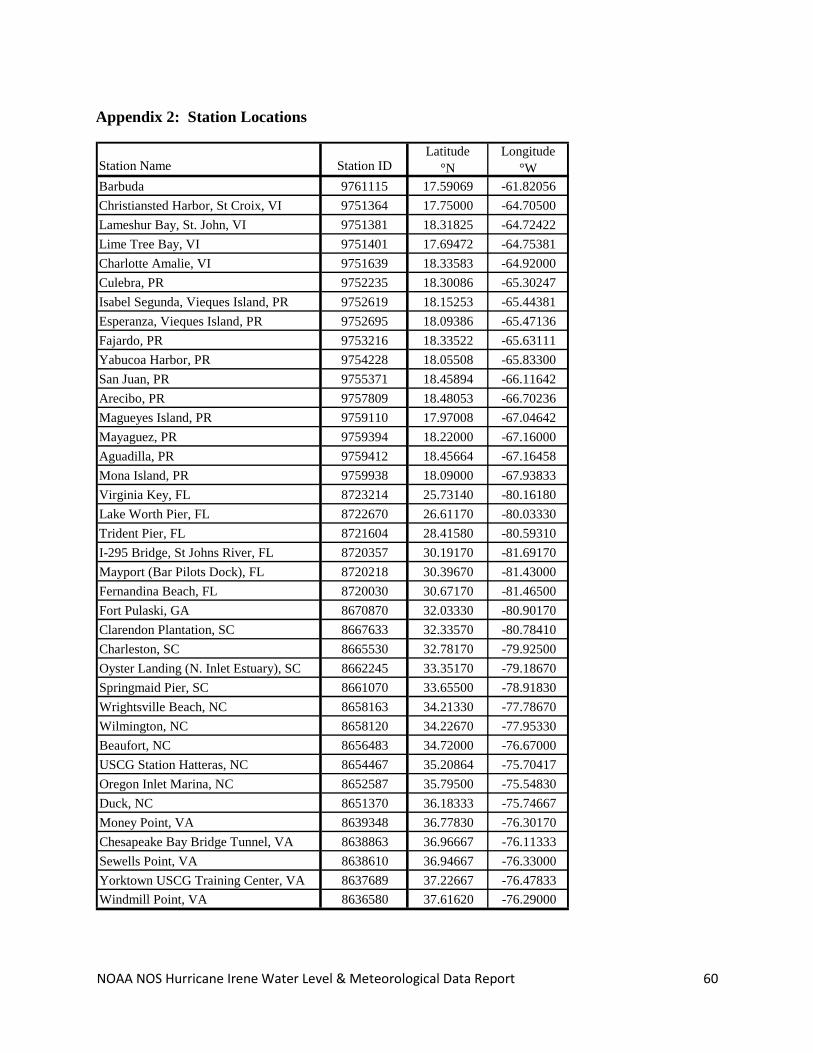
NOAA NOS Hurricane Irene Water Level & Meteorological Data Report 60
Appendix 2: Station Locations
Station Name Station IDLatitude
°NLongitude
°WBarbuda 9761115 17.59069 -61.82056Christiansted Harbor, St Croix, VI 9751364 17.75000 -64.70500Lameshur Bay, St. John, VI 9751381 18.31825 -64.72422Lime Tree Bay, VI 9751401 17.69472 -64.75381Charlotte Amalie, VI 9751639 18.33583 -64.92000Culebra, PR 9752235 18.30086 -65.30247Isabel Segunda, Vieques Island, PR 9752619 18.15253 -65.44381Esperanza, Vieques Island, PR 9752695 18.09386 -65.47136Fajardo, PR 9753216 18.33522 -65.63111Yabucoa Harbor, PR 9754228 18.05508 -65.83300San Juan, PR 9755371 18.45894 -66.11642Arecibo, PR 9757809 18.48053 -66.70236Magueyes Island, PR 9759110 17.97008 -67.04642Mayaguez, PR 9759394 18.22000 -67.16000Aguadilla, PR 9759412 18.45664 -67.16458Mona Island, PR 9759938 18.09000 -67.93833Virginia Key, FL 8723214 25.73140 -80.16180Lake Worth Pier, FL 8722670 26.61170 -80.03330Trident Pier, FL 8721604 28.41580 -80.59310I-295 Bridge, St Johns River, FL 8720357 30.19170 -81.69170Mayport (Bar Pilots Dock), FL 8720218 30.39670 -81.43000Fernandina Beach, FL 8720030 30.67170 -81.46500Fort Pulaski, GA 8670870 32.03330 -80.90170Clarendon Plantation, SC 8667633 32.33570 -80.78410Charleston, SC 8665530 32.78170 -79.92500Oyster Landing (N. Inlet Estuary), SC 8662245 33.35170 -79.18670Springmaid Pier, SC 8661070 33.65500 -78.91830Wrightsville Beach, NC 8658163 34.21330 -77.78670Wilmington, NC 8658120 34.22670 -77.95330Beaufort, NC 8656483 34.72000 -76.67000USCG Station Hatteras, NC 8654467 35.20864 -75.70417Oregon Inlet Marina, NC 8652587 35.79500 -75.54830Duck, NC 8651370 36.18333 -75.74667Money Point, VA 8639348 36.77830 -76.30170Chesapeake Bay Bridge Tunnel, VA 8638863 36.96667 -76.11333Sewells Point, VA 8638610 36.94667 -76.33000Yorktown USCG Training Center, VA 8637689 37.22667 -76.47833Windmill Point, VA 8636580 37.61620 -76.29000
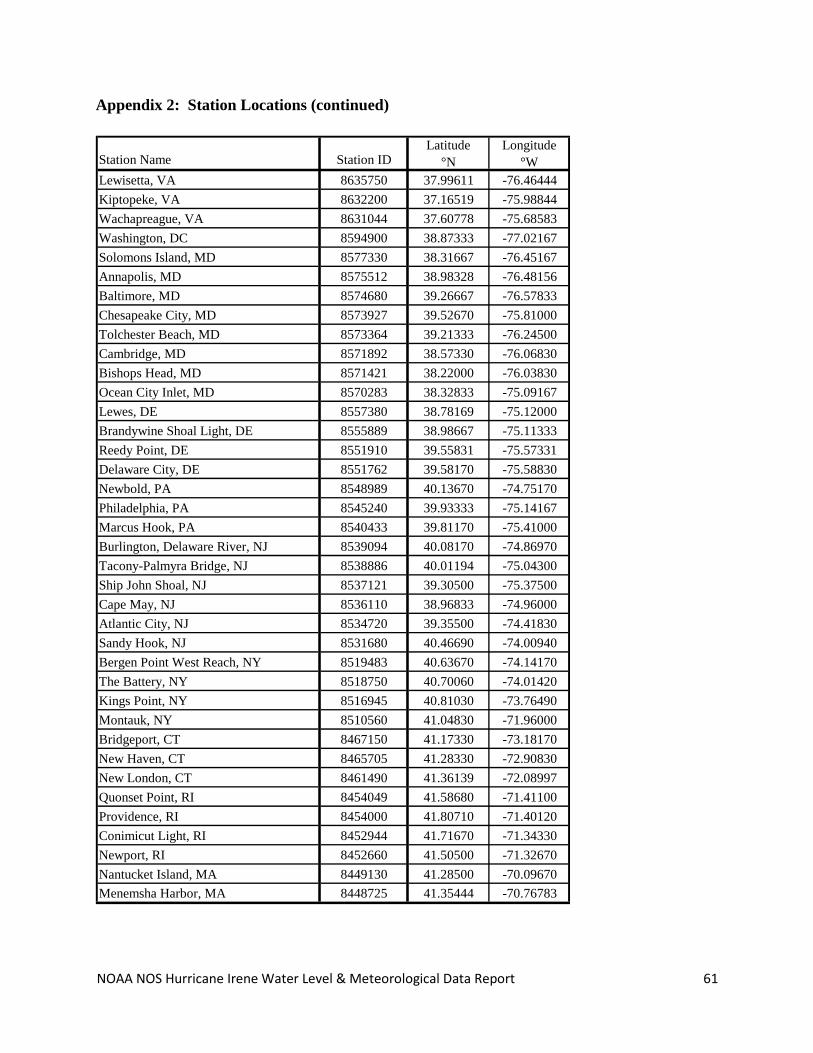
NOAA NOS Hurricane Irene Water Level & Meteorological Data Report 61
Appendix 2: Station Locations (continued)
Station Name Station IDLatitude
°NLongitude
°WLewisetta, VA 8635750 37.99611 -76.46444Kiptopeke, VA 8632200 37.16519 -75.98844Wachapreague, VA 8631044 37.60778 -75.68583Washington, DC 8594900 38.87333 -77.02167Solomons Island, MD 8577330 38.31667 -76.45167Annapolis, MD 8575512 38.98328 -76.48156Baltimore, MD 8574680 39.26667 -76.57833Chesapeake City, MD 8573927 39.52670 -75.81000Tolchester Beach, MD 8573364 39.21333 -76.24500Cambridge, MD 8571892 38.57330 -76.06830Bishops Head, MD 8571421 38.22000 -76.03830Ocean City Inlet, MD 8570283 38.32833 -75.09167Lewes, DE 8557380 38.78169 -75.12000Brandywine Shoal Light, DE 8555889 38.98667 -75.11333Reedy Point, DE 8551910 39.55831 -75.57331Delaware City, DE 8551762 39.58170 -75.58830Newbold, PA 8548989 40.13670 -74.75170Philadelphia, PA 8545240 39.93333 -75.14167Marcus Hook, PA 8540433 39.81170 -75.41000Burlington, Delaware River, NJ 8539094 40.08170 -74.86970Tacony-Palmyra Bridge, NJ 8538886 40.01194 -75.04300Ship John Shoal, NJ 8537121 39.30500 -75.37500Cape May, NJ 8536110 38.96833 -74.96000Atlantic City, NJ 8534720 39.35500 -74.41830Sandy Hook, NJ 8531680 40.46690 -74.00940Bergen Point West Reach, NY 8519483 40.63670 -74.14170The Battery, NY 8518750 40.70060 -74.01420Kings Point, NY 8516945 40.81030 -73.76490Montauk, NY 8510560 41.04830 -71.96000Bridgeport, CT 8467150 41.17330 -73.18170New Haven, CT 8465705 41.28330 -72.90830New London, CT 8461490 41.36139 -72.08997Quonset Point, RI 8454049 41.58680 -71.41100Providence, RI 8454000 41.80710 -71.40120Conimicut Light, RI 8452944 41.71670 -71.34330Newport, RI 8452660 41.50500 -71.32670Nantucket Island, MA 8449130 41.28500 -70.09670Menemsha Harbor, MA 8448725 41.35444 -70.76783
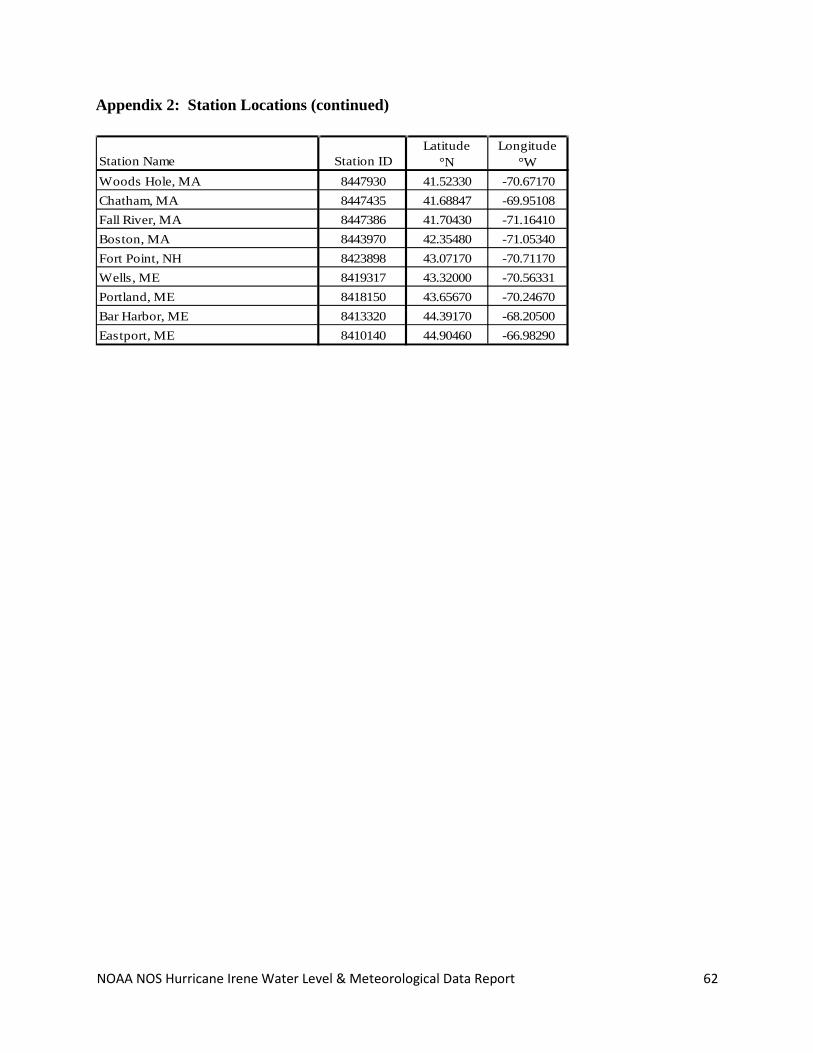
NOAA NOS Hurricane Irene Water Level & Meteorological Data Report 62
Appendix 2: Station Locations (continued)
Station Name Station IDLatitude
°NLongitude
°WWoods Hole, MA 8447930 41.52330 -70.67170Chatham, MA 8447435 41.68847 -69.95108Fall River, MA 8447386 41.70430 -71.16410Boston, MA 8443970 42.35480 -71.05340Fort Point, NH 8423898 43.07170 -70.71170Wells, ME 8419317 43.32000 -70.56331Portland, ME 8418150 43.65670 -70.24670Bar Harbor, ME 8413320 44.39170 -68.20500Eastport, ME 8410140 44.90460 -66.98290
NOAA NOS Hurricane Irene Water Level & Meteorological Data Report 63
Appendix 3: Definitions Excerpts From: Tide and Current Glossary, NOAA National Ocean Service, Silver Spring, MD, 2000 (http://www.tidesandcurrents.noaa.gov/publications/glossary2.pdf), Tidal Datums homepage (http://www.tidesandcurrents.noaa.gov/datum_options.html) and the Storm QuickLook Frequently Asked Questions homepage (http://www.tidesandcurrents.noaa.gov/quicklook_faqs.shtml) Bench mark (BM): A fixed physical object or mark used as reference for a horizontal or vertical datum. A tidal bench mark is one near a tide station to which the tide staff and tidal datums are referred. A primary bench mark is the principal mark of a group of tidal bench marks to which the tide staff and tidal datums are referred. Chart datum: The datum to which soundings on a chart are referred. It is usually taken to correspond to a low-water elevation, and its depression below mean sea level is represented by the symbol Z. Since 1980, chart datum has been implemented to mean lower low water for all marine waters of the United States, its territories, Commonwealth of Puerto Rico, and Trust Territory of the Pacific Islands. Datum (vertical): For marine applications, a base elevation used as a reference from which to reckon heights or depths. It is called a tidal datum when defined in terms of a certain phase of the tide. Tidal datums are local datums and should not be extended into areas which have differing hydrographic char-acteristics without substantiating measurements. In order that they may be recovered when needed, such datums are referenced to fixed points known as bench marks. See chart datum and bench marks. Geodetic datum: The NOAA National Geodetic Survey defines a geodetic datum as: "A set of constants used for calculating the coordinates of points on the Earth." In surveying and geodesy, a datum is a reference point on the earth's surface against which position measurements are made, and an associated model of the shape of the earth for computing positions. Horizontal datums are used for describing a point on the earth's surface, in latitude and longitude. Vertical datums are used to measure elevations or underwater depths. Highest Astronomical Tide (HAT): The elevation of the highest predicted astronomical tide expected to occur at a specific tide station over the National Tidal Datum Epoch. Historical Recorded Maximum Tide Level: The maximum tide elevation measured by a water level station with a continuous time series throughout a high tide cycle. A complete cycle is required to calculate the maximum tide elevation, using a best fit curve of the observations. These historical records may not have included the highest water levels measured at a station during an event if a complete high tide cycle was not measured due to station/sensor damage. See storm tides. Mean Lower Low Water (MLLW): A tidal datum. The average of the lower low water height of each tidal day observed over the National Tidal Datum Epoch. See National Tidal Datum Epoch. For stations with shorter series, comparison of simultaneous observations with a control tide station is made in order to derive the equivalent datum of the National Tidal Datum Epoch. Mean Higher High Water (MHHW): A tidal datum. The average of the higher high water height of each tidal day observed over the National Tidal Datum Epoch. For stations with shorter series, comparison of
NOAA NOS Hurricane Irene Water Level & Meteorological Data Report 64
simultaneous observations with a control tide station is made in order to derive the equivalent datum of the National Tidal Datum Epoch. Mean Sea Level (MSL): A tidal datum. The arithmetic mean of hourly heights observed over the National Tidal Datum Epoch. Shorter series are specified in the name; e.g. monthly mean sea level and yearly mean sea level. National Tidal Datum Epoch: The specific 19-year period adopted by the National Ocean Service as the official time segment over which tide observations are taken and reduced to obtain mean values (e.g., mean lower low water, etc.) for tidal datums. It is necessary for standardization because of periodic and apparent secular trends in sea level. The present National Tidal Datum Epoch is 1983 through 2001. It is reviewed annually for possible revision and must be actively considered for revision every 25 years. North American Vertical Datum of 1988 (NAVD 1988): A fixed reference for elevations determined by geodetic leveling. The datum was derived from a general adjustment of the first-order terrestrial leveling nets of the United States, Canada, and Mexico. In the adjustment, only the height of the primary tidal bench mark, referenced to the International Great Lakes Datum of 1985 (IGLD 1985) local mean sea level height value, at Father Point, Rimouski, Quebec, Canada was held fixed, thus providing minimum constraint. NAVD 1988 and IGLD 1985 are identical. However, NAVD 1988 bench mark values are given in Helmert orthometric height units while IGLD 1985 values are in dynamic heights. National Tidal Datum Epoch: The specific 19-year period adopted by the National Ocean Service as the official time segment over which tide observations are taken and reduced to obtain mean values (e.g., mean lower low water, etc.) for tidal datums. It is necessary for standardization because of periodic and apparent secular trends in sea level. The present NTDE is 1983 through 2001 and is actively considered for revision every 20-25 years. Tidal datums in certain regions with anomalous sea level changes (Alaska, Gulf of Mexico) are calculated on a Modified 5-Year Epoch. National Water Level Observation Network (NWLON): The network of tide and water level stations operated by the National Ocean Service along the marine and Great Lakes coasts and islands of the United States. Neap tides: Tides of decreased range occurring semimonthly as the result of the Moon being in quadrature (first or last quarters). Non-tidal: Water levels may be classified as tidal or non-tidal. Water bodies with little or no range in tide and where the rise and fall of the water surface can no longer be practically measured in a predictable rhythm due to masking of the tide by hydrologic, wind, or other effects are non-tidal. Range of tide: The difference in height between consecutive high and low waters. The mean range is the difference in height between mean high water and mean low water. The great diurnal range or diurnal range is the difference in height between mean higher high water and mean lower low water. For other ranges see spring, neap, perigean, apogean, and tropic tides; and tropic ranges. Tide: The periodic rise and fall of a body of water resulting from gravitational interactions between Sun, Moon, and Earth. The vertical component of the particulate motion of a tidal wave. Same as astronomic tide.
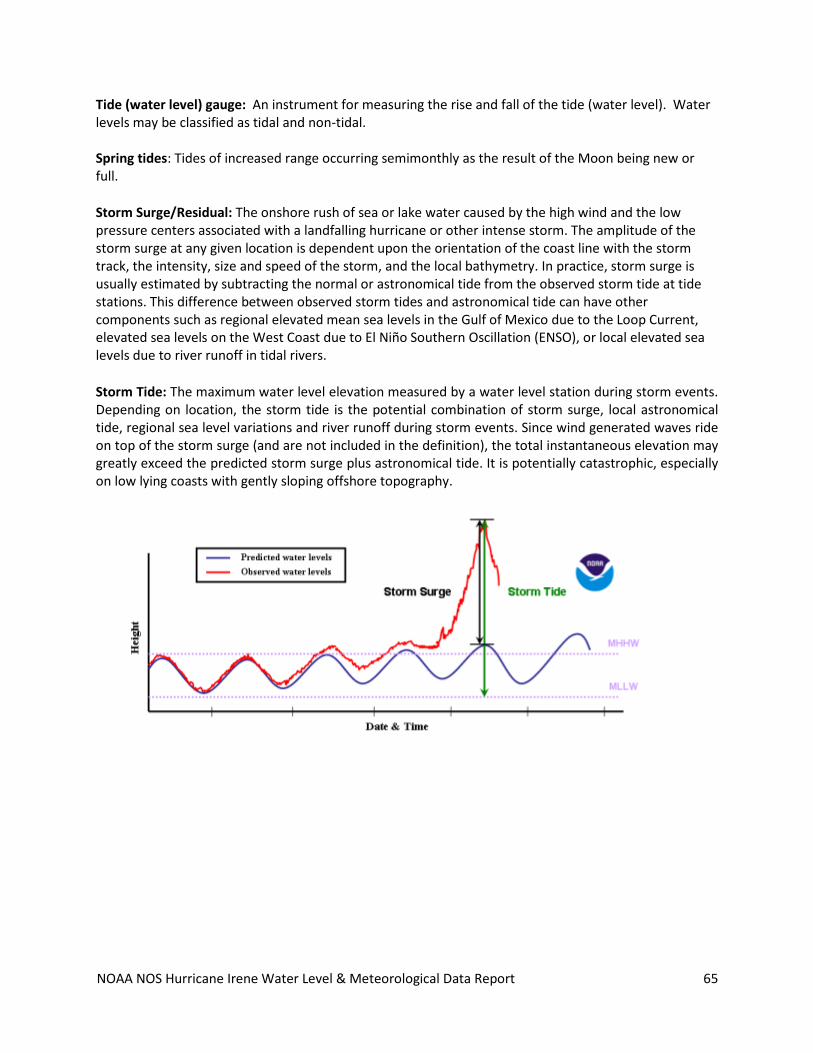
NOAA NOS Hurricane Irene Water Level & Meteorological Data Report 65
Tide (water level) gauge: An instrument for measuring the rise and fall of the tide (water level). Water levels may be classified as tidal and non-tidal. Spring tides: Tides of increased range occurring semimonthly as the result of the Moon being new or full.
Storm Surge/Residual: The onshore rush of sea or lake water caused by the high wind and the low pressure centers associated with a landfalling hurricane or other intense storm. The amplitude of the storm surge at any given location is dependent upon the orientation of the coast line with the storm track, the intensity, size and speed of the storm, and the local bathymetry. In practice, storm surge is usually estimated by subtracting the normal or astronomical tide from the observed storm tide at tide stations. This difference between observed storm tides and astronomical tide can have other components such as regional elevated mean sea levels in the Gulf of Mexico due to the Loop Current, elevated sea levels on the West Coast due to El Niño Southern Oscillation (ENSO), or local elevated sea levels due to river runoff in tidal rivers.
Storm Tide: The maximum water level elevation measured by a water level station during storm events. Depending on location, the storm tide is the potential combination of storm surge, local astronomical tide, regional sea level variations and river runoff during storm events. Since wind generated waves ride on top of the storm surge (and are not included in the definition), the total instantaneous elevation may greatly exceed the predicted storm surge plus astronomical tide. It is potentially catastrophic, especially on low lying coasts with gently sloping offshore topography.
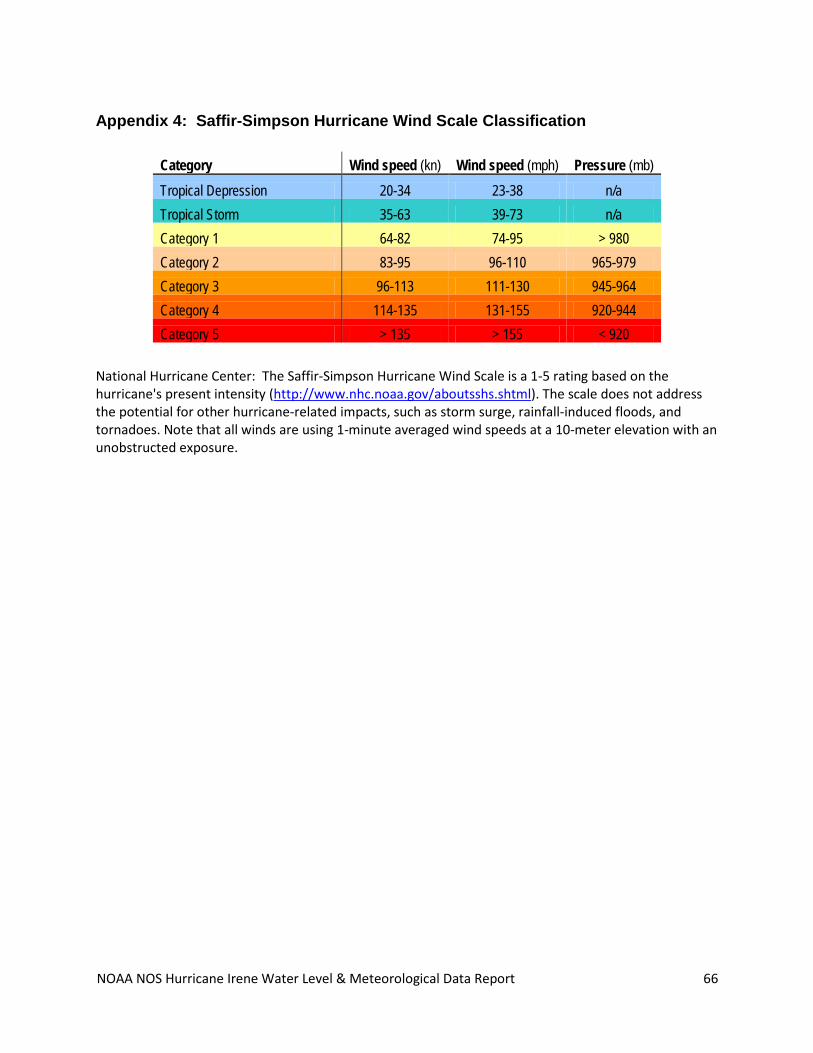
NOAA NOS Hurricane Irene Water Level & Meteorological Data Report 66
Appendix 4: Saffir-Simpson Hurricane Wind Scale Classification
Category Wind speed (kn) Wind speed (mph) Pressure (mb) Tropical Depression 20-34 23-38 n/a Tropical Storm 35-63 39-73 n/a Category 1 64-82 74-95 > 980 Category 2 83-95 96-110 965-979 Category 3 96-113 111-130 945-964 Category 4 114-135 131-155 920-944 Category 5 > 135 > 155 < 920
National Hurricane Center: The Saffir-Simpson Hurricane Wind Scale is a 1-5 rating based on the hurricane's present intensity (http://www.nhc.noaa.gov/aboutsshs.shtml). The scale does not address the potential for other hurricane-related impacts, such as storm surge, rainfall-induced floods, and tornadoes. Note that all winds are using 1-minute averaged wind speeds at a 10-meter elevation with an unobstructed exposure.
Related Documents