Human Migration, Settlement Patterns and Population Distribution Project Introduc)on: In this human geography exercise you, the students, will be learning about popula)on distribu)on and density by using various maps and Earth at night photos. You will learn about the three different se+lement pa+erns : sca$ered, linear and clustered and what causes these types of popula)on pa?erns. You will learn about human migra)on to Canada's three major ci)es, Toronto, Montreal and Vancouver, and its causes. You will research their own city to understand how migra)on and other factors contributed to the city's birth and growth. You will also analyze these migra)on pa?erns and predict future trends by using the informa)on found on the web and by working with a partner. You will create a )meline of your family's or personal migra)on pa?erns.

Welcome message from author
This document is posted to help you gain knowledge. Please leave a comment to let me know what you think about it! Share it to your friends and learn new things together.
Transcript

Human Migration, Settlement Patterns and Population Distribution Project
Introduc)on:
In this human geography exercise you, the students, will be learning about popula)on distribu)on and density by using various maps and Earth at night photos.
You will learn about the three different se+lement pa+erns: sca$ered, linear and clustered and what causes these types of popula)on pa?erns.
You will learn about human migra)on to Canada's three major ci)es, Toronto, Montreal and Vancouver, and its causes.
You will research their own city to understand how migra)on and other factors contributed to the city's birth and growth.
You will also analyze these migra)on pa?erns and predict future trends by using the informa)on found on the web and by working with a partner.
You will create a )meline of your family's or personal migra)on pa?erns.
Task 1. Using the links to maps and photos (some provided) you will identify areas of different population settlement and distribution around the world. Students will use the Earth at Night photos to identify the three different settlement patterns and the reasons behind these patterns.
2. Identify the major immigration trends for Canada's three major cities and your own city and predict future trends based on these numbers. Identify push and pull factors which contributed to the growth of these cities.
3. Plot the population distribution of Ontario and explain the reasons for these patterns.
4.Create a timeline tracking your migration or your family's migration patterns around the world or within Canada.
Process Process 1:
Using the map found on http://www.nightearth.com/and the full picture at http://www.realfuture.org/wordpress/wp-content/uploads/2009/05/earth_at_night.jpg answer the following questions:
Individually:
1) Find two areas of linear settlement patterns.
2) Find two areas of clustered settlement patterns.
3) Find two areas of scattered settlement patterns.
4) What two countries with the highest population densities and what two countries with the lowest population densities?
With a partner:
5) Explain why the continent of North America is much more lit up than Africa while Africa has a higher population?

Note: Word process your answers using Microsoft WORD, Apple’s PAGES, or word perfect.
Using the following links students will come to understand the major immigration trends of Canada's three major cities.
Students will then be required to discover the trends for the city they reside in.
Students will then predict reasons for possible settlement in these major cities and future trends for Canada.
Use these links to answer the following questions:
http://www.cbc.ca/news/background/immigration/patterns.html
http://www.cbc.ca/canada/story/2007/03/13/census-canada.html
Individually:
1) What are the three most populous cities in Canada and between the years 2001-2006 how many immigrants entered these cities?
2) Name the top two countries that are the source for immigrants to these major cities?

3) What percentage of immigrants from t6he years 2001-2006 were schoolchildren? Explain this for each city.
4) What are immigration trends for your city and why do you think people settled there?
As a group of three:
5) Explain why the top five countries for sources of immigrants have changed between the years 1981 and 2001?
6) Identify possible push and pull factors that contributed to the settlement and growth of these major cities.
7) Predict future trends of immigration to Canada.
Note: Word process your answers using Microsoft WORD, Apple’s PAGES, or word perfect.
Task 1:
Individually:
Using the second link provided plot the population density of Ontario on the map provided through the first link.
http://rapidshare.com/files/337869036/popmap.jpg.html
http://atlas.nrcan.gc.ca/site/english/maps/peopleandsociety/population/population1996/density
Note: Make sure the colors of your legend and map match.
Answer the following questions with a partner:
1) Explain why southern Ontario is much more densely populated than northern Ontario?
2) Why is the area around the great lakes much more densely populated than the interior of Ontario?

3) Do you feel that the population distribution of Ontario will remain the same in years to come? Why or why not?
Task 2:
Individually:
Create a time line of your family's migration patterns. If you can find information you can date it back as far as you like, if not you can simply track the
movement of your family around Ontario or Canada if you have moved. For each move state possible reasons why your family may have left that area and chose their new destination. You must have a minimum of three different movements for your time line and at least one push and pull factor for each.
Note: Word process your answers using Microsoft word or word perfect.
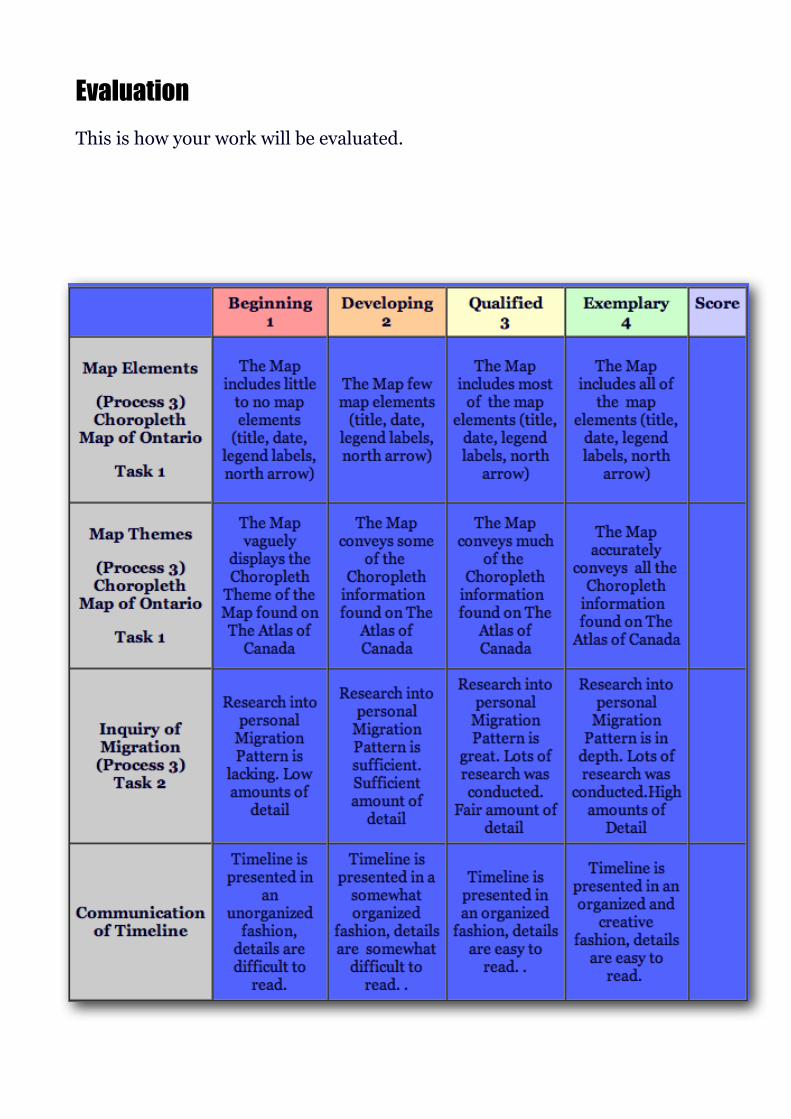
EvaluationThis is how your work will be evaluated.

ConclusionCongratulations!!
You have just completed all the stages.
You have looked at the different types of settlement patterns, and now understand how and why these patterns are developed. You have looked at the most populated cities in Canada and the people who live there. By completing the web quest you now understand why people emigrate and why they come to these particular cities. You have also looked at your own city of residence and your own personal migration patterns and stories, hopefully learning something about yourself along the way. Lastly, you have created a map of Ontario's population distribution and developed a timeline of your own personal migration/movements around the country or world. By using this information you have also attempted to predict future human settlement and migration patterns which will greatly affect the world.
You have sure come a long way!
We hope this exercise has taught you a little more about people, places, patterns and yourself!
So where to go from here?
Upon completion of this project, you now have an understanding of human settlement, migration and the population patterns and distribution that result. Human patterns greatly affect the world and change its dynamics. After this lesson we would move onto topics about resource management and how the human environment affects the physical environment. We would discuss these affects and assess our use of resources and how these resources are used around the world. This web quest would essentially lead into the idea of managing change, the idea of carrying capacity and sustainability.
Take a look at these websites:
http://www.nrcan.gc.ca/com/index-eng.php
http://www.abheritage.ca/abnature/environmental/humans_enviro.htm
http://www.conferenceboard.ca/topics/humanresource/default.aspx

Geography Quiz and Game Sites:
http://www.geochallenge.ca/geochallenge/quiz_yourself/
http://www.syvum.com/squizzes/geography/
http://www.sheppardsoftware.com/Geography.htm
--------------------------------------------------------------------------------
Teacher Introduction This project was designed to educate students with knowledge on human patterns in geography, namely immigration and settlement patterns. This is divided up into three processes. In the first process students are to look at patterns in settlement: linear, scattered and clustered, identify them in various photos and explain why these different patterns exist. In the second process, students are to look at census data to discover which cities in Canada have the highest population and think of reasons why. They must identify different push and pull factors and identify which countries have the highest rates of emigration to Canada. In the final process students are to look at and create a map of the population distribution of Ontario based on census data of Ontario. Students must also create a personal timeline of when their family moved to Canada or if they do not have that information they can make a timeline of their own movements around Canada. The students will also attempt to predict future emigration and settlement patterns. This lesson teaches students about the different settlement patterns, population distribution of Ontario and migration but also proivdes them with something tangible (the map and timeline) in which they can refer to afterwards. The students will discuss trends and predict future ones which will help lead into different geography topics such as resources, human use and management, and the affect these human patterns have on the environement. The lesson also has elements in which the students must find information about themselves. This personal aspect with make the lesson more relatable and meaningful for the students.
The content and activities are in compliance with Ontario Curriculum Geography unit, under the strands of Patterns in Human Geography and Migration.

Since this is neither an academic or applied class there will be many different learners that will work at different levels. Because of this the webquest may have to be altered to meet the needs of these various learners. Some ways that the lesson could be differentiated include: more time per process, answering all questions with a partner, the amount of teacher facilitation, etc.
Standards:
Overall Expectations
• Identify the main patterns of human settlement and identify the factors that influence population distribution and land use;
Specific Expectations
• identify the three main patterns of human settlement- linear, scattered, and clustered;
• compare the characteristics of of places with high and low population densities;
• produce and interpret simple scatter graphs to determine the correlation between population characteristics
• identify and explain the factors affecting population distribution (immigration trends and patterns)
Related Documents