http://www.ece.rice.edu/networks Huirong Fu and Edward W. Knightly Rice Networks Group Aggregation and Scalable QoS: A Performance Study

Http:// Huirong Fu and Edward W. Knightly Rice Networks Group Aggregation and Scalable QoS: A Performance Study.
Jan 03, 2016
Welcome message from author
This document is posted to help you gain knowledge. Please leave a comment to let me know what you think about it! Share it to your friends and learn new things together.
Transcript

http://www.ece.rice.edu/networks
Huirong Fu and Edward W. KnightlyRice Networks Group
Aggregation and Scalable QoS: A Performance Study
Edward W. Knightly
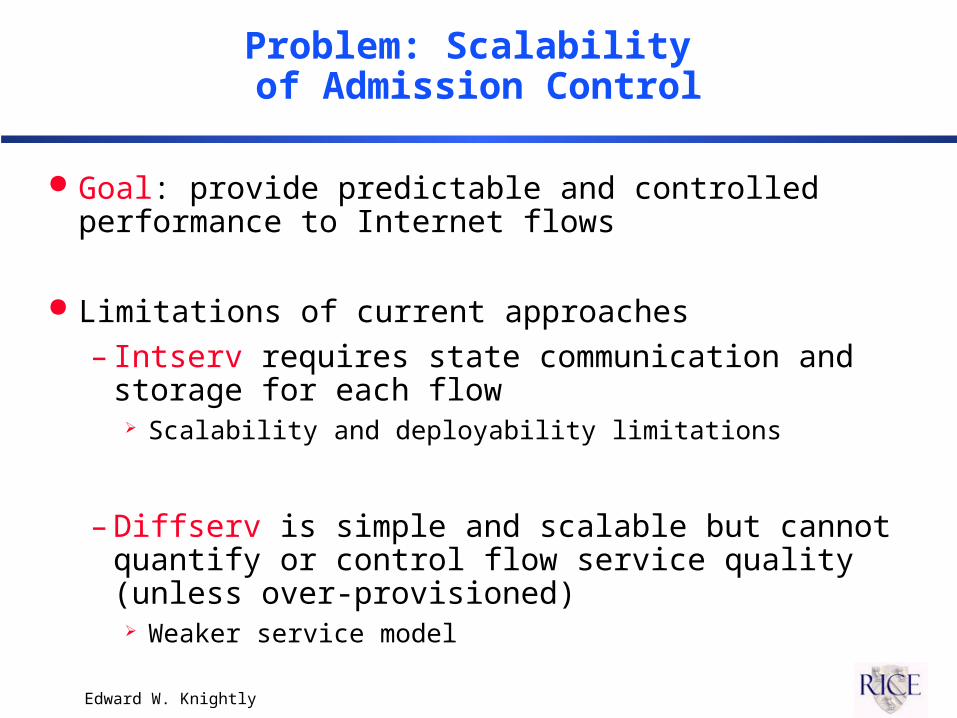
Problem: Scalability of Admission Control
Goal: provide predictable and controlled performance to Internet flows
Limitations of current approaches
– Intserv requires state communication and storage for each flow Scalability and deployability limitations
– Diffserv is simple and scalable but cannot quantify or control flow service quality (unless over-provisioned) Weaker service model

Edward W. Knightly
Can We Simultaneously Achieve ...?
High utilization
Scalability (not micro-managing flows)
Strong service model (e.g., suitable for VOIP)
– Internet (YYN)– Phone Network (NNY)– Intserv/ATM (YNY)– Diffserv (YYN)
Edward W. Knightly
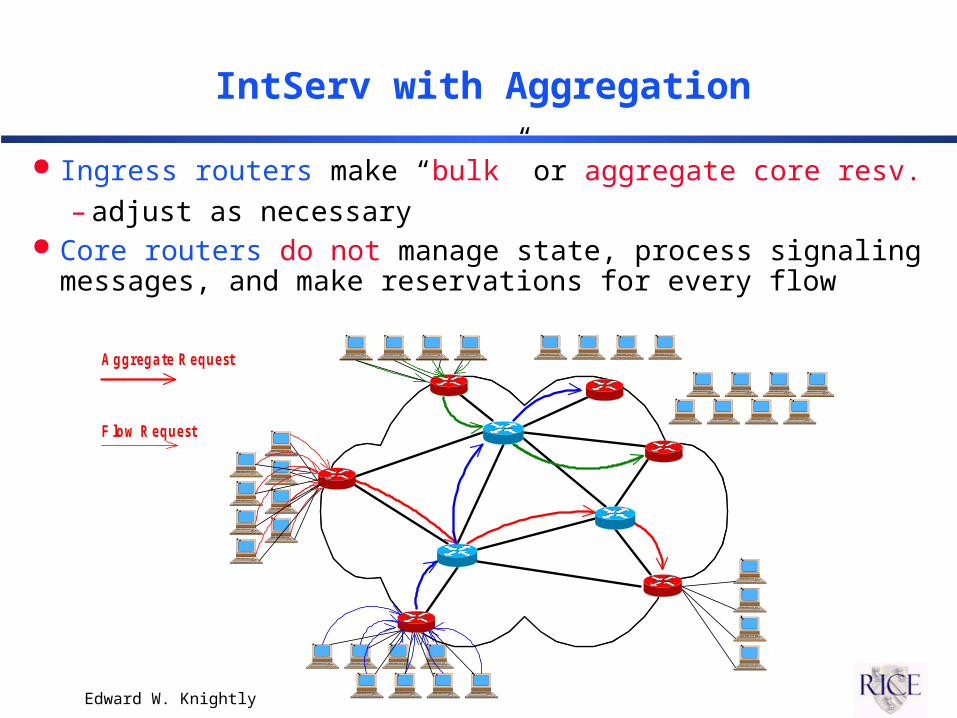
IntServ with Aggregation
Ingress routers make “bulk” or aggregate core resv. – adjust as necessary
Core routers do not manage state, process signaling messages, and make reservations for every flow
A g g re g a te R e que st
F lo w R e que st
Edward W. Knightly
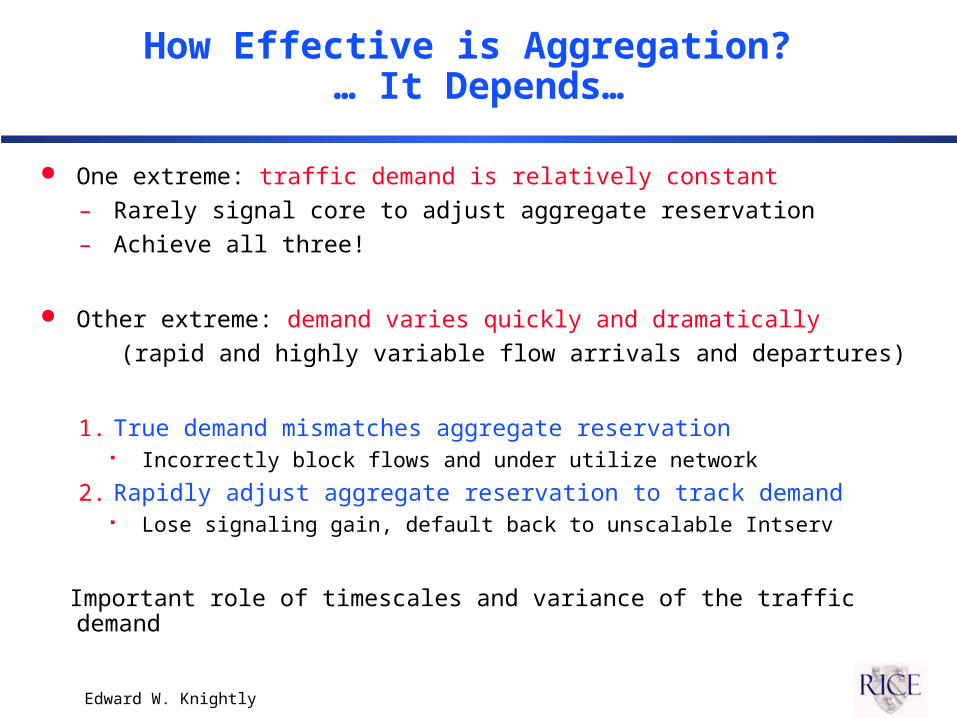
How Effective is Aggregation? … It Depends…
One extreme: traffic demand is relatively constant– Rarely signal core to adjust aggregate reservation– Achieve all three!
Other extreme: demand varies quickly and dramatically
(rapid and highly variable flow arrivals and departures)
1. True demand mismatches aggregate reservation Incorrectly block flows and under utilize network
2. Rapidly adjust aggregate reservation to track demand Lose signaling gain, default back to unscalable Intserv
Important role of timescales and variance of the traffic demand
Edward W. Knightly
Outline
Simple traffic and theoretical model to study aggregation
Validation and basic conclusions on timescales and variance
Remove assumptions of the basic model via simulations– Other primary demand functions– Correlation in secondary demand (multi-scale)
Trace driven simulations– Model validation– Insights into more realistic scenarios
Goal:devise framework to understand perf. of aggregation
Edward W. Knightly
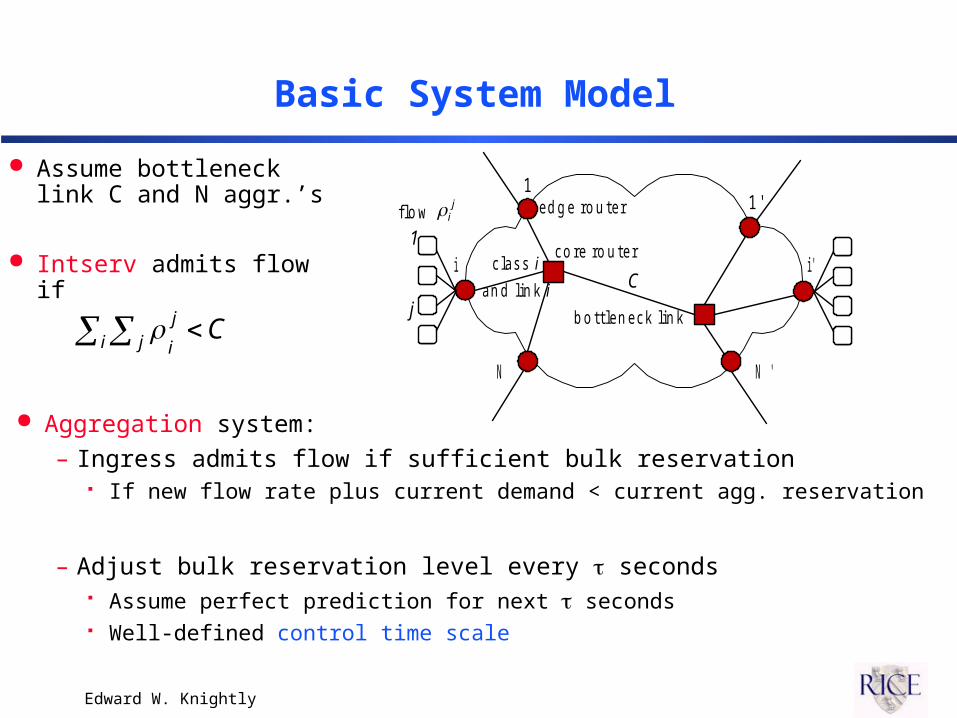
Basic System Model
Aggregation system:– Ingress admits flow if sufficient bulk reservation
If new flow rate plus current demand < current agg. reservation
– Adjust bulk reservation level every seconds Assume perfect prediction for next seconds Well-defined control time scale
Assume bottleneck link C and N aggr.’s
Intserv admits flow if Ci i'
N 'N
j
11 '
1
e d g e ro u t e r
c o re ro u t e r
b o t t le n e c k lin k
flo wj
i
a n d lin k i
c la s s i
Cj
ii j
Edward W. Knightly
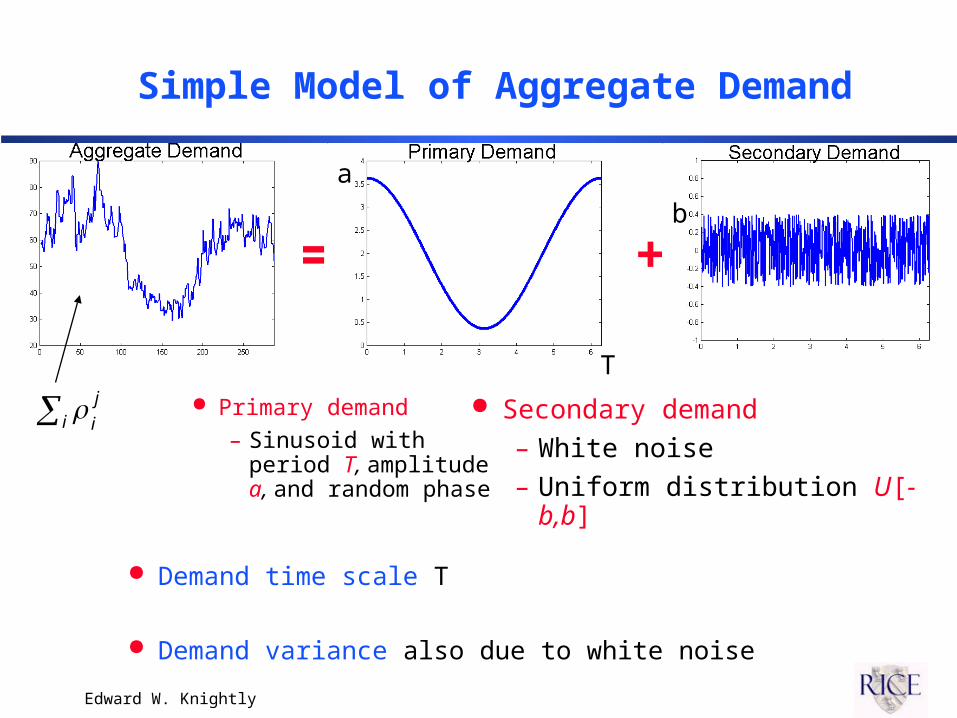
Simple Model of Aggregate Demand
Primary demand– Sinusoid with period
T, amplitude a, and random phase
Secondary demand– White noise– Uniform distribution U[-b,b]
+=
Demand time scale T
Demand variance also due to white noise
j
ii
a
b
T
Edward W. Knightly
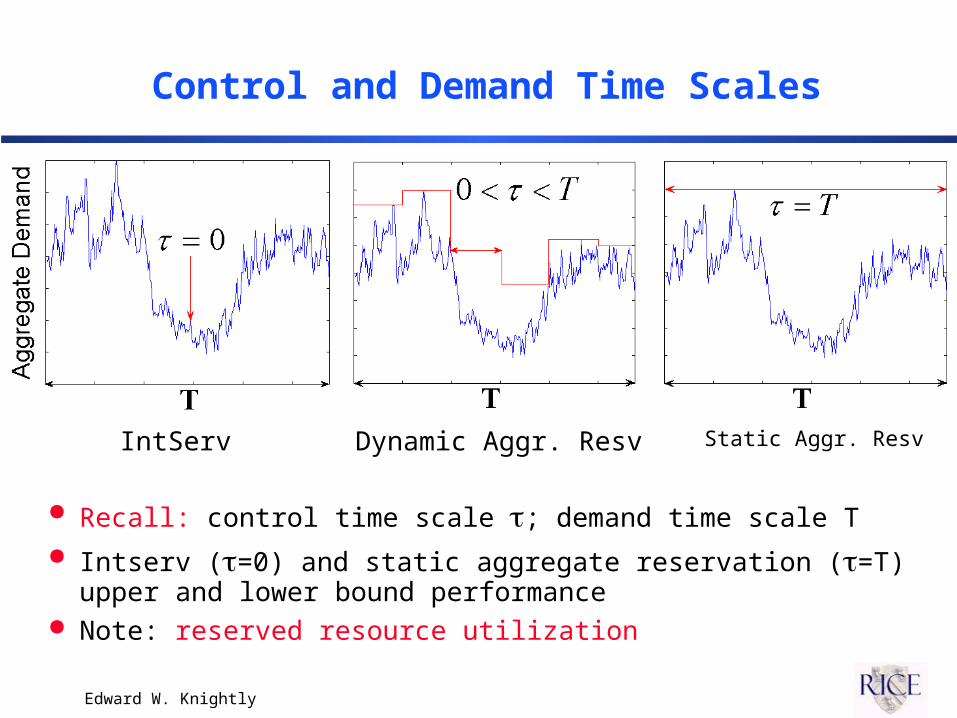
Control and Demand Time Scales
IntServ Static Aggr. ResvDynamic Aggr. Resv
Recall: control time scale ; demand time scale T Intserv (=0) and static aggregate reservation (=T) upper
and lower bound performance Note: reserved resource utilization
Edward W. Knightly
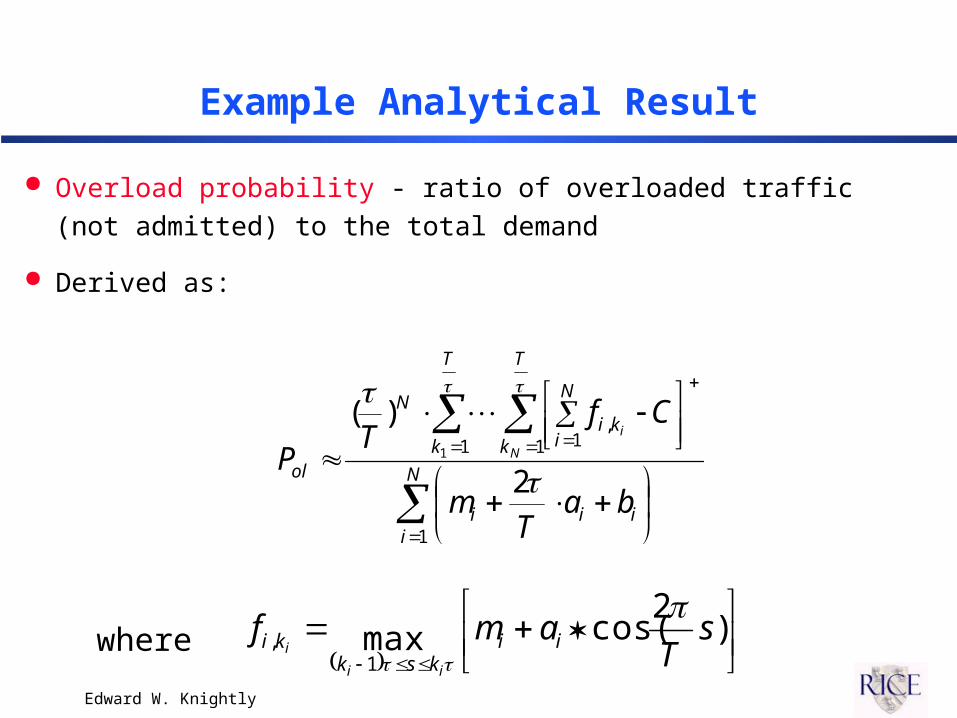
Example Analytical Result
Overload probability - ratio of overloaded traffic (not admitted) to the total demand
Derived as:
N
iiii
T
k
T
k
N
iki
N
ol
baT
m
CfT
P N
i
1
1 1 1,
2
)(1
where
)2
cos(max1
, sT
amf iiksk
ki
ii
i
Edward W. Knightly
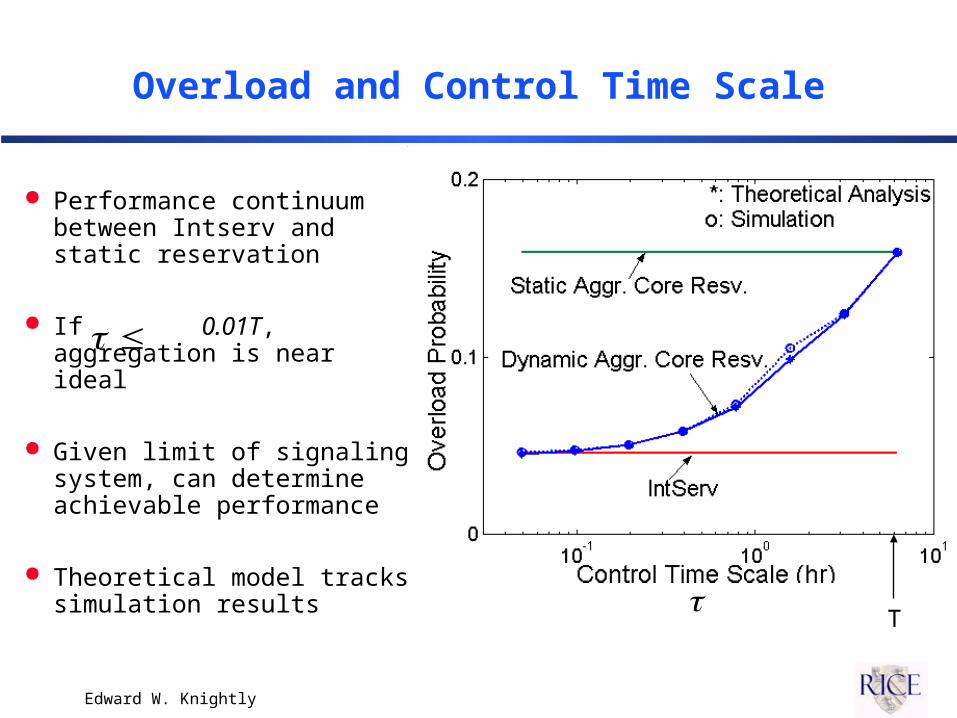
Overload and Control Time Scale
Performance continuum between Intserv and static reservation
If 0.01T, aggregation is near ideal
Given limit of signaling system, can determine achievable performance
Theoretical model tracks simulation results
T
Edward W. Knightly
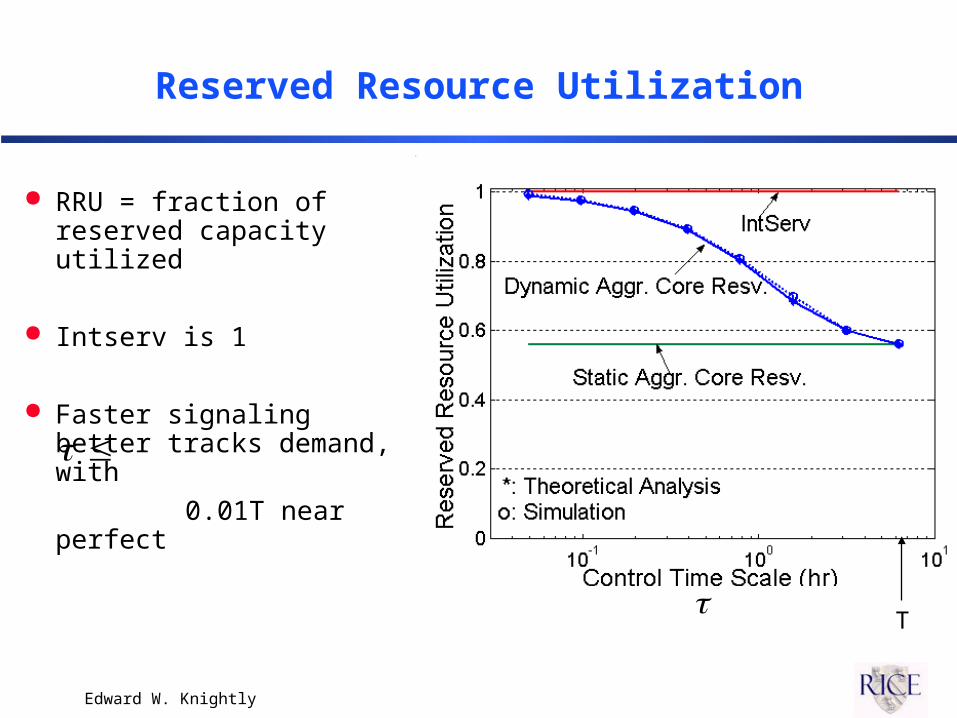
Reserved Resource Utilization
RRU = fraction of reserved capacity utilized
Intserv is 1
Faster signaling better tracks demand, with
0.01T near perfect
T
Edward W. Knightly
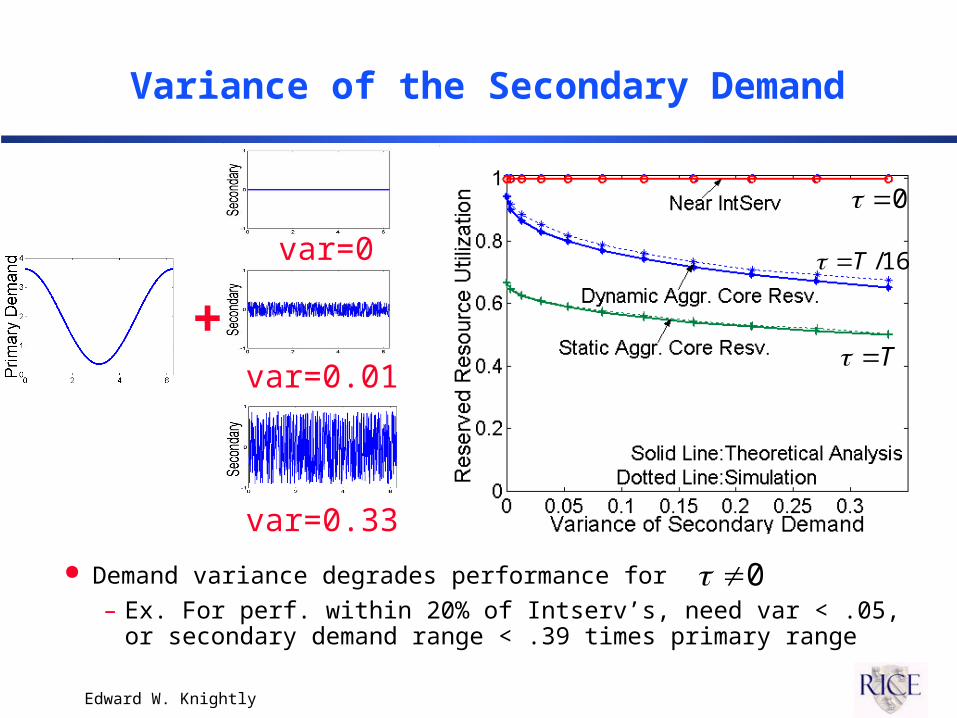
Variance of the Secondary Demand
Demand variance degrades performance for– Ex. For perf. within 20% of Intserv’s, need var < .05, or
secondary demand range < .39 times primary range
16/T
T
var=0
var=0.01
var=0.33
+
0
0
Edward W. Knightly
Outline
Simple traffic and theoretical model to study aggregation
Validation and basic conclusions on timescales and variance
Remove assumptions of the basic model via simulations– Other primary demand functions– Correlation in secondary demand (multi-scale)
Trace driven simulations– Model validation– Insights into more realistic scenarios
Goal:devise framework to understand perf. of aggregation
Edward W. Knightly
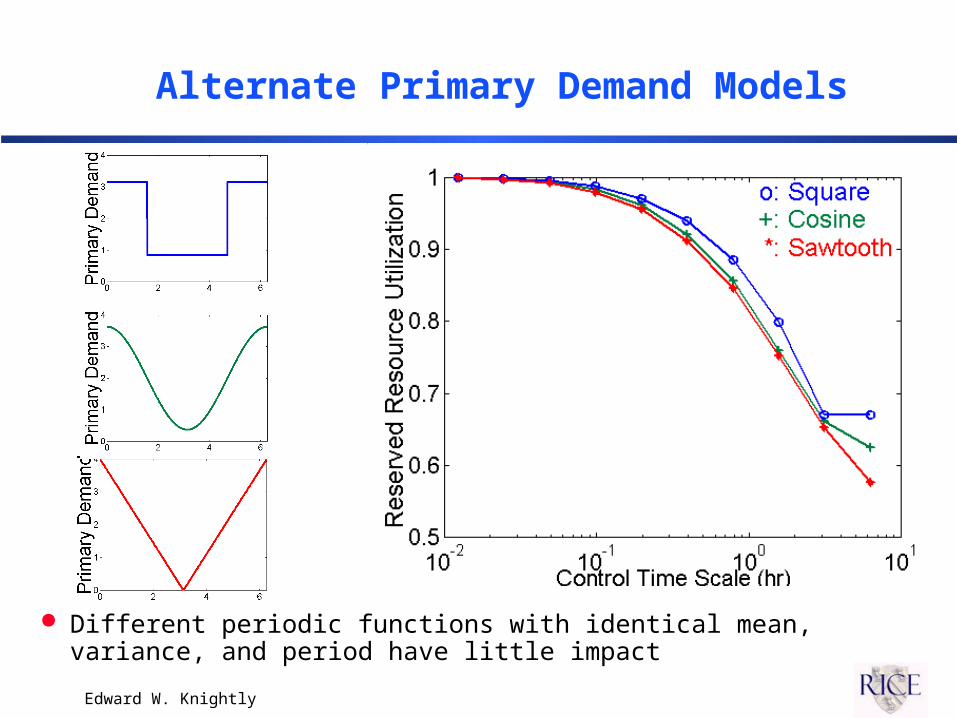
Alternate Primary Demand Models
Different periodic functions with identical mean, variance, and period have little impact
Edward W. Knightly
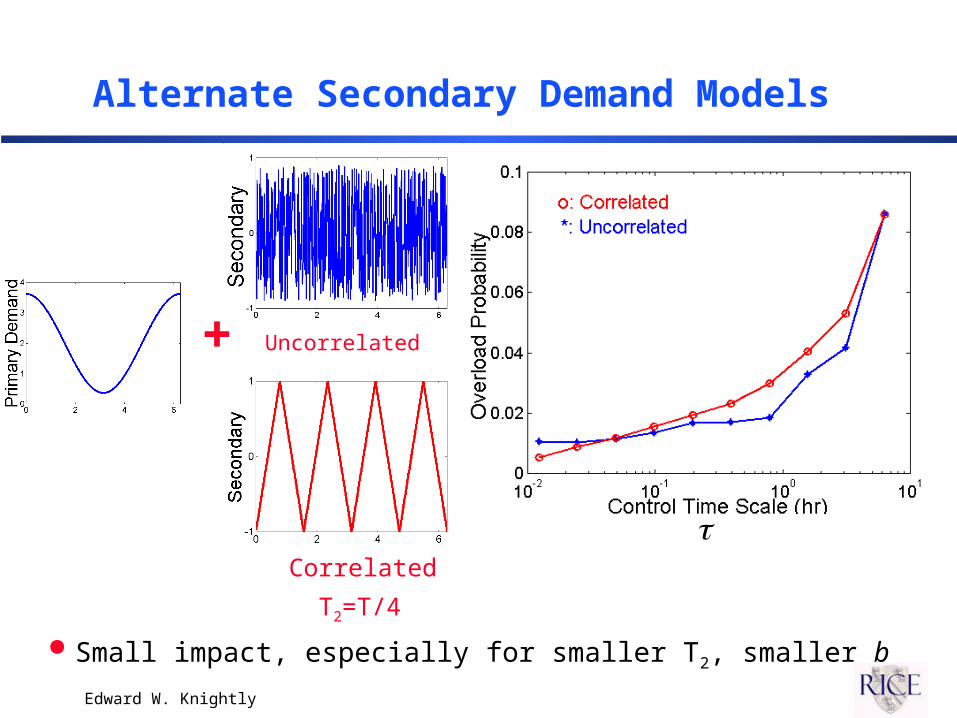
Alternate Secondary Demand Models
Small impact, especially for smaller T2, smaller b
Uncorrelated
Correlated
T2=T/4
+
Edward W. Knightly
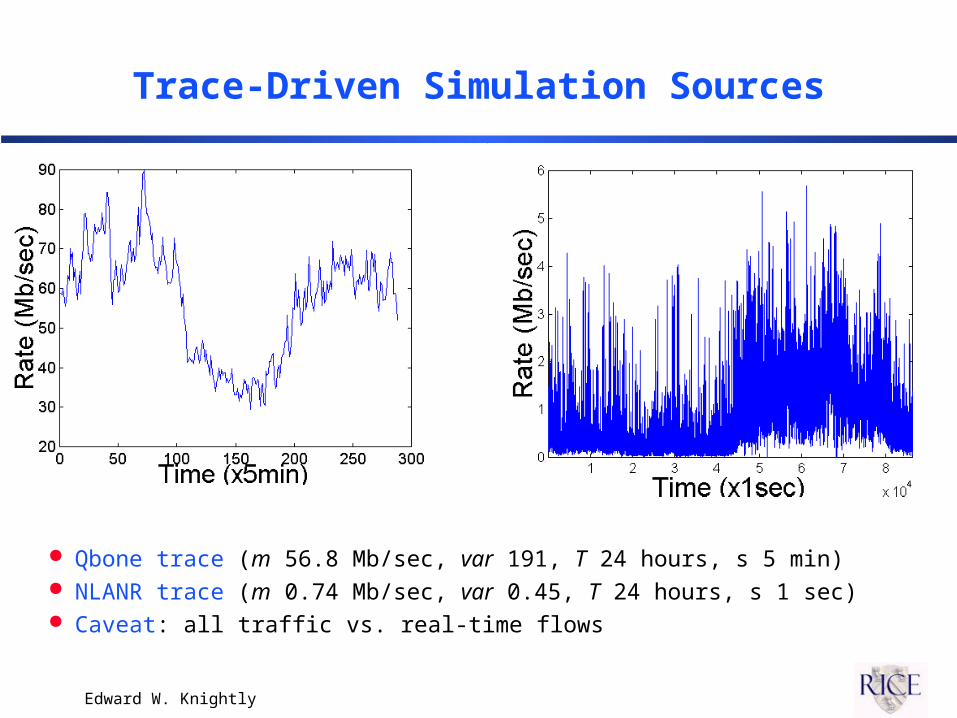
Trace-Driven Simulation Sources
Qbone trace (m 56.8 Mb/sec, var 191, T 24 hours, s 5 min) NLANR trace (m 0.74 Mb/sec, var 0.45, T 24 hours, s 1 sec) Caveat: all traffic vs. real-time flows
Edward W. Knightly
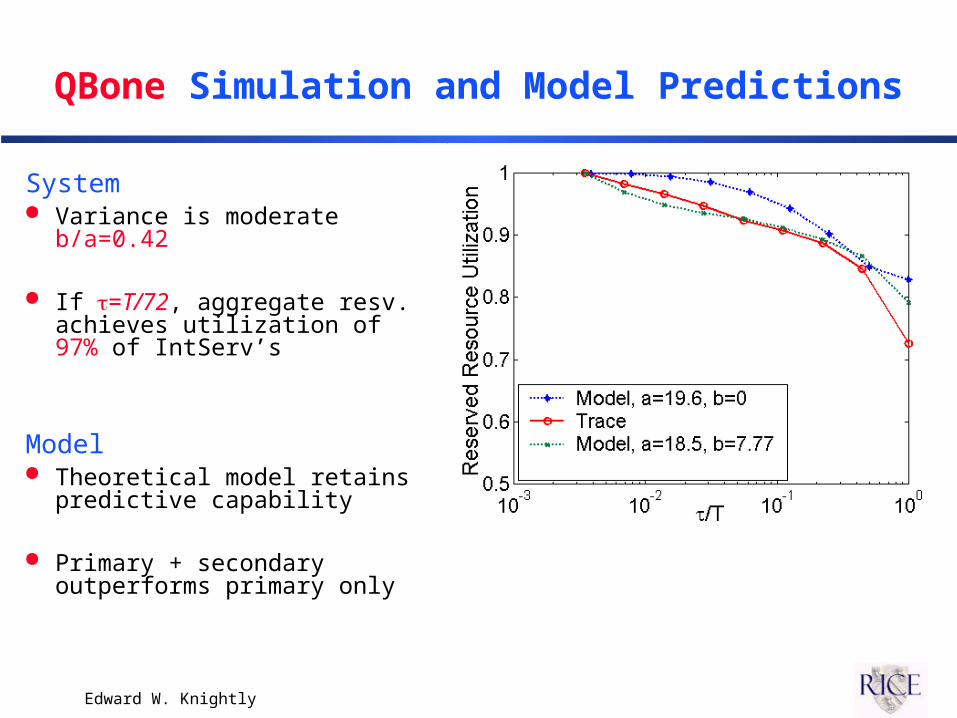
QBone Simulation and Model Predictions
System Variance is moderate
b/a=0.42
If =T/72, aggregate resv. achieves utilization of 97% of IntServ’s
Model Theoretical model retains
predictive capability
Primary + secondary outperforms primary only
Edward W. Knightly
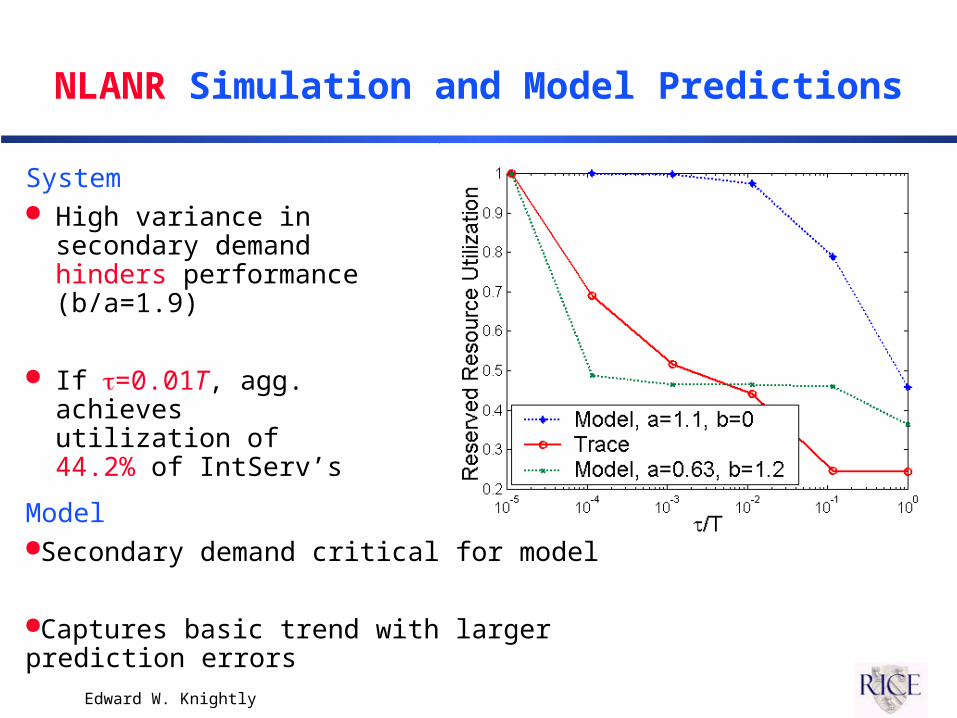
NLANR Simulation and Model Predictions
System High variance in
secondary demand hinders performance (b/a=1.9)
If =0.01T, agg. achieves utilization of 44.2% of IntServ’s
ModelSecondary demand critical for model
Captures basic trend with larger prediction errors
Edward W. Knightly
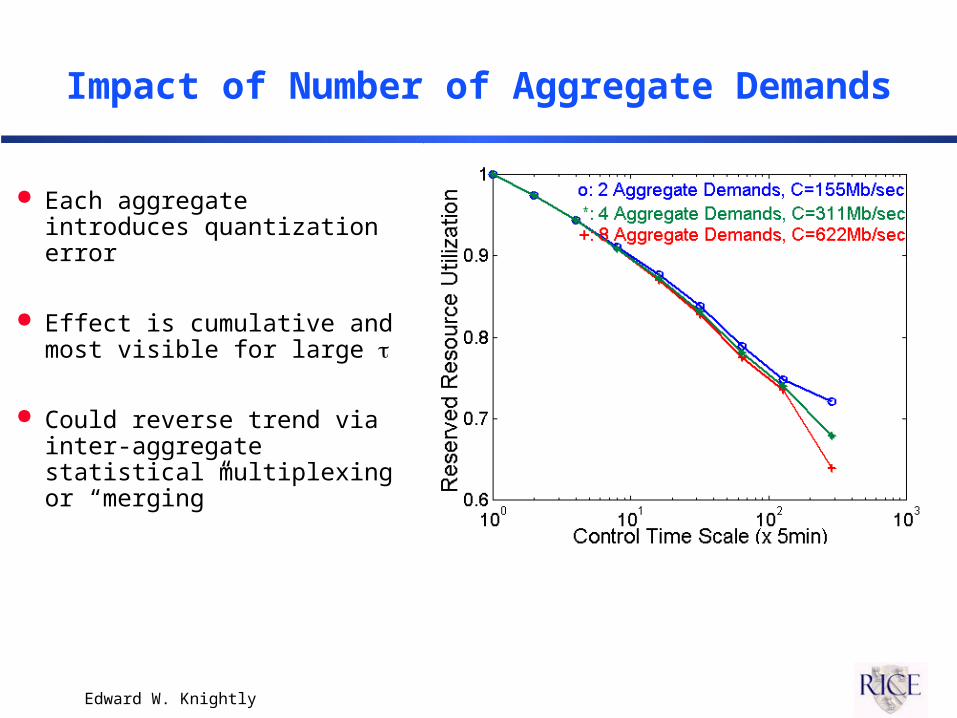
Impact of Number of Aggregate Demands
Each aggregate introduces quantization error
Effect is cumulative and most visible for large
Could reverse trend via inter-aggregate statistical multiplexing or “merging”
Edward W. Knightly
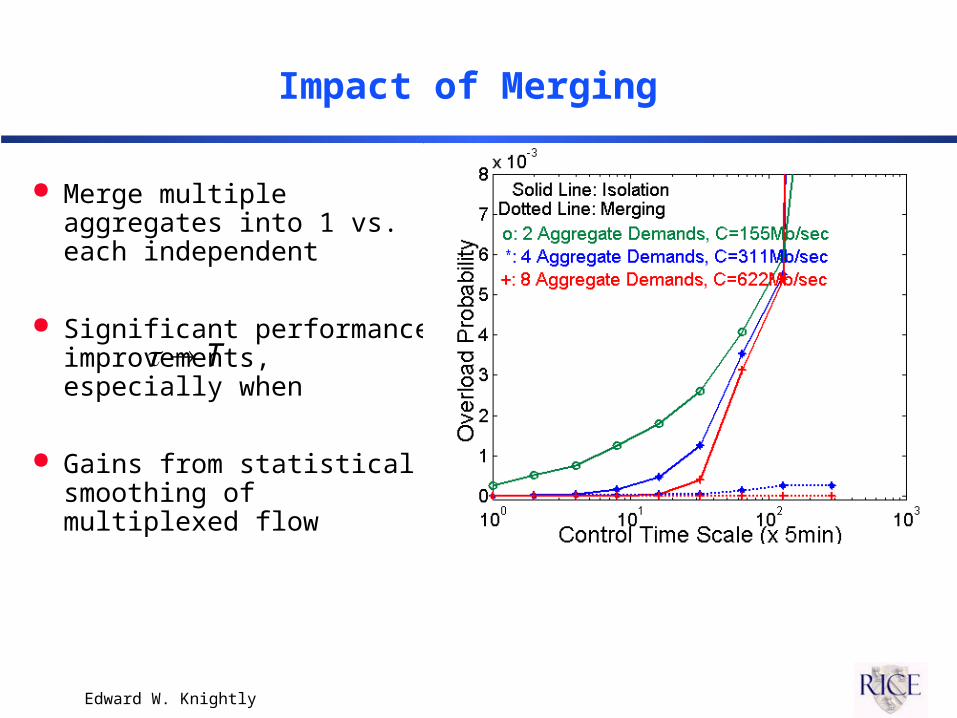
Impact of Merging
Merge multiple aggregates into 1 vs. each independent
Significant performance improvements, especially when
Gains from statistical smoothing of multiplexed flow
T
Edward W. Knightly
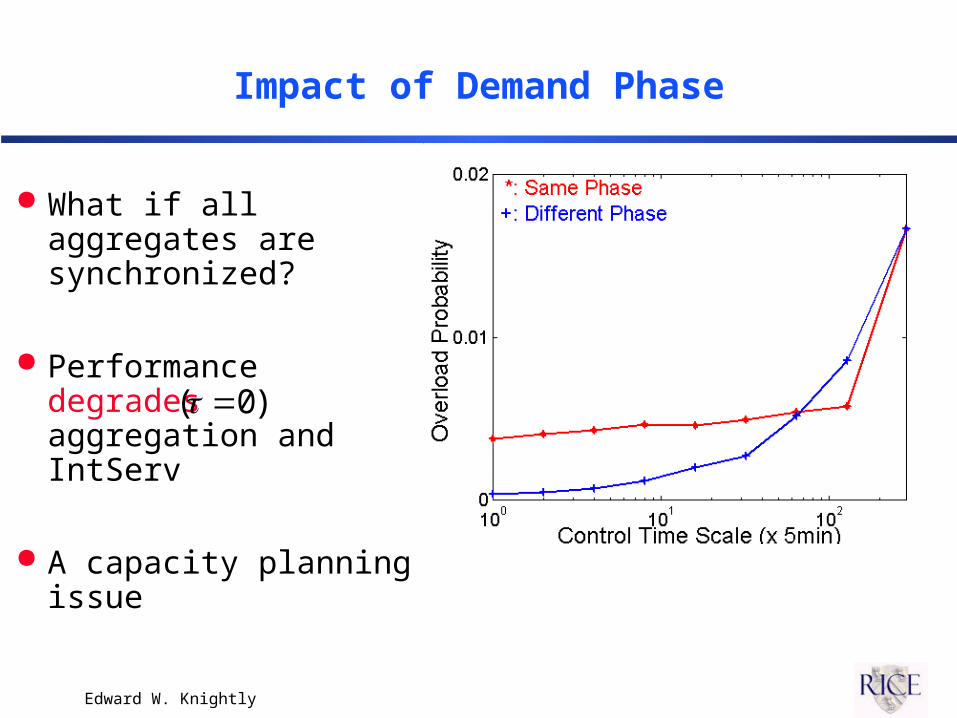
Impact of Demand Phase
What if all aggregates are synchronized?
Performance degrades aggregation and IntServ
A capacity planning issue
)0(
Edward W. Knightly
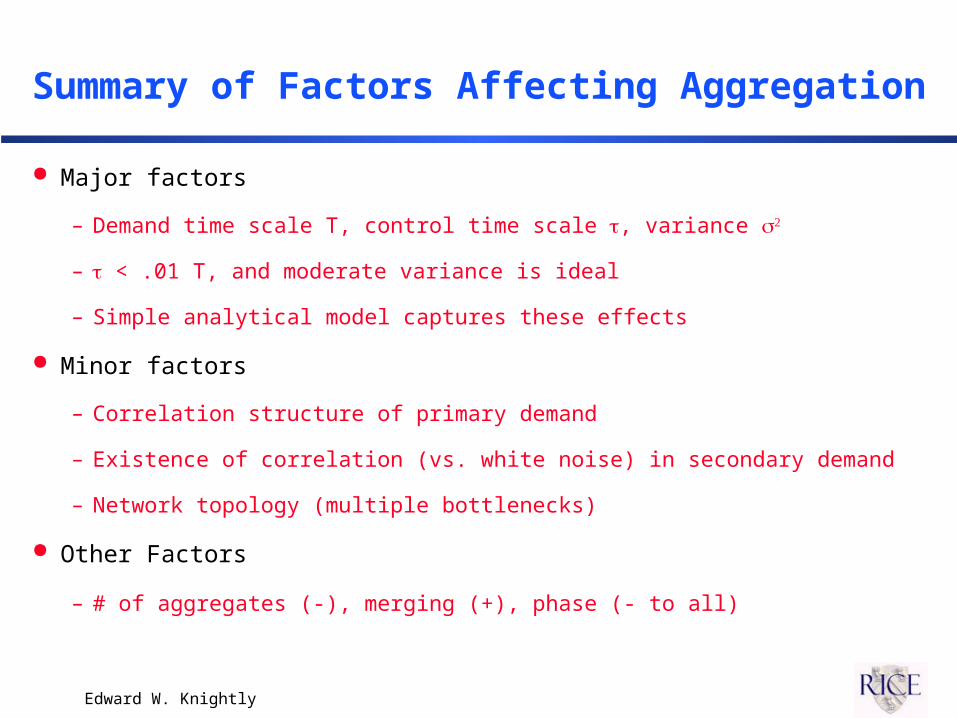
Summary of Factors Affecting Aggregation
Major factors
– Demand time scale T, control time scale , variance
– < .01 T, and moderate variance is ideal
– Simple analytical model captures these effects
Minor factors
– Correlation structure of primary demand
– Existence of correlation (vs. white noise) in secondary demand
– Network topology (multiple bottlenecks)
Other Factors
– # of aggregates (-), merging (+), phase (- to all)
Edward W. Knightly
Conclusions
Proposed a simple model for aggregate traffic
Derived closed-form expressions for the system’s key performance metrics
Provide a methodology to determine the regime under which aggregation is an accurate and high-performance mechanism
http://www.ece.rice.edu/networks
Edward W. Knightly
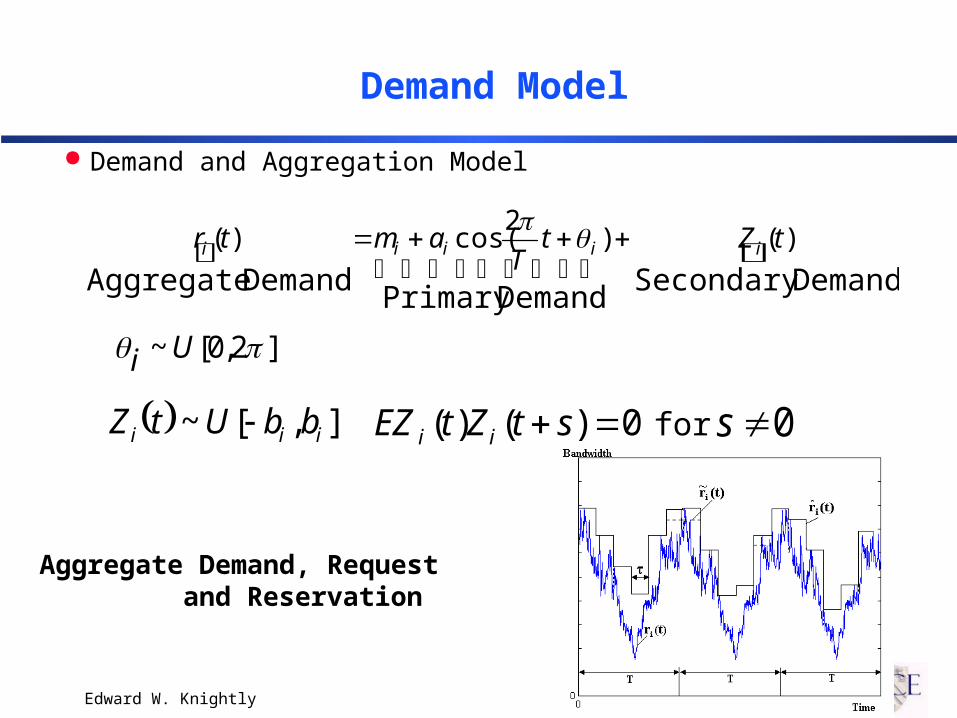
Demand Model
Demand and Aggregation Model
]2,0[~ Ui
],,[~ iii bbUtZ 0s0)()( stZtEZ ii for
DemandSecondary
DemandPrimaryDemandAggregate
)()2
cos()( tZtT
amtr iiiii
Aggregate Demand, Request and Reservation
Edward W. Knightly
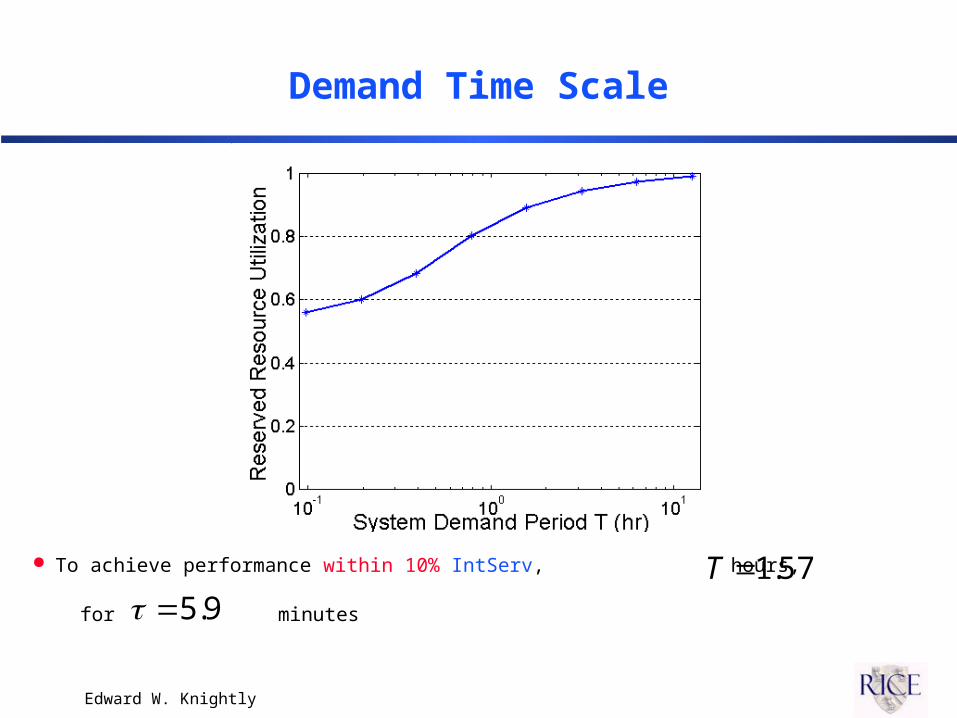
Demand Time Scale
To achieve performance within 10% IntServ, hours,
for minutes57.1T
9.5
Edward W. Knightly
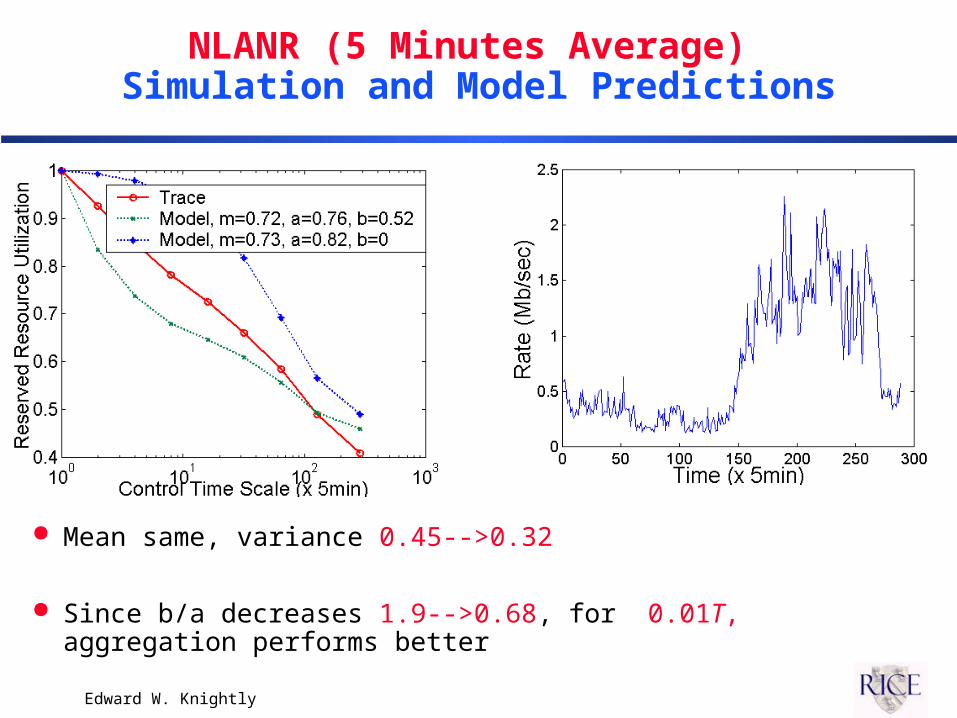
NLANR (5 Minutes Average) Simulation and Model Predictions
Mean same, variance 0.45-->0.32
Since b/a decreases 1.9-->0.68, for 0.01T, aggregation performs better

Edward W. Knightly
”Sketch” Derivation ofOverload Probability
Consider aggr. resv. requests occur at identical epochs
Decouple the impact of primary and secondary demands
– Primary demand: odd symmetric
– Secondary demand: ADDITIONAL bandwidth must be reserved since
• Conditioning on the relative phases of different aggregates
T,,2,,0
1max0
ii
sbsZP
ib
Edward W. Knightly
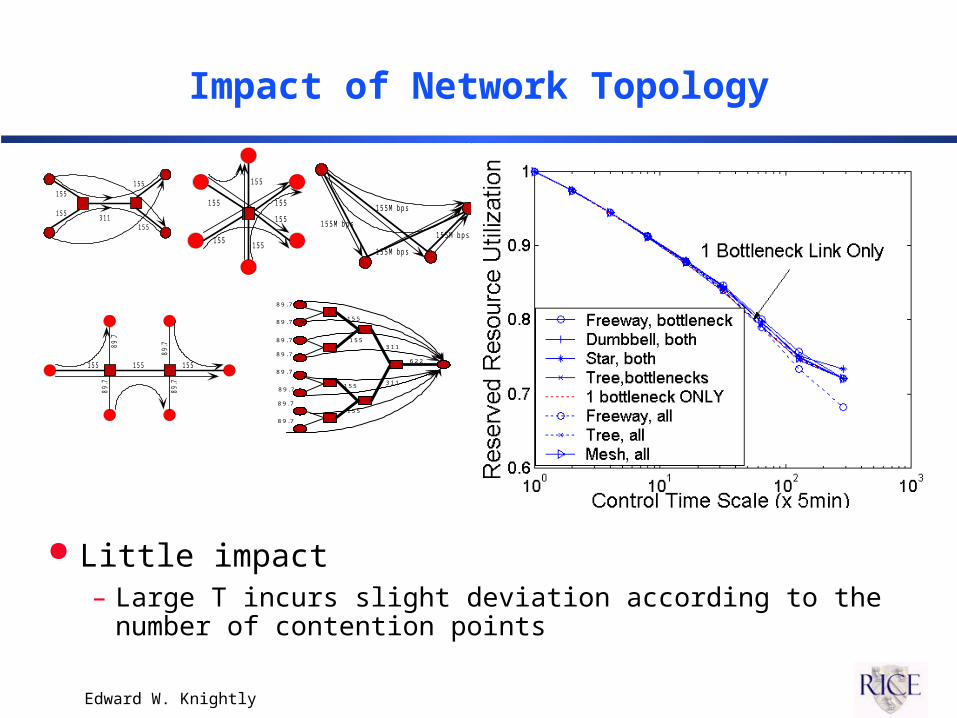
Impact of Network Topology
Little impact– Large T incurs slight deviation according to the number of
contention points
1 5 5
3 1 11 5 5
1 5 5
1 5 5
1 5 5
1 5 5
1 5 5
1 5 51 5 5
1 5 5
1 5 5 M b p s1 5 5 M b p s
1 5 5 M b p s
1 5 5 M b p s
1 5 51 5 5 1 5 5
89.7
89.789
.7
89.7
1 5 5
3 1 1
1 5 5
8 9 . 7
8 9 . 7
8 9 . 7
8 9 . 7
8 9 . 7
8 9 . 7
8 9 . 7
8 9 . 7
6 2 2
1 5 5
1 5 53 1 1
Related Documents