BioMed Central Page 1 of 12 (page number not for citation purposes) Malaria Journal Open Access Research The use of mobile phone data for the estimation of the travel patterns and imported Plasmodium falciparum rates among Zanzibar residents Andrew J Tatem* 1,2 , Youliang Qiu 1 , David L Smith 2,3 , Oliver Sabot 4 , Abdullah S Ali 5 and Bruno Moonen 4 Address: 1 Department of Geography, 3141 Turlington Hall, University of Florida, Gainesville, Florida, 32611-7315, USA, 2 Emerging Pathogens Institute, University of Florida, Gainesville, Florida, 32610-0009, USA, 3 Department of Biology, Bartram-Carr Hall, University of Florida, Gainesville, Florida, 32611, USA, 4 The William J Clinton Foundation, 383 Dorchester Avenue, Suite 400, Boston, Massachusetts, 02127, USA and 5 Zanzibar Malaria Control Programme (ZMCP), Zanzibar Ministry of Health and Social Welfare, P. O. Box 236, Zanzibar Email: Andrew J Tatem* - [email protected]; Youliang Qiu - [email protected]; David L Smith - [email protected]; Oliver Sabot - [email protected]; Abdullah S Ali - [email protected]; Bruno Moonen - [email protected] * Corresponding author Abstract Background: Malaria endemicity in Zanzibar has reached historically low levels, and the epidemiology of malaria transmission is in transition. To capitalize on these gains, Zanzibar has commissioned a feasibility assessment to help inform on whether to move to an elimination campaign. Declining local transmission has refocused attention on imported malaria. Recent studies have shown that anonimized mobile phone records provide a valuable data source for characterizing human movements without compromizing the privacy of phone users. Such movement data in combination with spatial data on P. falciparum endemicity provide a way of characterizing the patterns of parasite carrier movements and the rates of malaria importation, which have been used as part of the malaria elimination feasibility assessment for the islands of Zanzibar. Data and Methods: Records encompassing three months of complete mobile phone usage for the period October-December 2008 were obtained from the Zanzibar Telecom (Zantel) mobile phone network company, the principal provider on the islands of Zanzibar. The data included the dates of all phone usage by 770,369 individual anonymous users. Each individual call and message was spatially referenced to one of six areas: Zanzibar and five mainland Tanzania regions. Information on the numbers of Zanzibar residents travelling to the mainland, locations visited and lengths of stay were extracted. Spatial and temporal data on P. falciparum transmission intensity and seasonality enabled linkage of this information to endemicity exposure and, motivated by malaria transmission models, estimates of the expected patterns of parasite importation to be made. Results: Over the three month period studied, 88% of users made calls that were routed only through masts on Zanzibar, suggesting that no long distance travel was undertaken by this group. Of those who made calls routed through mainland masts the vast majority of trips were estimated to be of less than five days in length, and to the Dar Es Salaam Zantel-defined region. Though this region covered a wide range of transmission intensities, data on total infection numbers in Zanzibar Published: 10 December 2009 Malaria Journal 2009, 8:287 doi:10.1186/1475-2875-8-287 Received: 17 September 2009 Accepted: 10 December 2009 This article is available from: http://www.malariajournal.com/content/8/1/287 © 2009 Tatem et al; licensee BioMed Central Ltd. This is an Open Access article distributed under the terms of the Creative Commons Attribution License (http://creativecommons.org/licenses/by/2.0 ), which permits unrestricted use, distribution, and reproduction in any medium, provided the original work is properly cited.

Document
Mar 07, 2016
http://www.cddep.org/sites/cddep.org/files/publication_files/Tatem.Qiu_.etal_.2009.UseOfMobilePhoneDataForEstOfTravelPatterns.pdf
Welcome message from author
This document is posted to help you gain knowledge. Please leave a comment to let me know what you think about it! Share it to your friends and learn new things together.
Transcript
BioMed CentralMalaria Journal
ss
Open AcceResearchThe use of mobile phone data for the estimation of the travel patterns and imported Plasmodium falciparum rates among Zanzibar residentsAndrew J Tatem*1,2, Youliang Qiu1, David L Smith2,3, Oliver Sabot4, Abdullah S Ali5 and Bruno Moonen4Address: 1Department of Geography, 3141 Turlington Hall, University of Florida, Gainesville, Florida, 32611-7315, USA, 2Emerging Pathogens Institute, University of Florida, Gainesville, Florida, 32610-0009, USA, 3Department of Biology, Bartram-Carr Hall, University of Florida, Gainesville, Florida, 32611, USA, 4The William J Clinton Foundation, 383 Dorchester Avenue, Suite 400, Boston, Massachusetts, 02127, USA and 5Zanzibar Malaria Control Programme (ZMCP), Zanzibar Ministry of Health and Social Welfare, P. O. Box 236, Zanzibar
Email: Andrew J Tatem* - [email protected]; Youliang Qiu - [email protected]; David L Smith - [email protected]; Oliver Sabot - [email protected]; Abdullah S Ali - [email protected]; Bruno Moonen - [email protected]
* Corresponding author
AbstractBackground: Malaria endemicity in Zanzibar has reached historically low levels, and theepidemiology of malaria transmission is in transition. To capitalize on these gains, Zanzibar hascommissioned a feasibility assessment to help inform on whether to move to an eliminationcampaign. Declining local transmission has refocused attention on imported malaria. Recent studieshave shown that anonimized mobile phone records provide a valuable data source forcharacterizing human movements without compromizing the privacy of phone users. Suchmovement data in combination with spatial data on P. falciparum endemicity provide a way ofcharacterizing the patterns of parasite carrier movements and the rates of malaria importation,which have been used as part of the malaria elimination feasibility assessment for the islands ofZanzibar.
Data and Methods: Records encompassing three months of complete mobile phone usage forthe period October-December 2008 were obtained from the Zanzibar Telecom (Zantel) mobilephone network company, the principal provider on the islands of Zanzibar. The data included thedates of all phone usage by 770,369 individual anonymous users. Each individual call and messagewas spatially referenced to one of six areas: Zanzibar and five mainland Tanzania regions.Information on the numbers of Zanzibar residents travelling to the mainland, locations visited andlengths of stay were extracted. Spatial and temporal data on P. falciparum transmission intensity andseasonality enabled linkage of this information to endemicity exposure and, motivated by malariatransmission models, estimates of the expected patterns of parasite importation to be made.
Results: Over the three month period studied, 88% of users made calls that were routed onlythrough masts on Zanzibar, suggesting that no long distance travel was undertaken by this group.Of those who made calls routed through mainland masts the vast majority of trips were estimatedto be of less than five days in length, and to the Dar Es Salaam Zantel-defined region. Though thisregion covered a wide range of transmission intensities, data on total infection numbers in Zanzibar
Published: 10 December 2009
Malaria Journal 2009, 8:287 doi:10.1186/1475-2875-8-287
Received: 17 September 2009Accepted: 10 December 2009
This article is available from: http://www.malariajournal.com/content/8/1/287
© 2009 Tatem et al; licensee BioMed Central Ltd. This is an Open Access article distributed under the terms of the Creative Commons Attribution License (http://creativecommons.org/licenses/by/2.0), which permits unrestricted use, distribution, and reproduction in any medium, provided the original work is properly cited.
Page 1 of 12(page number not for citation purposes)
Malaria Journal 2009, 8:287 http://www.malariajournal.com/content/8/1/287
combined with mathematical models enabled informed estimation of transmission exposure andimported infection numbers. These showed that the majority of trips made posed a relatively lowrisk for parasite importation, but risk groups visiting higher transmission regions for extendedperiods of time could be identified.
Conclusion: Anonymous mobile phone records provide valuable information on humanmovement patterns in areas that are typically data-sparse. Estimates of human movement patternsfrom Zanzibar to mainland Tanzania suggest that imported malaria risk from this group isheterogeneously distributed; a few people account for most of the risk for imported malaria. Incombination with spatial data on malaria endemicity and transmission models, movement patternsderived from phone records can inform on the likely sources and rates of malaria importation. Suchinformation is important for assessing the feasibility of malaria elimination and planning anelimination campaign.
BackgroundMany countries are committing to nationwide malariaelimination and global eradication is once more back onthe international agenda [1-3]. Historically, the technicalfeasibility of achieving malaria elimination in a region hasbeen conceptualized as being composed of 'receptivity'and 'vulnerability' [4,5]. Receptivity represents thestrength of transmission in an area, while vulnerability isthe risk of malaria importation [6]. While both have beenregularly discussed theoretically, neither have been quan-tified, nor methods for their quantification ever defined.
Quantifying imported malaria risk represents a centralcomponent for not only assessing the feasibility ofmalaria elimination from a region, but for planning theimplementation of an elimination campaign. Malaria isconstantly being exported and imported around theWorld, and in areas of high transmission, malaria impor-tation is generally a minor concern. As local transmissionis reduced and after malaria has been eliminated from aregion, however, importation becomes a primary concern.
Zanzibar, an island group of the coast of Tanzania, is oneof the territories in sub-Saharan Africa that has recentlyexpressed its willingness to move from control towardselimination. Since 2003, the introduction of artemisinin-based combination therapy (ACT) and high coverages oflong-lasting insecticide treated nets and indoor residualspraying, has reduced malaria prevalence to just 0.8%[7,8]. These efforts have resulted in the government ofZanzibar considering an elimination campaign andundertaking an elimination feasibility assessment. Never-theless, proximity and high connectivity to the mainlandwhere transmission levels remain substantially higher inmany places [9] implies that imported malaria will be aconstant problem [10].
In general, parasites can be imported into Zanzibar in oneof three ways: (i) the migration of an infected mosquito,(ii) infected humans visiting or migrating from the main-
land, (iii) residents visiting the mainland and becominginfected, then returning. While mosquitoes may occasion-ally arrive though wind-blown or accidental aircraft orship transport, typically they will only fly short distances.Human carriage of parasites, therefore, represents theprincipal risk, and is to blame in many past instances else-where where malaria has resurged [11-14]. Quantifyingsuch movements both temporally and spatially, and theresulting imported infection risks, represents an impor-tant task if effective, evidence-based planning for elimina-tion is to be undertaken.
Recent approaches to quantifying human mobility pat-terns point the way to novel insights from new data[15,16], especially through the analysis of mobile phonerecords [17-19]. Anonimized phone call record data thathas both the time each call was made and the location ofthe nearest mast that each call was routed through can beused to construct trajectories of the movements of individ-uals over time [19]. Here, the potential of such data forestimating importation risk in the malaria eliminationfeasibility assessment for the islands of Zanzibar is dem-onstrated. The low market share on the mainland for thenetwork provider restricts the focus here to those infec-tions brought in by residents returning from mainlandtravel. However, the approaches put forward are suffi-ciently generic to be applied to alternative regions, elimi-nation settings and phone network provider data.Moreover, this exercise aims to present the first explora-tion of mobile phone based approaches to the quantifica-tion of vulnerability to inform malaria eliminationdecisions and planning.
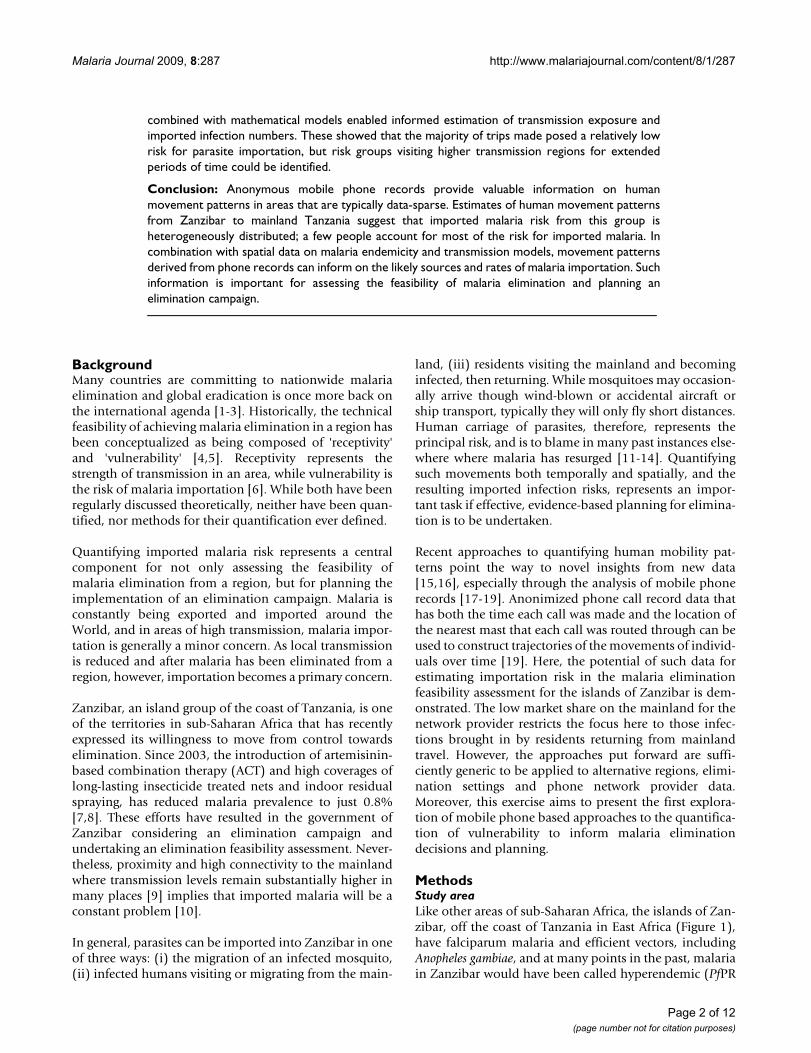
MethodsStudy areaLike other areas of sub-Saharan Africa, the islands of Zan-zibar, off the coast of Tanzania in East Africa (Figure 1),have falciparum malaria and efficient vectors, includingAnopheles gambiae, and at many points in the past, malariain Zanzibar would have been called hyperendemic (PfPR
Page 2 of 12(page number not for citation purposes)
Malaria Journal 2009, 8:287 http://www.malariajournal.com/content/8/1/287
in the 2-10 age group ~50-75%). Recent control efforts[8], possibly combined with socioeconomic changes,have pushed Plasmodium falciparum prevalences down to0.3% for the southern island of Unguja, and 1.4% for thenorthern island of Pemba [7], meaning approximately8,500 infected people at any one time; 3,000 on Ungujaand 5,500 on Pemba.
Zanzibar, however, has strong transport connections tothe mainland where transmission levels are higher, result-
ing in concerns about achieving and sustaining elimina-tion being raised [10], and making the quantification ofhuman movement patterns and ultimately, importedinfection rates, a critical aspect of elimination feasibility.While daily flights bring in around 10,000 people amonth [20], these are mainly tourists from non-endemicregions, who will likely be taking prophylaxis, and thusrepresent a low risk in terms of imported infections andonward transmission. Ferry services have capacity to moveup to 1,800 people daily between Zanzibar and the main-
Zantel coverage regions in TanzaniaFigure 1Zantel coverage regions in Tanzania.
Page 3 of 12(page number not for citation purposes)
Malaria Journal 2009, 8:287 http://www.malariajournal.com/content/8/1/287
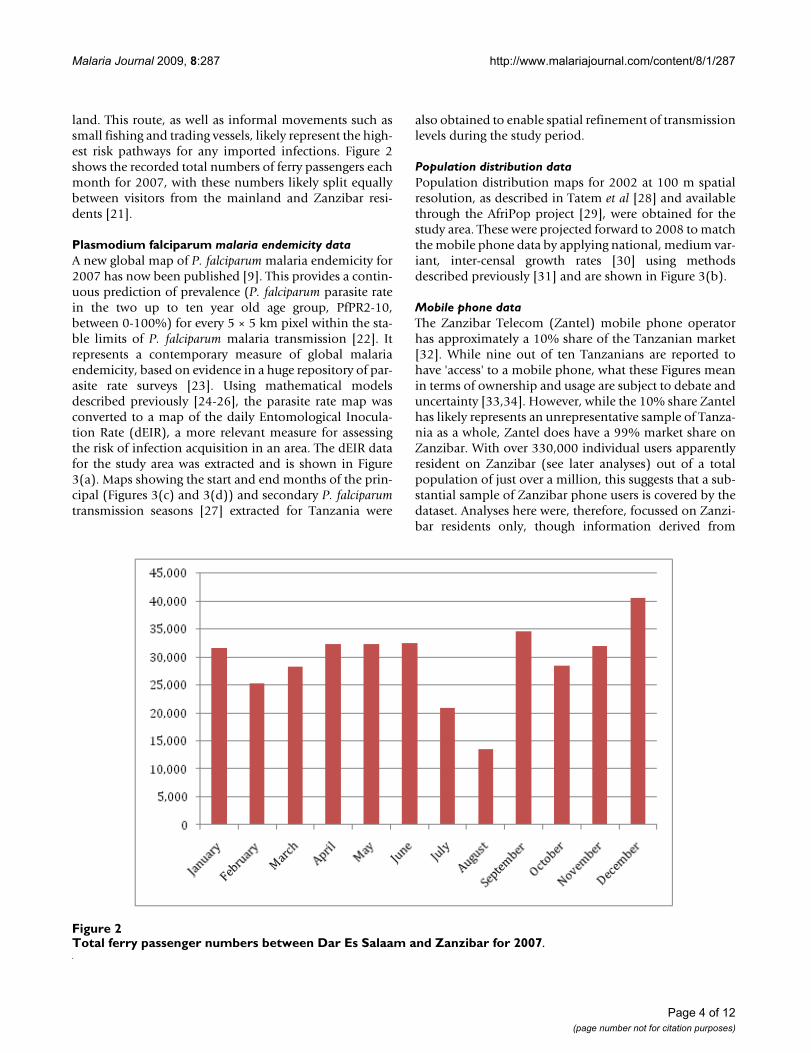
land. This route, as well as informal movements such assmall fishing and trading vessels, likely represent the high-est risk pathways for any imported infections. Figure 2shows the recorded total numbers of ferry passengers eachmonth for 2007, with these numbers likely split equallybetween visitors from the mainland and Zanzibar resi-dents [21].
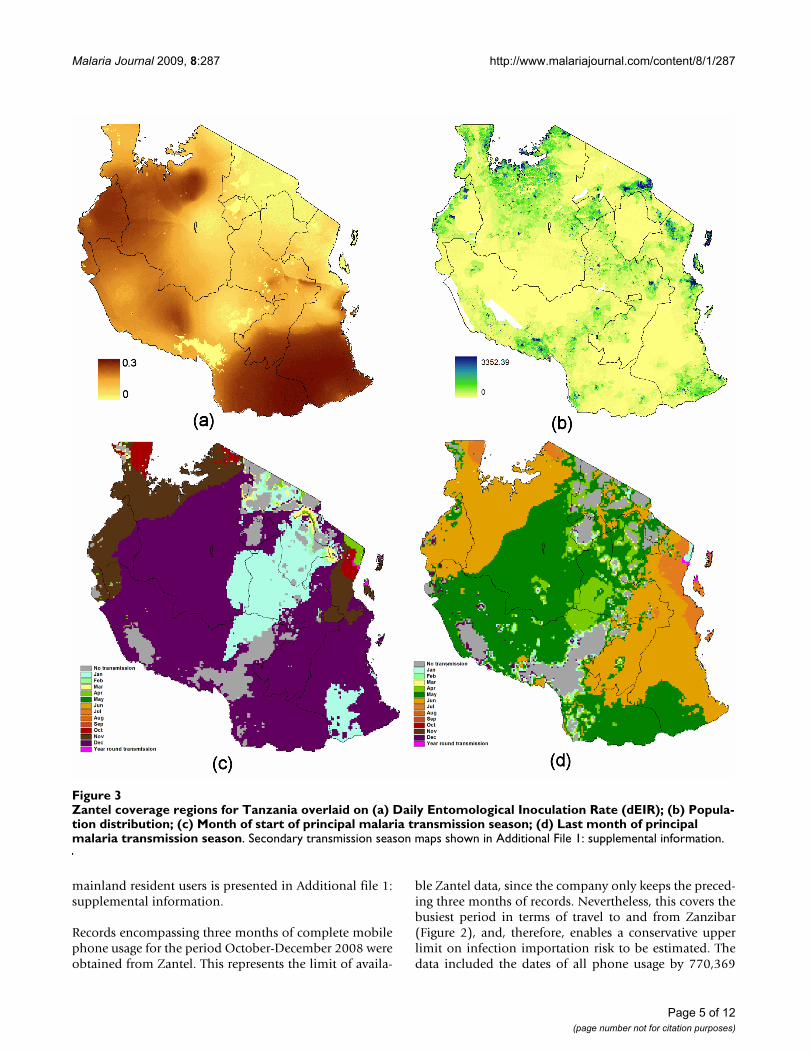
Plasmodium falciparum malaria endemicity dataA new global map of P. falciparum malaria endemicity for2007 has now been published [9]. This provides a contin-uous prediction of prevalence (P. falciparum parasite ratein the two up to ten year old age group, PfPR2-10,between 0-100%) for every 5 × 5 km pixel within the sta-ble limits of P. falciparum malaria transmission [22]. Itrepresents a contemporary measure of global malariaendemicity, based on evidence in a huge repository of par-asite rate surveys [23]. Using mathematical modelsdescribed previously [24-26], the parasite rate map wasconverted to a map of the daily Entomological Inocula-tion Rate (dEIR), a more relevant measure for assessingthe risk of infection acquisition in an area. The dEIR datafor the study area was extracted and is shown in Figure3(a). Maps showing the start and end months of the prin-cipal (Figures 3(c) and 3(d)) and secondary P. falciparumtransmission seasons [27] extracted for Tanzania were
also obtained to enable spatial refinement of transmissionlevels during the study period.
Population distribution dataPopulation distribution maps for 2002 at 100 m spatialresolution, as described in Tatem et al [28] and availablethrough the AfriPop project [29], were obtained for thestudy area. These were projected forward to 2008 to matchthe mobile phone data by applying national, medium var-iant, inter-censal growth rates [30] using methodsdescribed previously [31] and are shown in Figure 3(b).
Mobile phone dataThe Zanzibar Telecom (Zantel) mobile phone operatorhas approximately a 10% share of the Tanzanian market[32]. While nine out of ten Tanzanians are reported tohave 'access' to a mobile phone, what these Figures meanin terms of ownership and usage are subject to debate anduncertainty [33,34]. However, while the 10% share Zantelhas likely represents an unrepresentative sample of Tanza-nia as a whole, Zantel does have a 99% market share onZanzibar. With over 330,000 individual users apparentlyresident on Zanzibar (see later analyses) out of a totalpopulation of just over a million, this suggests that a sub-stantial sample of Zanzibar phone users is covered by thedataset. Analyses here were, therefore, focussed on Zanzi-bar residents only, though information derived from
Total ferry passenger numbers between Dar Es Salaam and Zanzibar for 2007Figure 2Total ferry passenger numbers between Dar Es Salaam and Zanzibar for 2007.
Page 4 of 12(page number not for citation purposes)
Malaria Journal 2009, 8:287 http://www.malariajournal.com/content/8/1/287
mainland resident users is presented in Additional file 1:supplemental information.
Records encompassing three months of complete mobilephone usage for the period October-December 2008 wereobtained from Zantel. This represents the limit of availa-
ble Zantel data, since the company only keeps the preced-ing three months of records. Nevertheless, this covers thebusiest period in terms of travel to and from Zanzibar(Figure 2), and, therefore, enables a conservative upperlimit on infection importation risk to be estimated. Thedata included the dates of all phone usage by 770,369
Zantel coverage regions for Tanzania overlaid on (a) Daily Entomological Inoculation Rate (dEIR); (b) Population distribution; (c) Month of start of principal malaria transmission season; (d) Last month of principal malaria transmission seasonFigure 3Zantel coverage regions for Tanzania overlaid on (a) Daily Entomological Inoculation Rate (dEIR); (b) Popula-tion distribution; (c) Month of start of principal malaria transmission season; (d) Last month of principal malaria transmission season. Secondary transmission season maps shown in Additional File 1: supplemental information.
Page 5 of 12(page number not for citation purposes)
Malaria Journal 2009, 8:287 http://www.malariajournal.com/content/8/1/287
individual users, making a total of 21,053,198 calls andtext messages. Prior to receiving the data, Zantel assignedeach individual user a unique code to ensure that the ano-nymity of users was maintained and that the data couldonly be used for studying general patterns of mobility.Each individual call and message was spatially referencedto one of six areas: Arusha, Dar Es Salaam, Dodoma,Mbeya, Mwanza and Zanzibar (Figure 1). Any individualthat made just four or less calls in any one month (anaverage of one per week) was removed from further anal-yses to ensure that sufficient temporal resolution existedin the remainder of the dataset for trajectory analysis.
Estimating exposure to transmission levelsFor each of the three months in the study period, and foreach Zantel region, the areas within their principal (Fig-ures 3(c) and 3(d)) or secondary transmission seasonswere identified and overlaid onto the dEIR map (Figure3(a)), with non-transmission season areas masked out.The minimum, mean and maximum dEIR values for eachZantel region and month were then calculated, and thegridded population data and dEIR data were combined tocalculate population weighted mean dEIRs for the entireregions, and their principal cities (Table 1). To examinethe ranges of possible results, should for instance theunlikely case of all visitors travelling to the highest trans-mission part of each Zantel region be reality, analyseswere undertaken with the extreme conditions of mini-mum and maximum possible dEIR exposure per region.With Zantel coverage principally available in the majorpopulated areas, and travellers more likely to visit heavilypopulated regions than empty rural areas, it was assumedhowever that the population-weighted measures likelyrepresented the more realistic range of estimates for dEIRexposure within each coverage region. Moreover, with ahigh percentage of travellers likely visiting just the princi-pal cities when travelling to each region, the populationweighted mean dEIR within the city limits of Arusha, DarEs Salaam, Dodoma, Mbeya and Mwanza, as defined bythe global rural-urban mapping project urban extent map[35], were also calculated. These scenarios and assump-
tions were tested through comparing estimated importedinfection numbers (see the quantifying imported malariarisk section) to the known numbers of infections presentat any one time on the islands of Unguja and Pemba.
Quantifying imported malaria risk from returning residentsMalaria importation risk or vulnerability have been dis-cussed in relation to malaria elimination for decades (e.g.[4,5,12]), but never quantified. In simple terms, malariaimportation risk as a measurable quantity in a focal coun-try or area is the product of human immigration ratesfrom other malaria endemic countries or areas and theircorresponding level of endemicity. However, it may notbe sufficient to estimate the number of people who crossthe borders of a country or region infected with malariaelsewhere; it also matters how long they stayed inendemic regions, how long they remain infected andinfectious in the country or area of interest, as well aswhere they stay. Thus, the risks deriving from visitors fromthe mainland (see Additional file 1: supplemental infor-mation) and returning residents should be quantified dif-ferently.
For Zanzibar residents visiting the mainland on day t,their length of stay, L, and dEIR in the area of stay are thekey factors. Recent research efforts have provided spatialquantification of P. falciparum endemicity [9] enablingestimation of the dEIR at the locations that Zanzibar resi-dents are visiting. Motivated by malaria transmissionmodels [36], the probability of obtaining an infection, P,is thus:
The total number of imported infections, I, over all N tripsmade in the three month study period is therefore:
P edEIR
t
t L
= −−
=
=∑1 0( )
I edEIR
Nt
t L
= −−
=
=∑∑1 0( )
Table 1: Monthly estimates of dEIR for each Zantel region.
Minimum Mean Maximum Population weighted mean Pop weighted principal city mean
Zantel region
Oct Nov Dec Oct Nov Dec Oct Nov Dec Oct Nov Dec Oct Nov Dec
Arusha 0.0 0.0 0.0 0.00005 0.00021 0.00063 0.00068 0.00154 0.00341 0.00001 0.00008 0.00014 0 0.00006 0.00006Dar Es Salaam 0.0 0.0 0.0 0.00104 0.00840 0.04049 0.00285 0.05654 0.21508 0.00082 0.00213 0.00855 0.00023 0.00023 0.00023Dodoma 0.0 0.0 0.0 0.00032 0.00099 0.00792 0.00332 0.0322 0.05258 0.00021 0.00084 0.00785 0 0.00199 0.00199Mbeya 0.0 0.0 0.0 0.00625 0.00974 0.02517 0.00995 0.06526 0.29468 0.00444 0.00848 0.03133 0 0.00512 0.00512Mwanza 0.0 0.0 0.0 0.00031 0.00066 0.00846 0.00221 0.00887 0.03671 0.00009 0.00032 0.0169 0 0.00492 0.00492
Page 6 of 12(page number not for citation purposes)
Malaria Journal 2009, 8:287 http://www.malariajournal.com/content/8/1/287
Given the estimates of trip length, range of estimates ofdEIR and proportion of travellers captured in the dataset,the total number of infections brought into Zanzibar byreturning residents were estimated, as well as the distribu-tion of infection origins. With only around 8,500 infec-tions on the islands at any one time, and just 3,000 onUnguja, where the majority of movements to and fromthe mainland derive from, this places a realistic limit onthe estimates of imported infection numbers, and thus, aguide to the likely dEIR visitor exposure for each Zantelregion.
ResultsIdentifying travellersOf the 770,369 individual phone users in the Zantel data-set, 24,625 (3.2%) made four calls or less per month inthe three month study period, and were thus removedfrom further analysis. Of the remaining users, 335,621made the majority of their calls on Zanzibar. From hereon, we assume that these represent Zanzibar residents,since the majority of calls by a customer are most likely tobe made in their home region. There will of course beexceptions to this, for instance, if a mobile phone is prin-cipally used for business use when travelling, but in theabsence of further information, this represents a reasona-ble assumption to make. Of the 335,621 Zanzibar resi-dent users, just 12.08% of them (40,543 users) made callsfrom the mainland. Thus, the vast majority of users onlymade calls from Zanzibar, indicating a lack of travel.
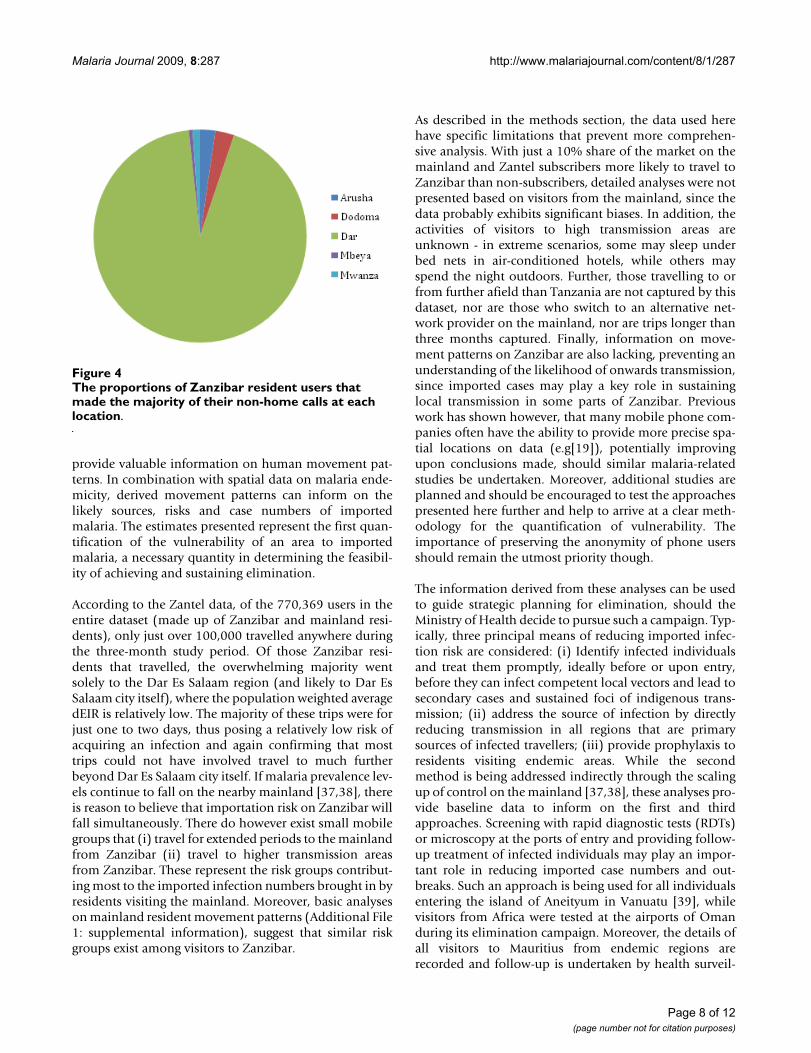
Locations visitedFigure 4 shows, of those Zanzibar residents who travelledin the study period, the proportions that made the major-ity of their non-home calls at each other mast location. Itis clear that of those who travelled to the mainland, a sub-stantial proportion made the majority of their non-Zanzi-bar calls in the Dar Es Salaam region, with only a smallproportion making the majority of their non-Zanzibarcalls at the other four mast locations.
Trip lengthsTo estimate the lengths of trips made by those makingcalls from more than one location, it was assumed that thedate of the first mainland call made represented the startof a trip. The end of this trip was estimated as the datewhen the first Zanzibar-based call was made again. Foreach user, the start and end dates of each individual tripmade were estimated in this way and the trip lengthsquantified and recorded. A total of 73,095 trips weremade, with 12,584 residents travelling in October makinga total of 24,439 trips, 11,947 in November making24,335 trips and 12,882 in December making 24,321trips. These figures correspond well with the ferry passen-ger numbers (Figure 1) and, assuming residents made uparound half of ferry passengers [21], suggest that around
95% of all trips made by Zanzibar residents to the main-land were captured in the dataset.
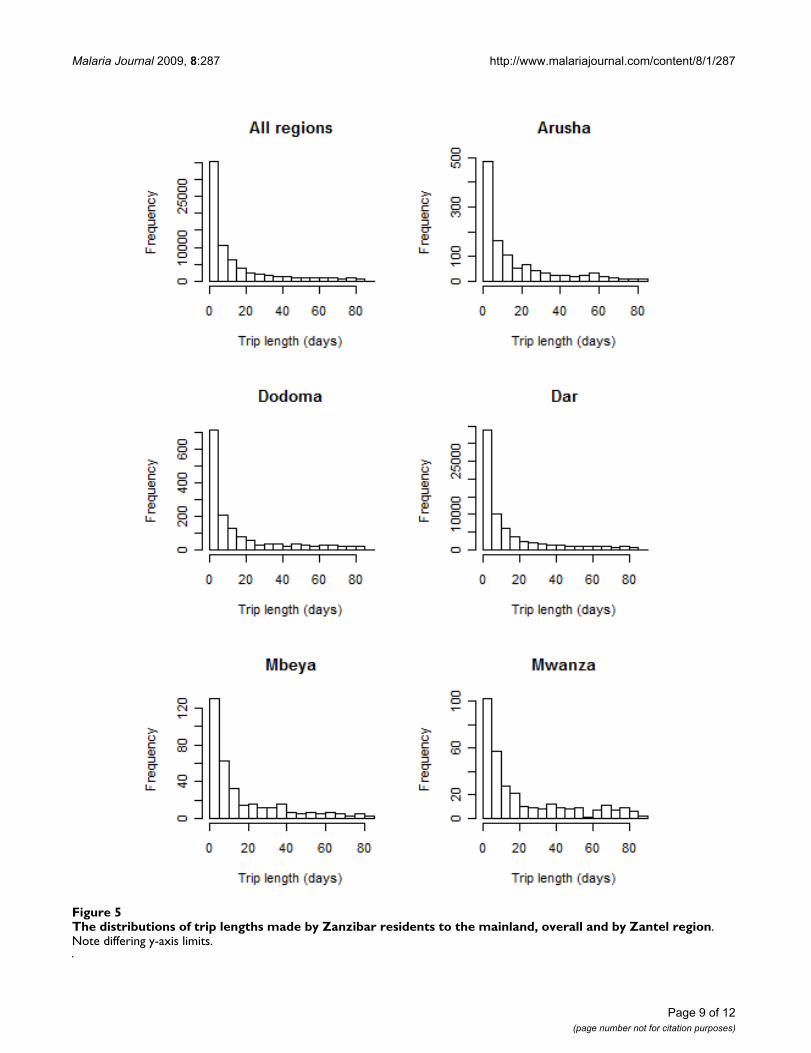
Figure 5 shows the distribution of trip lengths made byZanzibar residents. As shown in Figure 4, the vast majorityof trips made were to the Dar Es Salaam region. What isclear from Figure 5 is that the majority of trips made to themainland were of less than five days long. In fact, 17.4%of all trips to the Dar region were estimated to be of justone day in length, while 29% were of two days in lengthor less. A similar pattern is shown for the other regions,though with substantially fewer visits made, and a higherproportion of longer (10-30 days) trips made by thosetravelling further, e.g. Mbeya or Mwanza.
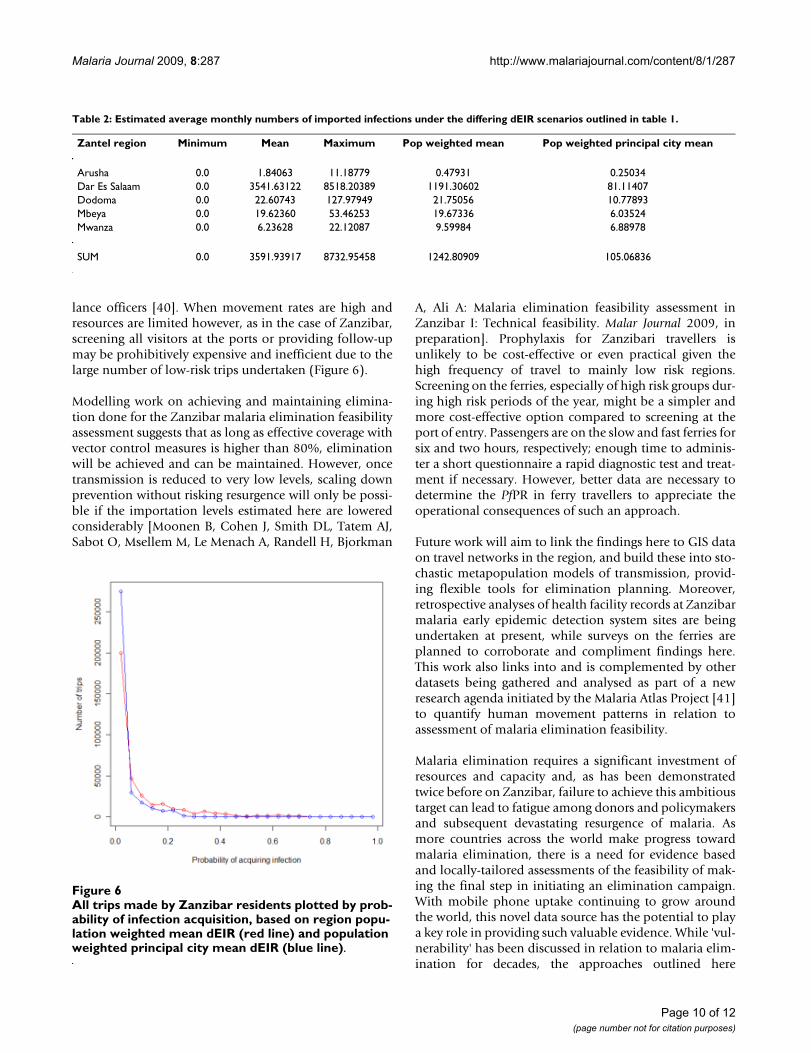
Estimating imported malaria riskTo provide estimates of imported case numbers fromreturning Zanzibar residents and likely origins of infec-tions, the data on dEIR scenarios for each Zantel regionwere combined with the trip length estimates using equa-tion (2). Table 2 shows that only the results from the pop-ulation weighted region and city scenarios fall under therealistic limits of total infections on the islands, given thatimported infections will also be brought in by visitorsfrom the mainland and that the majority of travel is toUnguja. Realistically, while a significant majority of visi-tors to each region will visit the principal cities, others willtravel to alternative population centres, thus the regionalpopulation weighted mean dEIR (upper) and principalcity population weighted mean dEIR (lower) scenariosrepresent credible limits for estimating the likely numberof imported infections per month arising from returningresidents. Thus, converting these to annualized measures,estimates of between one and 12 imported infections per1,000 people per year from returning residents representrealistic limits. Given increased travel in October-Decem-ber (Figure 2), these also likely represent conservativeoverestimates.
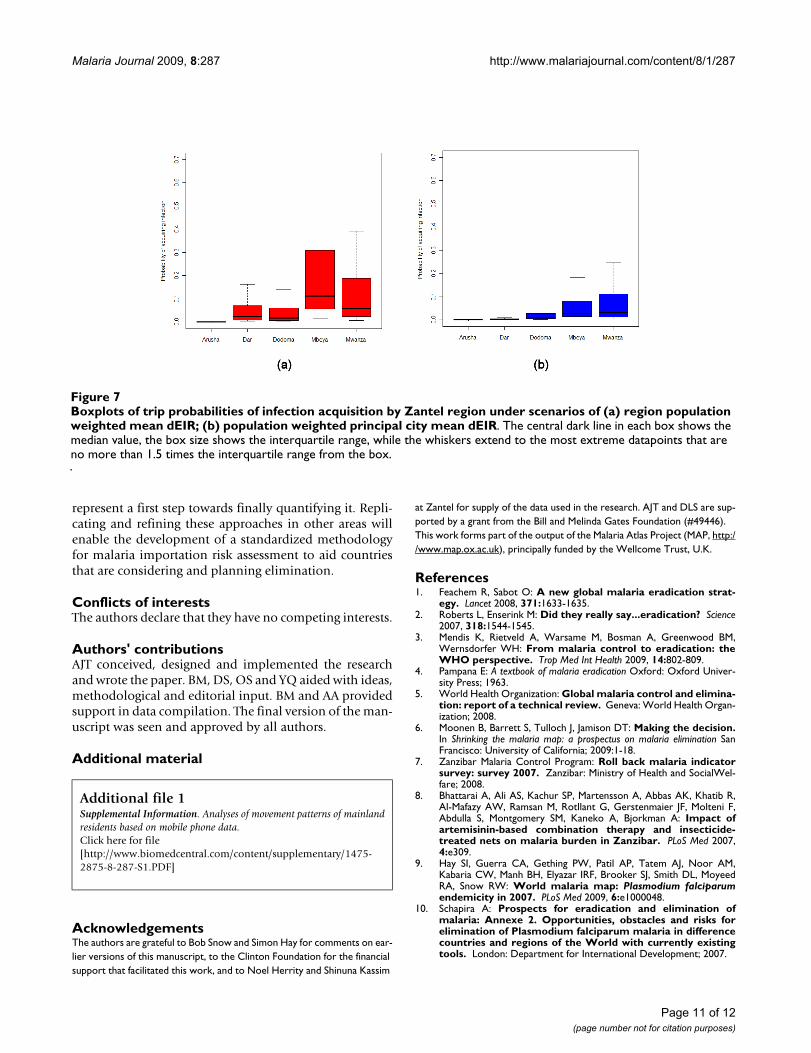
Figure 6 shows the distribution of trips by probability ofinfection acquisition, P, under the scenarios of exposureto regional population weighted mean dEIR and principalcity population weighted mean dEIR. Each scenario high-lights that the majority of trips made entailed a probabil-ity of infection acquisition of less than 0.05. Figure 7shows the regional composition of these distributions,illustrating that under both scenarios, the trips made byresidents to Dodoma, Mbeya and Mwanza providedgreater risks of infection acquisition, due to a higher pro-portion of longer stays in these regions typically, com-bined with overall high levels of transmission.
DiscussionResults here show that, despite data limitations, spatiallyand temporally referenced mobile phone usage data can
Page 7 of 12(page number not for citation purposes)
Malaria Journal 2009, 8:287 http://www.malariajournal.com/content/8/1/287
provide valuable information on human movement pat-terns. In combination with spatial data on malaria ende-micity, derived movement patterns can inform on thelikely sources, risks and case numbers of importedmalaria. The estimates presented represent the first quan-tification of the vulnerability of an area to importedmalaria, a necessary quantity in determining the feasibil-ity of achieving and sustaining elimination.
According to the Zantel data, of the 770,369 users in theentire dataset (made up of Zanzibar and mainland resi-dents), only just over 100,000 travelled anywhere duringthe three-month study period. Of those Zanzibar resi-dents that travelled, the overwhelming majority wentsolely to the Dar Es Salaam region (and likely to Dar EsSalaam city itself), where the population weighted averagedEIR is relatively low. The majority of these trips were forjust one to two days, thus posing a relatively low risk ofacquiring an infection and again confirming that mosttrips could not have involved travel to much furtherbeyond Dar Es Salaam city itself. If malaria prevalence lev-els continue to fall on the nearby mainland [37,38], thereis reason to believe that importation risk on Zanzibar willfall simultaneously. There do however exist small mobilegroups that (i) travel for extended periods to the mainlandfrom Zanzibar (ii) travel to higher transmission areasfrom Zanzibar. These represent the risk groups contribut-ing most to the imported infection numbers brought in byresidents visiting the mainland. Moreover, basic analyseson mainland resident movement patterns (Additional File1: supplemental information), suggest that similar riskgroups exist among visitors to Zanzibar.
As described in the methods section, the data used herehave specific limitations that prevent more comprehen-sive analysis. With just a 10% share of the market on themainland and Zantel subscribers more likely to travel toZanzibar than non-subscribers, detailed analyses were notpresented based on visitors from the mainland, since thedata probably exhibits significant biases. In addition, theactivities of visitors to high transmission areas areunknown - in extreme scenarios, some may sleep underbed nets in air-conditioned hotels, while others mayspend the night outdoors. Further, those travelling to orfrom further afield than Tanzania are not captured by thisdataset, nor are those who switch to an alternative net-work provider on the mainland, nor are trips longer thanthree months captured. Finally, information on move-ment patterns on Zanzibar are also lacking, preventing anunderstanding of the likelihood of onwards transmission,since imported cases may play a key role in sustaininglocal transmission in some parts of Zanzibar. Previouswork has shown however, that many mobile phone com-panies often have the ability to provide more precise spa-tial locations on data (e.g[19]), potentially improvingupon conclusions made, should similar malaria-relatedstudies be undertaken. Moreover, additional studies areplanned and should be encouraged to test the approachespresented here further and help to arrive at a clear meth-odology for the quantification of vulnerability. Theimportance of preserving the anonymity of phone usersshould remain the utmost priority though.
The information derived from these analyses can be usedto guide strategic planning for elimination, should theMinistry of Health decide to pursue such a campaign. Typ-ically, three principal means of reducing imported infec-tion risk are considered: (i) Identify infected individualsand treat them promptly, ideally before or upon entry,before they can infect competent local vectors and lead tosecondary cases and sustained foci of indigenous trans-mission; (ii) address the source of infection by directlyreducing transmission in all regions that are primarysources of infected travellers; (iii) provide prophylaxis toresidents visiting endemic areas. While the secondmethod is being addressed indirectly through the scalingup of control on the mainland [37,38], these analyses pro-vide baseline data to inform on the first and thirdapproaches. Screening with rapid diagnostic tests (RDTs)or microscopy at the ports of entry and providing follow-up treatment of infected individuals may play an impor-tant role in reducing imported case numbers and out-breaks. Such an approach is being used for all individualsentering the island of Aneityum in Vanuatu [39], whilevisitors from Africa were tested at the airports of Omanduring its elimination campaign. Moreover, the details ofall visitors to Mauritius from endemic regions arerecorded and follow-up is undertaken by health surveil-
The proportions of Zanzibar resident users that made the majority of their non-home calls at each locationFigure 4The proportions of Zanzibar resident users that made the majority of their non-home calls at each location.
Page 8 of 12(page number not for citation purposes)
Malaria Journal 2009, 8:287 http://www.malariajournal.com/content/8/1/287
Page 9 of 12(page number not for citation purposes)
The distributions of trip lengths made by Zanzibar residents to the mainland, overall and by Zantel regionFigure 5The distributions of trip lengths made by Zanzibar residents to the mainland, overall and by Zantel region. Note differing y-axis limits.
Malaria Journal 2009, 8:287 http://www.malariajournal.com/content/8/1/287
lance officers [40]. When movement rates are high andresources are limited however, as in the case of Zanzibar,screening all visitors at the ports or providing follow-upmay be prohibitively expensive and inefficient due to thelarge number of low-risk trips undertaken (Figure 6).
Modelling work on achieving and maintaining elimina-tion done for the Zanzibar malaria elimination feasibilityassessment suggests that as long as effective coverage withvector control measures is higher than 80%, eliminationwill be achieved and can be maintained. However, oncetransmission is reduced to very low levels, scaling downprevention without risking resurgence will only be possi-ble if the importation levels estimated here are loweredconsiderably [Moonen B, Cohen J, Smith DL, Tatem AJ,Sabot O, Msellem M, Le Menach A, Randell H, Bjorkman
A, Ali A: Malaria elimination feasibility assessment inZanzibar I: Technical feasibility. Malar Journal 2009, inpreparation]. Prophylaxis for Zanzibari travellers isunlikely to be cost-effective or even practical given thehigh frequency of travel to mainly low risk regions.Screening on the ferries, especially of high risk groups dur-ing high risk periods of the year, might be a simpler andmore cost-effective option compared to screening at theport of entry. Passengers are on the slow and fast ferries forsix and two hours, respectively; enough time to adminis-ter a short questionnaire a rapid diagnostic test and treat-ment if necessary. However, better data are necessary todetermine the PfPR in ferry travellers to appreciate theoperational consequences of such an approach.
Future work will aim to link the findings here to GIS dataon travel networks in the region, and build these into sto-chastic metapopulation models of transmission, provid-ing flexible tools for elimination planning. Moreover,retrospective analyses of health facility records at Zanzibarmalaria early epidemic detection system sites are beingundertaken at present, while surveys on the ferries areplanned to corroborate and compliment findings here.This work also links into and is complemented by otherdatasets being gathered and analysed as part of a newresearch agenda initiated by the Malaria Atlas Project [41]to quantify human movement patterns in relation toassessment of malaria elimination feasibility.
Malaria elimination requires a significant investment ofresources and capacity and, as has been demonstratedtwice before on Zanzibar, failure to achieve this ambitioustarget can lead to fatigue among donors and policymakersand subsequent devastating resurgence of malaria. Asmore countries across the world make progress towardmalaria elimination, there is a need for evidence basedand locally-tailored assessments of the feasibility of mak-ing the final step in initiating an elimination campaign.With mobile phone uptake continuing to grow aroundthe world, this novel data source has the potential to playa key role in providing such valuable evidence. While 'vul-nerability' has been discussed in relation to malaria elim-ination for decades, the approaches outlined here
Table 2: Estimated average monthly numbers of imported infections under the differing dEIR scenarios outlined in table 1.
Zantel region Minimum Mean Maximum Pop weighted mean Pop weighted principal city mean
Arusha 0.0 1.84063 11.18779 0.47931 0.25034Dar Es Salaam 0.0 3541.63122 8518.20389 1191.30602 81.11407Dodoma 0.0 22.60743 127.97949 21.75056 10.77893Mbeya 0.0 19.62360 53.46253 19.67336 6.03524Mwanza 0.0 6.23628 22.12087 9.59984 6.88978
SUM 0.0 3591.93917 8732.95458 1242.80909 105.06836
All trips made by Zanzibar residents plotted by probability of infection acquisition, based on region population weighted mean dEIR (red line) and population weighted principal city mean dEIR (blue line)Figure 6All trips made by Zanzibar residents plotted by prob-ability of infection acquisition, based on region popu-lation weighted mean dEIR (red line) and population weighted principal city mean dEIR (blue line).
Page 10 of 12(page number not for citation purposes)
Malaria Journal 2009, 8:287 http://www.malariajournal.com/content/8/1/287
Boxplots of trip probabilities of infection acquisition by Zantel region under scenarios of (a) region population weighted mean dEIR; (b) population weighted principal city mean dEIRFigure 7Boxplots of trip probabilities of infection acquisition by Zantel region under scenarios of (a) region population weighted mean dEIR; (b) population weighted principal city mean dEIR. The central dark line in each box shows the median value, the box size shows the interquartile range, while the whiskers extend to the most extreme datapoints that are no more than 1.5 times the interquartile range from the box.
represent a first step towards finally quantifying it. Repli-cating and refining these approaches in other areas willenable the development of a standardized methodologyfor malaria importation risk assessment to aid countriesthat are considering and planning elimination.
Conflicts of interestsThe authors declare that they have no competing interests.
Authors' contributionsAJT conceived, designed and implemented the researchand wrote the paper. BM, DS, OS and YQ aided with ideas,methodological and editorial input. BM and AA providedsupport in data compilation. The final version of the man-uscript was seen and approved by all authors.
Additional material
AcknowledgementsThe authors are grateful to Bob Snow and Simon Hay for comments on ear-lier versions of this manuscript, to the Clinton Foundation for the financial support that facilitated this work, and to Noel Herrity and Shinuna Kassim
at Zantel for supply of the data used in the research. AJT and DLS are sup-ported by a grant from the Bill and Melinda Gates Foundation (#49446). This work forms part of the output of the Malaria Atlas Project (MAP, http://www.map.ox.ac.uk), principally funded by the Wellcome Trust, U.K.
References1. Feachem R, Sabot O: A new global malaria eradication strat-
egy. Lancet 2008, 371:1633-1635.2. Roberts L, Enserink M: Did they really say...eradication? Science
2007, 318:1544-1545.3. Mendis K, Rietveld A, Warsame M, Bosman A, Greenwood BM,
Wernsdorfer WH: From malaria control to eradication: theWHO perspective. Trop Med Int Health 2009, 14:802-809.
4. Pampana E: A textbook of malaria eradication Oxford: Oxford Univer-sity Press; 1963.
5. World Health Organization: Global malaria control and elimina-tion: report of a technical review. Geneva: World Health Organ-ization; 2008.
6. Moonen B, Barrett S, Tulloch J, Jamison DT: Making the decision.In Shrinking the malaria map: a prospectus on malaria elimination SanFrancisco: University of California; 2009:1-18.
7. Zanzibar Malaria Control Program: Roll back malaria indicatorsurvey: survey 2007. Zanzibar: Ministry of Health and SocialWel-fare; 2008.
8. Bhattarai A, Ali AS, Kachur SP, Martensson A, Abbas AK, Khatib R,Al-Mafazy AW, Ramsan M, Rotllant G, Gerstenmaier JF, Molteni F,Abdulla S, Montgomery SM, Kaneko A, Bjorkman A: Impact ofartemisinin-based combination therapy and insecticide-treated nets on malaria burden in Zanzibar. PLoS Med 2007,4:e309.
9. Hay SI, Guerra CA, Gething PW, Patil AP, Tatem AJ, Noor AM,Kabaria CW, Manh BH, Elyazar IRF, Brooker SJ, Smith DL, MoyeedRA, Snow RW: World malaria map: Plasmodium falciparumendemicity in 2007. PLoS Med 2009, 6:e1000048.
10. Schapira A: Prospects for eradication and elimination ofmalaria: Annexe 2. Opportunities, obstacles and risks forelimination of Plasmodium falciparum malaria in differencecountries and regions of the World with currently existingtools. London: Department for International Development; 2007.
Additional file 1Supplemental Information. Analyses of movement patterns of mainland residents based on mobile phone data.Click here for file[http://www.biomedcentral.com/content/supplementary/1475-2875-8-287-S1.PDF]
Page 11 of 12(page number not for citation purposes)
Malaria Journal 2009, 8:287 http://www.malariajournal.com/content/8/1/287
Publish with BioMed Central and every scientist can read your work free of charge
"BioMed Central will be the most significant development for disseminating the results of biomedical research in our lifetime."
Sir Paul Nurse, Cancer Research UK
Your research papers will be:
available free of charge to the entire biomedical community
peer reviewed and published immediately upon acceptance
cited in PubMed and archived on PubMed Central
yours — you keep the copyright
Submit your manuscript here:http://www.biomedcentral.com/info/publishing_adv.asp
BioMedcentral
11. Julvez J, Mouchet J, Ragavoodoo C: Epidemiologie historique dupaludisme dans l'archipel des Mascareignes (Ocean Indien).Ann Soc Belg Med Trop 1990, 70:249-261.
12. Prothero RM: Population movements and problems ofmalaria eradication in Africa. Bull World Health Organ 1961,24:405-425.
13. Sivagnanasundaram C: Rates of infection during the 1967-68 P.vivax epidemic in Sri Lanka (Ceylon). J Trop Med Hyg 1973,76:83-86.
14. Hammadi D, Boubidi SC, Chaib SE, Saber A, Khechache Y, Gasmi M,Harrat Z: Malaria in Algerian Sahara. Bull Soc Pathol Exot 2009,102:185-192.
15. Brockmann D, Hufnagel L, Geisel T: The scaling laws of humantravel. Nature 2006, 439:462-465.
16. Brockmann D, Theis F: Money circulation, trackable items, andthe emergence of universal human mobility patterns. Perva-sive Comput 2008, 7:28.
17. Candia J, Gonzalez MC, Wang P, Schoenharl T, Madey G, Barabasi AL:Uncovering individual and collective human dynamics frommobile phone records. J Phys A Math Gen 2008, 41:1-11.
18. Gonzalez MC, Barabasi AL: From data to models. Nat Phys 2007,3:224-225.
19. Gonzalez MC, Hidalgo CA, Barabasi AL: Understanding individualhuman mobility patterns. Nature 2008, 453:779-782.
20. Zanzibar Commission for Tourism: Annually recorded number oftourist arrivals in Zanzibar by country 2002-07. Zanzibar: Zan-zibar Commission for Tourism; 2008.
21. Zanzibar Ministry of Communications and Transport: Ferry passen-ger data 2006-2007. Zanzibar: Zanzibar Ministry of Communica-tions and Transport; 2008.
22. Guerra CA, Gikandi PW, Tatem AJ, Noor AM, Smith DL, Hay SI,Snow RW: The limits and intensity of Plasmodium falciparumtransmission: implications for malaria control and elimina-tion worldwide. PLoS Med 2008, 5:e38.
23. Guerra CA, Hay SI, Lucioparedes LS, Gikandi PW, Tatem AJ, NoorAM, Snow RW: Assembling a global database of malaria para-site prevalence for the Malaria Atlas Project. Malar J 2007,6:17.
24. Smith DL, Dushoff J, Snow RW, Hay SI: The entomological innoc-ulation rate and Plasmodium falciparum infection in Africanchildren. Nature 2005, 438:492-495.
25. Smith DL, McKenzie FE: Statics and dynamics of malaria infec-tion in anopheles mosquitoes. Malar J 2004, 3:13.
26. Smith DL, McKenzie FE, Snow RW, Hay SI: Revisiting the basicreproductive number for malaria and its implications formalaria control. PLoS Biol 2007, 5:e42.
27. Tanser F, Sharp B, le Sueur D: Potential effect of climate changeon malaria transmission in Africa. Lancet 2003, 362:1792-1798.
28. Tatem AJ, Noor AM, von Hagen C, di Gregorio A, Hay SI: High res-olution population maps for low income nations: combiningland cover and census in East Africa. PLoS ONE 2007, 2:e1298.
29. AfriPop Project [http://www.afripop.org]30. United Nations Population Division: World population prospects,
2008 revision. New York: United Nations; 2009. 31. Hay SI, Noor AM, Nelson A, Tatem AJ: The accuracy of human
population maps for public health application. Trop Med IntHealth 2005, 10:1-14.
32. Tanzania Communications Regulatory Authority: Telecommunica-tions statistics as at 31st December 2008. Edited by: TCR.DarEs Salaam; 2009.
33. James J, Versteeg M: Mobile phones in Africa: how much do wereally know? Soc Indic Res 2007, 84:117-126.
34. Vodafone: Africa; the impact of mobile phones. Vodafone PolicyPapers Series 2005: Vodafone Group .
35. Balk DL, Deichmann U, Yetman G, Pozzi F, Hay SI, Nelson A: Deter-mining global population distribution: methods, applicationsand data. Adv Parasitol 2006, 62:119-156.
36. Smith DL, Hay SI: Endemicity response timelines for Plasmo-dium falciparum elimination. Malar J 2009, 8:87.
37. Stewart L, Gosling R, Griffin J, Gesase S, Campo J, Hashim R, MasikaP, Mosha J, Bousema T, Shekalaghe S, Cook J, Corran P, Ghani A, RileyEM, Drakeley C: Rapid assessment of malaria transmissionusing age-specific sero-conversion rates. PLoS ONE 2009,4:e6083.
38. Okiro EA, Hay SI, Gikandi PW, Sharif SK, Noor AM, Peshu N, MarshK, Snow RW: The decline in paediatric malaria admissions onthe coast of Kenya. Malar J 2007, 6:151.
39. Kaneko A, Taleo G, Kalkoa M, Yamar S, Kobayakawa T, Bjorkman A:Malaria eradication on islands. Lancet 2000, 356:1560-1564.
40. Feachem RGA, Phillips AA, Targett GA, (Eds): Shrinking themalaria map: a prospectus on malaria elimination. San Fran-cisco: The Global Health Group, Global Health Sciences, Universityof California; 2009.
41. Malaria Atlas Project [http://www.map.ox.ac.uk]
Page 12 of 12(page number not for citation purposes)
http://www.ncbi.nlm.nih.gov/entrez/query.fcgi?cmd=Retrieve&db=PubMed&dopt=Abstract&list_uids=2291690
http://www.ncbi.nlm.nih.gov/entrez/query.fcgi?cmd=Retrieve&db=PubMed&dopt=Abstract&list_uids=2291690
http://www.ncbi.nlm.nih.gov/entrez/query.fcgi?cmd=Retrieve&db=PubMed&dopt=Abstract&list_uids=4574924
Related Documents