IEEE TRANSACTIONS ON NETWORK AND SERVICE MANAGEMENT 1 On Progressive Network Recovery from Massive Failures under Uncertainty Diman Zad Tootaghaj, Student Member, IEEE, Novella Bartolini, Senior Member, IEEE, Hana Khamfroush, Member, IEEE, Thomas La Porta, Fellow Member, IEEE Abstract—Network recovery after large-scale failures has tremendous cost implications. While numerous approaches have been proposed to restore critical services after large-scale failures, they mostly assume having full knowledge of failure location, which cannot be achieved in real failure scenarios. Making restoration decisions under uncertainty is often further compli- cated in a large-scale failure. This paper addresses progressive network recovery under the uncertain knowledge of damages. We formulate the problem as a mixed integer linear programming (MILP) and show that it is NP-Hard. We propose an iterative stochastic recovery algorithm (ISR) to recover the network in a progressive manner to satisfy the critical services. At each optimization step, we make a decision to repair a part of the network and gather more information iteratively, until critical services are completely restored. We propose three different approaches: 1) an iterative shortest path algorithm (ISR-SRT), 2) an approximate branch and bound (ISR-BB) and 3) an iterative multi-commodity LP relaxation (ISR-MULT). Further, we compared our approach with the state-of-the-art Centrality based Damage Assessment and Recovery (CeDAR) and iterative split and prune (ISP) algorithms. Our results show that ISR-BB and ISR-MULT outperform the state-of-the-art ISP and CeDAR algorithms while we can configure our choice of trade-off between the execution time, the number of repairs (cost) and the demand loss. We show that our recovery algorithm, on average, can reduce the total number of repairs by a factor of about 3 with respect to ISP, while satisfying all critical demands. Index Terms—Network Recovery, Massive Disruption, Stochas- tic Optimization, Uncertainty. I. I NTRODUCTION L ARGE-SCALE failures in communication networks due to natural disasters can severely affect critical com- munications and threaten the lives of people in that area. In 2005, Hurricane Katrina led to an outage of over 2.5 million lines in the BellSouth (now AT&T) network [2]. In 2017, more than 7 million subscribers to cable or wire-line telecommunication services lost service due to Hurricane Irma D. Z. Tootaghaj was with the Department of Computer Science and Engineering, Pennsylvania State University, University Park, PA 16802 USA. She is now with Networking and Mobility group, Hewlett Packard Enterprise Labs, Palo Alto, CA 94304 USA (email: {diman.zad-tootaghaj}@hpe.com). T. La Porta is with the School of Electrical Engineering and Computer Science in the Pennsylvania State University, University Park, PA 16802 USA (email: {tlp}@cse.psu.edu), N. Bartolini is with the Department of Computer Science, Sapienza University of Rome, 00185 Rome, Italy (email: {bartolini}@di.uniroma1.it ), H. Khamfroush is with the Department of Com- puter Science in University of Kentucky, Lexington, KY 40506 USA (email: {khamfroush}@cs.uky.edu ). A partial and preliminary version appeared in Proc. IEEE IFIP Networking’17 [1]. [3]. In the absence of a proper communication infrastructure, rescue operation becomes extremely difficult. Progressive and timely network recovery is, therefore, a key to minimizing losses and facilitating rescue missions. Many prior works on failure detection and recovery assume full knowledge of failures and use a deterministic approach for the recovery phase, e.g., [4, 5]. In real-world scenarios, however, the failure pattern might be unknown or only partially known. Therefore, classic recovery approaches may not work, as they should. To this end, we focus on network recovery assuming partial and uncertain knowledge of the failure pattern. We propose a multi-stage stochastic recovery algorithm, that uses three optimization techniques to repair a part of the network at each iteration To clarify the discussion, we consider different states of network components. Depending on the available knowledge, we consider the network to be partitioned into three areas: 1) a green area where all nodes/edges are known to be working, 2) a red area where the status of nodes/edges is known to be failed, and 3) a gray area where the status of nodes/edges is unknown. We improve the knowledge of the network state by installing monitors on top of the nodes repaired at each iteration. A monitor is a piece of software, which can be installed on a working node to discover the reachable nodes. Monitor nodes provide additional information about the status of the network, which can be used to revise and improve the recovery plan. The contributions of this work are the following: • We tackle for the first time, the problem of network recovery after massive disruption under uncertainty of the exact location of the disrupted nodes/links. • We formulate the minimum expected recovery (MINER) problem as a mixed integer linear programming and show that it is NP-Hard. MINER aims at satisfying the critical demand flows while minimizing the proposed expected recovery cost (ERC) function under network capacity constraints. • We propose a multi-stage iterative stochastic recovery (ISR) algorithm, that is presented in three different ver- sions (depending on the optimization algorithm that is used), namely, Iterative shortest path (ISR-SRT), Itera- tive Branch and Bound (ISR-BB), and iterative multi- commodity LP relaxation (ISR-MULT) to find a feasible solution and solve the MINER problem. • In order to provide a fair comparison with our approach, we modified the state-of-the-art iterative split and prune (ISP) algorithm [5], presented as progressive ISP to work

Welcome message from author
This document is posted to help you gain knowledge. Please leave a comment to let me know what you think about it! Share it to your friends and learn new things together.
Transcript

IEEE TRANSACTIONS ON NETWORK AND SERVICE MANAGEMENT 1
On Progressive Network Recovery from MassiveFailures under Uncertainty
Diman Zad Tootaghaj, Student Member, IEEE, Novella Bartolini, Senior Member, IEEE, Hana Khamfroush,Member, IEEE, Thomas La Porta, Fellow Member, IEEE
Abstract—Network recovery after large-scale failures hastremendous cost implications. While numerous approaches havebeen proposed to restore critical services after large-scale failures,they mostly assume having full knowledge of failure location,which cannot be achieved in real failure scenarios. Makingrestoration decisions under uncertainty is often further compli-cated in a large-scale failure. This paper addresses progressivenetwork recovery under the uncertain knowledge of damages. Weformulate the problem as a mixed integer linear programming(MILP) and show that it is NP-Hard. We propose an iterativestochastic recovery algorithm (ISR) to recover the network ina progressive manner to satisfy the critical services. At eachoptimization step, we make a decision to repair a part of thenetwork and gather more information iteratively, until criticalservices are completely restored. We propose three differentapproaches: 1) an iterative shortest path algorithm (ISR-SRT),2) an approximate branch and bound (ISR-BB) and 3) aniterative multi-commodity LP relaxation (ISR-MULT). Further,we compared our approach with the state-of-the-art Centralitybased Damage Assessment and Recovery (CeDAR) and iterativesplit and prune (ISP) algorithms. Our results show that ISR-BBand ISR-MULT outperform the state-of-the-art ISP and CeDARalgorithms while we can configure our choice of trade-off betweenthe execution time, the number of repairs (cost) and the demandloss. We show that our recovery algorithm, on average, can reducethe total number of repairs by a factor of about 3 with respectto ISP, while satisfying all critical demands.
Index Terms—Network Recovery, Massive Disruption, Stochas-tic Optimization, Uncertainty.
I. INTRODUCTION
LARGE-SCALE failures in communication networks dueto natural disasters can severely affect critical com-
munications and threaten the lives of people in that area.In 2005, Hurricane Katrina led to an outage of over 2.5million lines in the BellSouth (now AT&T) network [2]. In2017, more than 7 million subscribers to cable or wire-linetelecommunication services lost service due to Hurricane Irma
D. Z. Tootaghaj was with the Department of Computer Science andEngineering, Pennsylvania State University, University Park, PA 16802 USA.She is now with Networking and Mobility group, Hewlett Packard EnterpriseLabs, Palo Alto, CA 94304 USA (email: {diman.zad-tootaghaj}@hpe.com).T. La Porta is with the School of Electrical Engineering and ComputerScience in the Pennsylvania State University, University Park, PA 16802USA (email: {tlp}@cse.psu.edu), N. Bartolini is with the Department ofComputer Science, Sapienza University of Rome, 00185 Rome, Italy (email:{bartolini}@di.uniroma1.it ), H. Khamfroush is with the Department of Com-puter Science in University of Kentucky, Lexington, KY 40506 USA (email:{khamfroush}@cs.uky.edu ). A partial and preliminary version appeared inProc. IEEE IFIP Networking’17 [1].
[3]. In the absence of a proper communication infrastructure,rescue operation becomes extremely difficult. Progressive andtimely network recovery is, therefore, a key to minimizinglosses and facilitating rescue missions. Many prior workson failure detection and recovery assume full knowledge offailures and use a deterministic approach for the recoveryphase, e.g., [4, 5]. In real-world scenarios, however, the failurepattern might be unknown or only partially known. Therefore,classic recovery approaches may not work, as they should. Tothis end, we focus on network recovery assuming partial anduncertain knowledge of the failure pattern.
We propose a multi-stage stochastic recovery algorithm,that uses three optimization techniques to repair a part of thenetwork at each iteration To clarify the discussion, we considerdifferent states of network components. Depending on theavailable knowledge, we consider the network to be partitionedinto three areas: 1) a green area where all nodes/edges areknown to be working, 2) a red area where the status ofnodes/edges is known to be failed, and 3) a gray area where thestatus of nodes/edges is unknown. We improve the knowledgeof the network state by installing monitors on top of the nodesrepaired at each iteration. A monitor is a piece of software,which can be installed on a working node to discover thereachable nodes. Monitor nodes provide additional informationabout the status of the network, which can be used to reviseand improve the recovery plan. The contributions of this workare the following:
• We tackle for the first time, the problem of networkrecovery after massive disruption under uncertainty of theexact location of the disrupted nodes/links.
• We formulate the minimum expected recovery (MINER)problem as a mixed integer linear programming and showthat it is NP-Hard. MINER aims at satisfying the criticaldemand flows while minimizing the proposed expectedrecovery cost (ERC) function under network capacityconstraints.
• We propose a multi-stage iterative stochastic recovery(ISR) algorithm, that is presented in three different ver-sions (depending on the optimization algorithm that isused), namely, Iterative shortest path (ISR-SRT), Itera-tive Branch and Bound (ISR-BB), and iterative multi-commodity LP relaxation (ISR-MULT) to find a feasiblesolution and solve the MINER problem.
• In order to provide a fair comparison with our approach,we modified the state-of-the-art iterative split and prune(ISP) algorithm [5], presented as progressive ISP to work
2 IEEE TRANSACTIONS ON NETWORK AND SERVICE MANAGEMENT
under uncertainty, by allowing a progressive approach andadding a discovery phase at each iteration. We show thatsince ISP does not consider uncertain failures and makesrouting decisions at each iteration step, it may lead toincorrect routing decisions due to uncertainty which leadsto higher repair cost compared to our algorithms.
• Further, we compare our algorithms with the state-of-the-art Centrality based Damage Assessment and Recovery(CeDAR) algorithm [6]. CeDAR works under the incom-plete knowledge of failure but aims at maximizing thetotal satisfied flow during the recovery process, while weaim at minimizing the recovery cost. Further, CeDARdoes not use a probabilistic knowledge of failures. Ourresults show that ISR-BB and ISR-MULT outperform thestate-of-the-art ISP and CeDAR algorithms in terms ofrecovery cost.
We observed that since the algorithms in [5] have beendesigned for known network failure patterns, poor decisions inthe first iterations of the algorithm propagate through the entireexecution, while our algorithm can correct previous decisionsafter each iteration as more information becomes available andtherefore, reduces the recovery cost. Different configurationsof our algorithm can significantly improve the total numberof repairs over other heuristics while performing close to theoptimal in terms of recovery cost.
The remainder of this paper is organized as follows. Sec-tion II discusses the background and motivation behind thiswork. In Section III, we explain the minimum expected re-covery (MINER) problem and show it is NP-Hard. Section IVdescribes our approach to minimize the expected recoverycost. Section VI shows our evaluation methodology and ex-perimental results and Section VII concludes the paper with asummary.
II. BACKGROUND AND MOTIVATION
A. Background
Large-scale network failure detection and recovery havebeen studied when full knowledge of the failure pattern isavailable in the system [7–12]. To the best of our knowledge,network recovery has not been extensively studied underuncertainty.
In the absence of complete knowledge of disrupted networkcomponents, prior works propose network tomography tech-niques to localize node failures from binary states of end-to-end paths or infer the performance degradation of links [13–16]. Our paper differs significantly from the literature work inthe area of network tomography, as it uses progressive mon-itoring with the purpose of providing information necessaryto perform the recovery activities. The problem of recoveryis not considered in tomography studies which address theproblem of localizing sparse degradation and failures, and arenot suitable for massive failure scenarios.
In a different line of research the problem of networkrecovery has been studied in the case of interdependent net-works [17–21]. Dependent failures in interdependent networks
between a power grid and a communication network have beenstudied in [20]. Tootaghaj et al. propose a progressive recoveryapproach in an interdependent network consisting of a powergrid and a communication network [17, 18]. They assume alimited amount of resources available at each iteration stepand propose a progressive recovery heuristic that restores thepower lines while maximizing the total load served during therecovery intervention.
Wang et al. and Ciavarella et al. studied progressive networkrecovery for large-scale failures. They proposed a progressiverecovery approach to maximize the weighted sum of total flowover the entire steps of recovery [4, 6]. While both Wang etal. and Ciavarella et al.’s work and our work aim to designa progressive recovery approach, the objective is different. In[4] and [6], the objective is maximizing the throughput overtime, whereas we aim to minimize the total cost of repairunder link capacity constraints, which is closer to the work ofBartolini et al. [5, 22]. In addition, both [4] and [5], assumethat full knowledge of failure is available in the system whileour work and [6] do not make this assumption. We assume theavailability of a probabilistic estimate of the failure scenario,while [6] assumes lack of knowledge.
The problem of minimizing the recovery cost to satisfymultiple demand flows under network capacity or qualityof service constraint has been proven to be NP-hard andseveral heuristics have been proposed in the literature to reducethe complexity. Bartolini et al. propose a polynomial-timeheuristic, called ISP, to break the problem into smaller sub-problems using iterative split and prune [5]. While this ap-proach performs very close to the optimal when full knowledgeof network failure is available, its performance has not beeninvestigated under uncertain failure patterns.
We propose a progressive version of ISP in Section V-A andshow that the lack of detailed information regarding the statusof the network components causes a considerable amount ofadditional repairs with respect to the ideal case of completeknowledge. Then, we show that by running our multi-stagerecovery approach, we can reduce the total number of repairscompared to ISP and avoid unnecessary repairs. Furthermore,we show that single-stage optimization techniques or iterativealgorithms, which do not update the initial beliefs, do notperform well for uncertain failures. This is due to the fact that asmall mistake at the beginning of the single-stage optimizationalgorithms propagates through the following steps and nocorrective actions can be taken.
We design a novel iterative algorithm to have an approx-imate solution to the problem of network recovery underuncertainty of the status of network components. Unlike previ-ous algorithms, our approach provides an iterative monitoringactivity, which allows more informed decisions and correctiveactions as long as more information becomes available.
B. Motivation
In this section, we show the gap between optimal recoveryand ISP [5] when we do not have perfect information.
Consider a network in which a large-scale failure has
TOOTAGHAJ et al.: ON PROGRESSIVE NETWORK RECOVERY FROM MASSIVE FAILURES UNDER UNCERTAINTY 3
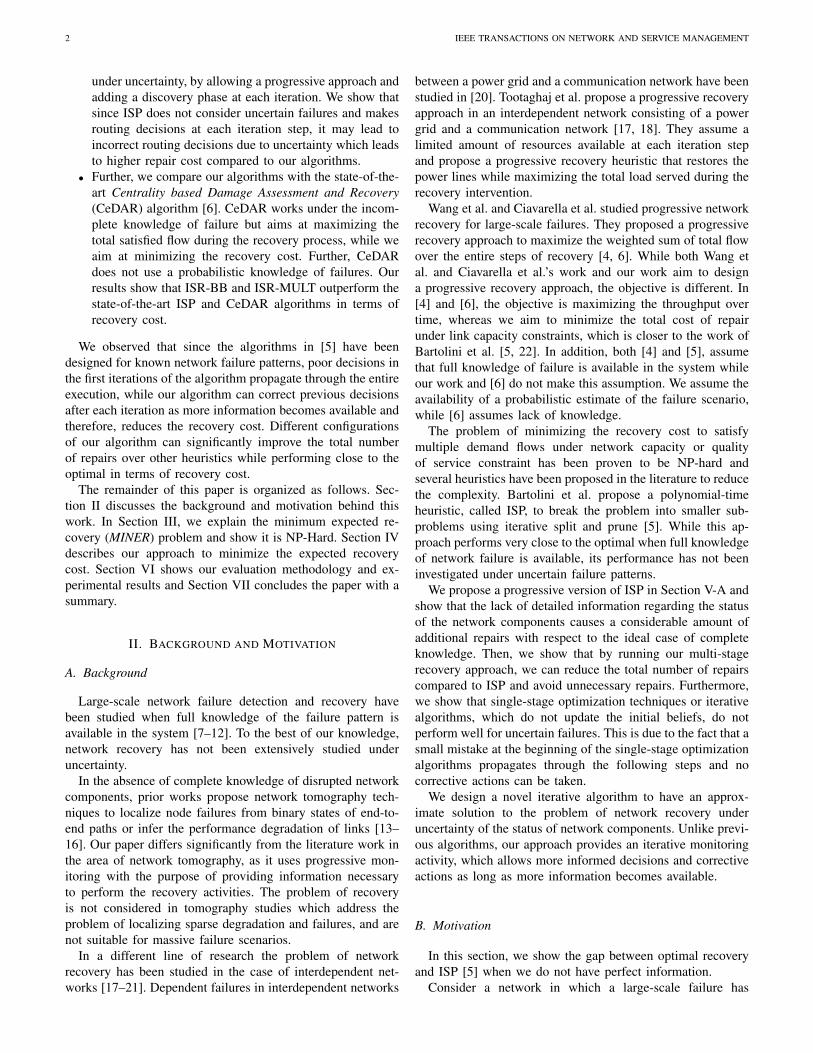
TABLE I: Number of repaired nodes/edges in optimal andISP with full information compared to ISP with gray area anduncertain-info, and progressive ISP.
NetworkName
# of networkelements(nodes/edges)
OPTfull-info
ISPfull-info
ISPuncertain-info
ProgressiveISP
BellCanada 112 28 34.23 79 45.39Deltacom 274 36.94 43.26 112 55.5KDL 1649 55.2 63.2 165.65 83.55
occurred. Due to the failures, the state of the entire networkis not visible to the network manager. Instead, the networkmanager knows that some nodes and links have failed, somecontinue to work, and the fate of others is uncertain (gray),meaning that their state is only known with some probability.If we use an algorithm like ISP to determine the requiredrepairs, it is likely that mistakes will be made due to theuncertain knowledge. ISP determines all the required repairs ina one-shot, meaning that once the algorithm is run, all repairsare determined. Therefore, it does not have an opportunity tolearn the state of the uncertain nodes. We performed a set ofsimulations on three different network topologies to illustratethe gap.
Table I shows the average total number of repairs for thethree algorithms on the three topologies for 10 random runs.As is shown, ISP with full information performs relativelyclose to the optimal in each case, while ISP with uncertaininformation requires more than three times the number ofrepairs as optimal in some cases.
We then modified ISP, as described in Section V-A, to run initerations, where at each iteration a repair is made. Informationabout network state is then gathered for any new portions ofthe network now visible due to the repair, and the algorithm isrun again with the new information until all demands are met.We call this algorithm progressive ISP. As can be seen in theTable, progressive ISP drastically reduces the repairs comparedto ISP with uncertain information. However, the gap betweenprogressive ISP and OPT full-info is still large which motivatesus to develop our iterative stochastic recovery (ISR) algorithmthat progressively repairs network elements and updates itsknowledge of the state of the network.
III. PROBLEM DEFINITION
We consider the problem of restoring critical services in anetwork subject to a large-scale failure, under the uncertainknowledge of the failure extent. We are interested in gradualrecovery of the network such that the total cost of repairednodes/edges during all steps of the recovery is minimized.
A. Network Model
Given an undirected graph G = (V,E) and a set of demandpairs EH = {(s1, t1), ..., (sk, tk)}, where EH ⊆ V × V andeach demand pair (sh, th) ∈ EH has a source sh, a destinationth and a positive demand flow dh, the goal is to minimize theexpected recovery cost (ERC) to satisfy the demands whilehaving capacity constraint cij for every edge in the graph.
TABLE II: Summary of notations.
Notation ExplanationG = (V,E) undirected graph modeling the communication net-
work. V is the set of nodes and E is the set of links.EH set of (source, destination) demand pairs.EB ⊆ E the set of broken edges in the red area.VB ⊆ V the set of broken nodes in the red area.EU ⊆ E the set of edges in the gray area whose failure pattern
is unknown.VU ⊆ V the set of nodes in the gray area whose failure patterns
is unknownEW ⊆ E the set of edges in the green area which are known
to be working correctly.VW ⊆ V the set of nodes in the green area which are known
to be working correctly.ζvi (n) the failure probability of node vi in the network at
the nth iteration.ζeij(n) the failure probability of edge eij in the network at
the nth iteration.keij(ζ
eij(n)) the cost of repairing edge eij in the network.
kvi (ζvi (n)) the cost of repairing vertex vi in the network.
cij the capacity of edge (i, j).fhij(n) the fraction of flow h that will be routed through link
(i, j).ηmax the maximum degree of the network.bhi (n) the flow h generated at node i.δeij the decision to repair link (i, j) ∈ E.δvi the decision to repair node i ∈ V .
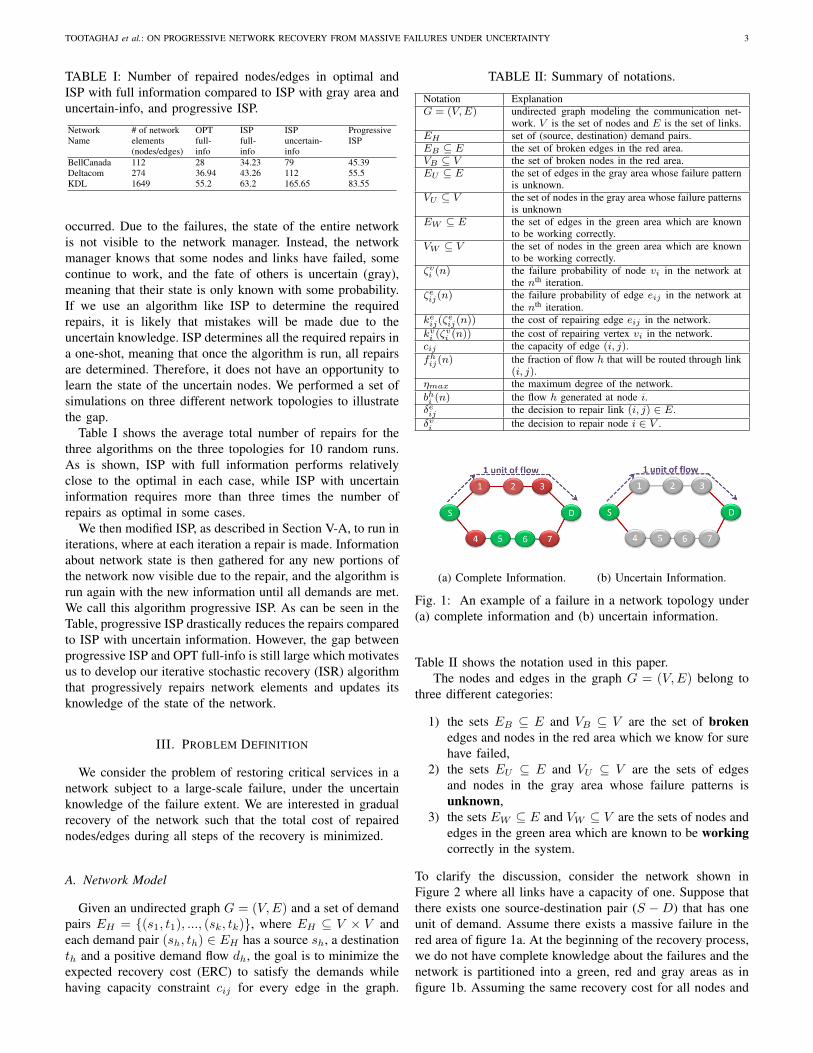
(a) Complete Information. (b) Uncertain Information.
Fig. 1: An example of a failure in a network topology under(a) complete information and (b) uncertain information.
Table II shows the notation used in this paper.The nodes and edges in the graph G = (V,E) belong to
three different categories:
1) the sets EB ⊆ E and VB ⊆ V are the set of brokenedges and nodes in the red area which we know for surehave failed,
2) the sets EU ⊆ E and VU ⊆ V are the sets of edgesand nodes in the gray area whose failure patterns isunknown,
3) the sets EW ⊆ E and VW ⊆ V are the sets of nodes andedges in the green area which are known to be workingcorrectly in the system.
To clarify the discussion, consider the network shown inFigure 2 where all links have a capacity of one. Suppose thatthere exists one source-destination pair (S −D) that has oneunit of demand. Assume there exists a massive failure in thered area of figure 1a. At the beginning of the recovery process,we do not have complete knowledge about the failures and thenetwork is partitioned into a green, red and gray areas as infigure 1b. Assuming the same recovery cost for all nodes and
4 IEEE TRANSACTIONS ON NETWORK AND SERVICE MANAGEMENT
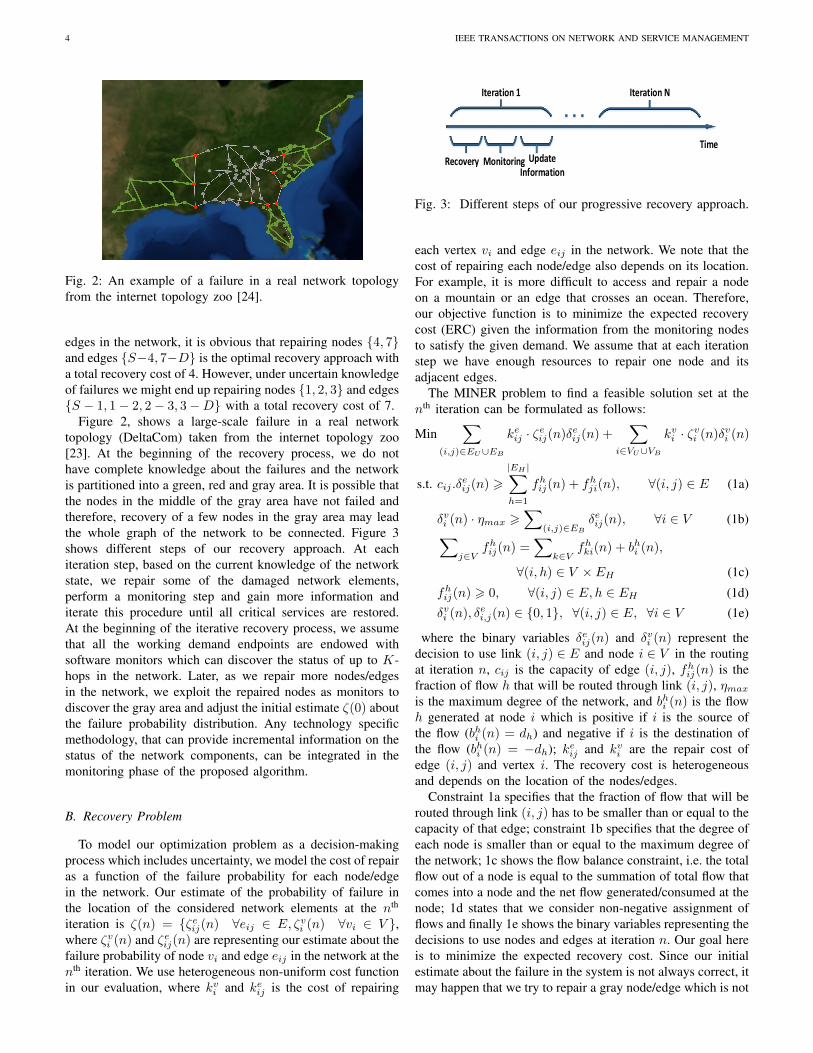
Fig. 2: An example of a failure in a real network topologyfrom the internet topology zoo [24].
edges in the network, it is obvious that repairing nodes {4, 7}and edges {S−4, 7−D} is the optimal recovery approach witha total recovery cost of 4. However, under uncertain knowledgeof failures we might end up repairing nodes {1, 2, 3} and edges{S − 1, 1− 2, 2− 3, 3−D} with a total recovery cost of 7.
Figure 2, shows a large-scale failure in a real networktopology (DeltaCom) taken from the internet topology zoo[23]. At the beginning of the recovery process, we do nothave complete knowledge about the failures and the networkis partitioned into a green, red and gray area. It is possible thatthe nodes in the middle of the gray area have not failed andtherefore, recovery of a few nodes in the gray area may leadthe whole graph of the network to be connected. Figure 3shows different steps of our recovery approach. At eachiteration step, based on the current knowledge of the networkstate, we repair some of the damaged network elements,perform a monitoring step and gain more information anditerate this procedure until all critical services are restored.At the beginning of the iterative recovery process, we assumethat all the working demand endpoints are endowed withsoftware monitors which can discover the status of up to K-hops in the network. Later, as we repair more nodes/edgesin the network, we exploit the repaired nodes as monitors todiscover the gray area and adjust the initial estimate ζ(0) aboutthe failure probability distribution. Any technology specificmethodology, that can provide incremental information on thestatus of the network components, can be integrated in themonitoring phase of the proposed algorithm.
B. Recovery Problem
To model our optimization problem as a decision-makingprocess which includes uncertainty, we model the cost of repairas a function of the failure probability for each node/edgein the network. Our estimate of the probability of failure inthe location of the considered network elements at the nth
iteration is ζ(n) = {ζeij(n) ∀eij ∈ E, ζvi (n) ∀vi ∈ V },where ζvi (n) and ζeij(n) are representing our estimate about thefailure probability of node vi and edge eij in the network at thenth iteration. We use heterogeneous non-uniform cost functionin our evaluation, where kvi and keij is the cost of repairing
Iteration 1 Iteration N
Time
Recovery Monitoring Update Information
Fig. 3: Different steps of our progressive recovery approach.
each vertex vi and edge eij in the network. We note that thecost of repairing each node/edge also depends on its location.For example, it is more difficult to access and repair a nodeon a mountain or an edge that crosses an ocean. Therefore,our objective function is to minimize the expected recoverycost (ERC) given the information from the monitoring nodesto satisfy the given demand. We assume that at each iterationstep we have enough resources to repair one node and itsadjacent edges.
The MINER problem to find a feasible solution set at thenth iteration can be formulated as follows:
Min∑
(i,j)∈EU∪EB
keij · ζeij(n)δeij(n) +∑
i∈VU∪VB
kvi · ζvi (n)δvi (n)
s.t. cij .δeij(n) >|EH |∑h=1
fhij(n) + fhji(n), ∀(i, j) ∈ E (1a)
δvi (n) · ηmax >∑
(i,j)∈EB
δeij(n), ∀i ∈ V (1b)∑j∈V
fhij(n) =∑
k∈Vfhki(n) + bhi (n),
∀(i, h) ∈ V × EH (1c)
fhij(n) > 0, ∀(i, j) ∈ E, h ∈ EH (1d)
δvi (n), δei,j(n) ∈ {0, 1}, ∀(i, j) ∈ E, ∀i ∈ V (1e)
where the binary variables δeij(n) and δvi (n) represent thedecision to use link (i, j) ∈ E and node i ∈ V in the routingat iteration n, cij is the capacity of edge (i, j), fhij(n) is thefraction of flow h that will be routed through link (i, j), ηmax
is the maximum degree of the network, and bhi (n) is the flowh generated at node i which is positive if i is the source ofthe flow (bhi (n) = dh) and negative if i is the destination ofthe flow (bhi (n) = −dh); keij and kvi are the repair cost ofedge (i, j) and vertex i. The recovery cost is heterogeneousand depends on the location of the nodes/edges.
Constraint 1a specifies that the fraction of flow that will berouted through link (i, j) has to be smaller than or equal to thecapacity of that edge; constraint 1b specifies that the degree ofeach node is smaller than or equal to the maximum degree ofthe network; 1c shows the flow balance constraint, i.e. the totalflow out of a node is equal to the summation of total flow thatcomes into a node and the net flow generated/consumed at thenode; 1d states that we consider non-negative assignment offlows and finally 1e shows the binary variables representing thedecisions to use nodes and edges at iteration n. Our goal hereis to minimize the expected recovery cost. Since our initialestimate about the failure in the system is not always correct, itmay happen that we try to repair a gray node/edge which is not

TOOTAGHAJ et al.: ON PROGRESSIVE NETWORK RECOVERY FROM MASSIVE FAILURES UNDER UNCERTAINTY 5
failed, but simply isolated from the working components. Thisis unavoidable in some cases. Nevertheless, it is an unwantedevent. For this reason, we distinguish between necessary andunnecessary recovery interventions. We associate a cost to theintervention on an unknown but working network element, totake account of the cost to send personnel to make a localinspection of the device. In the evaluation, we consider a met-ric called unnecessary repairs which corresponds to the totalnumber of nodes/edges in the gray area, ni ∈ VU , ei,j ∈ EU ,which we decide to use, δeij , δ
vi = 1, and are found to be
properly functional after a local inspection. On the other hand,necessary repairs are the total number of nodes/edges in thegray or red area, ni ∈ {VU ∪ VB}, ei,j ∈ {EU ∪ EB} whichwe decide to use, δeij , δ
vi = 1 and are found to be broken.
Proof of NP-Hardness. The Steiner Forest problem which isNP-Hard and APX-Hard in general graphs [25–27], is a specialcase of our optimization problem. To reduce the Steiner Forestproblem to an instance of our problem, we create one unit ofdemand flow for each demand pair in our supply graph. Weassume all source/destination pairs in the supply graph are theset of node pairs in the Steiner Forest problem for which wewant to find a forest with minimum cost. Furthermore, weassume there exist no broken/gray nodes in the supply graphand all edges are broken with expected repair cost of keijζ
eij .
We also assume that the capacity of edges is large enoughto accommodate the sum of all demand flows. Since thereexists no broken node, this instance of MINER returns a setof edges to recover, and since the capacity of links are largeenough to accommodate the sum of all flows, a single pathbetween any source/destination pair suffices to accommodatethe demand. Therefore, the union of repaired edges generates aSteiner forest because any cycle implies unnecessary repairs.Also, since MINER minimized the repair cost, the forest isthe one with minimum cost. Therefore, our problem is alsoNP-Hard.
In this work we do not consider cascading failures. Inparticular, when defining the status of the network elements,we assume that any cascading process is terminated and thefailure has reached its full extent. Notice also that ISR assumesthat, after recovery, routing will be performed according to acentralized scheme, based on the algorithm decisions so thatno overload will be produced on healthy links producing fur-ther cascading failures. The problem of cascading failures in acommunication network under uncontrolled routing is itself aninteresting problem and can be further studied in future works.Notice also that such a centralized approach is required duringan emergency and is made possible through the cooperation ofmultiple governmental and private entities. In the USA, for in-stance, the Federal Emergency Management Agency (FEMA)is in charge, according to the Stafford act, of providing disasterrelief and emergency assistance in the territory of the USA.The Agency recognizes the communication infrastructure arecritical for the community and includes it in the list of theinfrastructures to be repaired to restore critical communicationservices during an emergency, with utmost urgency. Despitethe fact that multiple private businesses may own different
parts of the communication infrastructure, FEMA promotesa holistic approach to disaster recovery providing financialand physical assistance. The example of FEMA holds for theUSA, but almost every country that recognizes the relevance ofthe communication network as a critical infrastructure adoptsidentical policies. For the same reason, in this paper weassume that all nodes can be exploited as monitors to gainmore information and can ping their neighbors to gather moreinformation.
C. Estimating the Probability Distribution of Network Failure
In the absence of detailed knowledge of which are thefailed components of the network, we assume the availabilityof a probabilistic estimate of the failure scenario. To thispurpose, we assume knowledge of the probability of failureof each node/link in the gray area, which can be foundusing machine learning algorithms [28, 29], reinforcementlearning approaches [30], seismography analysis in case of anearthquake [31], or understanding the robustness of differentparts of the network. This is typical of other works in thisarea. In [28], Bent et al. use historical sampling and machinelearning techniques to learn the distribution online. Tati etal. tackle the problem of unknown failure distribution fromthe perspective of reinforcement learning and propose analgorithm that learns path availabilities through probing [30].Guikema et al. use a statistical learning theory approach toanalyze risk and reliability of infrastructure systems [29].
Failures of network elements in the gray area may begeographically correlated or independent [32]. For example,if a router in a building has failed, then it is more likely thatother nodes/links in that building are also failed due to buildingcollapse. We model the intensity of the disruption accordingto a geographic failure distribution. For example, in case ofan earthquake with known epicenter coordinates and strength,we model the geographical distribution of failures accordingto a bi-variate Gaussian distribution centered at the epicenterof the earthquake, and with variance set in proportion to itsstrength. Instead, when failures are equally likely to occurin any network device of an area, we assume that they areuniformly distributed in a region wide enough to include all theknown failures. To evaluate the performance of our recoveryapproach when our estimate of the probability distribution offailure is not perfect, we performed a sensitivity analysis insection VI.
IV. ITERATIVE STOCHASTIC RECOVERY ALGORITHMS
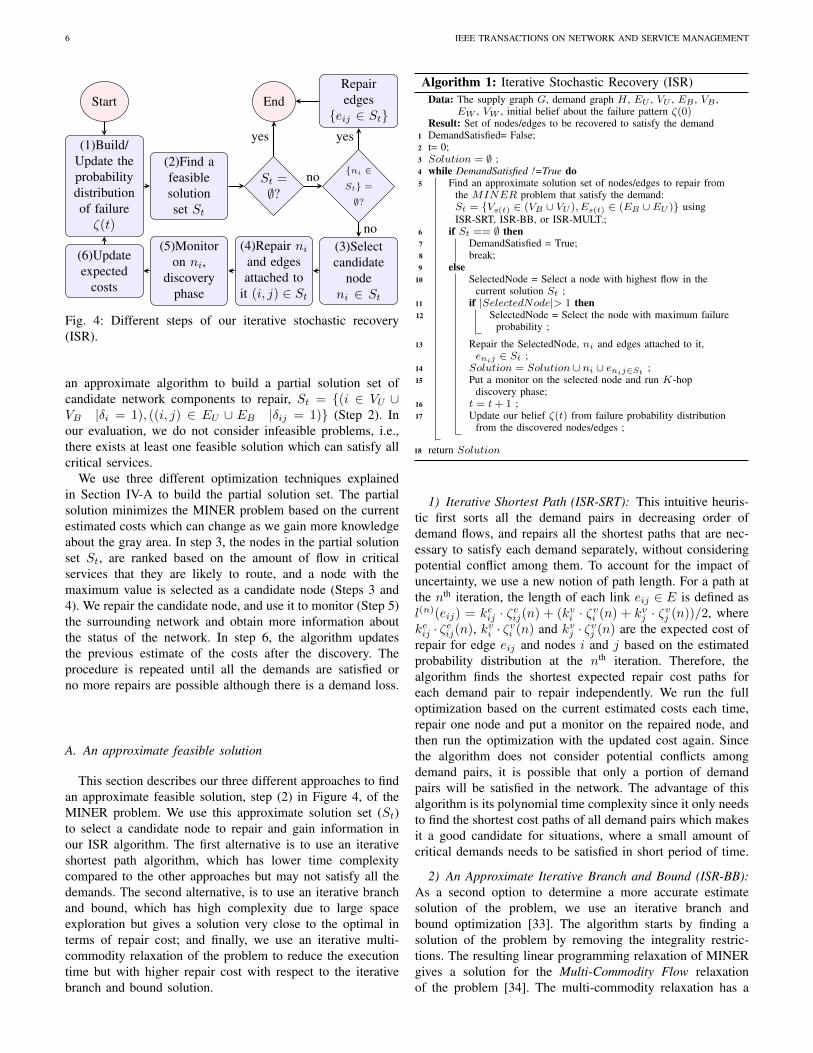
In this section, we propose the Iterative Stochastic Recovery(ISR) algorithm, in its three variants, namely, Iterative shortestpath (ISR-SRT), Iterative branch and bound (ISR-BB), anditerative multi-commodity (ISR-MULT). The skeleton of theseversions follow the same structure and only differ in termsof the approximate algorithm they use. We summarize ISRalgorithm in six main steps shown in Figure 4 and Algorithm 1.
Initially, ISR starts by estimating the probability distributionof the network failure (Step 1). At each iteration, ISR uses
6 IEEE TRANSACTIONS ON NETWORK AND SERVICE MANAGEMENT
Start
(1)Build/Update theprobabilitydistributionof failureζ(t)
(2)Find afeasiblesolutionset St
St =∅?
End
{ni ∈
St} =
∅?
Repairedges
{eij ∈ St}
(3)Selectcandidate
nodeni ∈ St
(4)Repair niand edgesattached to
it (i, j) ∈ St
(5)Monitoron ni,
discoveryphase
(6)Updateexpected
costs
yes
no
yes
no
Fig. 4: Different steps of our iterative stochastic recovery(ISR).
an approximate algorithm to build a partial solution set ofcandidate network components to repair, St = {(i ∈ VU ∪VB |δi = 1), ((i, j) ∈ EU ∪ EB |δij = 1)} (Step 2). Inour evaluation, we do not consider infeasible problems, i.e.,there exists at least one feasible solution which can satisfy allcritical services.
We use three different optimization techniques explainedin Section IV-A to build the partial solution set. The partialsolution minimizes the MINER problem based on the currentestimated costs which can change as we gain more knowledgeabout the gray area. In step 3, the nodes in the partial solutionset St, are ranked based on the amount of flow in criticalservices that they are likely to route, and a node with themaximum value is selected as a candidate node (Steps 3 and4). We repair the candidate node, and use it to monitor (Step 5)the surrounding network and obtain more information aboutthe status of the network. In step 6, the algorithm updatesthe previous estimate of the costs after the discovery. Theprocedure is repeated until all the demands are satisfied orno more repairs are possible although there is a demand loss.
A. An approximate feasible solution
This section describes our three different approaches to findan approximate feasible solution, step (2) in Figure 4, of theMINER problem. We use this approximate solution set (St)to select a candidate node to repair and gain information inour ISR algorithm. The first alternative is to use an iterativeshortest path algorithm, which has lower time complexitycompared to the other approaches but may not satisfy all thedemands. The second alternative, is to use an iterative branchand bound, which has high complexity due to large spaceexploration but gives a solution very close to the optimal interms of repair cost; and finally, we use an iterative multi-commodity relaxation of the problem to reduce the executiontime but with higher repair cost with respect to the iterativebranch and bound solution.
Algorithm 1: Iterative Stochastic Recovery (ISR)Data: The supply graph G, demand graph H , EU , VU , EB , VB ,
EW , VW , initial belief about the failure pattern ζ(0)Result: Set of nodes/edges to be recovered to satisfy the demand
1 DemandSatisfied= False;2 t= 0;3 Solution = ∅ ;4 while DemandSatisfied !=True do5 Find an approximate solution set of nodes/edges to repair from
the MINER problem that satisfy the demand:St = {Vs(t) ∈ (VB ∪ VU ), Es(t) ∈ (EB ∪ EU )} usingISR-SRT, ISR-BB, or ISR-MULT.;
6 if St == ∅ then7 DemandSatisfied = True;8 break;9 else
10 SelectedNode = Select a node with highest flow in thecurrent solution St ;
11 if |SelectedNode|> 1 then12 SelectedNode = Select the node with maximum failure
probability ;
13 Repair the SelectedNode, ni and edges attached to it,enij ∈ St ;
14 Solution = Solution ∪ ni ∪ enij∈St ;15 Put a monitor on the selected node and run K-hop
discovery phase;16 t = t+ 1 ;17 Update our belief ζ(t) from failure probability distribution
from the discovered nodes/edges ;
18 return Solution
1) Iterative Shortest Path (ISR-SRT): This intuitive heuris-tic first sorts all the demand pairs in decreasing order ofdemand flows, and repairs all the shortest paths that are nec-essary to satisfy each demand separately, without consideringpotential conflict among them. To account for the impact ofuncertainty, we use a new notion of path length. For a path atthe nth iteration, the length of each link eij ∈ E is defined asl(n)(eij) = keij · ζeij(n) + (kvi · ζvi (n) + kvj · ζvj (n))/2, wherekeij · ζeij(n), kvi · ζvi (n) and kvj · ζvj (n) are the expected cost ofrepair for edge eij and nodes i and j based on the estimatedprobability distribution at the nth iteration. Therefore, thealgorithm finds the shortest expected repair cost paths foreach demand pair to repair independently. We run the fulloptimization based on the current estimated costs each time,repair one node and put a monitor on the repaired node, andthen run the optimization with the updated cost again. Sincethe algorithm does not consider potential conflicts amongdemand pairs, it is possible that only a portion of demandpairs will be satisfied in the network. The advantage of thisalgorithm is its polynomial time complexity since it only needsto find the shortest cost paths of all demand pairs which makesit a good candidate for situations, where a small amount ofcritical demands needs to be satisfied in short period of time.
2) An Approximate Iterative Branch and Bound (ISR-BB):As a second option to determine a more accurate estimatesolution of the problem, we use an iterative branch andbound optimization [33]. The algorithm starts by finding asolution of the problem by removing the integrality restric-tions. The resulting linear programming relaxation of MINERgives a solution for the Multi-Commodity Flow relaxationof the problem [34]. The multi-commodity relaxation has a
TOOTAGHAJ et al.: ON PROGRESSIVE NETWORK RECOVERY FROM MASSIVE FAILURES UNDER UNCERTAINTY 7
polynomial time complexity and gives a lower bound (LB)for the minimization. If the solution satisfies all integralityrestrictions, then we have the optimal solution, otherwise, wepick a fractional variable, δx, and make two branches bycreating two more constraints in the optimization (δx = 0and δx = 1). We continue this procedure by making morebranches to get closer to optimal. The smallest branch thatsatisfies all integrality constraints is called an incumbent. Westop branching once the gap between the incumbent’s objectivefunction and the lower bound in the first iteration on theobjective function is smaller than a threshold (Gap), or wecan stop branching after passing a given time limit. In thefirst case, the algorithm gives a solution with an objectivefunction within (100 ∗ Gap)/LB percentage of the optimal.In the second case, there is no guarantee on the bound but wehave a guarantee on the execution time of the algorithm. Inthe worst-case scenario, we need to put all fractional variablesfrom the LP-relaxation of MINER in the solution set. At eachiteration, we run the optimization with the current estimationof the costs, repair one node and run the discovery phase, andthen run the optimization with the updated costs again.
The advantage of this algorithm is its low recovery cost.Although the execution time is high due to the exploration ofall possible branches, we can trade-off recovery cost to reducethe execution time.
3) An iterative multicommodity (ISR-MULT): Since theapproximate branch and bound algorithm has high executiontime due to large space exploration of branches, we proposea new iterative multicommodity solution. In this algorithm,we do not explore all possible branches, but only select thebranch which is more likely to stay in the final solution (bestcandidate node selection). We first start by constructing alinear programming (LP) relaxation of the MINER problemwhich can be solved in polynomial time providing non-integersolution for 0 ≤ δi ≤ 1 and 0 ≤ δi,j ≤ 1. The LP relaxationgives a lower bound on the objective function of MINER,but it can result in many repairs if we repair all fractionalvariables. To reduce the number of repairs, we select thebest candidate node from the current non-integer solutionto repair and run the discovery phase and update the costfunctions and failure probability distribution accordingly. Weiterate the algorithm until all the demand pairs are satisfied inthe network. Therefore, the iterative multicommodity solutionworks the same as a branch and bound technique except that,at each iteration of the algorithm we only select one of thebranches and do not explore other possible branches. At eachiteration of the algorithm, we repair the node or the edge whichcontributes the maximum flow. In case of ties, we choose thenetwork element with maximum failure probability.
B. Complexity analysis
In this section, we compare the complexity of the threeproposed approaches.
We note that all versions of ISR repair one node at a timeand therefore in the worst case scenario, the optimizationproblem needs O(|V |) iterations. In ISR-SRT, for each
demand pair (O|EH |) we calculate the shortest paths betweenthe endpoints in O(|E|)×O(|E|×log|V |), using the Dijkstraalgorithm repeatedly on residual graphs until the set of shortestpaths obtained is sufficient to meet the demand requirements.Notice that at each iteration, the residual graph will have atleast one edge less than the original graph. This iteration, forcalculating a number of shortest paths to satisfy the demandcan therefore be repeated up to O(|E|) times. Hence theISR-SRT has a complexity of O(EH) × O(|E|2×log|V |).Since it is executed in the algorithm of Figure 4 for upto O(|V |) times, the overall complexity of ISR-SRT isO(|V ||EH ||E|2×log|V |). Assuming that |E|= O(|V |),ISR-SRT has complexity O(|EH ||E|3×log|E|).
The bottleneck of the ISR-MULT algorithm issolving the LP relaxation. The relaxed problem hasO(|E|+|V |+|E||EH |) = O(|V |+|E||EH |) decisionvariables, and O(|E|+|V |+|V ||EH |) = O(|E|+|V ||EH |)constraints. The complexity of solving LP relaxation usingKarmarkar’s interior point method [35] is O(n3.5×L2), wheren is the number of variables and L is the number of bits inthe input. Therefore, under the assumption that |E|= O(|V |),the LP relaxation takes O(|E|7.5×|EH |7.5) and ISR-MULTtakes O(|E|8.5×|EH |7.5) to run. Assuming ISR-BB runsB branches to stop (depending on the time budget), thecomplexity of the algorithm is O(|B|×|E|8.5×|EH |7.5).
C. Best candidate node selection
The choice of the best candidate node, step (3) in Figure 4,is performed based on a centrality ranking, where we use anew notion of centrality which generalizes the classic conceptof betweenness centrality, to consider flow routing. Assumingthe total set of paths in the current solution (St), is P ∗ andP ∗ni
be the total set of paths in the current solution (St) thatcontain ni, then the candidate node, N∗i , is chosen as follows:
N∗i = argmaxni∈St
∑p∈P∗
ni
f(p)∑p∈P∗ f(p)
(2)
The numerator is the total amount of flow which can besatisfied in the current solution set (St) and passes throughni and the denominator is the total amount of satisfied flowin the current solution. We also tried a different criterion forselecting the best candidate node. In particular, we tried toselect the node with maximum failure probability. Extensivesimulation analysis shows that in most scenarios, selecting thenode with maximum centrality gives better results and reducesthe cost of repair. Therefore, we choose centrality as themain metric and whenever this metric is the same for severalnodes, we choose the node with maximum failure probability,argmaxni∈St
ζvni(t), to reduce unnecessary repairs, where
ζvni(t) represents the estimation of failure probability of node
ni, at time t.
D. Monitoring nodes
This section describes how monitor nodes probe the sur-rounding network to derive more information on the status
8 IEEE TRANSACTIONS ON NETWORK AND SERVICE MANAGEMENT
of the reachable nodes and links. We assume that at thebeginning of the algorithm, a monitor is deployed on eachdemand endpoint. Each monitor is able to identify other nodesthat are located within a distance of K-hops, for example byusing traceroutes or other probing methods.
Monitors adopt a breadth-first search algorithm to explorethe network, and truncate the visit at K-hops. Whenever amonitor determines that a node v is not able to forward theprobe to one of its neighbors w, the monitor marks both thelink (v, w) and the node w as gray as the monitor is not ableto assess whether the failure is located in the node w or inthe link (v, w). Note that a monitor node can only detect itsadjacent link failures.
E. When to iterate the optimization
In order to reduce the complexity of the algorithm, when thesolution of the current iteration of the approximate does notchange after the discovery phase, we propose the Heuristictrigger for solution update. Assuming S∗ is the total set ofnodes/edges in the gray area and S(t) is the total set of graynodes/edges which have to be repaired to satisfy the demandsin the current iteration of the algorithm, it is possible that afterrunning the discovery phase of our algorithm the next solutionset S(t + 1) remains the same and therefore we do not needto iterate the optimization.Heuristic trigger for solution update. Before running thediscovery phase, if the cost function for the current solutionS(t) was X , and it changes to X ′ after K-hops discovery,and the cost function of the set outside the current solutionS∗ − S(t) was Y and changes to Y ′ after K-hops discovery,then we only need to re-run the optimization if X − X ′ <Y −Y ′ because there exists a possibility that there is a bettersolution other than the current solution.
V. COMPARISON WITH PRIOR WORKS
In this section, we introduce two prior works, ISP [5] andCeDAR [6] that aim at recovering the network progressivelyafter large-scale disruption. Since the state-of-the-art ISP al-gorithm assumes perfect knowledge of the failed components,we modify it to work under uncertainty and call it progressiveISP.
A. Progressive ISP
This section describes progressive ISP which is our ex-tension of the state-of-the-art iterative split and prune (ISP)[5]. The basic ISP algorithm starts iteratively by ranking thenodes based on a new centrality metric, called demand basedcentrality, and reducing the demands by either pruning orsplitting the demand on the best candidate node. The demandpair which is least likely to be routed elsewhere is split overthe repaired node to break the problem into two smaller sub-problems. The demand can be pruned once we find a workingpath that can satisfy a portion of the demand.
While it has been shown that ISP, in terms of recoverycost, performs very close to optimal compared to other greedyapproaches when full knowledge of the failure is known,it performs poorly under uncertain failure distributions (seeTable I). Therefore, we adapted the algorithm to accommodateuncertain failures in a gray area, and iterate at each step todiscover the status of gray nodes/edges by putting monitoringnodes on the repaired nodes. We use an uncertain estimationof failure distribution in the first iteration of the algorithmand change the length of the edge eij ∈ E at the nth
iteration to l(n)(eij)/cij where l(n)(eij) is the expected costof eij based on the estimated probability distribution at thenth iteration defined in Section IV-A1 (ISR-SRT), and cijis capacity of eij . The edge cost is divided by cij to givehigher cost to the paths which have smaller capacity. Further,we put monitoring software on the node which is chosen tosplit the demand at each iteration to discover the gray area.However, once the demand splits over a candidate node, arouting decision is made on the selected node. Therefore, as wewill see in Section VI, even with the help of monitoring nodes,progressive ISP does not perform well in terms of the totalnumber of repairs under uncertain failures. In the remainderof the paper, we use the terms ”progressive ISP” and ”ISP”interchangeably.
B. CEDAR
Ciavarella et al. [6] propose a polynomial-time heuristiccalled Centrality based Damage Assessment and Recovery(CeDAR) that progressively recovers the network under theincomplete knowledge of failure. CeDAR aims at maximizingthe total satisfied flow during the recovery process. At each it-eration step of CeDAR, a limited amount of budget is availableto repair nodes/edges and the repairs are scheduled accordingto the availability of the resources at each time step. Whileour progressive recovery approach and CeDAR differ in theobjective function, they both propose a progressive recoveryunder the incomplete knowledge of failures and therefore, wecompare our result with CeDAR in Section VI in terms ofnumber of repaired nodes/edges and monitors placed.
At each iteration stage, CeDAR makes a repair decisionbased on the available resources and simplifies the problem byreducing the demand according to the pruning operation. Also,CeDAR updates the current status of the network by puttinga monitor on the repaired node and progressively updates theincomplete knowledge of the disrupted area. However, CeDARdoes not make any assumption of the probabilistic failuredistribution of the disrupted area.
VI. EVALUATION
In this section, we compare ISR algorithms, presented in IV,to the modified version of ISP introduced in Sections V-A. Weuse different network topologies including planar and non-planar real topologies taken from the Internet Topology Zoo[23, 24]. In particular considering the topologies BellCanada,Deltacom, and KDL. In addition to these ISP topologies, we

TOOTAGHAJ et al.: ON PROGRESSIVE NETWORK RECOVERY FROM MASSIVE FAILURES UNDER UNCERTAINTY 9
TABLE III: Network characteristics used in our evaluation.
Network Name # of nodes # of edges Average Node degreeBellCanada 48 64 2.62Deltacom 113 161 2.85KDL 754 895 2.37Minnesota 681 921 2.7
considered a physical layer topology, using the map of thefiber network of Minnesota made available by Aurora FiberOptic Network [36], which results from the collaboration ofmore than 50 carriers in the state.
Table III shows the characteristics of the topologies usedfor the evaluation. In addition to the real network topologies,we use synthetic Erdos-Renyi graphs with 100 nodes, wherewe varied the probability of having an edge between any twodifferent nodes, to investigate the behavior of the algorithmsin scenarios of increasing complexity.
In the following experiments, we consider several scenarios,in which we vary different aspects, such as the number ofdemand pairs, the amount of flow demand for each pair,and the parameters defining the geographical extent of thedisrupted area. For each scenario we randomize the resultsrunning 20 different trials, in which, depending on the sce-nario, we vary the random selection of source/destinationpairs and the random disruption of network elements. Weimplement our recovery algorithms in python and used theGurobi optimization toolkit, on a 24-core, 2.6 GHz, 32G RAMcluster [37].
A. K-hop discovery impact
In this section, we investigate the impact of the depth of thediscovery phase on the performance of the proposed algorithm.We change the number of discovered hops for the monitoringnodes from 1 to 5. We use the Minnesota fiber network topol-ogy with 6 demand pairs and 5 units of flow per demand. Thelink capacity is set randomly in the interval [20, 30]. We usea unitary repair cost for each node and edge. From Figure 5a,we can see that increasing the number of discovered hopsimproves the restoring performance of our algorithms in termsof total repair cost. We performed similar experiments withdifferent topologies, which we do not show in this paper, dueto space limitations, and obtained similar results. As Figure 5ahighlights, the number of monitoring hops affects the numberof unnecessary repairs (which we recall are the interventionsperformed on actually working, though, unreachable nodes)significantly, while it has a moderate effect on the number ofnecessary repairs. In fact, an inspection performed on a brokenelement with unknown status, always results in a necessaryintervention. By contrast, additional knowledge resulting froma higher setting of the parameter K, helps in reducing thenumber of unnecessary interventions.
From this example it is clear that ISP works worse than ISR.In fact, ISP is not designed to work with uncertain knowledgeof failure locations. Indeed ISP associates repair interventionswith routing decisions, and never reverts a decision made at apast stage using information made available at later stages. Bycontrast, all variants of SRT are able to adjust routing decisions
0
20
40
60
80
100
120
140
160
180
0 1 2 3 4 5
Co
st
of
rep
airs
K-hop discovery
P-ISP Total
P-ISP Necessary
ISR-MULT Total
ISR-MULT Necessary
ISR-BB Total
ISR-BB Necessary
OPT full-info
(a) Increasing K-hop.
0
20
40
60
80
100
120
10 15 20 25 30 35 40 45 50
Co
st
of
rep
airs
Percentage of disruption
P-ISP Total
P-ISP Necessary
ISR-MULT Total
ISR-MULT Necessary
ISR-BB Total
ISR-BB Necessary
OPT full-info
(b) Increasing disruption.
Fig. 5: K-hop discovery and disruption variance (K-hop=2),(Minnesota fiber network topology).
700
750
800
850
900
950
1000
0 5 10 15 20C
ost
of
rep
airs
Variance of Cost
P-ISP Total
P-ISP Necessary
ISR-MULT Total
ISR-MULT Necessary
ISR-BB Total
ISR-BB Necessary
OPT full-info
(a) Heterogeneous cost.
18
20
22
24
26
28
30
32
34
-20 -15 -10 -5 0 5 10 15 20 25
Nu
mb
er
of
rep
airs
Over/Under-estimation of failure variance
P-ISP Total
P-ISP Necessary
ISR-MULT Total
ISR-MULT Necessary
ISR-BB Total
ISR-BB Necessary
OPT full-info
(b) Sensitivity analysis.
Fig. 6: a) The impact of heterogeneous repair cost variationon total cost of repair, b) Over/under-estimation of the dis-ruption by adding an error between -20 to 25 to the variance(BellCanada, K-hop=2).
based on the most updated available knowledge, which resultsin lower recovery costs with respect to ISP.
B. Percentage of Disruption
In this scenario, addressed in Figure 5b, we change theamount of disruption in the network to evaluate the perfor-mance of the algorithms. We use the Minnesota fiber networktopology with 6 demand pairs and 5 units of flow per demandpair. The link capacity is set randomly in the interval [20, 30].We used a Gaussian failure distribution and changed thepercentage of disruption from 10 to 50. Figure 5b shows thesimulation results for this scenario.
We observe that the difference from the optimal is higherfor small amount of disruption, and all the algorithms performclose to each other when the percentage of disruption is higher.This is due to the fact that, as we increase the percentageof disruption, the total number of repairs increases until thewhole network get disrupted. Therefore, the uncertainty in thegray area has less impact on the restoration performance of thealgorithms because the whole gray area is failed. Furthermore,the number of necessary and unnecessary repairs is the samefor dense disruptions since most of the nodes in the networkare failed and the discovery phase does not help to reduce thenumber of unnecessary repairs by a large amount.
10 IEEE TRANSACTIONS ON NETWORK AND SERVICE MANAGEMENT
C. Heterogeneous repair cost
In this scenario, we analyze the impact of heterogeneous re-pair cost. We considered BellCanada topology with 5 demandpairs and 5 units of flow per demand pair. The link capacity isset randomly in the interval [20, 50]. We considered a scenariowhere the whole network is disrupted and used heterogeneousrepair cost with the average of 20 derived from a uniformdistribution, and changed the variance of cost from 0 to 20.Figure 6a shows the total and necessary repair cost for thisscenario. As shown, our recovery algorithms perform better interms of the total cost of repairs compared to the state-of-the-art ISP algorithm when the variance of heterogeneity is higher.This is due to the fact that when the variance of heterogeneityis higher, the algorithm has a higher solution space to choosethe repair schedule and therefore, the algorithm performs bettercompared to a homogeneous repair cost for all nodes/edges.Therefore, in the next set of experiments, we consider ahomogeneous repair cost.
D. Sensitivity analysis
In our next set of experiments, we study the sensitivityof the proposed algorithm with respect to the correctness ofthe initial failure estimation. We use the BellCanada topologywhere the link capacity is set randomly in the interval [20, 50].The network disruption is randomly generated according toa Gaussian geographic distribution with a variance of 50that destroys 50% of network components on average. Weconsider a varying error in the estimate of the disruptionextent, and we overestimate/underestimate the disruption byadding an error between -20 to 25 to the variance of thedisruption. Figure 6b shows the simulation results for thisscenario, where an error of 0 means that the estimate isgenerated according to the same distribution that is used togenerate the failures. We observe that when we underestimatethe disruption, the algorithms try to route the critical demandsthrough a part of the network, which is more likely to be failed.Overestimating the disruption assumes that more nodes/edgeshave been failed than the real disruption. Thus the algorithmattempts to repair a node/edge which was not really destroyed,therefore, there is a higher number of unnecessary repairs.Furthermore, the number of repairs does not change beyonda specific overestimation, because with higher disruption, weare assuming that the whole network is disrupted and theGaussian distribution does not give much information aboutthe disruption. ISR-BB performs better than other algorithmsin overestimation or perfect estimation scenarios, but its restor-ing performance decreases for underestimation scenarios. ISR-MULT is more robust in underestimation scenarios and inperfect/overestimation scenarios its performance is close toISP.
E. Impact of the accuracy of estimate in the initial probabilitydistribution
In this set of experiments, we use the DeltaCom topologywith 6 demand pairs and 5 units of flow per demand pair,
15
20
25
30
35
40
45
10 20 30 40 50 60 70 80 90
Nu
mb
er
of
No
de
re
pa
irs
Inaccuracy Percentage of knowledge
P-ISP
ISR-MULT
ISR-BB
OPT full-info
CeDAR
(a) Number of node repairs.
16
18
20
22
24
26
28
30
10 20 30 40 50 60 70 80 90
Nu
mb
er
of
Ed
ge
re
pa
irs
Inaccuracy Percentage of knowledge
P-ISP
ISR-MULT
ISR-BB
OPT full-info
CeDAR
(b) Number of edge repairs.
10
15
20
25
30
35
40
45
50
10 20 30 40 50 60 70 80 90
Nu
mb
er
of
Mo
nito
rs
Inaccuracy Percentage of knowledge
P-ISP
ISR-MULT
ISR-BB
OPT full-info
CeDAR
(c) Number of monitors.
30
35
40
45
50
55
60
65
70
10 20 30 40 50 60 70 80 90
Nu
mb
er
of
tota
l re
pa
irs
Inaccuracy Percentage of knowledge
P-ISP
ISR-MULT
ISR-BB
OPT full-info
CeDAR
(d) Number of total repairs.
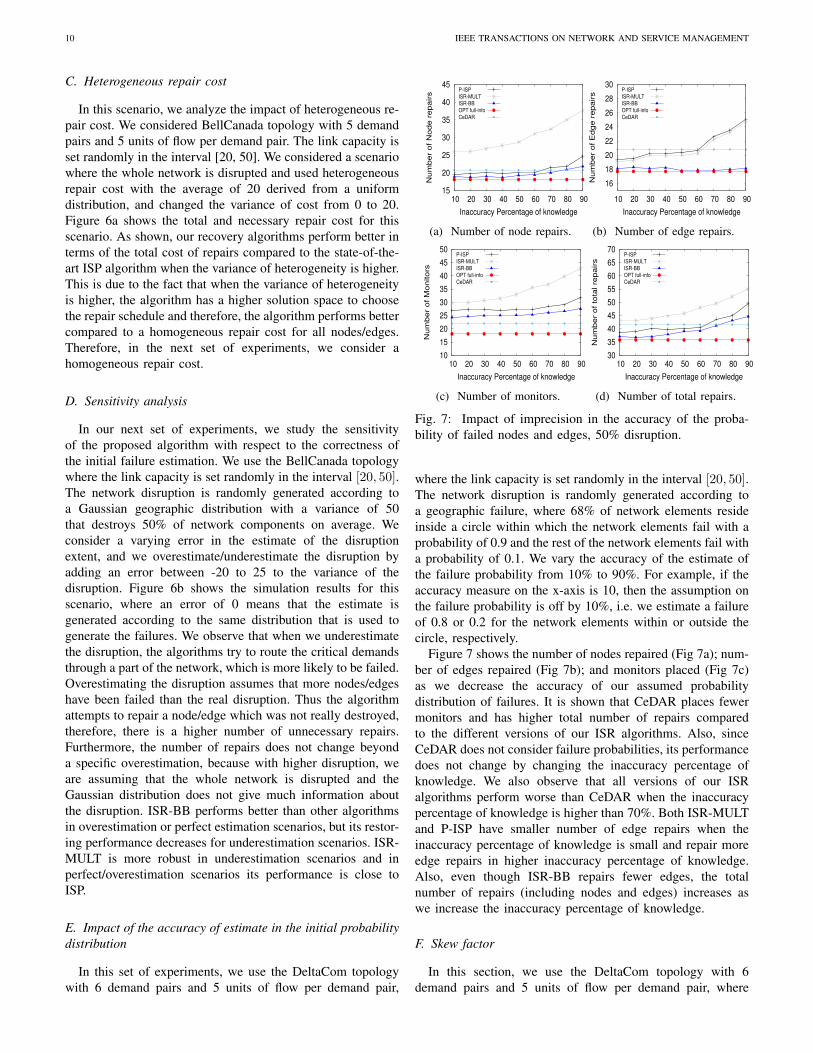
Fig. 7: Impact of imprecision in the accuracy of the proba-bility of failed nodes and edges, 50% disruption.
where the link capacity is set randomly in the interval [20, 50].The network disruption is randomly generated according toa geographic failure, where 68% of network elements resideinside a circle within which the network elements fail with aprobability of 0.9 and the rest of the network elements fail witha probability of 0.1. We vary the accuracy of the estimate ofthe failure probability from 10% to 90%. For example, if theaccuracy measure on the x-axis is 10, then the assumption onthe failure probability is off by 10%, i.e. we estimate a failureof 0.8 or 0.2 for the network elements within or outside thecircle, respectively.
Figure 7 shows the number of nodes repaired (Fig 7a); num-ber of edges repaired (Fig 7b); and monitors placed (Fig 7c)as we decrease the accuracy of our assumed probabilitydistribution of failures. It is shown that CeDAR places fewermonitors and has higher total number of repairs comparedto the different versions of our ISR algorithms. Also, sinceCeDAR does not consider failure probabilities, its performancedoes not change by changing the inaccuracy percentage ofknowledge. We also observe that all versions of our ISRalgorithms perform worse than CeDAR when the inaccuracypercentage of knowledge is higher than 70%. Both ISR-MULTand P-ISP have smaller number of edge repairs when theinaccuracy percentage of knowledge is small and repair moreedge repairs in higher inaccuracy percentage of knowledge.Also, even though ISR-BB repairs fewer edges, the totalnumber of repairs (including nodes and edges) increases aswe increase the inaccuracy percentage of knowledge.
F. Skew factor
In this section, we use the DeltaCom topology with 6demand pairs and 5 units of flow per demand pair, where

TOOTAGHAJ et al.: ON PROGRESSIVE NETWORK RECOVERY FROM MASSIVE FAILURES UNDER UNCERTAINTY 11
the link capacity is set randomly in the interval [20, 50].The network disruption is randomly generated according toa geographic failure, where 50% of network elements resideinside a circle within which the network elements fail witha probability of 0.1 and the rest of the network elements failwith a probability of 0.9. This allows us to evaluate the impactof the certainty of the failure on our algorithm. We expect thatthe higher the certainty we have of the status of a gray networkelement, the better the results.
We then increase the probability of failure inside the circlefrom 0.1 to 0.9. The skew factor is 9 in the beginning anddecreases to 1 as we increase the failure probability of thecircle. Figure 8 shows the number of nodes repaired (Fig 8a);number of edges repaired (Fig 8b); and monitors placed(Fig 8c) as we increase the imprecision in our initial theprobability distribution of failures.
We note that, although the algorithms might repair slightlyhigher/lower number of nodes/edges, but the number of totalrepairs (nodes and edges), compared to the optimal, is higherfor smaller skew factors. We observe that, CeDAR placesfewer monitors again in this scenario and has a higher totalnumber of repairs when the skew factor is high, but whenthe skew factor is smaller its performance is close to ourISR approaches. We underline that since CeDAR’s objectivefunction is different from ours, we only compare CeDAR withour algorithms in the scenarios where we want to evaluate theinaccuracy in the evaluation of the disruption percentage andskew factor in Figures 7 and 8.
G. Trade-off on demand loss, time complexity, and number ofrepairs
The recovery problem can be addressed by giving differentpriority to performance aspects such as: 1) demand loss, 2)execution time and 3) number of repairs (cost). These aspectsare in conflict with each other; therefore, we study the trade-off between them.
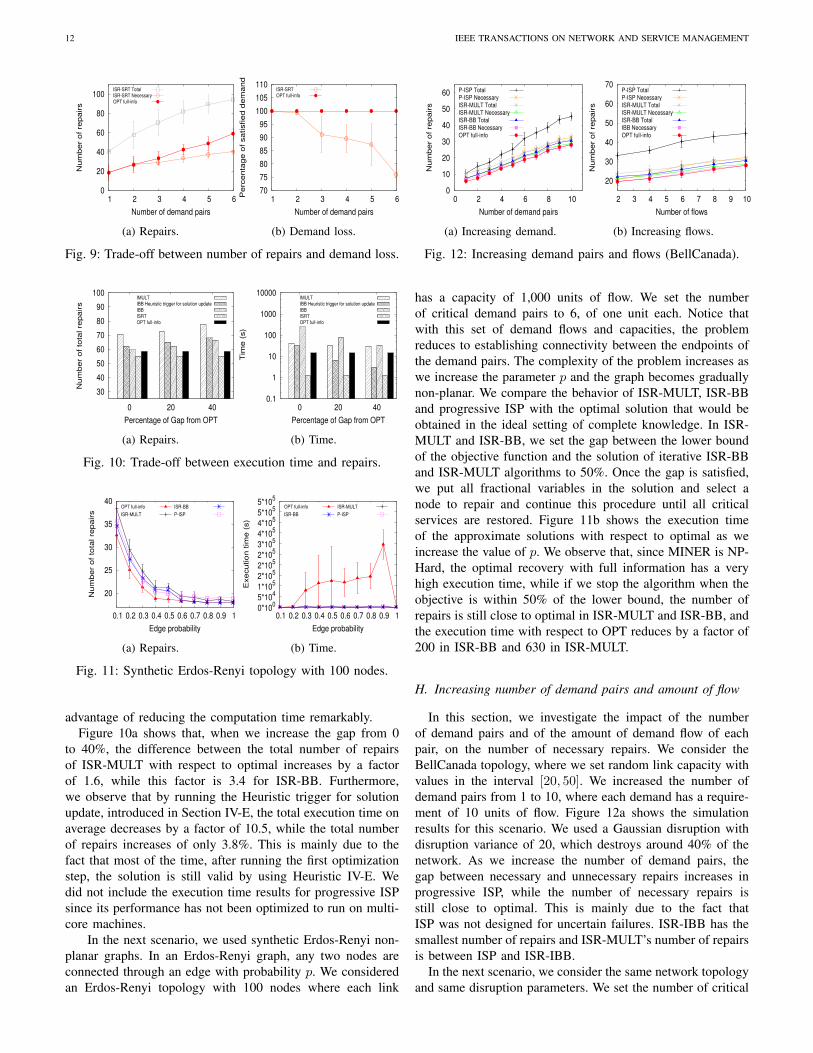
In this scenario, addressed in Figure 9, we considered theDeltacom topology, where we set the link capacity randomlyin the interval [20, 30]. We compare ISR-SRT to OPT todetermine the amount of demand flow loss in ISR-SRT. Wevary the number of critical demand flows from 1 to 6.Each demand pair has a requirement of 22 units of flow.The network disruption is randomly generated according toa Gaussian geographic distribution that causes the disruptionof 43% of the network components on average.
Figure 9a shows that ISR-SRT performs a smaller number ofnecessary repairs than OPT but a much higher number of totalrepairs, meaning that ISR-SRT schedules repairs for nodes thatare found to be working. Figure 9b also shows that ISR-SRTdoes not meet the demand requirements. The percentage ofsatisfied demands drops to 75% when the number of demandpairs grows to 6.
The reason for demand loss is due to the fact that ISR-SRTdoes not consider potential conflicts among different demands,and the decision on the nodes/links to be repaired is madeseparately for every demand pair without considering other
0
5
10
15
20
25
30
35
40
45
1 2 3 4 5 6 7 8 9
Nu
mb
er
of
No
de
re
pa
irs
Skew factor
P-ISP
ISR-MULT
ISR-BB
OPT full-info
CeDAR
(a) Number of node repairs.
5
10
15
20
25
30
35
1 2 3 4 5 6 7 8 9
Nu
mb
er
of
Ed
ge
re
pa
irs
Skew factor
P-ISP
ISR-MULT
ISR-BB
OPT full-info
CeDAR
(b) Number of edge repairs.
0
5
10
15
20
25
30
35
40
45
1 2 3 4 5 6 7 8 9
Nu
mb
er o
f M
on
ito
rs
Skew factor
P-ISP
ISR-MULT
ISR-BB
OPT full-info
CeDAR
(c) Number of monitors.
10
20
30
40
50
60
70
1 2 3 4 5 6 7 8 9
Nu
mb
er
of
tota
l re
pa
irs
Skew factor
P-ISP
ISR-MULT
ISR-BB
OPT full-info
CeDAR
(d) Number of total repairs.
Fig. 8: Impact of skew factor in the accuracy of the probabilityof failed nodes and edges, 50% disruption.
demands of the network. This has two effects. First, it may leadto the wrong decisions, and therefore increases the numberof unnecessary repairs. Second, the algorithm might make arouting decision in one iteration for a specific demand pairwhich turns to be in conflict with another demand pair in thenext iteration and make it impossible for the second demandpair to be satisfied. Therefore, the repairs that are required toroute the second demand pair are not performed due to theconflict, and the demand is not satisfied. This implies that thenumber of necessary repairs would be less w.r.t the optimalsolution. Since ISR-SRT has demand loss, we do not considerthe performance of ISR-SRT approach in other experiments.We underline that the other algorithms, namely OPT, ISR-BB and ISR-MULT, repair nodes/edges until all demand pairsare satisfied. In these algorithms, no routing decision is madebefore finding a feasible solution for all demand pairs. Forthis reason, they never show a demand loss. Since our goalis to restore all critical services, we do not further evaluateISR-SRT. However, due to its low computational complexity,the algorithm can be used in scenarios where the demand loadis low and a short computation time is required.
In the next experiment we used the same topology, under alarger disruption, corresponding to 75% of network elementson average. We consider 5 demand pairs, of 17 flow units each.In order to evidence the tradeoff between the number of repairsand computation time, in Figure 10 we vary the gap betweenthe lower bound of the objective function and the solution ofiterative ISR-BB and ISR-MULT algorithms from 0 to 40%.We recall that by increasing this gap, we decrease the numberof iterations of the optimization algorithms, and therefore weobtain an approximation of the solution that is farther fromthe optimal. Nevertheless, the increase in the gap has the
12 IEEE TRANSACTIONS ON NETWORK AND SERVICE MANAGEMENT
0
20
40
60
80
100
1 2 3 4 5 6
Nu
mb
er
of
rep
airs
Number of demand pairs
ISR-SRT Total
ISR-SRT Necessary
OPT full-info
(a) Repairs.
70
75
80
85
90
95
100
105
110
1 2 3 4 5 6
Pe
rce
nta
ge
of
sa
tisfie
d d
em
an
d
Number of demand pairs
ISR-SRT
OPT full-info
(b) Demand loss.
Fig. 9: Trade-off between number of repairs and demand loss.
30
40
50
60
70
80
90
100
0 20 40
Nu
mb
er
of
tota
l re
pa
irs
Percentage of Gap from OPT
IMULT
IBB Heuristic trigger for solution update
IBB
ISRT
OPT full-info
(a) Repairs.
0.1
1
10
100
1000
10000
0 20 40
Tim
e (
s)
Percentage of Gap from OPT
IMULT
IBB Heuristic trigger for solution update
IBB
ISRT
OPT full-info
(b) Time.
Fig. 10: Trade-off between execution time and repairs.
20
25
30
35
40
0.1 0.2 0.3 0.4 0.5 0.6 0.7 0.8 0.9 1
Nu
mb
er
of
tota
l re
pa
irs
Edge probability
OPT full-info
ISR-MULT
ISR-BB
P-ISP
(a) Repairs.
0*100
5*104
1*105
2*105
2*105
2*105
3*105
4*105
4*105
5*105
5*105
0.1 0.2 0.3 0.4 0.5 0.6 0.7 0.8 0.9 1
Exe
cu
tio
n t
ime
(s)
Edge probability
OPT full-info
ISR-BB
ISR-MULT
P-ISP
(b) Time.
Fig. 11: Synthetic Erdos-Renyi topology with 100 nodes.
advantage of reducing the computation time remarkably.Figure 10a shows that, when we increase the gap from 0
to 40%, the difference between the total number of repairsof ISR-MULT with respect to optimal increases by a factorof 1.6, while this factor is 3.4 for ISR-BB. Furthermore,we observe that by running the Heuristic trigger for solutionupdate, introduced in Section IV-E, the total execution time onaverage decreases by a factor of 10.5, while the total numberof repairs increases of only 3.8%. This is mainly due to thefact that most of the time, after running the first optimizationstep, the solution is still valid by using Heuristic IV-E. Wedid not include the execution time results for progressive ISPsince its performance has not been optimized to run on multi-core machines.
In the next scenario, we used synthetic Erdos-Renyi non-planar graphs. In an Erdos-Renyi graph, any two nodes areconnected through an edge with probability p. We consideredan Erdos-Renyi topology with 100 nodes where each link
0
10
20
30
40
50
60
0 2 4 6 8 10
Nu
mb
er
of
rep
airs
Number of demand pairs
P-ISP Total
P-ISP Necessary
ISR-MULT Total
ISR-MULT Necessary
ISR-BB Total
ISR-BB Necessary
OPT full-info
(a) Increasing demand.
20
30
40
50
60
70
2 3 4 5 6 7 8 9 10
Nu
mb
er
of
rep
airs
Number of flows
P-ISP Total
P-ISP Necessary
ISR-MULT Total
ISR-MULT Necessary
ISR-BB Total
IBB Necessary
OPT full-info
(b) Increasing flows.
Fig. 12: Increasing demand pairs and flows (BellCanada).
has a capacity of 1,000 units of flow. We set the numberof critical demand pairs to 6, of one unit each. Notice thatwith this set of demand flows and capacities, the problemreduces to establishing connectivity between the endpoints ofthe demand pairs. The complexity of the problem increases aswe increase the parameter p and the graph becomes graduallynon-planar. We compare the behavior of ISR-MULT, ISR-BBand progressive ISP with the optimal solution that would beobtained in the ideal setting of complete knowledge. In ISR-MULT and ISR-BB, we set the gap between the lower boundof the objective function and the solution of iterative ISR-BBand ISR-MULT algorithms to 50%. Once the gap is satisfied,we put all fractional variables in the solution and select anode to repair and continue this procedure until all criticalservices are restored. Figure 11b shows the execution timeof the approximate solutions with respect to optimal as weincrease the value of p. We observe that, since MINER is NP-Hard, the optimal recovery with full information has a veryhigh execution time, while if we stop the algorithm when theobjective is within 50% of the lower bound, the number ofrepairs is still close to optimal in ISR-MULT and ISR-BB, andthe execution time with respect to OPT reduces by a factor of200 in ISR-BB and 630 in ISR-MULT.
H. Increasing number of demand pairs and amount of flow
In this section, we investigate the impact of the numberof demand pairs and of the amount of demand flow of eachpair, on the number of necessary repairs. We consider theBellCanada topology, where we set random link capacity withvalues in the interval [20, 50]. We increased the number ofdemand pairs from 1 to 10, where each demand has a require-ment of 10 units of flow. Figure 12a shows the simulationresults for this scenario. We used a Gaussian disruption withdisruption variance of 20, which destroys around 40% of thenetwork. As we increase the number of demand pairs, thegap between necessary and unnecessary repairs increases inprogressive ISP, while the number of necessary repairs isstill close to optimal. This is mainly due to the fact thatISP was not designed for uncertain failures. ISR-IBB has thesmallest number of repairs and ISR-MULT’s number of repairsis between ISP and ISR-IBB.
In the next scenario, we consider the same network topologyand same disruption parameters. We set the number of critical

TOOTAGHAJ et al.: ON PROGRESSIVE NETWORK RECOVERY FROM MASSIVE FAILURES UNDER UNCERTAINTY 13
TABLE IV: Potential Implication of the proposed algorithms.
Algorithm Cons ProsISR-SRT
Demand loss, cannot satisfy all de-mands
Low complexity, easy to implement.Can be used to satisfy small criticaldemands in short time.
ISP High number of unnecessary repairsin high demand load
Low time complexity compared toISR-BB and ISR-MULT, works betterthan ISR-MULT in low demand load
ISR-BB
High time complexity due to largespace exploration
Low number of repairs, best for smalltopologies. Can be configured to re-duce the execution time with highernumber of repairs
ISR-MULT
Moderate time complexity, highnumber of repairs in smaller traffics(can be combined with ISP to haveadvantage of both)
Smaller number of repairs comparedto ISP, higher than ISR-BB. Betterrestoring performance for large num-ber of demand flow/pair.
demand pairs to 5 and increased the units of flow per demandpair from 2 to 10. Figure 12b shows the simulation results inthis scenario for our iterative algorithms and optimal recoverywith full knowledge. We observe that for less than 4 units offlow, ISP performs slightly better than the ISR-MULT solutionin terms of the number of necessary repairs. However, as weincrease the amount of flow per pair, ISR-MULT and ISR-BBperform better mainly because ISR-MULT and ISR-BB canrefine their incorrect decisions due to lack of knowledge fromthe beginning of the algorithm while ISP is not able to adjustits solution after initial wrong decisions. For small numberof flows/demand pair, both ISP and ISR-MULT are close tooptimal. We observe that in larger topologies, ISP performsbetter than ISR-MULT when the total demand load (sum ofall the demand flow requirements for all the demand pairs)is lower than 40% of the network capacity. This opens upthe opportunity to have a hybrid scenario for low flow/pairand high flow/pair scenarios where one can get advantage ofprogressive ISP under low demand load and the ISR-MULTfor higher demand load.
Table IV shows the comparison between progressive ISP,ISR-MULT, ISR-BB and ISR-SRT. We observed that each ofthe proposed algorithms has pros and cons, which makes themsuitable for scenarios where we need short execution time,or higher restoring performance or small number of criticaldemand pairs.
VII. CONCLUSION
While there have been several works on timely networkrecovery algorithms, far less progress has been seen in thecontext of uncertain network failure patterns. This paperconsiders, for the first time, a progressive network recoveryalgorithm under uncertainty. We use a multi-stage stochasticoptimization technique, called ISR to guess the best feasiblesolution set at each iteration using an estimated distributionof failure. ISR finds a feasible solution using three differentapproaches namely ISR-SRT, ISR-BB, and ISR-MULT. Fromthe elements of this solution, we select the one with the highestcentrality, at each iteration step to repair and exploit it as amonitor to discover the gray area, until all critical servicesare restored. We iterate the process, alternating monitoring,and repair activities until all critical services are restored. Oursimulation results show that ISR reduces the total cost of repairsignificantly with respect to the state-of-the-art ISP algorithm.
We also observed that we could configure our choice of trade-off between the demand loss, total number of repairs andexecution time.
ACKNOWLEDGEMENT
This research was sponsored by the Army Research Lab-oratory and was accomplished under Cooperative AgreementNumber W911NF-13-2-0045 (ARL Cyber Security CRA). Theviews and conclusions contained in this document are thoseof the authors and should not be interpreted as representingthe official policies, either expressed or implied, of the ArmyResearch Laboratory or the U.S. Government. The U.S. Gov-ernment is authorized to reproduce and distribute reprints forGovernment purposes not with standing any copyright notationhere on.
REFERENCES
[1] D. Z. Tootaghaj, H. Khamfroush, N. Bartolini, S. Ciavarella,S. Hayes, and T. La Porta. Network recovery from massivefailures under uncertain knowledge of damages. In IFIPNetworking, 2017.
[2] A. Kwasinski, W. W. Weaver, P. L. Chapman, and P. T.Krein. Telecommunications power plant damage assessmentfor hurricane katrina–site survey and follow-up results. IEEESystems Journal, 2009.
[3] Communications status report for areas impacted by hurricaneirma. Federal Communications Commission (FCC), September13, 2017.
[4] J. Wang, C. Qiao, and H. Yu. On progressive network recoveryafter a major disruption. In Proceedings IEEE INFOCOM,2011.
[5] N. Bartolini, S. Ciavarella, T. La Porta, and S. Silvestri. Networkrecovery after massive failures. In Dependable Systems andNetworks (DSN), 2016.
[6] S. Ciavarella, N. Bartolini, H. Khamfroush, and T. La Porta.Progressive damage assessment and network recovery aftermassive failures. In Proceedings IEEE INFOCOM, 2017.
[7] S. Tati, B. J. Ko, G. Cao, A. Swami, and T. La Porta. Adap-tive algorithms for diagnosing large-scale failures in computernetworks. In Dependable Systems and Networks (DSN), 2012.
[8] T. Horie, G. Hasegawa, S. Kamei, and M. Murata. A newmethod of proactive recovery mechanism for large-scale net-work failures. In AINA’09. International Conference on Ad-vanced Information Networking and Applications. IEEE, 2009.
[9] G. Yu and X. Qi. Disruption management: framework, modelsand applications. World Scientific, 2004.
[10] K. Al Sabeh, M. Tornatore, and F. Dikbiyik. Progressivenetwork recovery in optical core networks. In 2015 7th Inter-national Workshop on Reliable Networks Design and Modeling(RNDM). IEEE, 2015.
[11] A. Todimala and B. Ramamurthy. Approximation algorithmsfor survivable multicommodity flow problems with applicationsto network design. In Proceedings IEEE INFOCOM, 2006.
[12] Q. Zheng, G. Cao, T. La Porta, and A. Swami. Optimal recoveryfrom large-scale failures in ip networks. In IEEE ICDCS, 2012.
[13] L. Ma, T. He, A. Swami, D. Towsley, and K. K. Leung.Network capability in localizing node failures via end-to-endpath measurements. IEEE/ACM Transactions on Networking(TON), 2017.
[14] P. Barford, N. Duffield, A. Ron, and J. Sommers. Networkperformance anomaly detection and localization. In ProceedingsIEEE INFOCOM, 2009.

14 IEEE TRANSACTIONS ON NETWORK AND SERVICE MANAGEMENT
[15] N. Bartolini, T. He, and H. Khamfroush. Fundamental limitsof failure identifiability by boolean network tomography. InProceedings IEEE INFOCOM, 2017.
[16] D. Z. Tootaghaj, T. He, and T. La Porta. Parsimonious tomogra-phy: Optimizing cost-identifiability trade-off for probing-basednetwork monitoring. IFIP Performance, 2017.
[17] D. Z. Tootaghaj, N. Bartolini, H. Khamfroush, and T. La Porta.Controlling cascading failures in interdependent networks underincomplete knowledge. In SRDS. IEEE, 2017.
[18] D. Z. Tootaghaj, N. Bartolini, H. Khamfroush, T. He, N. R.Chaudhuri, and T. La Porta. Mitigation and recovery fromcascading failures in interdependent networks under uncertainty.IEEE Transactions on Control of Network Systems, 2018.
[19] S. Soltan, D. Mazauric, and G. Zussman. Cascading failuresin power grids: analysis and algorithms. In Proceedings of the5th international conference on Future energy systems. ACM,2014.
[20] M. Parandehgheibi and E. Modiano. Robustness of interdepen-dent networks: The case of communication networks and thepower grid. In Global Communications Conference (GLOBE-COM), 2013 IEEE.
[21] E. E. Lee, J. E. Mitchell, and W. A. Wallace. Restoration ofservices in interdependent infrastructure systems: A networkflows approach. IEEE Transactions on Systems, Man, andCybernetics, Part C (Applications and Reviews), 2007.
[22] N. Bartolini, S. Ciavarella, T. La Porta, and S. Silvestri. On crit-ical service recovery after massive network failures. IEEE/ACMTransactions on Networking (TON), 2017.
[23] S. Knight, H. X. Nguyen, N. Falkner, R. Bowden, andM. Roughan. The internet topology zoo. IEEE Journal onSelected Areas in Communications, 2011.
[24] The internet topology zoo.http://www.topology-zoo.org/, accessed in May,2015.
[25] M. X. Goemans and D. P. Williamson. A general approximationtechnique for constrained forest problems. SIAM Journal onComputing, 1995.
[26] M. Bateni, M. Hajiaghayi, and D. Marx. Approximationschemes for steiner forest on planar graphs and graphs ofbounded treewidth. Journal of the ACM (JACM), 2011.
[27] M. Hauptmann and M. Karpinski. A compendiumon steiner tree problems. Inst. fur Informatik, 2013.http://theory.cs.uni-bonn.de/.
[28] R. Bent and P. Van Hentenryck. Online stochastic optimizationwithout distributions. In ICAPS, 2005.
[29] S. D. Guikema. Natural disaster risk analysis for criticalinfrastructure systems: An approach based on statistical learningtheory. Reliability Engineering & System Safety, 94(4):855–860,2009.
[30] S. Tati, S. Silvestri, T. He, and T. La Porta. Robust networktomography in the presence of failures. In ICDCS. IEEE, 2014.
[31] Y. Bozorgnia and V. V. Bertero. Earthquake engineering:from engineering seismology to performance-based engineer-ing. CRC press, 2004.
[32] S. Neumayer and E. Modiano. Network reliability with ge-ographically correlated failures. In Proceedings IEEE INFO-COM, 2010.
[33] G. L. Nemhauser and L. A. Wolsey. Integer programming andcombinatorial optimization. Constraint Classification for MixedInteger Programming Formulations. COAL Bulletin, 20:8–12,1988.
[34] T. C. Hu. Multi-commodity network flows. Operationsresearch, 1963.
[35] N. Karmarkar. A new polynomial-time algorithm for linearprogramming. In Proceedings of the sixteenth annual ACMsymposium on Theory of computing. ACM, 1984.
[36] Aurora fiber optic networks.http://www.aurorafonet.com, Last access on Aug.2018.
[37] Gurobi optimization, inc. gurobi optimizer reference manual.http://www.gurobi.com/, accessed in, 2012.
Diman Zad Tootaghaj received her Ph.D. degreein the department of computer science and engineer-ing at the Pennsylvania State University, UniversityPark, PA. She received B.S. and M.S. degrees inElectrical Engineering from Sharif University ofTechnology, Iran in 2008 and 2011 and an M.S.degree in Computer Science and Engineering fromthe Pennsylvania State University in 2015. She isa Postdoc Researcher at Hewlett Packard Labs inPalo Alto, California. Her current research interestsinclude computer network, recovery approaches, dis-
tributed systems, and stochastic analysis.
Novella Bartolini (SM ’16) graduated with hon-ors in 1997 and received her PhD in computerengineering in 2001 from the University of Rome,Italy. She is now associate professor at SapienzaUniversity of Rome. She was visiting professor atPenn State University for three years from 2014to 2017. Previously, she was visiting scholar at theUniversity of Texas at Dallas for one year in 2000and research assistant at the University of Rome ’TorVergata’ in 2001-2002. She was program chair andprogram committee member of several international
conferences. She has served on the editorial board of Elsevier ComputerNetworks and ACM/Springer Wireless Networks. Her research interests liein the area of wireless networks and network management.
Hana Khamfroush Hana Khamfroush is an as-sistant professor in the Department of ComputerScience, University of Kentucky. Before joining theUniversity of Kentucky, she was a research asso-ciate in the Department of Computer Science andEngineering, Penn State University. She receivedher Ph.D. degree with honor in telecommunicationengineering from the University of Porto, Portugal.She was named a rising star in EECS by MIT andCMU in 2015 and 2016. She was selected as oneof the 200 young researchers for the Heidelberg
Laureate Forum, Germany.
Thomas La Porta is the Director of the Schoolof Electrical Engineering and Computer Science atPenn State University. He is an Evan Pugh Professorand the William E. Leonhard Chair Professor in theComputer Science and Engineering Department. Hereceived his B.S.E.E. and M.S.E.E. degrees fromThe Cooper Union, New York, NY, and his Ph.D.degree in Electrical Engineering from ColumbiaUniversity, New York, NY. He joined Penn State in2002. He was the founding Director of the Instituteof Networking and Security Research at Penn State.
Prior to joining Penn State, Dr. La Porta was with Bell Laboratories for 17years. He was the Director of the Mobile Networking Research Departmentin Bell Laboratories, Lucent Technologies where he led various projects inwireless and mobile networking. He is an IEEE Fellow and Bell Labs Fellow.Dr. La Porta was the founding Editor-in-Chief of the IEEE Transactionson Mobile Computing. He was the Director of Magazines for the IEEECommunications Society and was on its Board of Governors for three years.He has published numerous papers and holds 39 patents. He was an adjunctmember of faculty at Columbia University for 7 years where he taught courseson mobile networking and protocol design.
Related Documents