How to Value a Business: An Introduction Measuring the Economic Value of Triple Bottom Line Businesses

How to Value a Business - Presentation for Sustainable Business Network of Philadelphia - February 25, 2014
Nov 26, 2015
In a workshop for the Sustainable Business Network of Philadelphia, Senior Appraiser Michael Cunningham provided a workshop on "How to Value your Business." The case study involved how to value a "Brewery" but the steps are broadly applicable to how you might value any business. Presentation sponsor Hempstead & Co., LLC is a company that provides valuation and related financial consulting services.
Welcome message from author
This document is posted to help you gain knowledge. Please leave a comment to let me know what you think about it! Share it to your friends and learn new things together.
Transcript

How to Value a Business: An Introduction
Measuring the Economic Valueof Triple Bottom Line Businesses
Services Hempstead Provides
• Business Appraisals• Fairness Opinions• Purchase Price Allocations• Intangible Asset Appraisals• Solvency Analyses• Economic Damages Analyses• Financial Consulting and Advisory Services

Why Value a Business?
Prudent:• Benchmarking & Planning
• Buying or Selling• Obtaining Financing • Designing Partnerships• Buy & Sell Agreements
Required:• Estate & Gift Taxes• Financial Reporting (Public Companies)
• Divorce & Litigation• Issuing Stock Options• ESOPs

Valuation in the News
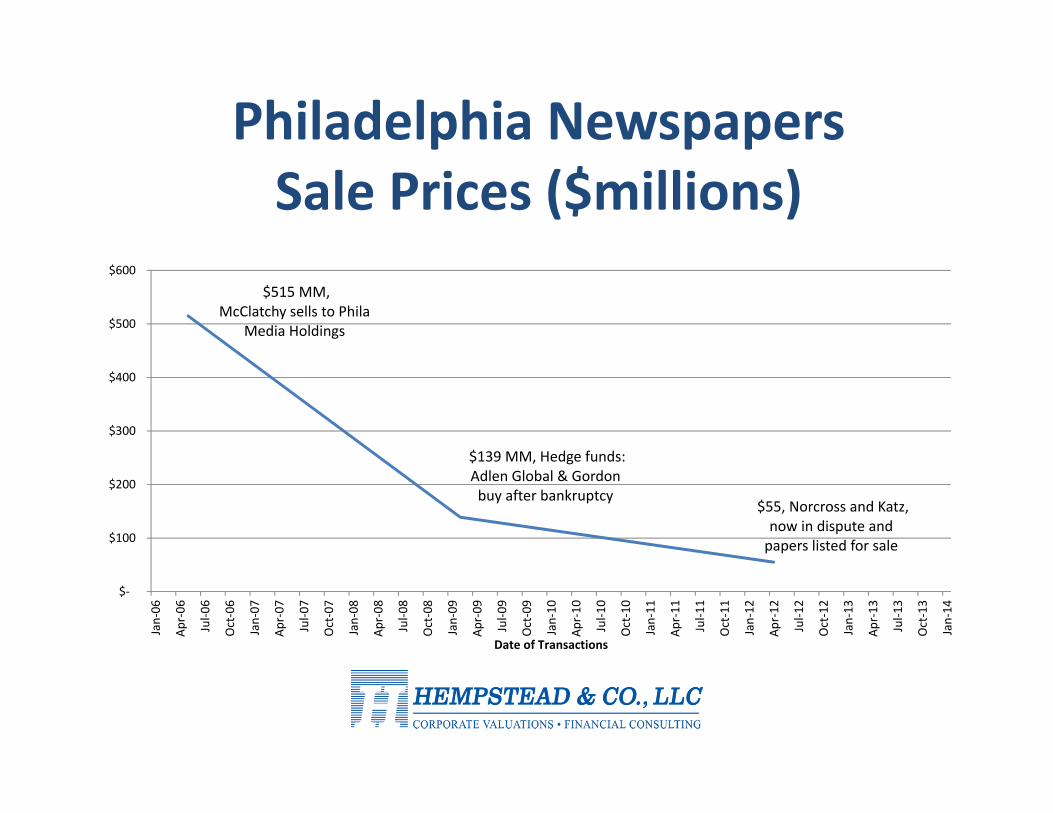
$515 MM, McClatchy sells to Phila
Media Holdings
$139 MM, Hedge funds: Adlen Global & Gordon buy after bankruptcy
$55, Norcross and Katz, now in dispute and papers listed for sale
$‐
$100
$200
$300
$400
$500
$600
Jan‐06
Apr‐06
Jul‐0
6
Oct‐06
Jan‐07
Apr‐07
Jul‐0
7
Oct‐07
Jan‐08
Apr‐08
Jul‐0
8
Oct‐08
Jan‐09
Apr‐09
Jul‐0
9
Oct‐09
Jan‐10
Apr‐10
Jul‐1
0
Oct‐10
Jan‐11
Apr‐11
Jul‐1
1
Oct‐11
Jan‐12
Apr‐12
Jul‐1
2
Oct‐12
Jan‐13
Apr‐13
Jul‐1
3
Oct‐13
Jan‐14
Date of Transactions
Philadelphia Newspapers Sale Prices ($millions)
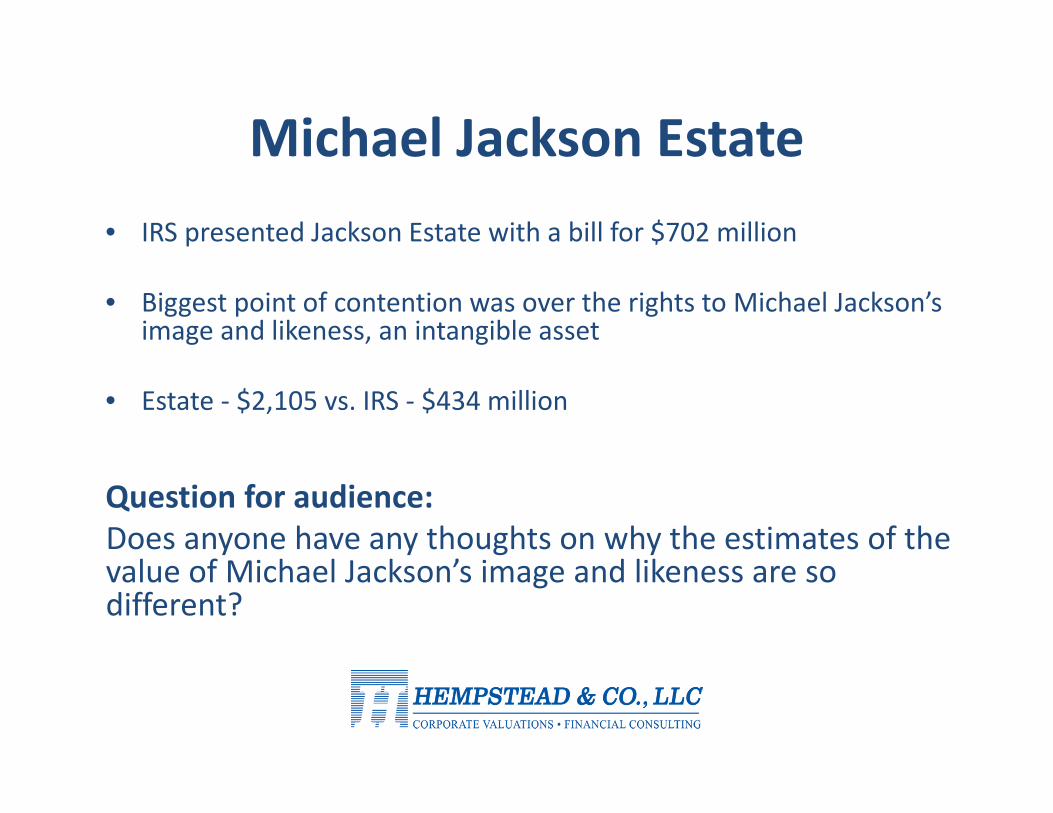
Michael Jackson Estate• IRS presented Jackson Estate with a bill for $702 million
• Biggest point of contention was over the rights to Michael Jackson’s image and likeness, an intangible asset
• Estate ‐ $2,105 vs. IRS ‐ $434 million
Question for audience: Does anyone have any thoughts on why the estimates of the value of Michael Jackson’s image and likeness are so different?

How to Value a BusinessCase Study: Valuing a Brewery
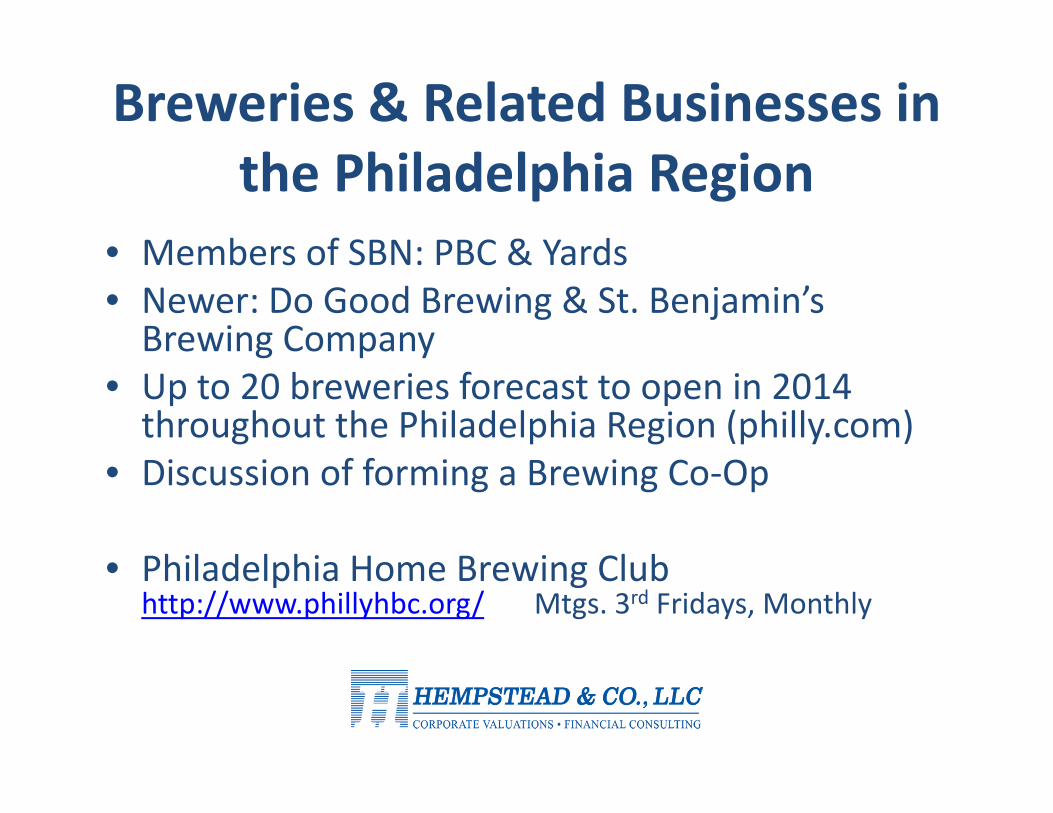
Breweries & Related Businesses in the Philadelphia Region
• Members of SBN: PBC & Yards• Newer: Do Good Brewing & St. Benjamin’s Brewing Company
• Up to 20 breweries forecast to open in 2014 throughout the Philadelphia Region (philly.com)
• Discussion of forming a Brewing Co‐Op
• Philadelphia Home Brewing Club http://www.phillyhbc.org/ Mtgs. 3rd Fridays, Monthly

Three Approaches to Valuing a Business
Asset‐Based Approach
Market‐Based Approach• Guideline Private Transactions• Guideline Publicly Traded Company Method
Income‐Based Approach• Capitalization of Earnings• Discounted Future Net Cash Flows

Asset‐Based Approaches to Value
– Generally focused on asset‐intensive entities• Manufacturers, wholesalers
– Generally not for use with asset‐light entities• Technology, professional services
– Generally provides a value floor

Considers Condition and Quality of Tangible Assets
Current Assets• Cash• Receivables• Inventory• Other Current Assets
Question for audience: What are some of the assets that breweries have?
Fixed Assets• Furniture and Fixtures
• Machinery and Equipment
• Real Estate
Other Assets• Other Investments
• Non‐Operating Assets

Mendocino Brewing (Blue Heron) Adjusted Net Asset Value
($000) Actual Pro formaSept 30, 2013 Realization January 1, 2014
ASSETS Current Assets
Cash, Cash Equiv. and Short-term Invest. $41 100% $41Total Receivables, Net 4,394 95% 4,174 Inventories, Net 2,144 75% 1,608 Deferred Income Taxes, Current - 100% - Prepaid Expenses 611 100% 611
Total Current Assets 7,190 6,434
Fixed Assets
Property, Plant & Equipment, Net 11,834Adjusted, per
Appraisal 12,000
Total Assets $19,024 $18,434
Total Liabilities ($17,859) 100% ($17,859)
Adjusted Net Asset Value $575
Notes:(1) Based on anticipated collection of receivables, conversations with Management(2) Based on appraisal(3) Based on Real Estate and M&E Appraisals‐ This Net Adjusted Asset example is for discussion purposes only
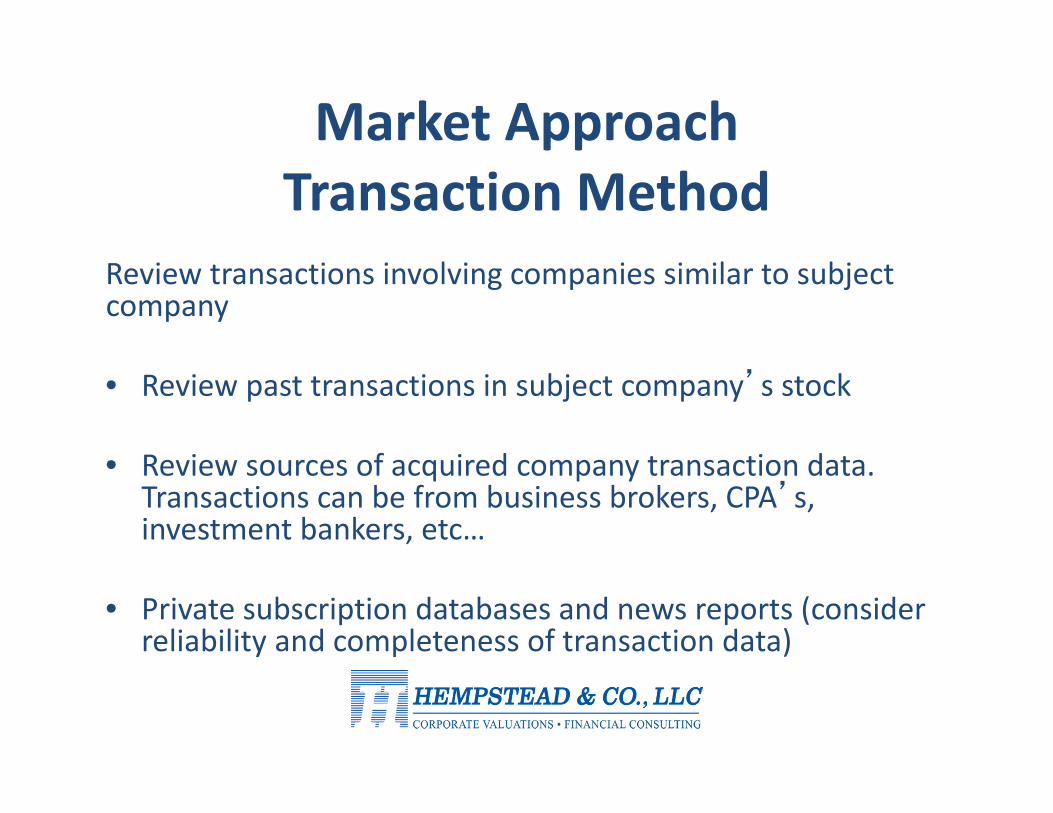
Market Approach Transaction Method
Review transactions involving companies similar to subject company
• Review past transactions in subject company’s stock
• Review sources of acquired company transaction data. Transactions can be from business brokers, CPA’s, investment bankers, etc…
• Private subscription databases and news reports (consider reliability and completeness of transaction data)
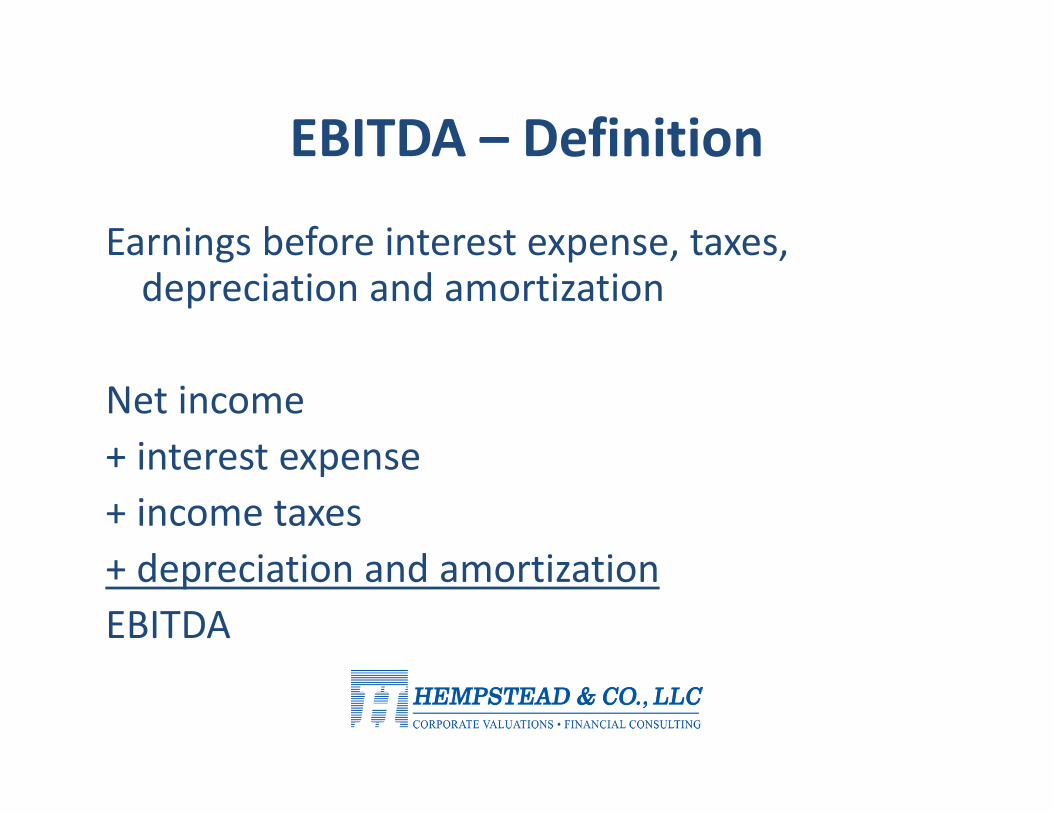
EBITDA – Definition
Earnings before interest expense, taxes, depreciation and amortization
Net income+ interest expense+ income taxes+ depreciation and amortizationEBITDA
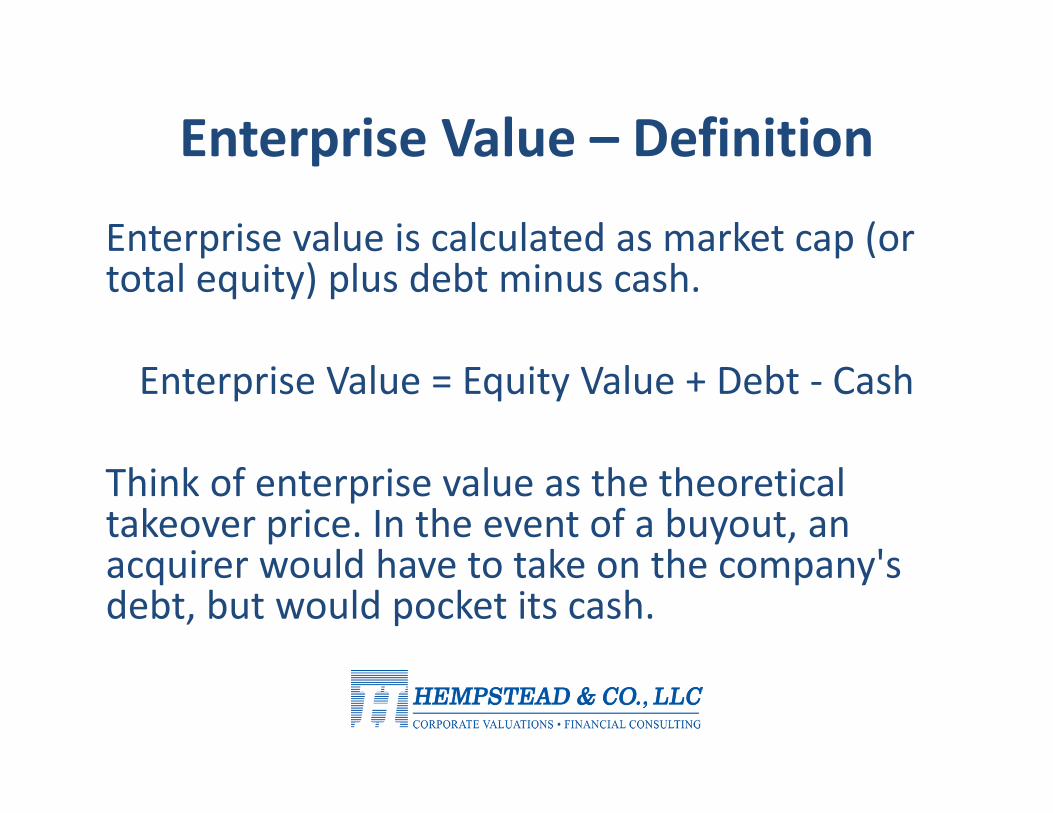
Enterprise Value – Definition
Enterprise value is calculated as market cap (or total equity) plus debt minus cash.
Enterprise Value = Equity Value + Debt ‐ Cash
Think of enterprise value as the theoretical takeover price. In the event of a buyout, an acquirer would have to take on the company's debt, but would pocket its cash.
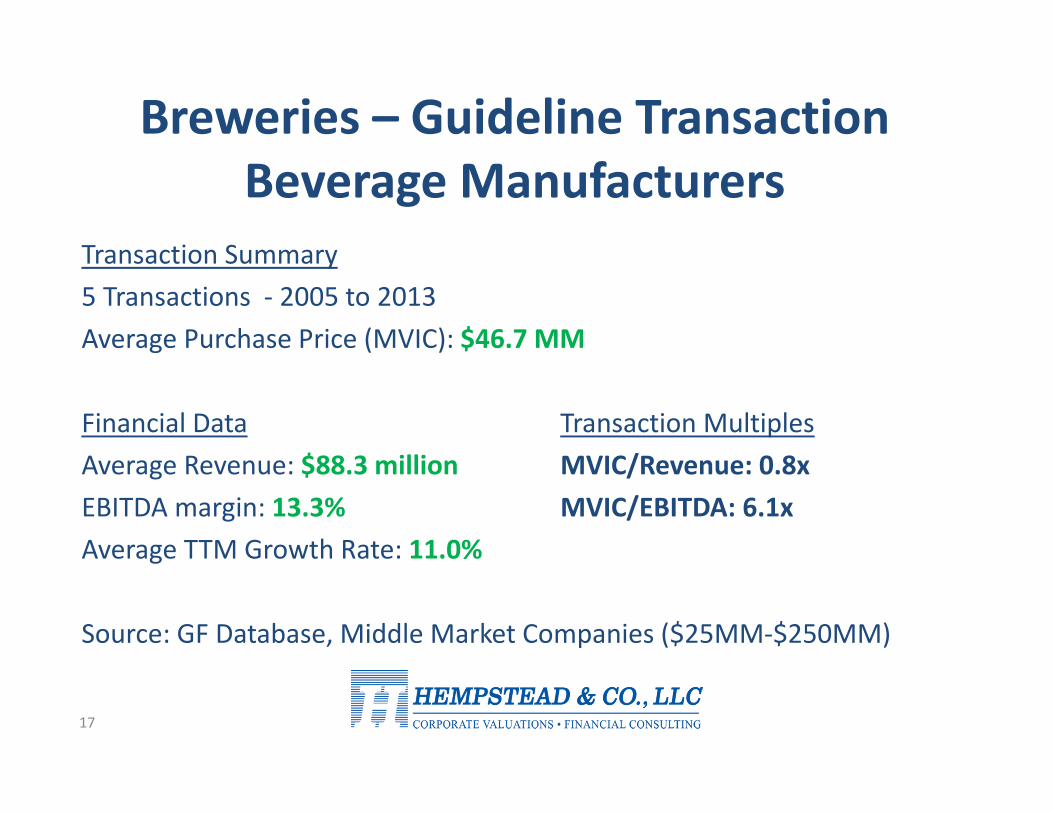
Breweries – Guideline Transaction Beverage Manufacturers
17
Transaction Summary5 Transactions ‐ 2005 to 2013Average Purchase Price (MVIC): $46.7 MM
Financial Data Transaction MultiplesAverage Revenue: $88.3 million MVIC/Revenue: 0.8xEBITDA margin: 13.3% MVIC/EBITDA: 6.1xAverage TTM Growth Rate: 11.0%
Source: GF Database, Middle Market Companies ($25MM‐$250MM)

Breweries – Guideline Transaction Kona Brewing Co., Inc.
Buyer: Craft Brewers Alliance, Inc.Sellers: Kona Brewing Co., Inc.
Date: October 31, 2010Company Location: Kona, Hawaii
Purchase Price (MVIC): $19 MM – ($11.7 MM in stock, $6.2 MM cash & debt assumed of $1.1 MM)
Note: Transaction did not include real estate; included 5 year non‐compete agreement
Financial Data Transaction MultiplesNet Sales: $13.4 million MVIC/Revenue: 1.42xOperating Profit: $578,149 (4.3% margin)EBITDA: $760,221 MVIC/EBITDA: 25xBook Value: $3.7 million
Market Approach –Guideline Company Method
Select Comparable (“Guideline”) Companies• Develop appropriate “comparable” criteria• Industry characteristics • Size of companies, profitability, growth• Frequency traded; Availability of information
Question for audience: What are some publicly‐traded beer companies?

Search Brewery Companies – Publicly Traded
Company Ticker Symbol Exchange Comment Brands(1) Anheuser Busch InBev BUD ADR Belgian/Brazilian Stella Artois, Bud, Michelob(2) Appalachian Mountain Brewery NCNE OTC New USA Start Up Honey Badger, Black Gold(3) Boston Beer Co SAM NYSE USA Sam Adams(4) Craft Beer Alliance BREW NASDAQ USA Start Up Red Hook, Omission(5) Diageo PLC DEO ADR British Guiness, Liquor(6) Grupo Modelo GPMCF ADR Mexico Corona, Modelo(7) Heineken N.V. HINKY ADR Dutch Heineken, Amstel(8) Mendocino MENB OTC USA Blue Heron, Red Tail Ail(9) Molson Coors Brewing TAP NYSE USA Coors, Blue Moon, Molson(10) SABMiller SBMRY ADR South African Miller Lite, Grolsch

Breweries – Guideline CompaniesSummary Financial Data (1/1/2014)
Company Name Boston Beer Co Molson Coors Brewing
Craft Brewers Alliance
Mendocino Brewing
Ticker Symbol SAM TAP BREW MENBExchange NYSE NYSE NASDAQ OTCPK
Enterprise Value (MVIC) $3 Billion $13.8 Billion $319 Million $11.5 Million% Net Debt (1.4%) 25.2% 2.4% 66.4%
Income Statement Sept 30, 2013 Sept 30, 2013 Sept 30, 2013 Sept 30, 2013 ExchangeNet Sales $686.7 million $4.2 Billion $177 Million $36.4 Million
Operating Profit Margin 16.2% 19.4% 1.9% 0.0% ADR
EBITDA $132.9 million $966.6 million $11.1 million $1 million
Financial Ratios MedianMVIC to Sales 4.4 3.3 1.8 0.3 2.5 MVIC to Operating Profit 27.4 17.0 93.5 (934.9) 22.2 MVIC to EBITDA 22.8 14.3 28.7 10.9 18.6

Reviewing GPC Multiples over time
Dec 31, Dec 31, Dec 31, Dec 31, Dec 31, Dec 31, 2008-2012EV/Revenue 2008 2009 2010 2011 2012 2013 Median
Boston Beer Co 1x 1.3x 2.6x 2.6x 2.8x na 2.6xCraft Beer Alliance 0.6x 0.5x 1.3x 0.8x 0.8x na 0.8xMendocino 0.3x 0.4x 0.4x 0.3x 0.3x na 0.3xMolson Coors Brewing 1.4x 2.1x 3.1x 2.5x 3x 3.3x 3x
Dec 31, Dec 31, Dec 31, Dec 31, Dec 31, Dec 31, 2008-2012EV/EBITDA 2008 2009 2010 2011 2012 2013 Median
Boston Beer Co 15x 5.6x 13.2x 11.8x 15x na 13.2xCraft Beer Alliance -1.9x 6.9x 15.4x 9.9x 10.3x na 9.9xMendocino 7.1x 21.7x 23.4x 5.1x 6x na 7.1xMolson Coors Brewing 3.8x 4x 9.5x 8.1x 18.8x 23.4x 8.1x
na = not available

Market‐Based Approach Results Summarized
Question for audience: Does any one have any reaction to the data we have reviewed on market‐based transactions of breweries?
MVIC/ MVIC/Revenue EBITDA
(a) Guideline Transactions 0.8x 6.1x
(b) Kona Brewing Co. 1.42x 25x
(c) Guideline Publicly Traded Companies - 5 Yr. Medians (2008-2012) 0.3x - 2.6x 7.1x - 13.2x

Market‐Based ApproachSelection of Multiples
• Determine appropriate pricing multiples
– Compare subject company to guideline group» Size (Sales / Total Assets)»Growth rates»Margins
• Apply multiples to subject entity
Qualitative Factors Can Impact Multiple Selection
• Relevant economic data (Global, National, Local)• Industry factors• Competition• Regulation• Supplier relationships• Market position• Management and employees
25

Market‐Based Approach to ValueApplication of Multiples
Select Implied Market Enterprise
Subject Brewing Company Multiple Value
Revenue $36,440,300 0.3x $11,499,807
EBITDA $1,051,200 10.9x $11,499,807
Preliminary Market-Based Indication of Value (Results Averaged) $11,500,000
- calculation for discussion purposes only
Earnings‐Based ApproachCapitalization of Earnings
– Subject value based on anticipated future financial benefits
• Capitalization of Earnings– Single estimate of earnings
» Mature companies, e.g. Manufacturing
• Discounted Cash Flow– Multi‐period estimate of earnings
» Early stage, fast growing companies, e.g. Technology, pharmaceuticals
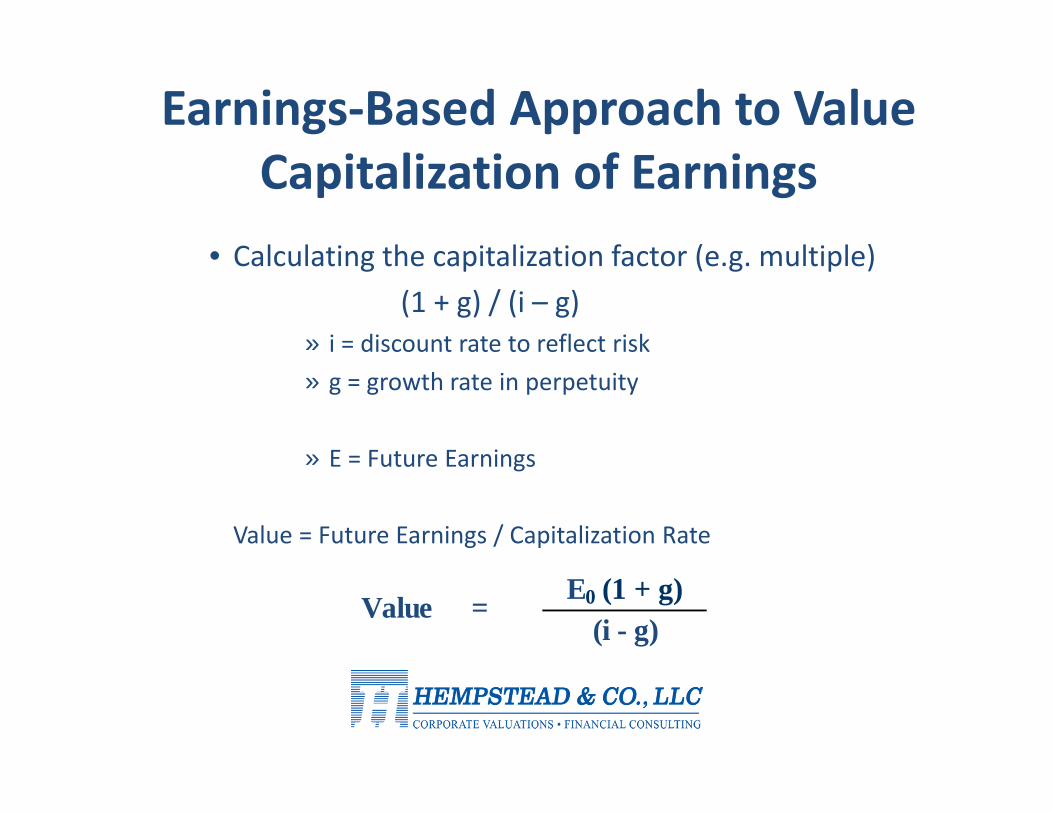
Earnings‐Based Approach to ValueCapitalization of Earnings
• Calculating the capitalization factor (e.g. multiple) (1 + g) / (i – g)
» i = discount rate to reflect risk» g = growth rate in perpetuity
» E = Future Earnings
Value = Future Earnings / Capitalization Rate
E0 (1 + g)(i - g)
Value =
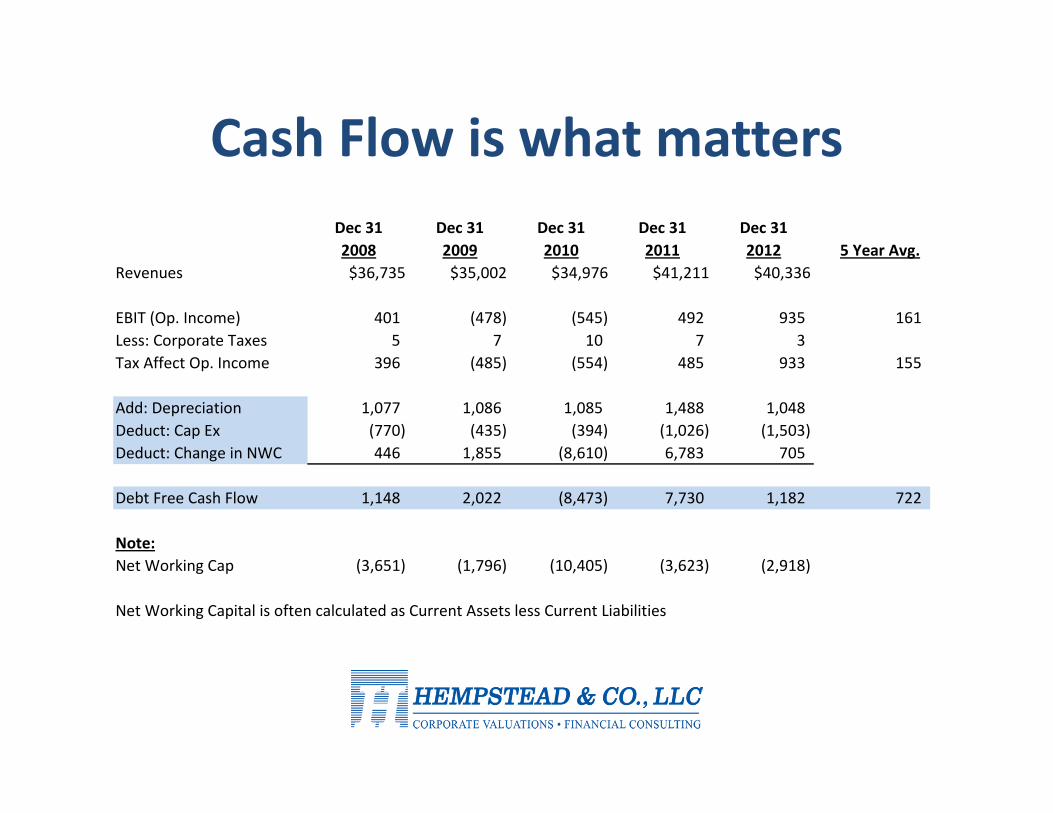
Cash Flow is what mattersDec 31 Dec 31 Dec 31 Dec 31 Dec 312008 2009 2010 2011 2012 5 Year Avg.
Revenues $36,735 $35,002 $34,976 $41,211 $40,336
EBIT (Op. Income) 401 (478) (545) 492 935 161 Less: Corporate Taxes 5 7 10 7 3 Tax Affect Op. Income 396 (485) (554) 485 933 155
Add: Depreciation 1,077 1,086 1,085 1,488 1,048 Deduct: Cap Ex (770) (435) (394) (1,026) (1,503) Deduct: Change in NWC 446 1,855 (8,610) 6,783 705
Debt Free Cash Flow 1,148 2,022 (8,473) 7,730 1,182 722
Note:Net Working Cap (3,651) (1,796) (10,405) (3,623) (2,918)
Net Working Capital is often calculated as Current Assets less Current Liabilities

Determining a Constant Growth Rate
• Company Historical Financial Data• Industry Data • U.S. or World Economic Data
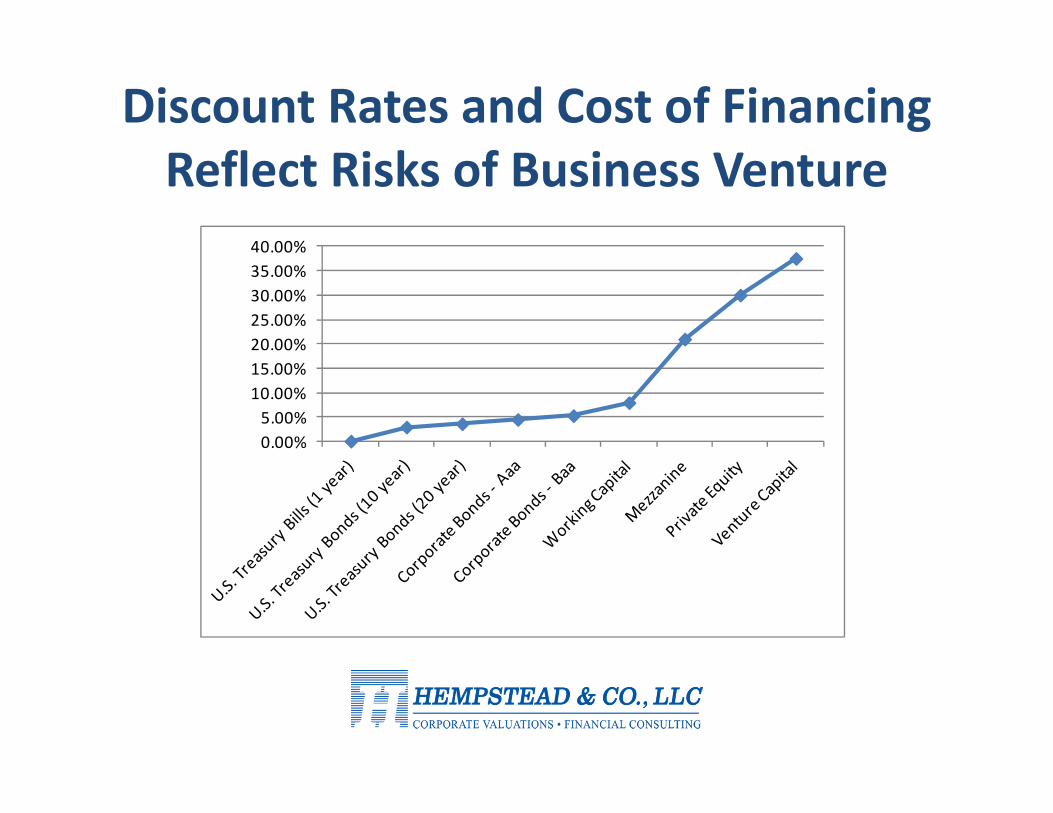
Discount Rates and Cost of FinancingReflect Risks of Business Venture
0.00%5.00%
10.00%15.00%20.00%25.00%30.00%35.00%40.00%
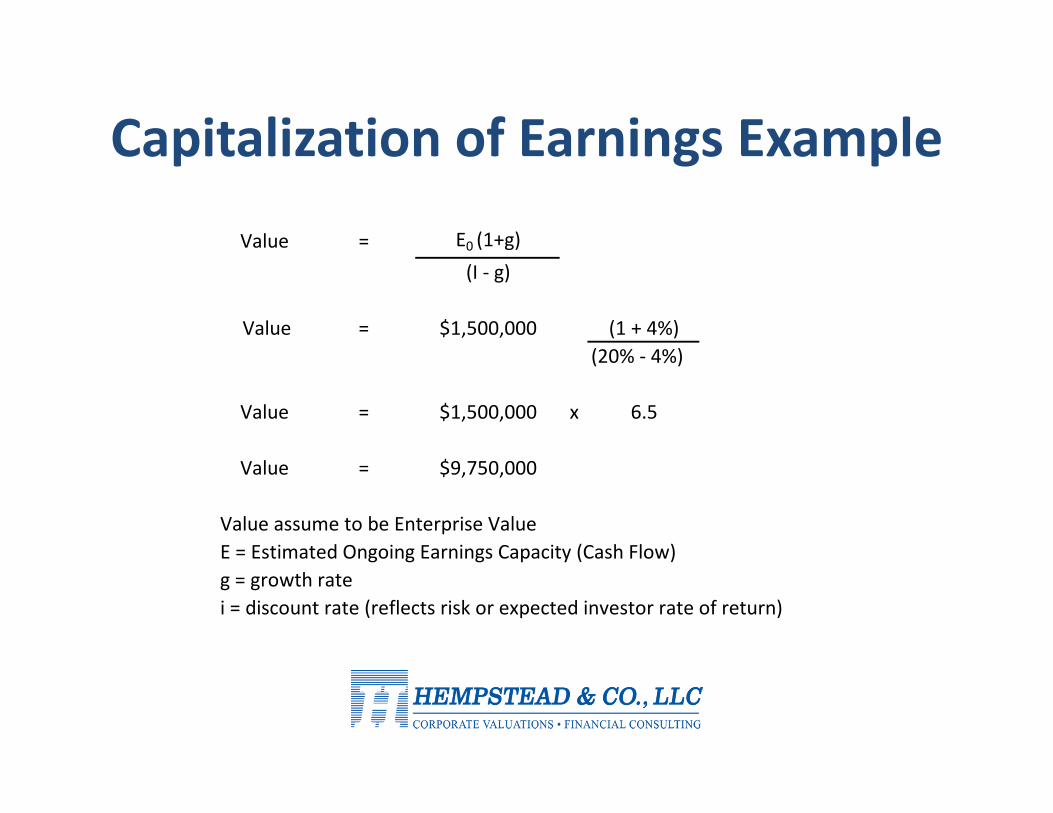
Capitalization of Earnings Example
Value = E0 (1+g)(I ‐ g)
Value = $1,500,000 (1 + 4%)(20% ‐ 4%)
Value = $1,500,000 x 6.5
Value = $9,750,000
Value assume to be Enterprise ValueE = Estimated Ongoing Earnings Capacity (Cash Flow)g = growth ratei = discount rate (reflects risk or expected investor rate of return)

Income ApproachDiscounted Cash Flow Method
(Debt‐Free)
Projection of Future Free Cash Flow (~ 3 ‐ 10 years)
Growth Rate in Terminal Year
Discount Rate that reflects risks
The determination of value for the subject company’s market value of total invested capital or Enterprise Value
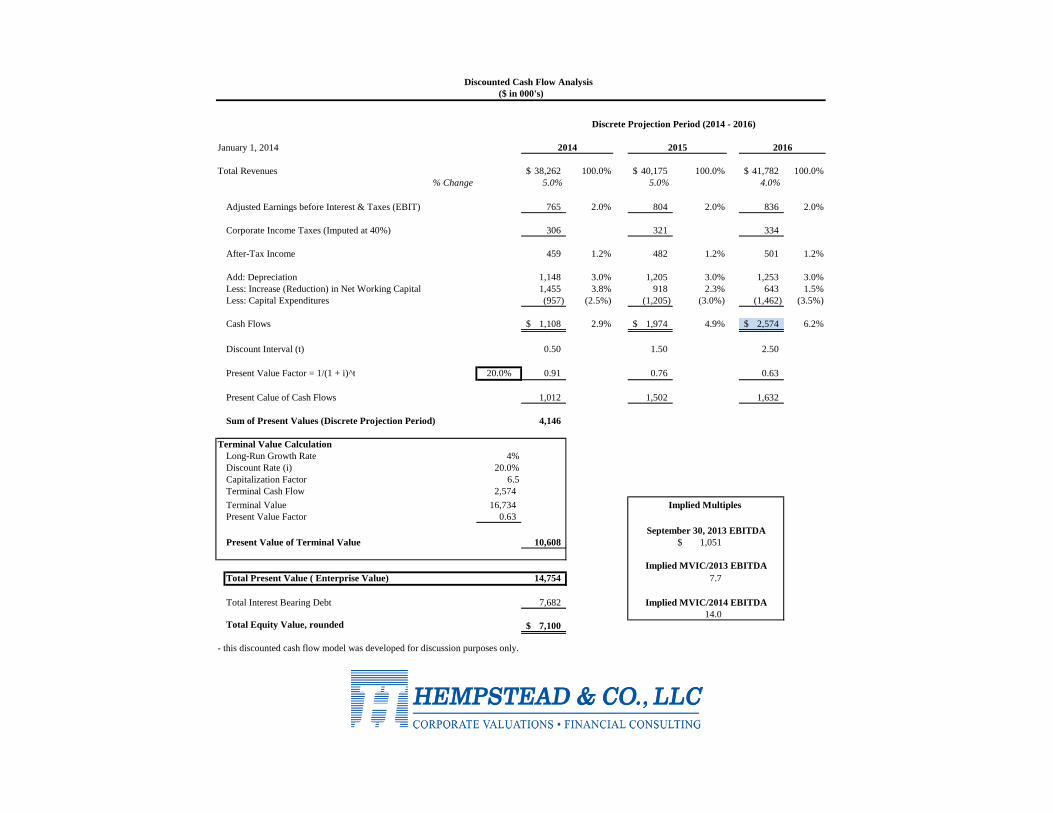
Discrete Projection Period (2014 - 2016)
January 1, 2014 2014 2015 2016
Total Revenues 38,262$ 100.0% 40,175$ 100.0% 41,782$ 100.0%% Change 5.0% 5.0% 4.0%
Adjusted Earnings before Interest & Taxes (EBIT) 765 2.0% 804 2.0% 836 2.0%
Corporate Income Taxes (Imputed at 40%) 306 321 334
After-Tax Income 459 1.2% 482 1.2% 501 1.2%
Add: Depreciation 1,148 3.0% 1,205 3.0% 1,253 3.0%Less: Increase (Reduction) in Net Working Capital 1,455 3.8% 918 2.3% 643 1.5%Less: Capital Expenditures (957) (2.5%) (1,205) (3.0%) (1,462) (3.5%)
Cash Flows 1,108$ 2.9% 1,974$ 4.9% 2,574$ 6.2%
Discount Interval (t) 0.50 1.50 2.50
Present Value Factor = 1/(1 + i)^t 20.0% 0.91 0.76 0.63
Present Calue of Cash Flows 1,012 1,502 1,632
Sum of Present Values (Discrete Projection Period) 4,146
Terminal Value CalculationLong-Run Growth Rate 4%Discount Rate (i) 20.0%Capitalization Factor 6.5Terminal Cash Flow [5] 2,574 Terminal Value [6] 16,734 Present Value Factor 0.63
Present Value of Terminal Value 10,608 1,051$
Total Present Value ( Enterprise Value) 14,754 7.7
Total Interest Bearing Debt 7,682 14.0
Total Equity Value, rounded [8] 7,100$
- this discounted cash flow model was developed for discussion purposes only.
Implied Multiples
Implied MVIC/2013 EBITDA
Implied MVIC/2014 EBITDA
September 30, 2013 EBITDA
Discounted Cash Flow Analysis($ in 000's)

Summary of Valuation Approaches
• Final conclusion of value– Reconciliation of approaches
• What indications of values appear reasonable?• Weighting of approaches
– Control vs. non‐control– Adjustments for DLOC and/or DLOM– Enterprise value vs. Equity value– Non‐Operating Assets?

QUESTIONS?

807 N. Haddon AvenueSuite 214
Haddonfield, NJ 08033(856) 795‐6026
www.hempsteadco.com
Michael Cunningham, ASA – [email protected] Routzahn, ASA – [email protected]
Related Documents