Sustainable Business Models Adam Jabłoński www.mdpi.com/journal/sustainability Edited by Printed Edition of the Special Issue Published in Sustainability

Welcome message from author
This document is posted to help you gain knowledge. Please leave a comment to let me know what you think about it! Share it to your friends and learn new things together.
Transcript

Sustainable Business Models
Adam Jabłoński
www.mdpi.com/journal/sustainability
Edited by
Printed Edition of the Special Issue Published in Sustainability

Sustainable Business Models


Sustainable Business Models
Special Issue Editor
Adam Jabłonski
MDPI • Basel • Beijing • Wuhan • Barcelona • Belgrade
Special Issue Editor
Adam Jabłonski
Institute of Management
WSB University Poznan
Poland
Editorial Office
MDPI
St. Alban-Anlage 66
4052 Basel, Switzerland
This is a reprint of articles from the Special Issue published online in the open access journal
Sustainability (ISSN 2071-1050) from 2015 to 2016 (available at: https://www.mdpi.com/journal/
sustainability/special issues/sustainable business models)
For citation purposes, cite each article independently as indicated on the article page online and as
indicated below:
LastName, A.A.; LastName, B.B.; LastName, C.C. Article Title. Journal Name Year, Article Number,
Page Range.
ISBN 978-3-03897-560-1 (Pbk)
ISBN 978-3-03897-561-8 (PDF)
c© 2019 by the authors. Articles in this book are Open Access and distributed under the Creative
Commons Attribution (CC BY) license, which allows users to download, copy and build upon
published articles, as long as the author and publisher are properly credited, which ensures maximum
dissemination and a wider impact of our publications.
The book as a whole is distributed by MDPI under the terms and conditions of the Creative Commons
license CC BY-NC-ND.
Contents
About the Special Issue Editor . . . . . . . . . . . . . . . . . . . . . . . . . . . . . . . . . . . . . . ix
Preface to ”Sustainable Business Models” . . . . . . . . . . . . . . . . . . . . . . . . . . . . . . . xi
Chih-Chao Chung, Li-Chung Chao, Chih-Hong Chen and Shi-Jer Lou
A Balanced Scorecard of Sustainable Management in the Taiwanese Bicycle Industry:Development of Performance Indicators and Importance AnalysisReprinted from: Sustainability 2016, 8, 518, doi:10.3390/su8060518 . . . . . . . . . . . . . . . . . . 1
Tuananh Tran and Joon Young Park
Development of a Novel Co-Creative Framework for Redesigning Product Service SystemReprinted from: Sustainability 2016, 8, 434, doi:10.3390/su8050434 . . . . . . . . . . . . . . . . . . 22
Adam Jabłonski and Marek Jabłonski
Research on Business Models in their Life CycleReprinted from: Sustainability 2016, 8, 430, doi:10.3390/su8050430 . . . . . . . . . . . . . . . . . . 38
Nestor Shpak, Tamara Kyrylych and Jolita Greblikaite
Diversification Models of Sales Activity for Steady Development of an EnterpriseReprinted from: Sustainability 2016, 8, 393, doi:10.3390/su8040393 . . . . . . . . . . . . . . . . . . 75
Andrea Sujova, Lubica Simanova and Katarina Marcinekova
Sustainable Process Performance by Application of Six Sigma Concepts: The Research Study ofTwo Industrial CasesReprinted from: Sustainability 2016, 8, 260, doi:10.3390/su8030260 . . . . . . . . . . . . . . . . . . 94
Andrzej Bialas
Risk Management in Critical Infrastructure—Foundation for Its Sustainable WorkReprinted from: Sustainability 2016, 8, 240, doi:10.3390/su8030240 . . . . . . . . . . . . . . . . . . 116
Joanna Kurowska-Pysz
Opportunities for Cross-Border Entrepreneurship Development in a Cluster Model Exemplifiedby the Polish–Czech Border RegionReprinted from: Sustainability 2016, 8, 230, doi: . . . . . . . . . . . . . . . . . . . . . . . . . . . . . 141
Jinhuan Tang, Shoufeng Ji and Liwen Jiang
The Design of a Sustainable Location-Routing-Inventory Model Considering ConsumerEnvironmental BehaviorReprinted from: Sustainability 2016, 8, 211, doi:10.3390/su8030211 . . . . . . . . . . . . . . . . . . 162
Adam Jabłonski
Scalability of Sustainable Business Models in Hybrid OrganizationsReprinted from: Sustainability 2016, 8, 194, doi:10.3390/su8030194 . . . . . . . . . . . . . . . . . . 182
M. Isabel Sanchez-Hernandez, Dolores Gallardo-Vazquez, Agnieszka Barcik and
Piotr Dziwinski
The Effect of the Internal Side of Social Responsibility on Firm Competitive Success in theBusiness Services IndustryReprinted from: Sustainability 2016, 8, 179, doi:10.3390/su8020179 . . . . . . . . . . . . . . . . . . 217
v
Chia-Nan Wang, Xuan-Tho Nguyen and Yen-Hui Wang
Automobile Industry Strategic Alliance Partner Selection: The Application of a Hybrid DEAand Grey Theory ModelReprinted from: Sustainability 2016, 8, 173, doi:10.3390/su8020173 . . . . . . . . . . . . . . . . . . 232
Marzanna Katarzyna Witek-Hajduk and Piotr Zaborek
Does Business Model Affect CSR Involvement? A Survey of Polish Manufacturing and ServiceCompaniesReprinted from: Sustainability 2016, 8, 93, doi:10.3390/su8020093 . . . . . . . . . . . . . . . . . . . 250
Courage Matobobo and Isaac O. Osunmakinde
Analytical Business Model for Sustainable Distributed Retail Enterprises in a CompetitiveMarketReprinted from: Sustainability 2016, 8, 140, doi:10.3390/su8020140 . . . . . . . . . . . . . . . . . . 271
Elzbieta Izabela Szczepankiewicz and Przemysław Mucko
CSR Reporting Practices of Polish Energy and Mining CompaniesReprinted from: Sustainability 2016, 8, 126, doi:10.3390/su8020126 . . . . . . . . . . . . . . . . . . 289
Barbara Kozuch and Katarzyna Sienkiewicz-Małyjurek
Inter-Organisational Coordination for Sustainable Local Governance: Public SafetyManagement in PolandReprinted from: Sustainability 2016, 8, 123, doi:10.3390/su8020123 . . . . . . . . . . . . . . . . . . 306
Liliana Hawrysz and Joachim Foltys
Environmental Aspects of Social Responsibility of Public Sector OrganizationsReprinted from: Sustainability 2016, 8, 19, doi:10.3390/su8010019 . . . . . . . . . . . . . . . . . . . 327
Jingxiao Zhang, Haiyan Xie, Klaus Schmidt and Hui Li
A New Systematic Approach to Vulnerability Assessment of Innovation Capability ofConstruction EnterprisesReprinted from: Sustainability 2016, 8, 17, doi:10.3390/su8010017 . . . . . . . . . . . . . . . . . . . 337
Ning Wang and Runlin Yan
Research on Consumers’ Use Willingness and Opinions of Electric Vehicle Sharing:An Empirical Study in ShanghaiReprinted from: Sustainability 2016, 8, 7, doi:10.3390/su8010007 . . . . . . . . . . . . . . . . . . . 362
Jeng-Wen Lin, Pu Fun Shen and Yin-Sung Hsu
Effects of Employees’ Work Values and Organizational Management on Corporate Performancefor Chinese and Taiwanese Construction EnterprisesReprinted from: Sustainability 2016, 8, 16836–16848, doi:10.3390/su71215852 . . . . . . . . . . . . 380
Chanwoo Cho and Sungjoo Lee
How Firms Can Get Ideas from Users for Sustainable Business InnovationReprinted from: Sustainability 2015, 7, 16039–16059, doi:10.3390/su71215802 . . . . . . . . . . . . 393
Gianluigi De Mare, Maria Fiorella Granata and Antonio Nestico
Weak and Strong Compensation for the Prioritization of Public Investments: MultidimensionalAnalysis for PoolsReprinted from: Sustainability 2015, 7, 16022–16038, doi:10.3390/su71215798 . . . . . . . . . . . . 414
Joanna Radomska
The Concept of Sustainable Strategy ImplementationReprinted from: Sustainability 2015, 7, 15847–15856, doi:10.3390/su71215790 . . . . . . . . . . . . 431
vi

Jeng-Wen Lin, Pu Fun Shen and Bing-Jean Lee
Repetitive Model Refinement for Questionnaire Design Improvement in the Evaluation ofWorking Characteristics in Construction EnterprisesReprinted from: Sustainability 2015, 7, 15179–15193, doi:10.3390/su71115179 . . . . . . . . . . . . 441
Seungkyum Kim, Changho Son, Byungun Yoon and Yongtae Park
Development of an Innovation Model Based on a Service-Oriented Product Service System(PSS)Reprinted from: Sustainability 2015, 7, 14427–14449, doi:10.3390/su71114427 . . . . . . . . . . . . 453
Mateusz Lewandowski
Designing the Business Models for Circular Economy—Towards the Conceptual FrameworkReprinted from: Sustainability 2016, 8, 43, doi:10.3390/su8010043 . . . . . . . . . . . . . . . . . . . 472
vii


About the Special Issue Editor
Adam Jabłonski is an associate professor Ph.D. at the WSB University in Poznan, Faculty in
Chorzow, Poland, Institute of Management. President of the Board of the consulting company
“OTTIMA plus” Ltd. Katowice and Vice-President of the Association Southern Railway Cluster. He
holds a postdoctoral degree in Economic Sciences, specializing in Management Science. He is the
author of a variety of studies and business analyses in the value management, risk management,
balanced scorecard, and corporate social responsibility fields. He has also written and co-written
several monographs and over 100 scientific articles in the field of management, published both in
Poland and in abroad.
His scientific interests include issues of modern and efficient business model design, including
sustainable business models and the principles of company value-building strategies that include
the rules of corporate social responsibility. He is also interested in business models and their key
attributes. He has explored various features of business models, especially focusing on the design and
operationalization of business models in a network environment. He has studied the mechanisms
that shape business models in a network environment, searching for universal principles, which are
a source of further scientific exploration in this area.
Currently, he is also a member of Scientific Boards of International Journals and he is the scientific
reviewer in 10 entities (USA, India, Denmark, Germany), and in Scientific Boards of National Journals
he is a scientific reviewer in nine entities.
ix


Preface to ”Sustainable Business Models”
The dynamically changing world economy, which is in an era of intensive development and
globalization, creates new needs in both the theoretical models of management and in the practical
discussion related to the perception of business. Because of new economic phenomena related to
the crisis, there is a need for the design and operationalization of innovative business models for
companies. Due to the fact that in times of crisis, the principles of strategic balance are particularly
important, these business models can be sustainable business models. Moreover, it is essential to
skillfully use different methods and concepts of management to ensure the continuity of business. It
seems that sustainable business models, in their essence, can support companies’ effectiveness and
contribute to their stable, sustainable functioning in the difficult, ever-changing market.
This Special Issue aims to discuss the key mechanisms concerning the design and
operationalization of sustainable business models, from a strategic perspective. We invite you to
contribute to this Issue by submitting comprehensive reviews, case studies, or research articles.
Papers selected for this Special Issue are subject to a rigorous peer review procedure, with the aim of
rapid and wide dissemination of research results, developments, and applications.
Adam Jabłonski
Special Issue Editor
xi

sustainability
Article
A Balanced Scorecard of Sustainable Management inthe Taiwanese Bicycle Industry: Development ofPerformance Indicators and Importance Analysis
Chih-Chao Chung 1, Li-Chung Chao 1, Chih-Hong Chen 2 and Shi-Jer Lou 3,*
1 Institute of Engineering Science and Technology, National Kaohsiung First University ofScience and Technology, Kaohsiung City 824, Taiwan; [email protected] (C.-C.C.);[email protected] (L.-C.C.)
2 Department of Modern Languages, National Pingtung University of Science and Technology, Pingtung 912,Taiwan; [email protected]
3 Graduate Institute of Technological and Vocational Education,National Pingtung University of Science and Technology, Pingtung 912, Taiwan
* Correspondence: [email protected]; Tel.: +886-8-770-3202
Academic Editors: Adam Jabłonski and Marc A. RosenReceived: 5 February 2016; Accepted: 25 May 2016; Published: 28 May 2016
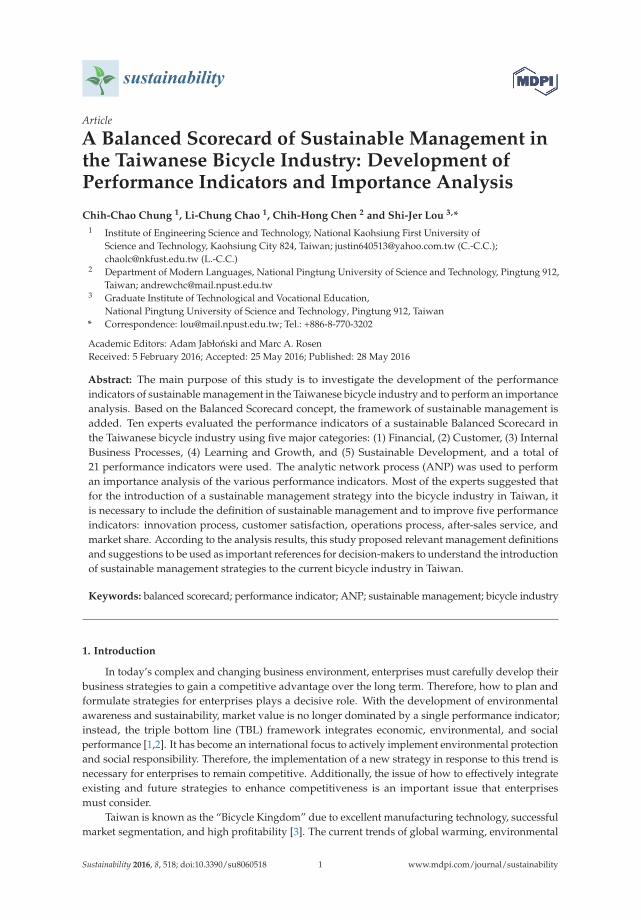
Abstract: The main purpose of this study is to investigate the development of the performanceindicators of sustainable management in the Taiwanese bicycle industry and to perform an importanceanalysis. Based on the Balanced Scorecard concept, the framework of sustainable management isadded. Ten experts evaluated the performance indicators of a sustainable Balanced Scorecard inthe Taiwanese bicycle industry using five major categories: (1) Financial, (2) Customer, (3) InternalBusiness Processes, (4) Learning and Growth, and (5) Sustainable Development, and a total of21 performance indicators were used. The analytic network process (ANP) was used to performan importance analysis of the various performance indicators. Most of the experts suggested thatfor the introduction of a sustainable management strategy into the bicycle industry in Taiwan, itis necessary to include the definition of sustainable management and to improve five performanceindicators: innovation process, customer satisfaction, operations process, after-sales service, andmarket share. According to the analysis results, this study proposed relevant management definitionsand suggestions to be used as important references for decision-makers to understand the introductionof sustainable management strategies to the current bicycle industry in Taiwan.
Keywords: balanced scorecard; performance indicator; ANP; sustainable management; bicycle industry
1. Introduction
In today’s complex and changing business environment, enterprises must carefully develop theirbusiness strategies to gain a competitive advantage over the long term. Therefore, how to plan andformulate strategies for enterprises plays a decisive role. With the development of environmentalawareness and sustainability, market value is no longer dominated by a single performance indicator;instead, the triple bottom line (TBL) framework integrates economic, environmental, and socialperformance [1,2]. It has become an international focus to actively implement environmental protectionand social responsibility. Therefore, the implementation of a new strategy in response to this trend isnecessary for enterprises to remain competitive. Additionally, the issue of how to effectively integrateexisting and future strategies to enhance competitiveness is an important issue that enterprisesmust consider.
Taiwan is known as the “Bicycle Kingdom” due to excellent manufacturing technology, successfulmarket segmentation, and high profitability [3]. The current trends of global warming, environmental
Sustainability 2016, 8, 518; doi:10.3390/su8060518 www.mdpi.com/journal/sustainability1
Sustainability 2016, 8, 518
consciousness, sports and leisure activities, and high international oil prices are beneficial to thedevelopment of the bicycle industry. In view of these considerations, if the Taiwanese bicycleindustry can conform to current environmental concerns, actively apply a sustainable business strategy,and maintain business leaders who assume industry responsibility, then the international image ofTaiwan-made bicycles and industrial competitiveness would be enhanced.
Based on the Balanced Scorecard concept, this study includes the definition of sustainablemanagement to develop performance indicators of a sustainable Balanced Scorecard for the bicycleindustry. This study uses the characteristics of the ANP to perform an importance analysis of thepriority of the various performance indicators in the bicycle industry. In addition, the study is intendedto help decision-makers understand the focus of the introduction of a sustainable management strategy.Specifically, the research objectives concerning a sustainable Balanced Scorecard for the bicycle industryof Taiwan are as follows:
(1) to develop performance indicators;(2) to investigate the importance analysis of the performance indicators;(3) to summarize the management definition of the importance of the performance indicators.
2. Literature Review
The trends in sustainable management strategy will be reviewed and the application of a BalancedScorecard will be discussed. The bicycle industry’s current status and sustainability issues will beexamined, and the application of the ANP will be illustrated.
2.1. Sustainable Management Strategy
The Report of the World Commission on Environment and Development states that humankindnow faces economic, social, and environmental threats. Human beings must have the ability to continueto develop and to meet their actual needs, but humanity should not jeopardize the wellbeing of thenext generation. This can be accomplished by applying the concepts of fairness, sustainability, andcommonality [4]. However, the general measure of business performance can be broadly divided intothree dimensions: financial performance, business performance, and organizational performance [5].As the environment changes, companies should not pursue profit maximization as their primary goal;efforts should be made to meet the public’s expectations of businesses, to enhance the corporate image,and to practice sustainable management [6]. To the stakeholders (consumers, shareholders, employees,communities, suppliers, and governments), organizations have a duty to maximize their positiveimpacts while minimizing the negative ones. Studies have suggested that in the future a multinationalcorporation will need to comply with more than 60 different environmental and societal norms [7].Issues related to social aspects are gradually taken seriously. Many companies have been engaged insocial responsibility and social welfare to strengthen their performance in terms of these social aspects.Moreover, the evaluation of business performance has gradually transformed into the triple bottomline framework, which consists of economic, environmental, and social performance [1,2]. The triplebottom line includes a financial baseline, an environmental baseline, and a social baseline. The financialbaseline refers to a company’s financial benefits, as shown by its financial report. The environmentalbaseline focuses on a company’s performance in terms of sustainable management, which requiresthat the company not damage the sustainability of natural capital. Related environmental indicatorsinclude compliance with environmental laws and standards, environmental management systems,energy use, waste disposal, recycling, and the use of eco-technology. The social baseline focuses onsocial capital and the maintenance and development of human capital. Social capital includes themutual trust between members of society and the co-operative relationship. Human capital includesstaff education, investment in health and nutrition, and an emphasis on labor rights. Businesses canparticipate in meaningful work, such as the protection of human rights, the abolition of child labor, theprotection of labor and women’s rights, social care, education, and health care [8,9].
2
Sustainability 2016, 8, 518
2.2. The Application of the Balanced Scorecard
The Balanced Scorecard (BSC) was developed by a one-year research project funded by the U.S.management consultancy firm Nolan, Norton & Co. (acquired by KPMG) in 1990 [10]. The programwas created by David Norton, of Nolan–Norton, and Robert Kaplan, a Harvard University professor.The program aimed to explore “the future overall performance evaluation system of the organization”.The strategy performance measurement system covered four dimensions: Financial, Customer,Internal Processes, and Learning and Growth; it is now known as the Balanced Scorecard [11–13].The application of the Balanced Scorecard is widely employed. In response to different organizationalpatterns, characteristics, and life cycles, there are different focal points, including balanced financialand non-financial indexes, balanced internal and external composing factors, balanced lead–lagrelationships of information, and balanced short-term performance and long-term value [14,15].For example, there are benefits to linking activity-based costing regarding gross profit with the BalancedScorecard after the Balanced Scorecard has been implemented [12]. Fletcher and Smith [16] discusshow, by integrating the analytic hierarchy process technique with the Balanced Scorecard, performanceindicators can be established to objectively assess the performance of enterprises. In addition, theBalanced Scorecard can also be utilized in evaluating the performance of suppliers, particularly whenchoosing them [17,18]. The four dimensions are explained as follows.
(1) Financial perspective
The financial perspective is the ultimate goal of the four dimensions of the Balanced Scorecard; itrepresents the financial performance of its operations [11]. It is primarily the intersection between theinterests of the shareholders and the financial impact of strategic objectives [19]. For most businesses,it is nothing more than the pursuit of revenue growth, increasing productivity, cost reduction, financialrisk management, and other issues [10].
(2) Customer perspective
The customer perspective primarily concerns how the company can create major core values tothe customer through policy and action [19]. The customer and market segments in which a businessunit competes and the measures of the business unit’s performance in these targeted segments aresources of revenue for the company to achieve its financial goals. [12]. The customer perspective canbe categorized into market share, customer acquisition, customer retention, customer satisfaction, andcustomer profitability. Companies must amend the target based on the customers who will generatethe most expected profit and the greatest potential for revenue growth.
(3) Internal business process perspective
The main difference between the Balanced Scorecard setting goals and traditional performancemeasurement systems is the inclusion of the internal business process. Kaplan and Norton state thatbefore designing the internal processes of the measurable performance indicators, the business valuechain should be analyzed. Based on the innovation process, the operation process, and post-salesservice, the internal processes can be implemented such that customer needs are met in an optimalmanner [20]. The beginning of the value chain of the internal business process perspective is theinnovation process, which clarifies the current and future customer needs. New products are developedto meet and create customer needs. Next, the operation process focuses on providing products andservices to existing customers. Finally, the post-sales service process, which includes defective productsand returns, is accounted for.
(4) Learning and growth perspective
The Learning and Growth perspective is about how to improve the competitiveness of theorganization and its human resources to accept the challenges to be faced in the future [19]. This
3
Sustainability 2016, 8, 518
perspective has three major core objectives—employee capabilities; information system capabilities;and motivation, empowerment, and alignment. The financial, customer, and internal business processperspectives of the Balanced Scorecard reveal gaps between the desired and actual ability of employees,systems, and procedures. To narrow these gaps, companies must invest to advance staff skills,strengthen information technology systems, and adjust organizational procedures and daily operationsso that employee satisfaction is enhanced, and staff retention rates and employee productivity aremaximized [11].
In summary, based on the structure of the Balanced Scorecard, there are implications for balancingthe external metrics, such as stakeholders and customers, with the key internal metrics, such as internalprocesses, innovation and learning, and growth [21,22]. Because the Balanced Scorecard is an opensystem, when the interests of all stakeholders and institutions succeed as part of an integral strategy,these interests can be integrated into it [20]. Therefore, this study is based on the original structure ofthe Balanced Scorecard and therefore integrates the environmental and social perspectives to formnew perspectives in order to achieve economic, social, and environmental objectives that also providethe possibility of sustainable development [21,23,24].
2.3. Current Status of the Bicycle Industry
The bicycle industry in Taiwan has been developing for the last 50 years. The foundation of theits industrial development was previous domestic transportation and loading operations. From 1971to 1974, the bicycle industry in Taiwan has helped foreign manufacturers earn gross profits in theform of large ODM orders. Hence, a superb manufacturing technology and a supply chain networkconsisting of many small and medium enterprises has been developed [25]. With the collaboration ofindustry, government, academia, and research, the bicycle industry in Taiwan has moved toward thedevelopment of entrepreneurial firms. The title “Superior Bicycle Kingdom” was won by focusing onadvancing quality and establishing domestic brands [26].
Since 2005, the government has proposed a transportation-industry promotion plan that targetsthe shaping of an international image of superior bicycles and the production of parts and componentsin Taiwan. Combined with industry, government, academia, and other research resources, the bicycleindustry in Taiwan has been continuously developing new materials and innovative features thatincorporate lightweight components, electronics, and ergonomics, as well as meet the demand forgood-value and high-grade products [27].
By developing bicycle product design and research and development capabilities, new featuresof domestic products and the high-tech image have been enhanced. Therefore, the value added andproduct competitiveness has been increased. New features and new materials have been developedand integrated to create a technological environment able to promote product differentiation withthe mainland products. With a leading position in bicycle stores, the bicycle industry in Taiwan hasdelivered more differentiated and innovative products in the international market [27,28]. The bicycleindustry in Taiwan has successfully established a well-known international brand and marketingchannels with the collaborative work of the government and private industry, and now strives totransform into an international high-quality research and development center and sales center [3].
In summary, the bicycle industry in Taiwan has gradually transformed from a manufacturingindustry into one combined with a service industry. The market segments are targeted with thedevelopment of innovative, high-quality bicycle products and services compared with the bicycleindustries of other countries. However, the bicycle industry’s business strategy is less refined. Therefore,this study emphasizes that the bicycle industry must respond to the current trend, pay attention to theenvironment and sustainability issues, and create an excellent image with the superiority of a leadingbrand. To maintain the competitive advantage of the bicycle industry, a sustainable business strategyinvolving the image and products of the company must be actively initiated.
4
Sustainability 2016, 8, 518
2.4. Analytic Network Process (ANP)
The analytic network process is a generalized model of the analytic hierarchy process; bothwere proposed by Thomas L. Saaty [29]. In recent years, the analytic hierarchy process (AHP) hasbeen widely used in many problems involving system decision-making. This method concerns thedivision of system levels, considering one-way influence between the hierarchy, and assumes thatelements of the same level are individually independent. However, there are many cases involvingelements of interdependent and feedback relationships in decision-making problems; AHP cannotincorporate these connections [30]. Bentes, Carneiro, Silva, and Kimura [31] discuss the restrictions ofan integration of BSC and AHP in the multidimensional assessment of organizational performance ina Brazilian telecom company. For example, there must be a hierarchical approach among the elements,assuming that there is no interaction between independent elements, or a sensitivity analysis cannotbe performed to verify whether results are reasonably stable. Therefore, ANP, proposed by Saaty in1996, included the characteristics of interdependence and feedback, enabling scholars and expertsto apply it to a wide range of issues [32,33]. AHP is actually a special case of ANP; AHP assumesthat there is independent influence between the relevant factors of an issue, while ANP assumes thatthere are mutually influential relations among factors [34]. ANP, like AHP, can reach a consensus ofall decision-making through a specific method, but it has a relatively deeper level of considerationcompared with AHP. The application of ANP consists of assessing the priority value of each objectand establishing an interdependence relationship as well as a network between various objectives andguidelines. Accordingly, ANP not only considers the practical problems with dependent characteristicsin programs and guidelines but also possesses a feedback mechanism to handle human society’s realand complex problems [35].
The construction and the steps of implementing the ANP are as follows.
(1) The construction of decision problems system
By investigating the interaction between various criteria, the overall structure of the decisionproblem network map is constructed. If there is an influence of the criteria on the overall structure,it is an outer dependence; if there is an influence between the sub-criteria involved in each criteriongroup, it is an inner dependence.
(2) Pairwise comparisons between various groups and guidelines
After the relationship mentioned above is established, groups with dependencies or feedbackrelationships are pair-wise compared in the AHP methods with a comparison scale from 1 to 9 [36].Questionnaires to all the experts are arranged as follows: by taking the geometric mean as the inputvalue, the comparison matrices are compiled. Each comparison matrix is required for consistencyanalysis, and when the consistency ratio (C.R.) ď0.1, it can be accepted; the paired comparisonquestionnaires can be considered to be valid questionnaires [37,38]. Then,
C.R. “ C.I.{R.I. (1)
where C.I. is the consistency index and R.I. is random inconsistency.
(3) Building a super-matrix
After pairwise comparisons, the vector of each matrix can be calculated. All the vectors includedwithin the matrix form the unweighted super-matrix. The weight of the same element within theunweighted matrix is multiplied by the relating number of community so that all straight fields addup to 1, resulting in the weighted super-matrix.
5
Sustainability 2016, 8, 518
(4) The super-matrix of limiting calculation of decision problems
To obtain a state of long-term stability, the weighted super-matrix is multiplied by itself repeatedlyuntil convergence, where in each column and field the numbers are equal; this can be expressed as thefollowing limit of the weighted super-matrix:
Wlim “ limkÑ8
´Wweighted
¯k. (2)
(5) The advantageous arrangement of feasibility plans
According to the various possible solutions and standards between each feature vector in thematrix to obtain the whole feature vector, one can find the best solution.
(6) Sensitivity analysis of the decision problem
The decision problem can be performed through sensitivity analysis to analyze the strength ofthe overall arrangement. This allows policy makers to see how the results change when a certaininput value changes and to observe whether the result is stable after the order is changed. Therefore,policymakers can choose the proposed plan with more confidence.
ANP has a wide range of applications in addition to the use of multi-target and multi-criteriadecision-making. It can access and evaluate the relative importance of a number of indicators todetermine the most suitable solution and be an important reference for the organization’s resourceallocation and policy construction [39,40]. The main purpose of this study is to select the performanceindicators of a sustainable strategy for the bicycle industry and to assess the relative importance ofperformance indicators. The bicycle industry can therefore adopt this model as an important referencefor further sustainable decision-making.
3. Research Design and Methods
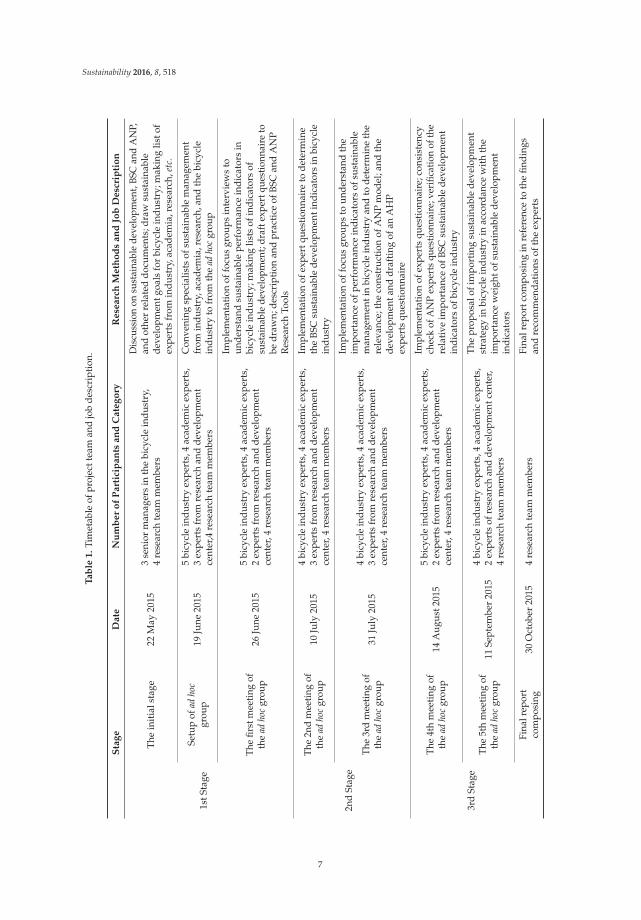
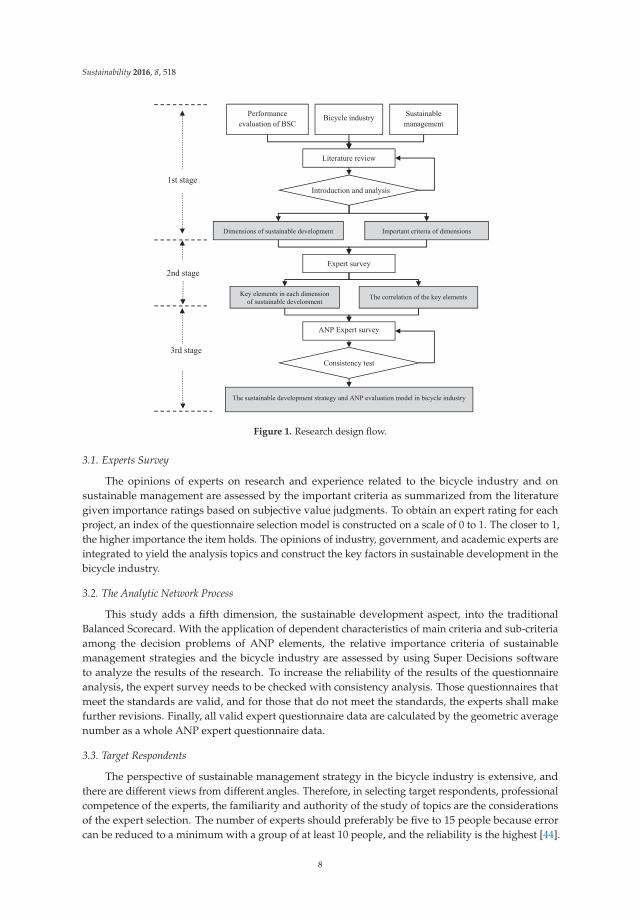
This study refers to Incorporating Design Thinking into Sustainable Business Modeling by Lehmann,Bocken, Steingrimsson, and Evans [41] to construct the bicycle sustainable management BalancedScorecard performance indicators ANP assessment model. By integrating the value mapping tool [42]and different notions and concrete cogitations that focus the design process around the concerns,interests, and values of humans in an iterative and interactive way [43], the interaction design isassembled. This study design is divided into three stages. The detailed process of the study is shownin Figure 1, and the project team work is listed in Table 1.
The first stage is based on the four aspects of the Balanced Scorecard: the analysis of sustainablemanagement and the literature review of the bicycle industry to summarize how the assessmentdimensions and criteria can be incorporated into the bicycle industry’s sustainable developmentstrategy. The second stage is to draw on the experience and opinions of experts by using a questionnairesurvey of the key elements of sustainable management strategies selected from all facets and importantprojects and to determine the correlation between the key elements as the basis for constructing theANP evaluation model. The third stage is to construct the ANP evaluation model and to includeanalysis of the dependency of the relevance among the criteria. With the analysis of the ANP expertsurvey results, the relative importance of the key elements emerges to help policy-makers realize therelevance of sustainable management to Taiwan’s bicycle industry.
6
Sustainability 2016, 8, 518
Ta
ble
1.
Tim
etab
leof
proj
ectt
eam
and
job
desc
ript
ion.
Sta
ge
Da
teN
um
be
ro
fP
art
icip
an
tsa
nd
Ca
teg
ory
Re
sea
rch
Me
tho
ds
an
dJo
bD
esc
rip
tio
n
1stS
tage
The
init
ials
tage
22M
ay20
153
seni
orm
anag
ers
inth
ebi
cycl
ein
dust
ry,
4re
sear
chte
amm
embe
rs
Dis
cuss
ion
onsu
stai
nabl
ede
velo
pmen
t,BS
Can
dA
NP,
and
othe
rre
late
ddo
cum
ents
;dra
wsu
stai
nabl
ede
velo
pmen
tgoa
lsfo
rbi
cycl
ein
dust
ry;m
akin
glis
tof
expe
rts
from
indu
stry
,aca
dem
ia,r
esea
rch,
etc.
Setu
pof
adho
cgr
oup
19Ju
ne20
155
bicy
cle
indu
stry
expe
rts,
4ac
adem
icex
pert
s,3
expe
rts
from
rese
arch
and
deve
lopm
ent
cent
er,4
rese
arch
team
mem
bers
Con
veni
ngsp
ecia
lists
ofsu
stai
nabl
em
anag
emen
tfr
omin
dust
ry,a
cade
mia
,res
earc
h,an
dth
ebi
cycl
ein
dust
ryto
from
the
adho
cgr
oup
The
first
mee
ting
ofth
ead
hoc
grou
p26
June
2015
5bi
cycl
ein
dust
ryex
pert
s,4
acad
emic
expe
rts,
2ex
pert
sfr
omre
sear
chan
dde
velo
pmen
tce
nter
,4re
sear
chte
amm
embe
rs
Impl
emen
tati
onof
focu
sgr
oups
inte
rvie
ws
toun
ders
tand
sust
aina
ble
perf
orm
ance
indi
cato
rsin
bicy
cle
indu
stry
;mak
ing
lists
ofin
dica
tors
ofsu
stai
nabl
ede
velo
pmen
t;dr
afte
xper
tque
stio
nnai
reto
bedr
awn;
desc
ript
ion
and
prac
tice
ofBS
Can
dA
NP
Res
earc
hTo
ols
2nd
Stag
e
The
2nd
mee
ting
ofth
ead
hoc
grou
p10
July
2015
4bi
cycl
ein
dust
ryex
pert
s,4
acad
emic
expe
rts,
3ex
pert
sfr
omre
sear
chan
dde
velo
pmen
tce
nter
,4re
sear
chte
amm
embe
rs
Impl
emen
tati
onof
expe
rtqu
esti
onna
ire
tode
term
ine
the
BSC
sust
aina
ble
deve
lopm
enti
ndic
ator
sin
bicy
cle
indu
stry
The
3rd
mee
ting
ofth
ead
hoc
grou
p31
July
2015
4bi
cycl
ein
dust
ryex
pert
s,4
acad
emic
expe
rts,
3ex
pert
sfr
omre
sear
chan
dde
velo
pmen
tce
nter
,4re
sear
chte
amm
embe
rs
Impl
emen
tati
onof
focu
sgr
oups
toun
ders
tand
the
impo
rtan
ceof
perf
orm
ance
indi
cato
rsof
sust
aina
ble
man
agem
enti
nbi
cycl
ein
dust
ryan
dto
dete
rmin
eth
ere
leva
nce;
the
cons
truc
tion
ofA
NP
mod
el;a
ndth
ede
velo
pmen
tand
draf
ting
ofan
AH
Pex
pert
squ
esti
onna
ire
3rd
Stag
e
The
4th
mee
ting
ofth
ead
hoc
grou
p14
Aug
ust2
015
5bi
cycl
ein
dust
ryex
pert
s,4
acad
emic
expe
rts,
2ex
pert
sfr
omre
sear
chan
dde
velo
pmen
tce
nter
,4re
sear
chte
amm
embe
rs
Impl
emen
tati
onof
expe
rts
ques
tion
nair
e;co
nsis
tenc
ych
eck
ofA
NP
expe
rts
ques
tionn
aire
;ver
ifica
tion
ofth
ere
lati
veim
port
ance
ofBS
Csu
stai
nabl
ede
velo
pmen
tin
dica
tors
ofbi
cycl
ein
dust
ry
The
5th
mee
ting
ofth
ead
hoc
grou
p11
Sept
embe
r20
154
bicy
cle
indu
stry
expe
rts,
4ac
adem
icex
pert
s,2
expe
rts
ofre
sear
chan
dde
velo
pmen
tcen
ter,
4re
sear
chte
amm
embe
rs
The
prop
osal
ofim
port
ing
sust
aina
ble
deve
lopm
ent
stra
tegy
inbi
cycl
ein
dust
ryin
acco
rdan
cew
ith
the
impo
rtan
cew
eigh
tofs
usta
inab
lede
velo
pmen
tin
dica
tors
Fina
lrep
ort
com
posi
ng30
Oct
ober
2015
4re
sear
chte
amm
embe
rsFi
nalr
epor
tcom
posi
ngin
refe
renc
eto
the
findi
ngs
and
reco
mm
enda
tion
sof
the
expe
rts
7
Sustainability 2016, 8, 518
Performance evaluation of BSC
Bicycle industry
Literature review
Expert survey
Key elements in each dimension of sustainable development
The correlation of the key elements
ANP Expert survey
Consistency test
The sustainable development strategy and ANP evaluation model in bicycle industry
Sustainable management
Dimensions of sustainable development Important criteria of dimensions
1st stage
2nd stage
3rd stage
Introduction and analysis
Figure 1. Research design flow.
3.1. Experts Survey
The opinions of experts on research and experience related to the bicycle industry and onsustainable management are assessed by the important criteria as summarized from the literaturegiven importance ratings based on subjective value judgments. To obtain an expert rating for eachproject, an index of the questionnaire selection model is constructed on a scale of 0 to 1. The closer to 1,the higher importance the item holds. The opinions of industry, government, and academic experts areintegrated to yield the analysis topics and construct the key factors in sustainable development in thebicycle industry.
3.2. The Analytic Network Process
This study adds a fifth dimension, the sustainable development aspect, into the traditionalBalanced Scorecard. With the application of dependent characteristics of main criteria and sub-criteriaamong the decision problems of ANP elements, the relative importance criteria of sustainablemanagement strategies and the bicycle industry are assessed by using Super Decisions softwareto analyze the results of the research. To increase the reliability of the results of the questionnaireanalysis, the expert survey needs to be checked with consistency analysis. Those questionnaires thatmeet the standards are valid, and for those that do not meet the standards, the experts shall makefurther revisions. Finally, all valid expert questionnaire data are calculated by the geometric averagenumber as a whole ANP expert questionnaire data.
3.3. Target Respondents
The perspective of sustainable management strategy in the bicycle industry is extensive, andthere are different views from different angles. Therefore, in selecting target respondents, professionalcompetence of the experts, the familiarity and authority of the study of topics are the considerationsof the expert selection. The number of experts should preferably be five to 15 people because errorcan be reduced to a minimum with a group of at least 10 people, and the reliability is the highest [44].
8
Sustainability 2016, 8, 518
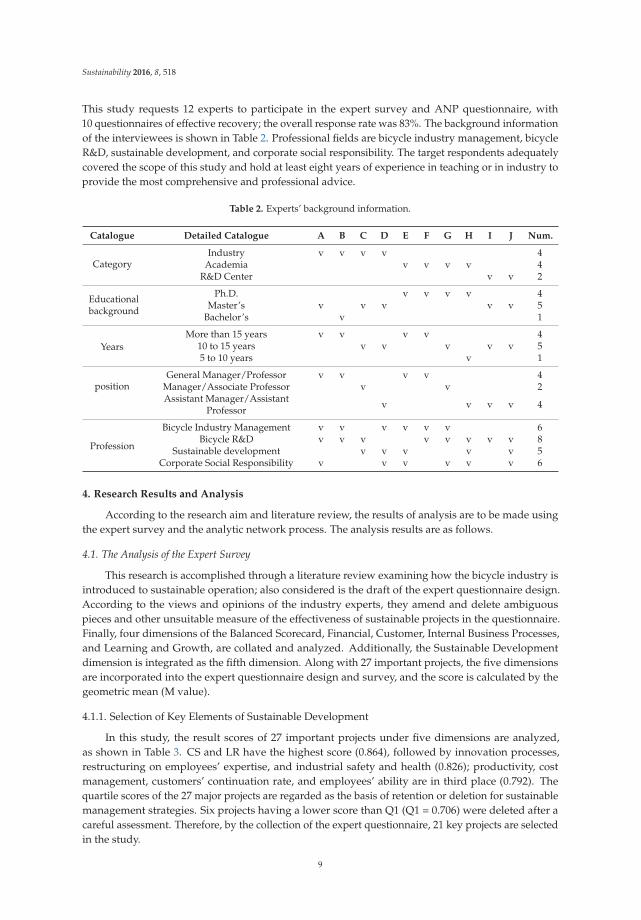
This study requests 12 experts to participate in the expert survey and ANP questionnaire, with10 questionnaires of effective recovery; the overall response rate was 83%. The background informationof the interviewees is shown in Table 2. Professional fields are bicycle industry management, bicycleR&D, sustainable development, and corporate social responsibility. The target respondents adequatelycovered the scope of this study and hold at least eight years of experience in teaching or in industry toprovide the most comprehensive and professional advice.
Table 2. Experts’ background information.
Catalogue Detailed Catalogue A B C D E F G H I J Num.
CategoryIndustry v v v v 4
Academia v v v v 4R&D Center v v 2
Educationalbackground
Ph.D. v v v v 4Master’s v v v v v 5
Bachelor’s v 1
YearsMore than 15 years v v v v 4
10 to 15 years v v v v v 55 to 10 years v 1
positionGeneral Manager/Professor v v v v 4
Manager/Associate Professor v v 2Assistant Manager/Assistant
Professor v v v v 4
Profession
Bicycle Industry Management v v v v v v 6Bicycle R&D v v v v v v v v 8
Sustainable development v v v v v 5Corporate Social Responsibility v v v v v v 6
4. Research Results and Analysis
According to the research aim and literature review, the results of analysis are to be made usingthe expert survey and the analytic network process. The analysis results are as follows.
4.1. The Analysis of the Expert Survey
This research is accomplished through a literature review examining how the bicycle industry isintroduced to sustainable operation; also considered is the draft of the expert questionnaire design.According to the views and opinions of the industry experts, they amend and delete ambiguouspieces and other unsuitable measure of the effectiveness of sustainable projects in the questionnaire.Finally, four dimensions of the Balanced Scorecard, Financial, Customer, Internal Business Processes,and Learning and Growth, are collated and analyzed. Additionally, the Sustainable Developmentdimension is integrated as the fifth dimension. Along with 27 important projects, the five dimensionsare incorporated into the expert questionnaire design and survey, and the score is calculated by thegeometric mean (M value).
4.1.1. Selection of Key Elements of Sustainable Development
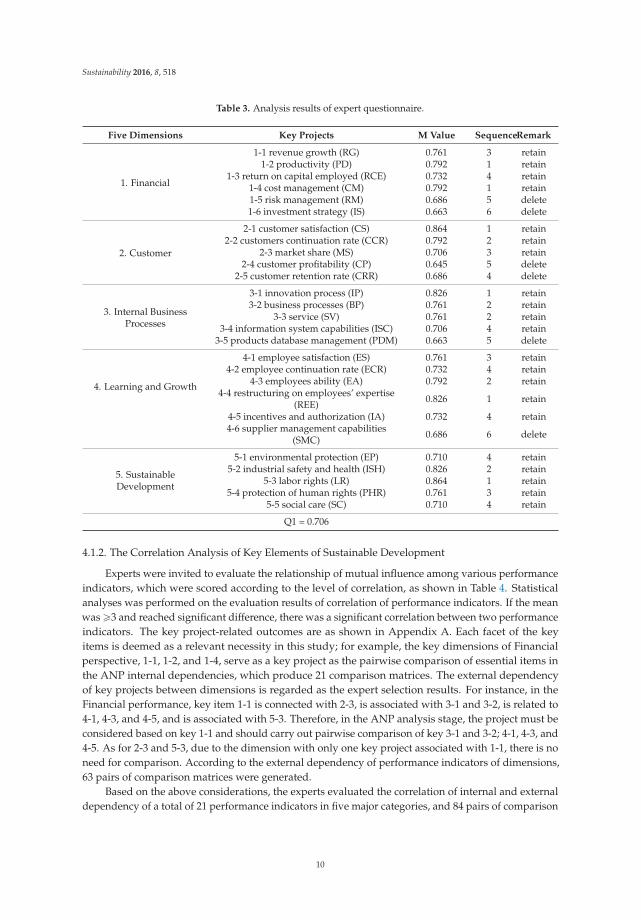
In this study, the result scores of 27 important projects under five dimensions are analyzed,as shown in Table 3. CS and LR have the highest score (0.864), followed by innovation processes,restructuring on employees’ expertise, and industrial safety and health (0.826); productivity, costmanagement, customers’ continuation rate, and employees’ ability are in third place (0.792). Thequartile scores of the 27 major projects are regarded as the basis of retention or deletion for sustainablemanagement strategies. Six projects having a lower score than Q1 (Q1 = 0.706) were deleted after acareful assessment. Therefore, by the collection of the expert questionnaire, 21 key projects are selectedin the study.
9
Sustainability 2016, 8, 518
Table 3. Analysis results of expert questionnaire.
Five Dimensions Key Projects M Value SequenceRemark
1. Financial
1-1 revenue growth (RG) 0.761 3 retain1-2 productivity (PD) 0.792 1 retain
1-3 return on capital employed (RCE) 0.732 4 retain1-4 cost management (CM) 0.792 1 retain1-5 risk management (RM) 0.686 5 delete1-6 investment strategy (IS) 0.663 6 delete
2. Customer
2-1 customer satisfaction (CS) 0.864 1 retain2-2 customers continuation rate (CCR) 0.792 2 retain
2-3 market share (MS) 0.706 3 retain2-4 customer profitability (CP) 0.645 5 delete
2-5 customer retention rate (CRR) 0.686 4 delete
3. Internal BusinessProcesses
3-1 innovation process (IP) 0.826 1 retain3-2 business processes (BP) 0.761 2 retain
3-3 service (SV) 0.761 2 retain3-4 information system capabilities (ISC) 0.706 4 retain
3-5 products database management (PDM) 0.663 5 delete
4. Learning and Growth
4-1 employee satisfaction (ES) 0.761 3 retain4-2 employee continuation rate (ECR) 0.732 4 retain
4-3 employees ability (EA) 0.792 2 retain4-4 restructuring on employees’ expertise
(REE) 0.826 1 retain
4-5 incentives and authorization (IA) 0.732 4 retain4-6 supplier management capabilities
(SMC) 0.686 6 delete
5. SustainableDevelopment
5-1 environmental protection (EP) 0.710 4 retain5-2 industrial safety and health (ISH) 0.826 2 retain
5-3 labor rights (LR) 0.864 1 retain5-4 protection of human rights (PHR) 0.761 3 retain
5-5 social care (SC) 0.710 4 retain
Q1 = 0.706
4.1.2. The Correlation Analysis of Key Elements of Sustainable Development
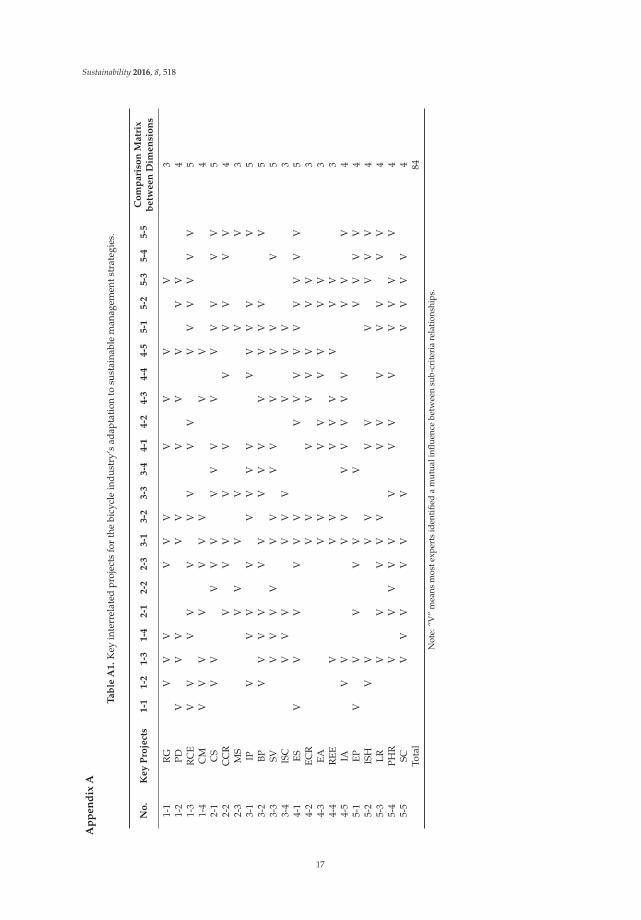
Experts were invited to evaluate the relationship of mutual influence among various performanceindicators, which were scored according to the level of correlation, as shown in Table 4. Statisticalanalyses was performed on the evaluation results of correlation of performance indicators. If the meanwas ě3 and reached significant difference, there was a significant correlation between two performanceindicators. The key project-related outcomes are as shown in Appendix A. Each facet of the keyitems is deemed as a relevant necessity in this study; for example, the key dimensions of Financialperspective, 1-1, 1-2, and 1-4, serve as a key project as the pairwise comparison of essential items inthe ANP internal dependencies, which produce 21 comparison matrices. The external dependencyof key projects between dimensions is regarded as the expert selection results. For instance, in theFinancial performance, key item 1-1 is connected with 2-3, is associated with 3-1 and 3-2, is related to4-1, 4-3, and 4-5, and is associated with 5-3. Therefore, in the ANP analysis stage, the project must beconsidered based on key 1-1 and should carry out pairwise comparison of key 3-1 and 3-2; 4-1, 4-3, and4-5. As for 2-3 and 5-3, due to the dimension with only one key project associated with 1-1, there is noneed for comparison. According to the external dependency of performance indicators of dimensions,63 pairs of comparison matrices were generated.
Based on the above considerations, the experts evaluated the correlation of internal and externaldependency of a total of 21 performance indicators in five major categories, and 84 pairs of comparison
10
Sustainability 2016, 8, 518
matrices were generated. These were used as the basis to develop the ANP evaluation model ofintroduction of Balanced Scorecard of sustainable management into the bicycle industry.
Table 4. Questionnaire of mutual influence and relationship on key projects.
Very Irrelevant Irrelevant Fair RelevantVery
Relevant
1-1 revenuegrowth ˝ (1 point) ˝ (2 points) ˝ (3 points) ˝ (4 points) ˝ (5 points) 2-1 customer
satisfaction
4.2. The Analysis of Analytic Network Process (ANP) Expert Questionnaires
Expert questionnaires are utilized to assess the key projects of the bicycle industry adaptation tothe sustainable management strategies, including 27 important projects under five dimensions, andtheir relevance, to construct the ANP evaluation model. Statistics and analyses are performed by theuse of expert questionnaires and Super Decisions software. The results are as follows.
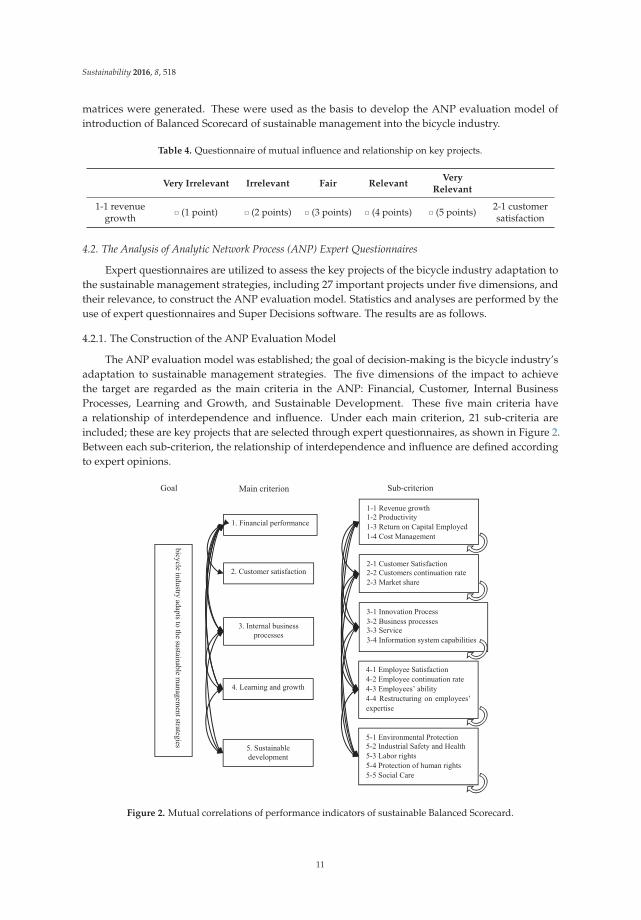
4.2.1. The Construction of the ANP Evaluation Model
The ANP evaluation model was established; the goal of decision-making is the bicycle industry’sadaptation to sustainable management strategies. The five dimensions of the impact to achievethe target are regarded as the main criteria in the ANP: Financial, Customer, Internal BusinessProcesses, Learning and Growth, and Sustainable Development. These five main criteria havea relationship of interdependence and influence. Under each main criterion, 21 sub-criteria areincluded; these are key projects that are selected through expert questionnaires, as shown in Figure 2.Between each sub-criterion, the relationship of interdependence and influence are defined accordingto expert opinions.
bicycle industry adapts to the sustainable managem
ent strategies
1. Financial performance
2. Customer satisfaction
3. Internal business processes
4. Learning and growth
5. Sustainable development
1-1 Revenue growth 1-2 Productivity 1-3 Return on Capital Employed 1-4 Cost Management
2-1 Customer Satisfaction 2-2 Customers continuation rate 2-3 Market share
3-1 Innovation Process 3-2 Business processes 3-3 Service 3-4 Information system capabilities
4-1 Employee Satisfaction 4-2 Employee continuation rate 4-3 Employees’ ability 4-4 Restructuring on employees’ expertise
5-1 Environmental Protection 5-2 Industrial Safety and Health 5-3 Labor rights 5-4 Protection of human rights 5-5 Social Care
Goal Main criterion Sub-criterion
Figure 2. Mutual correlations of performance indicators of sustainable Balanced Scorecard.
11
Sustainability 2016, 8, 518
4.2.2. Paired Comparison and Consistency Test
Based on the results of the ANP expert questionnaires, this study is examined for consistency withthe advice of every expert included. Valid questionnaires are calculated with the use of the geometricmean to find the average. After the integration with the comparison matrix is obtained, the expertoverall consistency test then followed. This study used Super Decisions software to obtain the weightand CI value of various matrices. The analysis results showed that the C.I. value of all the matriceswas ď0.1, suggesting that there was a certain amount of consistency in paired comparisons obtainedafter experts’ preference integration. The weights of various matrices were also highly reliable [36].
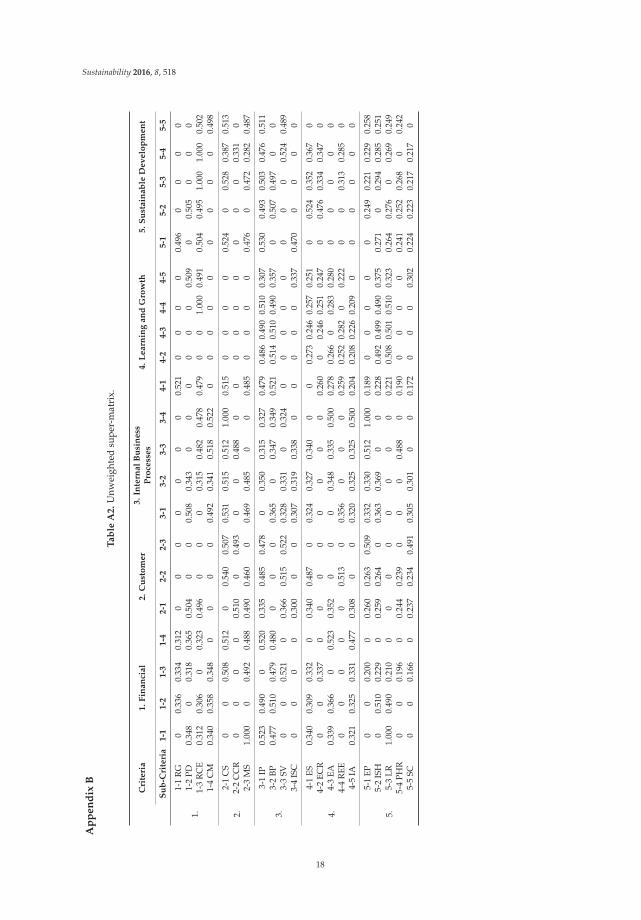
The eigenvectors obtained from various matrices were integrated to obtain the initial super-matrixassessed from the introduction of the sustainable management model into the bicycle industry; theunweighted super-matrix is shown in Appendix B. Because the unweighted super-matrix is composedof many paired comparison matrices, it is random. In other words, the total eigenvector of each row isnot equal to 1. Therefore, it is necessary to adjust the unweighted super-matrix to conform to the basicprinciple of randomization of ANP theory.
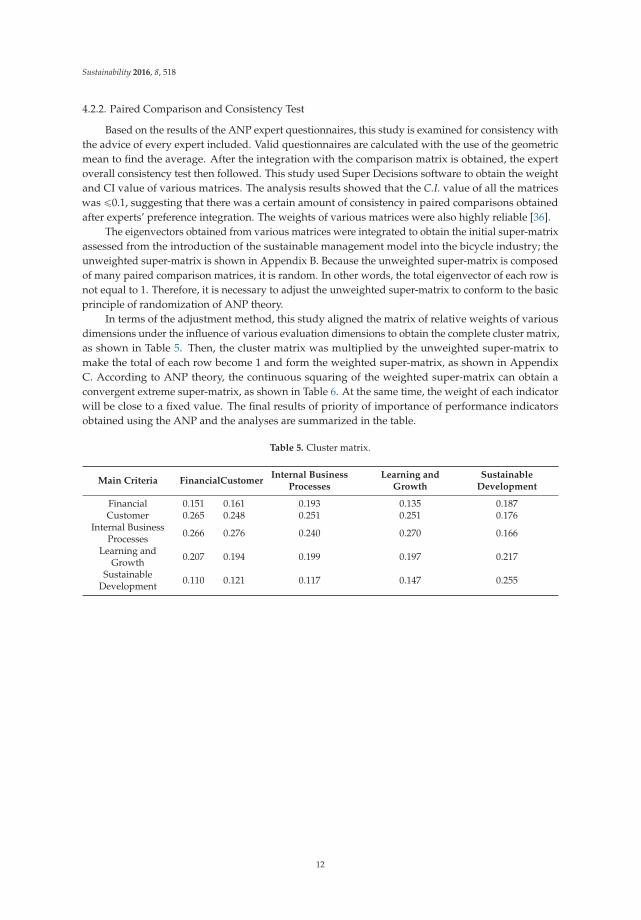
In terms of the adjustment method, this study aligned the matrix of relative weights of variousdimensions under the influence of various evaluation dimensions to obtain the complete cluster matrix,as shown in Table 5. Then, the cluster matrix was multiplied by the unweighted super-matrix tomake the total of each row become 1 and form the weighted super-matrix, as shown in AppendixC. According to ANP theory, the continuous squaring of the weighted super-matrix can obtain aconvergent extreme super-matrix, as shown in Table 6. At the same time, the weight of each indicatorwill be close to a fixed value. The final results of priority of importance of performance indicatorsobtained using the ANP and the analyses are summarized in the table.
Table 5. Cluster matrix.
Main Criteria FinancialCustomerInternal Business
ProcessesLearning and
GrowthSustainable
Development
Financial 0.151 0.161 0.193 0.135 0.187Customer 0.265 0.248 0.251 0.251 0.176
Internal BusinessProcesses 0.266 0.276 0.240 0.270 0.166
Learning andGrowth 0.207 0.194 0.199 0.197 0.217
SustainableDevelopment 0.110 0.121 0.117 0.147 0.255
12
Sustainability 2016, 8, 518
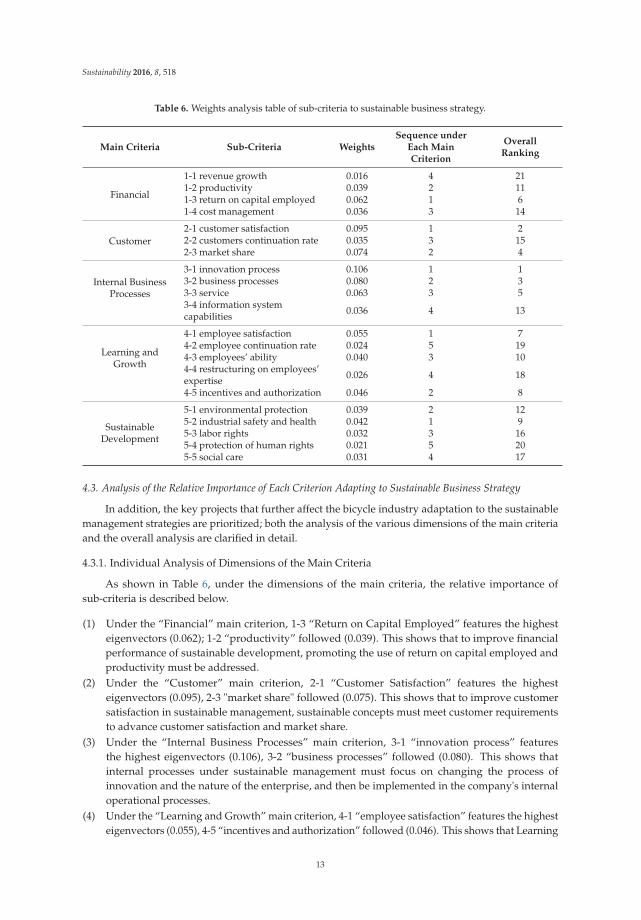
Table 6. Weights analysis table of sub-criteria to sustainable business strategy.
Main Criteria Sub-Criteria WeightsSequence under
Each MainCriterion
OverallRanking
Financial
1-1 revenue growth 0.016 4 211-2 productivity 0.039 2 111-3 return on capital employed 0.062 1 61-4 cost management 0.036 3 14
Customer2-1 customer satisfaction 0.095 1 22-2 customers continuation rate 0.035 3 152-3 market share 0.074 2 4
Internal BusinessProcesses
3-1 innovation process 0.106 1 13-2 business processes 0.080 2 33-3 service 0.063 3 53-4 information systemcapabilities 0.036 4 13
Learning andGrowth
4-1 employee satisfaction 0.055 1 74-2 employee continuation rate 0.024 5 194-3 employees’ ability 0.040 3 104-4 restructuring on employees’expertise 0.026 4 18
4-5 incentives and authorization 0.046 2 8
SustainableDevelopment
5-1 environmental protection 0.039 2 125-2 industrial safety and health 0.042 1 95-3 labor rights 0.032 3 165-4 protection of human rights 0.021 5 205-5 social care 0.031 4 17
4.3. Analysis of the Relative Importance of Each Criterion Adapting to Sustainable Business Strategy
In addition, the key projects that further affect the bicycle industry adaptation to the sustainablemanagement strategies are prioritized; both the analysis of the various dimensions of the main criteriaand the overall analysis are clarified in detail.
4.3.1. Individual Analysis of Dimensions of the Main Criteria
As shown in Table 6, under the dimensions of the main criteria, the relative importance ofsub-criteria is described below.
(1) Under the “Financial” main criterion, 1-3 “Return on Capital Employed” features the highesteigenvectors (0.062); 1-2 “productivity” followed (0.039). This shows that to improve financialperformance of sustainable development, promoting the use of return on capital employed andproductivity must be addressed.
(2) Under the “Customer” main criterion, 2-1 “Customer Satisfaction” features the highesteigenvectors (0.095), 2-3 "market share" followed (0.075). This shows that to improve customersatisfaction in sustainable management, sustainable concepts must meet customer requirementsto advance customer satisfaction and market share.
(3) Under the “Internal Business Processes” main criterion, 3-1 “innovation process” featuresthe highest eigenvectors (0.106), 3-2 “business processes” followed (0.080). This shows thatinternal processes under sustainable management must focus on changing the process ofinnovation and the nature of the enterprise, and then be implemented in the company's internaloperational processes.
(4) Under the “Learning and Growth” main criterion, 4-1 “employee satisfaction” features the highesteigenvectors (0.055), 4-5 “incentives and authorization” followed (0.046). This shows that Learning
13
Sustainability 2016, 8, 518
and Growth of enterprises under sustainable management must address employee satisfactionand emphasize employee incentives and sufficient authorization to improve the efficiency oflearning and growth of the organization.
(5) Under the “sustainable development” main criterion, 5-2 “industrial safety and health” featuresthe highest eigenvectors (0.042), followed by 5-1 “environmental protection” (0.039). The resultsshow that under a sustainable management strategy, it is necessary to attach importance to theinternal industrial safety and health of the company and to significantly reduce the use of varioushazardous substances and energies, as well as to make products that are approved by variousinternational green standard certifications, such as the IECQ QC 080000 hazardous substancemanagement system standard, or the EU CE Marking to achieve the objectives of environmentalprotection and social care.
In summary, the application of ANP carries out an overall assessment to be more rational andmore suitable for the company to determine the results [32]. When faced with the pressure of theinternational trend of sustainability, the Taiwanese bicycle industry has to adopt aggressive sustainablestrategies, set up objectives as countermeasures, and use ANP to understand the importance ofvarious indictors in various dimensions. In this way, the said information can be used as the basis fordetermining the priorities under limited resources in the organization. In addition, it can also be usedto measure relative weights of company performance. Therefore, the bicycle industry can focus on thedirection of execution of sustainable management strategies and assess the performance of executionof strategies to further improve strategy effectiveness.
4.3.2. Overall Analysis
From the overall analysis, most of the experts believe that the top five sub-criteria adapting tosustainable business strategy are innovation process (0.106), Customer Satisfaction (0.095), businessprocesses (0.080), service (0.074), and market share (0.063), as shown in Table 6. The results showthat to effectively achieve the overall effectiveness of the adaptation to sustainable managementstrategies, it is necessary to strengthen the application of the innovation process and the supply chainrelationships, and mutual trust must be established with long-term interaction and cooperation [28].Additionally, providing products to meet customer satisfaction is critical. For example, with the sameproducts, there is now environmental consciousness in customers’ choices, and they tend to buyproducts with eco-labels. Meanwhile, business processes within the enterprise must be implemented;otherwise, the effectiveness of the adaptation of sustainable management strategies will be greatlyreduced [45]. Additionally, companies must plan sustainable services to meet customers’ requirementsfor sustainable development, to increase market share, and to accomplish the goal of sustainablebusiness strategies and benefits.
What is more, there is the added new dimension of the sustainability Balanced Scorecard—sustainabledevelopment, the five sub-criteria of which do not receive a higher rating from experts. They are:industrial safety and health (0.042), environmental protection (0.039), labor rights (0.032), social care(0.031), and protection of human rights (0.021). Nevertheless, they should be taken into account.According to Thomas Saaty, even the smallest factors, as long as they will have an effect, need to beincluded in the structure [38]. The results of this study show that most experts believe sustainabledevelopment strategy must be adapted from the comprehensive nature of system processes of theenterprise, rather than unilateral emphasis and promotion on individual indicators to achieve theoverall effect.
Based on the above, this study used the characteristics of ANP to determine the priority of weightsof each sub-criterion and reflect the current trend of sustainable issues of the bicycle industry in Taiwan.This study clarifies that with the adaptation of sustainable business strategies, it is also importantto focus on the transformation of the company's internal systems. Under the premise of sustainablebusiness strategies, innovative approaches are taken to improve enterprise business processes and toimprove customer satisfaction and thus to achieve the goal of sustainable development [3,27].
14
Sustainability 2016, 8, 518
5. Conclusions and Recommendations
In accordance with the purposes of this study, research and analysis are conducted; the conclusions,managerial implications, and suggestions are as follows.
5.1. Conclusions and Managerial Implications
(1) This study attempted to adjust and modify the traditional Balanced Scorecard framework andused an expert questionnaire to confirm that the introduction of sustainable management strategyinto the bicycle industry should be from five major categories: Financial, Customer, InternalBusiness Processes, Learning and Growth, and Sustainable Development. With selection via afiltering mechanism, the five dimensions contain a total of 21 key projects. The results of thequestionnaire show that the evaluations of the experts are highly consistent. On the managerialimplications, these five dimensions can be regarded as the core of the bicycle industry’s adaptationto sustainable management strategies, and according to the 21 key projects, the performanceindicators are set correspondingly to measure the effectiveness of the adaptation of sustainablemanagement strategies.
(2) From prioritizing key projects of various dimensions in the bicycle industry adaptation tosustainable management strategies, it is known that companies must focus on promoting thereturn on capital employed and productivity to improve financial performance. By achievingcustomer requirements for sustainable development, customer satisfaction and market sharecan be enhanced. The company must also focus on changing the process of innovation and thenature of enterprise, implemented in the company’s internal operational processes. Furthermore,companies must pay attention to employee satisfaction and give emphasis to employee incentivesand sufficient authorization to improve the efficiency of learning and growth of the organization.The company must start with industrial health and safety within and then broaden outward tothe relevant interested parties to achieve the purposes of environmental protection and social care.In terms of managerial implications, the company can apply ANP to conduct the assessment onvarious dimensions, to obtain results that are more rational and more in line with the company’sfeatures. By confirming the relative importance of the various indicators as the performancemeasure in strategy implementation, the strategic direction of the company can be focused toenhance the effectiveness of the company’s strategy execution.
(3) From the overall analysis of the bicycle industry adaptation to sustainable management strategies,the three key factors are innovation process, customer satisfaction, and business processes. TheTaiwanese bicycle industry has responded to global sustainable environmental consciousness,as well as the highly competitive international business. To achieve the goal of sustainabledevelopment, the enterprise itself must have the forces of innovation and of research anddevelopment and be able to grow with trends and to create advantages. The company mustalso effectively take hold of the changing needs of customers and improve customer satisfaction.Moreover, when the industry adapts to the sustainable management strategies, the main point ofimplementation is to change the nature of the corporate business processes. As to managerialimplications, if Taiwan’s bicycle industry wants to possess a competitive advantage on the globalstage, the results of this study should be heeded. Innovation process, customer satisfaction, andbusiness processes must be emphasized to conform to the trend of the times and the environment.Innovative force must be restored in preparation for sustainable management strategies and toenable the brand leading the industry to grow.
5.2. Limitations of the Study and Recommendations
This study analyzes the assessment model of the bicycle industry’s adaptation to sustainablemanagement strategies, giving the practical applications to industry as well as directions for futureresearch. The recommendations are as follows.
15
Sustainability 2016, 8, 518
(1) Practical application to industry
This study analyzes and assesses only those strategies for the sustainable management of thebicycle industry; hence, the conclusions are not suitable to explain other industries. It is suggestedthat decision-makers from the bicycle industry can benefit from the results of this research, whichare the Balanced Scorecard of sustainable management, the five facets, and a total of 21 performanceindicators. They must merge and implement these tools with the company's sustainable managementstrategy. Additionally, performance evaluation is suggested to realize the current situation of thecompany as a basis for subsequent improvement.
Furthermore, the sustainable management BSC ANP assessment process in this study can alsobe referred to, to cope with external environmental factors and the company’s attributes, as wellas to reexamine and assess from a holistic perspective. By using ANP assessment to inspect theimportance of each performance indicator and analyze its connotations for management wishing tocreate a concrete and feasible action plan, the implementation of performance indicators and the goalof sustainable development can be achieved.
(2) Future research
This study is primarily related to the bicycle industry; therefore, the conclusions give priority tothe bicycle industry’s sustainable development. Future research could incorporate the customer viewsinto the bicycle industry to form the basis of strategic planning. In addition, the Balanced Scorecardof sustainable management mainly takes the entire bicycle industry as the research object to providestrategies of sustainable development. Follow-up studies could address individual bicycle businessesas a case study. Based on the attributes of the company, sustainable business performance assessmenttools can be facilitated to design a more complete and detailed measure, and the performance ofsustainable development strategy can be introduced to businesses so that they can perform quantitativeanalysis. In addition, in the current generation of shorter product life cycles, it is recommended toconduct a one-year period of dynamic monitoring.
The Balanced Scorecard assessment process proposed in this study can be taken into account forthe assessment of future development in the bicycle industry, to manage the dynamics of the bicycleindustry and therefore determine a company’s business direction. Additionally, the bicycle industrytrends and the status performance of the company can be compared to understand a company'sadvantages, disadvantages, and opportunities to better facilitate and make the most effective use oflimited resources.
Acknowledgments: The authors would like to thank the reviewers for their thoughtful review andvaluable comments.
Author Contributions: Shi-Jer Lou and Li-Chung Chao conceived and designed the experiments;Chih-Chao Chung and Shi-Jer Lou performed the experiments; Chih-Chao Chung and Chih-hong Chen analyzedthe data; Chih-Chao Chung and Li-Chung Chao contributed reagents/ materials/ analysis tools; Chih-Chao Chungand Chih-hong Chen wrote the paper.
Conflicts of Interest: The authors declare no conflict of interest.
16
Sustainability 2016, 8, 518
Ap
pe
nd
ixA
Ta
ble
A1
.K
eyin
terr
elat
edpr
ojec
tsfo
rth
ebi
cycl
ein
dust
ry’s
adap
tati
onto
sust
aina
ble
man
agem
ents
trat
egie
s.
No
.K
ey
Pro
ject
s1
-11
-21
-31
-42
-12
-22
-33
-13
-23
-33
-44
-14
-24
-34
-44
-55
-15
-25
-35
-45
-5C
om
pa
riso
nM
atr
ixb
etw
ee
nD
ime
nsi
on
s
1-1
RG
VV
VV
VV
VV
VV
31-
2PD
VV
VV
VV
VV
VV
41-
3R
CE
VV
VV
VV
VV
VV
VV
VV
V5
1-4
CM
VV
VV
VV
VV
V4
2-1
CS
VV
VV
VV
VV
VV
VV
VV
52-
2C
CR
VV
VV
VV
VV
VV
42-
3M
SV
VV
VV
V3
3-1
IPV
VV
VV
VV
VV
VV
VV
53-
2BP
VV
VV
VV
VV
VV
VV
VV
53-
3SV
VV
VV
VV
VV
VV
VV
53-
4IS
CV
VV
VV
VV
VV
34-
1ES
VV
VV
VV
VV
VV
VV
VV
V5
4-2
ECR
VV
VV
VV
VV
34-
3EA
VV
VV
VV
VV
34-
4R
EEV
VV
VV
VV
VV
34-
5IA
VV
VV
VV
VV
VV
VV
45-
1EP
VV
VV
VV
VV
VV
45-
2IS
HV
VV
VV
VV
VV
V4
5-3
LRV
VV
VV
VV
VV
VV
V4
5-4
PHR
VV
VV
VV
VV
VV
VV
V4
5-5
SCV
VV
VV
VV
VV
V4
Tota
l84
Not
e:”V
”m
eans
mos
texp
erts
iden
tifie
da
mut
uali
nflue
nce
betw
een
sub-
crit
eria
rela
tion
ship
s.
17
Sustainability 2016, 8, 518
Ap
pe
nd
ixB
Ta
ble
A2
.U
nwei
ghte
dsu
per-
mat
rix.
Cri
teri
a1.
Fin
an
cial
2.
Cu
sto
mer
3.
Inte
rnal
Bu
sin
ess
Pro
cess
es
4.
Learn
ing
an
dG
row
th5.
Su
stain
ab
leD
ev
elo
pm
en
t
Su
b-C
rite
ria
1-1
1-2
1-3
1-4
2-1
2-2
2-3
3-1
3-2
3-3
3-4
4-1
4-2
4-3
4-4
4-5
5-1
5-2
5-3
5-4
5-5
1.
1-1
RG
00.
336
0.33
40.
312
00
00
00
00.
521
00
00
0.49
60
00
01-
2PD
0.34
80
0.31
80.
365
0.50
40
00.
508
0.34
30
00
00
00.
509
00.
505
00
01-
3R
CE
0.31
20.
306
00.
323
0.49
60
00
0.31
50.
482
0.47
80.
479
00
1.00
00.
491
0.50
40.
495
1.00
01.
000
0.50
21-
4C
M0.
340
0.35
80.
348
00
00
0.49
20.
341
0.51
80.
522
00
00
00
00
00.
498
2.2-
1C
S0
00.
508
0.51
20
0.54
00.
507
0.53
10.
515
0.51
21.
000
0.51
50
00
00.
524
00.
528
0.38
70.
513
2-2
CC
R0
00
00.
510
00.
493
00
0.48
80
00
00
00
00
0.33
10
2-3
MS
1.00
00
0.49
20.
488
0.49
00.
460
00.
469
0.48
50
00.
485
00
00
0.47
60
0.47
20.
282
0.48
7
3.
3-1
IP0.
523
0.49
00
0.52
00.
335
0.48
50.
478
00.
350
0.31
50.
327
0.47
90.
486
0.49
00.
510
0.30
70.
530
0.49
30.
503
0.47
60.
511
3-2
BP0.
477
0.51
00.
479
0.48
00
00
0.36
50
0.34
70.
349
0.52
10.
514
0.51
00.
490
0.35
70
0.50
70.
497
00
3-3
SV0
00.
521
00.
366
0.51
50.
522
0.32
80.
331
00.
324
00
00
00
00
0.52
40.
489
3-4
ISC
00
00
0.30
00
00.
307
0.31
90.
338
00
00
00.
337
0.47
00
00
0
4.
4-1
ES0.
340
0.30
90.
332
00.
340
0.48
70
0.32
40.
327
0.34
00
00.
273
0.24
60.
257
0.25
10
0.52
40.
352
0.36
70
4-2
ECR
00
0.33
70
00
00
00
00.
260
00.
246
0.25
10.
247
00.
476
0.33
40.
347
04-
3EA
0.33
90.
366
00.
523
0.35
20
00
0.34
80.
335
0.50
00.
278
0.26
60
0.28
30.
280
00
00
04-
4R
EE0
00
00
0.51
30
0.35
60
00
0.25
90.
252
0.28
20
0.22
20
00.
313
0.28
50
4-5
IA0.
321
0.32
50.
331
0.47
70.
308
00
0.32
00.
325
0.32
50.
500
0.20
40.
208
0.22
60.
209
00
00
00
5.
5-1
EP0
00.
200
00.
260
0.26
30.
509
0.33
20.
330
0.51
21.
000
0.18
90
00
00
0.24
90.
221
0.22
90.
258
5-2
ISH
00.
510
0.22
90
0.25
90.
264
00.
363
0.36
90
00.
228
0.49
20.
499
0.49
00.
375
0.27
10
0.29
40.
285
0.25
15-
3LR
1.00
00.
490
0.21
00
00
00
00
00.
221
0.50
80.
501
0.51
00.
323
0.26
40.
276
00.
269
0.24
95-
4PH
R0
00.
196
00.
244
0.23
90
00
0.48
80
0.19
00
00
00.
241
0.25
20.
268
00.
242
5-5
SC0
00.
166
00.
237
0.23
40.
491
0.30
50.
301
00
0.17
20
00
0.30
20.
224
0.22
30.
217
0.21
70
18
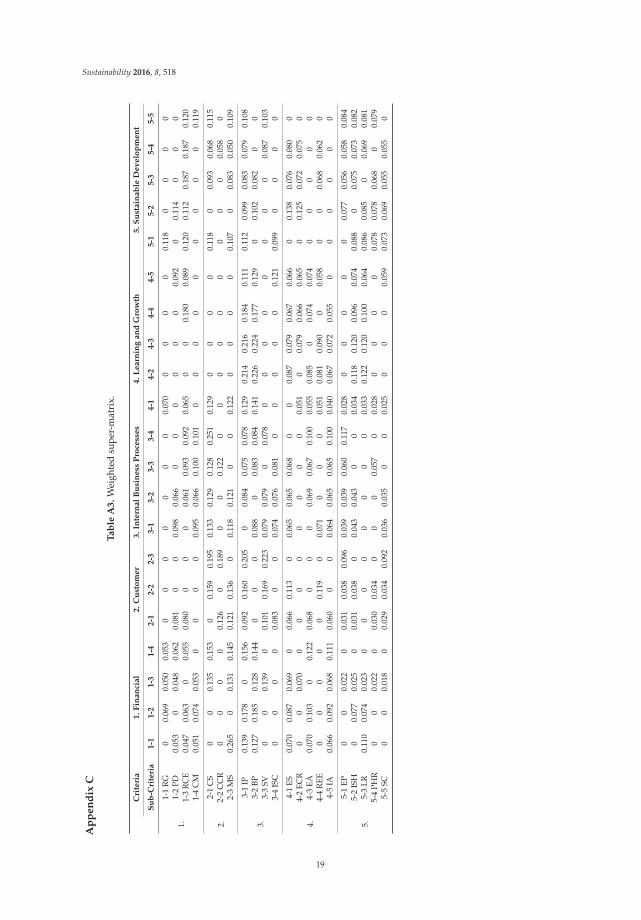
Sustainability 2016, 8, 518
Ap
pe
nd
ixC
Ta
ble
A3
.W
eigh
ted
supe
r-m
atri
x.
Cri
teri
a1
.F
ina
nci
al
2.
Cu
sto
me
r3
.In
tern
al
Bu
sin
ess
Pro
cess
es
4.
Le
arn
ing
an
dG
row
th5
.S
ust
ain
ab
leD
ev
elo
pm
en
t
Su
b-C
rite
ria
1-1
1-2
1-3
1-4
2-1
2-2
2-3
3-1
3-2
3-3
3-4
4-1
4-2
4-3
4-4
4-5
5-1
5-2
5-3
5-4
5-5
1.
1-1
RG
00.
069
0.05
00.
053
00
00
00
00.
070
00
00
0.11
80
00
01-
2PD
0.05
30
0.04
80.
062
0.08
10
00.
098
0.06
60
00
00
00.
092
00.
114
00
01-
3R
CE
0.04
70.
063
00.
055
0.08
00
00
0.06
10.
093
0.09
20.
065
00
0.18
00.
089
0.12
00.
112
0.18
70.
187
0.12
01-
4C
M0.
051
0.07
40.
053
00
00
0.09
50.
066
0.10
00.
101
00
00
00
00
00.
119
2.2-
1C
S0
00.
135
0.15
30
0.15
90.
195
0.13
30.
129
0.12
80.
251
0.12
90
00
00.
118
00.
093
0.06
80.
115
2-2
CC
R0
00
00.
126
00.
189
00
0.12
20
00
00
00
00
0.05
80
2-3
MS
0.26
50
0.13
10.
145
0.12
10.
136
00.
118
0.12
10
00.
122
00
00
0.10
70
0.08
30.
050
0.10
9
3.
3-1
IP0.
139
0.17
80
0.15
60.
092
0.16
00.
205
00.
084
0.07
50.
078
0.12
90.
214
0.21
60.
184
0.11
10.
112
0.09
90.
083
0.07
90.
108
3-2
BP0.
127
0.18
50.
128
0.14
40
00
0.08
80
0.08
30.
084
0.14
10.
226
0.22
40.
177
0.12
90
0.10
20.
082
00
3-3
SV0
00.
139
00.
101
0.16
90.
223
0.07
90.
079
00.
078
00
00
00
00
0.08
70.
103
3-4
ISC
00
00
0.08
30
00.
074
0.07
60.
081
00
00
00.
121
0.09
90
00
0
4.
4-1
ES0.
070
0.08
70.
069
00.
066
0.11
30
0.06
50.
065
0.06
80
00.
087
0.07
90.
067
0.06
60
0.13
80.
076
0.08
00
4-2
ECR
00
0.07
00
00
00
00
00.
051
00.
079
0.06
60.
065
00.
125
0.07
20.
075
04-
3EA
0.07
00.
103
00.
122
0.06
80
00
0.06
90.
067
0.10
00.
055
0.08
50
0.07
40.
074
00
00
04-
4R
EE0
00
00
0.11
90
0.07
10
00
0.05
10.
081
0.09
00
0.05
80
00.
068
0.06
20
4-5
IA0.
066
0.09
20.
068
0.11
10.
060
00
0.06
40.
065
0.06
50.
100
0.04
00.
067
0.07
20.
055
00
00
00
5.
5-1
EP0
00.
022
00.
031
0.03
80.
096
0.03
90.
039
0.06
00.
117
0.02
80
00
00
0.07
70.
056
0.05
80.
084
5-2
ISH
00.
077
0.02
50
0.03
10.
038
00.
043
0.04
30
00.
034
0.11
80.
120
0.09
60.
074
0.08
80
0.07
50.
073
0.08
25-
3LR
0.11
00.
074
0.02
30
00
00
00
00.
033
0.12
20.
120
0.10
00.
064
0.08
60.
085
00.
069
0.08
15-
4PH
R0
00.
022
00.
030
0.03
40
00
0.05
70
0.02
80
00
00.
078
0.07
80.
068
00.
079
5-5
SC0
00.
018
00.
029
0.03
40.
092
0.03
60.
035
00
0.02
50
00
0.05
90.
073
0.06
90.
055
0.05
50
19
Sustainability 2016, 8, 518
References
1. Elkington, J. Partnerships from cannibals with forks: The triple bottom line of 21st-century business.Environ. Qual. Manag. 1998, 8, 37–51. [CrossRef]
2. Hubbard, G. Measuring organizational performance: Beyond the triple bottom line. Bus. Strateg. Environ.2009, 18, 177–191. [CrossRef]
3. Hu, M.-C.; Wu, C.-Y. Exploring technological innovation trajectories through latecomers: Evidence fromTaiwan's bicycle industry. Technol. Anal. Strateg. Manag. 2011, 23, 433–452. [CrossRef]
4. Costanza, R.; Patten, B.C. Defining and predicting sustainability. Ecol. Econ. 1995, 15, 193–196. [CrossRef]5. Venkatraman, N.; Ramanujam, V. Measurement of business performance in strategy research: A comparison
of approaches. Acad. Manag. Rev. 1986, 11, 801–814.6. Robbins, S.P. Essentials of Organizational Behavior; Pearson Higher Ed: Boston, MA, USA, 2013.7. Robins, F. The future of corporate social responsibility. Asian Bus. Manag. 2005, 4, 95–115. [CrossRef]8. Aaronson, S.A. Corporate responsibility in the global village: The British role model and the American
laggard. Bus. Soc. Rev. 2003, 108, 309–338. [CrossRef]9. Crook, C. The good company. Economist 2005, 22, 3–18.10. Kaplan, R.S.; Norton, D.P.; Dorf, R.; Raitanen, M. The Balanced Scorecard: Translating Strategy into Action;
Harvard Business School Press: Boston, MA, USA, 1996; Volume 4.11. Kaplan, R.S.; Norton, D.P. Transforming the balanced scorecard from performance measurement to strategic
management: Part I. Account. Horiz. 2001, 15, 87–104. [CrossRef]12. Maiga, A.S.; Jacobs, F.A. Balanced scorecard, activity-based costing and company performance: An empirical
analysis. J. Manag. Issues 2003, 15, 283–301.13. Álvarez, C.; Rodríguez, V.; Ortega, F.; Villanueva, J. A Scorecard Framework Proposal for Improving
Software Factories’ Sustainability: A Case Study of a Spanish Firm in the Financial Sector. Sustainability 2015,7, 15999–16021. [CrossRef]
14. Niven, P.R. Balanced Scorecard Step-by-Step: Maximizing Performance and Maintaining Results; John Wiley& Sons: New York, NY, USA, 2002.
15. Gibbons, R.; Kaplan, R.S. Formal Measures in Informal Management: Can a Balanced Scorecard Change aCulture? Am. Econ. Rev. Pap. Proc. 2015, 105, 447–451. [CrossRef]
16. Fletcher, H.D.; Smith, D.B. Managing for value: Developing a performance measurement system integratingEVA and the BSC in strategic planning. J. Bus. Strateg. 2004, 21, 1–17.
17. Bhattacharya, A.; Mohapatra, P.; Kumar, V.; Dey, P.K.; Brady, M.; Tiwari, M.K.; Nudurupati, S.S. Greensupply chain performance measurement using fuzzy ANP-based balanced scorecard: A collaborativedecision-making approach. Prod. Plan. Control 2014, 25, 698–714. [CrossRef]
18. Tjader, Y.; May, J.H.; Shang, J.; Vargas, L.G.; Gao, N. Firm-level outsourcing decision making: A balancedscorecard-based analytic network process model. Int. J. Prod. Econ. 2014, 147, 614–623. [CrossRef]
19. Epstein, M.J.; Wisner, P.S. Using a balanced scorecard to implement sustainability. Environ. Qual. Manag.2001, 11, 1–10. [CrossRef]
20. Kaplan, R.S.; Norton, D.P. The Balanced Scorecard: Translating Strategy into Action; Harvard Business Press:Boston, MA, USA, 1997.
21. Möller, A.; Schaltegger, S. The Sustainability Balanced Scorecard as a Framework for Eco-efficiency Analysis.J. Ind. Ecol. 2005, 9, 73–83. [CrossRef]
22. De Felice, F.; Petrillo, A.; Autorino, C. Development of a Framework for Sustainable Outsourcing: AnalyticBalanced Scorecard Method (A-BSC). Sustainability 2015, 7, 8399–8419. [CrossRef]
23. Epstein, M.J.; Research, I. Measuring Corporate Environmental Performance: Best Practices for Costing andManaging an Effective Environmental Strategy; McGraw-Hill: New York, NY, USA, 1996.
24. Schaltegger, S.; Burritt, R. Contemporary Environmental Accounting: Issues, Concepts, and Practice; GreenleafPublishing: Sheffield, UK, 2000.
25. Chu, W.-W. Causes of growth: A study of Taiwan’s bicycle industry. Camb. J. Econ. 1997, 21, 55–72. [CrossRef]26. Yan, H.-D.; Hu, M.-C. Strategic entrepreneurship and the growth of the firm: The case of Taiwan’s bicycle
industry. Glob. Bus. Econ. Rev. 2008, 10, 11–34. [CrossRef]27. Chen, Y.-S.; Lin, M.-J.; Chang, C.-H.; Liu, F.-M. Technological innovations and industry clustering in the
bicycle industry in Taiwan. Technol. Soc. 2009, 31, 207–217. [CrossRef]
20
Sustainability 2016, 8, 518
28. Brookfield, J.; Liu, R.-J.; MacDuffie, J.P. Taiwan’s bicycle industry A-Team battles Chinese competition withinnovation and cooperation. Strateg. Leadersh. 2008, 36, 14–19. [CrossRef]
29. Saaty, T.L. Fundamentals of the analytic network process-dependence and feedback in decision-making witha single network. J. Syst. Sci. Syst. Eng. 2004, 13, 129–157. [CrossRef]
30. Rossi, C.; Cricelli, L.; Grimaldi, M.; Greco, M. The strategic assessment of intellectual capital assets:An application within Terradue Srl. J. Bus. Res. 2016, 69, 1598–1603. [CrossRef]
31. Bentes, A.V.; Carneiro, J.; da Silva, J.F.; Kimura, H. Multidimensional assessment of organizationalperformance: Integrating BSC and AHP. J. Bus. Res. 2012, 65, 1790–1799. [CrossRef]
32. Saaty, T.L. Theory and Applications of the Analytic Network Process: Decision Making with Benefits, Opportunities,Costs, and Risks; RWS Publications: Pittsburgh, PA, USA, 2005; Volume 4992.
33. Staš, D.; Lenort, R.; Wicher, P.; Holman, D. Green Transport Balanced Scorecard Model with AnalyticNetwork Process Support. Sustainability 2015, 7, 15243–15261. [CrossRef]
34. Biondi, S.; Calabrese, A.; Capece, G.; Costa, R.; Di Pillo, F. A New Approach for Assessing DealershipPerformance: An Application for the Automotive Industry. Int. J. Eng. Bus. Manag. 2013, 5, 1–8. [CrossRef]
35. Chung, C.C.; Chao, L.C.; Lou, S.J. The Establishment of a Green Supplier Selection and Guidance Mechanismwith the ANP and IPA. Sustainability 2016, 8, 259–282. [CrossRef]
36. Saaty, T.L. What is the Analytic Hierarchy Process?; Springer: Berlin, Germany, 1988.37. Saaty, T.L. How to make a decision: The analytic hierarchy process. Eur. J. Oper. Res. 1990, 48, 9–26.
[CrossRef]38. Saaty, T.L. Multicriteria Decision Making; RWS Publications: Pittsburgh, PA, USA, 1996.39. Karpak, B.; Topcu, I. Small medium manufacturing enterprises in Turkey: An analytic network process
framework for prioritizing factors affecting success. Int. J. Prod. Econ. 2010, 125, 60–70. [CrossRef]40. Abdi, M.R.; Labib, A.W. Performance evaluation of reconfigurable manufacturing systems via holonic
architecture and the analytic network process. Int. J. Prod. Res. 2011, 49, 1319–1335. [CrossRef]41. Lehmann, M.; Bocken, N.M.P.; Steingrímsson, J.G.; Evans, S. Incorporating Design Thinking into Sustainabl.
Business Modelling. In Proceedings of the 2nd International Conference on Sustainable, Seville, Spain, 12–14April 2015.
42. Bocken, N.; Short, S.; Rana, P.; Evans, S. A value mapping tool for sustainable business modelling. Int. J.Effect. Board Perform. 2013, 13, 482–497.
43. Meinel, C., Leifer, L., Plattner, H., Eds.; Design Thinking; Springer: Berlin, Germany, 2011.44. Dalkey, N.; Helmer, O. An experimental application of the Delphi method to the use of experts. Manag. Sci.
1963, 9, 458–467. [CrossRef]45. Bossidy, L.; Charan, R.; Burck, C. Execution: The discipline of getting things done. Afp. Exchang. 2004, 24,
26–29.
© 2016 by the authors. Licensee MDPI, Basel, Switzerland. This article is an open accessarticle distributed under the terms and conditions of the Creative Commons Attribution(CC BY) license (http://creativecommons.org/licenses/by/4.0/).
21
sustainability
Article
Development of a Novel Co-Creative Framework forRedesigning Product Service Systems
Tuananh Tran and Joon Young Park *
Department of Industrial and Systems Engineering, Dongguk University, Pil-dong, Jung-gu,Seoul 100715, Korea; [email protected]* Correspondence: [email protected]; Tel.: +82-222-603-714
Academic Editor: Adam JabłonskiReceived: 2 February 2016; Accepted: 28 April 2016; Published: 3 May 2016
Abstract: Product service systems (PSS) have been researched in academia and implemented inindustry for more than a decade, and they bring plenty of benefits to various stakeholders, suchas: customers, PSS providers, the environment, as well as society. However, the adoption of PSS inindustry so far is limited compared to its potentials. One of the reasons leading to this limitation isthat PSS design is tricky. So far, there are several methods to design PSS, but each of them has certainlimitations. This paper proposes a co-creative framework, which is constructed using the concept ofuser co-creation. This novel framework allows designers to design PSS effectively in terms of users’perception of PSS value, design quality and evaluation. The authors also introduce a case study todemonstrate and validate the proposed framework.
Keywords: product service system; PSS; PSS design; co-creation; PSS redesign; PSS business model
1. Introduction
1.1. Product Service System
Before the 2000s, consumers were familiar with the paradigm in which companies sell tangibleproducts to the market. For instance: Nokia provided mobile phones; Electrolux provided washingmachines; HP provided printers, etc. Nowadays, the demands of customers become more and morediversified, and the business environment becomes more and more competitive. This leads to the factthat companies are having a difficult time competing with the conventional business model of sellingpurely tangible products [1,2]. There is a need for finding new ways to enhance competitiveness,to attract new customers, as well as to keep existing ones. This need is fulfilled by incorporatingthe concept of product service systems (PSS) [3–5]. These PSS are a form of servitization in which acombination of a tangible product and an intangible service, called a “PSS offering” or simply “PSS”,is provided to the customers [6].
There are several examples of PSS in reality. According to Goedkoop et al. [7], PSS is “a marketableset of products and services capable of jointly fulfilling a user’s needs”. By this definition, the offeringof an iPhone and the Appstore from Apple Inc. can be considered as a PSS. In the same manner, acar-sharing service, where the users check in and pick up a car at a station, use and return the car atanother station, check out and pay per use, is also a PSS. In the car-sharing example, users do notbuy the car; they buy the “mobility” or the use of the car. This new concept of buying is similar to a“functional economy” [8], where customers are interested in “hiring products to get jobs done” [3,9,10].Baines et al. also introduced a well-known example of a PSS, which is the “document managementsolution” [11]. In this example, the customer does not buy a photocopier. Instead, the customer onlybuys its use. The company still owns the product and takes care of refilling, maintenance, replacingparts, etc.
Sustainability 2016, 8, 434; doi:10.3390/su8050434 www.mdpi.com/journal/sustainability22
Sustainability 2016, 8, 434
Since the very first work by Goedkoop et al. nearly two decades ago, PSS has gone a long way withvarious research having been carried out by various researchers. The pioneering works also include theones by Mont [8] and Morelli [12]. So far, PSS is classified into several types. According to Tukker [13],there are three types of PSS: product-oriented PSS, use-oriented PSS and result-oriented PSS.
1.2. Adoption of PSS in Industry
PSS brings benefits to various stakeholders, as studied in the literature [5,11]. For the customers,PSS provides flexible services with a higher level of personalization, better and continuously-improvedquality and, finally, total satisfaction. For companies, thanks to the implementation of PSS, they gainthe loyalty of customers, as well as better control of product quality, continuous improvement, chancesfor reducing costs, increasing knowledge and innovation. For society and the environment, PSS isalso beneficial in terms of reducing materials’ consumption through sharing their use, increasing theresponsibility of manufacturers, expanding the lifecycle of the products and creating more jobs in theservice sector.
PSS is now adopted more and more in industry. In order to promote the adoption of PSS, severalchallenges need to be resolved. These challenges were mentioned in various works by Mont [8],Baines et al. [11] and Beuren et al. [5]. The first challenge is that “ownerless consumption” is notfamiliar to the vast majority of customers. They are familiar with the concept of paying and getting“physical” items. Another challenge is for the manufacturers. They might have difficulties whenmaking decisions on pricing, managing risks and changing the organization due to a changing businessmodel. The major challenge for expanding PSS adoption is “PSS design”. This is not an easy task,because PSS is a complicated system. In PSS, besides products and services, there are also otherelements, such as the delivery network, stakeholders, value proposition, etc.
In order to design PSS, several methods have been introduced. Vasantha et al. reviewed eightwell-known PSS design methods that have been implemented widely so far [6]. As will be analyzedin Section 2, there is still a lack of an effective method to design PSS collaboratively and practically.This lack somehow limits the expansion of PSS adoption in industry.
1.3. Motivation for This Work and Research Goal
This research is motivated by the following real-world scenario: Mulenserv is a company thatprovides various engineering services to customers in the industrial market. One of Mulenserv’sservices is a PSS, which leases technical manuals and books together with supporting services(lectures, application workshops, technical contests, etc.). Their target customers are engineeringindividuals, as well as small technical companies. This is a niche market, and the PSS is highlycustomized due to the diversified demands of various customers. After six months of the initial release,the response of the market was limited: acceptance of potential customers, as well as satisfactionof customers who purchased the PSS were lower than expected. The company needs to redesign toimprove the PSS, so that the acceptance rate and customer satisfaction can be improved and the salescan be increased sustainably. In order to achieve this goal, they need an effective customer-centricframework to improve the PSS design, i.e., redesign the new PSS starting from the existing one.According to Vezzoli et al. [14], most of the successful cases of PSS applications are from the B2B(business to business) sector, not B2C (business to consumer). Mulenserv is a typical B2C case, and adesign solution is needed to help its PSS survive when being launched.
Since customer acceptance and satisfaction with the PSS is of critical importance to its success andthis acceptance strongly depends on the perception of the users of the provided service [14], this paperaims to develop a co-creative framework that allows companies to redesign a PSS in order to improvethe design of the PSS in terms of users’ perception of its value, design quality and evaluation and, thus,leading to increasing customer acceptance and, therefore, increasing its success. In this work, we setthe scope of the framework in a B2C environment. We construct this framework by incorporating theconcept of user co-creation.
23
Sustainability 2016, 8, 434
The next parts of this paper are organized as follows: Section 2 reviews existing literature thatis related to the research topic. Section 3 analyzes solutions and proposes the framework. Section 4introduces the case study, the experimental implementation, results and discussions. Section 5 drawsconcluding remarks and suggests future work.
2. Literature Review
2.1. Existing Methods to Design and Redesign PSS
PSS providers need tools, techniques and methods to design and enhance their PSS to satisfytheir customers. There has been much research conducted to propose PSS design methodologies withsimilar intentions and different ideas [15].
Several methods for designing PSS have been introduced so far [1,2,11]. Beside case-specificmethods, which were developed to design very specific PSSs [16,17], there are several generic methodsthat can be used to design various cases of PSS. These methods were summarized by Vasantha et al. [6].Although being well known and widely implemented, these methods have limitations. One of themis the lack of user co-creation in the design processes [6]. These methods do not mention in detailthe importance of co-creation, and there are no clear definitions of the roles of customers in the PSSdesign process.
More recently, Pezzotta et al. [18] proposed a framework to design and assess PSS from a serviceengineering approach. This framework utilizes computer-aided modeling tool for service design.It starts with functional analysis and the identification of customer needs, simulating and testingvarious scenarios to find out the best solution. Although being well structured, this method has littleinvolvement in co-creation, and the case study provided in the work [18] is more like a B2B case.
Morelli [19] commented that design methods should identify who is involved in the designprocess and their roles, as well as possible scenarios that could occur. The need for implementingcustomer co-creation is also raised in the work of Beuren et al. [5]. Vezzoli et al. [14] implied that adesign method should include details of where and when to involve stakeholders (producer/provider,customer, etc.) and to allow customers to customize a PSS according to their preferences.
Beside the lack of co-creation, existing PSS design methods provide little practical guidelines forpractitioners (i.e., companies) [2]. Incorporating incremental steps in a path or practice is necessaryfor a design method [14]. There is a lack of illustrating cases that can demonstrate and give insightsinto how PSS design methods work in various situations. This explains why existing methods arenot effective in terms of practical implementation. Furthermore, Qu et al. [15] suggested that morequantitative works need to be conducted in the literature because these works are more objectiveand persuasive.
In summary, existing design methodologies have not considerably included co-creation in thedesign processes and are not effective enough to act as practical guidelines for practitioners. In thissense, the involvement of each stakeholder in the design phases is not clarified in detail, and therepresentation of PSS itself is complicated. There is a need for a new method that is co-creative withuser involvement in the design process, better defined roles and responsibilities of stakeholders anda simpler PSS representation and that can provide practical guidelines. This method also need tobe evaluable.
2.2. Value Perception
In a service-oriented system, like a PSS, value perception is a critical issue to decide the buyingpotential of customers, because the service part in PSS is intangible and its value is difficult to measureand estimate [9,11,12]. In order to increase the value perception of PSS, the value of the PSS needsto be visualized. One of the methods to visualize PSS value is communicating and demonstratingPSS to the customers [20]. The importance of PSS value and value proposition has been mentionedin several works [21–23]. In one of the PSS design methods reviewed by Vasantha et al. [6], the value
24
Sustainability 2016, 8, 434
proposition is considered as an important dimension that forms the PSS [24]. Value is claimed to bethe differentiating factor that enables the success of a PSS, and new methods are needed to understandvalue perception in order to evaluate PSS performance [11].
There are also several notable works on PSS value visualization. The value proposition wasemphasized in the PSS design method proposed by Morelli [12]. Several tools that support valuevisualization have been introduced, including the “PSS board” [9] and color-coded CAD models [25].A framework to enhance value visualization and perception has also been proposed by Kowalkowskiand Kindstrom [20]. The above works focus on either value perception of the company (instead of thecustomers) [9,12,25] or value perception particularly in industrial markets [20].
Vezzoli et al. [14] commented that because of the lack of understanding about PSS and thedeep perception of its value, customers are not eager to adopt PSS solutions. This is a barrier forPSS application at the industrial scale. There is a need for new strategies and approaches to makeconsumers accept this new model of consumption.
In order to increase users’ acceptance of PSS offerings, designers must find ways to increase users’perception of PSS value, and thus, the visualization of PSS becomes critical. In Section 3, the authors ofthis work propose a method to represent and present PSS to enhance the communication of PSS valueto the users and enable user participation in co-creation.
2.3. Co-Creation in the Design Improvement and Evaluation of PSS
Steen et al. [26] identified three types of benefits of co-creation for the design project, the customersand the PSS provider. They did this by reviewing the literature and observing three service designprojects. In that work, experimental results were not reported in terms of numerical data, and theyalso implied that there was a need for conducting another experiment and performing a numericalanalysis to validate the effectiveness of user involvement in a service-oriented design project.
The design and development of PSS is a participatory process, and thus, co-creation has beenmentioned in the literature as one of the success enabling factors for PSS [6,11]. Co-creation refersto the participation of customers or users in various phases of its lifecycle, such as ideation, design,development and implementation (i.e., use), etc. The role of user participation is critical to the successbecause of the importance of users in a PSS model. Users are among the most important stakeholders,and because of the presence of the “service” part in which users only buy or hire things that help themto get jobs done [3,9], users’ voices deserve a deep consideration. As pointed out by Vansantha et al., toimprove PSS design, co-creation is employed limitedly in existing PSS design methods [6].
PSS evaluation is an essential issue that has been mentioned by various researchers [9,27–30].Especially, evaluation at the development stage can help companies to reduce the risks of PSS launching.Existing PSS design methods do not consider co-creation deep enough [6,11].
There are several works that dealt briefly with the evaluation issue in PSS design.A “lifecycle simulation” model was proposed by Komoto and Tomiyama [30] and was demonstratedwith a maintenance service. The evaluation of PSS was also considered in the tool developedby Lim et al. [9]. Another approach to PSS evaluation through prototyping was proposed [28].These works [9,28,30] focused on the evaluation of PSS mostly for companies, not for customers.
Customers can be used as a source of innovation by involving them in the PSS designprocess [1,11,31]. A PSS design process in which the participation of customers is used for evaluationwas proposed by Shih et al. [27]. In other work, an algorithm for PSS evaluation was proposed byYoon et al. [28]. However, still, in these works [27,28], customers are not the main drive for making adifference in the effectiveness of the evaluation result.
We aim to develop a novel co-creative framework that uses the co-creation of customers (i.e., users),has detailed defined roles, responsibilities and activities of stakeholders throughout the design processand includes a simple and clear PSS representation. This proposed framework is used to enhance thevalue perception, evaluation and design quality of PSS. It starts with the existing PSS or initial PSSconceptual idea and produces an improved PSS design as the outcome. The PSS that is developed
25
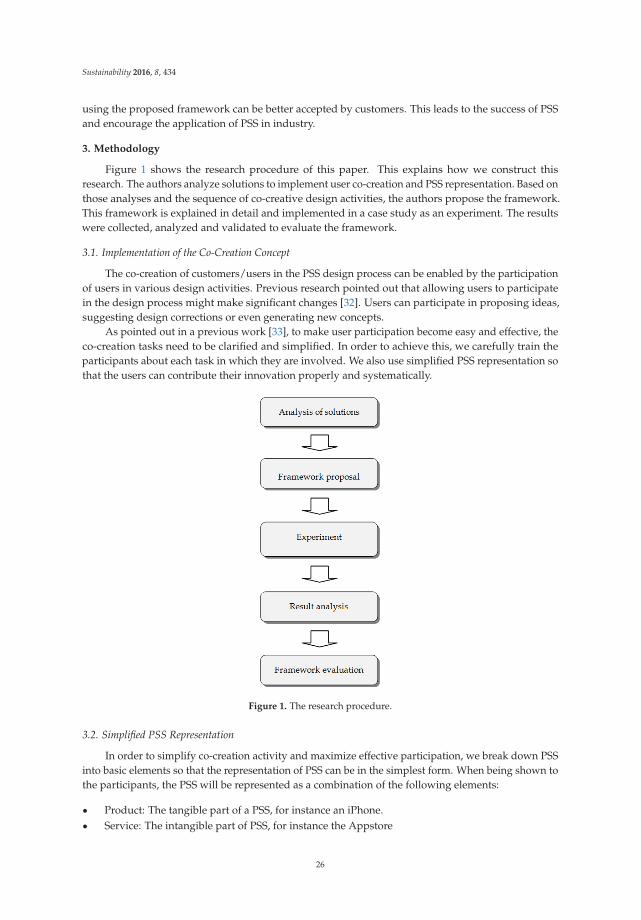
Sustainability 2016, 8, 434
using the proposed framework can be better accepted by customers. This leads to the success of PSSand encourage the application of PSS in industry.
3. Methodology
Figure 1 shows the research procedure of this paper. This explains how we construct thisresearch. The authors analyze solutions to implement user co-creation and PSS representation. Based onthose analyses and the sequence of co-creative design activities, the authors propose the framework.This framework is explained in detail and implemented in a case study as an experiment. The resultswere collected, analyzed and validated to evaluate the framework.
3.1. Implementation of the Co-Creation Concept
The co-creation of customers/users in the PSS design process can be enabled by the participationof users in various design activities. Previous research pointed out that allowing users to participatein the design process might make significant changes [32]. Users can participate in proposing ideas,suggesting design corrections or even generating new concepts.
As pointed out in a previous work [33], to make user participation become easy and effective, theco-creation tasks need to be clarified and simplified. In order to achieve this, we carefully train theparticipants about each task in which they are involved. We also use simplified PSS representation sothat the users can contribute their innovation properly and systematically.
Figure 1. The research procedure.
3.2. Simplified PSS Representation
In order to simplify co-creation activity and maximize effective participation, we break down PSSinto basic elements so that the representation of PSS can be in the simplest form. When being shown tothe participants, the PSS will be represented as a combination of the following elements:
‚ Product: The tangible part of a PSS, for instance an iPhone.‚ Service: The intangible part of PSS, for instance the Appstore
26
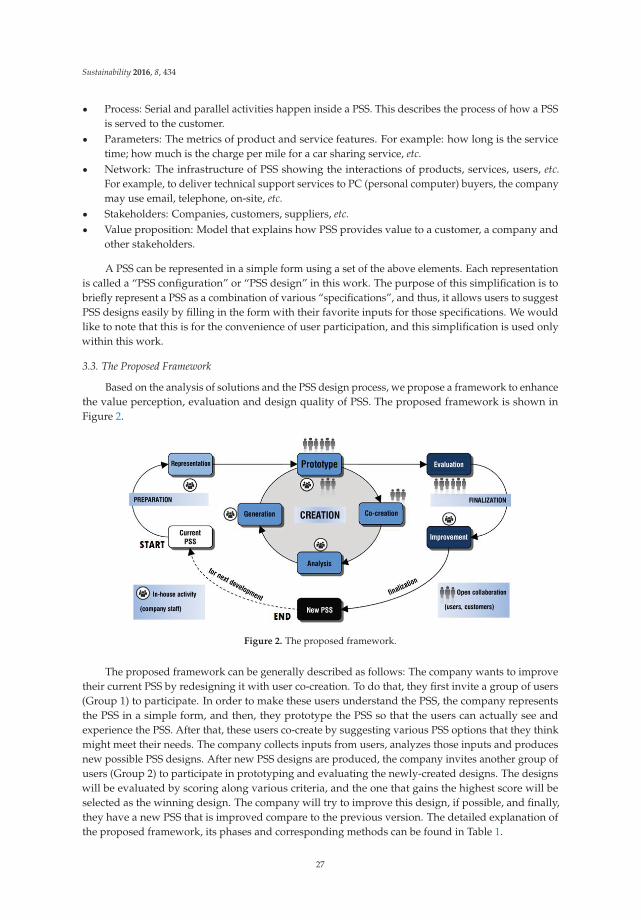
Sustainability 2016, 8, 434
‚ Process: Serial and parallel activities happen inside a PSS. This describes the process of how a PSSis served to the customer.
‚ Parameters: The metrics of product and service features. For example: how long is the servicetime; how much is the charge per mile for a car sharing service, etc.
‚ Network: The infrastructure of PSS showing the interactions of products, services, users, etc.For example, to deliver technical support services to PC (personal computer) buyers, the companymay use email, telephone, on-site, etc.
‚ Stakeholders: Companies, customers, suppliers, etc.‚ Value proposition: Model that explains how PSS provides value to a customer, a company and
other stakeholders.
A PSS can be represented in a simple form using a set of the above elements. Each representationis called a “PSS configuration” or “PSS design” in this work. The purpose of this simplification is tobriefly represent a PSS as a combination of various “specifications”, and thus, it allows users to suggestPSS designs easily by filling in the form with their favorite inputs for those specifications. We wouldlike to note that this is for the convenience of user participation, and this simplification is used onlywithin this work.
3.3. The Proposed Framework
Based on the analysis of solutions and the PSS design process, we propose a framework to enhancethe value perception, evaluation and design quality of PSS. The proposed framework is shown inFigure 2.
Figure 2. The proposed framework.
The proposed framework can be generally described as follows: The company wants to improvetheir current PSS by redesigning it with user co-creation. To do that, they first invite a group of users(Group 1) to participate. In order to make these users understand the PSS, the company representsthe PSS in a simple form, and then, they prototype the PSS so that the users can actually see andexperience the PSS. After that, these users co-create by suggesting various PSS options that they thinkmight meet their needs. The company collects inputs from users, analyzes those inputs and producesnew possible PSS designs. After new PSS designs are produced, the company invites another group ofusers (Group 2) to participate in prototyping and evaluating the newly-created designs. The designswill be evaluated by scoring along various criteria, and the one that gains the highest score will beselected as the winning design. The company will try to improve this design, if possible, and finally,they have a new PSS that is improved compare to the previous version. The detailed explanation ofthe proposed framework, its phases and corresponding methods can be found in Table 1.
27
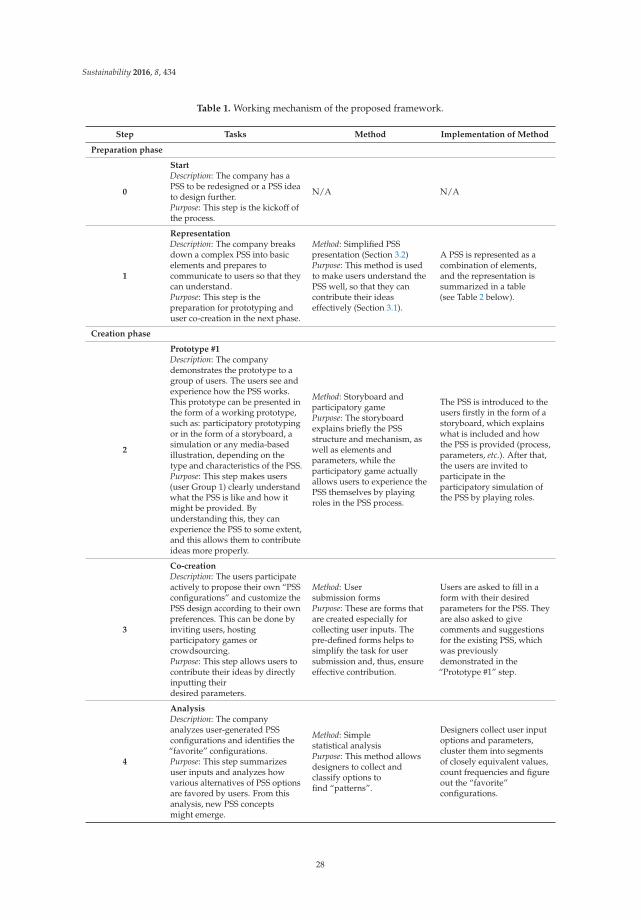
Sustainability 2016, 8, 434
Table 1. Working mechanism of the proposed framework.
Step Tasks Method Implementation of Method
Preparation phase
0
StartDescription: The company has aPSS to be redesigned or a PSS ideato design further.Purpose: This step is the kickoff ofthe process.
N/A N/A
1
RepresentationDescription: The company breaksdown a complex PSS into basicelements and prepares tocommunicate to users so that theycan understand.Purpose: This step is thepreparation for prototyping anduser co-creation in the next phase.
Method: Simplified PSSpresentation (Section 3.2)Purpose: This method is usedto make users understand thePSS well, so that they cancontribute their ideaseffectively (Section 3.1).
A PSS is represented as acombination of elements,and the representation issummarized in a table(see Table 2 below).
Creation phase
2
Prototype #1Description: The companydemonstrates the prototype to agroup of users. The users see andexperience how the PSS works.This prototype can be presented inthe form of a working prototype,such as: participatory prototypingor in the form of a storyboard, asimulation or any media-basedillustration, depending on thetype and characteristics of the PSS.Purpose: This step makes users(user Group 1) clearly understandwhat the PSS is like and how itmight be provided. Byunderstanding this, they canexperience the PSS to some extent,and this allows them to contributeideas more properly.
Method: Storyboard andparticipatory gamePurpose: The storyboardexplains briefly the PSSstructure and mechanism, aswell as elements andparameters, while theparticipatory game actuallyallows users to experience thePSS themselves by playingroles in the PSS process.
The PSS is introduced to theusers firstly in the form of astoryboard, which explainswhat is included and howthe PSS is provided (process,parameters, etc.). After that,the users are invited toparticipate in theparticipatory simulation ofthe PSS by playing roles.
3
Co-creationDescription: The users participateactively to propose their own “PSSconfigurations” and customize thePSS design according to their ownpreferences. This can be done byinviting users, hostingparticipatory games orcrowdsourcing.Purpose: This step allows users tocontribute their ideas by directlyinputting theirdesired parameters.
Method: Usersubmission formsPurpose: These are forms thatare created especially forcollecting user inputs. Thepre-defined forms helps tosimplify the task for usersubmission and, thus, ensureeffective contribution.
Users are asked to fill in aform with their desiredparameters for the PSS. Theyare also asked to givecomments and suggestionsfor the existing PSS, whichwas previouslydemonstrated in the“Prototype #1” step.
4
AnalysisDescription: The companyanalyzes user-generated PSSconfigurations and identifies the“favorite” configurations.Purpose: This step summarizesuser inputs and analyzes howvarious alternatives of PSS optionsare favored by users. From thisanalysis, new PSS conceptsmight emerge.
Method: Simplestatistical analysisPurpose: This method allowsdesigners to collect andclassify options tofind “patterns”.
Designers collect user inputoptions and parameters,cluster them into segmentsof closely equivalent values,count frequencies and figureout the “favorite”configurations.
28
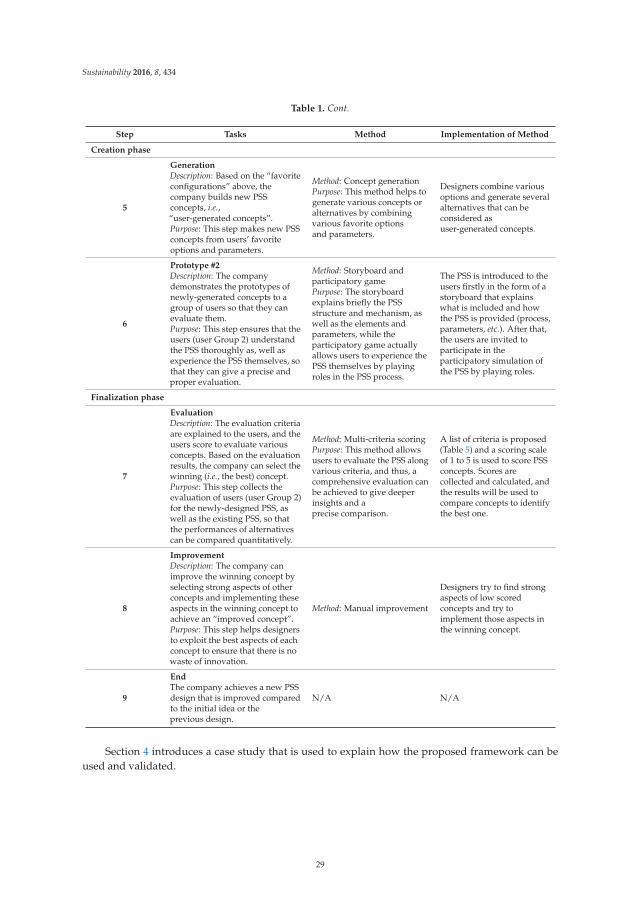
Sustainability 2016, 8, 434
Table 1. Cont.
Step Tasks Method Implementation of Method
Creation phase
5
GenerationDescription: Based on the “favoriteconfigurations” above, thecompany builds new PSSconcepts, i.e.,“user-generated concepts”.Purpose: This step makes new PSSconcepts from users’ favoriteoptions and parameters.
Method: Concept generationPurpose: This method helps togenerate various concepts oralternatives by combiningvarious favorite optionsand parameters.
Designers combine variousoptions and generate severalalternatives that can beconsidered asuser-generated concepts.
6
Prototype #2Description: The companydemonstrates the prototypes ofnewly-generated concepts to agroup of users so that they canevaluate them.Purpose: This step ensures that theusers (user Group 2) understandthe PSS thoroughly as, well asexperience the PSS themselves, sothat they can give a precise andproper evaluation.
Method: Storyboard andparticipatory gamePurpose: The storyboardexplains briefly the PSSstructure and mechanism, aswell as the elements andparameters, while theparticipatory game actuallyallows users to experience thePSS themselves by playingroles in the PSS process.
The PSS is introduced to theusers firstly in the form of astoryboard that explainswhat is included and howthe PSS is provided (process,parameters, etc.). After that,the users are invited toparticipate in theparticipatory simulation ofthe PSS by playing roles.
Finalization phase
7
EvaluationDescription: The evaluation criteriaare explained to the users, and theusers score to evaluate variousconcepts. Based on the evaluationresults, the company can select thewinning (i.e., the best) concept.Purpose: This step collects theevaluation of users (user Group 2)for the newly-designed PSS, aswell as the existing PSS, so thatthe performances of alternativescan be compared quantitatively.
Method: Multi-criteria scoringPurpose: This method allowsusers to evaluate the PSS alongvarious criteria, and thus, acomprehensive evaluation canbe achieved to give deeperinsights and aprecise comparison.
A list of criteria is proposed(Table 5) and a scoring scaleof 1 to 5 is used to score PSSconcepts. Scores arecollected and calculated, andthe results will be used tocompare concepts to identifythe best one.
8
ImprovementDescription: The company canimprove the winning concept byselecting strong aspects of otherconcepts and implementing theseaspects in the winning concept toachieve an “improved concept”.Purpose: This step helps designersto exploit the best aspects of eachconcept to ensure that there is nowaste of innovation.
Method: Manual improvement
Designers try to find strongaspects of low scoredconcepts and try toimplement those aspects inthe winning concept.
9
EndThe company achieves a new PSSdesign that is improved comparedto the initial idea or theprevious design.
N/A N/A
Section 4 introduces a case study that is used to explain how the proposed framework can beused and validated.
29
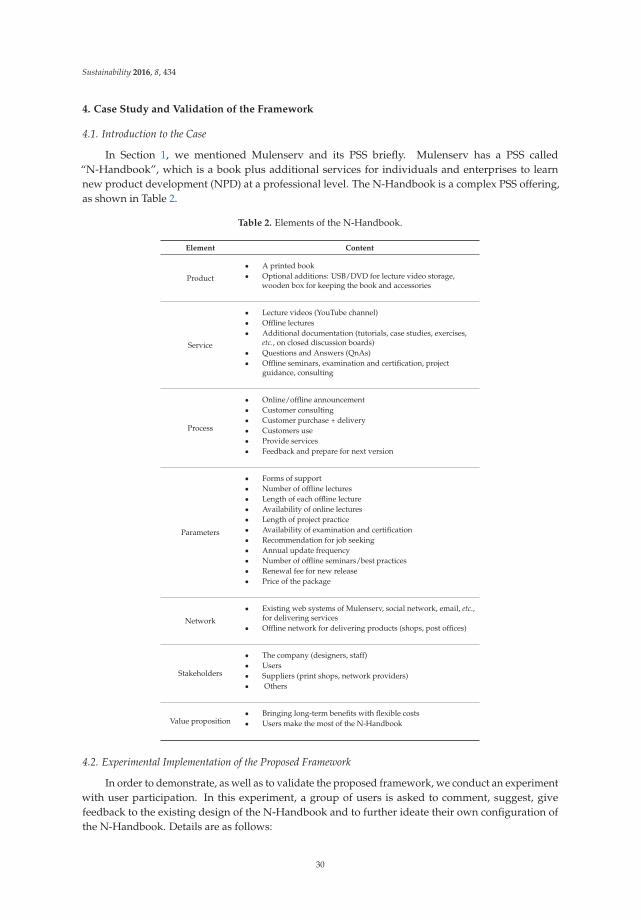
Sustainability 2016, 8, 434
4. Case Study and Validation of the Framework
4.1. Introduction to the Case
In Section 1, we mentioned Mulenserv and its PSS briefly. Mulenserv has a PSS called“N-Handbook”, which is a book plus additional services for individuals and enterprises to learnnew product development (NPD) at a professional level. The N-Handbook is a complex PSS offering,as shown in Table 2.
Table 2. Elements of the N-Handbook.
Element Content
Product
‚ A printed book‚ Optional additions: USB/DVD for lecture video storage,
wooden box for keeping the book and accessories
Service
‚ Lecture videos (YouTube channel)‚ Offline lectures‚ Additional documentation (tutorials, case studies, exercises,
etc., on closed discussion boards)‚ Questions and Answers (QnAs)‚ Offline seminars, examination and certification, project
guidance, consulting
Process
‚ Online/offline announcement‚ Customer consulting‚ Customer purchase + delivery‚ Customers use‚ Provide services‚ Feedback and prepare for next version
Parameters
‚ Forms of support‚ Number of offline lectures‚ Length of each offline lecture‚ Availability of online lectures‚ Length of project practice‚ Availability of examination and certification‚ Recommendation for job seeking‚ Annual update frequency‚ Number of offline seminars/best practices‚ Renewal fee for new release‚ Price of the package
Network
‚ Existing web systems of Mulenserv, social network, email, etc.,for delivering services
‚ Offline network for delivering products (shops, post offices)
Stakeholders
‚ The company (designers, staff)‚ Users‚ Suppliers (print shops, network providers)‚ Others
Value proposition‚ Bringing long-term benefits with flexible costs‚ Users make the most of the N-Handbook
4.2. Experimental Implementation of the Proposed Framework
In order to demonstrate, as well as to validate the proposed framework, we conduct an experimentwith user participation. In this experiment, a group of users is asked to comment, suggest, givefeedback to the existing design of the N-Handbook and to further ideate their own configuration ofthe N-Handbook. Details are as follows:
30
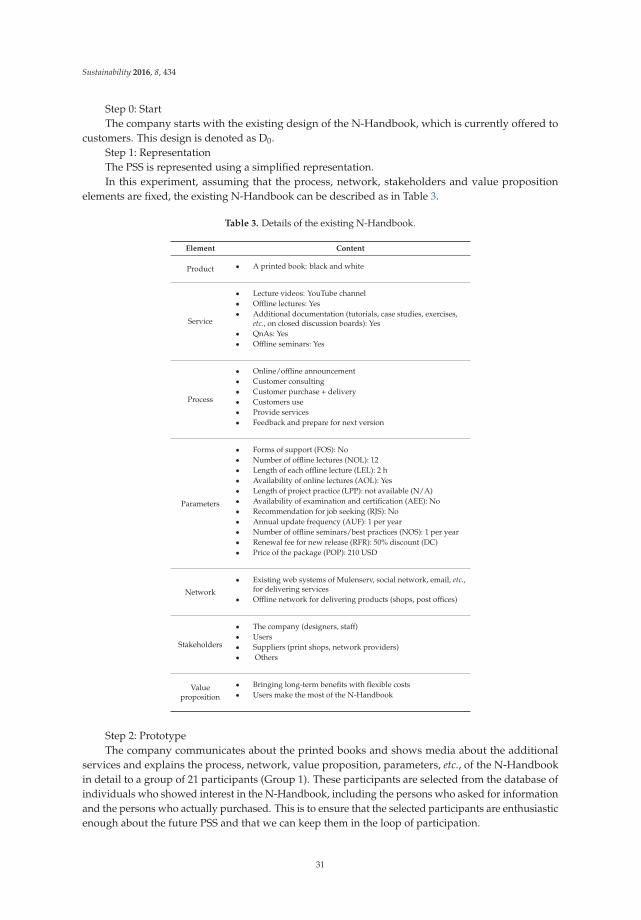
Sustainability 2016, 8, 434
Step 0: StartThe company starts with the existing design of the N-Handbook, which is currently offered to
customers. This design is denoted as D0.Step 1: RepresentationThe PSS is represented using a simplified representation.In this experiment, assuming that the process, network, stakeholders and value proposition
elements are fixed, the existing N-Handbook can be described as in Table 3.
Table 3. Details of the existing N-Handbook.
Element Content
Product ‚ A printed book: black and white
Service
‚ Lecture videos: YouTube channel‚ Offline lectures: Yes‚ Additional documentation (tutorials, case studies, exercises,
etc., on closed discussion boards): Yes‚ QnAs: Yes‚ Offline seminars: Yes
Process
‚ Online/offline announcement‚ Customer consulting‚ Customer purchase + delivery‚ Customers use‚ Provide services‚ Feedback and prepare for next version
Parameters
‚ Forms of support (FOS): No‚ Number of offline lectures (NOL): 12‚ Length of each offline lecture (LEL): 2 h‚ Availability of online lectures (AOL): Yes‚ Length of project practice (LPP): not available (N/A)‚ Availability of examination and certification (AEE): No‚ Recommendation for job seeking (RJS): No‚ Annual update frequency (AUF): 1 per year‚ Number of offline seminars/best practices (NOS): 1 per year‚ Renewal fee for new release (RFR): 50% discount (DC)‚ Price of the package (POP): 210 USD
Network
‚ Existing web systems of Mulenserv, social network, email, etc.,for delivering services
‚ Offline network for delivering products (shops, post offices)
Stakeholders
‚ The company (designers, staff)‚ Users‚ Suppliers (print shops, network providers)‚ Others
Valueproposition
‚ Bringing long-term benefits with flexible costs‚ Users make the most of the N-Handbook
Step 2: PrototypeThe company communicates about the printed books and shows media about the additional
services and explains the process, network, value proposition, parameters, etc., of the N-Handbookin detail to a group of 21 participants (Group 1). These participants are selected from the database ofindividuals who showed interest in the N-Handbook, including the persons who asked for informationand the persons who actually purchased. This is to ensure that the selected participants are enthusiasticenough about the future PSS and that we can keep them in the loop of participation.
31
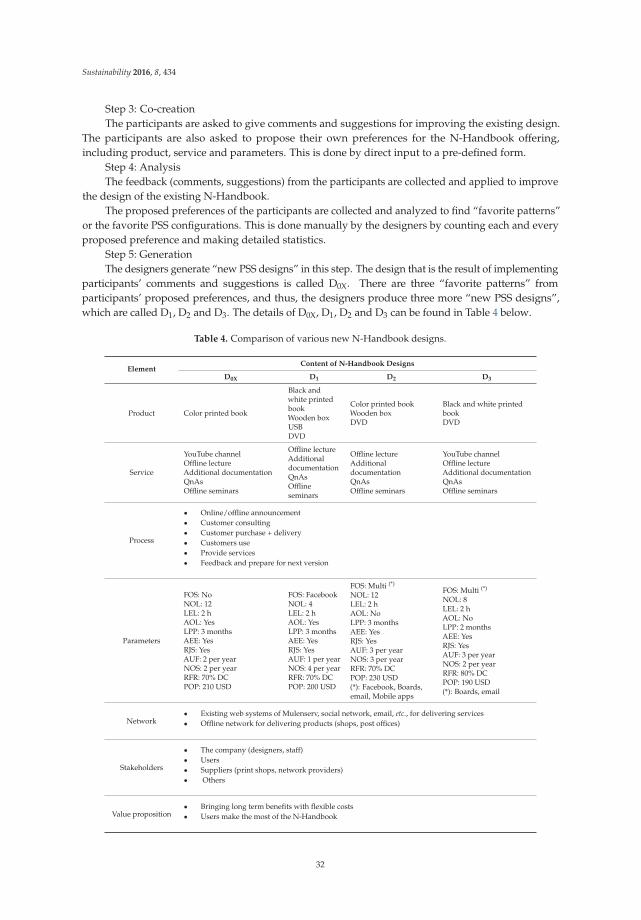
Sustainability 2016, 8, 434
Step 3: Co-creationThe participants are asked to give comments and suggestions for improving the existing design.
The participants are also asked to propose their own preferences for the N-Handbook offering,including product, service and parameters. This is done by direct input to a pre-defined form.
Step 4: AnalysisThe feedback (comments, suggestions) from the participants are collected and applied to improve
the design of the existing N-Handbook.The proposed preferences of the participants are collected and analyzed to find “favorite patterns”
or the favorite PSS configurations. This is done manually by the designers by counting each and everyproposed preference and making detailed statistics.
Step 5: GenerationThe designers generate “new PSS designs” in this step. The design that is the result of implementing
participants’ comments and suggestions is called D0X. There are three “favorite patterns” fromparticipants’ proposed preferences, and thus, the designers produce three more “new PSS designs”,which are called D1, D2 and D3. The details of D0X, D1, D2 and D3 can be found in Table 4 below.
Table 4. Comparison of various new N-Handbook designs.
ElementContent of N-Handbook Designs
D0X D1 D2 D3
Product Color printed book
Black andwhite printedbookWooden boxUSBDVD
Color printed bookWooden boxDVD
Black and white printedbookDVD
Service
YouTube channelOffline lectureAdditional documentationQnAsOffline seminars
Offline lectureAdditionaldocumentationQnAsOfflineseminars
Offline lectureAdditionaldocumentationQnAsOffline seminars
YouTube channelOffline lectureAdditional documentationQnAsOffline seminars
Process
‚ Online/offline announcement‚ Customer consulting‚ Customer purchase + delivery‚ Customers use‚ Provide services‚ Feedback and prepare for next version
Parameters
FOS: NoNOL: 12LEL: 2 hAOL: YesLPP: 3 monthsAEE: YesRJS: YesAUF: 2 per yearNOS: 2 per yearRFR: 70% DCPOP: 210 USD
FOS: FacebookNOL: 4LEL: 2 hAOL: YesLPP: 3 monthsAEE: YesRJS: YesAUF: 1 per yearNOS: 4 per yearRFR: 70% DCPOP: 200 USD
FOS: Multi (*)
NOL: 12LEL: 2 hAOL: NoLPP: 3 monthsAEE: YesRJS: YesAUF: 3 per yearNOS: 3 per yearRFR: 70% DCPOP: 230 USD(*): Facebook, Boards,email, Mobile apps
FOS: Multi (*)
NOL: 8LEL: 2 hAOL: NoLPP: 2 monthsAEE: YesRJS: YesAUF: 3 per yearNOS: 2 per yearRFR: 80% DCPOP: 190 USD(*): Boards, email
Network‚ Existing web systems of Mulenserv, social network, email, etc., for delivering services‚ Offline network for delivering products (shops, post offices)
Stakeholders
‚ The company (designers, staff)‚ Users‚ Suppliers (print shops, network providers)‚ Others
Value proposition‚ Bringing long term benefits with flexible costs‚ Users make the most of the N-Handbook
32
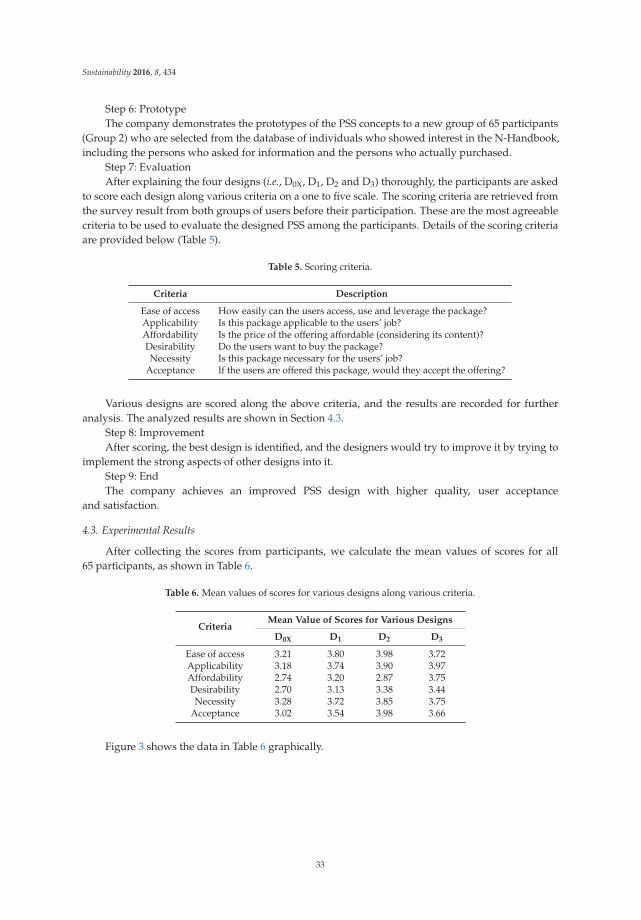
Sustainability 2016, 8, 434
Step 6: PrototypeThe company demonstrates the prototypes of the PSS concepts to a new group of 65 participants
(Group 2) who are selected from the database of individuals who showed interest in the N-Handbook,including the persons who asked for information and the persons who actually purchased.
Step 7: EvaluationAfter explaining the four designs (i.e., D0X, D1, D2 and D3) thoroughly, the participants are asked
to score each design along various criteria on a one to five scale. The scoring criteria are retrieved fromthe survey result from both groups of users before their participation. These are the most agreeablecriteria to be used to evaluate the designed PSS among the participants. Details of the scoring criteriaare provided below (Table 5).
Table 5. Scoring criteria.
Criteria Description
Ease of access How easily can the users access, use and leverage the package?Applicability Is this package applicable to the users’ job?Affordability Is the price of the offering affordable (considering its content)?Desirability Do the users want to buy the package?Necessity Is this package necessary for the users’ job?
Acceptance If the users are offered this package, would they accept the offering?
Various designs are scored along the above criteria, and the results are recorded for furtheranalysis. The analyzed results are shown in Section 4.3.
Step 8: ImprovementAfter scoring, the best design is identified, and the designers would try to improve it by trying to
implement the strong aspects of other designs into it.Step 9: EndThe company achieves an improved PSS design with higher quality, user acceptance
and satisfaction.
4.3. Experimental Results
After collecting the scores from participants, we calculate the mean values of scores for all65 participants, as shown in Table 6.
Table 6. Mean values of scores for various designs along various criteria.
CriteriaMean Value of Scores for Various Designs
D0X D1 D2 D3
Ease of access 3.21 3.80 3.98 3.72Applicability 3.18 3.74 3.90 3.97Affordability 2.74 3.20 2.87 3.75Desirability 2.70 3.13 3.38 3.44Necessity 3.28 3.72 3.85 3.75
Acceptance 3.02 3.54 3.98 3.66
Figure 3 shows the data in Table 6 graphically.
33
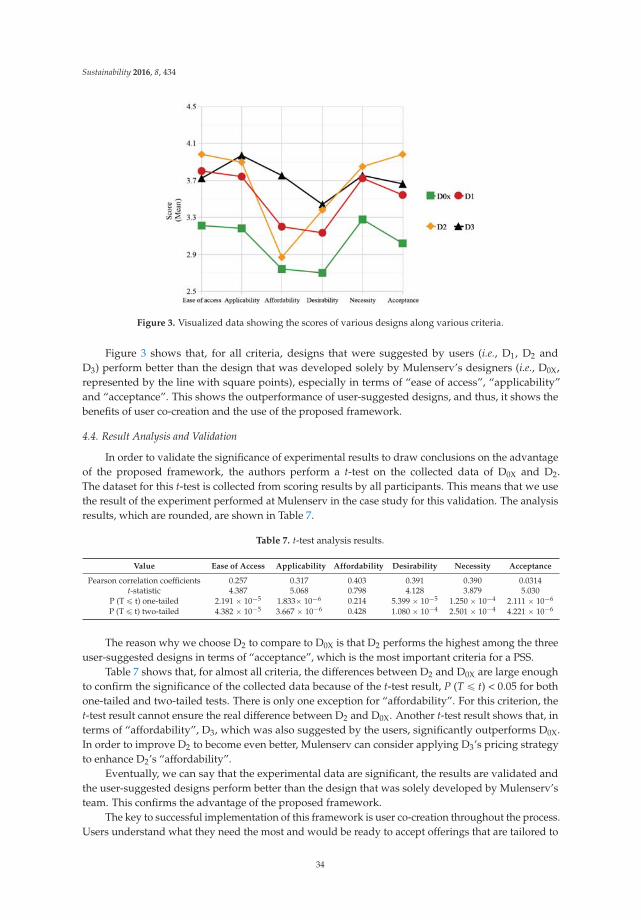
Sustainability 2016, 8, 434
Figure 3. Visualized data showing the scores of various designs along various criteria.
Figure 3 shows that, for all criteria, designs that were suggested by users (i.e., D1, D2 andD3) perform better than the design that was developed solely by Mulenserv’s designers (i.e., D0X,represented by the line with square points), especially in terms of “ease of access”, “applicability”and “acceptance”. This shows the outperformance of user-suggested designs, and thus, it shows thebenefits of user co-creation and the use of the proposed framework.
4.4. Result Analysis and Validation
In order to validate the significance of experimental results to draw conclusions on the advantageof the proposed framework, the authors perform a t-test on the collected data of D0X and D2.The dataset for this t-test is collected from scoring results by all participants. This means that we usethe result of the experiment performed at Mulenserv in the case study for this validation. The analysisresults, which are rounded, are shown in Table 7.
Table 7. t-test analysis results.
Value Ease of Access Applicability Affordability Desirability Necessity Acceptance
Pearson correlation coefficients 0.257 0.317 0.403 0.391 0.390 0.0314t-statistic 4.387 5.068 0.798 4.128 3.879 5.030
P (T ď t) one-tailed 2.191 ˆ 10´5 1.833ˆ 10´6 0.214 5.399 ˆ 10´5 1.250 ˆ 10´4 2.111 ˆ 10´6
P (T ď t) two-tailed 4.382 ˆ 10´5 3.667 ˆ 10´6 0.428 1.080 ˆ 10´4 2.501 ˆ 10´4 4.221 ˆ 10´6
The reason why we choose D2 to compare to D0X is that D2 performs the highest among the threeuser-suggested designs in terms of “acceptance”, which is the most important criteria for a PSS.
Table 7 shows that, for almost all criteria, the differences between D2 and D0X are large enoughto confirm the significance of the collected data because of the t-test result, P (T ď t) < 0.05 for bothone-tailed and two-tailed tests. There is only one exception for “affordability”. For this criterion, thet-test result cannot ensure the real difference between D2 and D0X. Another t-test result shows that, interms of “affordability”, D3, which was also suggested by the users, significantly outperforms D0X.In order to improve D2 to become even better, Mulenserv can consider applying D3’s pricing strategyto enhance D2’s “affordability”.
Eventually, we can say that the experimental data are significant, the results are validated andthe user-suggested designs perform better than the design that was solely developed by Mulenserv’steam. This confirms the advantage of the proposed framework.
The key to successful implementation of this framework is user co-creation throughout the process.Users understand what they need the most and would be ready to accept offerings that are tailored to
34
Sustainability 2016, 8, 434
their needs. Two other important factors are the simplification of PSS configurations using elementsand the demonstration of PSS prototypes so that the users can experience and understand the PSSbefore co-creation. The proposed framework is structured regarding all of those factors.
There are several issues when adopting the design process of conventional NPD (new productdevelopment) to the PSS context. In NPD, the company designs and develops products according to therequirements that were retrieved from customer needs and the results of competitive benchmarking.In some cases, the communication of customer needs to the design team is not done properly, and thatleads to ineffective products. When being applied to PSS design, where user emotion, behavior andpreferences are highly significant, conventional NPD processes may not work properly. These cases ofdesigning PSS need a new approach, such as our proposed framework. On the other hand, if the designrequires technical skills, such as engineering, drafting, manufacturing, etc., the co-creation task maybecome difficult for users to participate in, and the model may not be applied effectively. In summary,the proposed framework can effectively deal with the designing of user-sensitive components, such asconsumer PSS in a B2C environment (not industrial PSS in a B2B environment).
After proposing the framework and conducting the experiment, we gained more insights andexperience of how users are actually involved in a co-creative design process. To gain the expectedresult for implementation, several guidelines can be found below:
‚ Prepare the scenario of implementing the framework in the case, and communicate necessaryactivities during the process to all design team members.
‚ Prototypes of PSS are very important. The prototypes help users to fully understand how thePSS works, allowing them to experience it so that they can generate and evaluate the PSS in acorrect way.
‚ Representing of the PSS is also important. PSS representation needs to be simple, but thoroughenough to cover all possible PSS elements and parameters. This allows users to co-create effectivelyin terms of quantity and quality.
‚ Selection of the right participants is essential. Since the participation to co-create in this process istime consuming and requires plenty of effort, only users who are enthusiastic enough can ensureeffective participation.
4.5. Managerial Implications
As shown by the validation of the experimental data, proper implementation of the proposedframework can lead to better performance of the PSS. This suggests that the concept of co-creation anduser involvement can be implemented to bring innovation and breakthroughs to PSS development.The proposed framework can also be used to estimate the response of potential users (buyers) to the“to be launched” PSS. Companies can customize the proposed framework for their specific PSS designprojects while keeping the basic principles: the right users; simple representation; thorough prototypes;easy input forms; and comprehensive evaluation.
In the case study of this paper, we use an on-site participatory design for invited users. Othermethods of involving users can also be used, such as crowdsourcing. In this case, we can use a websitewhere we upload a call for participation, demonstrations of the PSS, guidelines for each and every step,etc. This is another option for PSS projects. As suggested in the “Tasks” column of each step (Table 1),companies can choose various tools to perform tasks in the process of the proposed framework.
5. Conclusions
In this work, the authors propose a co-creative framework for redesigning a PSS. For the firsttime, a framework for user co-creation in PSS design has been proposed, detailed and evaluated withexperimental implementation.
Our work provides a practical guideline for developers in designing and redesigning PSS.It enhances the value perception, evaluation and design quality of PSS. The experimental
35
Sustainability 2016, 8, 434
implementation with the case study and the analysis of the experimental results shows that theproposed framework is valid.
The proposed framework can effectively deal with the designing of user-sensitive components,such as consumer PSS in a B2C environment. In cases that requires a high level of technical skills andknowledge or cases with complicated service processes, such as industrial PSS (in a B2B environment),this framework might not work effectively.
Whether PSS can lead to achieving sustainability depends on how the technical design and thebusiness model are developed to address sustainable development criteria. One limitation of this workis that, due to its focus, there is a lack of such consideration. Therefore, this work cannot claim thepossibility of achieving sustainability through PSS. In our following work, where the focus is moreappropriate, we would consider this issue as a separate research topic.
Furthermore, for future work, in order to prove the advantages of the proposed framework, acomparison between its implementation results and those of other existing methods will be carriedout. Furthermore, an architecture of a computer program (or a mobile application) that employs thisframework as the backbone can be developed. This program can assist design teams to design PSScollaboratively within their own team and with innovative customers.
Acknowledgments: This research was supported by the Basic Research Program through the National ResearchFoundation of Korea (NRF) funded by the Ministry of Education (No. 2013R1A1A2013649).
Author Contributions: Tuananh Tran conceived of, designed and performed the experiments; Joon Young Parkproposed and Tuananh Tran performed the analysis of the experimental data. Tuananh Tran wrote the initialmanuscript. Joon Young Park corrected and revised the final writing.
Conflicts of Interest: There is no conflict of interest for this work.
References
1. Weber, C.; Steinbach, M.; Botta, C.; Deubel, T. Modeling of product–Service systems (PSS) based on the PDDapproach. In Proceedings of the International Design Conference, Dubrovnik, Croatia, 18–21 May 2004;pp. 547–554.
2. Aurich, J.C.; Mannweiler, C.; Schweitzer, E. How to design and offer service successfully. CIRP J. Manuf.Sci. Technol. 2010, 2, 136–143. [CrossRef]
3. Bettencourt, L.A.; Ulwick, A.W. The customer—Centered innovation map. Harv. Bus. Rev. 2008, 5, 109–114.4. Sakao, T.; Birkhofer, H.; Panshef, V.; Dorsam, E. An effective and efficient method to design services:
Empirical study for services by an investment machine manufacturer. Int. J. Internet Manuf. Serv. 2009, 2,95–110. [CrossRef]
5. Beuren, F.H.; Ferreira, M.G.G.; Miguel, P.A.C. Product-service systems: A literature review on integratedproducts and services. J. Clean. Prod. 2013, 47, 222–231. [CrossRef]
6. Vasantha, G.V.A.; Roy, R.; Lelah, A.; Brissaud, D. A review of product-service systems design methodologies.J. Eng. Des. 2012, 23, 635–659. [CrossRef]
7. Goedkoop, M.J.; van Halen, C.J.G.; te Riele, H.R.M.; Rommens, P.J.M. Product Service Systems, Ecologicaland Economic Basis. Report to Ministry of Housing, Spatial Planning and the Environment CommunicationsDirectorate, The Hague, The Netherlands. 1999. Available online: http://docplayer.net/334668-Product-service-systems-ecological-and-economic-basics.html (accessed on 29 April 2016).
8. Mont, O.K. Clarifying the concept of product-service system. J. Clean. Prod. 2002, 10, 237–245. [CrossRef]9. Lim, C.H.; Kim, K.J.; Hong, Y.S.; Park, K.T. PSS Board: A structured tool for product-service system process
visualization. J. Clean. Prod. 2012, 37, 42–55. [CrossRef]10. Hussain, R.; Lockett, H.; Vasantha, G.V.A. A framework to inform PSS conceptual design by using
system–in–use data. Comput. Ind. 2012, 63, 319–327. [CrossRef]11. Baines, T.S.; Lightfoot, H.; Steve, E.; Neely, A.; Greenough, R.; Peppard, J.; Roy, R.; Shehab, E.; Braganza, A.;
Tiwari, A.; et al. State-of-the-art in product service systems. Proc. Inst. Mech. Eng. Part B 2007, 221, 1543–1552.[CrossRef]
12. Morelli, N. The design of product/service systems from a designer’s perspective. Common Ground (Lond.)2002, 18, 3–17.
36
Sustainability 2016, 8, 434
13. Tukker, A. Eight types of product-service system: Eight ways to sustainability? Experiences from SusProNet.Bus. Strategy Environ 2004, 13, 246–260. [CrossRef]
14. Vezzoli, C.; Ceschin, F.; Diehl, J.C.; Kohtala, C. New design challenges to widely implement ‘SustainableProduct–Service Systems’. J. Clean. Prod. 2015, 97, 1–12. [CrossRef]
15. Qu, M.; Yu, S.; Chen, D.; Chu, J.; Tian, B. State-of-the-art of design, evaluation, and operation methodologiesin product service systems. Comput. Ind. 2016, 77, 1–14. [CrossRef]
16. Luiten, H.; Knot, M.; van der Host, T. Sustainable product service systems: The kathalys method.In Proceedings of the 2nd International Symposium on Environmentally Conscious Design and InverseManufacturing, Tokyo, Japan, 11–15 December 2001; pp. 190–197.
17. Manzini, E.; Vezolli, C. A strategic design approach to develop sustainable product service systems: Examplestaken from the “environmental friendly innovation” Italian prize. J. Clean. Prod. 2003, 11, 851–857. [CrossRef]
18. Pezzotta, G.; Pirola, F.; Pinto, R.; Akasaka, F.; Shimomura, Y. A Service Engineering framework to designand assess an integrated product-service. Mechatronics 2015, 31, 169–179. [CrossRef]
19. Morelli, N. Developing new product service systems (PSS): Methodologies and operational tools.J. Clean. Prod. 2006, 14, 1495–1501. [CrossRef]
20. Kowalkowski, C.; Kindström, D. Value visualization strategies for PSS Development. In Introduction toProduct/Service-System Design; Sakao, T., Lindahl, M., Eds.; Springer: London, UK, 2009; pp. 159–182.
21. Sakao, T.; Shimomura, Y. Service Engineering: A Novel Engineering Discipline for Producers to IncreaseValue Combining Service and Product. J. Clean. Prod. 2007, 15, 590–604. [CrossRef]
22. Kim, Y.S.; Wang, E.; Lee, S.W.; Choi, Y.C. A Product-Service System Representation and Its Applicationin a Concept Design Scenario. In Proceedings of the 1st CIRP Industrial Product Service Systems (IPS2)Conference, Cranfield University, England, UK, 1–2 April 2009; pp. 32–39.
23. Maussang, N.; Zwolinski, P.; Brissaud, D. Product-service system design methodology: From the PSSarchitecture design to the products specifications. J. Eng. Des. 2009, 20, 349–366. [CrossRef]
24. Tan, A.R.; Matzen, D.; McAloone, T.; Evans, S. Strategies for Designing and Developing Services forManufacturing Firms. CIRP J. Manuf. Sci. Technol. 2010, 3, 90–97. [CrossRef]
25. Bertoni, A.; Bertoni, M.; Isaksson, O. Communicating the Value of PSS Design Alternatives usingColor-Coded CAD Models. In Proceedings of the 3rd CIRP International Conference on Industrial ProductService Systems, Braunschweig, Germany, 5–6 May 2011.
26. Steen, M.; Manschot, M.; De Koning, N. Benefits of co-design in service design projects. Int. J. Des. 2011, 5,53–60.
27. Shih, L.H.; Hu, A.H.; Lin, S.L.; Chen, J.L.; Tu, J.C. ; Kuo T.C. An Integrated Approach for Product ServiceSystem Development: II. Evaluation Phase. J. Environ. Eng. Manag. 2009, 19, 343–356.
28. Yoon, B.; Kim, S.; Rhee, J. An evaluation method for designing a new product-service system.Expert Syst. Appl. 2012, 39, 3100–3108. [CrossRef]
29. Exner, K.; Lindow, K.; Buchholz, C.; Stark, R. Validation of Product-Service Systems-A Prototyping Approach.Procedia CIRP 2014, 16, 68–73. [CrossRef]
30. Komoto, H.; Tomiyama, T. Design of Competitive Maintenance Service for Durable and Capital Goods usingLife Cycle Simulation. Int. J. Autom. Technol. 2009, 3, 63–70.
31. Dorst, K. The core of ‘design thinking’ and its application. Des. Stud. 2011, 32, 521–532. [CrossRef]32. Kleemann, F. Un(der)paid Innovators: The Commercial Utilization of Consumer Work through
Crowdsourcing Science. Technol. Innov. Stud. 2008, 4, 5–26.33. Tran, T.; Park, J.Y. Crowd Participation Pattern in the Phases of a Product Development Process that Utilizes
Crowdsourcing. Ind. Eng. Manag. Syst. 2012, 11, 266–275. [CrossRef]
© 2016 by the authors. Licensee MDPI, Basel, Switzerland. This article is an open accessarticle distributed under the terms and conditions of the Creative Commons Attribution(CC BY) license (http://creativecommons.org/licenses/by/4.0/).
37
sustainability
Article
Research on Business Models in their Life Cycle
Adam Jabłonski * and Marek Jabłonski *
Department of Management, University of Dabrowa Górnicza (Wyzsza Szkoła Biznesu w Dabrowie Górniczej),Zygmunta Cieplaka Str. 1c, 41-300 Dabrowa Górnicza, Poland* Correspondence: [email protected] (A.J.); [email protected] (M.J.);
Tel.: +48-60-6364-500 (A.J.); +48-60-4538-566 (M.J.)
Academic Editor: Marc A. RosenReceived: 18 January 2016; Accepted: 27 April 2016; Published: 30 April 2016
Abstract: The paper presents the results of theoretical discussions and research findings in the fieldof designing sustainable business models that support the creation of value at various stages of thebusiness life cycle. The paper presents selected findings of extensive research into the business modelsof Polish companies listed on the Warsaw Stock Exchange. Companies which are at various stages ofdevelopment should build and adapt their business models in order to maintain the ability to createvalue for stakeholders. Characteristics of business models at the early stages of development aredifferent than at mature stages. The paper highlights the differences in business models in the contextof the life cycle of companies and sustainability criteria. The paper presents research findings whichshow that the company’s development can be seen from the point of view of the business model.Research on business models concentrated on identifying the key attributes and the configurationof the business models appropriate for the early stage of development as well as the maturity stage.It was found that the business models of companies at an early stage of the development of companieslisted on the Warsaw Stock Exchange are oriented primarily to how the company shapes, delivers,and captures value from the market in order to generate profits for shareholders and increase thevalue of the company, while the business models of mature companies include the intentions ofmanagement used to balance objectives with respect to different groups of stakeholders, and tocarefully formulate and implement business objectives with particular attention paid to preservingthe sustainability of the business. The assessment of business models from the point of view of the lifecycle proves that managers change their approach to configuring business models over time; at somepoint, they include management intentions aimed at a broader range of goals than merely generatingprofits. At the early stage, it is important to adapt the business model to the ability to create valuefor shareholders by actively searching for the optimal configuration of the business model. Here acomponent approach to making rapid changes in the structure of the business model is essential.The business model of mature companies is based on assumptions ensuring the long-term viability ofthe business and is holistic in nature. When the company moves from the stage of early developmentto the maturity stage, business models change in such a way that the assumptions of the Triple BottomLine concept become increasingly important, as expressed in the joint implementation of CorporateSocial Responsibility and Value-Based Management assumptions. At the early stage of development,the business model strengthens the need to create value for shareholders and is not as dependent onstrong partnerships with a large number of stakeholders. At the maturity stage, it is important tobalance the objectives of all stakeholders and to build long-term relationships with them. As regardsrelationships with the environment, business models at these two stages are different. The paperpresents research on the business models of companies at their early stage of development as well asmature companies, taking into consideration the assumptions of the Sustainable Business Model.
Keywords: business model; company value; capital market; balance; a sustainable business model; lifecycle of a business model; early stage of company development; maturity stage of company development
Sustainability 2016, 8, 430; doi:10.3390/su8050430 www.mdpi.com/journal/sustainability38
Sustainability 2016, 8, 430
1. Introduction
Conducting business in the conditions of the economic crisis has given rise to a new perspectiveon the decision-making processes taking place in companies. Companies' ability to manage businesscontinuity, including their abilities related to strategic revival or restructuring, is acquiring specialsignificance which should contribute to ensuring the continued creation of company value. This isimportant in that the management mechanisms of the capital market are significantly influenced bychanges in the macro-environment occurring at the same time, forces of sectoral determinants andinternal decision-making processes in companies. One of the key strategic factors affecting theseprocesses is to have the appropriate competencies related to company life cycle management usingefficient business models. These models, which define and take advantage of the company’s potentialto compete, shape the image of the company in the market and are a source of competitive advantagewhich the company has and renews cyclically. It should be noted that, as [1] (p. 174) writes, a businessmodel concept is based on economic sciences and paradigms related to conducting business. This insightallows a researcher to expand the scope of research into issues related to the active conduct of modernbusiness. The authors hypothesize that the achievement of success by a company and its ability tobuild company value over a long period of time depends on having an efficient business model ineach period of business activity using sustainability criteria. This model should be appropriate for thepresent market conditions and should allow the company to adjust to ever-changing needs by managingits configuration in such a way that the interfaces between its components provide a platform for thedynamic development and growth of the company at each stage of its operation.
The purpose of the paper is to present the research findings and discussions in the field ofdesigning business models that contribute to the creation of value at various stages of the business lifecycle, and indicates that a business model at the maturity stage of development has the characteristicsof sustainability. The paper presents selected theoretical aspects and the findings of extensive researchinto the business models of companies listed on the Warsaw Stock Exchange, as published in works byM. Jabłonski [2] and A. Jabłonski [3]. The studies described in these publications have been selectivelychosen for the purpose of this paper, as well as combined and interpreted in such a way as to coverall the stages of a company’s life cycle. The same applies to studies and analyses and how theytake into account the business models of both companies at the early stage of development andmature companies. Based on the data, the paper presents reflections on and analyses of businessmodels in the life cycle in the context of business model development which fulfills the objectivesof the sustainability concept. The managers of companies at the early stage of development focustheir attention on designing, delivering scalability and dynamically adjusting the business modelused. Conversely, in mature companies they significantly expand the understanding of the businessmodel, adding management intentions to its attributes, based on balancing the interests of differentgroups of stakeholders and the coherent and coordinated use of assumptions of the Value-BasedManagement and Corporate Social Responsibility concepts, leading to the creation of the SustainableBusiness Model. Business models examined by means of the criterion of the life cycle change dueto the growing needs of stakeholders over time. As these needs and expectations are the greatest inthe case of mature companies, it is therefore justifiable to create a category of a business model basedon sustainability. The methodological objectives of the paper are based on the theory of a systemsapproach by L. von Bertalanffy [4], K.E. Boulding [5], R.L. Ackoff [6] and the approach of ResourceBased View, Rumelt [7], E. T. Penrose [8], J. Barney [9–11], R. Amit, P., M. A. Peteraf [12], B. Wernerfelt1984 [13], M. J. Dollinger [14], C. K. Prahalad and G. Hamel [15] (p. 81). The systems approach andresource-based view are suitable for the assessment of business models and company management interms of the life cycle, as they take into account the pooling of resources in a relatively firm and unifiedwhole. The business model is a system consisting of the fitting configuration of resources appropriatefor a given situation.
This paper is structured as follows. After discussing the sustainability concept as a new wayof understanding business sustainability (Section 2), business models are discussed in terms of the
39
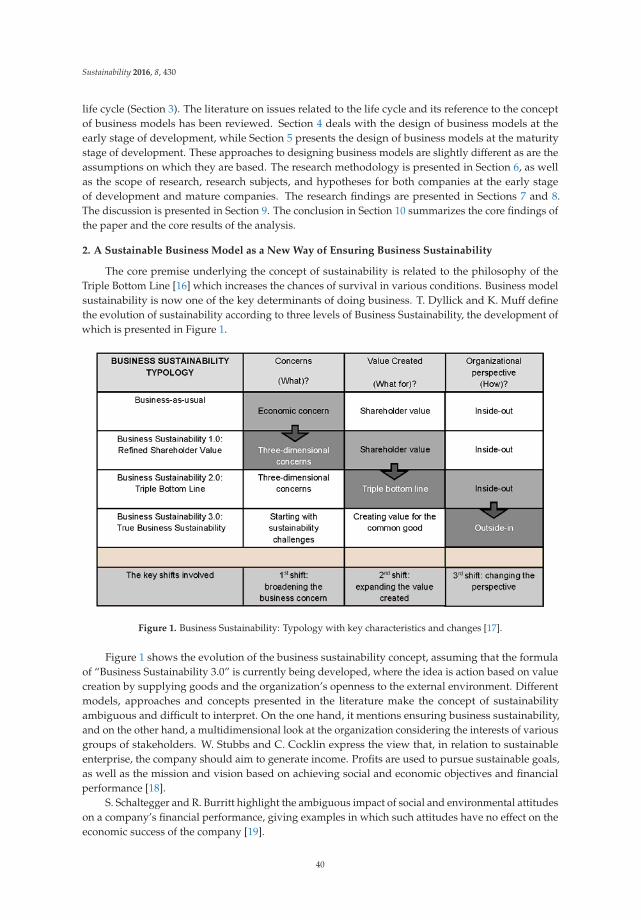
Sustainability 2016, 8, 430
life cycle (Section 3). The literature on issues related to the life cycle and its reference to the conceptof business models has been reviewed. Section 4 deals with the design of business models at theearly stage of development, while Section 5 presents the design of business models at the maturitystage of development. These approaches to designing business models are slightly different as are theassumptions on which they are based. The research methodology is presented in Section 6, as wellas the scope of research, research subjects, and hypotheses for both companies at the early stageof development and mature companies. The research findings are presented in Sections 7 and 8.The discussion is presented in Section 9. The conclusion in Section 10 summarizes the core findings ofthe paper and the core results of the analysis.
2. A Sustainable Business Model as a New Way of Ensuring Business Sustainability
The core premise underlying the concept of sustainability is related to the philosophy of theTriple Bottom Line [16] which increases the chances of survival in various conditions. Business modelsustainability is now one of the key determinants of doing business. T. Dyllick and K. Muff definethe evolution of sustainability according to three levels of Business Sustainability, the development ofwhich is presented in Figure 1.
Figure 1. Business Sustainability: Typology with key characteristics and changes [17].
Figure 1 shows the evolution of the business sustainability concept, assuming that the formulaof “Business Sustainability 3.0” is currently being developed, where the idea is action based on valuecreation by supplying goods and the organization’s openness to the external environment. Differentmodels, approaches and concepts presented in the literature make the concept of sustainabilityambiguous and difficult to interpret. On the one hand, it mentions ensuring business sustainability,and on the other hand, a multidimensional look at the organization considering the interests of variousgroups of stakeholders. W. Stubbs and C. Cocklin express the view that, in relation to sustainableenterprise, the company should aim to generate income. Profits are used to pursue sustainable goals,as well as the mission and vision based on achieving social and economic objectives and financialperformance [18].
S. Schaltegger and R. Burritt highlight the ambiguous impact of social and environmental attitudeson a company’s financial performance, giving examples in which such attitudes have no effect on theeconomic success of the company [19].
40
Sustainability 2016, 8, 430
T. Dyllick and K. Hockerts present a model based on the concept of corporate sustainability(balancing and integrating the company’s activities) mapped in the form of a triangle. In the threecorners of the triangle the focus is, respectively, on the business case, natural case and societal case [20].W. McDonough and M. Braungart present the model of corporate sustainability in the form of a fractaltriangle with ecology-ecology, equity-equity and economy-economy in its corners [21].
F. Boons and F. Lüdeke-Freund focus on linking the sustainability concept with innovation.In their opinion, the sustained success of an organization depends on innovation. Rules determiningthe functioning of a sustainable business model should be based on creating technological innovationthat can create new markets after being commercialized [22].
The relationship between the concept of CSR (Corporate Social Responsibility) and financialmanagement is highlighted by Archie B. Carroll and Kareem M. Shabana, who believe thatgenerally, based on the review of practical business examples, CSR has a positive effect on companyperformance [23].
S. Schaltegger and R. Burritt show that applying the principles of corporate social responsibilityand sustainability management uses the same assumptions, based on the integration of social, economicand environmental aspects [24].
Frank Boons, Carlos Montalvo, Jaco Quist, Marcus Wagner believe that sustainable businessmodels should be supported by government agencies through appropriate policies. Companiesand government should work together to create innovations implemented in sustainable businessmodels [25].
A business case for sustainability according to S. Schaltegger, F. Lüdeke-Freund and E.G. Hansenis the interpretation which indicates that the key aspect differentiating classic business solutionsbetween cases based on sustainability is a primary objective and incorporating smart solutions basedon environmental and social factors affecting the economic success of the company into the businessmodel [26]. J.G. York defines three conditions that guide the investors when they invest in sustainablebusiness, namely the required increase in ROIC (Return on Invested Capital), the minimum value of theWACC (Weighted Average Cost of Capital) and an increase in the availability of capital. This approachis cost-effective and usable for startups [27].
S. Schaltegger, E. Hansen, and F. Lüdeke-Freund define a business model for sustainability asone which helps in describing, analyzing, managing, and communicating (i) a company’s sustainablevalue proposition to its customers, and all other stakeholders; (ii) how it creates and delivers thisvalue; (iii) and how it captures economic value while maintaining or regenerating natural, social, andeconomic capital beyond its organizational boundaries [28].
Nikolay Dentchev, Rupert Baumgartner, Hans Dieleman, Lara Johannsdottir, Jan Jonker,Timo Nyberg, Romana Rauter, Michele Rosano, Yulia Snihur, Xingfu Tang, and Bart van Hoof solicitinputs on the variety of organizational settings which support the implementation of sustainablebusiness models.
– Do organizational and legal structures matter for the development of sustainable business models?If so, how does that help or hinder utilization of the new models?
– What are the drivers for profit-dominated organizations to engage in implementing sustainablebusiness models?
– How does intrapreneurship impact the implementation of sustainable business modelsin multinationals?
– What is the role of the service sector in implementing sustainable business models, in addition tomanufacturing or other types of industries?
– Are there conflicts of co-existence among multinational companies which are using sustainableand conventional business models?
– What are the dynamics of sustainable business model implementation in non-profit organizationsand government-controlled organizations [29]?
41
Sustainability 2016, 8, 430
N.M.P. Bocken, S.W. Short, P. Rana, and S. Evans believe that business model innovations forsustainability stand out from other concepts due to the fact that innovations based on reducing theadverse effects on the environment make it possible to effectively capture value from the market andincrease the economic value of the company. At the same time, the product offer also changes [30].
Each approach indicates how interdisciplinary a sustainable business model concept is and howmany interpretations it has. It is interesting to examine a sustainable business model from the point ofview of the life cycle.
3. The Life Cycle of Business Models
The relevant literature proposes various definitions of business models. This concept is interpretedfrom different points of view. For example, according to R. Amit and C. Zott, “A business modeldescribes the structure of transaction governance designed in such a way that value is created and allbusiness opportunities are taken advantage of” [31] (p. 511).
The definition by R. Casadesus-Masanell and J.E. Ricart is based on identifying business logic inthe context of creating value for stakeholders [32] (p. 196).
As far as preserving the continuity of the business in the long term is concerned, the definitionof the business model was presented by B. Demil and X. Lecocq, who say that “a business modeldefines how the organization operates to ensure its stability” [33] (p. 231). An interesting definitionhas been presented by B. Mahadevan, who says that a business model is the unique configurationof three streams, namely a stream associated with customer service and cooperation with partners,a revenue stream, and a logistical stream [34] (p. 59).
D.J. Teece bases his definition on converting payments into profits [1] (p. 173).An approach to business models based on the concept of innovation is presented by
H. Chesbrough, who claims, based on joint works with R. Rosenbloom, that it is crucial for a businessmodel to rely on assumptions resulting from presenting a value proposition, identifying marketsegments, designing the structure of the value chain, looking at the means of generating revenue,evaluating the cost structure, as well as describing the company’s position in the value network.All this must be supported by an adequate competitive strategy [35] (p. 355).
E. Fielt highlights the description of business operation logic in terms of capturing value from themarket [36] (pp. 91–92).
There are many definitions and approaches to business models and there is still no consensuson a universal definition. They are examined in terms of the essence of their definition, the useand the configuration of components. The proposed definition of the business model concept isinterdisciplinary in its nature. They prove the broad extent to which the definitions of business modelsare examined in relation to many areas and perspectives. Some authors focus their attention on thestrategic character of delivering value to a customer, others on the results such as profit, and still otherson social aspects. The definitions presented emphasize other factors that distinguish them from oneanother. Undoubtedly, however, all of them focus on the logic of doing business, and thus on theassumptions on which the company has based its business. The distinct characteristics of variousapproaches to the issue discussed result from showing other features which can ensure the company’ssuccess. Life cycle is an important issue in terms of examining business models.
The issue of a company’s life cycle is generally widely recognized in the literature. Authors whohave contributed to the development of this issue include Chandler (1962) [37], Patton (1959) [38],Levitt (1965) [39], Cox (1967) [40], Churchill and Lewis (1983), Greiner (1972) [41,42], Hofer (1975) [43],Scott and Bruce (1987) [44], Quinn and Cameron (1983) [45], and Parnell and Carraher (2003) [46].According to Levitt (1965) and Cox (1967), different strategies are adopted at different stages of theproduct life cycle. Thietart and Vivas (1984) [47] argue that strategies depend not only on the stage ofthe life cycle, but are affected by the company’s strategic logic. In addition, the success of the strategyseems to be dependent on the sector and characteristics of the external environment.
42
Sustainability 2016, 8, 430
In terms of the examination of the life cycle of companies in the context of the organization, fromthe point of view of business models, a cognitive gap can be observed in this area. To date, the issueof the life cycle of companies in terms of business model attributes and increasing the value of thecompany has not been widely discussed. The business model as an ontological being may also beexamined from the point of view of the life cycle.
The authors highlight the research gap in existing studies, e.g., on strategic factors andinterrelations, and derive their research questions. There is a significant research gap in managementsciences in the scope of business models in the context of the life cycle, particularly in relation to thecompanies listed on the stock exchange applying the principles of sustainability.
As regards research into the life cycle of business models, D.R.A. Schallmo and L. Brecht show therelationship between the length of the life cycle and the application of corporate social responsibilityprinciples, which, in a sense, is linked with the concept of sustainability. The authors suggest that theapplication of corporate social responsibility principles contributes to business model sustainability.These principles lengthen the life cycle of the business model [48].
Further research was done by M. de Reuver, H. Bouwman and I. MacInnes, who examinedwhich types of external factors are most important from the point of view of the business model lifecycle. They argue that, on the basis of 45 case studies from various sectors of the economy, the mostimportant drivers of business model dynamics are technological factors. This is particularly importantin the case of startups, where technological attributes should be supported by market needs, while forlarge companies this relationship is less important. External factors must be taken into account whendesigning the business model in various stages of development but also when modifying it [49].
As far as the business model at an early stage of development is concerned, some characteristicscan be observed. A business model at an early stage of its development is shaped in the context ofapplying the effective configuration of components that constitute it, and which are conducive to thecreation of value. A business model should be supported by the attributes related to the quality ofthe management team. This is particularly important as regards the quality of the management ofcompanies at an early stage of their development. B. M. Martins Rodríguez [50] (p. 129) identifies aneed to separate two key areas, namely the business model and the characteristics related to the topmanagement team. A startup can succeed only if managers have high competencies and operationalcapabilities in terms of creating value.
A business model goes through the distinct stages of the idea, development and commercialization.Its shape is different from what it will be in the future, when, in order to maintain continuity of business,a company will need to use different methods and management concepts appropriate to the levelof organizational development. The companies that are at an early stage of development and theirbusiness models should be geared to survival. However, the planning horizon in these companies isshorter due to a number of uncertainties. Young companies focus mainly on finding a viable, scalableand effective business model, which will allow the company to capture market value. Changes in suchmodels as regards the company’s configuration can happen very quickly—companies modify theirbusiness models throughout the life cycle. Survival is a goal for both young and mature companies, atwhich point stakeholders will play a greater role, expecting the distribution of the value produced.The final form of the business model will be based on balancing various areas of activity in the formof constructive comparison, which may be referred to as a sustainable business model. The conceptof sustainability is understood as durability; sustainability is a relatively new concept not yet fullyexplored. W. M. Grudzewski, I.K. Hejduk, A. Sankowska, and M. Wantuchowicz define sustainabilityas the company’s ability to continuously learn, adapt and develop, revitalize, reconstruct and reorientto maintain a lasting and distinctive position in the market by offering buyers above-average valuetoday and in the future (consistent with the paradigm of innovative growth) through organic variationconstituting business models, and arising from the creation of new opportunities, objectives andresponses to them, while balancing the interests of different groups [51] (p. 27). C. Kidd believes thatthe concept of sustainability derives from a broader look at this issue, in relation to balancing the
43
Sustainability 2016, 8, 430
influence of various political, social and scientific groups in time [52]. This means that there is a closecorrelation between the stability of the business and sustainable stakeholder relationship management.G. Svenson, G. Wood, and M. Callaghan also argue that a fundamental aspect of sustainability occurswhen company expectations and ideas of the market and society affect the prevailing opinions of whatcan and cannot be done in sustainable business practice. In turn, stakeholders and their expectationshelp to answer this question [53] (p. 338). Relationships with stakeholders determine the shape andnature of the principles of sustainability in business. An interesting sustainable business model basedon an original SMART concept (sustainability modeling and reporting system) has been developed byM. Daud Ahmed and D. Sundaram [54] (pp. 611–624). In this model, they defined the sustainabilityroadmap (sustainable business transformation roadmap) in which the key elements consist of design,transformation, monitoring and control, discovery, science and strategy. M. Yunus, B. Moingeon, andL. Lehmann-Ortega define the concept of a social business model, which can also be a sustainablebusiness model, and have developed the foundations of building a social business model consistingof two areas also common to innovative models and areas specific to social models. They showsimilarities with conventional and innovative business models which include:
– the challenges of conventional knowledge and basic assumptions,– the discovery of complementary business partners,– undertakings in improving process experiments.
As regards the specific assumptions relevant to social business models, they show features such as:
– Encouraging social orientation in terms of profit for shareholders,– Clear, specific objectives for profit for society.
The approaches presented show the essence of the sustainability concept and direct its attentionto the continuous ability of the company to remain in the market when the condition of this goal is tohave an effective business model at every stage of the life cycle. It should be largely oriented to socialobjectives without losing the features of a company focused on generating profit. The time taken fromthe stage of business model development to the achievement of a state characterized by features of asustainable business model will depend on the particular character of the company, the sector which itoperates in, and market volatility. Based on observations of the phenomena occurring in the economy,it can be said that this time grows ever shorter. The ability to understand the cycle designed in such away allows managers to quickly detect weaknesses in the business model and adjust its configurationto ensure the constant ability to create value, at the beginning mostly only for shareholders, and lateralso for other stakeholders by adapting it to the expected value. It is possible that, at the initial stage ofcompany development, a business model that has the features of a sustainable business model is built.However, it rarely happens in a free market economy. In its initial stage of development, the companyfocuses primarily on investing and multiplying profits for further expansion and development. At alater stage of development, the company can share what was gained in previous years. Figure 2 showsthe change in the business model in the life cycle of the company. A business model at an early stageof development will be characterized by features other than a business model in its maturity stage ofdevelopment. To ensure their usefulness and verify their effectiveness, different management methodsand techniques will be used.
44
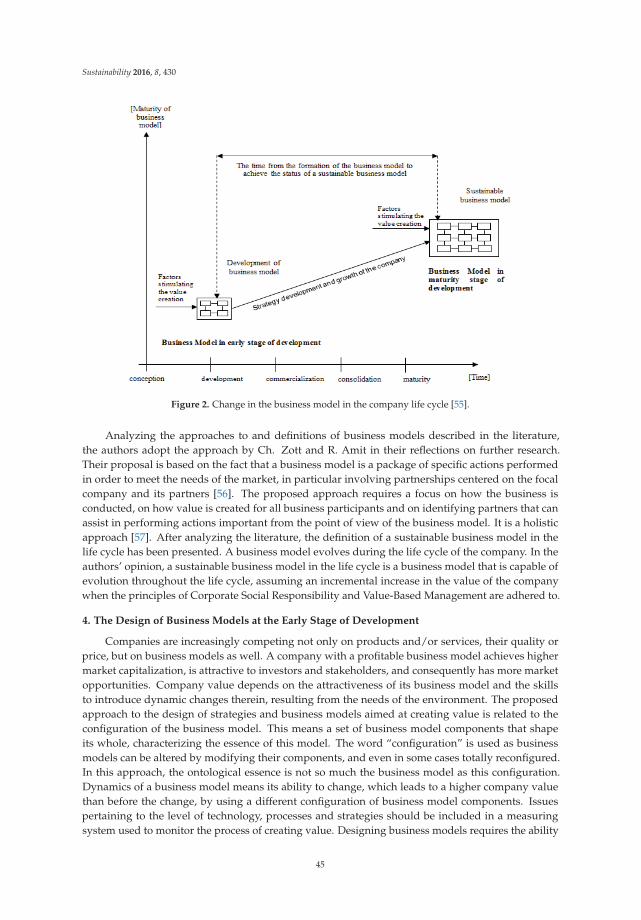
Sustainability 2016, 8, 430
Figure 2. Change in the business model in the company life cycle [55].
Analyzing the approaches to and definitions of business models described in the literature,the authors adopt the approach by Ch. Zott and R. Amit in their reflections on further research.Their proposal is based on the fact that a business model is a package of specific actions performedin order to meet the needs of the market, in particular involving partnerships centered on the focalcompany and its partners [56]. The proposed approach requires a focus on how the business isconducted, on how value is created for all business participants and on identifying partners that canassist in performing actions important from the point of view of the business model. It is a holisticapproach [57]. After analyzing the literature, the definition of a sustainable business model in thelife cycle has been presented. A business model evolves during the life cycle of the company. In theauthors’ opinion, a sustainable business model in the life cycle is a business model that is capable ofevolution throughout the life cycle, assuming an incremental increase in the value of the companywhen the principles of Corporate Social Responsibility and Value-Based Management are adhered to.
4. The Design of Business Models at the Early Stage of Development
Companies are increasingly competing not only on products and/or services, their quality orprice, but on business models as well. A company with a profitable business model achieves highermarket capitalization, is attractive to investors and stakeholders, and consequently has more marketopportunities. Company value depends on the attractiveness of its business model and the skillsto introduce dynamic changes therein, resulting from the needs of the environment. The proposedapproach to the design of strategies and business models aimed at creating value is related to theconfiguration of the business model. This means a set of business model components that shapeits whole, characterizing the essence of this model. The word “configuration” is used as businessmodels can be altered by modifying their components, and even in some cases totally reconfigured.In this approach, the ontological essence is not so much the business model as this configuration.Dynamics of a business model means its ability to change, which leads to a higher company valuethan before the change, by using a different configuration of business model components. Issuespertaining to the level of technology, processes and strategies should be included in a measuringsystem used to monitor the process of creating value. Designing business models requires the ability
45
Sustainability 2016, 8, 430
to respond to any signals forecasting changes in the external and internal environment of the company;managers not taking them into consideration in the decision-making process can lead to economiclosses. The business model constantly reacts to corporate strategy. The concept of strategy geometrydeveloped by R.W. Keidal fulfills these expectations, making a clear distinction between elements ofthe complexity of formulating strategies in the context of the factors that influence them [58] (p. 6).Changing the business model can be natural (resulting from the company’s flexibility in adapting tochanges in its environment—a company changes when the business environment changes) or forced.Forced changes are often restructuring in their nature [59] (p. 36). This approach to managementprocesses requires the implementation of a results-oriented organizational culture. Therefore, in theprocess of modifying business models quickly, it is essential to implement the concept of StrategicPerformance Management. The assumptions of the concept have been presented by A. de Waal, whosays that this is a process that requires company managers to regularly verify the mission, strategy andgoals. As a result, these goals are measurable using key success factors and performance indicators tomaintain the determined direction of the company’s operations [60] (p. 19).
A dynamic aspect of business models exposes processes and value chains, but it also significantlyaffects the shape of organizational structures. The proposed approach should serve to quickly movefrom one model to another using a different business model configuration. One of the assumptions isconsidering business models from the perspective of seeking an effective configuration of the companystrategic structure to identify such components of the business model that are crucial in the process ofthe creation of company value. Treating the concepts of business models, especially in the area of theirconfiguration, jointly with the concept of value creation appears to be an important subject today, butone which is not fully recognized as yet, especially in the area of companies classified as innovative.
5. Design of Business Models at the Maturity Stage of Development
The dynamically changing global economy in the era of the intensive development of globalizationcreates new needs, both in theoretical management models as well as in practical discussions relatedto the perception of business. This is particularly important in the current economic and moral crisis,the effects of which are visible in most developed countries. It is important to find and/or use theexisting management paradigms, the examination and codification of which will provide a platformfor the development and growth of companies. By observing and analyzing business trends and thebehavior of companies for the past few years, it can be concluded that many business orientationsand concepts, whose roots and method of evaluation are often radically different, lead to similarbusiness results. This has happened to the concepts of Value-Based Management, Corporate SocialResponsibility, Shareholders, Stakeholders as well as Sustainable Business, and was significantlyinfluenced by the globalized nature of world economies, which resulted in the creation of values onthe basis of which corporate business models were built. The strategic behavior of companies andtheir intercultural exchange led to the creation of new sources and platforms for building competitiveadvantage, and consequently a stable source for building long-term value. The principles of sustainabledevelopment are increasingly appreciated, including in the United States. Transferred to the microlevel in terms of the competitiveness of the company, its strategy and by following the principles ofcorporate social responsibility amid the global economic crisis, they resulted in the creation of a newmanagement concept, namely Sustainability. This can be regarded as Sustainable Development aimingto simultaneously adhere to the principles of ethics, ecology and economy, and may also be understoodas the ability of the company to manage quickly and flexibly, focusing on objectives and enablingthe implementation of the company mission and vision, taking into account the establishment ofcompetitive advantage on the market. This can be achieved by creating new products and/or servicesand implementing modern management methods and concepts, the source of which is scientificresearch and solutions to business practices. Sustainable business is business conducted when conceptsof value-based management and corporate social responsibility are used in a systemic way, providingvalue for company stakeholders.
46
Sustainability 2016, 8, 430
Sustainable business at all levels of management, which includes all of the factors and functionstherein, ensures business continuity as well as the power to create value in the long term, andenables a sustainable dividend payout to shareholders and the generation of a social dividend toother stakeholders of the company. The combination of these factors and functions will result in thesearch for the most optimal business solutions. This can be done through the mutual, constructivecomparison of resources and factors influencing the ability to increase company value. Therefore, themost important factor is to find such a balance that will ensure business continuity in the market, whileachieving business results which guarantee the long-term value of the company. The balance ensuringthe implementation of the sustainable business concept may result from building a sustainable businessmodel connected with the principles of VBM (Value Based Management), CSR and the concepts ofStakeholders, Shareholders and Sustainable Business. This may lead to the continuity of the businessin the volatile conditions of the market environment.
Therefore, considering the theoretical and practical dimensions of the above issues, it is importantto answer the question, which as yet has not been fully answered in the literature: Which strategicfactors and their interrelations in the adopted business models have the greatest impact on thelong-term building of a socially responsible company? What should the design of such a businessmodel be?
A premise which says that the subject is important, difficult and requires extended research andscientific discussions is that companies want to build long-term value, to operate successfully in themarket, to ensure the continuity of the business, to renew (reconstruct, adapt) their business models,and finally to win. However, they are constantly looking for the optimal ways and mechanismsallowing them to do it effectively and efficiently. At the same time, signals from the market, economicimpulses, the economic crisis, chaos in the market, public disappointment with the place and role ofcompanies in the economy, and examples of business collapses all hinder the selection of the mostappropriate way to manage companies.
Moving away from certain management concepts, changes in values, the occurrence of the rapidflow of not only capital but also information and knowledge and access thereto, changes in perceivingthe nature of the business, and its place in the global ecosystem also resulted in a new dimension inusing the strength of management sciences in global business.
According to the authors, new dimensions of business are responsible management, sustainablemanagement, socially acceptable management and efficient and effective management. Such an effectcan be obtained by applying sustainability principles in a socially responsible manner.
A socially responsible company is a company whose business model, in increasing its value, isbuilt on the basis of strategic factors associated with corporate social responsibility and the principlesof value-based management, while determining wise organizational behavior in the company, andwise market behavior towards company stakeholders, which are based on the principles of integrity,ethics and professionalism.
Strategic factors related to corporate social responsibility and value-based management arethe factors associated with the functioning and behavior of the organization towards the externaland internal environment, where an appropriate combination leads to sustainable value in terms oflong-term operation on the market.
As a consequence of this approach, a holistic sustainable business model is created, reducedin its nature, becoming a platform for creating long-term, sustainable value for a sociallyresponsible company.
A company that is responsible, to a limited extent, is a company that applies the principlesof corporate social responsibility only sometimes, when it is clearly profitable. It adheres to theseprinciples not on a voluntary basis, according to the organizational culture of the company, but in aforced way.
A socially irresponsible company is a company that—in its business activities—does not obey theprinciples of corporate social responsibility by, inter alia, failing to abide by applicable legal and other
47
Sustainability 2016, 8, 430
conditions, by organizational behaviors indicating discrimination, bullying, intimidation, and otherpathological behavior towards staff and other company stakeholders (including suppliers, co-operatorsand others) and by treating the company and company personnel only as a tool for making profit.In view of the above discussions, it can be assumed that the main components of a sustainable businessmodel built in the subject-object system are strategic factors related to:
1. A combined implementation of the concepts of corporate social responsibility andvalue-based management.
2. Balancing the potential of the company.3. Combining the stakeholder concept and the shareholder concept, which are also strongly related
to the concepts of corporate social responsibility (stakeholders) and value-based management(shareholders).
4. A sustainable dividend policy.
A holistic model of sustainable business creating company value in the long term can be built onthe basis of the following driving forces that give it the proper dynamics.
1. Strength of conscious application of corporate social responsibility principles.2. Strength of economic sustainability of the company.3. Strength of conscious application of corporate governance principles.4. Strength of stakeholder value and the dynamics of their migration processes.5. Strength of the consensual relationship: company’s board, shareholders, stakeholders.6. Strength of implementing a sustainable strategy based on the principles of a balanced scorecard.7. Strength of balancing intellectual capital of the company.8. Strength of balancing fixed assets of the company.9. Strength of balancing internal processes of the company.
10. Strength of the management style based on the logic of conscious decision-making [3] (p. 249).
6. Methodology of Research
As a research instrument, one basic method has been used, i.e., analysis of the literature concerningthe life cycle of business models from startup to mature company. The authors present the problem ofcreating the framework of business models in their life cycle. The level of sustainability depends on thestage of company development. For this purpose, the authors have used literature research, a sustainedapproach to shaping the attributes of business models, the features of companies at an early stage ofdevelopment and mature companies, as well as the principles for building a sustainable business modelat different stages of company development. The authors have adopted an interpretative approachas the methodology of scientific research, based on the literature and a systematic retrospectiveassessment of the business models of companies in the course of conducting their own business activityand during their consulting practice. As regards the companies at the early stage of development,the issue of which business model components are responsible for increasing shareholder valueto the greatest extent is also important. They should, therefore, be a driver of adjusting businessmodels, and changes aimed at building company value should focus on them. The scope of theissue presented in the paper represents an attempt to link the findings of the research in the contextof the business life cycle criterion, namely at an early stage of company development, and at thematurity stage. Therefore, if we add the two scopes of research, quantitative research was conductedon a sample of 220 companies listed on the Polish Stock Exchange in Warsaw (48 New Connectcompanies, 44 Index WIG20, WIG40, WIGdiv, Respect Index, New Connect Lead companies and128 companies taking part in the "Environmentally Friendly Company" national ecology competition).Qualitative research was conducted on a sample of 384 companies from the New Connect market and10 selected companies taking part in the “Environmentally Friendly Company” national competition.
48
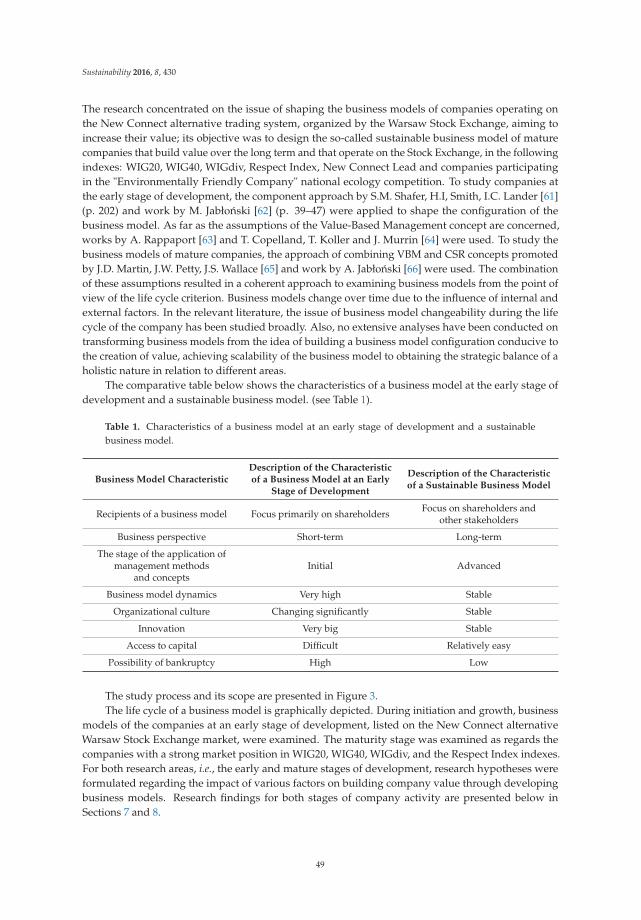
Sustainability 2016, 8, 430
The research concentrated on the issue of shaping the business models of companies operating onthe New Connect alternative trading system, organized by the Warsaw Stock Exchange, aiming toincrease their value; its objective was to design the so-called sustainable business model of maturecompanies that build value over the long term and that operate on the Stock Exchange, in the followingindexes: WIG20, WIG40, WIGdiv, Respect Index, New Connect Lead and companies participatingin the "Environmentally Friendly Company" national ecology competition. To study companies atthe early stage of development, the component approach by S.M. Shafer, H.I, Smith, I.C. Lander [61](p. 202) and work by M. Jabłonski [62] (p. 39–47) were applied to shape the configuration of thebusiness model. As far as the assumptions of the Value-Based Management concept are concerned,works by A. Rappaport [63] and T. Copelland, T. Koller and J. Murrin [64] were used. To study thebusiness models of mature companies, the approach of combining VBM and CSR concepts promotedby J.D. Martin, J.W. Petty, J.S. Wallace [65] and work by A. Jabłonski [66] were used. The combinationof these assumptions resulted in a coherent approach to examining business models from the point ofview of the life cycle criterion. Business models change over time due to the influence of internal andexternal factors. In the relevant literature, the issue of business model changeability during the lifecycle of the company has been studied broadly. Also, no extensive analyses have been conducted ontransforming business models from the idea of building a business model configuration conducive tothe creation of value, achieving scalability of the business model to obtaining the strategic balance of aholistic nature in relation to different areas.
The comparative table below shows the characteristics of a business model at the early stage ofdevelopment and a sustainable business model. (see Table 1).
Table 1. Characteristics of a business model at an early stage of development and a sustainablebusiness model.
Business Model CharacteristicDescription of the Characteristicof a Business Model at an Early
Stage of Development
Description of the Characteristicof a Sustainable Business Model
Recipients of a business model Focus primarily on shareholders Focus on shareholders andother stakeholders
Business perspective Short-term Long-term
The stage of the application ofmanagement methods
and conceptsInitial Advanced
Business model dynamics Very high Stable
Organizational culture Changing significantly Stable
Innovation Very big Stable
Access to capital Difficult Relatively easy
Possibility of bankruptcy High Low
The study process and its scope are presented in Figure 3.The life cycle of a business model is graphically depicted. During initiation and growth, business
models of the companies at an early stage of development, listed on the New Connect alternativeWarsaw Stock Exchange market, were examined. The maturity stage was examined as regards thecompanies with a strong market position in WIG20, WIG40, WIGdiv, and the Respect Index indexes.For both research areas, i.e., the early and mature stages of development, research hypotheses wereformulated regarding the impact of various factors on building company value through developingbusiness models. Research findings for both stages of company activity are presented below inSections 7 and 8.
49
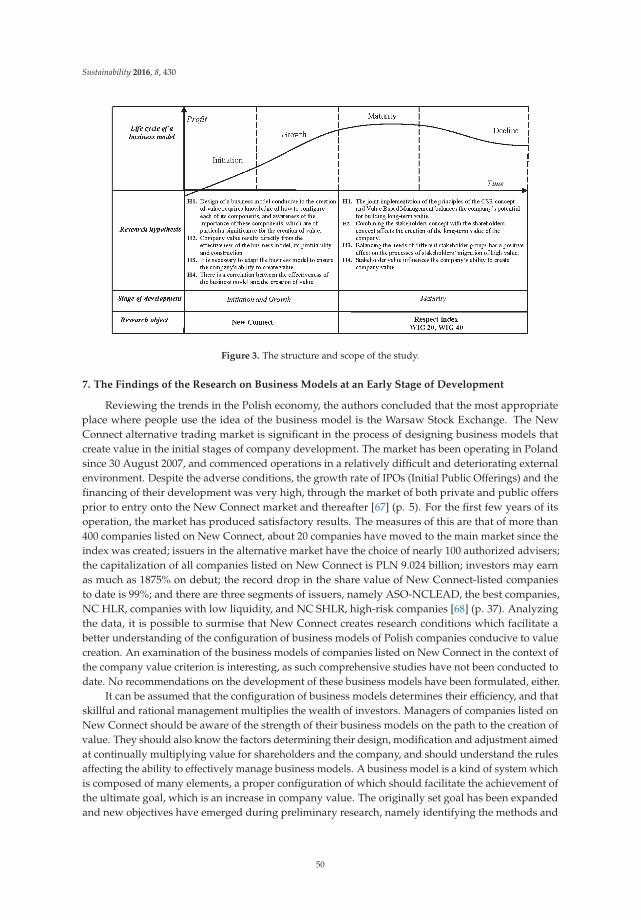
Sustainability 2016, 8, 430
Figure 3. The structure and scope of the study.
7. The Findings of the Research on Business Models at an Early Stage of Development
Reviewing the trends in the Polish economy, the authors concluded that the most appropriateplace where people use the idea of the business model is the Warsaw Stock Exchange. The NewConnect alternative trading market is significant in the process of designing business models thatcreate value in the initial stages of company development. The market has been operating in Polandsince 30 August 2007, and commenced operations in a relatively difficult and deteriorating externalenvironment. Despite the adverse conditions, the growth rate of IPOs (Initial Public Offerings) and thefinancing of their development was very high, through the market of both private and public offersprior to entry onto the New Connect market and thereafter [67] (p. 5). For the first few years of itsoperation, the market has produced satisfactory results. The measures of this are that of more than400 companies listed on New Connect, about 20 companies have moved to the main market since theindex was created; issuers in the alternative market have the choice of nearly 100 authorized advisers;the capitalization of all companies listed on New Connect is PLN 9.024 billion; investors may earnas much as 1875% on debut; the record drop in the share value of New Connect-listed companiesto date is 99%; and there are three segments of issuers, namely ASO-NCLEAD, the best companies,NC HLR, companies with low liquidity, and NC SHLR, high-risk companies [68] (p. 37). Analyzingthe data, it is possible to surmise that New Connect creates research conditions which facilitate abetter understanding of the configuration of business models of Polish companies conducive to valuecreation. An examination of the business models of companies listed on New Connect in the context ofthe company value criterion is interesting, as such comprehensive studies have not been conducted todate. No recommendations on the development of these business models have been formulated, either.
It can be assumed that the configuration of business models determines their efficiency, and thatskillful and rational management multiplies the wealth of investors. Managers of companies listed onNew Connect should be aware of the strength of their business models on the path to the creation ofvalue. They should also know the factors determining their design, modification and adjustment aimedat continually multiplying value for shareholders and the company, and should understand the rulesaffecting the ability to effectively manage business models. A business model is a kind of system whichis composed of many elements, a proper configuration of which should facilitate the achievement ofthe ultimate goal, which is an increase in company value. The originally set goal has been expandedand new objectives have emerged during preliminary research, namely identifying the methods and
50
Sustainability 2016, 8, 430
tools used by the company in terms of monitoring the value creation process, the degree to which thecompany is results-oriented and the objective of building systems of value-based management.
The main purpose of the research was to assess the development of business models of Polishcompanies conducive to the creation of their value. In order to verify this relationship, it was necessaryto formulate the following partial hypotheses:
The research sample was companies listed on New Connect at the time of conducting theresearch (desk research: 384 companies on New Connect), quantitative research (a research sampleof 48 companies on New Connect) and qualitative research (12 companies selected from amongthe 384 companies listed on New Connect on 24 May 2012 which met the criteria of representativecompanies). Two case studies were developed. Research was conducted from November 2011 to May2012, and research triangulation was applied. In terms of desk research, 384 companies listed on NewConnect were studied. The research model adopted ensured the diversity of the research sample interms of geography and the type of business. Furthermore, it ensured diversity among the businessmodels used. Analysis was conducted based on public documents:
´ the information document from the debut on New Connect,´ financial statements,´ financial analyses carried out by brokerage houses, investment houses and banks.
The analysis included an assessment of changes in the quotations of companies on the market.The companies were evaluated on the day of their debut, after 52 weeks of the floating date (if time ofoperation on the market was less than 52 weeks, its total operating time on New Connect was takeninto account), and on the day the research was conducted. Within the framework of the quantitativeresearch, the sample was selected in such a way that the objectives could be achieved. The companiessurveyed were capital companies, mainly small- or medium-sized. Analyzing the territorial scope ofactivities of the surveyed companies, it should be noted that half of them operate on the internationalmarket, 37.5% operate on a national scale, while 12.5% only operate regionally. None of the companiesoperate only locally, which indicates the high potential and innovative character of their productoffer. Therefore, the products and services they offer find both a national and international audience.As part of the qualitative analysis of business models, companies that achieved a positive return atthe end of 2011 were selected (their rate of return at the end of the period was positive); moreover,the degree to which they fulfilled forecasts specified in the information document was not less than90%. This criterion was adopted in order to select, out of all companies listed on New Connect, thosecompanies that were the best in terms of the scope of value creation for investors and, at the same time,which demonstrated their effectiveness compared to their forecasts. A representative sample obtainedin this way was used to prepare business models that were favorable to value creation. At the end of2011, 338 companies in total were listed on the New Connect alternative market. During the periodfrom 1 January 2011 to 31 December 2011, only 64 entities achieved a positive return at the end of theperiod. These companies accounted for only 18.9% of all listed companies. An additional criterionused in the analysis was the price-to-earnings (P/E) ratio and the price-to-book value (P/BV) ratio.The criterion for accepting companies for the research project was the requirement of positive valuesfor both ratios. This additional criterion was fulfilled by 36 companies, accounting for 10.6% of alllisted companies at the end of 2011. In particular, the assessment of indicators of the degree to whichthe net profit assumed in financial forecasts had been achieved was adopted. The indicators werecompared with the annual updated rates of return. It was also assumed that the company should havebeen listed on New Connect for not less than six months—which means that its debut on New Connectwas before 1 June 2011. In the original version of the concept of qualitative research on businessmodels, it was assumed that the company should have been listed not less than 12 months prior (i.e.,its debut was before 1 January 2011). However, after preparing a sample meeting the proposed criteria,it turned out that only 14 companies fulfilled the criteria. It was agreed that this number was too smallto conduct research reliably. Therefore, a decision was taken to accept companies with a shorter period
51
Sustainability 2016, 8, 430
of operation on New Connect. Presence on New Connect, which is characterized by very dynamicchanges, for a period of six months, and maintaining investor confidence during this time (expressedin a positive rate of return), can provide a platform for formulating reliable conclusions in terms ofthe business model configuration, conducive to the process of company value creation. Out of all thecompanies listed on New Connect, 32 companies (accounting for 9.5% of all the listed companies atthe end of 2011) fulfilled all the criteria to be accepted for analysis.
When the percentage share of these companies on New Connect at the end of 2011 was comparedto the percentage share of companies examined in the NC Index (NewConnect Index), the total shareof 32 companies in the NC Index was obtained, which amounted to 16.9%. The value of the percentageshare in the NC Index was almost twice the percentage share in total. This means that the capitalizationof New Connect companies meeting the criteria was above average. A total of 12 companies wereselected for the qualitative analysis of business models, which accounts for 3.1% of all the companieslisted on New Connect at the end of 2011. In order to assess the accuracy of the research sampling, thepercentage share of those companies on the New Connect market at the end of 2011 was compared tothe percentage share of the NC Index companies. In this way, the quantitative share was comparedwith the capitalization of companies. The total share of these 12 companies in the NC Index was6.05%, and the value of the percentage share in the NC Index was almost twice the percentage shareof the total. This means that the capitalization of New Connect companies meeting the criteria wasabove average. Being aware of the limitations resulting from the number of companies approved, theywere accepted in terms of conducting the research. All 12 companies selected for qualitative researchmet the criterion of the degree of at least 90% net profit achieved when compared to that assumed inthe financial forecasts (the level of 90% was established based on accepting 10% divergence from theexpected result). Two examples were selected for the case study analysis: in the first one, an increasein company value was observed and the business model was not changed, and in the second, financialforecasts were not fulfilled and the business model had to be modified (strong pressure from investorsand the Warsaw Stock Exchange Board), which resulted in the company changing its configurationand a significant increase in the share price.
There is no doubt that the business model of a company at an early stage of development ischaracterized by attributes other than a mature business model. Every company goes through differentstages of development, which may change due to the specific nature of the business models. The stagesmay be as follows: conception, development, commercialization, consolidation, and maturity. At theinitial stage of company operation are conception, development and commercialization. A businessmodel should be designed in such a way that, at the expected stage of achievements, a uniquecombination of resources focuses on the value chain. It is also favorable to take an appropriate positionin the value network in order to capture value. Moving from one priority to another in order tocreate value characterizes the dynamics of the business model. Managers’ knowledge of the businessmodel structure and ability to adapt it skillfully develops the ability to create value [2] (pp. 411–412).The configuration of the business model at the initial stage of company development is based on thebasic attributes and is supported with management methods and techniques focused on the concept ofproject management. The simplicity of the business model should be its strength as, when combinedwith a unique configuration of attributes, it can lead to a company gaining competitive advantage,which can thus create value for shareholders. The research and analysis conducted allowed us toprove the main hypothesis: Company value is created by shaping the configuration of the businessmodel components. All the hypotheses presented in Figure 3 are true. Figure 4 shows the results ofresearch on shaping the business models conducive to the creation of value for companies in the earlystages of development (companies listed on New Connect). The numerical values indicate the strengthof the correlation between different components and value creation (or destruction). The proposedconfiguration of the business model components shown in Figure 3 is the result of extensive literatureresearch related to identifying individual components constituting the structure for describing a businessmodel. The final number of components is a result of the reduction of the components that, based
52
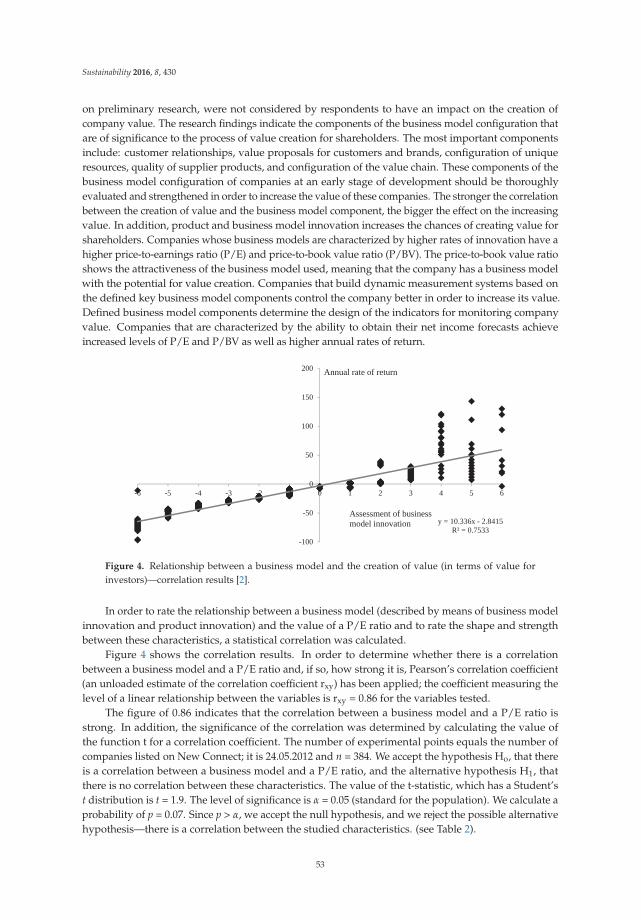
Sustainability 2016, 8, 430
on preliminary research, were not considered by respondents to have an impact on the creation ofcompany value. The research findings indicate the components of the business model configuration thatare of significance to the process of value creation for shareholders. The most important componentsinclude: customer relationships, value proposals for customers and brands, configuration of uniqueresources, quality of supplier products, and configuration of the value chain. These components of thebusiness model configuration of companies at an early stage of development should be thoroughlyevaluated and strengthened in order to increase the value of these companies. The stronger the correlationbetween the creation of value and the business model component, the bigger the effect on the increasingvalue. In addition, product and business model innovation increases the chances of creating value forshareholders. Companies whose business models are characterized by higher rates of innovation have ahigher price-to-earnings ratio (P/E) and price-to-book value ratio (P/BV). The price-to-book value ratioshows the attractiveness of the business model used, meaning that the company has a business modelwith the potential for value creation. Companies that build dynamic measurement systems based onthe defined key business model components control the company better in order to increase its value.Defined business model components determine the design of the indicators for monitoring companyvalue. Companies that are characterized by the ability to obtain their net income forecasts achieveincreased levels of P/E and P/BV as well as higher annual rates of return.
y = 10.336x - 2.8415R² = 0.7533
-100
-50
0
50
100
150
200
-6 -5 -4 -3 -2 -1 0 1 2 3 4 5 6
Annual rate of return
Assessment of business model innovation
Figure 4. Relationship between a business model and the creation of value (in terms of value forinvestors)—correlation results [2].
In order to rate the relationship between a business model (described by means of business modelinnovation and product innovation) and the value of a P/E ratio and to rate the shape and strengthbetween these characteristics, a statistical correlation was calculated.
Figure 4 shows the correlation results. In order to determine whether there is a correlationbetween a business model and a P/E ratio and, if so, how strong it is, Pearson’s correlation coefficient(an unloaded estimate of the correlation coefficient rxy) has been applied; the coefficient measuring thelevel of a linear relationship between the variables is rxy = 0.86 for the variables tested.
The figure of 0.86 indicates that the correlation between a business model and a P/E ratio isstrong. In addition, the significance of the correlation was determined by calculating the value ofthe function t for a correlation coefficient. The number of experimental points equals the number ofcompanies listed on New Connect; it is 24.05.2012 and n = 384. We accept the hypothesis Ho, that thereis a correlation between a business model and a P/E ratio, and the alternative hypothesis H1, thatthere is no correlation between these characteristics. The value of the t-statistic, which has a Student’st distribution is t = 1.9. The level of significance is α = 0.05 (standard for the population). We calculate aprobability of p = 0.07. Since p > α, we accept the null hypothesis, and we reject the possible alternativehypothesis—there is a correlation between the studied characteristics. (see Table 2).
53
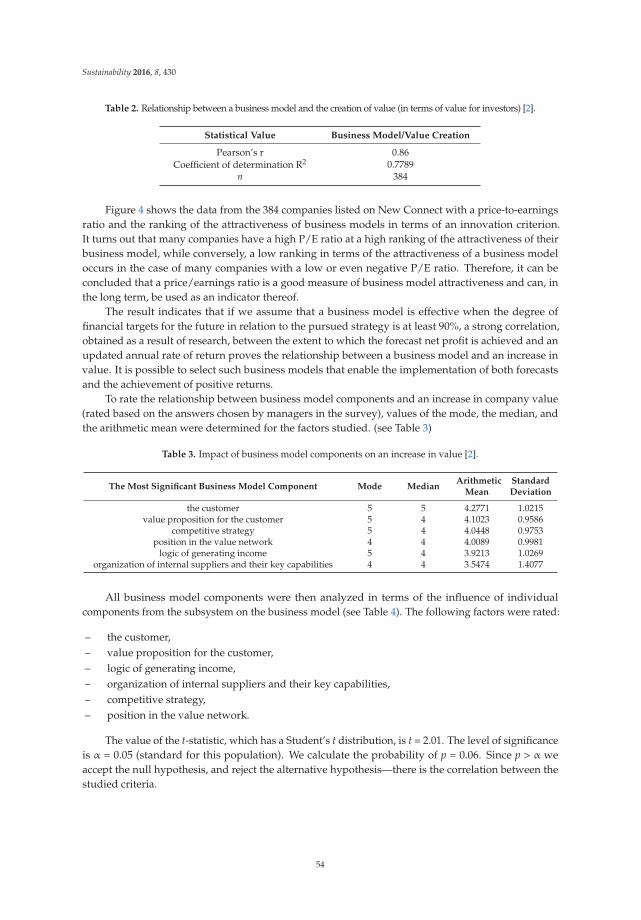
Sustainability 2016, 8, 430
Table 2. Relationship between a business model and the creation of value (in terms of value for investors) [2].
Statistical Value Business Model/Value Creation
Pearson’s r 0.86Coefficient of determination R2 0.7789
n 384
Figure 4 shows the data from the 384 companies listed on New Connect with a price-to-earningsratio and the ranking of the attractiveness of business models in terms of an innovation criterion.It turns out that many companies have a high P/E ratio at a high ranking of the attractiveness of theirbusiness model, while conversely, a low ranking in terms of the attractiveness of a business modeloccurs in the case of many companies with a low or even negative P/E ratio. Therefore, it can beconcluded that a price/earnings ratio is a good measure of business model attractiveness and can, inthe long term, be used as an indicator thereof.
The result indicates that if we assume that a business model is effective when the degree offinancial targets for the future in relation to the pursued strategy is at least 90%, a strong correlation,obtained as a result of research, between the extent to which the forecast net profit is achieved and anupdated annual rate of return proves the relationship between a business model and an increase invalue. It is possible to select such business models that enable the implementation of both forecastsand the achievement of positive returns.
To rate the relationship between business model components and an increase in company value(rated based on the answers chosen by managers in the survey), values of the mode, the median, andthe arithmetic mean were determined for the factors studied. (see Table 3)
Table 3. Impact of business model components on an increase in value [2].
The Most Significant Business Model Component Mode MedianArithmetic
MeanStandardDeviation
the customer 5 5 4.2771 1.0215value proposition for the customer 5 4 4.1023 0.9586
competitive strategy 5 4 4.0448 0.9753position in the value network 4 4 4.0089 0.9981
logic of generating income 5 4 3.9213 1.0269organization of internal suppliers and their key capabilities 4 4 3.5474 1.4077
All business model components were then analyzed in terms of the influence of individualcomponents from the subsystem on the business model (see Table 4). The following factors were rated:
– the customer,– value proposition for the customer,– logic of generating income,– organization of internal suppliers and their key capabilities,– competitive strategy,– position in the value network.
The value of the t-statistic, which has a Student’s t distribution, is t = 2.01. The level of significanceis α = 0.05 (standard for this population). We calculate the probability of p = 0.06. Since p > α weaccept the null hypothesis, and reject the alternative hypothesis—there is the correlation between thestudied criteria.
54
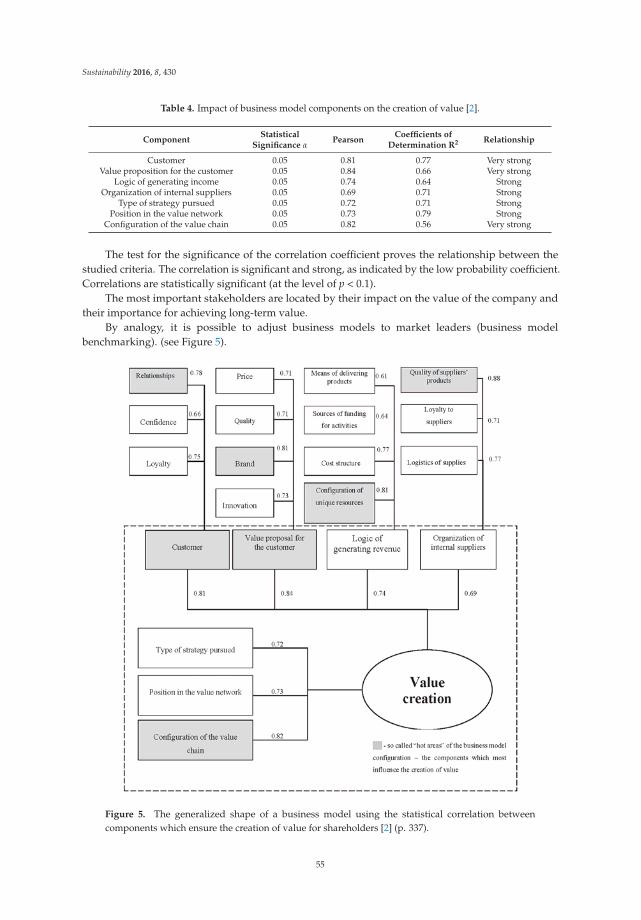
Sustainability 2016, 8, 430
Table 4. Impact of business model components on the creation of value [2].
ComponentStatistical
Significance αPearson
Coefficients ofDetermination R2 Relationship
Customer 0.05 0.81 0.77 Very strongValue proposition for the customer 0.05 0.84 0.66 Very strong
Logic of generating income 0.05 0.74 0.64 StrongOrganization of internal suppliers 0.05 0.69 0.71 Strong
Type of strategy pursued 0.05 0.72 0.71 StrongPosition in the value network 0.05 0.73 0.79 Strong
Configuration of the value chain 0.05 0.82 0.56 Very strong
The test for the significance of the correlation coefficient proves the relationship between thestudied criteria. The correlation is significant and strong, as indicated by the low probability coefficient.Correlations are statistically significant (at the level of p < 0.1).
The most important stakeholders are located by their impact on the value of the company andtheir importance for achieving long-term value.
By analogy, it is possible to adjust business models to market leaders (business modelbenchmarking). (see Figure 5).
Figure 5. The generalized shape of a business model using the statistical correlation betweencomponents which ensure the creation of value for shareholders [2] (p. 337).
55
Sustainability 2016, 8, 430
By making dynamic changes in the configuration of the business model, it is possible to adjust itto develop the ability to create value. The results have been analyzed based on this assumption.
Research and analysis conducted on business models of companies at an early stage of developmentin the context of activity on the capital market have allowed us to draw the following conclusions:
(1) Referring to the review of the relevant literature on business models and value-basedmanagement, a theoretical configuration of business models was developed. The results indicatethat a business model should be a unique form of resources focused on the value chain. It isalso favorable to take an appropriate position in the value network in order to capture value.Moving from one priority to another in order to create value characterizes the dynamics of thebusiness model. Managers’ knowledge of the business model structure and its skillful adaptationdevelops the ability to create value.
(2) Based on the research, the importance of the impact of individual components of the businessmodel on company value was determined. The results allowed us to build a business modelstructure that indicates what the optimal configuration of the efficient and effective businessmodel should be like. The main components were identified, which include the value propositionfor the customer, the customer himself and the configuration of the value chain. The keysubsystems of these components were also specified, which indicate what configuration, fromamong those proposed in the theoretical model, works best for managers, in the context of thecriterion of company value. These include: in the area of the customer, relationships; in the valueproposition for the customer, brand and innovation; in the area of revenue generation logic, theconfiguration of unique resources; in the area of organization of internal suppliers, the qualityof provided services. The model presents the link between the components and their impacton the configuration of the business model conducive to the creation of value. The structure ofa business model which is favorable to the creation of value should be consistent and shouldinclude the above-mentioned priorities. It depends highly on the configuration of the value chain.
(3) The analysis of the correlation of the degree to which the financial forecasts of net profit describedin the annual information documents are fulfilled with the updated rates of return of companieslisted on New Connect showed a high correlation coefficient at 0.79. If we assume that theefficiency of the business model is verified by the fulfillment of forecasts, the hypothesis thatthere is a relationship between the business model and the value increase can be proved. Businessmodel configuration management aims to improve its effectiveness, including the fulfillmentof expected forecasts, favors the creation of value and is verified with the values of return rates.Fulfilling forecasts, or failing to do so, significantly affects return rates.
(4) In order to assess the factors affecting the rate of company value growth, 23 factors weredetermined, of which the factors that are most important to New Connect companies include:
(a) relationships with customers,(b) a full understanding of customer needs,(c) the ability to create unique value for the customer which is not offered by competitors.
(5) Having analyzed a designed portfolio of business model innovation and product innovation,it was concluded that as many as 63% of all companies listed on New Connect are characterizedneither by an innovative business model nor by innovative products, which significantly affectsthe performance of these companies and, at the same time, their market value.
(6) Companies which were characterized by both innovative business models and innovativeproducts, recognized as models of this market, accounted for only 10% of the New Connect index.If one looks at this phenomenon positively, in the future one in 10 companies on New Connectmay, through capital gained on New Connect, build the elite class of companies changing therules of the game in the sectors in which they operate.
(7) Comparing two extreme sets (the first characterized by an innovative business model andinnovative products—only 10% of the companies surveyed; the second, characterized by an
56
Sustainability 2016, 8, 430
unimaginative business model and products—63% of companies), the result is not promising.It is necessary to verify either the potential of the business model component configuration ofthese companies, or specify stricter criteria for floating on the New Connect market, which shouldinclude elements of innovation.
(8) During further research on the issue of whether there is a relationship between the businessmodel and company value, it was concluded that there is a very strong correlation between thebusiness model evaluated according to the criteria of innovation and the price/earnings ratio, ata figure of 0.86. The correlation between the degree to which financial forecasts of net profit arefulfilled and the average updated annual rate of return is strong and stands at 0.79. The resultsobtained give a strong message to theoreticians and practitioners of management that investmentin innovation and diligent work towards fulfilling financial forecasts translate into the strongcreation of value.
(9) There is strong pressure from investors and the board of the Warsaw Stock Exchange to ensure thatthe forecasts published by the companies are reliable, as this significantly affects the modificationof business models used by these companies.
The results presented show that the principles of sustainability as regards the companies at anearly stage of development and with respect to incorporating them into the genotype of businessmodels of companies at an early stage of development are used inconsistently and only selectively.The situation is different for mature companies where sustainability is regarded as a value driver.
8. Research Findings on Business Models at the Mature Stage of Development
In conducting research on sustainable business models, the main hypothesis and 11 auxiliaryhypotheses were proposed. The main hypothesis is that: the joint realization of the concepts ofcorporate social responsibility and value-based management affects the balance of the company’spotential and how (and whether) the needs of different groups of stakeholders are fulfilled, which, as aresult, translates into an increase in the long-term value of the company.
In the research conducted, in order to prove the proposed hypotheses, the principles oftriangulation were used. The methodological triangulation applied covered three types of research:quantitative research, qualitative research and research based on the expert method.
The main objective of the research was to create a holistic sustainable business model contributingto building the long-term value of a socially responsible company. The scope of the researchcovered companies currently listed on the Warsaw Stock Exchange, on the following stock indexes:WIG20, WIG40, WIGdiv, Respect Index, New Connect Lead and companies participating in the“Environmentally Friendly Company” competition; 128 companies that adhered to the principles ofcorporate social responsibility with a strong theme of environmental responsibility participated in thefirst stage of the research, on the analysis of the results of the “Environmentally Friendly Company”ecology competition. In the second phase, survey questionnaires were sent to 100 companies listed onthe Polish Stock Market Respect Index, WIG20, WIG40, WIGdiv and NewConnect Lead. In the firstpart, the companies completed a self-assessment questionnaire and underwent a competition audit,while in the second part, research surveys (questionnaires) were sent to the companies that voluntarilyself-assessed by completing the questionnaires. The return rate was 44%, which is a satisfactory result.The research sample was selected so that it would fulfill the objectives included in the subject ofthe paper. The selection of the Respect Index companies, which included companies operating inaccordance with best practices in information governance, corporate governance, investor relationships,CSR policy, environmental management, personnel policy, and management systems, aimed to receiveanswers from companies which consciously follow the principles of corporate social responsibility.The Respect Index companies satisfy the strict requirements of corporate social responsibility, pursuecorporate responsibility strategies, or follow an orderly plan of action in terms of company socialresponsibility/sustainable development. This strategy is created based on business objectives, takinginto account the key risks (specific and industry) and results from the need to examine the needs and
57
Sustainability 2016, 8, 430
expectations of significant stakeholder groups. It is pursued on the basis of the schedule adoptedand performance measures (results, benefits). The Respect Index is an index of socially responsiblecompanies in Central and Eastern Europe, which includes companies from the main market of theWarsaw Stock Exchange in its portfolio and is one of the indicators that builds their credibility inthe eyes of investors. A key element of the business model of the Respect Index companies is anincrease in their value, taking into account the principles of corporate social responsibility and theneeds of stakeholders.
Questionnaires were also sent to the largest listed companies, that is WSE WIG20 and WIG40companies, in order to examine these companies in terms of the application of corporate socialresponsibility and value-based management principles. To fully supplement the sample so that itmet the criteria related to all hypotheses assumed, a survey questionnaire was also sent to WIGdivcompanies, which is the revenue index (dividends and subscription rights taken into account). WIGdivcomprises the largest companies with high liquidity, which regularly pay dividends to shareholders.The index also includes certain WIG20 companies. The selection of companies in the index wasdetermined by the specific character of these companies, namely that their business model is based ongenerating profit and regularly paying dividends to shareholders, and focuses on observing the rulesof so-called sustainable dividends, which are consistent with the principles of sustainable business.Due to the fact that there is an important correlation between the adopted company business modeland its stock index, companies of this index are also included in the research sample.
On the other hand, engagement in corporate social responsibility was also important in the selectionof companies. Research was also conducted on 128 companies participating in the EnvironmentallyFriendly Company ecology competition, which promoted the principles of environmental responsibilityand sustainable development by creating effective strategies built on ecological criteria.
The research was extended further with the qualitative analysis of 10 companies whose profilesmatched the companies from the area of quantitative research, i.e., Respect Index, WIG20, WIG40,WIGdiv and New Connect Lead companies. Ten joint-stock companies were selected, all of whichimplement corporate social responsibility principles in order to increase competitive advantage andbuild long-term value. At the same time, these companies, in addition to fulfilling the criteria ofecological responsibility, met the fuller and broader criteria of corporate social responsibility.
The selection of the research sample was as follows:To achieve the main objective of the study related to the achievement of the expected and assumed
state, which is developing a holistic model of sustainable business contributing to building long-termvalue of a socially responsible company, surveys as well as expert studies were conducted using anevaluation questionnaire and analytical studies of existing documents related to the Respect Index stockexchange. A research criterion for choosing research companies was developed, and the analysis wasconducted in terms of both subjective and objective criteria. As regards the subjective criterion, all formsof business activity in Polish legislation were analyzed: sole traders, partnerships, general partnerships,other partnerships, corporations (limited liability companies, joint stock companies). As far as anobjective criterion is concerned, after reviewing the literature and business practices, evaluation criteriawere defined that aim to properly select the profiles of the companies surveyed. These criteria include:company valuation (a company is subjected to valuation), the pattern of management “best practices”(it may be considered that the adopted management mechanisms, and the degree to which modernmanagement methods and concepts are used, exceed standards in the Polish economy), a minimummarket presence of 10 years (the maturity stage in business—in the author’s opinion, a minimum10-year presence in the market indicates that the company wants to continue its business activity,develop, gain competitive advantage, ensure business continuity and build the long-term value ofthe company), the principles of corporate governance are fulfilled (a company wants to operate inaccordance with the standards of corporate governance, wants to conduct direct and indirect dialoguewith shareholders through their representatives in the supervisory board of the company, wants toseek the most effective forms of communication, dialogue and relationships to achieve satisfactory
58
Sustainability 2016, 8, 430
performance), social responsibility is observed (a company which fulfills the principles of corporatesocial responsibility and includes them in the principles of doing business, wants to balance theinterests of major groups of stakeholders and wishes to observe the law, follow core values, care forthe environment, and generate profits for shareholders by building an organizational culture thathelps achieve this goal), functions in various sectors of the economy and services (companies operatein different sectors, therefore the picture of the study will have a cross-sectoral dimension and thesolutions developed during the study and the design of a business model have a chance to be appliedin various sectors of the economy and services). (see Tables 5 and 6)
Table 5. Legal form of the winners of the three previous editions of the “Environmentally FriendlyCompany” (FBS) competition from 2006–2008 [3].
Legal Form FBS 2006 FBS 2007 FBS 2008Legal Form—FBS
2006–2008
Joint-stock company 7 16 17 40Limited Liability Company 22 28 25 75
General Partnership 2 1 1 4Other 4 3 2 9Total 35 48 45 128
Table 6. Type of business activity of the winners of the three previous editions of the “EnvironmentallyFriendly Company” (FBS) competition from 2006, 2007 and 2008 [3].
Type of Activity FBS 2006 FBS 2007 FBS 2008Type of Activity—FBS
2006–2008
Production 11 13 12 36Services 14 22 21 57
Trade 1 1 2 4Production and services 5 5 6 16
Production and trade 1 2 1 4Production, services, trade 1 3 2 6
Trade and services 2 2 1 5Total 35 48 45 128
8.1. The Company’s Business Model Based on Fulfilling the Assumptions of the Concept of CorporateSocial Responsibility
Companies’ application of the assumptions of the concept of corporate social responsibility has itsown internal reference because it is based on ethical principles within the organization, that on the onehand affect decision-making systems, and on the other hand the external environment of the company,shaping its social dimension and image in the market. The conscious application of CSR assumptionswas the first area studied of the activity of companies that agreed to take part in research. (see Table 7)
Table 7. Impact of organizational cultures based on social responsibility and value-basedmanagement—statistical values [3].
Statistical Value Value
Pearson 0.6599Coefficient of determination R2 0.4355
n 44.00
Figure 6 shows the correlation results. In order to determine whether the assumed correlationbetween organizational cultures based on CSR and VBM exists and whether it is strong, Pearson’scoefficient was applied to the values (unloaded estimate of the correlation coefficient rxy); it is
59
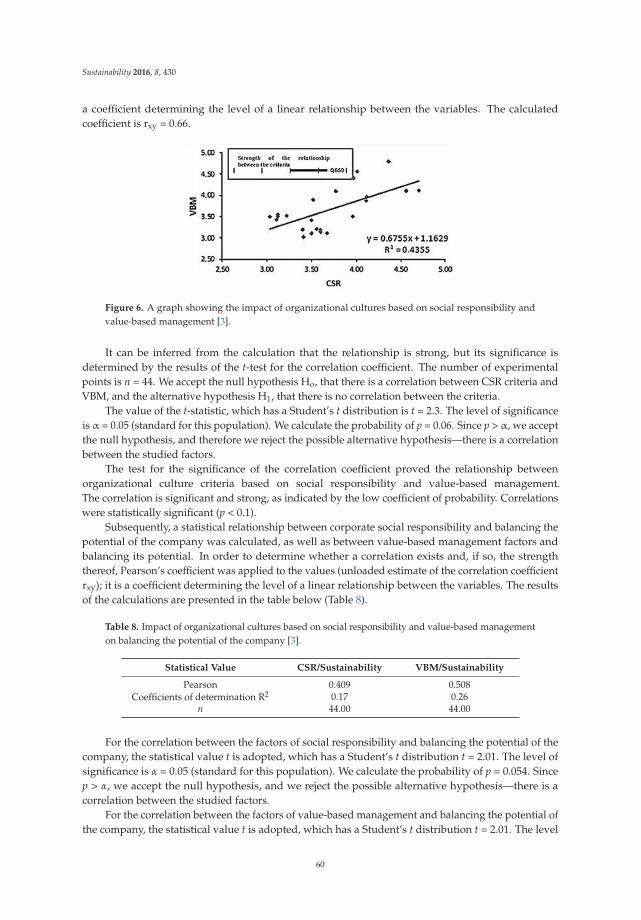
Sustainability 2016, 8, 430
a coefficient determining the level of a linear relationship between the variables. The calculatedcoefficient is rxy = 0.66.
Figure 6. A graph showing the impact of organizational cultures based on social responsibility andvalue-based management [3].
It can be inferred from the calculation that the relationship is strong, but its significance isdetermined by the results of the t-test for the correlation coefficient. The number of experimentalpoints is n = 44. We accept the null hypothesis Ho, that there is a correlation between CSR criteria andVBM, and the alternative hypothesis H1, that there is no correlation between the criteria.
The value of the t-statistic, which has a Student’s t distribution is t = 2.3. The level of significanceis α = 0.05 (standard for this population). We calculate the probability of p = 0.06. Since p > α, we acceptthe null hypothesis, and therefore we reject the possible alternative hypothesis—there is a correlationbetween the studied factors.
The test for the significance of the correlation coefficient proved the relationship betweenorganizational culture criteria based on social responsibility and value-based management.The correlation is significant and strong, as indicated by the low coefficient of probability. Correlationswere statistically significant (p < 0.1).
Subsequently, a statistical relationship between corporate social responsibility and balancing thepotential of the company was calculated, as well as between value-based management factors andbalancing its potential. In order to determine whether a correlation exists and, if so, the strengththereof, Pearson’s coefficient was applied to the values (unloaded estimate of the correlation coefficientrxy); it is a coefficient determining the level of a linear relationship between the variables. The resultsof the calculations are presented in the table below (Table 8).
Table 8. Impact of organizational cultures based on social responsibility and value-based managementon balancing the potential of the company [3].
Statistical Value CSR/Sustainability VBM/Sustainability
Pearson 0.409 0.508Coefficients of determination R2 0.17 0.26
n 44.00 44.00
For the correlation between the factors of social responsibility and balancing the potential of thecompany, the statistical value t is adopted, which has a Student’s t distribution t = 2.01. The level ofsignificance is α = 0.05 (standard for this population). We calculate the probability of p = 0.054. Sincep > α, we accept the null hypothesis, and we reject the possible alternative hypothesis—there is acorrelation between the studied factors.
For the correlation between the factors of value-based management and balancing the potential ofthe company, the statistical value t is adopted, which has a Student’s t distribution t = 2.01. The level
60
Sustainability 2016, 8, 430
of significance is α = 0.05 (standard for this population). We calculate the probability of p = 0.054.Since p > α, we accept the null hypothesis, and we reject the possible alternative hypothesis—there is acorrelation between the studied factors.
It can be inferred that there is no basis to reject the research hypothesis H3, which says that thejoint use of the concepts of corporate social responsibility (CSR) and value-based management (VBM)balances the potentials of the company.
Research clearly shows that most of the companies have an organizational culture based onorganizational behavior deeply embedded in the joint implementation of the principles of corporatesocial responsibility and value-based management. The companies surveyed want to apply theprinciples of sustainable development and growth aimed at long-term functioning and continuousprofit generation, limiting the possibility of uncontrolled risks and building a positive relationship withthe environment. The value of the company depends on the skill of balancing its potentials (balancinga company’s internal factors).
The most important elements of an organizational equilibrium concept are associated with thedriving forces behind a sustainable business model and can be synthetically presented in the followingrelationships with sustainability related to:
‚ material balance (expressed as the strength of the economic sustainability of the company) andsocial balance (expressed as the strength of the conscious application of the principles of corporatesocial responsibility);
‚ internal balance, related to the strength of balancing the company’s internal processes, andexternal balance, expressed as the strength of stakeholders.
As well as sustainability instruments related to:
‚ Strategy expressed as the strength of implementing a sustainable strategy based on the principlesof a balanced scorecard.
‚ Procedures related to the strength of the management style based on the logic of consciousdecision-making.
‚ Culture expressed as the strength of the conscious application of the principles of corporate governance.‚ Structure expressed as the strength of a consensual relationship between company management,
shareholders, stakeholders.
In order to test the strength of the relationships, the correlation between sustainabilityand sustainability instruments was analyzed. Balance has a material and social, internal andexternal dimension. Organizational balance (material, social) is based on the mutual adaptation ofintraorganizational relationships and the relationship between the organization and the environment in amanner that satisfies the criteria of balance. It is associated with the strength of the conscious applicationof the principles of corporate social responsibility and the strength of economic sustainability.
Social imbalance is expressed primarily in the reduction of activities for the organization and thedelegitimization of the organization and its activities in the environment; companies then reduce theircommitment to social responsibility.
Material imbalance is expressed as reducing the economic efficiency of operations and reducingmaterial resources provided by the organization environment. Thus, the strength of economicsustainability, related to value-based management (VBM), becomes an element requiring improvement.
Imbalance provides both a stimulus for change and innovation, transferring the imbalance to otherareas, as well as for actions to regain balance and to re-define the company’s criteria. The company hasa number of sustainability instruments. The research examined sustainability instruments suchas developing a strategy, procedures, programs, budgets, formal business structures, operatingrules, procedures and systems, and organizational cultures, which aim to ensure organizationalperformance—this is expressed as the strength of the management style based on the logic ofconscious decision-making.
61
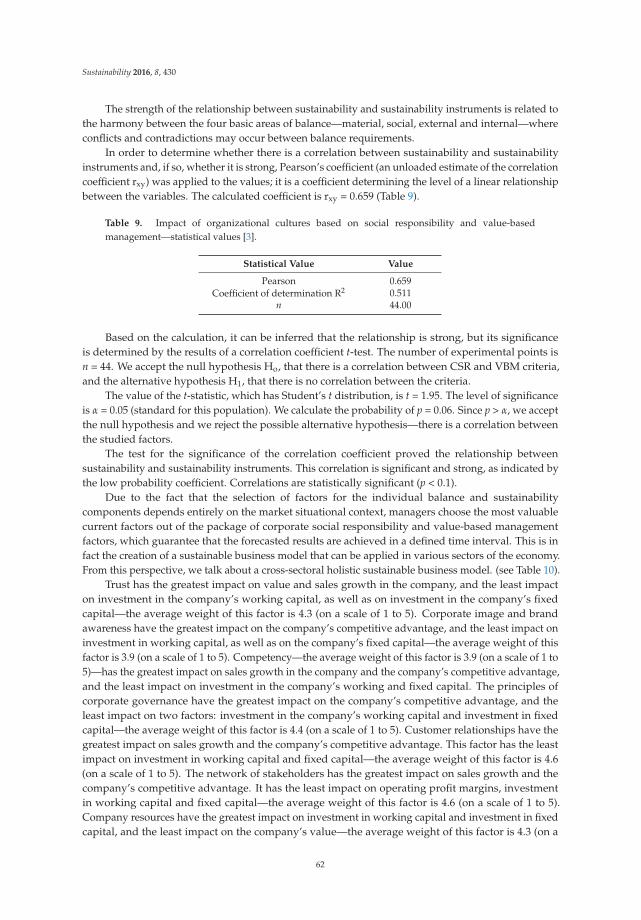
Sustainability 2016, 8, 430
The strength of the relationship between sustainability and sustainability instruments is related tothe harmony between the four basic areas of balance—material, social, external and internal—whereconflicts and contradictions may occur between balance requirements.
In order to determine whether there is a correlation between sustainability and sustainabilityinstruments and, if so, whether it is strong, Pearson’s coefficient (an unloaded estimate of the correlationcoefficient rxy) was applied to the values; it is a coefficient determining the level of a linear relationshipbetween the variables. The calculated coefficient is rxy = 0.659 (Table 9).
Table 9. Impact of organizational cultures based on social responsibility and value-basedmanagement—statistical values [3].
Statistical Value Value
Pearson 0.659Coefficient of determination R2 0.511
n 44.00
Based on the calculation, it can be inferred that the relationship is strong, but its significanceis determined by the results of a correlation coefficient t-test. The number of experimental points isn = 44. We accept the null hypothesis Ho, that there is a correlation between CSR and VBM criteria,and the alternative hypothesis H1, that there is no correlation between the criteria.
The value of the t-statistic, which has Student’s t distribution, is t = 1.95. The level of significanceis α = 0.05 (standard for this population). We calculate the probability of p = 0.06. Since p > α, we acceptthe null hypothesis and we reject the possible alternative hypothesis—there is a correlation betweenthe studied factors.
The test for the significance of the correlation coefficient proved the relationship betweensustainability and sustainability instruments. This correlation is significant and strong, as indicated bythe low probability coefficient. Correlations are statistically significant (p < 0.1).
Due to the fact that the selection of factors for the individual balance and sustainabilitycomponents depends entirely on the market situational context, managers choose the most valuablecurrent factors out of the package of corporate social responsibility and value-based managementfactors, which guarantee that the forecasted results are achieved in a defined time interval. This is infact the creation of a sustainable business model that can be applied in various sectors of the economy.From this perspective, we talk about a cross-sectoral holistic sustainable business model. (see Table 10).
Trust has the greatest impact on value and sales growth in the company, and the least impacton investment in the company’s working capital, as well as on investment in the company’s fixedcapital—the average weight of this factor is 4.3 (on a scale of 1 to 5). Corporate image and brandawareness have the greatest impact on the company’s competitive advantage, and the least impact oninvestment in working capital, as well as on the company’s fixed capital—the average weight of thisfactor is 3.9 (on a scale of 1 to 5). Competency—the average weight of this factor is 3.9 (on a scale of 1 to5)—has the greatest impact on sales growth in the company and the company’s competitive advantage,and the least impact on investment in the company’s working and fixed capital. The principles ofcorporate governance have the greatest impact on the company’s competitive advantage, and theleast impact on two factors: investment in the company’s working capital and investment in fixedcapital—the average weight of this factor is 4.4 (on a scale of 1 to 5). Customer relationships have thegreatest impact on sales growth and the company’s competitive advantage. This factor has the leastimpact on investment in working capital and fixed capital—the average weight of this factor is 4.6(on a scale of 1 to 5). The network of stakeholders has the greatest impact on sales growth and thecompany’s competitive advantage. It has the least impact on operating profit margins, investmentin working capital and fixed capital—the average weight of this factor is 4.6 (on a scale of 1 to 5).Company resources have the greatest impact on investment in working capital and investment in fixedcapital, and the least impact on the company’s value—the average weight of this factor is 4.3 (on a
62
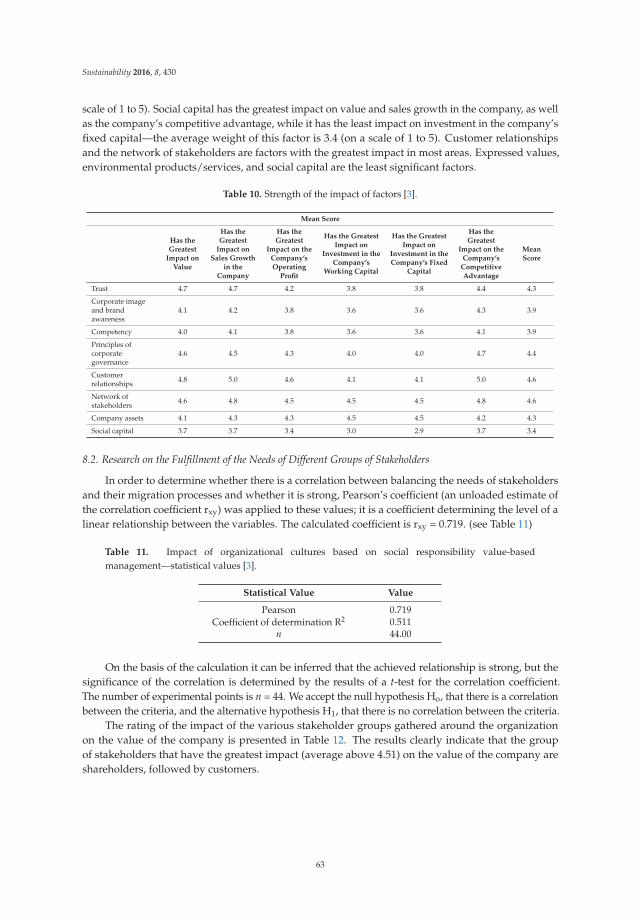
Sustainability 2016, 8, 430
scale of 1 to 5). Social capital has the greatest impact on value and sales growth in the company, as wellas the company’s competitive advantage, while it has the least impact on investment in the company’sfixed capital—the average weight of this factor is 3.4 (on a scale of 1 to 5). Customer relationshipsand the network of stakeholders are factors with the greatest impact in most areas. Expressed values,environmental products/services, and social capital are the least significant factors.
Table 10. Strength of the impact of factors [3].
Mean Score
Has theGreatest
Impact onValue
Has theGreatest
Impact onSales Growth
in theCompany
Has theGreatest
Impact on theCompany’sOperating
Profit
Has the GreatestImpact on
Investment in theCompany’s
Working Capital
Has the GreatestImpact on
Investment in theCompany’s Fixed
Capital
Has theGreatest
Impact on theCompany’s
CompetitiveAdvantage
MeanScore
Trust 4.7 4.7 4.2 3.8 3.8 4.4 4.3
Corporate imageand brandawareness
4.1 4.2 3.8 3.6 3.6 4.3 3.9
Competency 4.0 4.1 3.8 3.6 3.6 4.1 3.9
Principles ofcorporategovernance
4.6 4.5 4.3 4.0 4.0 4.7 4.4
Customerrelationships 4.8 5.0 4.6 4.1 4.1 5.0 4.6
Network ofstakeholders 4.6 4.8 4.5 4.5 4.5 4.8 4.6
Company assets 4.1 4.3 4.3 4.5 4.5 4.2 4.3
Social capital 3.7 3.7 3.4 3.0 2.9 3.7 3.4
8.2. Research on the Fulfillment of the Needs of Different Groups of Stakeholders
In order to determine whether there is a correlation between balancing the needs of stakeholdersand their migration processes and whether it is strong, Pearson’s coefficient (an unloaded estimate ofthe correlation coefficient rxy) was applied to these values; it is a coefficient determining the level of alinear relationship between the variables. The calculated coefficient is rxy = 0.719. (see Table 11)
Table 11. Impact of organizational cultures based on social responsibility value-basedmanagement—statistical values [3].
Statistical Value Value
Pearson 0.719Coefficient of determination R2 0.511
n 44.00
On the basis of the calculation it can be inferred that the achieved relationship is strong, but thesignificance of the correlation is determined by the results of a t-test for the correlation coefficient.The number of experimental points is n = 44. We accept the null hypothesis Ho, that there is a correlationbetween the criteria, and the alternative hypothesis H1, that there is no correlation between the criteria.
The rating of the impact of the various stakeholder groups gathered around the organizationon the value of the company is presented in Table 12. The results clearly indicate that the groupof stakeholders that have the greatest impact (average above 4.51) on the value of the company areshareholders, followed by customers.
63
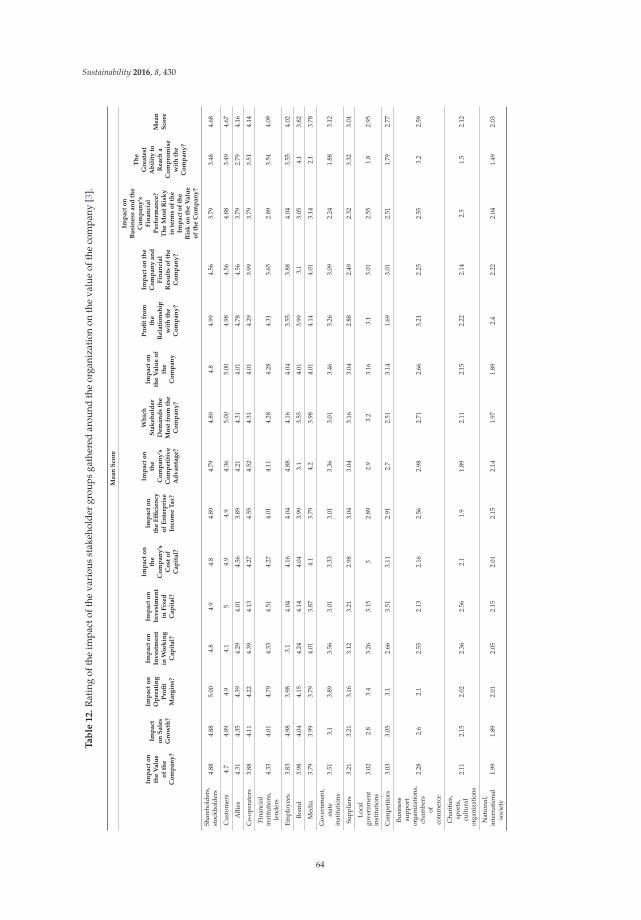
Sustainability 2016, 8, 430
Ta
ble
12
.R
atin
gof
the
impa
ctof
the
vari
ous
stak
ehol
der
grou
psga
ther
edar
ound
the
orga
niza
tion
onth
eva
lue
ofth
eco
mpa
ny[3
].
Me
an
Sco
re
Imp
act
on
the
Va
lue
of
the
Co
mp
an
y?
Imp
act
on
Sa
les
Gro
wth
?
Imp
act
on
Op
era
tin
gP
rofi
tM
arg
ins?
Imp
act
on
Inv
est
me
nt
inW
ork
ing
Ca
pit
al?
Imp
act
on
Inv
est
me
nt
inF
ixe
dC
ap
ita
l?
Imp
act
on
the
Co
mp
an
y’s
Co
sto
fC
ap
ita
l?
Imp
act
on
the
Effi
cie
ncy
of
En
terp
rise
Inco
me
Ta
x?
Imp
act
on
the
Co
mp
an
y’s
Co
mp
eti
tiv
eA
dv
an
tag
e?
Wh
ich
Sta
ke
ho
lde
rD
em
an
ds
the
Mo
stfr
om
the
Co
mp
an
y?
Imp
act
on
the
Va
lue
of
the
Co
mp
an
y
Pro
fit
fro
mth
eR
ela
tio
nsh
ipw
ith
the
Co
mp
an
y?
Imp
act
on
the
Co
mp
an
ya
nd
Fin
an
cia
lR
esu
lts
of
the
Co
mp
an
y?
Imp
act
on
Bu
sin
ess
an
dth
eC
om
pa
ny
’sF
ina
nci
al
Pe
rfo
rma
nce
?T
he
Mo
stR
isk
yin
term
so
fth
eIm
pa
cto
fth
eR
isk
on
the
Va
lue
of
the
Co
mp
an
y?
Th
eG
rea
test
Ab
ilit
yto
Re
ach
aC
om
pro
mis
ew
ith
the
Co
mp
an
y?
Me
an
Sco
re
Shar
ehol
ders
,st
ockh
olde
rs4.
884.
885.
004.
84.
94.
84.
894.
794.
894.
84.
994.
563.
793.
484.
68
Cus
tom
ers
4.7
4.89
4.9
4.1
54.
94.
94.
365.
005.
004.
984.
564.
883.
494.
67
Alli
es4.
314.
354.
394.
294.
014.
563.
894.
214.
314.
014.
784.
563.
792.
794.
16
Co-
oper
ator
s3.
884.
114.
224.
394.
134.
274.
554.
524.
314.
014.
293.
993.
793.
514.
14
Fina
ncia
lin
stitu
tions
,le
nder
s4.
334.
014.
794.
334.
514.
274.
014.
114.
284.
284.
313.
652.
893.
544.
09
Empl
oyee
s3.
834.
983.
983.
14.
044.
164.
044.
884.
164.
043.
553.
884.
043.
554.
02
Boar
d3.
984.
044.
154.
244.
144.
043.
993.
13.
554.
013.
993.
13.
054.
13.
82
Med
ia3.
793.
993.
794.
013.
874.
13.
794.
23.
984.
014.
144.
013.
142.
13.
78
Gov
ernm
ent,
stat
ein
stitu
tions
3.51
3.1
3.89
3.56
3.01
3.33
3.01
3.36
3.01
3.46
3.26
3.09
2.24
1.88
3.12
Supp
liers
3.21
3.21
3.16
3.12
3.21
2.98
3.04
3.04
3.16
3.04
2.88
2.49
2.32
3.32
3.01
Loca
lgo
vern
men
tin
stitu
tions
3.02
2.8
3.4
3.26
3.15
32.
892.
93.
23.
163.
13.
012.
551.
82.
95
Com
petit
ors
3.03
3.05
3.1
2.66
3.51
3.11
2.91
2.7
2.51
3.14
1.69
3.01
2.51
1.79
2.77
Busi
ness
supp
ort
orga
niza
tions
,ch
ambe
rsof
com
mer
ce
2.28
2.6
2.1
2.55
2.13
2.16
2.56
2.98
2.71
2.66
3.21
2.25
2.55
3.2
2.59
Cha
riti
es,
spor
ts,
cult
ural
orga
niza
tions
2.11
2.15
2.02
2.36
2.56
2.1
1.9
1.89
2.11
2.15
2.22
2.14
2.5
1.5
2.12
Nat
iona
l,in
tern
atio
nal
soci
ety
1.99
1.89
2.01
2.05
2.15
2.01
2.15
2.14
1.97
1.89
2.4
2.22
2.04
1.49
2.03
64
Sustainability 2016, 8, 430
8.3. The Application of a Sustainable Dividend Policy
In order to ensure the company’s liquidity and profitability today and in the future, companiespay a profit in the form of dividends, which are also sustainable: the allocation of one-third of thedividends to increase the company’s equity in order to increase business credibility, also by increasingits debt-raising capacity; the allocation of one-third of the dividends for investments in tangible andintangible capital; and the allocation of one-third of the dividends for consumption by the companyshareholders, who are the primary donors of cash for the development and growth of the organizationand expect satisfactory return on capital employed in the reference period they establish.
It results in significant value added, arising from the application of the principles of socialresponsibility, and includes a financial dividend to shareholders paid in a sustainable manner and asocial dividend, the beneficiaries of which are all company stakeholders.
A sustainable business model has been presented based on proving the hypotheses, as shown inFigure 5.
All the hypotheses are true. Quantitative research has been combined with qualitative research,which was supplemented with expert analysis. Methodological triangulation has been applied, i.e.,the use of many methods to examine a single issue. Raw data from empirical research has been usedby means of a survey questionnaire as well as secondary data from analyzing the stock exchangeand documents drawn up by companies related to applying the principles of corporate governance.The result of the research is a sustainable business model built on the basis of seven driving forceswith marked correlations between its elements, between which the interactions occur. A holisticsustainable business model (Figure 5) shows the key statistical links that have particularly importantimplications for building the long-term value of the company. The correlations between variables(empirical research findings using questionnaires) that are considered important have been shown.The model is the result of empirical research with respect to the selected variables. The variablesform the shape of relationships between determinants describing an eclectic sustainable businessmodel. Not all variables correlate with other variables—only those that are important for building thelong-term value of the company have been shown.
On the basis of the above design of a sustainable business model, its new definition has beendeveloped using the proven hypotheses. The numbers in the figure indicate the statistical relationshipsbetween the different components of the proposed sustainable business model for mature companies.Where there are no numerical values, the relationship has not been studied and only the cause andeffect relationships have been shown as it is necessary to show them for the applied holistic approach.A sustainable business model building the long-term value of a socially responsible company is themodel built by the joint use of the corporate social responsibility and value-based management conceptswhich ensures that the needs of shareholders and other stakeholder groups are fulfilled through askillful balancing of the company’s potential towards generating value allocated in a sustainable way,enabling the continuity of company management.
A sustainable business model is a hybrid model, i.e., a model built in the subject-object system.Components of this model include entities centered on the company, forming relationships, influencingthe company value drivers and strategic factors connected with the theory of corporate socialresponsibility, value-based management, the theory of stakeholders and the theory of shareholdersfunctioning in the mutual relationship based on the principles of sustainability. (see Figure 7).
This model is a holistic model of reduced nature, which could be applied in different sectors ofthe economy, treated as a subsystem of the entire ecosystem. This means that this model and its designare included in the middle-range theory. While determining the strategic options of the companiessurveyed, enabling the design of an effective sustainable business model, boundary conditions whichwere defined in the course of constructing a 3S (Synergy, Symbiosis, Symmetry) triangle and DSB(Durability, Sustainability, Balance) triangle must be specified.
65
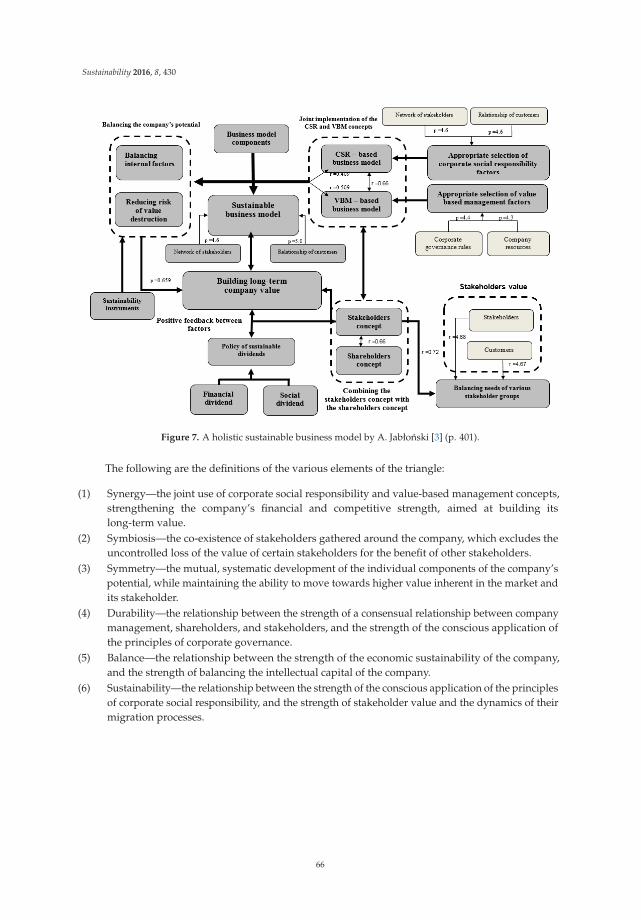
Sustainability 2016, 8, 430
Figure 7. A holistic sustainable business model by A. Jabłonski [3] (p. 401).
The following are the definitions of the various elements of the triangle:
(1) Synergy—the joint use of corporate social responsibility and value-based management concepts,strengthening the company’s financial and competitive strength, aimed at building itslong-term value.
(2) Symbiosis—the co-existence of stakeholders gathered around the company, which excludes theuncontrolled loss of the value of certain stakeholders for the benefit of other stakeholders.
(3) Symmetry—the mutual, systematic development of the individual components of the company’spotential, while maintaining the ability to move towards higher value inherent in the market andits stakeholder.
(4) Durability—the relationship between the strength of a consensual relationship between companymanagement, shareholders, and stakeholders, and the strength of the conscious application ofthe principles of corporate governance.
(5) Balance—the relationship between the strength of the economic sustainability of the company,and the strength of balancing the intellectual capital of the company.
(6) Sustainability—the relationship between the strength of the conscious application of the principlesof corporate social responsibility, and the strength of stakeholder value and the dynamics of theirmigration processes.
66
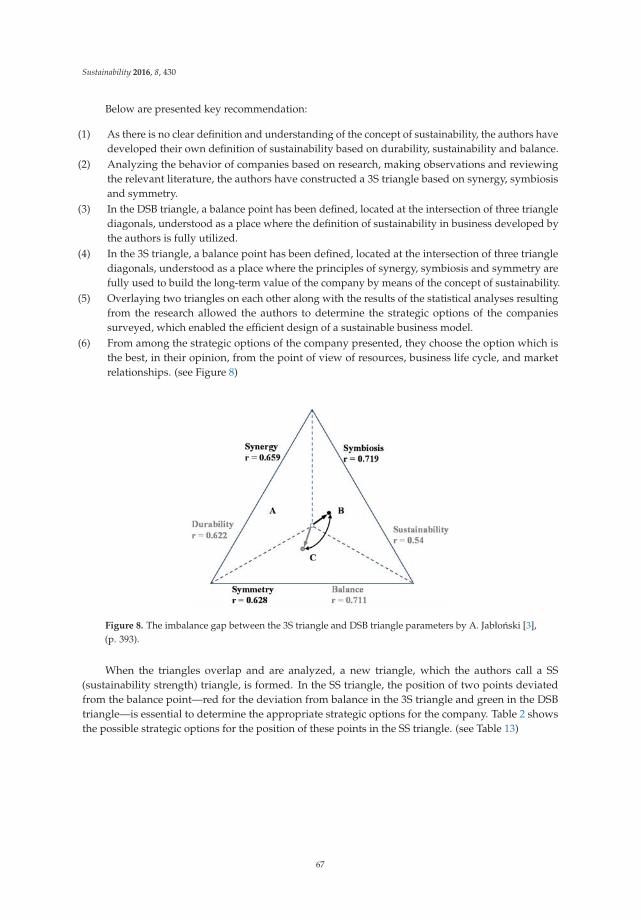
Sustainability 2016, 8, 430
Below are presented key recommendation:
(1) As there is no clear definition and understanding of the concept of sustainability, the authors havedeveloped their own definition of sustainability based on durability, sustainability and balance.
(2) Analyzing the behavior of companies based on research, making observations and reviewingthe relevant literature, the authors have constructed a 3S triangle based on synergy, symbiosisand symmetry.
(3) In the DSB triangle, a balance point has been defined, located at the intersection of three trianglediagonals, understood as a place where the definition of sustainability in business developed bythe authors is fully utilized.
(4) In the 3S triangle, a balance point has been defined, located at the intersection of three trianglediagonals, understood as a place where the principles of synergy, symbiosis and symmetry arefully used to build the long-term value of the company by means of the concept of sustainability.
(5) Overlaying two triangles on each other along with the results of the statistical analyses resultingfrom the research allowed the authors to determine the strategic options of the companiessurveyed, which enabled the efficient design of a sustainable business model.
(6) From among the strategic options of the company presented, they choose the option which isthe best, in their opinion, from the point of view of resources, business life cycle, and marketrelationships. (see Figure 8)
Figure 8. The imbalance gap between the 3S triangle and DSB triangle parameters by A. Jabłonski [3],(p. 393).
When the triangles overlap and are analyzed, a new triangle, which the authors call a SS(sustainability strength) triangle, is formed. In the SS triangle, the position of two points deviatedfrom the balance point—red for the deviation from balance in the 3S triangle and green in the DSBtriangle—is essential to determine the appropriate strategic options for the company. Table 2 showsthe possible strategic options for the position of these points in the SS triangle. (see Table 13)
67
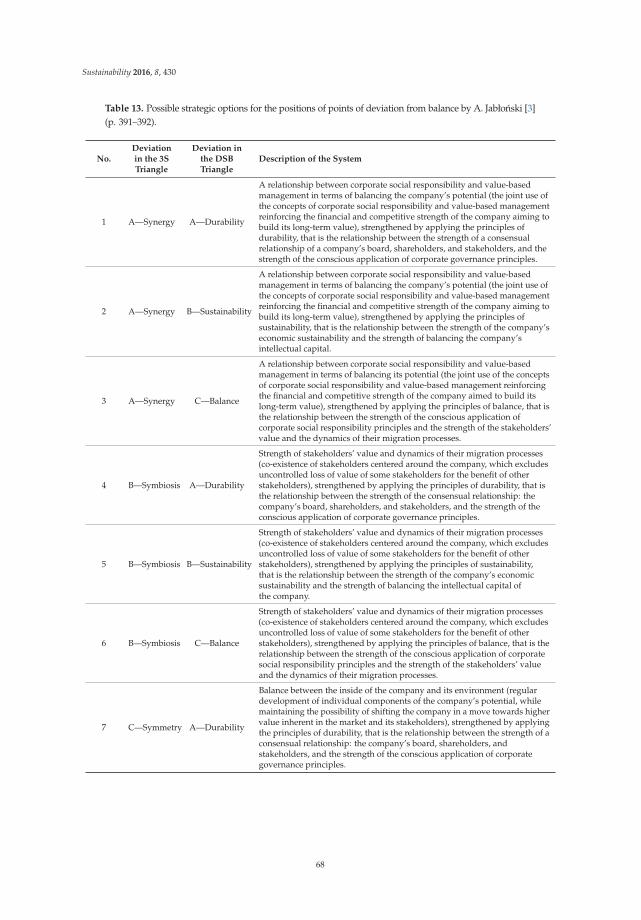
Sustainability 2016, 8, 430
Table 13. Possible strategic options for the positions of points of deviation from balance by A. Jabłonski [3](p. 391–392).
No.Deviationin the 3STriangle
Deviation inthe DSBTriangle
Description of the System
1 A—Synergy A—Durability
A relationship between corporate social responsibility and value-basedmanagement in terms of balancing the company’s potential (the joint use ofthe concepts of corporate social responsibility and value-based managementreinforcing the financial and competitive strength of the company aiming tobuild its long-term value), strengthened by applying the principles ofdurability, that is the relationship between the strength of a consensualrelationship of a company’s board, shareholders, and stakeholders, and thestrength of the conscious application of corporate governance principles.
2 A—Synergy B—Sustainability
A relationship between corporate social responsibility and value-basedmanagement in terms of balancing the company’s potential (the joint use ofthe concepts of corporate social responsibility and value-based managementreinforcing the financial and competitive strength of the company aiming tobuild its long-term value), strengthened by applying the principles ofsustainability, that is the relationship between the strength of the company’seconomic sustainability and the strength of balancing the company’sintellectual capital.
3 A—Synergy C—Balance
A relationship between corporate social responsibility and value-basedmanagement in terms of balancing its potential (the joint use of the conceptsof corporate social responsibility and value-based management reinforcingthe financial and competitive strength of the company aimed to build itslong-term value), strengthened by applying the principles of balance, that isthe relationship between the strength of the conscious application ofcorporate social responsibility principles and the strength of the stakeholders’value and the dynamics of their migration processes.
4 B—Symbiosis A—Durability
Strength of stakeholders’ value and dynamics of their migration processes(co-existence of stakeholders centered around the company, which excludesuncontrolled loss of value of some stakeholders for the benefit of otherstakeholders), strengthened by applying the principles of durability, that isthe relationship between the strength of the consensual relationship: thecompany’s board, shareholders, and stakeholders, and the strength of theconscious application of corporate governance principles.
5 B—Symbiosis B—Sustainability
Strength of stakeholders’ value and dynamics of their migration processes(co-existence of stakeholders centered around the company, which excludesuncontrolled loss of value of some stakeholders for the benefit of otherstakeholders), strengthened by applying the principles of sustainability,that is the relationship between the strength of the company’s economicsustainability and the strength of balancing the intellectual capital ofthe company.
6 B—Symbiosis C—Balance
Strength of stakeholders’ value and dynamics of their migration processes(co-existence of stakeholders centered around the company, which excludesuncontrolled loss of value of some stakeholders for the benefit of otherstakeholders), strengthened by applying the principles of balance, that is therelationship between the strength of the conscious application of corporatesocial responsibility principles and the strength of the stakeholders’ valueand the dynamics of their migration processes.
7 C—Symmetry A—Durability
Balance between the inside of the company and its environment (regulardevelopment of individual components of the company’s potential, whilemaintaining the possibility of shifting the company in a move towards highervalue inherent in the market and its stakeholders), strengthened by applyingthe principles of durability, that is the relationship between the strength of aconsensual relationship: the company’s board, shareholders, andstakeholders, and the strength of the conscious application of corporategovernance principles.
68
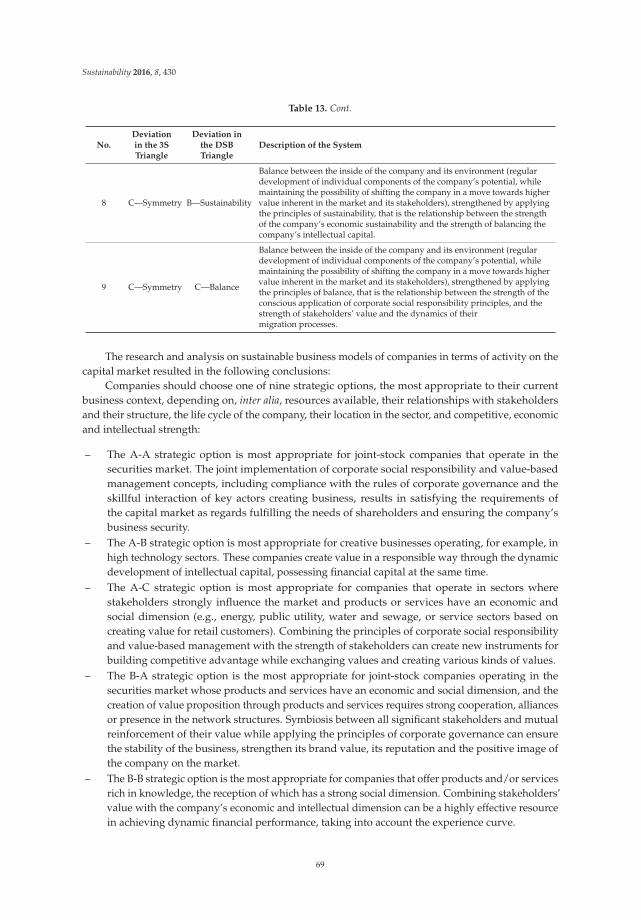
Sustainability 2016, 8, 430
Table 13. Cont.
No.Deviationin the 3STriangle
Deviation inthe DSBTriangle
Description of the System
8 C—Symmetry B—Sustainability
Balance between the inside of the company and its environment (regulardevelopment of individual components of the company’s potential, whilemaintaining the possibility of shifting the company in a move towards highervalue inherent in the market and its stakeholders), strengthened by applyingthe principles of sustainability, that is the relationship between the strengthof the company’s economic sustainability and the strength of balancing thecompany’s intellectual capital.
9 C—Symmetry C—Balance
Balance between the inside of the company and its environment (regulardevelopment of individual components of the company’s potential, whilemaintaining the possibility of shifting the company in a move towards highervalue inherent in the market and its stakeholders), strengthened by applyingthe principles of balance, that is the relationship between the strength of theconscious application of corporate social responsibility principles, and thestrength of stakeholders’ value and the dynamics of theirmigration processes.
The research and analysis on sustainable business models of companies in terms of activity on thecapital market resulted in the following conclusions:
Companies should choose one of nine strategic options, the most appropriate to their currentbusiness context, depending on, inter alia, resources available, their relationships with stakeholdersand their structure, the life cycle of the company, their location in the sector, and competitive, economicand intellectual strength:
– The A-A strategic option is most appropriate for joint-stock companies that operate in thesecurities market. The joint implementation of corporate social responsibility and value-basedmanagement concepts, including compliance with the rules of corporate governance and theskillful interaction of key actors creating business, results in satisfying the requirements ofthe capital market as regards fulfilling the needs of shareholders and ensuring the company’sbusiness security.
– The A-B strategic option is most appropriate for creative businesses operating, for example, inhigh technology sectors. These companies create value in a responsible way through the dynamicdevelopment of intellectual capital, possessing financial capital at the same time.
– The A-C strategic option is most appropriate for companies that operate in sectors wherestakeholders strongly influence the market and products or services have an economic andsocial dimension (e.g., energy, public utility, water and sewage, or service sectors based oncreating value for retail customers). Combining the principles of corporate social responsibilityand value-based management with the strength of stakeholders can create new instruments forbuilding competitive advantage while exchanging values and creating various kinds of values.
– The B-A strategic option is the most appropriate for joint-stock companies operating in thesecurities market whose products and services have an economic and social dimension, and thecreation of value proposition through products and services requires strong cooperation, alliancesor presence in the network structures. Symbiosis between all significant stakeholders and mutualreinforcement of their value while applying the principles of corporate governance can ensurethe stability of the business, strengthen its brand value, its reputation and the positive image ofthe company on the market.
– The B-B strategic option is the most appropriate for companies that offer products and/or servicesrich in knowledge, the reception of which has a strong social dimension. Combining stakeholders’value with the company’s economic and intellectual dimension can be a highly effective resourcein achieving dynamic financial performance, taking into account the experience curve.
69
Sustainability 2016, 8, 430
– The B-C strategic option is most appropriate for business and social enterprises which stronglyinfluence society and its behavior. This is the most extensive model, as it applies not only to capitalcompanies (operating in the capital market and outside), but also to non-profit and not-for-profitorganizations. Orienting the strategy to fulfilling the needs of stakeholders is associated withthe concept of social entrepreneurship, where value has not only a financial dimension (financialdividend), but also a social one (social dividend).
– The C-A strategic option is most appropriate for companies operating in relatively stable sectorsof the economy, where the market growth rate is not high. By using creative comparison, thecompany may try to match its internal potential to relevant market expectations, following theprinciples of economic sustainability. Companies applying an evolutionary model in managementcan develop in a sustainable way and maintain their ability to effectively and efficiently managebusiness and social risk.
– The C-B strategic option is most appropriate for stable companies that create products and/orservices rich in knowledge, based on the mechanisms of incremental innovation. They modify theproducts and/or services they offer, based on the continuous study of customer needs, marketobservations, flexibility and changes in the area—the inside of a company—the market.
– The C-C strategic option is most appropriate for companies operating in a stable market withthe clearly defined, changing needs of customers and other stakeholders in a sustainable way.Stakeholders appreciate the stable state of the company operating in a stable market and seek tojoin the course of mutual value exchange. As a result, the value of the company increases, as wellas the value of its stakeholders.
The above strategic options show the trends in the creation of sustainable business models forcompanies at the maturity stage of development.
9. Discussion
The assumptions of sustainability are achievable through the entire life cycle of thecompany—from the stage of incubation to maturity. Discussion of the results in terms of contributionto sustainability in the life cycle requires defining at least two extreme stages, the early stage ofcompany development and the maturity stage. At each stage, the assumptions of the base businessmodel will be different. In each case, survival in different conditions, which is a prerequisite forlong-term value creation for different groups of stakeholders, should be a key stimulator of businessactivity. The configuration design and its monitoring of the survival strategy of business modelsat an early stage of development and business models operating in the market for a long time isthe underlying assumption of creating value in the long term. The business model must changedue to the changeable internal and external environment based on the capabilities inherent in itspotential. Skillfully making changes to the business model during its life cycle enables it to survive.Therefore, survival is determined by the ability to modify the business model throughout the life cycleof the company, applying the solution appropriate for the situation in the sphere of business models.We believe that the concept of sustainability, which is based on configuring the business model interms of its variability in the context of the company’s life cycle, is subject to interpretation. Bothyoung and mature companies want, first of all, to be able to survive to create maximum value forstakeholders in good times. The pillars of survival will be generally the same, even though they willbe different at each stage. Whether a model is sustainable depends on the ability to reconfigure thebusiness models at different stages of development. A sustainable business model, by the criterionof the company’s life cycle, is understood as the development of a model configuration such that itwill allow the company to survive on the market under all circumstances. Such logic implies that, atvarious stages of the company’s life cycle, managers are able to configure their business models withbusiness model components adequate for meeting the needs of the market. The resulting businessmodel canvas will continue to evolve by changing the components that have been fully exploited
70
Sustainability 2016, 8, 430
and replacing them with those that will be able to further create company value and achieve highperformance. As a result, the company still has an efficient business model. That efficiency translatesinto achieving appropriate rates of return from the business model. The accepted methodology ofbusiness model development will then be realized.
As a result, further research and work on application should be a contribution to creating othersolutions in this respect. It is also interesting to examine this issue from the point of view of thenetwork economy. In this way, a new approach to business models has been presented, which shouldcontribute to the development of the sustainability issue from the point of view of the company’slife cycle.
10. Conclusions
The functioning of companies in the Polish capital market in times of crisis determines newmechanisms not only of competing, but mainly of developing rules of conducting business. Companieswhich are at various stages of development and at different stages of functioning in their sector mustdesign business models that can provide a platform for stability of the defined and used components,constituting an efficient business model. In order to be able to do it, they should make strategicdecisions relevant to the life cycle they are in. Only such a design of the business model and strategythat is consistent with a given stage of company development may ensure an acceptable level of growthand development of the company, providing the basis for managing and maintaining its continuityover a long period of time, using sustainability principles. The assessment of business models can takeinto account the following factors:
– developed in other stages of the company life cycle– requiring other methods and management concepts appropriate to the level of company maturity,
supporting the process of value creation– if the company is a participant in the capital market it may be listed in other indices (a company
at the initial stage of its development in the New Connect Index, for example, and a maturecompany in the Respect Index)
– an emphasis on the creation of value in the short and long term– an emphasis on the creation of value mainly for shareholders and/or the concept of value creation
for the company through a dialogue with stakeholders as the conditions of implementing theprinciples of sustainability
Research included both companies at an early stage of development and mature companies.The data of companies listed on the Stock Exchange in Warsaw in the indices relevant to their specificcharacter were used. Using the theoretical assumptions related to the concept of the componentapproach to building the business model configuration of companies at an early stage of developmentand stakeholder theory and the joint use of the CSR and VBM concepts for mature companies, twomodels have been developed relating to two extreme stages of development, the stage of shaping thebusiness model for the objective of developing the company’s ability to create value for shareholdersand the stage of ensuring the long-term value of the company in the case of mature companies. In thisway, individual attributes and their combinations for business models that are at two extreme stages ofdevelopment have been identified. The first group of the surveyed companies was IPO companies,while the second was companies that had been listed on the Stock Exchange for a long time and thatare governed by the principles of corporate governance. Thus, their business models are different.As shown in this paper, managers in start-ups focus their attention on designing, delivering scalabilityand dynamically adjusting the used business model, while in the case of mature companies theyexpand the understanding of the business model, adding management intentions to its attributesbased on balancing the interests of different groups of stakeholders and a coherent and coordinateduse of assumptions of the concepts of value-based management and corporate social responsibility,resulting in the creation of a sustainable business model. Business models examined using the criterion
71
Sustainability 2016, 8, 430
of the life cycle change due to the growing needs of stakeholders over time. As these needs andexpectations are the greatest in the case of mature companies, the creation of a category of a businessmodel concentrated on sustainability is therefore justified. In the case of companies at an earlystage of development, it is also important to take into account which business model componentsare responsible for increasing shareholder value to the greatest extent. They should therefore be adriver of adjusting business models, and changes aiming to build company value should focus onthem. Directions for further research may include the further development of the concept of businessmodels of the early and mature stages of company development; mechanisms for creating, deliveringand capturing value at various stages of the life cycle of the company; shaping networked businessmodels in the life cycle; and the methods of achieving business model scalability at various stages ofcompany development.
Prospects for further scientific research may include:
(1) The further development of the concept of a business model in the life cycle from the point ofview of its sustainability.
(2) Building sustainable business models based on the network paradigm.(3) Making changes in the configuration of business models on different levels of development.(4) Studying the scalability of sustainable business models in hybrid organizations.(5) Searching the impact of cooperative behaviors in building business models.
Several issues limiting research and analysis have been selected. The subject of studying businessmodels in their life cycle is relatively new and not fully developed. Therefore, there are not manycomparable studies that may provide a reference point for the research findings. There are a smallnumber of scientific studies on business models examined in terms of the life cycle, which also makesit difficult to explore this issue. The limitations can also include problems resulting from the researchsampling. The authors intend to develop the research issue and conduct further research on the subjectfor different groups of companies, not only capital market participants.
Author Contributions: Adam Jabłonski and Marek Jabłonski contributed equally to the research design, datacollection and the composition of the paper.
Conflicts of Interest: The authors declare no conflict of interest.
References
1. Teece, D.J. Business models, business strategy and innovation. Long Range Plan. 2010, 43, 172–194. [CrossRef]2. Jabłonski, M. Kształtowanie Modeli Biznesu w Procesie Kreacji Wartosci Przedsiebiorstw (Designing Business Models
in the Process of Company Value Creation); Difin: Warszawa, Poland, 2013. (In Polish)3. Jabłonski, A. Modele Zrównowazonego Biznesu w Budowie Długoterminowej Wartosci Przedsiebiorstw z
Uwzglednieniem ich Społecznej Odpowiedzialnosci (Sustainable Business Models in Building Long-Term Value,Taking Their Corporate Social Responsibility into Account); Difin: Warszawa, Poland, 2013. (In Polish)
4. Von Bertalanffy, L. General System Theory; George Braziller: New York, NY, USA, 1969.5. Boulding, K.E. Economic Analysis; Harper and Row: New York, NY, USA, 1966; Volume 1.6. Ackoff, R.L. Towards a system of systems concept. Manag. Sci. 1971, 17, 661–671. [CrossRef]7. Rumelt, R.P. How much does industry matter? Strateg. Manag. J. 1991, 12, 167–185. [CrossRef]8. Penrose, E.T. The Theory of the Growth of the Firm; Wiley: New York, NY, USA, 1959.9. Barney, J.B. Firm resources and sustained competitive advantage. J. Manag. 1991, 17, 99–120. [CrossRef]10. Barney, J.B. Is the resource-based “view” a useful perspective for strategic management research? Yes.
Acad. Manag. Rev. 2001, 26, 41–56.11. Barney, J.B.; Clark, D.N. Resource-Based Theory: Creating And Sustaining Competitive Advantage;
Oxford University Press: Oxford, UK, 2007.12. Peteraff, M. The cornerstones of competitive advantage: A resource-based view. Strateg. Manag. J. 1993, 14,
179–191. [CrossRef]13. Wernerfelt, B. A resource-based view of the firm. Strateg. Manag. J. 1984, 5, 171–180. [CrossRef]
72
Sustainability 2016, 8, 430
14. Dollinger, M.J. Entrepreneurship. Strategies and Resources; Prentice Hall: Upper Saddle River, NJ, USA, 2001.15. Prahalad, C.K.; Hamel, G. The Core Competence of the Corporation. Harv. Bus. Rev. 1990, 18, 79–91.16. Elkington, J. Cannibals with Forks: The Triple Bottom Line of Twenty-First Century Business; Capstone: Mankato,
MN, USA, 1997.17. Dyllick, T.; Muff, K. Clarifying the meaning of sustainable business: Introducing a typology from
business-as-usual to true business sustainability. Organ. Environ. 2015. [CrossRef]18. Stubbs, W.; Cocklin, C. Conceptualizing a “sustainability business model”. Organ. Environ. 2008, 21.
[CrossRef]19. Schaltegger, S.; Burritt, R. Business cases and corporate engagement with sustainability: Differentiating
ethical motivations. J. Bus. Ethics 2015. [CrossRef]20. Dyllick, T.; Hockerts, K. Beyond the business case for corporate sustainability. Bus. Strateg. Environ. 2002, 11,
130–141. [CrossRef]21. Mc Donough, W.; Braugnart, M. The Next Industrial Revolution; The Atlantic Monthly: Washington, DC, USA, 1998.22. Boons, F.; Lüdeke-Freund, F. Business models for sustainable innovation: State-of-the-art and steps towards
a research agenda. J. Clean. Prod. 2013, 45, 9–19. [CrossRef]23. Carroll, A.; Shabana, K. The business case for corporate social responsibility: A review of concepts, research
and practice. Int. J. Manag. Rev. 2010, 12, 85–105. [CrossRef]24. Schaltegger, S.; Burritt, R. Corporate sustainability. In The International Yearbook of Environmental and Resource
Economics. 2005/2006: A Survey of Current Issues; Folmer, H., Tietenberg, T., Eds.; Edward Elgar: Cheltenham,UK, 2005; pp. 185–222.
25. Boons, F.; Montalvo, C.; Quist, J.; Wagner, M. Sustainable innovation, business models and economicperformance: An overview. J. Clean. Prod. 2013, 45, 1–8. [CrossRef]
26. Schaltegger, S.; Lüdeke-Freund, F.; Hansen, E. Business cases for sustainability: The role of business modelinnovation for corporate sustainability. Int. J. Innov. Sustain. 2012, 6, 95–119. [CrossRef]
27. York, J.G. Pragmatic sustainability: Translating environmental ethics into competitive advantage.J. Bus. Ethics 2009. [CrossRef]
28. Schaltegger, S.; Hansen, E.; Lüdeke-Freund, F. Business models for sustainability: Origins, present research,and future avenues. Organ. Environ. 2015. [CrossRef]
29. Dentchev, N.; Baumgartner, R.; Dieleman, H.; Jóhannsdóttir, L.; Jonker, J.; Nyberg, T.; Rauter, R.; Rosano, M.;Snihur, Y.; Tang, X.; et al. Embracing the variety of sustainable business models: Social entrepreneurship,corporate intrapreneurship, creativity, innovation, and other approaches to sustainability challenges.J. Clean. Prod. 2015. [CrossRef]
30. Bocken, N.M.P.; Short, S.W.; Rana, P.; Evans, S. A literature and practice review to develop sustainablebusiness model archetypes. J. Clean. Prod. 2014, 65, 42–56. [CrossRef]
31. Amit, R.; Zott, C. Value creation in e-business. Strateg. Manag. J. 2001, 22, 493–520. [CrossRef]32. Casadesus-Masanell, R.; Ricart, J.E. From strategy to business models and onto tactics. Long Range Plan.
2010, 43, 195–215. [CrossRef]33. Demil, B.; Lecocq, X. Business model evolution: In search of dynamic consistency. Long Range Plan. 2010, 43,
227–246. [CrossRef]34. Mahadevan, B. Business models for internet-based ecommerce: An anatomy. Calif. Manag. Rev. 2000, 42,
55–69. [CrossRef]35. Chesbrough, H. Business model innovation: Opportunities and barriers. Long Range Plan. 2010, 43, 354–363.
[CrossRef]36. Fielt, E. Conceptualising business models: Definitions, frameworks and classifications. J. Bus. Models 2013, 1,
85–105.37. Chandler, A. Strategy and Structure: Chapters in the History of Industrial Enterprise; Doubleday: New York, NY,
USA, 1962.38. Patton, A. Stretch your product’s earning years: Top management’s stake in the product life cycle. Manag. Rev.
1959, 48, 9–14.39. Levitt, T. Exploit the product life cycle. Harv. Bus. Rev. 1965, 43, 81–94.40. Cox, W.E. Product life cycles as marketing models. J. Bus. 1967, 40, 375–384. [CrossRef]41. Churchill, N.C.; Lewis, V.L. The five stages of small business growth. Harv. Bus. Rev. 1983, 61, 30–50.42. Greiner, L. Evolution and revolution as organizations grow. Harv. Bus. Rev. 1972. [CrossRef]
73
Sustainability 2016, 8, 430
43. Hofer, C.W. Toward a contingency theory of business strategy. Acad. Manag. J. 1975, 18, 784–810. [CrossRef]44. Scott, M.; Bruce, R. Five stages of growth in small business. Long Range Plan. 1987, 20, 45–52. [CrossRef]45. Quinn, R.E.; Cameron, K. Organizational life cycles and shifting criteria of effectiveness: Some preliminary
evidence. Manag. Sci. 1983, 29, 33–51. [CrossRef]46. Lester, D.L.; Parnell, J.A.; Carraher, S. Organization life cycle: A five-stage empirical scale. Int. J. Organ. Anal.
2003, 11, 339–354. [CrossRef]47. Thietart, R.A.; Vivas, R. An empirical investigation of success strategies for businesses along the product life
cycle. Manag. Sci. 1984, 30, 1405–1423. [CrossRef]48. Schallmo, D.R.A.; Brecht, L. Business model innovation in business-to-business markets—Procedure and
examples. In Proceedings of the 3rd ISPIM Innovation Symposium: Managing the Art of Innovation: TurningConcepts into Reality, Quebec City, QC, Canada, 12–15 December 2010.
49. De Reuver, M.; Bouwman, H.; MacInnes, I. Business model dynamics: A case survey. J. Theor. Appl. Electron.Commer. Res. 2009, 4, 1–11. [CrossRef]
50. Rodríguez, B.M.M. A new insight into the valuation of start-ups: Bridging the intellectual capital gap inventure capital appraisals. Electron. J. Knowl. Manag. 2003, 1, 125–138.
51. Grudzewski, W.M.; Hejduk, I.K.; Sankowska, A.; Wantuchowicz, M. Sustainability w Biznesie CzyliPrzedsiebiorstwo Przyszłosci, Zmiany Paradygmatów I Koncepcji Zarzadzania; Wydawnictwo Poltext: Warszawa,Poland, 2010.
52. Kidd, C.V. The evolution of sustainability. J. Agric. Environ. Ethics 1992, 5, 1–26. [CrossRef]53. Svenson, G.; Wood, G.; Callaghan, M. A corporate model of sustainable business practices: An ethical
perspective. J. World Bus. 2010, 45, 336–345. [CrossRef]54. Ahmed, M.D.; Sundaram, D. Sustainability modelling and reporting: From roadmap to implementation.
Decis. Support Syst. 2012, 53, 611–624. [CrossRef]55. Jabłonski, A.; Jabłonski, M. Modele biznesu w cyklu zycia przedsiebiorstwa—Wyzwania strategiczne
(Business models in the company life cycle—Strategic challenges). Prz. Organ. 2013, 9, 17–21. (In Polish)56. Zott, C.; Amit, R. Business model design: An activity system perspective. Special Issue on Business Models.
Long Range Plan. 2010, 43, 216–226. [CrossRef]57. Zott, C.; Amit, R.; Massa, L. The business model: Theoretical roots, recent developments, and future research.
Available online: www.iese.edu/research/pdfs/di-0862-e.pdf (accessed on 22 April 2016).58. Keidal, R.W. The Geometry of Strategy, Concepts for Strategic Management; Routledge Taylor & Francis Group:
New York, NY, USA, 2010.59. Jabłonski, M. Geometria strategii a procesy kreacji wartosci przedsiebiorstwa (The Geometry of strategy and
processes of company value creation). Prz. Organ. 2011, 4, 36–41. (In Polish)60. De Waal, A. Strategic Performance Management, a Managerial and Behavioral Approach; Palgrave Macmillan:
New York. NY, USA, 2007.61. Shafer, S.M.; Smith, H.I.; Lander, I.C. The power of business models. Bus. Horiz. 2005, 48, 199–207. [CrossRef]62. Jabłonski, M. Geometria modeli biznesu. Ekon. Organ. Przeds. 2011, 4, 39–47. (In Polish)63. Rappaport, A. Creating Shareholder Value: The New Standard for Business Performance; Free Press: New York,
NY, USA, 1986.64. Copeland, T.; Koller, T.; Murrin, J. Valuation: Measuring and Managing the Value of Companies; John Wiley &
Sons: New York, NY, USA, 1994.65. Martin, J.D.; Petty, J.W.; Wallace, J.S. Value Based Management with Corporate Social Responsibility;
Oxford University Press: Oxford, UK, 2009.66. Jabłonski, A. Corporate Social Responsibility in Value Based Management; Wyzsza Szkoła Biznesu: Dabrowa
Górnicza, Poland, 2009.67. New Connect after One Year, Raport z Dojrzewania (A Maturity Report), Warszawa, Poland, 2008. Available
online: http://www.newconnect.pl/pub/dokumenty_do_pobrania/Raport_NC.pdf (accessed on 22 April 2016).68. Niedzielska, J. A Guide to 5 Years of New Connect, New Connect.info, Warszawa, Poland, 2012. Available
online: http://www.newconnect.info/przewodnik/przewodnik_zwiastun.pdf (accessed on 22 April 2016).
© 2016 by the authors. Licensee MDPI, Basel, Switzerland. This article is an open accessarticle distributed under the terms and conditions of the Creative Commons Attribution(CC BY) license (http://creativecommons.org/licenses/by/4.0/).
74
sustainability
Article
Diversification Models of Sales Activity for SteadyDevelopment of an Enterprise
Nestor Shpak 1, Tamara Kyrylych 1,* and Jolita Greblikaite 2,*
1 Department of Management and International Business Undertakings,Economics and Management Education Research Institute, National University “Lviv Polytechnic”,Metropolitan Andrey street 3, 79013 Lviv, Ukraine; [email protected]
2 Faculty of Economics and Management, Business and Rural Development Management Institute,Aleksandras Stulginskis University, Studentu str. 11, Akademija, 53361 Kaunas, Lithuania
* Correspondence: [email protected] (T.K.); [email protected] (J.G.);Tel.: +38-666-575-299 (T.K.); +37-061-644-615 (J.G.)
Academic Editor: Adam JabłonskiReceived: 10 December 2015; Accepted: 18 April 2016; Published: 21 April 2016
Abstract: The paper substantiates the importance of the optimal directionality choice of salesactivity as one of the main lines of enterprise activity, the functioning of which should be complete,synchronous and complementary. Diversification is one of the powerful instruments to ensure thesteady development of the sales activity of an enterprise. Three models of sales activity diversificationof an enterprise are developed. The first model is based on unveiling the potential of sales channelsand allows us to show the peculiarities of their use. The second model of the optimal quantitativedistribution of production between sales channels is based on profit maximization. This approachnot only takes into account the evaluation of the prescribed parameters of sales channels, but alsoprovides the high profitability of each assortment item and of the whole enterprise. The third modelof the optimal distribution of production between sales channels accounts for the experience ofcollaboration between the enterprise and sales channels during the past period and ensures theminimal risk and appropriate profitability for each sales channel. The proposed models are testedand compared to actual data of the enterprise; the advantages and peculiarities of each modelare discussed.
Keywords: sales activity; diversification; optimal production distribution; sales channels; profitability;business risk
1. Introduction
Market fluctuations are noticeably observed in modern conditions of uncertainty, disbalance anddisproportions between the expected and actual state of the market. A reaction of enterprises on theseprocesses is manifested by the adaptation to such conditions, an active search for new instrumentsand methods, which allow a company to ensure steady development, to confine the competitivepositions and to reduce exogenous and endogenous risks appearing during the economic activity ofmarket entities. One of such instruments providing the steady development of an enterprise consists ofdiversification, which is directed toward expanding the domain of company operation. Diversificationof sales activity is a process of extended use of innovative tools, mechanisms, methods and modelsfor achieving marketing goals and determining optimal sales channels and the optimal distributionof products in each sales channel. Diversification provides an instrument for varying the enterpriseoperation and constructive optimal decision-making to improve enterprise conditions.
Today, more and more companies choose multichannel distribution systems; the use of suchsystems has increased greatly in recent years [1]. It was emphasized in [2] that the increasing complexity
Sustainability 2016, 8, 393; doi:10.3390/su8040393 www.mdpi.com/journal/sustainability75
Sustainability 2016, 8, 393
of the competitive environment requires new approaches to stating company strategy and tactics.Enterprises diversify their sales activities to vary the use of distribution channels and to reducea risk of profit deficiency caused by exploiting only a few sales channels or by cooperation withundisciplined intermediaries.
In this paper, we present three models of sales activity diversification of a company. Section 2includes a review of existing approaches to the selection of sales channels, the conceptual discussionand presentation of models. The potential of sales channels and the peculiarities of their use arediscussed in Section 3. The second approach to the optimal quantitative distribution of productionbetween distribution channels based on profit maximization is considered in Section 4. The third modelof the optimal distribution of production between distribution channels based on risk minimization isdescribed in Section 5. The proposed models are tested and compared to actual data of the company;a comparison of predicted income is presented in Section 6. The advantages and peculiarities of eachmodel are discussed in Section 7. Conclusions are reported in Section 8.
2. Theoretical Framework
The problem of the optimal selection of sales channels has attracted considerable interest ofmany researchers. Coughlan et al. [3] discussed the structure, function, framework, development,maintenance and management of distribution channels to attain significant competitive advantages.Developing relationships between sales channels and control mechanisms in such channels wasreviewed in [4,5]. Nevin [5] emphasized that to be effective in designing channels, marketing managersneed to understand the alternative mechanisms for controlling the individual channel members.Different kinds of consumers and their behavior on a market to provide the effective selling distributionwere analyzed in [6,7]. Various aspects of sales channels choice by consumers have also been studiedin [8–10]. Sutton and Klein [11] considered the optimization of marketing instruments to driveprofitable sales channels of an enterprise. They underlined the need of optimizing the performance ofeach marketing channel (which channels perform better than others?) and of identifying risks andcritical success factors to hit performance targets. Ingene and Parry [12] analyzed channel performance,channel strategy and mathematical models of sales channels. Evaluating channel choice, Magrathand Hardy [13] considered three groups of criteria: efficiency (cost, capacity), effectiveness (coverage,control, competence) and adaptability (flexibility, vitality). Criteria characterizing producers, markets,purchasing peculiarities, goods, intermediaries, customers, behavior of sales channels participants,etc., were examined in [14–18]. Kotler [19] described economical, control and adaptive criteria ofchannels’ evaluation. Criteria for selecting and evaluating intermediaries in indirect sales channelswere discussed in [19–21]. Rolnicki [22] provides a comprehensive list of channel member selectioncriteria, including reputation, business and managerial stability, financial strength, type of marketcoverage, sales competency, etc. Various aspects of the sustainability of distribution channels werediscussed by Dent [23]. Different profit-maximization models for distribution channels were proposedin [24]. Several examples of using the linear programming methods in management were presentedby Anderson et al. [25]. A game-theoretical approach to modeling distribution channels was usedin [26,27].
At the present time, the problem of selecting the best sales channels and arranging the movementof goods in them is still investigated incompletely, especially taking into account the specificity ofUkrainian economic relations. This determines the need of system research ensuring the steadydevelopment of sales activity of enterprises based on diversification principles. Choosing optimalsales channels, enterprises have to deal with a set of questions and problems. To solve these problems,the authors have proposed three approaches to the diversification of sales activity of a company.The presented complex of criteria has been formulated by the authors based on the large amountof literature on this topic, taking into account the practice of sales activity in Ukraine and previousauthors’ investigations. Three models considered in the paper present a new solution of a problemof sales channels’ selection using the present-day mathematical technique. The mathematical tools
76
Sustainability 2016, 8, 393
are known in the literature, but the authors have implemented and adapted these models to existingconditions of enterprise functioning and development taking into account special features of proposedqualitative and quantitative characteristic criteria for comparing direct and indirect sales channels.
The choice of a model depends on the production type, the product life cycle stage, thegoals of an enterprise (maximal profit or minimal risk) and other parameters. The model ofdetermining the sales channel potential assumes comparing the sales channels based on qualitative andquantitative characteristic criteria, which reflect the peculiarities of cooperation between a companyand intermediaries or take into account the sales results of individual direct sales channels. The secondmodel of the optimal quantitative distribution of production between sales channels is based on profitmaximization. This approach not only takes into account the evaluation of the prescribed parametersof sales channels, but also provides the high profitability of each assortment item and of the wholeenterprise. The third model of the optimal distribution of production between sales channels accountsfor the experience of collaboration between the enterprise and sales channels during the past periodand ensures the minimal risk and appropriate profitability for each sales channel.
3. The Model of Determining the Sales Channel Potential
Based on the research mentioned above, the practice of economic entities and our own study [16],the qualitative-quantitative criteria were elaborated for evaluating and comparing the direct andindirect sales channels. The importance of elaborating such criteria was also emphasized by Magrathand Hardy [13]: “Products or services must be graded, assembled, bundled, converted, augmented,promoted, displayed, sold, warranted, repaired, transported, and so on. Any channel of distributioncan be compared in terms of its inherent ability to fulfill such functions”.
As an example, Svitovyr, LLC (Lviv, Ukraine), was considered. The characteristic criteria ofcomparing direct sales channels are presented in Table 1. We also give recommendations for theircalculation. The obtained criteria will be used to compare the direct channels’ potentials using theimproved radar method (see Figure 1a).
Recommendations for the calculation of the qualitative and quantitative characteristic criteria fordirect channels:
(1) The channel having the largest total production turnover gets 10 points; the points of otherchannels are calculated proportionally to the leading channel.
(2) The channel having the largest increase of sales volume gets 10 points; the points of other channelsare calculated proportionally to the leading channel.
(3) The sum of strengths and opportunities positionsThe sum of weaknesses and threats positions .The direct channel having the maximum value of
the ratio gets 10 points; the points of other channels are calculated proportionally to theleading channel.
(4) Independent experts interview top-management representatives of direct sales channels formingthe expert opinion according to a 10-point grading scale.
(5) The direct channel having the lowest markup rate gets 10 points. Points for other channels arecalculated subtracting 0.5 points for every additional 5% of markup rate.
(6) The direct channel having the shortest period of goods delivery from the producer to a consumergets 10 points. Points for other channels are calculated subtracting 0.5 points for everyadditional day.
(7) A secret shopper evaluates sales personnel according to the 10-point grading scale.
(8) Total population of settlements, where production is presentedPopulation of Ukraine .
(9) The leading direct channel gets 10 points; the points of other channels are calculated proportionallyto the leading channel.
(10) The number of months in useThe number of months of company existence .
77
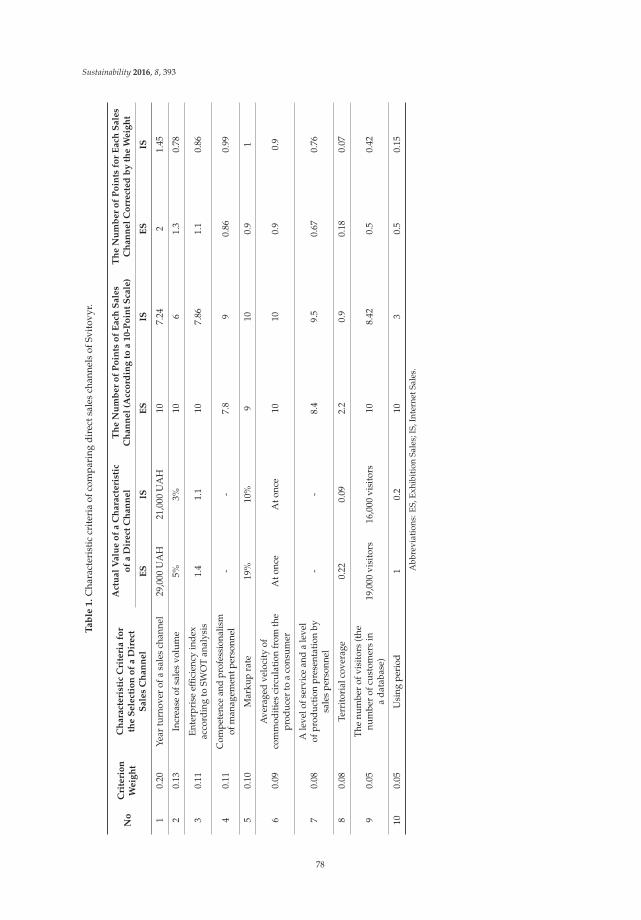
Sustainability 2016, 8, 393
Ta
ble
1.
Cha
ract
eris
tic
crit
eria
ofco
mpa
ring
dire
ctsa
les
chan
nels
ofSv
itov
yr.
No
Cri
teri
on
We
igh
t
Ch
ara
cte
rist
icC
rite
ria
for
the
Se
lect
ion
of
aD
ire
ctS
ale
sC
ha
nn
el
Act
ua
lV
alu
eo
fa
Ch
ara
cte
rist
ico
fa
Dir
ect
Ch
an
ne
lT
he
Nu
mb
er
of
Po
ints
of
Ea
chS
ale
sC
ha
nn
el
(Acc
ord
ing
toa
10
-Po
int
Sca
le)
Th
eN
um
be
ro
fP
oin
tsfo
rE
ach
Sa
les
Ch
an
ne
lC
orr
ect
ed
by
the
We
igh
t
ES
ISE
SIS
ES
IS
10.
20Ye
artu
rnov
erof
asa
les
chan
nel
29,0
00U
AH
21,0
00U
AH
107.
242
1.45
20.
13In
crea
seof
sale
svo
lum
e5%
3%10
61.
30.
78
30.
11En
terp
rise
effic
ienc
yin
dex
acco
rdin
gto
SWO
Tan
alys
is1.
41.
110
7.86
1.1
0.86
40.
11C
ompe
tenc
ean
dpr
ofes
sion
alis
mof
man
agem
entp
erso
nnel
--
7.8
90.
860.
99
50.
10M
arku
pra
te19
%10
%9
100.
91
60.
09A
vera
ged
velo
city
ofco
mm
oditi
esci
rcul
atio
nfr
omth
epr
oduc
erto
aco
nsum
erA
tonc
eA
tonc
e10
100.
90.
9
70.
08A
leve
lofs
ervi
cean
da
leve
lof
prod
ucti
onpr
esen
tati
onby
sale
spe
rson
nel
--
8.4
9.5
0.67
0.76
80.
08Te
rrit
oria
lcov
erag
e0.
220.
092.
20.
90.
180.
07
90.
05Th
enu
mbe
rof
visi
tors
(the
num
ber
ofcu
stom
ers
ina
data
base
)19
,000
visi
tors
16,0
00vi
sito
rs10
8.42
0.5
0.42
100.
05U
sing
peri
od1
0.2
103
0.5
0.15
Abb
revi
atio
ns:E
S,Ex
hibi
tion
Sale
s;IS
,Int
erne
tSal
es.
78
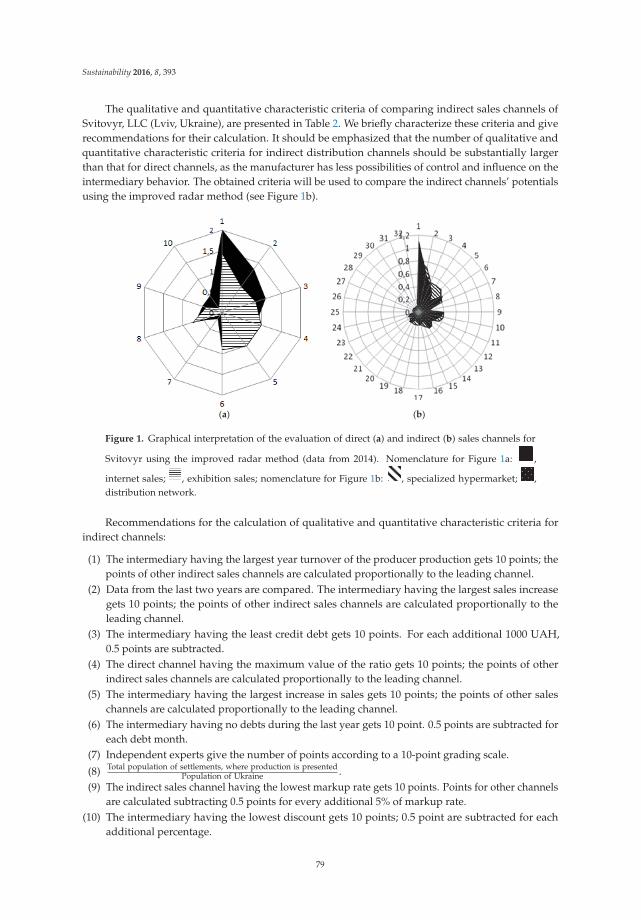
Sustainability 2016, 8, 393
The qualitative and quantitative characteristic criteria of comparing indirect sales channels ofSvitovyr, LLC (Lviv, Ukraine), are presented in Table 2. We briefly characterize these criteria and giverecommendations for their calculation. It should be emphasized that the number of qualitative andquantitative characteristic criteria for indirect distribution channels should be substantially largerthan that for direct channels, as the manufacturer has less possibilities of control and influence on theintermediary behavior. The obtained criteria will be used to compare the indirect channels’ potentialsusing the improved radar method (see Figure 1b).
(a) (b)
Figure 1. Graphical interpretation of the evaluation of direct (a) and indirect (b) sales channels for
Svitovyr using the improved radar method (data from 2014). Nomenclature for Figure 1a: ,,
internet sales; ,, exhibition sales; nomenclature for Figure 1b: ,, specialized hypermarket; ,,distribution network.
Recommendations for the calculation of qualitative and quantitative characteristic criteria forindirect channels:
(1) The intermediary having the largest year turnover of the producer production gets 10 points; thepoints of other indirect sales channels are calculated proportionally to the leading channel.
(2) Data from the last two years are compared. The intermediary having the largest sales increasegets 10 points; the points of other indirect sales channels are calculated proportionally to theleading channel.
(3) The intermediary having the least credit debt gets 10 points. For each additional 1000 UAH,0.5 points are subtracted.
(4) The direct channel having the maximum value of the ratio gets 10 points; the points of otherindirect sales channels are calculated proportionally to the leading channel.
(5) The intermediary having the largest increase in sales gets 10 points; the points of other saleschannels are calculated proportionally to the leading channel.
(6) The intermediary having no debts during the last year gets 10 point. 0.5 points are subtracted foreach debt month.
(7) Independent experts give the number of points according to a 10-point grading scale.
(8) Total population of settlements, where production is presentedPopulation of Ukraine .
(9) The indirect sales channel having the lowest markup rate gets 10 points. Points for other channelsare calculated subtracting 0.5 points for every additional 5% of markup rate.
(10) The intermediary having the lowest discount gets 10 points; 0.5 point are subtracted for eachadditional percentage.
79
Sustainability 2016, 8, 393
(11) Independent experts interview top-management representatives of an indirect sales channelforming the expert opinion according to a 10-point grading scale.
(12) Independent experts give the number of points according to a 10-point grading scale.(13) The intermediary having the lowest freight charges gets 10 points; 0.5 point are subtracted for
each additional 1000 UAH.(14) The intermediary with the largest year turnover gets 10 points; the points of other indirect sales
channels are calculated proportionally to the leading channel.(15) A secret shopper evaluates sales personnel according to a 10-point grading scale.(16) The intermediary having the largest frequency of promotions gets 10 points; the points of other
sales channels are calculated proportionally to the leading channel.(17) The intermediary having the least increase in sales of the analogical production of competitors gets
10 points. The points of other channels are calculated subtracting 0.5 points for each additional5% increase.
(18) The duration of intermediary activity is compared; the leading indirect channel gets 10 points;the points of other indirect sales channels are calculated proportionally to the leading channel.
(19) The part of producer’s costs in joint promotions is compared to that of the intermediary. Thechannel in which the part of producer’s costs is the lowest gets 10 points; the points of otherindirect sales channels are calculated proportionally to the leading channel.
(20) The intermediary having the shortest period of product delivery from the producer to a consumergets 10 points. Points of other channels are calculated subtracting 0.5 points for eachadditional day.
(21) Turnover of producer productionTotal turnover of the intermediary . The indirect channel having the largest ratio gets 10 points; thepoints of other indirect sales channels are calculated proportionally to the leading channel.
(22) The Marketing Department and Sales Department give the number of points according toa 10-point scale.
(23) Independent experts give the number of points according to a 10-point grading scale.(24) Independent experts give the number of points according to a 10-point grading scale.(25) The number of months in use
The number of months of company existence .(26) The dates of the last investment in fixed assets are compared. The indirect channel with the last
investment gets 10 points. The points of other channels are calculated by subtracting one pointfor each year earlier than the leading channel.
(27) The use of ecological modes of transport and the use of rendering plant facilities are estimated.The indirect channel having at least one of the abovementioned items gets 10 points.
(28) The indirect sales channel having no returns gets 10 points. The points for other channels arecalculated subtracting one point for each return.
(29) Independent experts give the number of points according to a 10-point grading scale.
(30) The number of nonstandard situations solved positivelyThe number of nonstandard situations .
(31) The dates of the last purchase are compared. The indirect channel with the latest purchase gets10 points. The points of other channels are calculated subtracting 0.5 points for each month earlierthan the leading channel.
(32) Volumes of the last purchase are compared. The indirect channel with the largest purchasevolume gets 10 points; the points of other indirect sales channels are calculated proportionally tothe leading channel.
80
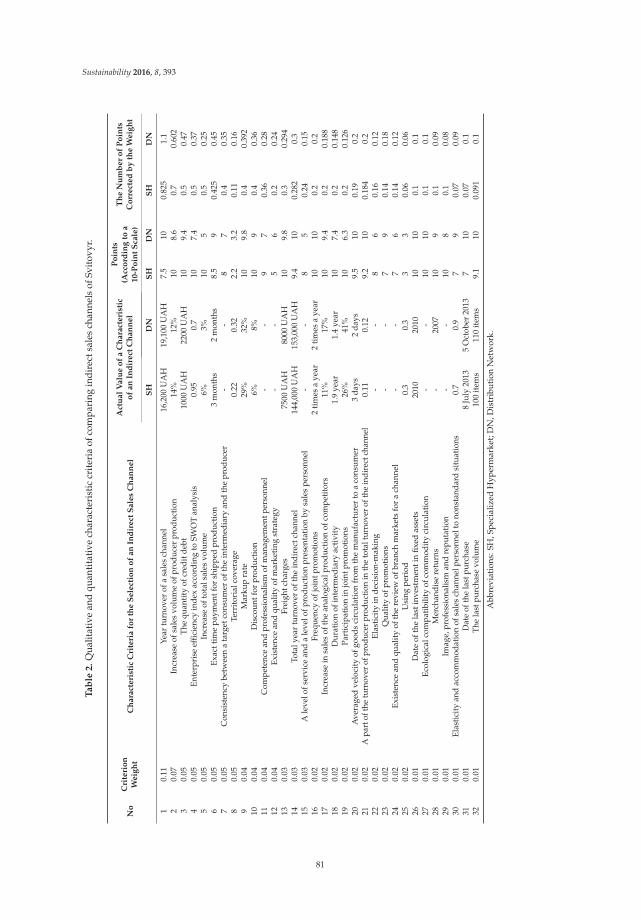
Sustainability 2016, 8, 393
Ta
ble
2.
Qua
litat
ive
and
quan
tita
tive
char
acte
rist
iccr
iter
iaof
com
pari
ngin
dire
ctsa
les
chan
nels
ofSv
itov
yr.
No
Cri
teri
on
We
igh
tC
ha
ract
eri
stic
Cri
teri
afo
rth
eS
ele
ctio
no
fa
nIn
dir
ect
Sa
les
Ch
an
ne
l
Act
ua
lV
alu
eo
fa
Ch
ara
cte
rist
ico
fa
nIn
dir
ect
Ch
an
ne
l
Po
ints
(Acc
ord
ing
toa
10
-Po
int
Sca
le)
Th
eN
um
be
ro
fP
oin
tsC
orr
ect
ed
by
the
We
igh
t
SH
DN
SH
DN
SH
DN
10.
11Ye
artu
rnov
erof
asa
les
chan
nel
16,2
00U
AH
19,1
00U
AH
7.5
100.
825
1.1
20.
07In
crea
seof
sale
svo
lum
eof
prod
ucer
prod
ucti
on14
%12
%10
8.6
0.7
0.60
23
0.05
The
quan
tity
ofcr
edit
debt
1000
UA
H22
00U
AH
109.
40.
50.
474
0.05
Ente
rpri
seef
ficie
ncy
inde
xac
cord
ing
toSW
OT
anal
ysis
0.95
0.7
107.
40.
50.
375
0.05
Incr
ease
ofto
tals
ales
volu
me
6%3%
105
0.5
0.25
60.
05Ex
actt
ime
paym
entf
orsh
ippe
dpr
oduc
tion
3m
onth
s2
mon
ths
8.5
90.
425
0.45
70.
05C
onsi
sten
cybe
twee
na
targ
etco
nsum
erof
the
inte
rmed
iary
and
the
prod
ucer
--
87
0.4
0.35
80.
05Te
rrit
oria
lcov
erag
e0.
220.
322.
23.
20.
110.
169
0.04
Mar
kup
rate
29%
32%
109.
80.
40.
392
100.
04D
isco
untf
orpr
oduc
tion
6%8%
109
0.4
0.36
110.
04C
ompe
tenc
ean
dpr
ofes
sion
alis
mof
man
agem
entp
erso
nnel
--
97
0.36
0.28
120.
04Ex
iste
nce
and
qual
ity
ofm
arke
ting
stra
tegy
--
56
0.2
0.24
130.
03Fr
eigh
tcha
rges
7500
UA
H80
00U
AH
109.
80.
30.
294
140.
03To
taly
ear
turn
over
ofth
ein
dire
ctch
anne
l14
4,00
0U
AH
153,
000
UA
H9.
410
0.28
20.
315
0.03
Ale
velo
fser
vice
and
ale
velo
fpro
duct
ion
pres
enta
tion
bysa
les
pers
onne
l-
-8
50.
240.
1516
0.02
Freq
uenc
yof
join
tpro
mot
ions
2ti
mes
aye
ar2
tim
esa
year
1010
0.2
0.2
170.
02In
crea
sein
sale
sof
the
anal
ogic
alpr
oduc
tion
ofco
mpe
tito
rs11
%17
%10
9.4
0.2
0.18
818
0.02
Dur
atio
nof
inte
rmed
iary
acti
vity
1.9
year
1.4
year
107.
40.
20.
148
190.
02Pa
rtic
ipat
ion
injo
intp
rom
otio
ns26
%41
%10
6.3
0.2
0.12
620
0.02
Ave
rage
dve
loci
tyof
good
sci
rcul
atio
nfr
omth
em
anuf
actu
rer
toa
cons
umer
3da
ys2
days
9.5
100.
190.
221
0.02
Apa
rtof
the
turn
over
ofpr
oduc
erpr
oduc
tion
inth
eto
talt
urno
ver
ofth
ein
dire
ctch
anne
l0.
110.
129.
210
0.18
40.
222
0.02
Elas
tici
tyin
deci
sion
-mak
ing
--
86
0.16
0.12
230.
02Q
ualit
yof
prom
otio
ns-
-7
90.
140.
1824
0.02
Exis
tenc
ean
dqu
alit
yof
the
revi
ewof
bran
chm
arke
tsfo
ra
chan
nel
--
76
0.14
0.12
250.
02U
sing
peri
od0.
30.
33
30.
060.
0626
0.01
Dat
eof
the
last
inve
stm
enti
nfix
edas
sets
2010
2010
1010
0.1
0.1
270.
01Ec
olog
ical
com
pati
bilit
yof
com
mod
ity
circ
ulat
ion
--
1010
0.1
0.1
280.
01M
erch
andi
sere
turn
s-
2007
109
0.1
0.09
290.
01Im
age,
prof
essi
onal
ism
and
repu
tati
on-
-10
80.
10.
0830
0.01
Elas
tici
tyan
dac
com
mod
atio
nof
sale
sch
anne
lper
sonn
elto
nons
tand
ard
situ
atio
ns0.
70.
97
90.
070.
0931
0.01
Dat
eof
the
last
purc
hase
8Ju
ly20
135
Oct
ober
2013
710
0.07
0.1
320.
01Th
ela
stpu
rcha
sevo
lum
e10
0it
ems
110
item
s9.
110
0.09
10.
1
Abb
revi
atio
ns:S
H,S
peci
aliz
edH
yper
mar
ket;
DN
,Dis
trib
utio
nN
etw
ork.
81
Sustainability 2016, 8, 393
On the basis of the described criteria, the direct and indirect channels’ potentials will be compared.The existing radar method [28,29], which does not account for the criterion weights, involves buildinga circle with a radius equal to 10 conventional units. Next, a graphical cyclogram is constructed atthe radial axis at which the criteria values are marked. These marks are connected creating a polygon(the number of axes is equal to the number of criteria). The proposed improved radar method [16]consists of building a circle with a radius equal to the maximum value of all of the criteria, sortingthe criteria into groups according to the weight decrease and according to points adjusted by theweight coefficient. It should be mentioned that the recommended values of criteria weights reflecttheir significance and are set based on the experience of enterprise activity. At the radial axis of thegraphical cyclogram, the criteria values corrected by their weights are marked. The area Sp of theobtained polygon is determined as follows:
Sp “ sin` 2π
n˘ pa1 ˆ γ1 ˆ a2 ˆ γ2 ` a2 ˆ γ2 ˆ a3 ˆ γ3 ` a3 ˆ γ3 ˆ a4 ˆ γ4 ` ...`
`an´1 ˆ γn´1 ˆ an ˆ γn ` an ˆ γn ˆ a1 ˆ γ1q ˆ 0.5(1)
where n is the number of criteria, αi is the value of the i-th characteristic criterion and γi denotes theweight coefficient of the i-th criterion.
Comparison of sales channels is carried out using the generalized characteristic index Yk which iscalculated as:
Yk “ Sp
Sc(2)
In this equation, Sc is the area of a circle with a radius equal to the maximal value of all of theweighted criteria (r “ max pai ˚ γiq). The greater is the value of Yk , the more profitable is the saleschannel (see Figure 1).
Based on graphical evaluation of the direct and indirect sales channels of Svitovyr, usingthe improved radar method, the correspondence between the actual and reference values of thecharacteristics of sales channels are presented in Table 3.
The analysis of the obtained results for Svitovyr allows us to conclude that exhibition sales hasthe largest potential among the direct sales channels, as its level of correspondence between the actualand reference values of the characteristics is equal to 0.125. According to this model, specializedhypermarket has the largest potential among the indirect sales channels, as its level of correspondencebetween the actual and reference values of the characteristics is equal to 0.067.
The recommended percentage of production distribution between the direct sales channelscalculated on the basis of generalized characteristic indices is the following: 55% for exhibitionsales and 45% for internet sales; whereas the recommended percentage of production distributionbetween the indirect sales channels is the following: 67% for specialized hypermarket and 33% fordistribution network.
Actual values of income per unit and actual sales volumes of three-phase and single-phasetransformers for direct and indirect distribution channels of Svitovyr, LLC (Lviv, Ukraine), arepresented in Table 4.
The recommended sales volumes for the three-phase and single-phase transformers obtained onthe basis of the considered model are shown in Table 5.
82
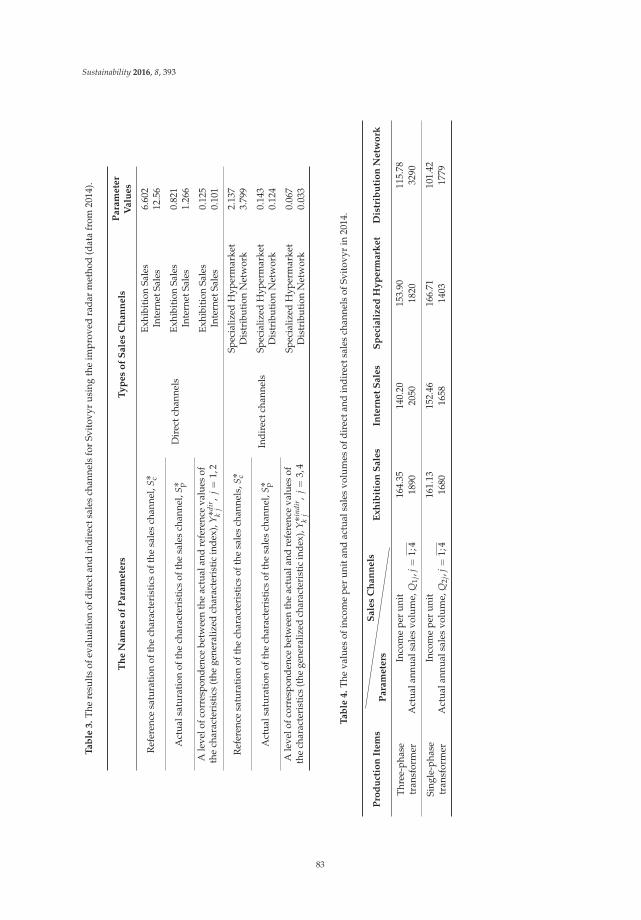
Sustainability 2016, 8, 393
Ta
ble
3.
The
resu
lts
ofev
alua
tion
ofdi
rect
and
indi
rect
sale
sch
anne
lsfo
rSv
itov
yrus
ing
the
impr
oved
rada
rm
etho
d(d
ata
from
2014
).
Th
eN
am
es
of
Pa
ram
ete
rsT
yp
es
of
Sa
les
Ch
an
ne
lsP
ara
me
ter
Va
lue
s
Ref
eren
cesa
tura
tion
ofth
ech
arac
teri
stic
sof
the
sale
sch
anne
l,S c
Dir
ectc
hann
els
Exhi
biti
onSa
les
6.60
2In
tern
etSa
les
12.5
6
Act
uals
atur
atio
nof
the
char
acte
rist
ics
ofth
esa
les
chan
nel,
S pEx
hibi
tion
Sale
s0.
821
Inte
rnet
Sale
s1.
266
Ale
velo
fcor
resp
onde
nce
betw
een
the
actu
alan
dre
fere
nce
valu
esof
the
char
acte
rist
ics
(the
gene
raliz
edch
arac
teri
stic
inde
x),Y
˚dir
kj
,j“
1,2
Exhi
biti
onSa
les
0.12
5In
tern
etSa
les
0.10
1
Ref
eren
cesa
tura
tion
ofth
ech
arac
teri
stic
sof
the
sale
sch
anne
ls,S
c
Indi
rect
chan
nels
Spec
ializ
edH
yper
mar
ket
2.13
7D
istr
ibut
ion
Net
wor
k3.
799
Act
uals
atur
atio
nof
the
char
acte
rist
ics
ofth
esa
les
chan
nel,
S pSp
ecia
lized
Hyp
erm
arke
t0.
143
Dis
trib
utio
nN
etw
ork
0.12
4
Ale
velo
fcor
resp
onde
nce
betw
een
the
actu
alan
dre
fere
nce
valu
esof
the
char
acte
rist
ics
(the
gene
raliz
edch
arac
teri
stic
inde
x),Y
˚ind
irk
j,
j“3,
4Sp
ecia
lized
Hyp
erm
arke
t0.
067
Dis
trib
utio
nN
etw
ork
0.03
3
Ta
ble
4.
The
valu
esof
inco
me
per
unit
and
actu
alsa
les
volu
mes
ofdi
rect
and
indi
rect
sale
sch
anne
lsof
Svit
ovyr
in20
14.
Pro
du
ctio
nIt
em
sP
ara
me
ters
Sa
les
Ch
an
ne
lsE
xh
ibit
ion
Sa
les
Inte
rne
tS
ale
sS
pe
cia
liz
ed
Hy
pe
rma
rke
tD
istr
ibu
tio
nN
etw
ork
Thre
e-ph
ase
tran
sfor
mer
Inco
me
per
unit
164.
3514
0.20
153.
9011
5.78
Act
uala
nnua
lsal
esvo
lum
e,Q
1j,j
“1;
418
9020
5018
2032
90
Sing
le-p
hase
tran
sfor
mer
Inco
me
per
unit
161.
1315
2.46
166.
7110
1.42
Act
uala
nnua
lsal
esvo
lum
e,Q
2j,j
“1;
416
8016
5814
0317
79
83
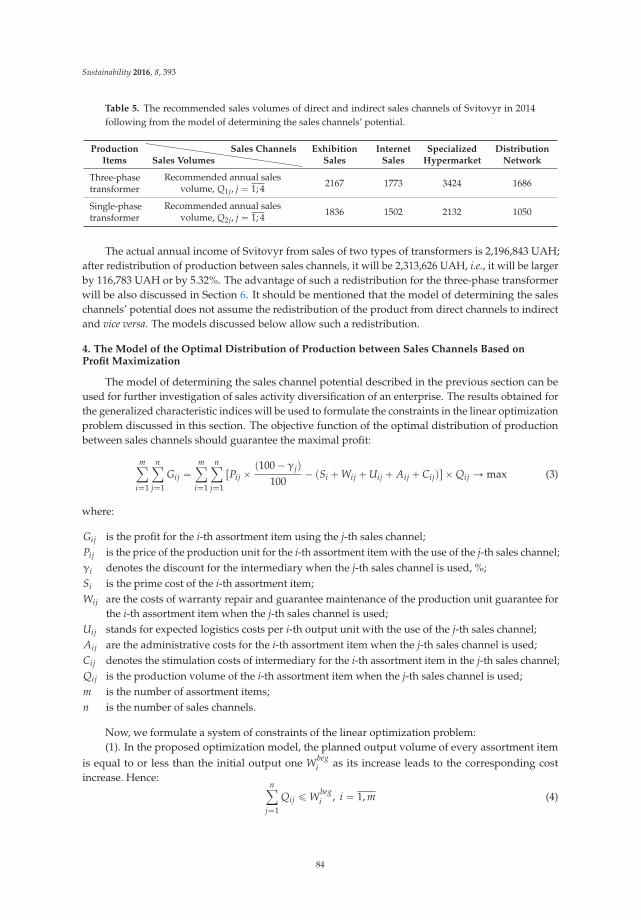
Sustainability 2016, 8, 393
Table 5. The recommended sales volumes of direct and indirect sales channels of Svitovyr in 2014following from the model of determining the sales channels’ potential.
ProductionItems Sales Volumes
Sales Channels ExhibitionSales
InternetSales
SpecializedHypermarket
DistributionNetwork
Three-phasetransformer
Recommended annual salesvolume, Q1j, j “ 1; 4 2167 1773 3424 1686
Single-phasetransformer
Recommended annual salesvolume, Q2j, j “ 1; 4 1836 1502 2132 1050
The actual annual income of Svitovyr from sales of two types of transformers is 2,196,843 UAH;after redistribution of production between sales channels, it will be 2,313,626 UAH, i.e., it will be largerby 116,783 UAH or by 5.32%. The advantage of such a redistribution for the three-phase transformerwill be also discussed in Section 6. It should be mentioned that the model of determining the saleschannels’ potential does not assume the redistribution of the product from direct channels to indirectand vice versa. The models discussed below allow such a redistribution.
4. The Model of the Optimal Distribution of Production between Sales Channels Based onProfit Maximization
The model of determining the sales channel potential described in the previous section can beused for further investigation of sales activity diversification of an enterprise. The results obtained forthe generalized characteristic indices will be used to formulate the constraints in the linear optimizationproblem discussed in this section. The objective function of the optimal distribution of productionbetween sales channels should guarantee the maximal profit:
mÿi“1
nÿj“1
Gij “mÿ
i“1
nÿj“1
rPij ˆ p100 ´ γjq100
´ pSi ` Wij ` Uij ` Aij ` Cijqs ˆ Qij Ñ max (3)
where:
Gij is the profit for the i-th assortment item using the j-th sales channel;Pij is the price of the production unit for the i-th assortment item with the use of the j-th sales channel;γi denotes the discount for the intermediary when the j-th sales channel is used, %;Si is the prime cost of the i-th assortment item;Wij are the costs of warranty repair and guarantee maintenance of the production unit guarantee for
the i-th assortment item when the j-th sales channel is used;Uij stands for expected logistics costs per i-th output unit with the use of the j-th sales channel;Aij are the administrative costs for the i-th assortment item when the j-th sales channel is used;Cij denotes the stimulation costs of intermediary for the i-th assortment item in the j-th sales channel;Qij is the production volume of the i-th assortment item when the j-th sales channel is used;m is the number of assortment items;n is the number of sales channels.
Now, we formulate a system of constraints of the linear optimization problem:(1). In the proposed optimization model, the planned output volume of every assortment item
is equal to or less than the initial output one Wbegi as its increase leads to the corresponding cost
increase. Hence:nÿ
j“1
Qij ď Wbegi , i “ 1, m (4)
84
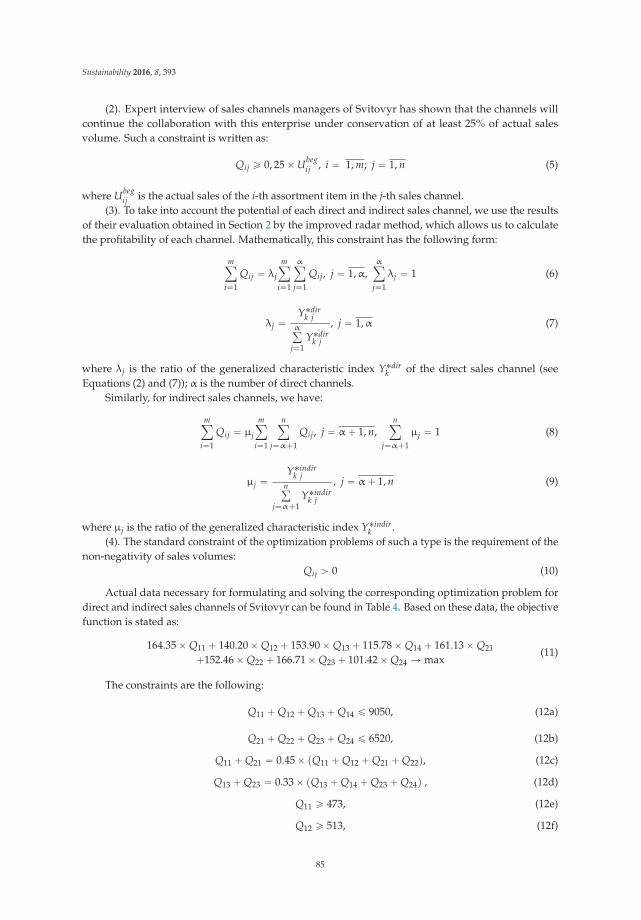
Sustainability 2016, 8, 393
(2). Expert interview of sales channels managers of Svitovyr has shown that the channels willcontinue the collaboration with this enterprise under conservation of at least 25% of actual salesvolume. Such a constraint is written as:
Qij ě 0, 25 ˆ Ubegij , i “ 1, m; j “ 1, n (5)
where Ubegij is the actual sales of the i-th assortment item in the j-th sales channel.
(3). To take into account the potential of each direct and indirect sales channel, we use the resultsof their evaluation obtained in Section 2 by the improved radar method, which allows us to calculatethe profitability of each channel. Mathematically, this constraint has the following form:
mÿi“1
Qij “ λj
mÿi“1
αÿj“1
Qij, j “ 1,α,αÿ
j“1
λj “ 1 (6)
λj “Y˚dir
k jαř
j“1Y˚dir
k j
, j “ 1,α (7)
where λj is the ratio of the generalized characteristic index Y˚dirk of the direct sales channel (see
Equations (2) and (7)); α is the number of direct channels.Similarly, for indirect sales channels, we have:
mÿi“1
Qij “ μj
mÿi“1
nÿj“α`1
Qij, j “ α ` 1, n,nÿ
j“α`1
μj “ 1 (8)
μj “Y˚indir
k jnř
j“α`1Y˚indir
k j
, j “ α ` 1, n (9)
where μj is the ratio of the generalized characteristic index Y˚indirk .
(4). The standard constraint of the optimization problems of such a type is the requirement of thenon-negativity of sales volumes:
Qij ą 0 (10)
Actual data necessary for formulating and solving the corresponding optimization problem fordirect and indirect sales channels of Svitovyr can be found in Table 4. Based on these data, the objectivefunction is stated as:
164.35 ˆ Q11 ` 140.20 ˆ Q12 ` 153.90 ˆ Q13 ` 115.78 ˆ Q14 ` 161.13 ˆ Q21
`152.46 ˆ Q22 ` 166.71 ˆ Q23 ` 101.42 ˆ Q24 Ñ max(11)
The constraints are the following:
Q11 ` Q12 ` Q13 ` Q14 ď 9050, (12a)
Q21 ` Q22 ` Q23 ` Q24 ď 6520, (12b)
Q11 ` Q21 “ 0.45 ˆ pQ11 ` Q12 ` Q21 ` Q22q, (12c)
Q13 ` Q23 “ 0.33 ˆ pQ13 ` Q14 ` Q23 ` Q24q , (12d)
Q11 ě 473, (12e)
Q12 ě 513, (12f)
85
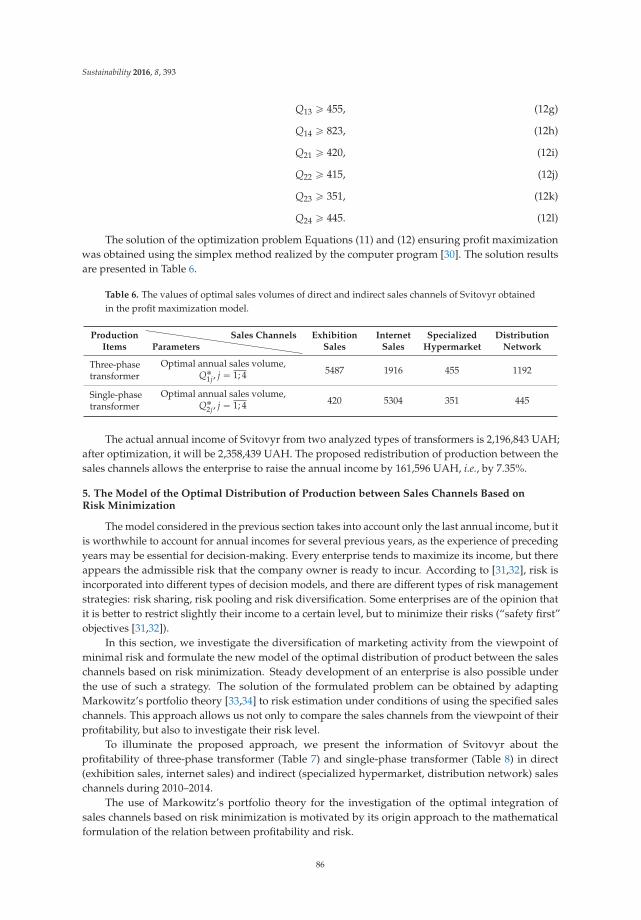
Sustainability 2016, 8, 393
Q13 ě 455, (12g)
Q14 ě 823, (12h)
Q21 ě 420, (12i)
Q22 ě 415, (12j)
Q23 ě 351, (12k)
Q24 ě 445. (12l)
The solution of the optimization problem Equations (11) and (12) ensuring profit maximizationwas obtained using the simplex method realized by the computer program [30]. The solution resultsare presented in Table 6.
Table 6. The values of optimal sales volumes of direct and indirect sales channels of Svitovyr obtainedin the profit maximization model.
ProductionItems Parameters
Sales Channels ExhibitionSales
InternetSales
SpecializedHypermarket
DistributionNetwork
Three-phasetransformer
Optimal annual sales volume,Q1j, j “ 1; 4 5487 1916 455 1192
Single-phasetransformer
Optimal annual sales volume,Q2j, j “ 1; 4 420 5304 351 445
The actual annual income of Svitovyr from two analyzed types of transformers is 2,196,843 UAH;after optimization, it will be 2,358,439 UAH. The proposed redistribution of production between thesales channels allows the enterprise to raise the annual income by 161,596 UAH, i.e., by 7.35%.
5. The Model of the Optimal Distribution of Production between Sales Channels Based onRisk Minimization
The model considered in the previous section takes into account only the last annual income, but itis worthwhile to account for annual incomes for several previous years, as the experience of precedingyears may be essential for decision-making. Every enterprise tends to maximize its income, but thereappears the admissible risk that the company owner is ready to incur. According to [31,32], risk isincorporated into different types of decision models, and there are different types of risk managementstrategies: risk sharing, risk pooling and risk diversification. Some enterprises are of the opinion thatit is better to restrict slightly their income to a certain level, but to minimize their risks (“safety first”objectives [31,32]).
In this section, we investigate the diversification of marketing activity from the viewpoint ofminimal risk and formulate the new model of the optimal distribution of product between the saleschannels based on risk minimization. Steady development of an enterprise is also possible underthe use of such a strategy. The solution of the formulated problem can be obtained by adaptingMarkowitz’s portfolio theory [33,34] to risk estimation under conditions of using the specified saleschannels. This approach allows us not only to compare the sales channels from the viewpoint of theirprofitability, but also to investigate their risk level.
To illuminate the proposed approach, we present the information of Svitovyr about theprofitability of three-phase transformer (Table 7) and single-phase transformer (Table 8) in direct(exhibition sales, internet sales) and indirect (specialized hypermarket, distribution network) saleschannels during 2010–2014.
The use of Markowitz’s portfolio theory for the investigation of the optimal integration ofsales channels based on risk minimization is motivated by its origin approach to the mathematicalformulation of the relation between profitability and risk.
86
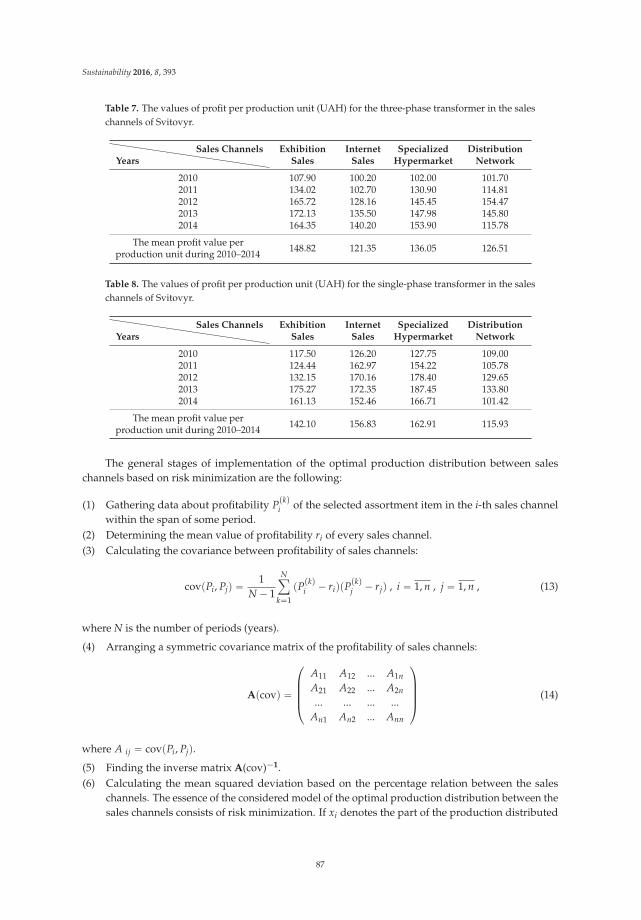
Sustainability 2016, 8, 393
Table 7. The values of profit per production unit (UAH) for the three-phase transformer in the saleschannels of Svitovyr.
YearsSales Channels Exhibition
SalesInternet
SalesSpecialized
HypermarketDistribution
Network
2010 107.90 100.20 102.00 101.702011 134.02 102.70 130.90 114.812012 165.72 128.16 145.45 154.472013 172.13 135.50 147.98 145.802014 164.35 140.20 153.90 115.78
The mean profit value perproduction unit during 2010–2014 148.82 121.35 136.05 126.51
Table 8. The values of profit per production unit (UAH) for the single-phase transformer in the saleschannels of Svitovyr.
YearsSales Channels Exhibition
SalesInternet
SalesSpecialized
HypermarketDistribution
Network
2010 117.50 126.20 127.75 109.002011 124.44 162.97 154.22 105.782012 132.15 170.16 178.40 129.652013 175.27 172.35 187.45 133.802014 161.13 152.46 166.71 101.42
The mean profit value perproduction unit during 2010–2014 142.10 156.83 162.91 115.93
The general stages of implementation of the optimal production distribution between saleschannels based on risk minimization are the following:
(1) Gathering data about profitability Ppkqi of the selected assortment item in the i-th sales channel
within the span of some period.(2) Determining the mean value of profitability ri of every sales channel.(3) Calculating the covariance between profitability of sales channels:
covpPi, Pjq “ 1N ´ 1
Nÿk“1
pPpkqi ´ riqpPpkq
j ´ rjq , i “ 1, n , j “ 1, n , (13)
where N is the number of periods (years).
(4) Arranging a symmetric covariance matrix of the profitability of sales channels:
Apcovq “
¨˚˝
A11 A12 ... A1nA21 A22 ... A2n... ... ... ...
An1 An2 ... Ann
˛‹‹‹‚ (14)
where A ij “ covpPi, Pjq.
(5) Finding the inverse matrix A(cov)´1.(6) Calculating the mean squared deviation based on the percentage relation between the sales
channels. The essence of the considered model of the optimal production distribution between thesales channels consists of risk minimization. If xi denotes the part of the production distributed
87
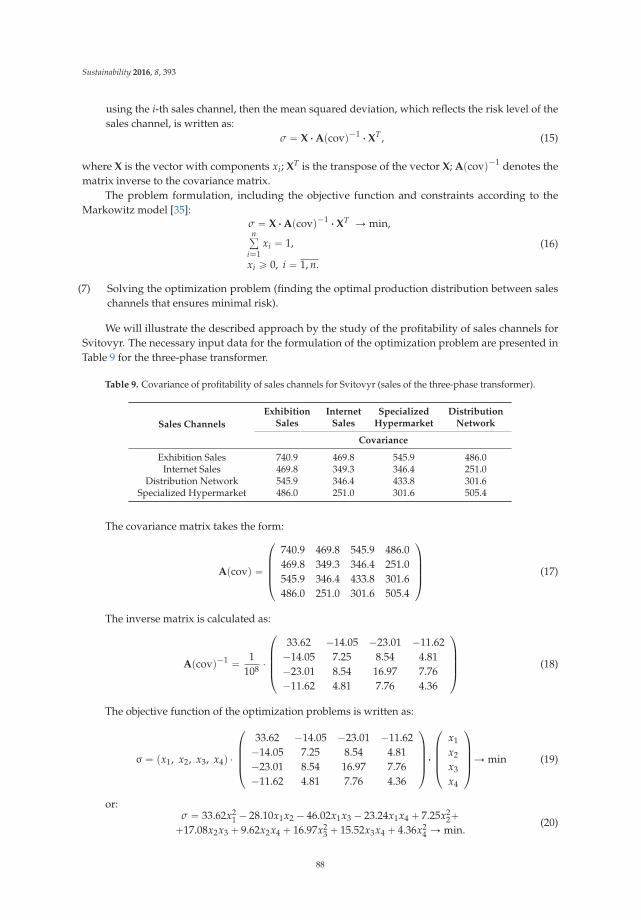
Sustainability 2016, 8, 393
using the i-th sales channel, then the mean squared deviation, which reflects the risk level of thesales channel, is written as:
σ “ X ¨ Apcovq´1 ¨ XT , (15)
where X is the vector with components xi; XT is the transpose of the vector X; Apcovq´1 denotes thematrix inverse to the covariance matrix.
The problem formulation, including the objective function and constraints according to theMarkowitz model [35]:
σ “ X ¨ Apcovq´1 ¨ XT Ñ min,nř
i“1xi “ 1,
xi ě 0, i “ 1, n.
(16)
(7) Solving the optimization problem (finding the optimal production distribution between saleschannels that ensures minimal risk).
We will illustrate the described approach by the study of the profitability of sales channels forSvitovyr. The necessary input data for the formulation of the optimization problem are presented inTable 9 for the three-phase transformer.
Table 9. Covariance of profitability of sales channels for Svitovyr (sales of the three-phase transformer).
Sales Channels
ExhibitionSales
InternetSales
SpecializedHypermarket
DistributionNetwork
Covariance
Exhibition Sales 740.9 469.8 545.9 486.0Internet Sales 469.8 349.3 346.4 251.0
Distribution Network 545.9 346.4 433.8 301.6Specialized Hypermarket 486.0 251.0 301.6 505.4
The covariance matrix takes the form:
Apcovq “
¨˚˝
740.9 469.8 545.9 486.0469.8 349.3 346.4 251.0545.9 346.4 433.8 301.6486.0 251.0 301.6 505.4
˛‹‹‹‚ (17)
The inverse matrix is calculated as:
Apcovq´1 “ 1108 ¨
¨˚˝
33.62 ´14.05 ´23.01 ´11.62´14.05 7.25 8.54 4.81´23.01 8.54 16.97 7.76´11.62 4.81 7.76 4.36
˛‹‹‹‚ (18)
The objective function of the optimization problems is written as:
σ “ px1, x2, x3, x4q ¨
¨˚˝
33.62 ´14.05 ´23.01 ´11.62´14.05 7.25 8.54 4.81´23.01 8.54 16.97 7.76´11.62 4.81 7.76 4.36
˛‹‹‹‚¨
¨˚˝
x1
x2
x3
x4
˛‹‹‹‚Ñ min (19)
or:σ “ 33.62x2
1 ´ 28.10x1x2 ´ 46.02x1x3 ´ 23.24x1x4 ` 7.25x22`
`17.08x2x3 ` 9.62x2x4 ` 16.97x23 ` 15.52x3x4 ` 4.36x2
4 Ñ min.(20)
88
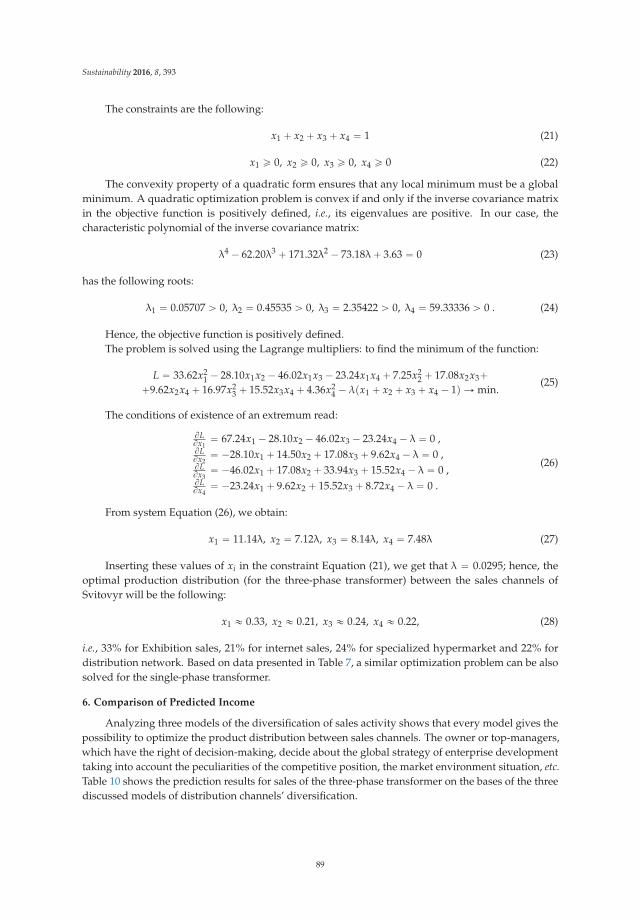
Sustainability 2016, 8, 393
The constraints are the following:
x1 ` x2 ` x3 ` x4 “ 1 (21)
x1 ě 0, x2 ě 0, x3 ě 0, x4 ě 0 (22)
The convexity property of a quadratic form ensures that any local minimum must be a globalminimum. A quadratic optimization problem is convex if and only if the inverse covariance matrixin the objective function is positively defined, i.e., its eigenvalues are positive. In our case, thecharacteristic polynomial of the inverse covariance matrix:
λ4 ´ 62.20λ3 ` 171.32λ2 ´ 73.18λ ` 3.63 “ 0 (23)
has the following roots:
λ1 “ 0.05707 ą 0, λ2 “ 0.45535 ą 0, λ3 “ 2.35422 ą 0, λ4 “ 59.33336 ą 0 . (24)
Hence, the objective function is positively defined.The problem is solved using the Lagrange multipliers: to find the minimum of the function:
L “ 33.62x21 ´ 28.10x1x2 ´ 46.02x1x3 ´ 23.24x1x4 ` 7.25x2
2 ` 17.08x2x3``9.62x2x4 ` 16.97x2
3 ` 15.52x3x4 ` 4.36x24 ´ λpx1 ` x2 ` x3 ` x4 ´ 1q Ñ min.
(25)
The conditions of existence of an extremum read:
BLBx1“ 67.24x1 ´ 28.10x2 ´ 46.02x3 ´ 23.24x4 ´ λ “ 0 ,
BLBx2“ ´28.10x1 ` 14.50x2 ` 17.08x3 ` 9.62x4 ´ λ “ 0 ,
BLBx3“ ´46.02x1 ` 17.08x2 ` 33.94x3 ` 15.52x4 ´ λ “ 0 ,
BLBx4“ ´23.24x1 ` 9.62x2 ` 15.52x3 ` 8.72x4 ´ λ “ 0 .
(26)
From system Equation (26), we obtain:
x1 “ 11.14λ, x2 “ 7.12λ, x3 “ 8.14λ, x4 “ 7.48λ (27)
Inserting these values of xi in the constraint Equation (21), we get that λ “ 0.0295; hence, theoptimal production distribution (for the three-phase transformer) between the sales channels ofSvitovyr will be the following:
x1 « 0.33, x2 « 0.21, x3 « 0.24, x4 « 0.22, (28)
i.e., 33% for Exhibition sales, 21% for internet sales, 24% for specialized hypermarket and 22% fordistribution network. Based on data presented in Table 7, a similar optimization problem can be alsosolved for the single-phase transformer.
6. Comparison of Predicted Income
Analyzing three models of the diversification of sales activity shows that every model gives thepossibility to optimize the product distribution between sales channels. The owner or top-managers,which have the right of decision-making, decide about the global strategy of enterprise developmenttaking into account the peculiarities of the competitive position, the market environment situation, etc.Table 10 shows the prediction results for sales of the three-phase transformer on the bases of the threediscussed models of distribution channels’ diversification.
89
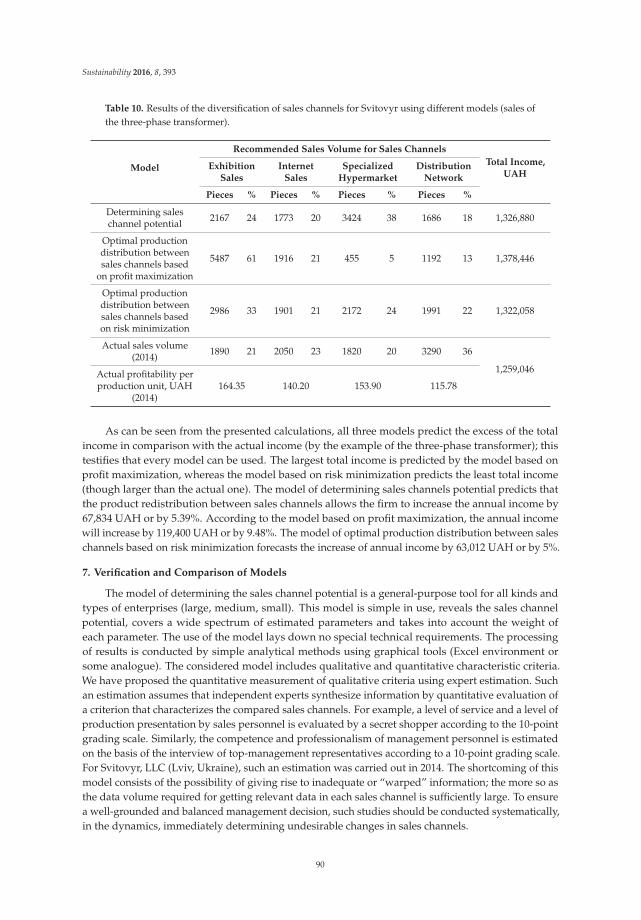
Sustainability 2016, 8, 393
Table 10. Results of the diversification of sales channels for Svitovyr using different models (sales ofthe three-phase transformer).
Model
Recommended Sales Volume for Sales Channels
Total Income,UAH
ExhibitionSales
InternetSales
SpecializedHypermarket
DistributionNetwork
Pieces % Pieces % Pieces % Pieces %
Determining saleschannel potential 2167 24 1773 20 3424 38 1686 18 1,326,880
Optimal productiondistribution betweensales channels based
on profit maximization
5487 61 1916 21 455 5 1192 13 1,378,446
Optimal productiondistribution betweensales channels basedon risk minimization
2986 33 1901 21 2172 24 1991 22 1,322,058
Actual sales volume(2014) 1890 21 2050 23 1820 20 3290 36
1,259,046Actual profitability perproduction unit, UAH
(2014)164.35 140.20 153.90 115.78
As can be seen from the presented calculations, all three models predict the excess of the totalincome in comparison with the actual income (by the example of the three-phase transformer); thistestifies that every model can be used. The largest total income is predicted by the model based onprofit maximization, whereas the model based on risk minimization predicts the least total income(though larger than the actual one). The model of determining sales channels potential predicts thatthe product redistribution between sales channels allows the firm to increase the annual income by67,834 UAH or by 5.39%. According to the model based on profit maximization, the annual incomewill increase by 119,400 UAH or by 9.48%. The model of optimal production distribution between saleschannels based on risk minimization forecasts the increase of annual income by 63,012 UAH or by 5%.
7. Verification and Comparison of Models
The model of determining the sales channel potential is a general-purpose tool for all kinds andtypes of enterprises (large, medium, small). This model is simple in use, reveals the sales channelpotential, covers a wide spectrum of estimated parameters and takes into account the weight ofeach parameter. The use of the model lays down no special technical requirements. The processingof results is conducted by simple analytical methods using graphical tools (Excel environment orsome analogue). The considered model includes qualitative and quantitative characteristic criteria.We have proposed the quantitative measurement of qualitative criteria using expert estimation. Suchan estimation assumes that independent experts synthesize information by quantitative evaluation ofa criterion that characterizes the compared sales channels. For example, a level of service and a level ofproduction presentation by sales personnel is evaluated by a secret shopper according to the 10-pointgrading scale. Similarly, the competence and professionalism of management personnel is estimatedon the basis of the interview of top-management representatives according to a 10-point grading scale.For Svitovyr, LLC (Lviv, Ukraine), such an estimation was carried out in 2014. The shortcoming of thismodel consists of the possibility of giving rise to inadequate or “warped” information; the more so asthe data volume required for getting relevant data in each sales channel is sufficiently large. To ensurea well-grounded and balanced management decision, such studies should be conducted systematically,in the dynamics, immediately determining undesirable changes in sales channels.
90
Sustainability 2016, 8, 393
The model of the optimal distribution of production between sales channels based on profitmaximization ensures the maximal profit of an enterprise by choosing the most profitable saleschannel. The advantages of this model are the following: the accuracy of the obtained results, a highlevel of their processing, the possibility of formulating additional constraints according to the needsand interests of a company, the possibility of comparing current and potential sales channels, thepossibility of changing undisciplined intermediaries and redistributing production into more profitabledirect and indirect sales channels. The shortcomings of the considered model are connected with theneed to have specialists in linear programming, the risk of sales channel “overestimation” and thefailure to take account of dynamic conditions.
The model of the optimal distribution of production between sales channels based on riskminimization is helpful for enterprises of those countries, the economy of which develops underindeterminate and chaotic conditions. This model can also be used when the product life cycle is atan initial stage and when an enterprise tries to enter into a new market where gathering information iscomplicated and there is high probability of product “aversion” by customers. The advantages of thismodel consist of the balance of risks and profits in the selection of the optimal sales channel and inelimination of the influence of subjective factors. The shortcomings of this model are connected withthe threat of profit deficiency due to “underestimation” of the future sales channel potential and withthe need of invoking experts-mathematicians to formulate a one-off optimization problem or the needfor employing one’s own specialists in this field.
8. Conclusions
Steady development of an enterprise is ensured by harmonious, synchronous and complementaryrealization of all of the directions of company activity. Our paper is devoted to one of such directions:sales activity. Mathematical modeling provides the tools for the optimal choice of sales channels basedon diversification. Three models of such a choice have been proposed: the model of determiningsales channels’ potential, the model based on profit maximization and the model of the optimalproduction distribution between sales channels based on risk minimization. The first model allows usto throw light on the potential of sales channel, to show the peculiarities of its use and to introduce thequalitative and quantitative characteristic criteria for comparing direct and indirect sales channels.
To ensure steady development of a company, it is necessary not only to determine the keyparameters of sales channels, but also to provide high profitability of every assortment item, as wellas high profitability of the whole enterprise. The second model solves this problem as a problem oflinear optimization. At the same time, the second model takes into account only current profitabilityand does not consider the comparison with the previous periods. This aspect is investigated by thethird model based on accounting for the experience of the previous periods and risk minimization.The use of every model forecasts larger income than that brought by the current product distribution.The proposed models can be used by individual enterprises, as well as by consulting companies thatoffer facility for analysis and optimization of sales activity.
Author Contributions: All authors contributed equally to this work for drafting the paper, reviewing relevantstudies, compiling and analyzing the data. All authors wrote, reviewed and commented on the manuscript.All authors have read and approved the final manuscript.
Conflicts of Interest: The authors declare no conflict of interest.
References
1. Kotler, P.; Armstrong, G. Principles of Marketing, 12th ed.; Prentice Hall: Upper Saddle River, NJ, USA, 2008.2. Lambin, J.J.; Schuiling, I. Market.-Driven Management: Strategic and Operational Marketing, 3rd ed.; Palgrave
Macmillan: London, UK, 2012.3. Coughlan, A.T.; Anderson, E.; Stern, L.W.; El-Ansary, A.I. Marketing Channels, 7th ed.; Prentice Hall: Upper
Saddle River, NJ, USA, 2006.
91
Sustainability 2016, 8, 393
4. Weitz, B.A.; Jap, S.D. Relationship marketing and distribution channels. J. Acad. Mark. Sci. 1995, 23, 305–320.[CrossRef]
5. Nevin, J.R. Relationship marketing and distribution channels: Exploring fundamental issues. J. Acad.Mark. Sci. 1995, 23, 327–334. [CrossRef]
6. Jobber, D.; Lancaster, G. Selling and Sales Management, 8th ed.; Prentice Hall: London, UK, 2009.7. Trenz, M. Multichannel Commerce: A Consumer Perspective on the Integration of Physical and Electronic Channels;
Springer: Heidelberg, Germany, 2015.8. Gupta, A.; Su, B.; Walter, Z. Risk profile and consumer shopping behavior in electronic and traditional
channels. Decis. Support. Syst. 2004, 38, 347–367. [CrossRef]9. Konus, U.; Verhoef, P.C.; Neslin, S.A. Multichannel shopper segments and their covariates. J. Retail. 2008, 84,
398–413. [CrossRef]10. Verhagen, T.; van Dolen, W. Online purchase intentions: A multi-channel store image perspectives. Inf. Manag.
2009, 46, 77–82. [CrossRef]11. Sutton, D.; Klein, T. Enterprise Marketing Management: The New Science of Marketing; John Wiley & Sons:
Hoboken, NJ, USA, 2003.12. Ingene, C.A.; Parry, M.E. Mathematical Models of Distribution Channels; Kluwer Academic Publishers: Boston,
MA, USA, 2005.13. Magrath, A.J.; Hardy, K.H. Selecting sales and distribution channels. Ind. Mark. Manag. 1987, 16, 273–278.
[CrossRef]14. Hertsyk, V.A. Distribution Management of Enterprise Production; Volodymyr Dahl East Ukrainian National
University: Luhansk, Ukraine, 2011. (In Ukrainian)15. Kovalchuk, S.V., Ed.; Marketing Innovations in Economics and Business; Poligrafist-2: Khmelnytskyi, Ukraine,
2013; pp. 1–321. (In Ukrainian)16. Shpak, N.; Kyrylych, T. Sales channels selection for small industrial enterprises based on qualitative-
quantitative characteristic criteria. Int. Quart. J. Econ. Technol. New Technol. Model. Process. 2013, 2, 79–88.17. Shpak, N.O.; Kyrylych, T. The method of optimal planning of distribution activity for small industrial
enterprises. Econ. State 2014, 4, 15–22. (In Ukraininan)18. Emrich, C. Multi-Channel Communications- und Marketing-Management; Gabler Verlag: Wiesbaden,
Germany, 2008.19. Kotler, P. Marketing Management: Millenium, 10th ed.; Prentice Hall: Upper Saddle River, NJ, USA, 2000.20. Capon, N.; Capon, R.; Hulbert, J.M. Managing Marketing in the 21st Century: Developing & Implementing the
Market. Strategy; Wessex: Bronxville, NY, USA, 2009.21. Kotler, P.; Armstrong, G.; Harris, L.C.; Piercy, N. Principles of Marketing, 6th European ed.; Pearson: Harlow,
UK, 2013.22. Rolnicki, K. Managing Channels of Distribution: The Marketing Executive’s Complete Guide; AMACOM:
New York, NY, USA, 1998.23. Dent, J. Distribution Channels: Understanding and Managing Channels to Market; Kogan Page: London, UK,
2008.24. Chen, J.M.; Chen, T.H. The profit-maximization models for a multi-item distribution channel. Transp. Res.
Part E Logist. Transp. Rev. 2007, 43, 338–354. [CrossRef]25. Anderson, D.R.; Sweeney, D.J.; Williams, T.A.; Camm, J.D.; Martin, K. An. Introduction to Management Science:
Quantitative Approaches to Decision Making; South-Western Cengage Learning: Mason, OH, USA, 2011.26. Park, S.Y.; Keh, H.T. Modelling hybrid distribution channels: A game-theoretical analysis. J. Retail.
Consum. Serv. 2003, 10, 155–167. [CrossRef]27. Dong, Y.; Shankar, V.; Dresner, M. Efficient replenishment in the distribution channel. J. Retail. 2007, 83,
253–278. [CrossRef]28. Kuz’min, O.Y.; Chernobay, L.I.; Romanko, O.P. Methods of analysis of the enterprise competitiveness.
Sci. Bull. Ukr. Natl. Forest. Univ. 2011, 21, 159–166. (In Ukrainian)29. Kalashnik, O.V.; Omelchenko, N.V.; Tovt, V.M. The use of graphical models for evaluating the competitiveness
of goods. Commod. Res. Innov. 2011, 3, 234–241. (In Ukrainian)30. Library of Practical Software Open Access “Optimizing Resources with Linear Programming”. Available
online: http://www.phpsimplex.com/en/index.htm (accessed on 27 April 2011).31. Robinson, L.J.; Barry, P.J. The Competitive Firm’s Response to Risk; Macmillan: New York, NY, USA, 1987.
92

Sustainability 2016, 8, 393
32. Tsay, A.A. Risk sensitivity in distribution channel partnerships: Implications for manufacturer return policies.J. Retail. 2002, 78, 147–160. [CrossRef]
33. Markowitz, H.M. Portfolio Selection. Efficient Diversification of Investments; John Wiley & Sons: New York, NY,USA, 1959.
34. Fabozzi, F.J.; Markowitz, H.M. The Theory and Practice of Investment Management, 2nd ed.; John Wiley & Sons:Hoboken, NJ, USA, 2011.
35. Zakharin, S.V. Economic diversification as an efficient mechanism of ensuring enterprise development.Bull. Kyiv Nat. Univ. Technol. Design 2012, 1, 139–145. (In Ukrainian)
© 2016 by the authors. Licensee MDPI, Basel, Switzerland. This article is an open accessarticle distributed under the terms and conditions of the Creative Commons Attribution(CC BY) license (http://creativecommons.org/licenses/by/4.0/).
93
sustainability
Article
Sustainable Process Performance by Application ofSix Sigma Concepts: The Research Study of TwoIndustrial Cases
Andrea Sujova *, Lubica Simanova and Katarina Marcinekova
Department of Business Economics, Technical university in Zvolen, T.G.Masaryka 24, 96053 Zvolen, Slovakia;[email protected] (L.S.); [email protected] (K.M.)* Correspondence: [email protected]; Tel.: +421-45-5206-438; Fax: +421-45-532-811
Academic Editor: Adam JabłonskiReceived: 22 December 2015; Accepted: 7 March 2016; Published: 10 March 2016
Abstract: The current approach to business management focuses on increasing the performance ofbusiness processes. To achieve the required processes performance means to ensure the requiredquality and capability of processes. The partial aim of this paper is to confirm the positive effectsof the Six Sigma methodology (SSM) on the corporate performance in the Slovak Republic andan investigation of the dependency of SSM implementation on the certified quality managementsystem (QMS) as a set-forward condition via a questionnaire survey carried out in Slovak industrialenterprises. The survey results confirmed the above-mentioned assumptions. The SSM using DMAIC(Define-Measure-Analyze-Improve-Control) was applied in real conditions of two manufacturingenterprises with a different level of quality management system. The results of the research studyproved a possibility to implement SSM and to use the same methods in enterprises aside from alevel of QMS. However, more remarkable results were achieved by the enterprise which introducedQMS. The first application of SSM in enterprises within specific conditions of furniture productionprocesses can be considered to be a contribution of the research study, as well. The result of the workis the model including the methodology and the appropriate combination of methods and tools forassuring the sustainable performance of the business processes.
Keywords: process performance; Six Sigma; sustainable improvement; furniture manufacturing
1. Introduction
Due to the increased pressure of globalization upon the world market, business competitivenessis currently dependent upon the innovative abilities of companies, not only in the area of products butalso in processes. One modern approach is based on corporate performance measurement by means ofinternal process performance measurements. Companies are, therefore, shifting more and more of theirattention from the quality of products to the performance and quality of internal business processes.
The performance of business processes represents achieving the required results in a given process,and its size is expressed by the difference between the actual and the required results. The performanceof the process is evaluated by comparing actually achieved and required value of the stated index ofthe process, which can be the duration of the process, costs for the process, the quality of the process,added value, the number of skills, and the number of innovations.
To make the required process performance sustainable their capability must be assured, i.e., therequired process quality. Correct decisions play an important role in the quality assurance processand they shall be based on the situation analysis using appropriate tools and methods of operationalmanagement and quality improvement. The Six Sigma methodology (SSM) is used as the process
Sustainability 2016, 8, 260; doi:10.3390/su8030260 www.mdpi.com/journal/sustainability94
Sustainability 2016, 8, 260
quality assurance and improvement method, as its implementation has achieved significant costreductions, mainly in the machine, automotive, and electric and technical industry.
Successful results in an automotive industry after implementation of the Six Sigma methodology(SSM) are presented in studies [1–3]. Benefits of using SSM in achieving the required process capabilitiesimprovement, hence improving the system stability, were presented by Al-Agha et al. [4]. The highlyuseful role of Six Sigma for small and medium enterprises was justified by Kaushik et al. [5]. The mainidea of successful leadership to achieve sustainable competitive advantage to ensure the quality ofservice by using SSM was reviewed in the paper of Rabeea et al. [6].
Six Sigma has been applied not only in the industrial enterprises but also in the area of theservices, health, and public administration, both in the private and public field, where there is a strongorientation on the customer, quality, time, and performance [7].
Six Sigma originated in the 1980s as a corporate strategy containing a set of techniques forimprovement of manufacturing processes and the elimination of defects in the Motorola company. Themain goal of the strategy was to minimize the dispersion of the characteristics critical for quality of themanufactured products and performed processes and setting of the average values approaching thetarget values defined by the customers. The application of SSM brought about changes within a shorttime, leading to the reduction of defects in the products using the same labor, technology, and design,while consuming less cost. Thanks to the strategy, Motorola gained the leading position in the areaof the quality and was awarded the Malcom National Quality Award. Many worldwide enterpriseslike Toyota, Ford, BMW, Hilti, Shell, General Electric, Honeywell International, Caterpillar, Raytheon,and Merril Lynch have successfully applied this methodology [4]. General Electric was one of the firstcompanies adopting the SSM from Motorola and in the three years since introduction they calculatedthat the method had saved them $750 million, net, after subtracting all costs, including the cost onthe method.
Based on a case study done by Nilmani and Shidhar in a firm producing automotive components,the company was able to improve the process yield from 44% to 90% after applying SSM [8]. Theprocess capability sigma level improved from 2.91 to 4.43 sigma [9]. According to Gibbons, byapplying Six Sigma in a well-known manufacturing company in the United Kingdom, overallequipment effectiveness improved significantly from 40% to 85% [10]. He also concluded that using theDMAIC (Define-Measure-Analyze-Improve-Control) approach provided a systematic improvementand problem-solving process. Moreover, this kind of process improvement approach resulted in asustainable and stable process.
Experience of Slovak and Czech enterprises has proven that, for example, processes inmanufacturing companies in the automobile industry with an already established quality assurancesystem are at an average level of around 3.5 to 4 sigma. In this case, an improvement in the firm’sprocesses by 0.2 sigma represents economic benefits in the amount of 1% of company income.
Six Sigma processes show a proven approach for businesses and organizations to improve theirperformance and that sustainability programs are in need of this operational approach and discipline.Six Sigma helps a business leader design a sustainable program for value creation [11].
Research from several authors, as well as experience from companies, have shown that Six Sigmaprovides process performance on a high and sustainable level. The authors of the paper have chosen,out of all existing concepts, just this one to create a model of sustainable process performance.
The first aim of the work was to prove the positive effects of the Six Sigma concept on thecorporate performance of the enterprises in the Slovak Republic and investigate the dependency of SSMimplementation on the implementation of a quality management system as a set-forward condition.To meet the purpose, a primary quantitative survey using a questionnaire method was carried out.The aim resulted from several studies dealing with effects of SSM on corporate performance [12,13]and investigating the relationship between certified QMS and SSM [14–16]. The results of the studieswere the inspiration behind our research hypotheses.
95
Sustainability 2016, 8, 260
The goal of the paper is to introduce the Six Sigma concept in the companies with a different levelof quality management system and find out the effect of the process performance. The result of thework is a model, including the methodology and the appropriate combination of the methods andtools for assurance of the sustainable performance of the business processes.
2. Material and Methods
The purpose of this study has arisen by the idea how to ensure sustainable quality andimprovement of production processes. The first step was the study of the theoretical and latestscientific knowledge. Based on the study, the goal and methodology of the primary research wasstated. The research results led the authors to create the purpose and procedure of the application inthe real conditions of enterprises.
2.1. Literature Review
The name of the “Six Sigma” methodology comes from statistics where σ means standarddeviation. The term “Six Sigma” refers to the ability of highly-capable processes to produce outputwithin specification. In particular, processes that operate with six sigma quality produce at defect levelsbelow 3.4 defects per (one) million opportunities [4]. According to [2–6] a Six Sigma is a statisticalmeasure of process capability, which is equivalent to 99.99966% of good parts.
According to Töpfer et al. [17], Six Sigma has two dimensions which are:
‚ Six Sigma, as project management, with sound statistical foundations and effective qualitymanagement tools, which contain:
- systematic methodology—DMAIC and DMADV (Define-Measure-Analyze-Design-Verify),- project and process management,- a set of tools—process analysis for resolving problems, statistics,- philosophy and quality culture at a zero defect level.
‚ Six Sigma, as a statistical concept for measurement, is based on the principle that there are nomore than 3.4 errors in the process per million chances, whilst taking into account the complexityof products and processes.
There exist several definitions of Six Sigma, as a concept, which were summarized in the paper bySimanova [18]. Based on studies of the opinions of individual authors of Six Sigma methodology, wemay state a concordance of opinions that Six Sigma is an approach or system which, by combiningthe use of statistical methods, understanding customer requirements, and decreasing the variabilityof processes, leads to an improvement in processes and increases their level of perfection which isexpressed by a maximum number of 3.4 faults per million chances.
The literature review of a lean six sigma for the manufacturing industry was provided byAlbliwi et al. [19]. It is based on a review of papers published in the top journals, which resultedin definitions of limitations and impending factors before starting an implementation process of SSM.
Limitations and impending factors before starting a SSM implementation process were alsopresented in [20,21]. According to Kuvvetli et al. a project selection and its scope, quality culture, anddefining and measuring metrics were determined as the top factors that affect success levels of sixsigma projects [20]. The study of Arumugam et al. has shown that technical and social supports jointlyaffect the success of Six Sigma implementation [21].
The relationship between certified quality management system and SSM was investigated in thestudies [14–16]. The results of literature review performed by Karthi et al. point to little work carriedout on integrating Six Sigma and ISO 9001 standards. The synergy of implementing ISO 9001 standardsand Six Sigma has been eluding contemporary organizations [14]. The work of Chiarini deals withdifferences between requirements of ISO 13053 aimed to standardizing SSM implementation and theactual practises of companies by implementing Six Sigma [16].
96
Sustainability 2016, 8, 260
If we compare the contribution of Six Sigma from various sources [1–6,9,22–25], it is clear thatdeployment of this methodology in companies brings increased performance, increased productivity,increased competitiveness, and growth in market share, whilst retaining loyal customers and obtainingnew, decreased production costs by decreasing the proportion of costs for repairs and disposal ofnon-conforming products, new product designs, and, growth in the qualifications and professionallevel of employees. The study by Aldowiasan, focusing on Six Sigma performance for non-normalprocesses, showed that less variation reduction was required to improve exponentially distributedprocesses [26]. Chao-Ton and Chia-Jan classified the benefit of SSM into hard saving involving tangibleoutcomes in relation to cost and revenue, and soft savings, involving actual improvements in efficiency,quality, and cash flow [27].
Six Sigma has two key methodologies: DMAIC and DMADV. DMAIC (Define-Measure-Analyze-Improve-Control) is used to improve an existing business process, and DMADV (Define-Measure-Analyze-Design-Verify) is used to create new product or process designs for predictable, defect-freeperformance [28].
DMAIC procedure has been described in several studies concerning application of Six Sigmamethodology [1–11]. Steps of DMAIC procedure endeavor to adopt a smarter way of doing things soas to minimize the occurrence of errors. It emphasizes doing things right the first time, rather thanspending effort on correcting errors [29].
The tools used by this procedure focus on minimizing the general causes of errors, increasingthe quality of process outputs, decreasing operational costs, increasing process performance, andeliminating faults caused by other factors. It also involves the use of statistical methods, qualityimprovement techniques, and the scientific method, as well [30]. The study of Prashar deals with theuse of non-statistical Shainin DOE (Design of Experiments) tools to simplify the quality improvementinitiative and its incorporating within SSM [31]. The suggestion to implement Poka–Yoke technique inDMAIC phases is the result of the work done by Vinod et al. [32].
The summary of the most often used methods and tools in the methodology Six Sigma withclassification to individual phases of the improvement model DMAIC in accordance with therecommendation of the authors [1–4,17,27–33] was made. It can be found in Table A1 in Appendix ofthis paper.
2.2. Analysis of the Current Situation in Slovak Enterprises—Methodology of the Research
The current situation in the area of process performance management has been analyzed throughprimary quantitative research in Slovak enterprises using the questionnaire method. The main researchobjective was the analysis of using traditional and modern methods and tools for process performancemanagement and measurement in Slovak enterprises from selected industrial branches.
In the first step a database of enterprises data has been created. The information sources camemostly from the Internet databases and Statistical Bureau. The database size comprised 2235 enterprisesfrom branches of engineering, construction, automotive, and wood-processing industries. By means ofInternet applications an online questionnaire has been created and distributed to 1500 enterprises.
Questionnaire questions were divided into three areas: common characteristics (branch, region,ownership, number of employees, activity orientation, type of production organization), financialresults (turnover, indicator ROE), and area of internal processes, production, and quality. Questionsconcerning internal processes were as follows:
‚ What qualitative level corresponds with implementation of processes in your company?‚ What level of elaborated process map does your company have?‚ What methods are used in process management in your company?‚ What indicators for production process performance measurement are used in your company?‚ What indicators for evaluation of employee performance in processes are used in your company?
97
Sustainability 2016, 8, 260
‚ What internal processes and their indicators are regularly measured and evaluated inyour company?
‚ What certification of quality management system has got your company?
Data collection was carried out in the first quarter of 2013 and an online database for datacollection was created. Number of returned questionnaires was 164, which is a representative samplein the research. Selected results have been published by authors [34–36].
One of the research objectives was the analysis of using the methods and tools for securing ofprocess quality (capability) in Slovak enterprises from selected industrial branches.
The following hypotheses were set for the questionnaire survey:
‚ H1: There is a positive dependence between the application of Six Sigma and the amount of returnon equity (ROE).
‚ H2: There is a positive dependence between the application of Six Sigma and the implementationof quality management systems (QMS) according to the standards of ISO 9001.
Investigation of a dependency between SSM and QMS according to the standards ISO 9001 wassuggested after the assumption that QMS according to the standards ISO 9001 is focused on ensuringand improving the process quality and it creates the basic prerequisites and necessary conditions forimplementation of Six Sigma. The next reason was finding if enterprises without certified QMS haveimplemented the Six Sigma concept.
Results of the survey were processed by the application of several scientific methods of analysis,synthesis, deduction, and comparison. Another group of applied methods include mathematicalmethods focusing on the calculation of absolute, relative, and cumulative frequencies of the answers.Cross-tabulations were used for the structural analysis of the relations and causalities.
The chi-square independence test (χ2) was used for hypotheses verification. It is necessary tocreate alternative hypotheses alongside with the principal hypotheses for testing:
‚ H01: “There is no dependence between the application of Six Sigma and amount of the return onequity ROE.”
‚ H02: “There is no dependence between the application of Six Sigma and implemented QMS.”
For independent phenomena it is applicable: A, B applies to P(A X B) = P(A) P(B); therefore, it isinevitable to compare the empirically-determined frequencies nij with expected frequencies.
Estimated theoretic frequencies:πi. “ ni. ˜ n (1)
π.j “ n.j ˜ n (2)
and estimated theoretic compound probability:
πij “ πi. ˆ π.j “ ni. ˆ n ˆ n.j ˆ n “ ni. ˆ n.j ˆ n2 (3)
Therefore, the estimation of theoretic frequency is:
n1ij “ πij “ `
n ˆ ni. ˆ n.j˘ ˜ n2 “ `
ni. ˆ n.j˘ ˜ n (4)
Equation (4) shall be interpreted as a rule used for the calculation of the expected values:
Expected frequency “ sum in column { total sum ˆ sum in line (5)
Test statistics were calculated according to the following formula:
χ2 “ÿ
ri“1
ÿsj“1
pnij ´ n’ijq2
nij(6)
98
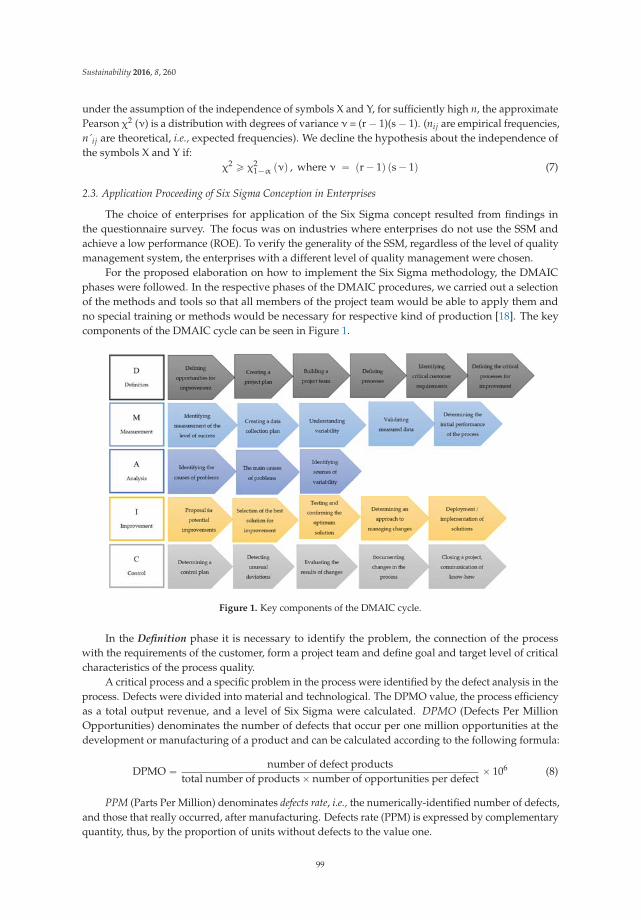
Sustainability 2016, 8, 260
under the assumption of the independence of symbols X and Y, for sufficiently high n, the approximatePearson χ2 (ν) is a distribution with degrees of variance ν = (r ´ 1)(s ´ 1). (nij are empirical frequencies,n´ij are theoretical, i.e., expected frequencies). We decline the hypothesis about the independence ofthe symbols X and Y if:
χ2 ě χ21´α pνq , where ν “ pr ´ 1q ps ´ 1q (7)
2.3. Application Proceeding of Six Sigma Conception in Enterprises
The choice of enterprises for application of the Six Sigma concept resulted from findings inthe questionnaire survey. The focus was on industries where enterprises do not use the SSM andachieve a low performance (ROE). To verify the generality of the SSM, regardless of the level of qualitymanagement system, the enterprises with a different level of quality management were chosen.
For the proposed elaboration on how to implement the Six Sigma methodology, the DMAICphases were followed. In the respective phases of the DMAIC procedures, we carried out a selectionof the methods and tools so that all members of the project team would be able to apply them andno special training or methods would be necessary for respective kind of production [18]. The keycomponents of the DMAIC cycle can be seen in Figure 1.
Figure 1. Key components of the DMAIC cycle.
In the Definition phase it is necessary to identify the problem, the connection of the processwith the requirements of the customer, form a project team and define goal and target level of criticalcharacteristics of the process quality.
A critical process and a specific problem in the process were identified by the defect analysis in theprocess. Defects were divided into material and technological. The DPMO value, the process efficiencyas a total output revenue, and a level of Six Sigma were calculated. DPMO (Defects Per MillionOpportunities) denominates the number of defects that occur per one million opportunities at thedevelopment or manufacturing of a product and can be calculated according to the following formula:
DPMO “ number of defect productstotal number of products ˆ number of opportunities per defect
ˆ 106 (8)
PPM (Parts Per Million) denominates defects rate, i.e., the numerically-identified number of defects,and those that really occurred, after manufacturing. Defects rate (PPM) is expressed by complementaryquantity, thus, by the proportion of units without defects to the value one.
99
Sustainability 2016, 8, 260
OFD (Opportunities For Defects) is a probability of defects of one unit, which describes howmany places defects can occur.
Measurements of the defect frequency, according to the DPMO, and Sigma criteria can distinguishthe level of the process in regard of the defect frequency at the output and identify critical, bottleneckpoints in the processes.
Subsequently, a critical process map, SIPOC, was elaborated (Suppliers-Inputs-Process-Outputs-Customers). SIPOC is a process map that helps understand and identify process boundariesand key processes to ensure focus only on the customer [9].
The target of the defined critical process and the final level of Six Sigma was determined in theproject charter proposal. The project charter contains an outline for the problem definition, projectteam, time duration, and project target.
The objective of the phase Measurement is to gain relevant data about critical processes bymeasurement of the key process attributes so that the problem area could be defined. In this phase,potential sources for non–conformity in the process are identified. In the first phase, the quality indexof the critical process was determined and a number of measurements were done to find out thecapability of the process. The following methods were used:
- The measurement plan by Pande et al. [22]: five-phase methodology for measurement plan.- Capability indexes Cp and Cpk: critical process capability evaluation in terms of keeping specified
or expected limits and an average value (see [4,18,37]).- Histograms as a visual synthesis of frequency distribution and process variability.
Modules of descriptive statistics, industrial statistics, and Sigma process analysis were used forthe calculations.
In the phase Analysis, the attention is given to the data analysis and dependence verification oftype cause and effect, process comprehension with the objective to find out the key problem causes.The following methods were used at the application in enterprises:
- Brainstorming: looking for causes of critical process incapability.- Diagram of causes and effects—Ishikawa diagram: graphical visualization of coherence between
the problem and causes or possible solutions.- Method FMEA (Failure Mode and Effect Analysis): analysis of the occurrence of failures, possible
causes and effects for the customer.
In the phase Improvement, solutions to eliminate problem causes are proposed, carried out andverified. The applied methods:
- An action plan and diagram: solutions to eliminate the identified cause of failures and animprovement of the critical process.
- Repetitive measurement of the critical process and the calculation of process capability indexes.
In the final phase Control, the results from the previous phases are evaluated, processes arecontinually followed and the process control is carried out so that any variation from the targetvalue would be corrected before the effect of failure (non-conformity) occurs. The appropriateimplementation of the changes and improvements with the objective of the sustainable improvedcondition is controlled. The applied methods include:
- QFD method (Quality Function Deployment): customer requirements are deployed into theproduct characteristics and critical process outputs.
- Affinity diagram serves for identification of logical or causal connections between the problemelements [13].
The applied procedure of the SSM in the companies was verified by the efficiency evaluationof Six Sigma in the companies with a different level of quality management. For that purpose, the
100
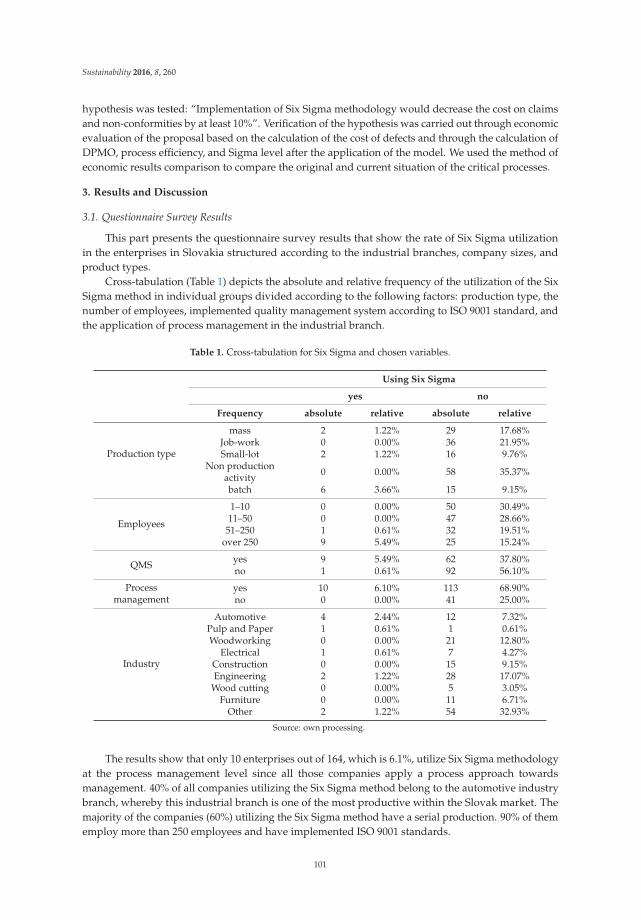
Sustainability 2016, 8, 260
hypothesis was tested: “Implementation of Six Sigma methodology would decrease the cost on claimsand non-conformities by at least 10%”. Verification of the hypothesis was carried out through economicevaluation of the proposal based on the calculation of the cost of defects and through the calculation ofDPMO, process efficiency, and Sigma level after the application of the model. We used the method ofeconomic results comparison to compare the original and current situation of the critical processes.
3. Results and Discussion
3.1. Questionnaire Survey Results
This part presents the questionnaire survey results that show the rate of Six Sigma utilizationin the enterprises in Slovakia structured according to the industrial branches, company sizes, andproduct types.
Cross-tabulation (Table 1) depicts the absolute and relative frequency of the utilization of the SixSigma method in individual groups divided according to the following factors: production type, thenumber of employees, implemented quality management system according to ISO 9001 standard, andthe application of process management in the industrial branch.
Table 1. Cross-tabulation for Six Sigma and chosen variables.
Using Six Sigma
yes no
Frequency absolute relative absolute relative
Production type
mass 2 1.22% 29 17.68%Job-work 0 0.00% 36 21.95%Small-lot 2 1.22% 16 9.76%
Non productionactivity 0 0.00% 58 35.37%
batch 6 3.66% 15 9.15%
Employees
1–10 0 0.00% 50 30.49%11–50 0 0.00% 47 28.66%
51–250 1 0.61% 32 19.51%over 250 9 5.49% 25 15.24%
QMSyes 9 5.49% 62 37.80%no 1 0.61% 92 56.10%
Processmanagement
yes 10 6.10% 113 68.90%no 0 0.00% 41 25.00%
Industry
Automotive 4 2.44% 12 7.32%Pulp and Paper 1 0.61% 1 0.61%Woodworking 0 0.00% 21 12.80%
Electrical 1 0.61% 7 4.27%Construction 0 0.00% 15 9.15%Engineering 2 1.22% 28 17.07%
Wood cutting 0 0.00% 5 3.05%Furniture 0 0.00% 11 6.71%
Other 2 1.22% 54 32.93%
Source: own processing.
The results show that only 10 enterprises out of 164, which is 6.1%, utilize Six Sigma methodologyat the process management level since all those companies apply a process approach towardsmanagement. 40% of all companies utilizing the Six Sigma method belong to the automotive industrybranch, whereby this industrial branch is one of the most productive within the Slovak market. Themajority of the companies (60%) utilizing the Six Sigma method have a serial production. 90% of thememploy more than 250 employees and have implemented ISO 9001 standards.
101
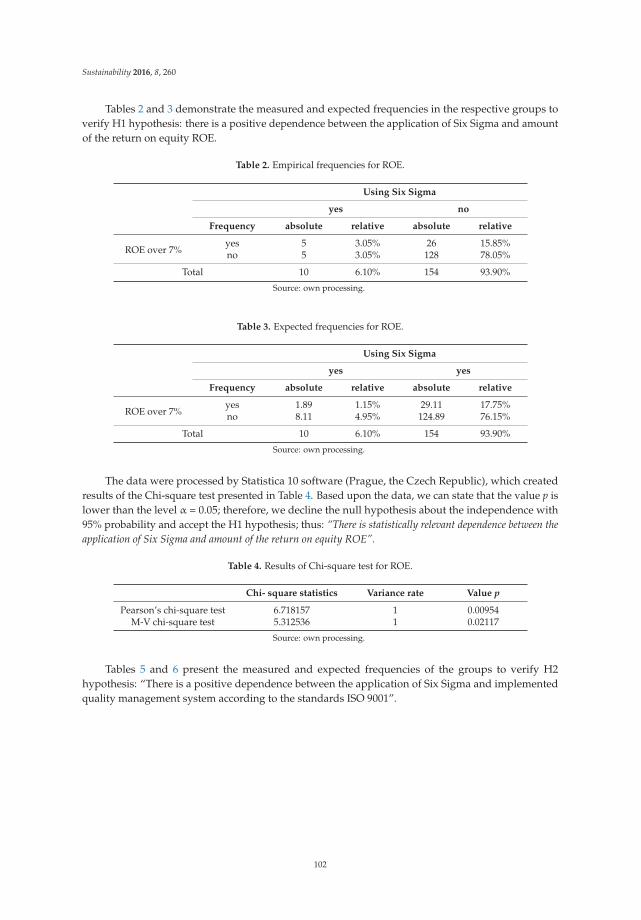
Sustainability 2016, 8, 260
Tables 2 and 3 demonstrate the measured and expected frequencies in the respective groups toverify H1 hypothesis: there is a positive dependence between the application of Six Sigma and amountof the return on equity ROE.
Table 2. Empirical frequencies for ROE.
Using Six Sigma
yes no
Frequency absolute relative absolute relative
ROE over 7%yes 5 3.05% 26 15.85%no 5 3.05% 128 78.05%
Total 10 6.10% 154 93.90%
Source: own processing.
Table 3. Expected frequencies for ROE.
Using Six Sigma
yes yes
Frequency absolute relative absolute relative
ROE over 7%yes 1.89 1.15% 29.11 17.75%no 8.11 4.95% 124.89 76.15%
Total 10 6.10% 154 93.90%
Source: own processing.
The data were processed by Statistica 10 software (Prague, the Czech Republic), which createdresults of the Chi-square test presented in Table 4. Based upon the data, we can state that the value p islower than the level α = 0.05; therefore, we decline the null hypothesis about the independence with95% probability and accept the H1 hypothesis; thus: “There is statistically relevant dependence between theapplication of Six Sigma and amount of the return on equity ROE”.
Table 4. Results of Chi-square test for ROE.
Chi- square statistics Variance rate Value p
Pearson’s chi-square test 6.718157 1 0.00954M-V chi-square test 5.312536 1 0.02117
Source: own processing.
Tables 5 and 6 present the measured and expected frequencies of the groups to verify H2hypothesis: “There is a positive dependence between the application of Six Sigma and implementedquality management system according to the standards ISO 9001”.
102
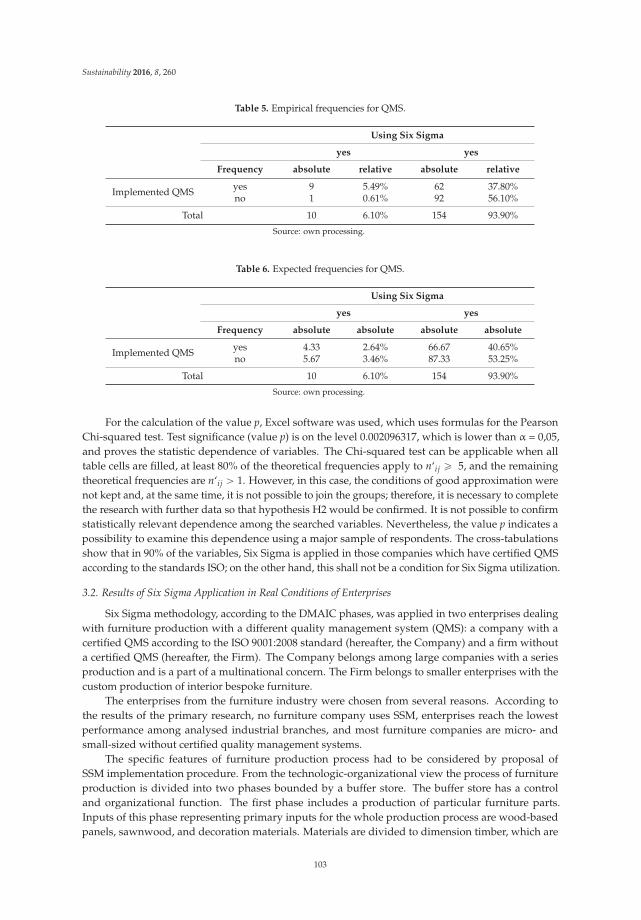
Sustainability 2016, 8, 260
Table 5. Empirical frequencies for QMS.
Using Six Sigma
yes yes
Frequency absolute relative absolute relative
Implemented QMS yes 9 5.49% 62 37.80%no 1 0.61% 92 56.10%
Total 10 6.10% 154 93.90%
Source: own processing.
Table 6. Expected frequencies for QMS.
Using Six Sigma
yes yes
Frequency absolute absolute absolute absolute
Implemented QMS yes 4.33 2.64% 66.67 40.65%no 5.67 3.46% 87.33 53.25%
Total 10 6.10% 154 93.90%
Source: own processing.
For the calculation of the value p, Excel software was used, which uses formulas for the PearsonChi-squared test. Test significance (value p) is on the level 0.002096317, which is lower than α = 0,05,and proves the statistic dependence of variables. The Chi-squared test can be applicable when alltable cells are filled, at least 80% of the theoretical frequencies apply to n‘ij ě 5, and the remainingtheoretical frequencies are n‘ij ą 1. However, in this case, the conditions of good approximation werenot kept and, at the same time, it is not possible to join the groups; therefore, it is necessary to completethe research with further data so that hypothesis H2 would be confirmed. It is not possible to confirmstatistically relevant dependence among the searched variables. Nevertheless, the value p indicates apossibility to examine this dependence using a major sample of respondents. The cross-tabulationsshow that in 90% of the variables, Six Sigma is applied in those companies which have certified QMSaccording to the standards ISO; on the other hand, this shall not be a condition for Six Sigma utilization.
3.2. Results of Six Sigma Application in Real Conditions of Enterprises
Six Sigma methodology, according to the DMAIC phases, was applied in two enterprises dealingwith furniture production with a different quality management system (QMS): a company with acertified QMS according to the ISO 9001:2008 standard (hereafter, the Company) and a firm withouta certified QMS (hereafter, the Firm). The Company belongs among large companies with a seriesproduction and is a part of a multinational concern. The Firm belongs to smaller enterprises with thecustom production of interior bespoke furniture.
The enterprises from the furniture industry were chosen from several reasons. According tothe results of the primary research, no furniture company uses SSM, enterprises reach the lowestperformance among analysed industrial branches, and most furniture companies are micro- andsmall-sized without certified quality management systems.
The specific features of furniture production process had to be considered by proposal ofSSM implementation procedure. From the technologic-organizational view the process of furnitureproduction is divided into two phases bounded by a buffer store. The buffer store has a controland organizational function. The first phase includes a production of particular furniture parts.Inputs of this phase representing primary inputs for the whole production process are wood-basedpanels, sawnwood, and decoration materials. Materials are divided to dimension timber, which are
103
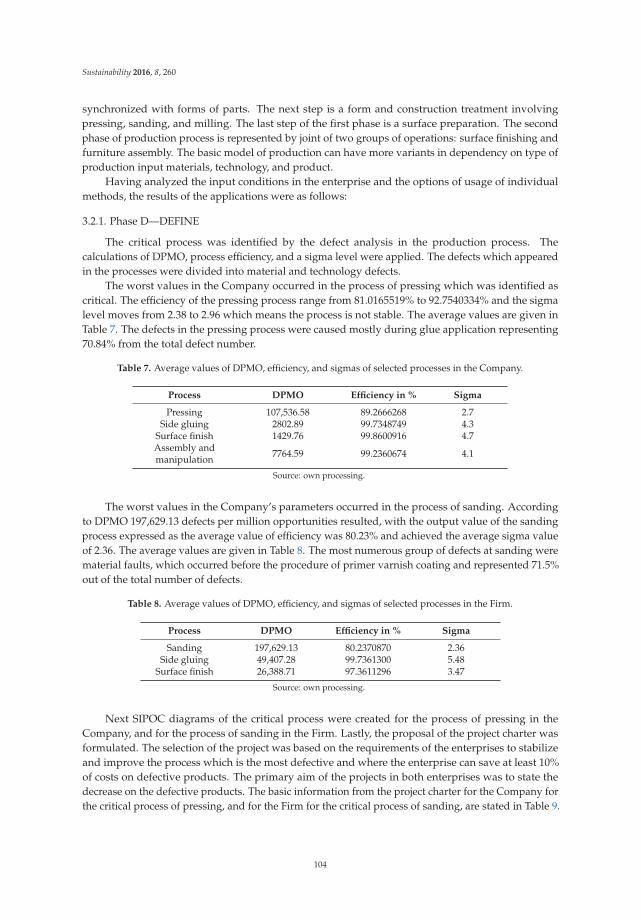
Sustainability 2016, 8, 260
synchronized with forms of parts. The next step is a form and construction treatment involvingpressing, sanding, and milling. The last step of the first phase is a surface preparation. The secondphase of production process is represented by joint of two groups of operations: surface finishing andfurniture assembly. The basic model of production can have more variants in dependency on type ofproduction input materials, technology, and product.
Having analyzed the input conditions in the enterprise and the options of usage of individualmethods, the results of the applications were as follows:
3.2.1. Phase D—DEFINE
The critical process was identified by the defect analysis in the production process. Thecalculations of DPMO, process efficiency, and a sigma level were applied. The defects which appearedin the processes were divided into material and technology defects.
The worst values in the Company occurred in the process of pressing which was identified ascritical. The efficiency of the pressing process range from 81.0165519% to 92.7540334% and the sigmalevel moves from 2.38 to 2.96 which means the process is not stable. The average values are given inTable 7. The defects in the pressing process were caused mostly during glue application representing70.84% from the total defect number.
Table 7. Average values of DPMO, efficiency, and sigmas of selected processes in the Company.
Process DPMO Efficiency in % Sigma
Pressing 107,536.58 89.2666268 2.7Side gluing 2802.89 99.7348749 4.3
Surface finish 1429.76 99.8600916 4.7Assembly andmanipulation 7764.59 99.2360674 4.1
Source: own processing.
The worst values in the Company’s parameters occurred in the process of sanding. Accordingto DPMO 197,629.13 defects per million opportunities resulted, with the output value of the sandingprocess expressed as the average value of efficiency was 80.23% and achieved the average sigma valueof 2.36. The average values are given in Table 8. The most numerous group of defects at sanding werematerial faults, which occurred before the procedure of primer varnish coating and represented 71.5%out of the total number of defects.
Table 8. Average values of DPMO, efficiency, and sigmas of selected processes in the Firm.
Process DPMO Efficiency in % Sigma
Sanding 197,629.13 80.2370870 2.36Side gluing 49,407.28 99.7361300 5.48
Surface finish 26,388.71 97.3611296 3.47
Source: own processing.
Next SIPOC diagrams of the critical process were created for the process of pressing in theCompany, and for the process of sanding in the Firm. Lastly, the proposal of the project charter wasformulated. The selection of the project was based on the requirements of the enterprises to stabilizeand improve the process which is the most defective and where the enterprise can save at least 10%of costs on defective products. The primary aim of the projects in both enterprises was to state thedecrease on the defective products. The basic information from the project charter for the Company forthe critical process of pressing, and for the Firm for the critical process of sanding, are stated in Table 9.
104
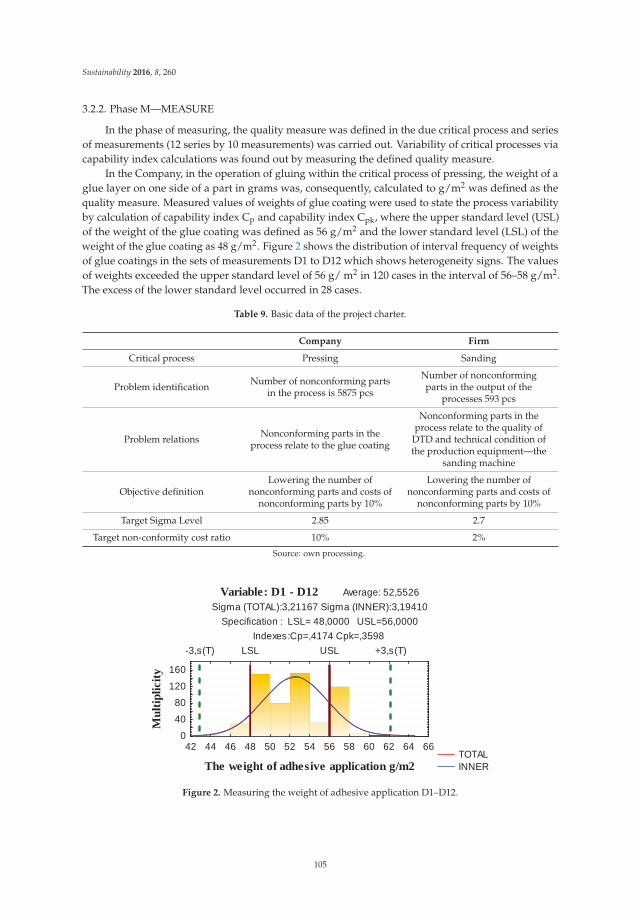
Sustainability 2016, 8, 260
3.2.2. Phase M—MEASURE
In the phase of measuring, the quality measure was defined in the due critical process and seriesof measurements (12 series by 10 measurements) was carried out. Variability of critical processes viacapability index calculations was found out by measuring the defined quality measure.
In the Company, in the operation of gluing within the critical process of pressing, the weight of aglue layer on one side of a part in grams was, consequently, calculated to g/m2 was defined as thequality measure. Measured values of weights of glue coating were used to state the process variabilityby calculation of capability index Cp and capability index Cpk, where the upper standard level (USL)of the weight of the glue coating was defined as 56 g/m2 and the lower standard level (LSL) of theweight of the glue coating as 48 g/m2. Figure 2 shows the distribution of interval frequency of weightsof glue coatings in the sets of measurements D1 to D12 which shows heterogeneity signs. The valuesof weights exceeded the upper standard level of 56 g/ m2 in 120 cases in the interval of 56–58 g/m2.The excess of the lower standard level occurred in 28 cases.
Table 9. Basic data of the project charter.
Company Firm
Critical process Pressing Sanding
Problem identification Number of nonconforming partsin the process is 5875 pcs
Number of nonconformingparts in the output of the
processes 593 pcs
Problem relations Nonconforming parts in theprocess relate to the glue coating
Nonconforming parts in theprocess relate to the quality of
DTD and technical condition ofthe production equipment—the
sanding machine
Objective definitionLowering the number of
nonconforming parts and costs ofnonconforming parts by 10%
Lowering the number ofnonconforming parts and costs of
nonconforming parts by 10%
Target Sigma Level 2.85 2.7
Target non-conformity cost ratio 10% 2%
Source: own processing.
Variable: D1 - D12 Average: 52,5526Sigma (TOTAL):3,21167 Sigma (INNER):3,19410
Specification : LSL= 48,0000 USL=56,0000Indexes:Cp=,4174 Cpk=,3598
TOTAL INNER
42 44 46 48 50 52 54 56 58 60 62 64 66
The weight of adhesive application g/m2
-3,s(T) LSL USL +3,s(T)
04080
120160
Mul
tiplic
ity
Figure 2. Measuring the weight of adhesive application D1–D12.
105
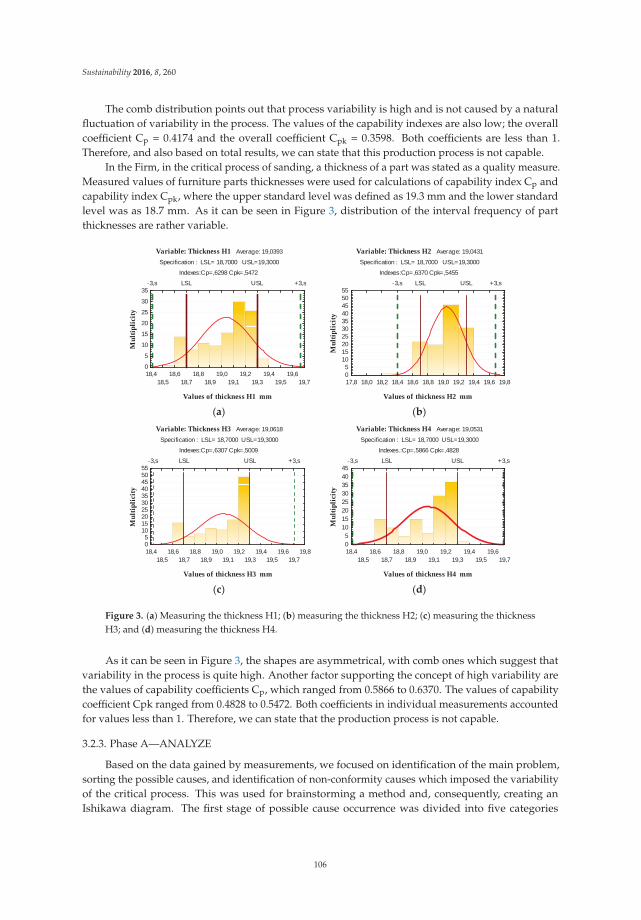
Sustainability 2016, 8, 260
The comb distribution points out that process variability is high and is not caused by a naturalfluctuation of variability in the process. The values of the capability indexes are also low; the overallcoefficient Cp = 0.4174 and the overall coefficient Cpk = 0.3598. Both coefficients are less than 1.Therefore, and also based on total results, we can state that this production process is not capable.
In the Firm, in the critical process of sanding, a thickness of a part was stated as a quality measure.Measured values of furniture parts thicknesses were used for calculations of capability index Cp andcapability index Cpk, where the upper standard level was defined as 19.3 mm and the lower standardlevel was as 18.7 mm. As it can be seen in Figure 3, distribution of the interval frequency of partthicknesses are rather variable.
Variable: Thickness H1 Average: 19,0393
Specification : LSL= 18,7000 USL=19,3000
Indexes:Cp=,6298 Cpk=,5472
18,418,5
18,618,7
18,818,9
19,019,1
19,219,3
19,419,5
19,619,7
Values of thickness H1 mm
-3,s LSL USL +3,s
0
5
10
15
20
25
30
35
Mul
tiplic
ity
Variable: Thickness H2 Average: 19,0431
Specification : LSL= 18,7000 USL=19,3000
Indexes:Cp=,6370 Cpk=,5455
17,8 18,0 18,2 18,4 18,6 18,8 19,0 19,2 19,4 19,6 19,8
Values of thickness H2 mm
-3,s LSL USL +3,s
05
10152025303540455055
Mul
tipli
city
(a) (b)Variable: Thickness H3 Average: 19,0618
Specification : LSL= 18,7000 USL=19,3000
Indexes:Cp=,6307 Cpk=,5009
18,418,5
18,618,7
18,818,9
19,019,1
19,219,3
19,419,5
19,619,7
19,8
Values of thickness H3 mm
-3,s LSL USL +3,s
05
10152025303540455055
Mul
tiplic
ity
Variable: Thickness H4 Average: 19,0531
Specification : LSL= 18,7000 USL=19,3000
Indexes.:Cp=,5866 Cpk=,4828
18,418,5
18,618,7
18,818,9
19,019,1
19,219,3
19,419,5
19,619,7
Values of thickness H4 mm
-3,s LSL USL +3,s
05
1015202530354045
Mul
tiplic
ity
(c) (d)
Figure 3. (a) Measuring the thickness H1; (b) measuring the thickness H2; (c) measuring the thicknessH3; and (d) measuring the thickness H4.
As it can be seen in Figure 3, the shapes are asymmetrical, with comb ones which suggest thatvariability in the process is quite high. Another factor supporting the concept of high variability arethe values of capability coefficients Cp, which ranged from 0.5866 to 0.6370. The values of capabilitycoefficient Cpk ranged from 0.4828 to 0.5472. Both coefficients in individual measurements accountedfor values less than 1. Therefore, we can state that the production process is not capable.
3.2.3. Phase A—ANALYZE
Based on the data gained by measurements, we focused on identification of the main problem,sorting the possible causes, and identification of non-conformity causes which imposed the variabilityof the critical process. This was used for brainstorming a method and, consequently, creating anIshikawa diagram. The first stage of possible cause occurrence was divided into five categories
106
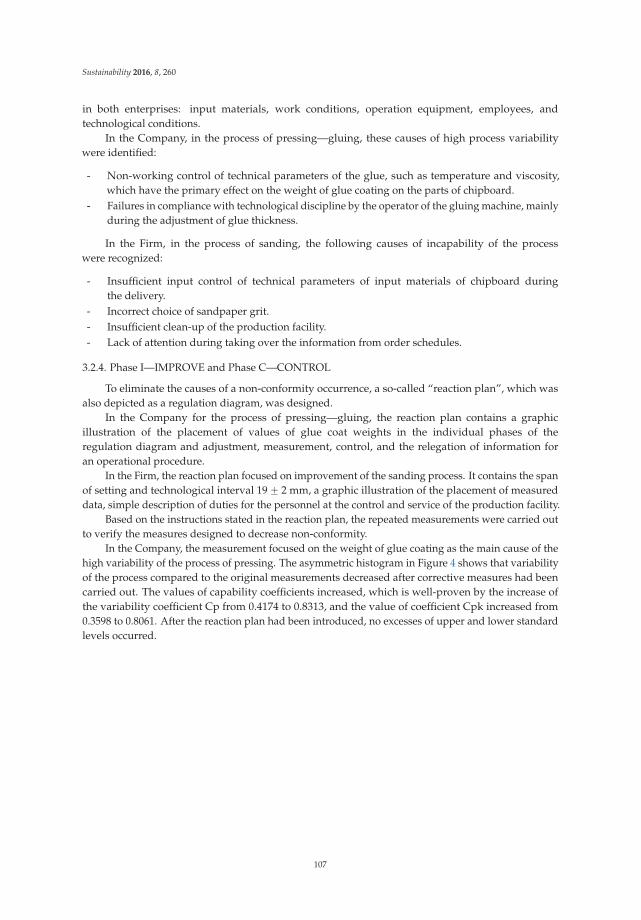
Sustainability 2016, 8, 260
in both enterprises: input materials, work conditions, operation equipment, employees, andtechnological conditions.
In the Company, in the process of pressing—gluing, these causes of high process variabilitywere identified:
- Non-working control of technical parameters of the glue, such as temperature and viscosity,which have the primary effect on the weight of glue coating on the parts of chipboard.
- Failures in compliance with technological discipline by the operator of the gluing machine, mainlyduring the adjustment of glue thickness.
In the Firm, in the process of sanding, the following causes of incapability of the processwere recognized:
- Insufficient input control of technical parameters of input materials of chipboard duringthe delivery.
- Incorrect choice of sandpaper grit.- Insufficient clean-up of the production facility.- Lack of attention during taking over the information from order schedules.
3.2.4. Phase I—IMPROVE and Phase C—CONTROL
To eliminate the causes of a non-conformity occurrence, a so-called “reaction plan”, which wasalso depicted as a regulation diagram, was designed.
In the Company for the process of pressing—gluing, the reaction plan contains a graphicillustration of the placement of values of glue coat weights in the individual phases of theregulation diagram and adjustment, measurement, control, and the relegation of information foran operational procedure.
In the Firm, the reaction plan focused on improvement of the sanding process. It contains the spanof setting and technological interval 19 ˘ 2 mm, a graphic illustration of the placement of measureddata, simple description of duties for the personnel at the control and service of the production facility.
Based on the instructions stated in the reaction plan, the repeated measurements were carried outto verify the measures designed to decrease non-conformity.
In the Company, the measurement focused on the weight of glue coating as the main cause of thehigh variability of the process of pressing. The asymmetric histogram in Figure 4 shows that variabilityof the process compared to the original measurements decreased after corrective measures had beencarried out. The values of capability coefficients increased, which is well-proven by the increase ofthe variability coefficient Cp from 0.4174 to 0.8313, and the value of coefficient Cpk increased from0.3598 to 0.8061. After the reaction plan had been introduced, no excesses of upper and lower standardlevels occurred.
107
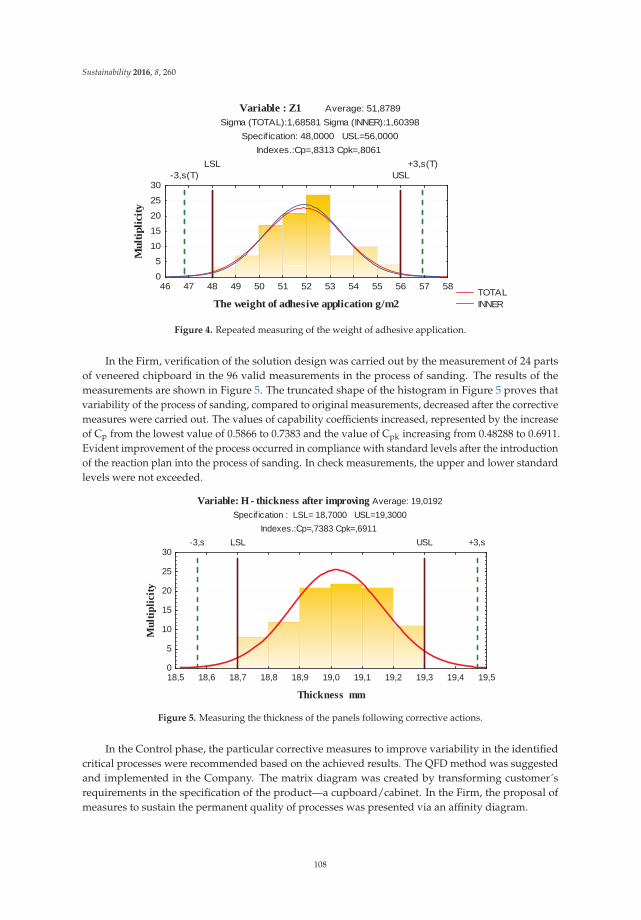
Sustainability 2016, 8, 260
Variable : Z1 Average: 51,8789Sigma (TOTAL):1,68581 Sigma (INNER):1,60398
Specif ication: 48,0000 USL=56,0000Indexes.:Cp=,8313 Cpk=,8061
TOTAL INNER
46 47 48 49 50 51 52 53 54 55 56 57 58
The weight of adhesive application g/m2
-3,s(T)LSL
USL+3,s(T)
0
5
10
15
20
25
30
Mul
tiplic
ity
Figure 4. Repeated measuring of the weight of adhesive application.
In the Firm, verification of the solution design was carried out by the measurement of 24 partsof veneered chipboard in the 96 valid measurements in the process of sanding. The results of themeasurements are shown in Figure 5. The truncated shape of the histogram in Figure 5 proves thatvariability of the process of sanding, compared to original measurements, decreased after the correctivemeasures were carried out. The values of capability coefficients increased, represented by the increaseof Cp from the lowest value of 0.5866 to 0.7383 and the value of Cpk increasing from 0.48288 to 0.6911.Evident improvement of the process occurred in compliance with standard levels after the introductionof the reaction plan into the process of sanding. In check measurements, the upper and lower standardlevels were not exceeded.
Variable: H - thickness after improving Average: 19,0192Specif ication : LSL= 18,7000 USL=19,3000
Indexes.:Cp=,7383 Cpk=,6911
18,5 18,6 18,7 18,8 18,9 19,0 19,1 19,2 19,3 19,4 19,5
Thickness mm
-3,s LSL USL +3,s
0
5
10
15
20
25
30
Mul
tiplic
ity
Figure 5. Measuring the thickness of the panels following corrective actions.
In the Control phase, the particular corrective measures to improve variability in the identifiedcritical processes were recommended based on the achieved results. The QFD method was suggestedand implemented in the Company. The matrix diagram was created by transforming customer´srequirements in the specification of the product—a cupboard/cabinet. In the Firm, the proposal ofmeasures to sustain the permanent quality of processes was presented via an affinity diagram.
108
Sustainability 2016, 8, 260
3.3. Impacts of Implementation of Six Sigma Methodology in Enterprises
Verification of the hypothesis which assumes decreasing the costs on claims and non-conformingproducts by 10% via implementation of Six Sigma was performed by comparison of the original and thecurrent state of the process, which were assessed as critical and by economic assessment of decreasingcosts of non-conformity.
Basic data to perform an economic assessment of the design were the numbers of non-conformingproducts divided according to the kind of defects and the price of a part in € in the critical processbefore and after implementation of Six Sigma.
In the Company, as is obvious from Table 10, we can see that total value of non-conformingproducts in the process decreased. It can be stated that after implementation of suggestions to improvequality by the Six Sigma methodology there was a decrease in the costs by 12.97%, which met the aimoutlined by the project charter.
Table 10. Economic assessment of the proposal in the Company—the process of pressing.
StateNumber of
non-conformitiesin pcs
Price in €/pcs Total sum in €
% share ofnon-conformities inproduction volume
Original 5879 8.23 34,277.95 3.40Current 5324 8.23 29,833.75 2.18
Source: own processing.
An improvement can be also seen in the DPMO categories, which also decreased and the valueof effectiveness increased. The sigma value increased from 2.75 to 2.95. The sigma level was set toincrease from 2.75 to 2.85 in the aims of the project charter. The overview of the original and currentDPMO, efficiency, and sigma levels is presented in Table 11. On the basis of the mentioned analysis,we can declare that the charter aim for the critical process of pressing was fully met. Based on theabove-mentioned results of the analyses in the process of pressing in the Company with a certifiedsystem of quality management, the hypothesis can be confirmed.
Table 11. Values of DPMO, effectiveness, sigma level in the Company—the process of pressing.
State DPMO Effectiveness in % Sigma
Original 107,536.58 89.2463424 2.75Current 73,261.27 92.9700000 2.95
Source: own processing.
In the Firm, the number of non-conforming products was counted before and after theimplementation of improvement proposals by the price of a part in € after sanding, before the primercoat. As we can see in Table 12, there was a decrease in the total value of non-conforming products,representing 8.25% of the total value of non-conforming products in the process of sanding caused byfaults in sanding before the primer coat. The aim set in the project charter was not achieved.
Table 12. Economic assessment of the proposal in the Firm—the process of sanding.
StateNumber of
non-conformitiesin pcs
Price in €/pcs Total sum in €
% share ofnon-conformities inproduction volume
Original 424 11.36 4816.64 3.40Current 389 11.36 4419.04 2.18
Source: own processing.
109
Sustainability 2016, 8, 260
Table 13 gives the overview of the original and current DPMO values, the value of effectiveness,and sigma levels in the process of sanding in the Firm. The improvement appeared in the values ofDPMO categories, effectiveness, and the sigma level, which increased from 2.36 to 2.60. The aims ofthe project charter proposed an increase of the sigma level from 2.36 to 2.7. Referring to the analysis,we can declare that the aim of the project charter was not achieved at 100%. Referring to the results ofthe analysis in the process of sanding in the Firm, which does not have a certified quality managementsystem, the hypothesis was not confirmed.
Table 13. Values of DPMO, effectiveness, sigma level in the Firm—the process of sanding.
State DPMO Effectiveness in % Sigma
Original 197,629.13 80.237087 2.36Current 134,753.36 86.520000 2.60
Source: own processing.
3.4. The Model of Ensuring Sustainable Processes Performance via the Six Sigma Concep
The model describes essential activities according to DMAIC, methods, and tools of how toensure activities to improve quality of processes from the viewpoint of decreasing non-conformityand DPMO, increasing effectiveness and sigma level, decreasing process variability, their stabilization,the search, and analysis of causes of non-conformity occurrence, proposals to eliminate the causesof non-conformity occurrence, process control, a procedure of the measurements and verification ofcorrective measures, process management, the usage of methods and tools of descriptive statistics, theusage of modules of industrial statistics, and Six Sigma modules.
The model introduces one cycle of improvement of process performance via the improvement ofan identified critical process, which can be constantly repeated and, so, constantly increased processperformance. It is illustrated in Figure 6.
110
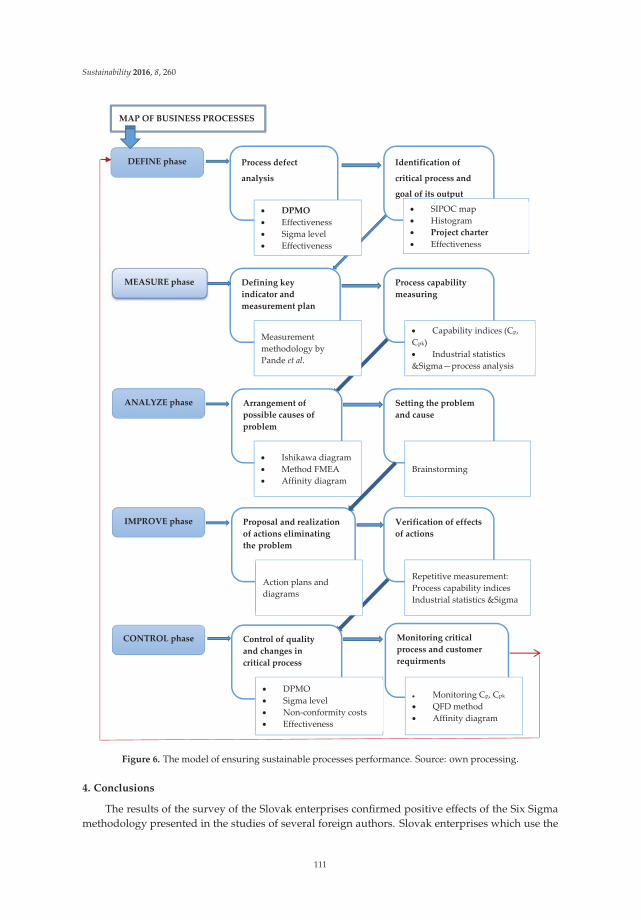
Sustainability 2016, 8, 260
MAP OF BUSINESS PROCESSES
DEFINE phase
MEASURE phase
Verification of effectsof actions
Proposal and realizationof actions eliminatingthe problem
Arrangement ofpossible causes ofproblem
Setting the problemand cause
Identification of
critical process and
goal of its output
Process defect
analysis
Process capabilitymeasuring
Defining keyindicator andmeasurement plan
ANALYZE phase
Control of qualityand changes incritical process
Monitoring criticalprocess and customerrequirments
CONTROL phase
IMPROVE phase
SIPOC mapHistogramProject charterEffectiveness
DPMOSigma levelNon conformity costsEffectiveness
DPMOEffectivenessSigma levelEffectiveness
Measurementmethodology byPande et al.
Capability indices (Cp,Cpk)
Industrial statistics&Sigma—process analysis
Ishikawa diagramMethod FMEAAffinity diagram
Brainstorming
Action plans anddiagrams
Repetitive measurement:Process capability indicesIndustrial statistics &Sigma
Monitoring Cp, Cpk
QFD methodAffinity diagram
Figure 6. The model of ensuring sustainable processes performance. Source: own processing.
4. Conclusions
The results of the survey of the Slovak enterprises confirmed positive effects of the Six Sigmamethodology presented in the studies of several foreign authors. Slovak enterprises which use the
111
Sustainability 2016, 8, 260
methodology achieve not only higher performance of business processes, but also higher corporateperformance. Moreover, the dependency of achieved corporate performance on the use of SixSigma was statistically confirmed. The application of Six Sigma methodology in practical conditionsof Slovak enterprises producing furniture confirmed achievement of better results in the field ofensuring and improving the quality of production processes, an increase of savings on costs ofclaims and nonconforming products, and a possibility to implement measures to eliminate causes ofnon-conformity occurring in a process.
The limitations of the research study consist in the insufficient statistical confirmation ofdependency on SSM on a certified quality management system because of a small number ofinvestigated enterprises with an implemented Six Sigma concept. The next part of the work wasfocused on two specific cases: two furniture manufacturing enterprises from 500 existing furniturecompanies in Slovakia. Therefore, a generalization will require further careful investigation.
Despite the above-mentioned limitations, the research study proved a possibility to implement theSix Sigma methodology and to use the same methods in enterprises, aside from a quality managementsystem, such as quality management under certification according to ISO 9001 standards or onlyutilizing the basic tools of quality management.
The results of the study further showed that better results were achieved in the enterprise whichhas introduced a quality management system. Therefore, we may claim that quality managementsystems form better grounds to implement Six Sigma and the achievement of higher benefits.
The results of this work develops contemporary knowledge in assumptions and limitations by theapplication of Six Sigma methodology and its tools in connection with quality management systemsand they indicate a direct dependence with a level of corporate performance. The contribution ofthe research study can be considered in the first application of SSM in enterprises within specificconditions of furniture production processes.
The practical implications of the research can be seen in the suggested model, includingprocedures, suitable methods, and tools for implementation and permanent utilization of SSM inmanufacturing enterprises. The suggested model of sustainably ensuring the required performance ofprocesses enables monitoring and unveils the critical moments of processes, constantly, and eliminatethem, subsequently. The model presents a never-ending cycle, which ensures sustainable processperformance. The SSM and a suitable selection of tools are the means of a constant assurance andincrease of business processes performance. Six Sigma provides a permanent improvement of processesby the effective use of methods, tools, techniques, and procedures, particularly by decreasing variabilityand variance of processes, by an increase of capability of processes.
Further research will be focused on the utility of other modern methods and tools by ensuringa sustainable process performance and its continual improvement with higher effects than SSM,especially in enterprises without a certified quality management system. The research work willalso deal with other aspects of process improvement, such as process economic efficiency and leanprocesses leading to the suggestion of a methodology for complex improvement of the process.
Acknowledgments: This article has been supported by funds of the project No. 1/0286/16 under VEGA agency,Slovakia for covering the publishing costs.
Author Contributions: Andrea Sujova designed the study and conducted literature review. Lubica Simanovaperformed case study in enterprises. Katarina Marcinekova processed research data and performed statisticalanalyses. The first author wrote the manuscript and all authors read and approved the final manuscript.
Conflicts of Interest: The authors declare no conflict of interest.
112
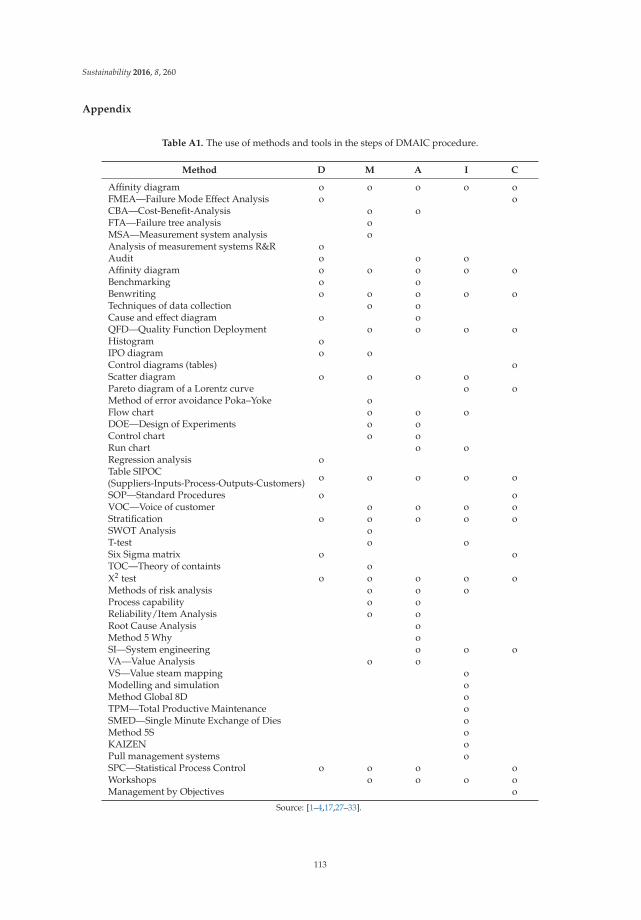
Sustainability 2016, 8, 260
Appendix
Table A1. The use of methods and tools in the steps of DMAIC procedure.
Method D M A I C
Affinity diagram o o o o oFMEA—Failure Mode Effect Analysis o oCBA—Cost-Benefit-Analysis o oFTA—Failure tree analysis oMSA—Measurement system analysis oAnalysis of measurement systems R&R oAudit o o oAffinity diagram o o o o oBenchmarking o oBenwriting o o o o oTechniques of data collection o oCause and effect diagram o oQFD—Quality Function Deployment o o o oHistogram oIPO diagram o oControl diagrams (tables) oScatter diagram o o o oPareto diagram of a Lorentz curve o oMethod of error avoidance Poka–Yoke oFlow chart o o oDOE—Design of Experiments o oControl chart o oRun chart o oRegression analysis oTable SIPOC(Suppliers-Inputs-Process-Outputs-Customers) o o o o o
SOP—Standard Procedures o oVOC—Voice of customer o o o oStratification o o o o oSWOT Analysis oT-test o oSix Sigma matrix o oTOC—Theory of containts oX2 test o o o o oMethods of risk analysis o o oProcess capability o oReliability/Item Analysis o oRoot Cause Analysis oMethod 5 Why oSI—System engineering o o oVA—Value Analysis o oVS—Value steam mapping oModelling and simulation oMethod Global 8D oTPM—Total Productive Maintenance oSMED—Single Minute Exchange of Dies oMethod 5S oKAIZEN oPull management systems oSPC—Statistical Process Control o o o oWorkshops o o o oManagement by Objectives o
Source: [1–4,17,27–33].
113
Sustainability 2016, 8, 260
References
1. Carvalho, G.; Christo, E.S.; Costa, K.A. Application of Six Sigma Methodology in Improving of the IndustrialProduction Processes. Appl. Mech. Mater. 2014, 9, 327–331. [CrossRef]
2. Ev, G.; Scaria, J. Reducing rejection and rework by application of Six Sigma methodology in manufacturingprocess. Int. J. Six Sigma Compet. Advant. 2010, 1, 77–99.
3. Korenko, M.; Uhrin, P.; Kaplík, P.; Foldešiová, D. Application of Six Sigma Methodology in ProductionOrganization. Adv. Mater. Res. 2013, 9, 87–94.
4. Al-Agha, O.; Alzubaidi, A.J.; Al-Agha, M.I. Implementing Six Sigma Methodology in Industrial ControlSystems. Int. J. Comput. Appl. Technol. 2015, 5, 2229–6093.
5. Kaushik, P.; Khanduja, D.; Mittal, K. A case study: Application of Six Sigma methodology in a small andmedium-sized manufacturing enterprise. TQM J. 2012, 1, 4–16. [CrossRef]
6. Rabeea, O.; Al-Mfraji, M.; Almsafir, M.K. Sustainable Competitive Advantage Using Six Sigma Methodology:Review. J. Mod. Mark. Res. 2012, 1, 10–26.
7. Schroeder, R.A. Six Sigma: The Breakthrough Management Strategy Revolutionizing the World’s Top Corporations;Currency: Sydney, Australia, 2006.
8. Sahu, N.; Sridhar, N. Six Sigma Implementation using DMAIC approach: A case Study in a Cylinder Linearmanufacturing Firm. Int. J. Mech. Product. Eng. Res. Dev. 2013, 4, 11–22.
9. Ng, K.C.; Chong, K.E.; Goh, G.G.G. Improving Overall Equipment Effectiveness (OEE) through the sixsigma methodology in a semiconductor firm: A case study. In Proceedings of International Conference onIndustrial Engineering and Engineering Management, Selangor, Malaysia, 9–12 December 2014; pp. 833–837.
10. Gibbons, P.M. Incorporating six sigma thinking and asset management strategy performance indicators intothe overall equipment effectiveness measure. In Proceedings of the second European Research Conferenceon Continuous Improvement and Lean Six Sigma, Bristol, UK, 18 January 2010.
11. Kadri, S. Six Sigma Methodology for the Environment Sustainable Development. In Mechanism Design forSustainability, 1st ed.; Luo, Z., Ed.; Springer: Berline, Germany, 2013; pp. 61–76.
12. Sin, A.B.; Zailani, S.; Iranmaneshb, M.; Ramayah, T. Structural equation modelling on knowledge creationin Six Sigma DMAIC project and its impact on organizational performance. Int. J. Product. Econ. 2015, 168,105–117.
13. Jacobs, B.W.; Swink, M.; Linderman, K. Performance effects of early and late Six Sigma adoptions. J. Oper.Manag. 2015, 36, 244–257. [CrossRef]
14. Karthi, S.; Devadasan, S.R.; Murugesh, R.; Sreenivasa, C.G.; Sivaram, N.M. Global views on integrating SixSigma and ISO 9001 certification. Total Qual. Manag. Bus. Excell. 2012, 23, 237–262. [CrossRef]
15. Chiarini, A. Relationships between total quality management and Six Sigma inside European manufacturingcompanies: A dedicated survey. Int. J. Product. Qual. Manag. 2013, 11, 179–194. [CrossRef]
16. Chiarini, A. A comparison between companies’ implementation of Six Sigma and ISO 13053 requirements:A first investigation from Europe. Int. J. Process Manag. Benchmarking 2013, 3, 154–172. [CrossRef]
17. Töpfer, A. Six Sigma, 1st ed.; Computer Press: Praha, Czech Republic, 2008; p. 287.18. Simanova, L. Specific Proposal of the Application and Implementation Six Sigma in Selected Processes of the
Furniture Manufacturing. Procedia Econ. Financ. 2015, 34, 268–275. [CrossRef]19. Albliwi, S.A.; Antony, J.; Lim, S.A.H. A systematic review of Lean Six Sigma for the manufacturing industry.
Bus. Process Manag. J. 2015, 21, 665–691. [CrossRef]20. Kuvvetli, Ü.; Firuzan, A.R.; Alpaykut, S.; Gerger, A. Determining Six Sigma success factors in Turkey by
using structural equation modeling. J. Appl. Stat. 2016, 43, 738–753. [CrossRef]21. Arumugam, V.; Antony, J.; Kumar, M. Linking learning and knowledge creation to project success in Six
Sigma projects: An empirical investigation. Int. J. Product. Econ. 2013, 141, 388–402. [CrossRef]22. Pande, P.S.; Neumann, P.R.; Cavanagh, R.R. Zavádíme Metodu Six Sigma, 1st ed.; TwinsCom: Brno,
Czech Republic, 2008.23. Fan, J.J.; Fan, J.; Qian, C.; Yung, K.; Fan, X.; Zhang, G.; Pecht, M. Optimal Design of Life Testing for
High-Brightness White LEDs Using the Six Sigma DMAIC Approach. IEEE Trans. Device Mater. Reliab. 2015,15, 576–587. [CrossRef]
24. Dora, M.; Gellynck, X. Lean Six Sigma Implementation in a Food Processing SME: A Case Study. Qual. Reliab.Eng. Int. 2015, 31, 1151–1159. [CrossRef]
114
Sustainability 2016, 8, 260
25. Ericsson, E.; Gingnell, L.; Lillieskold, J. Implementing Design for Six Sigma in large Swedish productdeveloping organisations-an interview study. Total Qual. Manag. Bus. Excell. 2015, 26, 648–660. [CrossRef]
26. Aldowaisan, T.; Nourelfath, M.; Hassan, J. Six Sigma performance for non-normal processes. Eur. J. Oper.Res. 2015, 247, 968–977. [CrossRef]
27. Chao-Ton, S.; Chia-Jan, C. A Systematic Methodology for the Creation of Six Sigma Projects: A Case Studyof Semi-conductor Foundry. Expect Syst. Appl. 2008, 34, 2693–2703.
28. Pyzdek, T.; Keller, P. The Six Sigma Handbook, 4th ed.; McGraw-Hill Professional: London, UK, 2014.29. Okpala, K.E. Total Quality Management and SMPS Performance Effects in Nigeria: A Review of Six Sigma
Methodology. Asian J. Financ. Account. 2012, 2, 363–378. [CrossRef]30. Sanchez, J.; Valles, A. Successful Projects from the Application of Six Sigma Methodology. In Six Sigma
Projects and Personal Experiences; InTech: Rijeka, Croatia, 2011; pp. 91–116. Available online: https://www.researchgate.net/publication/221913365 (accessed on 19 November 2015).
31. Prashar, A. Using Shainin DOE for Six Sigma: An Indian case study. Product. Plan. Control 2016, 27, 83–101.[CrossRef]
32. Vinod, M.; Devadasan, S.R.; Sunil, D.T.; Thilak, V.M.M. Six Sigma through Poka-Yoke: A navigation throughliterature arena. Int. J. Adv. Manuf. Technol. 2015, 81, 315–327. [CrossRef]
33. Nenadál, J.; Plura, J. Moderní Management Jakosti, 1st ed.; Management Press: Praha, Czech Republic, 2008;pp. 348–354.
34. Sujova, A. Business Process Performance Management—A Modern Approach to Corporate PerformanceManagement. In Proceedings of International Conference Liberec Economic Forum, Liberec, Czech Republic,16–17 September 2013; pp. 542–550.
35. Sujová, A.; Marcineková, K. Modern Methods of Process Management Used in Slovak Enterprises.Procedia Econ. Financ. 2015, 23, 889–893. [CrossRef]
36. Marcineková, K.; Sujová, A. The Influence of the Process Control Level on the Enterprises’ ROE.Procedia Econ. Financ. 2015, 34, 290–295. [CrossRef]
37. Simanova, L.; Gejdos, P. The Use of Statistical Control Tools to Quality Improving in Furniture Business.Procedia Econ. Financ. 2015, 34, 276–283. [CrossRef]
© 2016 by the authors. Licensee MDPI, Basel, Switzerland. This article is an open accessarticle distributed under the terms and conditions of the Creative Commons Attribution(CC BY) license (http://creativecommons.org/licenses/by/4.0/).
115
sustainability
Article
Risk Management in CriticalInfrastructure—Foundation for Its Sustainable Work
Andrzej Bialas
Institute of Innovative Technologies EMAG, 40-189 Katowice, Leopolda 31, Poland; [email protected];Tel.: +48-32-200-77-00; Fax: +48-32-200-77-01
Academic Editors: Adam Jabłonski, Giuseppe Ioppolo and Marc A. RosenReceived: 24 October 2015; Accepted: 26 February 2016; Published: 4 March 2016
Abstract: The paper concerns research related to the European project CIRAS and presents avalidation experiment with the use of a risk management tool adapted for critical infrastructures.The project context and state of the art are discussed. The adaptation of the risk management toolis performed according to previously elaborated requirements which consider interdependencies,cause-consequences analysis, risk measures and risk register implementation. A novel structured riskmanagement method was proposed how to deal with internal and external impacts of a hazardousevent which occurred in the given CI. The method is embedded into the critical infrastructureresilience process. These requirements can be implemented on the ready-to-use software platform forfurther experiments. The experimentation results are used as the input for CIRAS. The discussedtool can be applied as the risk reduction component in the CIRAS Tool, and the validation processpresented here is the basis to elaborate two project use cases.
Keywords: critical infrastructure; risk management; bow-tie concept; software tool; interdependencies
1. Introduction
The paper concerns the risk management issue in critical infrastructures. Today’s societies arebased on products and services provided by large-scale technical infrastructures of such sectorsas energy, oil, gas, finances, transport, telecommunications, health, etc. These infrastructures,when disrupted or destroyed, have a serious impact on health, safety, security or well-being ofthe society or effective functioning of governments and/or economies, therefore they are called criticalinfrastructures (CIs). Smooth functioning of the CIs builds right relationships between the citizensand governments. Modern societies are very sensitive to any disturbances in critical infrastructures.The CI disturbances or damages hamper the economic growth, social prosperity and sustainabledevelopment of our civilization. For this reason, it is very important to mitigate any negative impact oncritical infrastructures. Risk management, which plays the key role in the CI protection, still remains achallenge due to many unresolved problems. This was the author’s motivation to undertake researchin this field.
CI is identified as a very complex socio-technical system, sometimes called a system ofsystems. The system of systems (SoS) consists of multiple, heterogeneous, distributed, occasionallyindependently operating systems embedded in networks at multiple levels, which evolve over time [1].To function properly, CIs include many diversified components (technological, IT hardware, software,environmental, personal, organizational) and complex processes interrelated with other processesacross different economy sectors.
In such environments different kinds of threats and hazards may occur, such as: natural disastersand catastrophes, technical disasters and failures, espionage, international crime, physical and cyberterrorism. To avoid disturbances in CIs and to minimize possible consequences of threats, critical
Sustainability 2016, 8, 240; doi:10.3390/su8030240 www.mdpi.com/journal/sustainability116
Sustainability 2016, 8, 240
infrastructure protection (CIP) programmes are implemented, which specify a consistent set ofdiversified security measures applied for the given CI: technical, organizational and procedural.The measures should properly affect the identified risk. The measures selection is based on riskmanagement principles.
1.1. Resilience and Risk Management in Critical Infrastructures
Risk management is a continuous process including the identification, analysis, and assessmentof potential hazards in a system or hazards related to a certain activity. Based on the recognized riskpicture, the risk control measures are proposed to eliminate or reduce potential harms to people,environment, or other assets. The risk management process encompasses risk monitoring andcommunication. ISO 31000 [2] is the basic risk management standard. Examples of the most recognizedrisk management methods and techniques are included in IEC 31010 [3].
The risk management issue in critical infrastructures has a specific character because CIs are verycomplex, diversified and there are mutual interrelations between different infrastructures. Becauseof relationships between infrastructures, the state of each infrastructure influences or is correlated tothe state of the other. They are called interdependencies [4–7] and can be divided to four categories:physical, cyber, geographical and logical interdependency. The effects of an incident may propagateacross CIs with dire consequences. The paper takes into account interdependencies, however thecomplex interdependencies issues are not the basic topic of the paper.
Well-secured CIs can resist external and internal disturbances and are able to work on anacceptable efficiency level even when these disturbances occur. To improve the CI resilience is the mainobjective of CI stakeholders. The CIs resilience is an effective, sustainable use of critical infrastructuresby stakeholders to perform tasks for the economy, government and citizens. “The concept of resiliencecan be seen as a superset in which typical risk assessment is a complementary part” [6]. The followingactivities leading to the CI resilience are proposed in this publication:
‚ preparing the CI specification based on the structural analysis—the most critical elements, the mostvulnerable points, dependencies and interdependencies are identified; please note: dependencydefines a unidirectional relationship between infrastructures, while interdependency defines abidirectional relationship;
‚ running the dynamic analysis to identify the most dangerous risk scenarios—generally the subjectof analysis or simulation are: propagation of dire effects of CIs phenomena, identification ofthe threats impact, analyses of common failures, system response to a failure or an incident,recovery process, etc.
‚ the most dangerous risk scenarios, prioritized, are taken into account later during the riskmanagement process.
1.2. Research Related to the CIRAS Project
The critical infrastructure protection is recognized in European Union (EU) as one of the keyissues. The CIP related needs on the EU and member-state levels are expressed in the EuropeanCouncil (EC) Directive [8]. It specifies rules of the CI identification based on the casualties, economicsand public criteria, as well as the risk analysis issues and management programmes. In 2006 theEuropean Programme for Critical Infrastructure Protection (EPCIP) was issued. A revised version isincluded in the EC document [9].
The CIP programmes encompass diversified (physical, technical, organizational) countermeasures,applied on the basis of risk. The risk management issue in CIs is extremely important and hasnot been fully solved so far. There are several dozen EU or worldwide CIP R&D projects, eitheralready completed or currently running (Framework Programmes—FP6 and FP7, Horizon 2020,The Prevention, Preparedness and Consequence Management of Terrorism and other Security-related
117
Sustainability 2016, 8, 240
Risks Programme—CIPS). Most of them deal with risk management methodologies and theirsupporting tools. The CIRAS (Critical Infrastructure Risk Assessment Support) project [10] is one of them.
The paper concerns a preliminary research of the CIRAS project. CIRAS was launched by theinternational consortium comprising:
‚ ATOS Spain SA (ATOS),‚ Center for European Security Strategies from Germany (CESS),‚ Institute of Innovative Technologies EMAG from Poland (EMAG).
The CIRAS objective is to develop a methodology and tool to support decision makers in thesecurity measures selection for critical infrastructures. The CIRAS approach to security managementin critical infrastructure protection takes into account typical CI phenomena like interdependencies,cascading and escalation of incident impacts.
The novelty of the CIRAS approach lies in a holistic assessment of all aspects of CIs securitymeasures, including the expected risk reduction and its cost, financial benefits, as well as many vaguesocio-political factors to be considered in the security planning process. To select the right securitymeasure (countermeasure) according to the CIRAS methodology, the decision maker should select acountermeasure that:
‚ properly reduces the risk volume to ensure security on an accepted level and to bring benefits forCI stakeholders,
‚ is cost-effective during implementation and operation,‚ is free of social, psychological, political, legal, ethical, economical, technical, environmental,
and other limitations; these vague factors in the project are called “qualitative criteria”.
To support the decision making process, these issues are solved by three separate pillars,implemented as the key software components of the CIRAS Tool:
‚ a Risk Reduction Assessment (RRA) component,‚ a Cost-Benefit Assessment (CBA) component,‚ a Qualitative Criteria Assessment (QCA) component.
The CIRAS approach is based on the methodology elaborated in the FP7 (Seventh FrameworkProgramme) ValueSec project [11]. Both the ValueSec and CIRAS methodologies support thedecision making process using these three pillars, but the domains of applications and the pillarsimplementation approaches are different. Please note that the critical infrastructure domain, due to itsspecific phenomena caused by interdependencies, is much more complex than the ValueSec applicationdomains (mass event security, mass transportation security, communal security planning, air transportsecurity, protection against cyber-attacks on a smart grid). The CIs complexity influences the shape ofthe RRA, CBA and QCA components as well as the components collaboration within the frameworkimplemented in the CIRAS Tool.
Research was performed by the project team members to elaborate the CIRAS methodology andto design and implement it in the CIRAS Tool. The project uses four main inputs:
‚ an extensive review of the state of the art of risk management, cost-benefits, and decision supportmethodologies and tools, especially those for critical infrastructure protection,
‚ conclusions from the CIRAS stakeholders’ workshops,‚ experience gained by the CIRAS team members from the ValueSec project, particularly concerning
the pillars implementation.
This paper deals with a part of this research focused on the RRA component implementation.The problems addressed are:
‚ how to find and adapt a tool to be the RRA component,
118
Sustainability 2016, 8, 240
‚ how to develop a new tool, according to the project requirements, if the above is not possible.
The RRA component should satisfy the project requirements:
‚ the basic requirements for CI risk management tools identified in [12], and‚ the project specific requirements identified by the consortium with the stakeholders’ help, i.e., RRA
should be able to properly manage the risk in critical infrastructures by selecting security measureswith the right cost-benefits parameters and free of vague restrictions, should be able to easilyintegrate with other CIRAS components of the tool, and should be relatively simple.
The research presented in this article was focused on the feasibility of the OSCAD-based RRA.OSCAD (proprietary name) [13] is a ready-made software platform to be adapted and configuredto different domains of application. The CIRAS consortium considered it a candidate for theRRA component.
This paper presents research which allowed to assess whether OSCAD can fulfil the projectrequirements and whether it can be used as the RRA component of the CIRAS Tool.
As a result of the experiment a novel approach is proposed how to deal with internal and externalimpacts of a hazardous event which occurred in the given CI. It allows to distinguish three maincategories of impacts: direct CI damages, event escalation by breaching internal security barriers andcausing secondary damages, event escalation from the given CI on the dependent CIs. The elaboratedstructured risk management method for critical infrastructures is embedded into the CI resilienceprocess. The method is implemented in the OSCAD-CIRAS experimental tool. The tool allows toassess critical infrastructure damages in several time horizons and to assess several security measuresalternatives with respect to the risk reduction and cost-benefits parameters.
1.3. State of the Art
During the CIRAS project a review [4,14–16] of laws, standards, frameworks, methods and toolswas performed and summarized in [17].
The review confirms that the risk management issue in critical infrastructures is much morecomplicated than in other domains of application. It is specific due to the following factors:
‚ unprecedented CIs complexity, even when compared to very large business organizations ortechnical facilities,
‚ continuous evolution and enhancement of critical infrastructures,‚ mutual interrelations between different infrastructures (interdependencies),‚ problem diversity—the risk management issue is related to many other issues, like: complex
systems architectures, interdependencies, complex interactions, behavioral aspects, reliabilitytheory, vulnerability analysis, resilience, emerging behavior,
‚ knowledge of architecture and functioning principles of complex systems is fuzzy and thedata incomplete,
‚ different abstraction levels applied to manage CIs and cross-sectoral relations,‚ high-impact and low-probability events may occur,‚ increased needs for communication and coordination among the CI operators.
The review shows that a significant number of risk assessment methods and tools can be appliedin the critical infrastructure domain. Usually, they were developed for different organizations to solvetheir technical or organizational risk-related problems within the limited environments, and initiallythey were not dedicated to critical infrastructures. Later, many of them were adapted to CI needs.Usually, they are very mature, sector-specific, represent the detailed approach to the risk issue andcan be easily applied on the lower level of the CI hierarchy. Their basic features are: threats andvulnerabilities categorization and identification, and the evaluation of impacts. Only few tools are ableto operate on the higher CI hierarchy level. This group is still extended.
119
Sustainability 2016, 8, 240
Risk management methods are very diverse and their shapes and abstraction levels depend onthe levels of CIs where they are used. For example, a CI operator needs a more detailed approach thana policy maker working on the system-of-systems level, and the tool implemented for the CI assetlevel is more detailed than the tool for the CI operator. Generally, a higher CI level requires a moregeneral approach.
The asset level methods and tools are adapted to higher levels but this generates problemshow to handle cross-sectoral dependencies. This issue has been examined by many researchers.The challenge is how to adapt risk assessment methods used on the CI lower level to the higher level(complex system) needs.
The interdependency methodologies, supporting risk management methodologies, are growingin a parallel manner to each other. They are based on modeling and simulation techniques [6]. They arecrucial to ensure the CI resilience, and in this sense they also support risk management methodologies.Many general purpose risk managers are not able to use input from the interdependencies analysis.
The review confirms that it is very hard to point out a tool which can be applied in the CIRAS Tool.There are many tools which satisfy certain basic requirements and are able to assess and manage therisk in critical infrastructures, however they do not address sufficiently the CIRAS project requirements,especially those related to the following issues:
‚ cross-sectoral risk management,‚ cooperation with the CBA and QCA components (using cost, benefit, and vague factors in the risk
management process),‚ operations on the alternative packages of countermeasures,‚ easy integration (connectivity, source code availability, commonly used technologies).
During the review the OSCAD was analyzed in comparison with other tools. This is a generalpurpose tool (software platform) which, when developed, was not intended especially for CIs. The toolis very flexible. Its functionality satisfies the basic CI risk management requirements and there is alsoa chance to meet the CIRAS project requirements. The paper presents research allowing to explainthese issues.
1.4. Paper Content
The paper presents the following: a risk management study (Section 2) including theexperimentation platform requirements, risk assessment method description, implementation of therequirements on the ready-made software platform, experiment plan workout, and the experimentationprocess. Section 3 includes the experimentation summary, and Section 4—the paper summary.
2. Risk Management Case Study
The case study is focused on the analysis how particular project requirements can be fulfilled bythe OSCAD-based RRA, and shows step by step how this component has been developed according tothe proposed risk management method.
2.1. General Requirements for Experimental Risk Manager
Basic requirements for the CI risk management tool were discussed in [12]. Summarizing thisdiscussion, the following requirements were proposed:
(1) The CI specific phenomena, such as common cause failures, cascading and escalating effects,as well as interdependencies between CIs [5] should be considered in the risk management process.
(2) The bow-tie risk concept [4,18] is recommended for implementation as the conceptual modelof the risk assessment tool. It embraces both causes of the given hazardous event and its diversifiedand multidirectional consequences.
120
Sustainability 2016, 8, 240
(3) The CI risk register, as the managed inventory of hazardous events used in CIP programmes,should include at a minimum: related hazards/threats, corresponding hazardous event, probabilityof the event and its consequences. There are some other data associated with the risk register items,such as assets, societal critical functions, vulnerabilities, countermeasures, etc.
(4) Risk measures and the assessment process should be defined for the given application domain.A common method is to assess the likelihood (probability, frequency) of a hazardous event, and toassess the consequence severity in different dimensions. Risk is the function of both, usually expressedby a risk matrix.
The following issues are relevant with respect to the CIRAS project requirements:
(1) The RRA component should be able:
‚ to assess risk before a measure is implemented and reassess the risk for a certain number ofsecurity measures alternatives considered for implementation,
‚ to consider cross-sectoral dependencies,‚ to take into account cost-benefits factors and qualitative criteria dealing with the security
measures alternatives.
(2) RRA should exchange information with the CBA and QCA components during the decisionprocess dealing with the security measures selection.
(3) RRA component should consider the CI specific phenomena, analyze causes and impacts ofhazardous events, and manage the risk register data.
The data exchange between the components cannot be fully demonstrated, because thecomponents have not been integrated yet.
2.2. Implementation Platform
The OSCAD software platform was chosen as the research platform [13]. Initially, this platformwas designed to support business continuity management in accordance with ISO 22301 andinformation security management in accordance with ISO/IEC 27001. The software can identifydifferent disturbances of business processes and/or breaches of information assets in differentcompanies and organizations. OSCAD helps to reduce their losses, caused by incidents, and cansupport the recovery process too. OSCAD is an open and flexible tool, therefore it can be adapted toprotect assets or processes in different application domains, e.g.,: flood protection [19], railway safetymanagement systems [20] and coal mining [21]. The risk management functionality of OSCAD is ofkey importance to the protection of critical infrastructures.
OSCAD is equipped with risk assessment tools which analyze the causes of hazardous events(pairs: threat-vulnerability with respect to the asset or process):
‚ Asset Oriented Risk Analyzer (AORA),‚ Process Oriented Risk Analyzer (PORA).
AORA is used to calculate risk levels of critical assets and risk reduction levels after securitymeasures implementation. The analysis is conducted for the given asset with the related threats whichexploit the asset vulnerabilities. The impact and likelihood values of threats and the current values ofsecurity measures are used to determine the inherent risk level. After applying new security measures,the risk level is reassessed and the gain in risk reduction can be determined. The PORA analysis issimilar, however, it is focused on causes of the processes disturbances.
Moreover, OSCAD is equipped with tools which are able to analyze multidimensional impacts ofhazardous events:
‚ Asset Oriented Business Impact Analyzer (ABIA),‚ Process Oriented Business Impact Analyzer (PBIA).
121
Sustainability 2016, 8, 240
ABIA is used to assess possible impacts of assets loss for an organization (here CI). The assessmentis made according to different loss categories such as: fatalities and qualitative costs (political, social,legal), damages of infrastructure, revenue loss, external costs in other organizations. High loss levelsindicate that security measures should be applied to reduce risk. PBIA is similar, however it concernsimpacts for an organization (here CI), when the processes are disturbed.
As a result of the adaptation, the OSCAD-CIRAS tool prototype was developed [22].The OSCAD adaptation performed by the author encompasses the elaboration of the domain specificsystem dictionaries, e.g., assets, threats, vulnerabilities, countermeasures, risk measures, softwareconfiguration, etc. OSCAD-CIRAS can be used as an experimental tool to acquire knowledge andexperience which will then be used as an input to the CIRAS project.
2.3. Requirements Implementation on the Ready-Made Software Platform
The paper extends the works presented in [23] and deals with risk management experimentsconducted with the use of the ready-made open OSCAD software platform, which was adaptedto fulfill the basic CIs requirements with respect to risk management. It was assumed that oneOSCAD-CIRAS instance, at minimum, can be implemented in one infrastructure. OSCAD-CIRAS isable to co-operate with similar systems working in other infrastructures. This co-operation is focusedmainly on communication during the risk management process [2]. The presented experiment concernsthe railway transport CI co-operating with the electricity CI. To simplify the experiment, both CIs areimplemented in one OSCAD-CIRAS.
Risk management items implemented in OSCAD-CIRAS comply with the taxonomy included inthe EC Directive [8], which distinguishes two groups of CIs: ECI (European CI), embraced by the ECDirective, and others (non-ECI). Assets and other items belonging to the given CI are preceded by alabel being the abbreviation of a CI name: Ele (Electricity), Oil (Oil), Gas (Gas), RoT (Road Transport),RaT (Rail Transport), AiT (Air Transport), IWT (Inland Waterways Transport), Sea (Ocean and Short-SeaShipping and Ports).
Based on the discussed below requirements a structured risk management method was developedand presented in Subsection 2.4 (Figure 6).
2.3.1. Interdependencies and CI-specific Issues—Input from Resilience Analysis
Critical infrastructure is a complex socio-technical system which interacts with similar systemsworking in other application domains. These interactions are considered on different layers (e.g., on theCI operator layer, sector layer, intra sector layer) [6].
The risk management process should be extended beyond a single infrastructure, because ahazardous event occurring within the given CI impacts this CI but may also cause problems for otherinteracting CIs, and similarly, the given CI may be impacted by hazardous events which occurred inexternal CIs. The risk management process should be able to consider interdependencies. This issuestill remains a challenge.
OSCAD-CIRAS does not have a specialized functionality to analyze resilience, includinginterdependencies, and for this reason it should be supported externally to get the relevant information.The resilience analysis, producing necessary input, precedes and supports the risk assessment process.
The first kind of input concerns information about interdependencies obtained from the resilienceanalysis, more specifically from its static part focused on the system of systems analysis. During thedependency analysis [6], the following factors are taken into account:
‚ shared resources, shared services,‚ common assets, components, policies,‚ common causes of potential impacts, like: fire, flooding, virus attack, network attack,
communication unavailability.
122
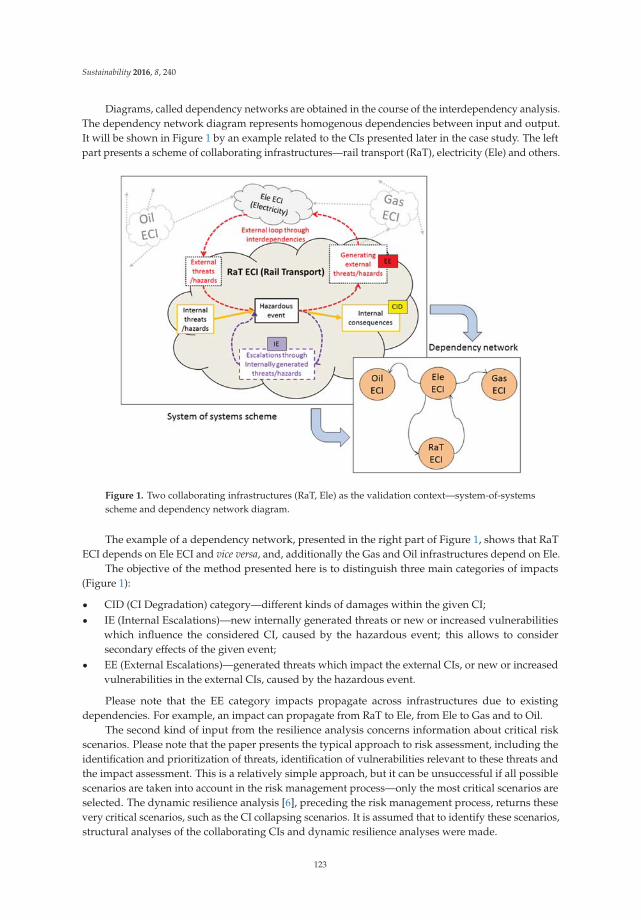
Sustainability 2016, 8, 240
Diagrams, called dependency networks are obtained in the course of the interdependency analysis.The dependency network diagram represents homogenous dependencies between input and output.It will be shown in Figure 1 by an example related to the CIs presented later in the case study. The leftpart presents a scheme of collaborating infrastructures—rail transport (RaT), electricity (Ele) and others.
Figure 1. Two collaborating infrastructures (RaT, Ele) as the validation context—system-of-systemsscheme and dependency network diagram.
The example of a dependency network, presented in the right part of Figure 1, shows that RaTECI depends on Ele ECI and vice versa, and, additionally the Gas and Oil infrastructures depend on Ele.
The objective of the method presented here is to distinguish three main categories of impacts(Figure 1):
‚ CID (CI Degradation) category—different kinds of damages within the given CI;‚ IE (Internal Escalations)—new internally generated threats or new or increased vulnerabilities
which influence the considered CI, caused by the hazardous event; this allows to considersecondary effects of the given event;
‚ EE (External Escalations)—generated threats which impact the external CIs, or new or increasedvulnerabilities in the external CIs, caused by the hazardous event.
Please note that the EE category impacts propagate across infrastructures due to existingdependencies. For example, an impact can propagate from RaT to Ele, from Ele to Gas and to Oil.
The second kind of input from the resilience analysis concerns information about critical riskscenarios. Please note that the paper presents the typical approach to risk assessment, including theidentification and prioritization of threats, identification of vulnerabilities relevant to these threats andthe impact assessment. This is a relatively simple approach, but it can be unsuccessful if all possiblescenarios are taken into account in the risk management process—only the most critical scenarios areselected. The dynamic resilience analysis [6], preceding the risk management process, returns thesevery critical scenarios, such as the CI collapsing scenarios. It is assumed that to identify these scenarios,structural analyses of the collaborating CIs and dynamic resilience analyses were made.
123
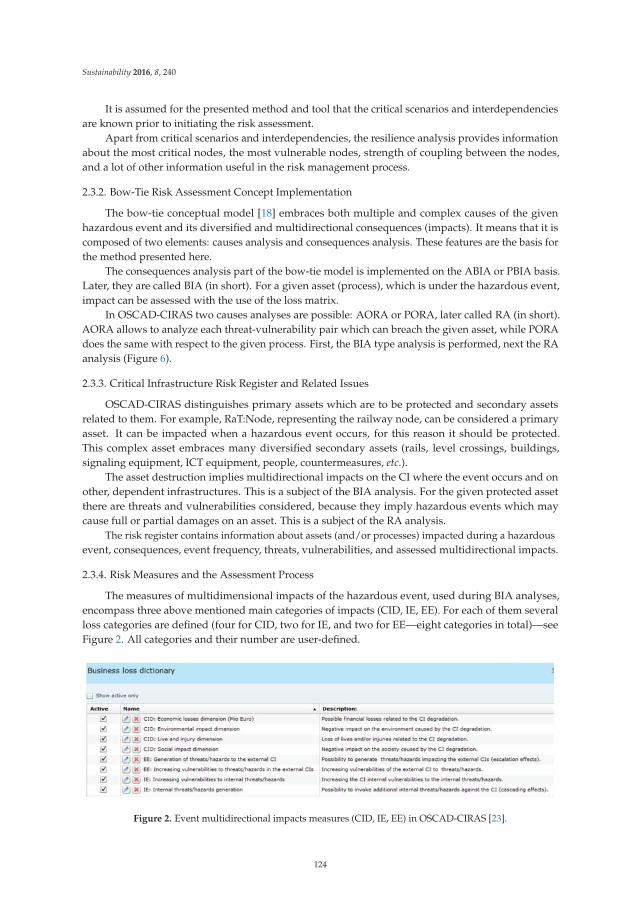
Sustainability 2016, 8, 240
It is assumed for the presented method and tool that the critical scenarios and interdependenciesare known prior to initiating the risk assessment.
Apart from critical scenarios and interdependencies, the resilience analysis provides informationabout the most critical nodes, the most vulnerable nodes, strength of coupling between the nodes,and a lot of other information useful in the risk management process.
2.3.2. Bow-Tie Risk Assessment Concept Implementation
The bow-tie conceptual model [18] embraces both multiple and complex causes of the givenhazardous event and its diversified and multidirectional consequences (impacts). It means that it iscomposed of two elements: causes analysis and consequences analysis. These features are the basis forthe method presented here.
The consequences analysis part of the bow-tie model is implemented on the ABIA or PBIA basis.Later, they are called BIA (in short). For a given asset (process), which is under the hazardous event,impact can be assessed with the use of the loss matrix.
In OSCAD-CIRAS two causes analyses are possible: AORA or PORA, later called RA (in short).AORA allows to analyze each threat-vulnerability pair which can breach the given asset, while PORAdoes the same with respect to the given process. First, the BIA type analysis is performed, next the RAanalysis (Figure 6).
2.3.3. Critical Infrastructure Risk Register and Related Issues
OSCAD-CIRAS distinguishes primary assets which are to be protected and secondary assetsrelated to them. For example, RaT:Node, representing the railway node, can be considered a primaryasset. It can be impacted when a hazardous event occurs, for this reason it should be protected.This complex asset embraces many diversified secondary assets (rails, level crossings, buildings,signaling equipment, ICT equipment, people, countermeasures, etc.).
The asset destruction implies multidirectional impacts on the CI where the event occurs and onother, dependent infrastructures. This is a subject of the BIA analysis. For the given protected assetthere are threats and vulnerabilities considered, because they imply hazardous events which maycause full or partial damages on an asset. This is a subject of the RA analysis.
The risk register contains information about assets (and/or processes) impacted during a hazardousevent, consequences, event frequency, threats, vulnerabilities, and assessed multidirectional impacts.
2.3.4. Risk Measures and the Assessment Process
The measures of multidimensional impacts of the hazardous event, used during BIA analyses,encompass three above mentioned main categories of impacts (CID, IE, EE). For each of them severalloss categories are defined (four for CID, two for IE, and two for EE—eight categories in total)—seeFigure 2. All categories and their number are user-defined.
Figure 2. Event multidirectional impacts measures (CID, IE, EE) in OSCAD-CIRAS [23].
124
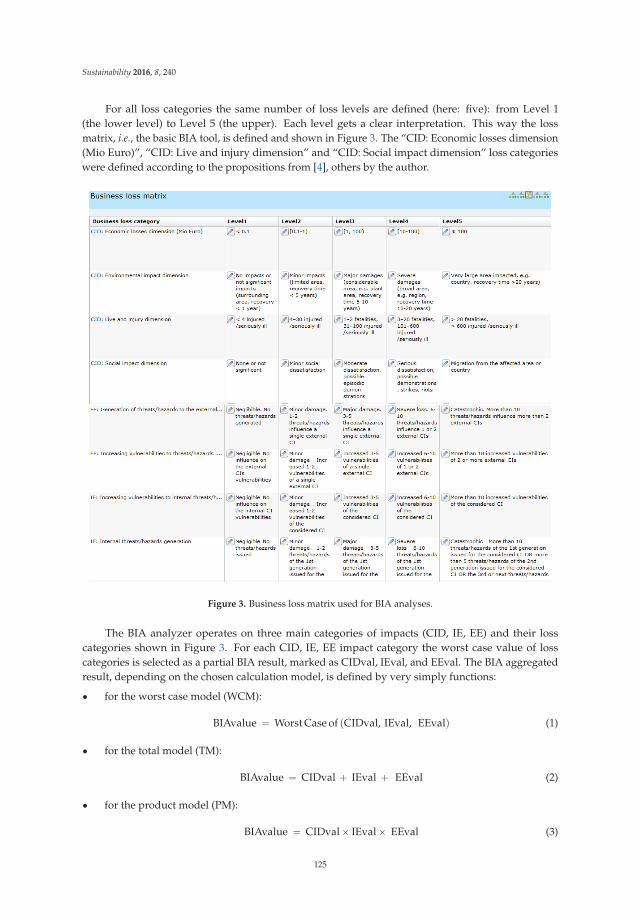
Sustainability 2016, 8, 240
For all loss categories the same number of loss levels are defined (here: five): from Level 1(the lower level) to Level 5 (the upper). Each level gets a clear interpretation. This way the lossmatrix, i.e., the basic BIA tool, is defined and shown in Figure 3. The “CID: Economic losses dimension(Mio Euro)”, “CID: Live and injury dimension” and “CID: Social impact dimension” loss categorieswere defined according to the propositions from [4], others by the author.
Figure 3. Business loss matrix used for BIA analyses.
The BIA analyzer operates on three main categories of impacts (CID, IE, EE) and their losscategories shown in Figure 3. For each CID, IE, EE impact category the worst case value of losscategories is selected as a partial BIA result, marked as CIDval, IEval, and EEval. The BIA aggregatedresult, depending on the chosen calculation model, is defined by very simply functions:
‚ for the worst case model (WCM):
BIAvalue “ Worst Case of pCIDval, IEval, EEvalq (1)
‚ for the total model (TM):
BIAvalue “ CIDval ` IEval ` EEval (2)
‚ for the product model (PM):
BIAvalue “ CIDval ˆ IEval ˆ EEval (3)
125
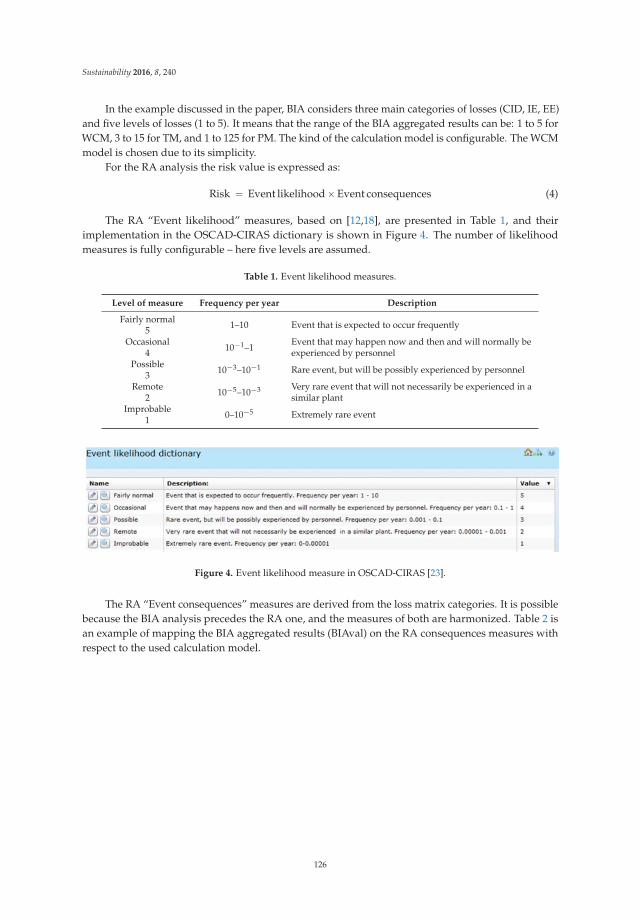
Sustainability 2016, 8, 240
In the example discussed in the paper, BIA considers three main categories of losses (CID, IE, EE)and five levels of losses (1 to 5). It means that the range of the BIA aggregated results can be: 1 to 5 forWCM, 3 to 15 for TM, and 1 to 125 for PM. The kind of the calculation model is configurable. The WCMmodel is chosen due to its simplicity.
For the RA analysis the risk value is expressed as:
Risk “ Event likelihood ˆ Event consequences (4)
The RA “Event likelihood” measures, based on [12,18], are presented in Table 1, and theirimplementation in the OSCAD-CIRAS dictionary is shown in Figure 4. The number of likelihoodmeasures is fully configurable – here five levels are assumed.
Table 1. Event likelihood measures.
Level of measure Frequency per year Description
Fairly normal5 1–10 Event that is expected to occur frequently
Occasional4 10´1–1
Event that may happen now and then and will normally beexperienced by personnel
Possible3 10´3–10´1 Rare event, but will be possibly experienced by personnel
Remote2 10´5–10´3 Very rare event that will not necessarily be experienced in a
similar plantImprobable
1 0–10´5 Extremely rare event
Figure 4. Event likelihood measure in OSCAD-CIRAS [23].
The RA “Event consequences” measures are derived from the loss matrix categories. It is possiblebecause the BIA analysis precedes the RA one, and the measures of both are harmonized. Table 2 isan example of mapping the BIA aggregated results (BIAval) on the RA consequences measures withrespect to the used calculation model.
126
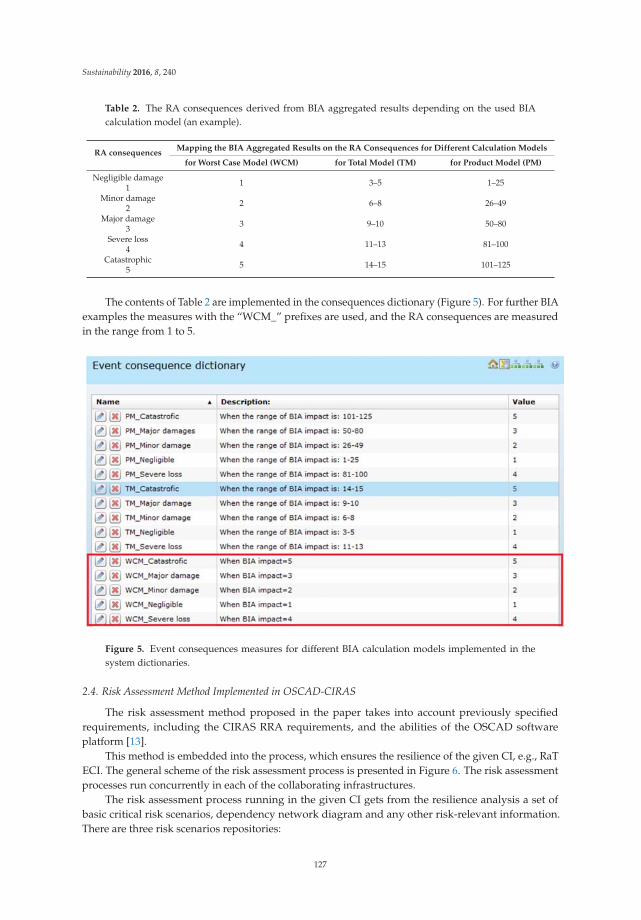
Sustainability 2016, 8, 240
Table 2. The RA consequences derived from BIA aggregated results depending on the used BIAcalculation model (an example).
RA consequencesMapping the BIA Aggregated Results on the RA Consequences for Different Calculation Models
for Worst Case Model (WCM) for Total Model (TM) for Product Model (PM)
Negligible damage1 1 3–5 1–25
Minor damage2 2 6–8 26–49
Major damage3 3 9–10 50–80
Severe loss4 4 11–13 81–100
Catastrophic5 5 14–15 101–125
The contents of Table 2 are implemented in the consequences dictionary (Figure 5). For further BIAexamples the measures with the “WCM_” prefixes are used, and the RA consequences are measuredin the range from 1 to 5.
Figure 5. Event consequences measures for different BIA calculation models implemented in thesystem dictionaries.
2.4. Risk Assessment Method Implemented in OSCAD-CIRAS
The risk assessment method proposed in the paper takes into account previously specifiedrequirements, including the CIRAS RRA requirements, and the abilities of the OSCAD softwareplatform [13].
This method is embedded into the process, which ensures the resilience of the given CI, e.g., RaTECI. The general scheme of the risk assessment process is presented in Figure 6. The risk assessmentprocesses run concurrently in each of the collaborating infrastructures.
The risk assessment process running in the given CI gets from the resilience analysis a set ofbasic critical risk scenarios, dependency network diagram and any other risk-relevant information.There are three risk scenarios repositories:
127
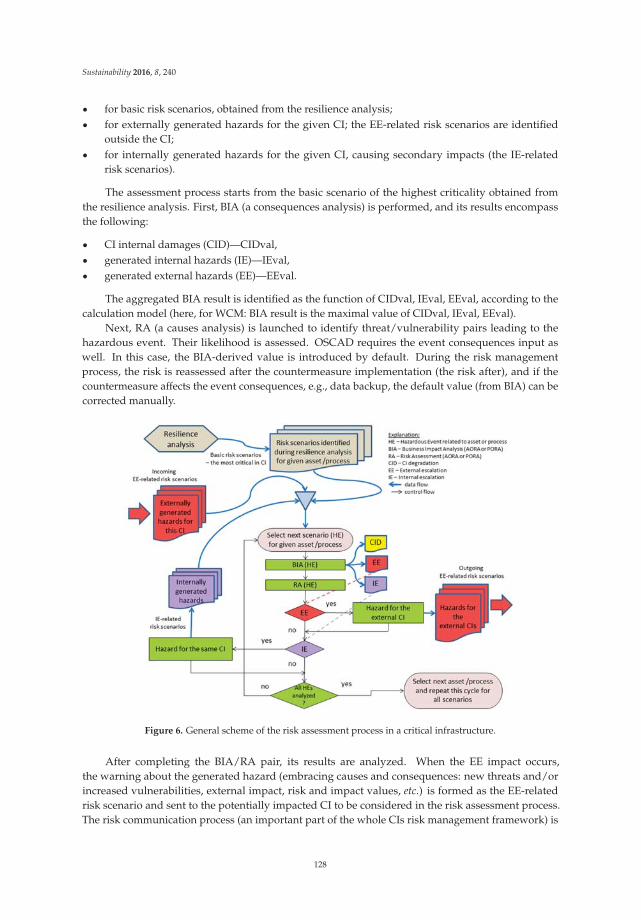
Sustainability 2016, 8, 240
‚ for basic risk scenarios, obtained from the resilience analysis;‚ for externally generated hazards for the given CI; the EE-related risk scenarios are identified
outside the CI;‚ for internally generated hazards for the given CI, causing secondary impacts (the IE-related
risk scenarios).
The assessment process starts from the basic scenario of the highest criticality obtained fromthe resilience analysis. First, BIA (a consequences analysis) is performed, and its results encompassthe following:
‚ CI internal damages (CID)—CIDval,‚ generated internal hazards (IE)—IEval,‚ generated external hazards (EE)—EEval.
The aggregated BIA result is identified as the function of CIDval, IEval, EEval, according to thecalculation model (here, for WCM: BIA result is the maximal value of CIDval, IEval, EEval).
Next, RA (a causes analysis) is launched to identify threat/vulnerability pairs leading to thehazardous event. Their likelihood is assessed. OSCAD requires the event consequences input aswell. In this case, the BIA-derived value is introduced by default. During the risk managementprocess, the risk is reassessed after the countermeasure implementation (the risk after), and if thecountermeasure affects the event consequences, e.g., data backup, the default value (from BIA) can becorrected manually.
Figure 6. General scheme of the risk assessment process in a critical infrastructure.
After completing the BIA/RA pair, its results are analyzed. When the EE impact occurs,the warning about the generated hazard (embracing causes and consequences: new threats and/orincreased vulnerabilities, external impact, risk and impact values, etc.) is formed as the EE-relatedrisk scenario and sent to the potentially impacted CI to be considered in the risk assessment process.The risk communication process (an important part of the whole CIs risk management framework) is
128
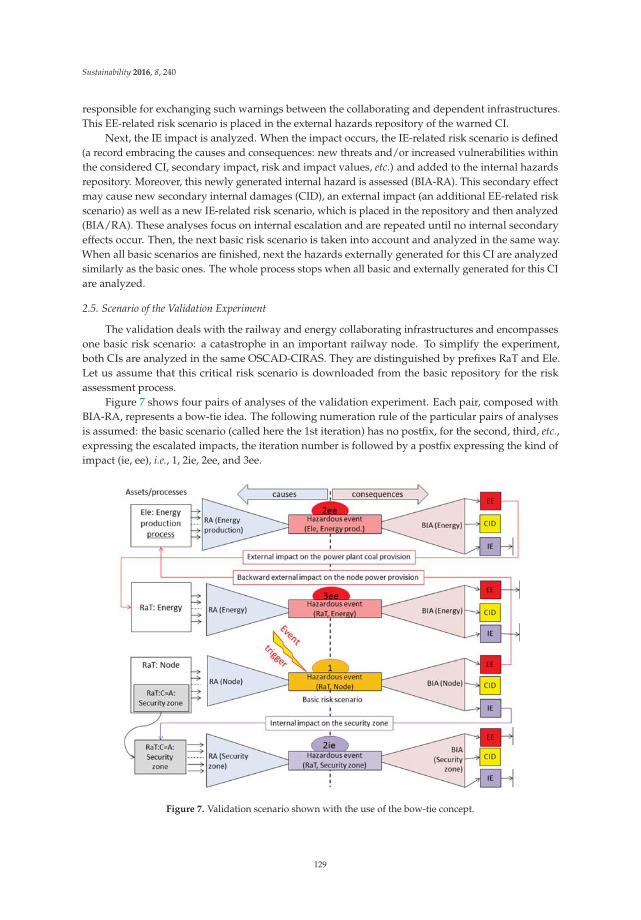
Sustainability 2016, 8, 240
responsible for exchanging such warnings between the collaborating and dependent infrastructures.This EE-related risk scenario is placed in the external hazards repository of the warned CI.
Next, the IE impact is analyzed. When the impact occurs, the IE-related risk scenario is defined(a record embracing the causes and consequences: new threats and/or increased vulnerabilities withinthe considered CI, secondary impact, risk and impact values, etc.) and added to the internal hazardsrepository. Moreover, this newly generated internal hazard is assessed (BIA-RA). This secondary effectmay cause new secondary internal damages (CID), an external impact (an additional EE-related riskscenario) as well as a new IE-related risk scenario, which is placed in the repository and then analyzed(BIA/RA). These analyses focus on internal escalation and are repeated until no internal secondaryeffects occur. Then, the next basic risk scenario is taken into account and analyzed in the same way.When all basic scenarios are finished, next the hazards externally generated for this CI are analyzedsimilarly as the basic ones. The whole process stops when all basic and externally generated for this CIare analyzed.
2.5. Scenario of the Validation Experiment
The validation deals with the railway and energy collaborating infrastructures and encompassesone basic risk scenario: a catastrophe in an important railway node. To simplify the experiment,both CIs are analyzed in the same OSCAD-CIRAS. They are distinguished by prefixes RaT and Ele.Let us assume that this critical risk scenario is downloaded from the basic repository for the riskassessment process.
Figure 7 shows four pairs of analyses of the validation experiment. Each pair, composed withBIA-RA, represents a bow-tie idea. The following numeration rule of the particular pairs of analysesis assumed: the basic scenario (called here the 1st iteration) has no postfix, for the second, third, etc.,expressing the escalated impacts, the iteration number is followed by a postfix expressing the kind ofimpact (ie, ee), i.e., 1, 2ie, 2ee, and 3ee.
Figure 7. Validation scenario shown with the use of the bow-tie concept.
129
Sustainability 2016, 8, 240
The scenario is initiated by the event trigger which occurred in the RaT:Node (please note thenaming convention: CIname:AssetName) primary asset and caused a hazardous event, e.g., intentionalderailment seriously impacting the railway node area.
1st iteration
The “1 BIA(RaT:Node)” analysis identifies multidimensional impacts of this event. Please notethat the impacted asset or process is within the brackets. The internal degradation (mostly financialconsequences) which is caused by an intentional derailment is assessed (CID). BIA proves thatthis event:
‚ impacts the external infrastructure Ele as the coal transport for the power plant is stopped for along time (EE-related risk scenario generated); normally this should imply sending this scenario toOSCAD-CIRAS working in Ele CI, but here both CIs are simulated in one OSCAD-CIRAS instance;
‚ breaches the security zone (countermeasure) which is a secondary asset of RaT:Node; IE-relatedrisk scenario is generated and placed in the internal repository.
The “1 RA(RaT:Node)” analysis identifies causes of the hazardous event and the related risk.Because secondary effects are revealed, they should be further analyzed, causing the next iteration,instead of taking a new basic scenario.
2nd iteration
Due to the external escalation (EE), extra analyses for Ele CI (energy production in the powerplant) are performed:
‚ “2ee BIA(Ele:Energy)” identifies the CI degradation caused by an externally generated threat;it does not identify any internal impacts (IE), but identifies backward external impacts to the RaTinfrastructure (energy provision for the RaT:Energy); this implies the 3rd iteration;
‚ “2ee RA(Ele:Energy production process)” identifies how coal delivery disturbance impacts theenergy production process (here the process-oriented approach is applied).
Due to the internal escalation (IE), extra analyses of the security zone are needed:
‚ “2ie BIA(RaT:NodeÑSecurity zone)”,‚ “2ie RA(RaT:NodeÑSecurity zone)”.
Please note that a secondary asset is preceded by “Ñ”. The related BIA identifies secondary CIdegradation caused by a breach in the security zone (here: theft) but does not identify any further IEor EE impacts.
3rd iteration
Due to the external threat generated by Ele for RaT:Energy, two extra analyses are performed:
‚ “3ee BIA(RaT:Energy)”,‚ “3ee RA(RaT:Energy)”.
The additional CI internal degradation is assessed, and no internal/external escalations aredetected. In the 3rd iteration both RaT and Ele infrastructures achieve a stable state and therefore nofurther analyses are needed. Particular analyses were performed during the validation process.
2.6. Running the Validation Experiment
The validation experiment embraces eight analyses (four BIA, four RA) performed inOSCAD-CIRAS according to the scenario shown in Figure 7.
The left side of Figure 8 presents the OSCAD-CIRAS menu/submenu depending on the contextof the operation, here: risk analyses. The right part shows all performed analyses, their status,
130
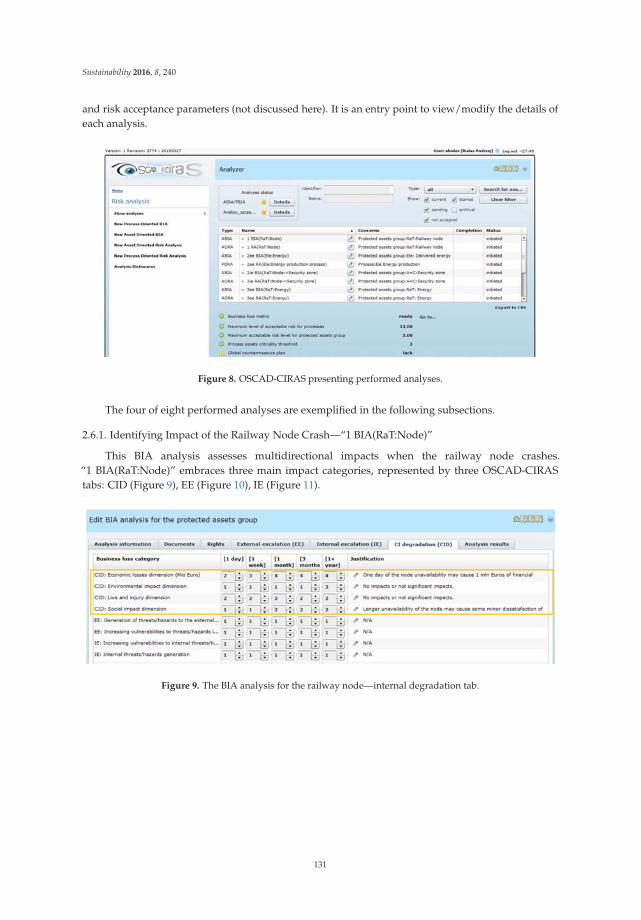
Sustainability 2016, 8, 240
and risk acceptance parameters (not discussed here). It is an entry point to view/modify the details ofeach analysis.
Figure 8. OSCAD-CIRAS presenting performed analyses.
The four of eight performed analyses are exemplified in the following subsections.
2.6.1. Identifying Impact of the Railway Node Crash—“1 BIA(RaT:Node)”
This BIA analysis assesses multidirectional impacts when the railway node crashes.“1 BIA(RaT:Node)” embraces three main impact categories, represented by three OSCAD-CIRAStabs: CID (Figure 9), EE (Figure 10), IE (Figure 11).
Figure 9. The BIA analysis for the railway node—internal degradation tab.
131
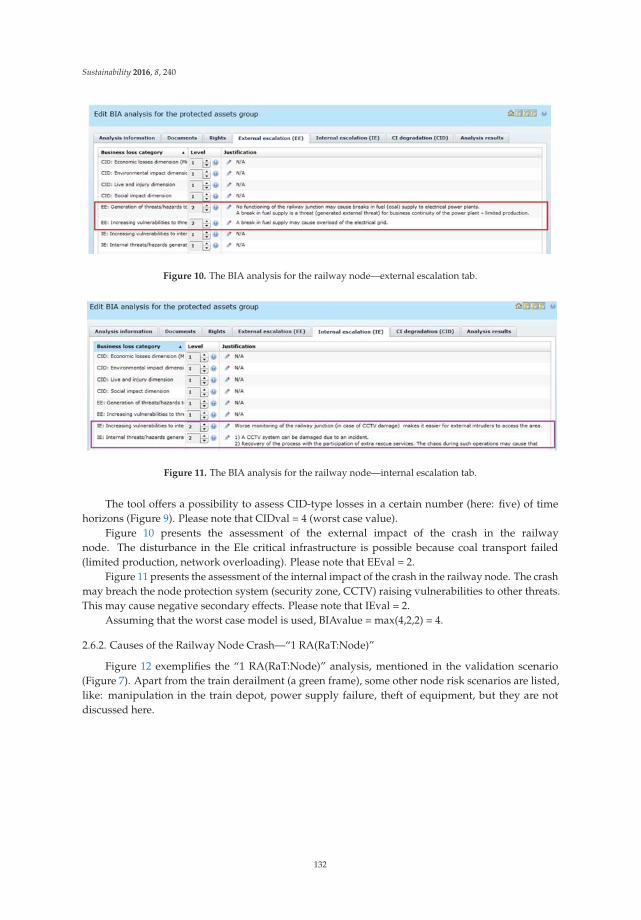
Sustainability 2016, 8, 240
Figure 10. The BIA analysis for the railway node—external escalation tab.
Figure 11. The BIA analysis for the railway node—internal escalation tab.
The tool offers a possibility to assess CID-type losses in a certain number (here: five) of timehorizons (Figure 9). Please note that CIDval = 4 (worst case value).
Figure 10 presents the assessment of the external impact of the crash in the railwaynode. The disturbance in the Ele critical infrastructure is possible because coal transport failed(limited production, network overloading). Please note that EEval = 2.
Figure 11 presents the assessment of the internal impact of the crash in the railway node. The crashmay breach the node protection system (security zone, CCTV) raising vulnerabilities to other threats.This may cause negative secondary effects. Please note that IEval = 2.
Assuming that the worst case model is used, BIAvalue = max(4,2,2) = 4.
2.6.2. Causes of the Railway Node Crash—“1 RA(RaT:Node)”
Figure 12 exemplifies the “1 RA(RaT:Node)” analysis, mentioned in the validation scenario(Figure 7). Apart from the train derailment (a green frame), some other node risk scenarios are listed,like: manipulation in the train depot, power supply failure, theft of equipment, but they are notdiscussed here.
132
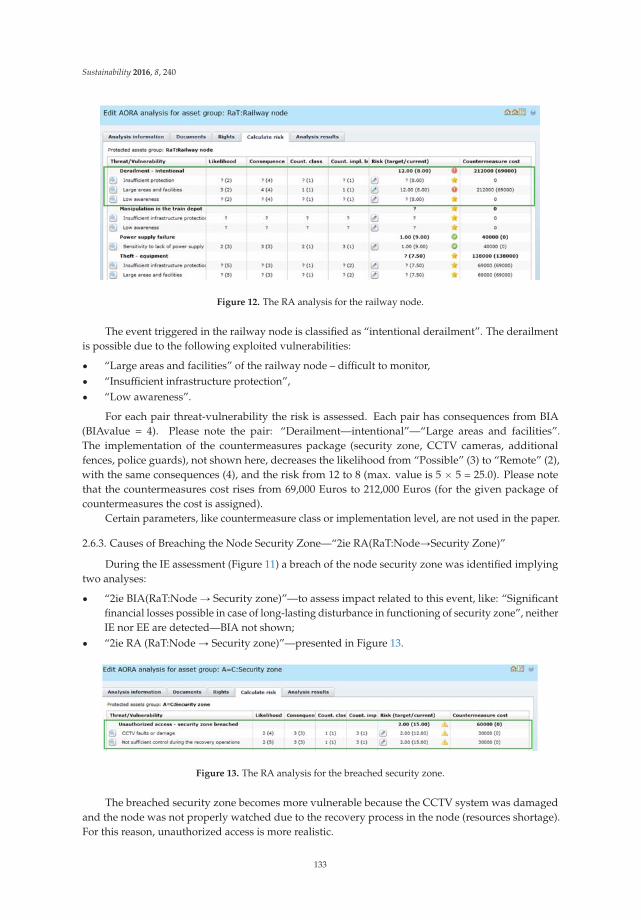
Sustainability 2016, 8, 240
Figure 12. The RA analysis for the railway node.
The event triggered in the railway node is classified as “intentional derailment”. The derailmentis possible due to the following exploited vulnerabilities:
‚ “Large areas and facilities” of the railway node – difficult to monitor,‚ “Insufficient infrastructure protection”,‚ “Low awareness”.
For each pair threat-vulnerability the risk is assessed. Each pair has consequences from BIA(BIAvalue = 4). Please note the pair: “Derailment—intentional”—“Large areas and facilities”.The implementation of the countermeasures package (security zone, CCTV cameras, additionalfences, police guards), not shown here, decreases the likelihood from “Possible” (3) to “Remote” (2),with the same consequences (4), and the risk from 12 to 8 (max. value is 5 ˆ 5 = 25.0). Please notethat the countermeasures cost rises from 69,000 Euros to 212,000 Euros (for the given package ofcountermeasures the cost is assigned).
Certain parameters, like countermeasure class or implementation level, are not used in the paper.
2.6.3. Causes of Breaching the Node Security Zone—“2ie RA(RaT:NodeÑSecurity Zone)”
During the IE assessment (Figure 11) a breach of the node security zone was identified implyingtwo analyses:
‚ “2ie BIA(RaT:Node Ñ Security zone)”—to assess impact related to this event, like: “Significantfinancial losses possible in case of long-lasting disturbance in functioning of security zone”, neitherIE nor EE are detected—BIA not shown;
‚ “2ie RA (RaT:Node Ñ Security zone)”—presented in Figure 13.
Figure 13. The RA analysis for the breached security zone.
The breached security zone becomes more vulnerable because the CCTV system was damagedand the node was not properly watched due to the recovery process in the node (resources shortage).For this reason, unauthorized access is more realistic.
133
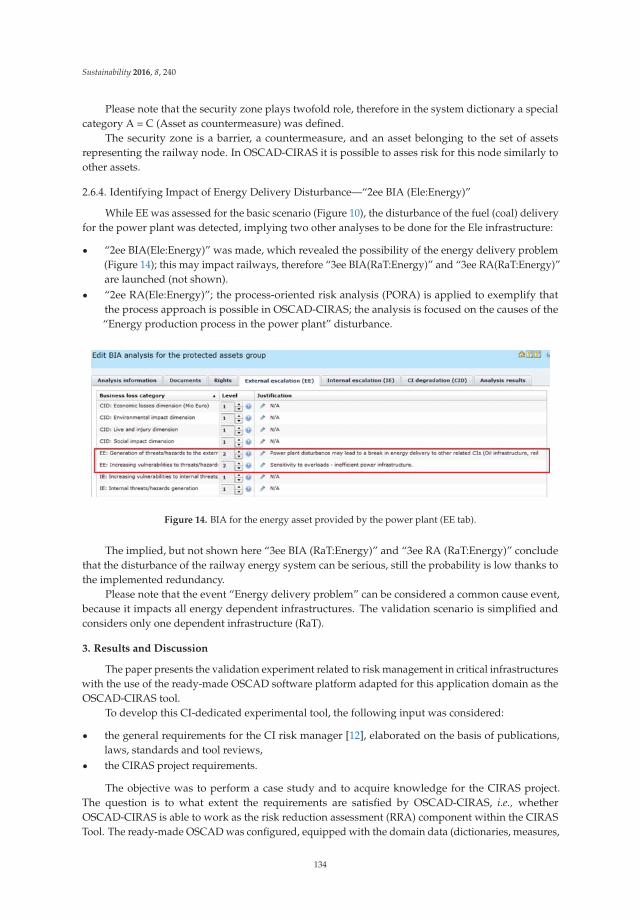
Sustainability 2016, 8, 240
Please note that the security zone plays twofold role, therefore in the system dictionary a specialcategory A = C (Asset as countermeasure) was defined.
The security zone is a barrier, a countermeasure, and an asset belonging to the set of assetsrepresenting the railway node. In OSCAD-CIRAS it is possible to asses risk for this node similarly toother assets.
2.6.4. Identifying Impact of Energy Delivery Disturbance—“2ee BIA (Ele:Energy)”
While EE was assessed for the basic scenario (Figure 10), the disturbance of the fuel (coal) deliveryfor the power plant was detected, implying two other analyses to be done for the Ele infrastructure:
‚ “2ee BIA(Ele:Energy)” was made, which revealed the possibility of the energy delivery problem(Figure 14); this may impact railways, therefore “3ee BIA(RaT:Energy)” and “3ee RA(RaT:Energy)”are launched (not shown).
‚ “2ee RA(Ele:Energy)”; the process-oriented risk analysis (PORA) is applied to exemplify thatthe process approach is possible in OSCAD-CIRAS; the analysis is focused on the causes of the“Energy production process in the power plant” disturbance.
Figure 14. BIA for the energy asset provided by the power plant (EE tab).
The implied, but not shown here “3ee BIA (RaT:Energy)” and “3ee RA (RaT:Energy)” concludethat the disturbance of the railway energy system can be serious, still the probability is low thanks tothe implemented redundancy.
Please note that the event “Energy delivery problem” can be considered a common cause event,because it impacts all energy dependent infrastructures. The validation scenario is simplified andconsiders only one dependent infrastructure (RaT).
3. Results and Discussion
The paper presents the validation experiment related to risk management in critical infrastructureswith the use of the ready-made OSCAD software platform adapted for this application domain as theOSCAD-CIRAS tool.
To develop this CI-dedicated experimental tool, the following input was considered:
‚ the general requirements for the CI risk manager [12], elaborated on the basis of publications,laws, standards and tool reviews,
‚ the CIRAS project requirements.
The objective was to perform a case study and to acquire knowledge for the CIRAS project.The question is to what extent the requirements are satisfied by OSCAD-CIRAS, i.e., whetherOSCAD-CIRAS is able to work as the risk reduction assessment (RRA) component within the CIRASTool. The ready-made OSCAD was configured, equipped with the domain data (dictionaries, measures,
134
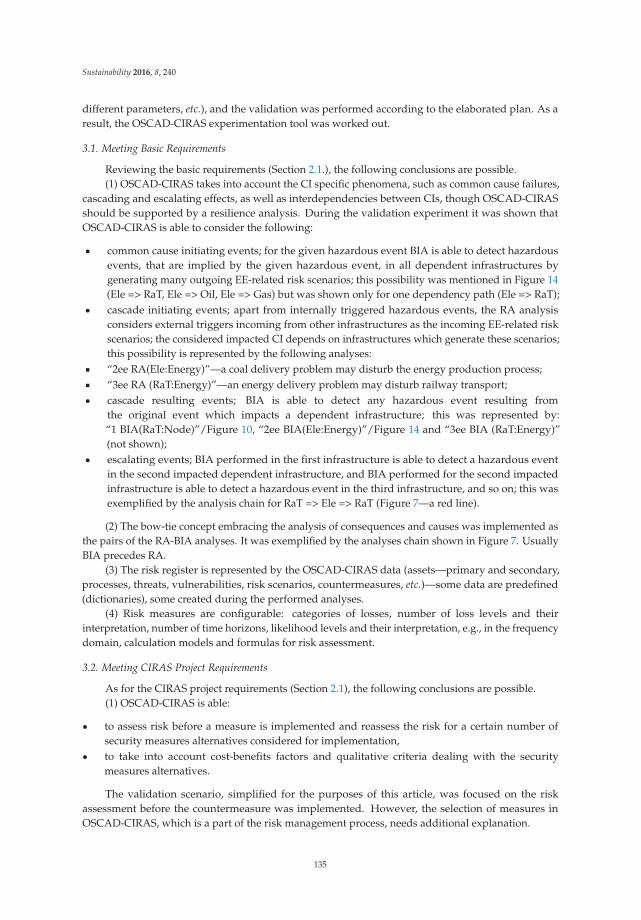
Sustainability 2016, 8, 240
different parameters, etc.), and the validation was performed according to the elaborated plan. As aresult, the OSCAD-CIRAS experimentation tool was worked out.
3.1. Meeting Basic Requirements
Reviewing the basic requirements (Section 2.1.), the following conclusions are possible.(1) OSCAD-CIRAS takes into account the CI specific phenomena, such as common cause failures,
cascading and escalating effects, as well as interdependencies between CIs, though OSCAD-CIRASshould be supported by a resilience analysis. During the validation experiment it was shown thatOSCAD-CIRAS is able to consider the following:
‚ common cause initiating events; for the given hazardous event BIA is able to detect hazardousevents, that are implied by the given hazardous event, in all dependent infrastructures bygenerating many outgoing EE-related risk scenarios; this possibility was mentioned in Figure 14(Ele => RaT, Ele => Oil, Ele => Gas) but was shown only for one dependency path (Ele => RaT);
‚ cascade initiating events; apart from internally triggered hazardous events, the RA analysisconsiders external triggers incoming from other infrastructures as the incoming EE-related riskscenarios; the considered impacted CI depends on infrastructures which generate these scenarios;this possibility is represented by the following analyses:
‚ “2ee RA(Ele:Energy)”—a coal delivery problem may disturb the energy production process;‚ “3ee RA (RaT:Energy)”—an energy delivery problem may disturb railway transport;‚ cascade resulting events; BIA is able to detect any hazardous event resulting from
the original event which impacts a dependent infrastructure; this was represented by:“1 BIA(RaT:Node)”/Figure 10, “2ee BIA(Ele:Energy)”/Figure 14 and “3ee BIA (RaT:Energy)”(not shown);
‚ escalating events; BIA performed in the first infrastructure is able to detect a hazardous eventin the second impacted dependent infrastructure, and BIA performed for the second impactedinfrastructure is able to detect a hazardous event in the third infrastructure, and so on; this wasexemplified by the analysis chain for RaT => Ele => RaT (Figure 7—a red line).
(2) The bow-tie concept embracing the analysis of consequences and causes was implemented asthe pairs of the RA-BIA analyses. It was exemplified by the analyses chain shown in Figure 7. UsuallyBIA precedes RA.
(3) The risk register is represented by the OSCAD-CIRAS data (assets—primary and secondary,processes, threats, vulnerabilities, risk scenarios, countermeasures, etc.)—some data are predefined(dictionaries), some created during the performed analyses.
(4) Risk measures are configurable: categories of losses, number of loss levels and theirinterpretation, number of time horizons, likelihood levels and their interpretation, e.g., in the frequencydomain, calculation models and formulas for risk assessment.
3.2. Meeting CIRAS Project Requirements
As for the CIRAS project requirements (Section 2.1), the following conclusions are possible.(1) OSCAD-CIRAS is able:
‚ to assess risk before a measure is implemented and reassess the risk for a certain number ofsecurity measures alternatives considered for implementation,
‚ to take into account cost-benefits factors and qualitative criteria dealing with the securitymeasures alternatives.
The validation scenario, simplified for the purposes of this article, was focused on the riskassessment before the countermeasure was implemented. However, the selection of measures inOSCAD-CIRAS, which is a part of the risk management process, needs additional explanation.
135
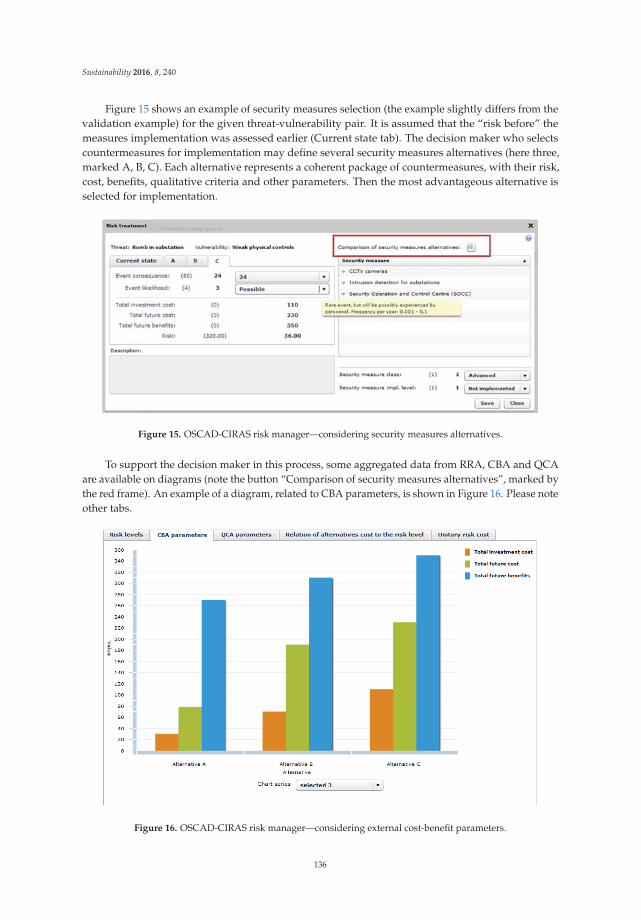
Sustainability 2016, 8, 240
Figure 15 shows an example of security measures selection (the example slightly differs from thevalidation example) for the given threat-vulnerability pair. It is assumed that the “risk before” themeasures implementation was assessed earlier (Current state tab). The decision maker who selectscountermeasures for implementation may define several security measures alternatives (here three,marked A, B, C). Each alternative represents a coherent package of countermeasures, with their risk,cost, benefits, qualitative criteria and other parameters. Then the most advantageous alternative isselected for implementation.
Figure 15. OSCAD-CIRAS risk manager—considering security measures alternatives.
To support the decision maker in this process, some aggregated data from RRA, CBA and QCAare available on diagrams (note the button “Comparison of security measures alternatives”, marked bythe red frame). An example of a diagram, related to CBA parameters, is shown in Figure 16. Please noteother tabs.
Figure 16. OSCAD-CIRAS risk manager—considering external cost-benefit parameters.
136
Sustainability 2016, 8, 240
More detailed graphs, tables, reports related to particular alternatives will be available fromthe CIRAS tool level. Currently they are under development. OSCAD-CIRAS is able to exchange(through developed web services) information with the CBA and QCA components during the decisionprocess dealing with the security measures selection
(2) Other issues related to the project requirements were discussed previously, like the ability toconsider the CI specific phenomena and cross-sectoral dependencies, to analyze causes and impacts ofhazardous events, and to manage the risk register data.
Reassuming, the validation process is based on the planned scenario which encompasses twocritical infrastructures: railway transport (RaT) and electricity provision (Ele). Two kinds of escalationeffects are demonstrated:
‚ those propagated through a CI internal path,‚ those propagated through a path crossing one or more CIs.
The consequences of hazardous events in a given CI can impact the same CI again and/or theneighboring CIs, creating a complex sequence of impacts. The presented method allows to identify:
‚ direct consequences occurring within the considered infrastructure (called here: CI degradation);‚ secondary effects caused by breaching internal barriers (CI safeguards) and occurring in this CI
as the consequences of a hazardous event (called here: internal escalation); this escalation canpropagate further causing additional hazardous events—internal or external;
‚ secondary effects occurring in the external CIs as the consequences of a hazardous event(called here: external escalation); they can propagate further, impacting other CIs or generatinginternal escalations.
The scenario depends on the new risks identified during the analysis. The presented methodassumes (in the loss matrix for BIA analyses) that a new hazardous event (internal or external) canbe triggered as a consequence of a previous hazardous event. Internally triggered events result frombreaching the CI internal barriers. Events triggered within the external CIs can propagate thanks toexisting CI interdependencies. The risk assessment results give information if the hazardous event willpropagate internally and/or externally, or nowhere. It means that each risk situation may drive quite adifferent scenario in the same set of infrastructures. If, during the analysis of infrastructure A, it wasdetected that a breach in infrastructure B is possible (EE), then the risk analysis in infrastructure B isneeded and will be added to the risk analyses scenario. Otherwise, the analysis in infrastructure B willnot be added to this scenario. If, during the analysis of infrastructure A, it was detected that a securitybarrier can be breached (IE), then the analysis in infrastructure A is needed and will be added to therisk analyses scenario. Otherwise, it will not be added to this scenario.
For this reason, each scenario is here called a risk-driven scenario. It is assumed thatinterdependencies are known—all paths with possible propagation of impacts are known.
4. Conclusions
The objective of the paper is to develop a structured risk management method for criticalinfrastructures, embedded into the CI resilience process (Figure 6). The method distinguishes threecategories of impacts composed into the BIA loss matrix:
‚ CID (direct CI degradation),‚ IE (escalation by breaching internal security barriers),‚ EE (escalation by breaching security barriers in external CIs).
The method is based on the commonly used risk management methodology, though it wasenhanced by three above mentioned features which allowed to take into account the following issues(Section 3):
137
Sustainability 2016, 8, 240
‚ how a hazardous event which occurred in the given CI impacts the dependent CIs; this allows toconsider common cause initiating events, cascade resulting events, externally escalating events;
‚ how a hazardous event which occurred in external CIs impacts the given CI; this allows to considercascade initiating events, externally escalating events;
‚ secondary impacts of a hazardous event which occurred in the given CI and lead to an internalescalation; this allows to analyze breaches in the multilayered protection system.
There are some extra features which make it possible to assess a critical infrastructure degradationin several time horizons (CID-type consequences). In addition, they can assess several securitymeasures packages with respect to the risk reduction ability.
To elaborate, implement and validate this method, the research includes as well:
‚ the identification of CI domain-related data, like assets, processes, threats, vulnerabilities, commonused countermeasures, etc., and put them into the OSCAD system dictionaries,
‚ the risk parameters definition, i.e.,: scales of measures for likelihood, consequences, impactscategories and levels, loss matrix, calculation formulas configuration,
‚ the planning of the validation scenario (to be simple enough and be able to exemplify all featuresof the elaborated method),
‚ performing validation to assess the feasibility of the proposed solution.
The paper gives substantial contribution to the CIRAS project. The aim of the research presentedin the paper is to acquire knowledge about the shape of the key component responsible for riskassessment (RRA) of the CIRAS Tool. The case study was based on the ready-made businesscontinuity/information security management OSCAD software. During the research this softwarewas adapted to the critical infrastructure application domain, according to the identified requirements.This way the dedicated OSCAD-CIRAS tool was developed. The near real data were prepared for thecritical infrastructure domain and the software was configured. According to the planned validationscenario, the risk assessment within two collaborating infrastructures (railway, energy) was studied.The case study gives information how to use OSCAD-CIRAS in the CIRAS project. The results ofresearch confirm that OSCAD-CIRAS can be applied as the RRA component.
The acquired knowledge was used by the CIRAS project team. Currently all components(RRA, CBA, QCA) are integrated into the CIRAS Tool. The case study described in the paper isthe basis for two CIRAS project use cases.
The CIRAS project considerably extends the risk reduction assessment by additional CBA(cost-benefits) and QCA (vague factors) assessments to obtain a full risk picture for the decision maker.
Acknowledgments: The author thanks his Colleagues from the CIRAS project consortium for reviewing this paperand discussing the presented concept. The author is grateful for their assistance during the OSCAD customization(installation, logo edition, preparing the OSCAD dictionaries).
Author Contributions: The presented validation experiment represent the author’s own research.
Conflicts of Interest: The author declares no conflict of interest. The OSCAD is owned by the Institute ofInnovative Technologies EMAG. This project has been funded with support from the European Commission.This publication reflects the views only of the author, and the European Commission cannot be held responsible forany use which may be made of the information contained therein (obligatory for each paper concerning CIRAS).
References and Notes
1. Eusgeld, I.; Nan, C.; Dietz, S. “System-of-systems” approach for interdependent critical infrastructures.Reliab. Eng. Syst. Saf. 2011, 96, 679–686. [CrossRef]
2. ISO. Risk management—Principles and guidelines; ISO 31000:2009; International Organization forStandardization: Geneva, Switzerland, 2009.
138
Sustainability 2016, 8, 240
3. IEC/ISO. Risk Management—Risk Assessment Techniques; IEC 31010:2009; International ElectrotechnicalCommission (in cooperation with ISO): Geneva, Switzerland, 2009.
4. Hokstad, P.; Utne, I.B.; Vatn, J. Risk and Interdependencies in Critical Infrastructures: A Guideline for Analysis,Reliability Engineering; Springer-Verlag: London, UK, 2012.
5. Rinaldi, S.M.; Peerenboom, J.P.; Kelly, T.K. Identifying, Understanding and Analyzing Critical InfrastructureInterdependencies. IEEE Control Syst. Mag. 2001, 21, 11–25. [CrossRef]
6. Giannopoulos, G.; Filippini, R. Risk Assessment and Resilience for Critical Infrastructures.In Proceedings of Workshop Proceedings, Ispra, Italy, 25–26 April 2012; Available online:http://publications.jrc.ec.europa.eu/repository/handle/JRC71923 (accessed on 29 February 2016).
7. Min, H.-S. J.; Beyeler, W.; Brown, T.; Jun Son, Y.; Jones, A.T. Toward modelling and simulation of criticalnational infrastructure interdependencies. IIE Trans. 2007, 39, 57–71. [CrossRef]
8. The Council of the European Union. Council Directive 2008/114/EC—on the identification and designationof European critical infrastructures and the assessment of the need to improve their protection. 2008.Available online: http://eur-lex.europa.eu/legal-content/EN/TXT/?uri=CELEX%3A32008L0114 (accessedon 29 February 2016).
9. European Commission. Commission Staff Working Document—on a new approach to the EuropeanProgramme for Critical Infrastructure Protection Making European Critical Infrastructures more secure. 2013.Available online: https://ec.europa.eu/energy/sites/ener/files/documents/20130828_epcip_commission_staff_working_document.pdf (accessed on 29 February 2016).
10. CIRAS project web site. Available online: http://cirasproject.eu/content/project-topic (accessed on22 December 2015).
11. ValueSec FP7 project web site. Available online: www.valuesec.eu (accessed on 22 December 2015).12. Bialas, A. Critical infrastructures risk manager—the basic requirements elaboration. In Theory and
Engineering of Complex Systems and Dependability; Zamojski, W., Mazurkiewicz, J., Sugier, J., Walkowiak, T.,Kacprzyk, J., Eds.; Springer-Verlag: Cham, Switzerland; Heidelberg, Germany; New York, NY, USA;Dordrecht, The Netherland; London, UK, 2015; pp. 11–24.
13. EMAG. OSCAD project web site. Available online: http://www.oscad.eu/index.php/en/ (accessed on21 December 2015).
14. Giannopoulos, G.; Filippini, R.; Schimmer, M. Risk Assessment Methodologies for Critical InfrastructureProtection—Part I: A State of the Art; Publications Office of the European Union: Luxembourg, 2012.
15. European Commission. EURACOM Deliverable D20: Final Publishable Summary, Version: D20.1. 2011.Available online: http://cordis.europa.eu/result/rcn/57042_en.html (accessed on 21 December 2015).
16. ENISA. Inventory of Risk Management/Risk Assessment Methods and Tools. Available online:http://rm-inv.enisa.europa.eu/methods (accessed on 21 December 2015).
17. Baginski, J.; Bialas, A.; Rogowski, D.; Flisiuk, B.; (Institute of Innovative Technologies EMAG, Katowice,Poland); Martin, J.; Garcia, A.; (ATOS S.A., Madrid, Spain); Klein, P.; (Center for European Security Strategies,Munich, Germany). State of the Art of Methods and Tools. 2015.
18. Rausand, M. Risk Assessment: Theory, Methods, and Applications. In Statistics in Practice; Wiley: Hoboken,NJ, USA, 2011.
19. Białas, A. Risk assessment aspects in mastering the value function of security measures. In NewResults in Dependability and Computer Systems; Zamojski, W., Mazurkiewicz, J., Sugier, J., Walkowiak, T.,Kacprzyk, J., Eds.; Springer-Verlag: Cham, Switzerland; Heidelberg, Germany; New York, NY, USA;Dordrecht, The Netherland; London, UK, 2013.
20. Bialas, A. Computer support for the railway safety management system—first validation results.In Advances in Intelligent Systems and Computing; Zamojski, W., Mazurkiewicz, J., Sugier, J., Walkowiak, T.,Kacprzyk, J., Eds.; Springer-Verlag: Cham, Switzerland; Heidelberg, Germany; New York, NY, USA;Dordrecht, The Netherland; London, UK, 2014.
21. Białas, A. Business continuity management, information security and assets management in mining.Mechanizacja i Automatyzacja Górnictwa 2013, 8, 125–138. Available online: http://yadda.icm.edu.pl/yadda/element/bwmeta1.element.baztech-891910b0-6f4e-4dfb-8bc3-345d940cc88b?q=fd72cbbb-7631-435b-9e4e-cf0b5ebdcc38$4&qt=IN_PAGE (accessed on 29 February 2016).
139

Sustainability 2016, 8, 240
22. OSCAD-CIRAS. Available online on request using the author’s e-mail.23. Białas, A. Experimentation tool for critical infrastructures risk management. In Proceedings of the
2015 Federated Conference on Computer Science and Information Systems (FedCSIS), Lodz, Poland,13–16 September 2015.
© 2016 by the author. Licensee MDPI, Basel, Switzerland. This article is an open accessarticle distributed under the terms and conditions of the Creative Commons Attribution(CC BY) license (http://creativecommons.org/licenses/by/4.0/).
140
sustainability
Article
Opportunities for Cross-Border EntrepreneurshipDevelopment in a Cluster Model Exemplified by thePolish–Czech Border Region
Joanna Kurowska-Pysz
Management and Engineering Production Department, University of Dabrowa Górnicza, Str. Cieplaka 1c,41-300 Dabrowa Górnicza, Poland; [email protected]; Tel.: +48-602-231-123
Academic Editor: Adam JabłonskiReceived: 31 December 2015; Accepted: 18 February 2016; Published: 2 March 2016
Abstract: The subject of the paper is the analysis and evaluation of cross-border entrepreneurshipdevelopment opportunities on the basis of cross-border cooperation, which has gradually evolvedfrom consisting of bilateral partnerships to a networking model or even a cluster. The studyconducted at the Polish–Czech border area indicates that, in terms of the development of cross-bordercooperation, the economic sphere is lagging far behind social activities such as culture, educationand tourism. At the same time, Polish and Czech enterprises are not sufficiently mobilized todevelop cross-border entrepreneurship, although a number of support instruments in this regardhave been proposed. Sustainable development of the border should take into account both socialand economic aspects. An important research problem therefore becomes determining the possibilityof boosting the development of cross-border entrepreneurship on the basis of the existing formsof cross-border cooperation, including cooperation in the social sphere. The aim of this paper isto define the conditions and opportunities for the development of cluster cooperation in the areaof cross-border entrepreneurship. The author has attempted to resolve whether the intensity ofcross-border cooperation can be a factor which mobilizes companies to develop their cross-borderentrepreneurship and whether cross-border entrepreneurship can be further developed within thecluster model.
Keywords: sustainable development of the border region; cross-border cooperation; cross-borderentrepreneurship; partnerships; cluster
1. Introduction
Processes occurring in the world economy have a significant impact on the functioning ofenterprises, regardless of the scale of their business activity. Increased globalization favours theexpansion of large transnational corporations, whereas simultaneously in the economy, there aremany mechanisms stimulating the development of small and medium-sized businesses. Smallerenterprises, mostly operating on a regional or local scale, also have good prospects on the market,and also show a tendency for integration (also with larger companies), for example as clusters [1].Clusters are a form of partnership aimed at developing cooperation between enterprises, but alsolocal governments, academic institutions and business environment institutions, located in immediategeographical proximity and representing related sectors. These two strategic conditions are necessaryto form appropriately strong bonds between the participants of a cluster.
An impulse for the development of any form of cooperation, including cooperation within theclusters, can be both the needs and expectations of interested entities as well as external factorsencouraging integration. Particularly favourable system conditions, aiding the development ofcooperation, are created in border regions. In contrast to many well-developed border towns in
Sustainability 2016, 8, 230; doi:10.3390/su8030230 www.mdpi.com/journal/sustainability141
Sustainability 2016, 8, 230
Western Europe or East Asia, Eastern Europe border regions are developing rather poorly, especiallyin economic and social terms. They are disadvantaged and at risk of marginalization, requiringspecial support. The reason is certainly the geopolitical situation in the communist bloc, which haspursued a specific policy of borderland development. Until the fall of the communist bloc, obtaininga passport was only possible for some citizens cooperating with the authorities. Until Poland andthe Czech Republic joined the Schengen Zone on 21 December 2007, each crossing of the border wasassociated with the control of documents. Before freely crossing the border was allowed, the borderarea, as a militarily strategic zone, was excluded from priority economic and social investments, andit was patrolled by the army in the large part. In a social sense, crossing the border was seen as anextraordinary necessity, not as a privilege of border residents and other citizens. This possibility wasexploited only in specific situations. The border was therefore divided and not united, which at presentmeans the process of cross-border cooperation between Poland and the Czech Republic, despite itsundeniable dynamism, is not progressing as fast as in other regions of the world.
Integration activities, stimulating the development of border areas, are undertaken bothat the level of the European Union, as well as individually by neighbouring member states,which are in favour of cross-border business development and socio-economic integration of theneighbouring communities.
So far, in cross-border cooperation, both in terms of social as well as economic cooperation,bilateral partnerships are the dominant type of cooperation existing between local governmentsand NGOs, and occur much less frequently between enterprises. There is no doubt that bilateralcooperation between the same partners continuing for a long time strengthens cross-border relations,yet does not fully serve the development of border areas. In order to effectively counteract thedevelopment-related problems of these areas, it is both necessary to form new partnerships betweenentities that have not worked together before as well as develop networking opportunities. Currently,most examples of networking occur in the social sphere whereas at the economic level they occuronly occasionally. In order to balance this trend, it is necessary to define mechanisms to encouragecross-border entrepreneurship development and economic cooperation of a networking nature thatcould develop as clusters.
Analysis of cooperative relations occurring in the borderland has encouraged the author toconsider the opportunities for cluster cooperation development in these areas. It is fostered by botha natural tendency for cross-border integration, as well as the external conditions, resulting amongother factors from the socio-economic policy of neighbouring border regions and the European Union'ssystem support, e.g., in the form of the INTERREG VA 2014-2020 funds [2].
The aim of the paper is to define the conditions and possibilities for the development of clustercooperation in the area of cross-border entrepreneurship. An example of Polish–Czech cross-bordercooperation between Silesian Voivodeship (Poland) and the Moravian-Silesian Region (Czech Republic)was used to measure the level of development of cross-border entrepreneurship. The author hasattempted to resolve whether the intensity of cross-border cooperation can be a factor that mobilizesbusinesses to develop their cross-border entrepreneurship and whether cross-border entrepreneurshipcan thrive in the cluster model.
In the studied area, qualitative research was conducted: desk research and quantitative researchinvolving IDI, CATI, CAWI and CATI and PAPI data collection methods. In this paper, the authorused qualitative research (IDI), implemented in 2014 by the TRITIA association and the RegionalDevelopment Agency in Ostrava, on a sample of 30 Polish and Czech companies. Research topicsrelated to the motives and the process of the development of cross-border entrepreneurship and otherconditions related to their activities at the border. As part of this study, several case studies wereundertaken of companies developing their cross-border entrepreneurship, including the companyrun by the author in the field of consulting. In addition to these studies, the author has used her ownresearch conducted by means of the CATI method with 14 companies from the voivodeship of Silesiaand the Moravian country, identifying their level of interest in cross-border entrepreneurship, as well
142
Sustainability 2016, 8, 230
as their opinions about the barriers and benefits related to it. In order to identify potential regionalspecializations which can form the basis for the development of future cross-border clusters, the authoralso used her own qualitative research conducted in the years 2014–2015, including:
- survey methods such as: CATI, CASI and CAWI on a group of 466 Polish local government unitsand 199 Czech local government units for assessing the current state of Polish–Czech bordercooperation, identification of factors shaping the development of this cooperation, the projecteddirections of this cooperation and the main actors of this cooperation,
- survey using PAPI method, giving the possibility of creating in Polish-Czech Euroregion CieszynSilesia—of a cross-border cluster in cultural and creative industries, which covered a totalof 40 entities from Poland and the Czech Republic, declaring their intention to strengthencross-border cooperation, including 18 Polish and Czech companies. These studies related to thenature and extent of cooperation with the entities in the neighboring country, the key benefits ofcluster cooperation in the field of culture and creative industries as well as barriers to this process.
Conclusions from the study will serve as recommendations for entities responsible for cross-bordercooperation policy (e.g., regional governments, business environment institutions) whose task is tocreate good conditions for the development of cross-border entrepreneurship.
2. Cross-Border Territorial Partnerships as a Form of Inter-Organisational Cooperation in theBorder Regions
Territorial partnership is voluntary and is based on the agreement between at least threepartners representing at least two of the three sectors: public, private and non-governmental.These partners maintain autonomy and jointly implement long-term measures for the benefit ofa specific region. Within the framework of cooperation, they improve and monitor the partnership andmaintain the principle of equality in the sharing of resources, responsibilities, risks and benefits [3].The development of territorial partnerships in the 1980s contributed to the popularization of thelocal resources management model, involving—among others—the creation of more or less formalorganizations uniting representatives of public, private and non-governmental sectors in a specificarea [4,5]. Partnerships also developed through the process of European integration and the supportof cross-border cooperation, as well as the pursuit to strengthen the competitiveness of peripheral andmarginalized areas. Territorial partnerships bear a reference to cross-border cooperation.
The definition of cross-border cooperation was provided in the European Charter for Borderand Cross-Border Regions (1981) [6], the European Outline Convention on Transfrontier Cooperationbetween Territorial Communities or Authorities (1980) [7] and the European Charter of RegionalSelf-Government (1997) [8]. Generally, it can be stated that cross-border cooperation is one of theforms of territorial cooperation of different types of units in the border regions, which might berelated to all areas, including entrepreneurship. A common historical origin and other importantsimilarities between neighbouring areas on the borderland (e.g., linguistic, cultural, constitutional,social or economic) may aid in joining forces to achieve common development goals.
Cross-border cooperation applies equally to the activities of local authorities at various levels,as well as to joint initiatives, e.g., non-governmental organizations or businesses. It aims to createcooperation networks at local and regional levels, as a result of which cooperation on economic matterscan be fostered, while cultural and social barriers in local communities disappear [9].
The issue of partnerships was recognized, among others, in the regulation of EU structuralfunds [10]. Traditionally, partnerships are a mechanism for the transfer of development policy to lowerlevels of the hierarchy (top down policy). Partnerships are also agreements of entities at different levelsof the hierarchy, providing interested parties with influence and participation in the developmentprocesses, both initiated at the lowest levels of cooperation (bottom up policy), as well as arranged athigher levels (as mentioned above, top down policy) [11].
The principles of entering into cross-border partnerships have been stipulated in the CouncilRegulation (EC) No. 1083/2006. Each country, depending on its needs and legislative capabilities,
143
Sustainability 2016, 8, 230
enters into partnerships with public authorities at various levels, or with other entities, includingNGOs, which can act as economic and social partners [12].
Currently, partnership is most commonly associated with various forms of cooperationbetween institutions, entities and individuals in the implementation of common social, economic orenvironmental goals. The essence of partnership consists in finalizing an agreement (but also civil lawor association agreement) by entities, institutions, organizations and individuals aimed at engagingall the concerned parties in actions aimed at optimal use of the available resources and stimulatingmulti-dimensional development, using various tools and cooperation mechanisms. The consequenceof the concluded agreement is to undertake joint ventures (projects, programs) of a different nature,enabling achievement of common objectives.
An example of cross-border partnership are Euroregions—associations operating in theborderlands of two or more countries, specializing in cross-border cooperation [13]. The main aim oftheir activities is the removal of socio-economic inequalities, solving the problems of disadvantagedand peripheral areas, building mutual trust and cooperation across borders [14] as well as promotingcross-border entrepreneurship development and integration in other fields, e.g., education [15]. Suchgoals are pursued by Euroregion Cieszyn Silesia. This forum of cooperation covers the border areas ofthe Silesian Voivodeship (Poland) and the Moravian-Silesian Region (Czech Republic). In the Polishand Czech part, there are two associations whose members are municipalities, NGOs and enterprisesengaged in Euroregion activity. Both active associations and their members have undertaken aseries of cross-border projects, some of which were carried out with the support of European Unionstructural funds [16]. However, in the period following the completion of these projects, cooperationwas continued and further developed [17]. An example of such integration trends, based on theimplementation of earlier EU projects may be, among others, interest in creating a cross-border culturecluster in the Euroregion Cieszyn Silesia. It is one of the examples of partnership activities, consistingin the creation of local network structures or a cluster, based on the cooperation of persons, entitiesand institutions interested in the development of a given territory.
However, increasing trends to further strengthen cross-border relations to form a cluster can beobserved, which allow for a departure from bilateral cooperation to multilateral interaction betweenthe main actors in the cluster. Sectoral clusters are among the inter-organizational networks, whichinvolve the transfer of knowledge [18] and other flows (material or information), as well as thedevelopment of relationships (formal and informal), of which the most important are social. In thenetworks of cooperation, the participation of enterprises, research units, administration [19], civilsociety and those responsible for environmental issues [20] is necessary. Due to the institutional andsocial nature of clusters, official relationships overlap here both structurally (between the cooperatingparties) and organically (between the people involved in the cooperation). Another aspect is thatfriendly, neutral as well as hostile or competitive relationships [21] can form in the cluster. The numberof links, the types of actors and the industry specializations of the cluster have been captured byM. Hennning, J. Moodysson and M. Nilsson [22]. They emphasized how important it is to directcross-organizational cooperation, including clustering, according to regional specializations. This leadsto the involvement of entities responsible for shaping regional policy, going beyond the typical areasof clusters’ operation. This coupling of actions drives the competitive advantage of the region, andvarious measures to strengthen inter-organizational cooperation in sectoral clusters were also includedin this paper. The author focuses on the example of the eastern part of the Czech–Polish border,i.e., Euroregion Cieszyn Silesia, where a clear regional specialization in the field of culture and creativeindustries is being established, and entities responsible for the regional policy of Poland and the CzechRepublic as well as for cross-border policy (i.a. TRITIA) are involved in integration policy. An examplewould be, among others, interest in creating a cross-border cluster of culture and creative industries inthe Euroregion Cieszyn Silesia.
144
Sustainability 2016, 8, 230
3. Clusters as an Advanced Form of Cross-Border Cooperation Development
The territorial and integrative context of cluster activity is an important prerequisite toconsidering the possibility of cross-border cluster development in borderlands. Low levels ofsocio-economic development of border areas indicate the need for greater emphasis on the economicaspects of integration and cooperation, which so far have definitely been outweighed by the socialaspects. Not only in borderland regions, an important feature of innovative and competitiveorganizations is their propensity for cooperation, including the development of various types ofnetwork relationships [23–25].
These are structures in which individuals and groups, acting independently, collaborate towardsachieving a common goal [26]. This cooperation may take the form of various types of territorialpartnerships, single and multi-sector, as well as networks and clusters [27,28]. The degree ofinstitutionalization of clusters is varied [29]. They involve mainly businesses, but also institutionsof operating in varied business environments, local governments at various levels, NGOs, localdevelopment agencies, schools, banking institutions and the R&D sector, including scientific bodies.
A cluster is a geographic concentration of interconnected enterprises, specialized suppliers,service providers, businesses operating in related sectors and associated institutions in particular fields,competing with each other but also cooperating [30]. The cluster can also be defined as geographicallylimited agglomerations of enterprises [31], together generating synergistic effects. There are manyother similar definitions [32,33]
A cluster is defined by the following key elements: the cluster members and the relationshipsbetween them, generated knowledge and innovation, and the economic impact (economic effect) ofcluster activities.
The process of cluster development in a border area can be considered as one of the new challengesof cross-border cooperation, which is currently evolving from consisting of bilateral partnershipstowards a networking model. Clusters serve in the cooperation of entities within a certain geographicalarea, which provides the ability to initiate and develop direct contact between the participants in thenetwork. Another premise is the possibility of achieving synergy through joint action for the benefit ofthe given community and territory. Clusters as a form of networks are often characterized by loose andvoluntary relationships, involving the transfer of resources between individuals, including the transferof information and knowledge [34]. Clusters are also characterized by specialization in a particularsector or industry, affinity of the technologies and skills used, consistency between objectives andproducts or services offered on the market [35].
In the long term, the success of the cluster is determined by the quality of internal collaborationand having common objectives among its participants. It is also important to appoint a leader who isable to animate and develop cooperative relationships within a cluster, despite many obstacles andrestraints that constrain this process.
Natural tendencies for integration, the popularity of inter-organizational cooperation, as well asthe availability of mechanisms supporting this cooperation (including structural funds) are certainlyimportant factors conducive to the development of cluster structures in border regions, which concernexternal entities interested in the development of clusters and networks. The European Commissionindicates that the regions which combine risk capital, competence and high quality research on abroad portfolio of clusters have a chance to become nodes of innovation [36]. Such developmentimpulses are important in border regions, often peripheral and marginalized, mostly characterizedby lower indicators of economic and social development, also with weaker potential than preferablylocated areas. For these regions, especially important is access to valuable knowledge and the ability toovercome various types of barriers to development, including barriers in cross-border relations, thanksto which economic and social cohesion of borderland is fostered. In the process of “learning” in borderregions and developing cross-border cooperation, an important role might be served by clusters.
The location of the cluster in cross-border environments where various forms of cooperation arevery popular, including cross-sector partnerships involving entities from neighbouring countries, could
145
Sustainability 2016, 8, 230
become a catalyst for closer relations between cluster members. In general, the scope and objectivesof cooperation in the cluster are defined by partners themselves (entrepreneurs, local governments,NGOs, etc.), but in the border region the broader context of cluster activity should be taken intoaccount—the desired and expected development of cross-border cooperation. Clusters have the chanceto become effective, future-oriented forms of cross-border cooperation which will contribute to a betteruse of the diverse potential of the entire border, effectively overcoming barriers in building mutualrelations between neighbouring communities, as well as achieving more dynamic development of thewhole cross-border region. The development of cluster structures in the borderland contributes toovercoming the negative aspects of the peripheral location of border areas, the use of the developmentopportunities arising from the proximity of the neighbouring country, promoting the idea of Europeanunity and international cooperation, the spreading of the socio-cultural influences and innovations,among other benefits
4. Cross-Border Entrepreneurship and Cross-Border Cooperation
Entrepreneurship is a result of the development of social relations. Entrepreneurs strive to createvalue [37] and to improve their own personal well-being, but also that of society [38,39], which isreflected in the wide economic development of the area in which they operate. The development ofentrepreneurship can be one of the indications of cross-border cooperation, leading to the improvementof the socio-economic situation of marginalized areas. Social activities have an important role toplay here as well (e.g., joint planning at a cross-border level, events, cultural activities, education,investment in infrastructure on both sides of the border, etc.), which makes the integration processmore natural and versatile [40]. According to P. Drucker, entrepreneurship as a mode of behaviour, canbe attributed to individuals, a team or institution [41]. Thus, in the regional system, the developmentof entrepreneurship is the resultant behaviour of many entities with different business objectives.In this sense, entrepreneurship refers not only to the business itself, but also to local governments,non-governmental organizations or other entities in the business environment [42]. Of great importancein the process of enterprise development are such factors as education and quality of intellectual capital,intensity and diversity of support for growing businesses, the activity of local and regional authoritiesin creating conditions conducive to economic revival, the social attitude of residents and the traditionof entrepreneurship in the given area.
Cross-border entrepreneurship concerns many indications of economic activity beyond borders,which usually include various forms of partnerships [43]. The cross-border location of economicentities means that it is often not necessary to register a business activity on the other side of the border,or else business activity is carried out there through another entity in the neighbouring border region.
The conceptual importance of cross-border entrepreneurship is thus determined by: the termcross-border, which means exceeding national borders; and its transboundary nature, which entailsregular and continuous contact beyond national borders, with daily (institutionalized or not)cooperation in the areas on both sides of the border [44].
Cross-border entrepreneurship represents an opportunity both for the development of the regionsas well as individual enterprises. The relationship between cross-border entrepreneurship andcross-border cooperation is interdependent. On the one hand, cross-border cooperation stimulatesthe development of entrepreneurship in marginalized regions, but at the same time, entrepreneurshipexpanding across national borders is also an impetus for closer cross-border cooperation.
Cross-border entrepreneurship has an influence on capital, supply and sales markets, the searchfor business partners, transfer of knowledge and know-how, acquiring staff and other resources ofinterest to the partners on both sides of the border [45]. Cross-border entrepreneurship can also includecross-border clusters and cooperation networks.
146
Sustainability 2016, 8, 230
5. Conditions for the Development of Cross-Border Entrepreneurship in the Silesian Voivodeshipand the Moravian-Silesian Region
The Silesian Voivodeship and the Moravian-Silesian Region are twin areas located on theCzech–Polish border, which for many years have been brought together through close cross-bordercooperation. According to the data as of 31 December 2013, Silesian Voivodeship had a populationof approximately 4.6 million and occupied an area of 12.333 km2, while GDP per capita at currentprices amounted to 44.960 PLN (approx. 11 thousand Euro). On the other hand, the Moravian-SilesianRegion was inhabited by approx. 1.2 million people and occupied an area of 5427 km2 and GDP percapita at current prices amounted to 325.963 CZK (12 thousand Euro) [46]. Despite the differencesin the level of population and surface area, the economic potential of both regions is similar. In thereport “Doing Business 2015”, in terms of the conditions for conducting business, Poland was ranked32nd place, while the Czech Republic 44th place for 189 countries assessed, while in terms of barriersin starting up a business, Poland was classified 85th, while the Czech Republic was ranked at 110thplace [47].
In both countries, there exist similar business solutions. A comparative analysis shows that both inthe Silesian Voivodeship, as well as in the Moravian-Silesian Region, a number of institutions operatewhich support developing companies. These are mainly technology parks and entrepreneurshipincubators, as well as loan and delivery funds. In both regions, there are also grants from structuralfunds available, and additionally in these areas, there is the possibility of tapping into EU fundsintended specifically for the development of borderlands which come from the Operational Programmeof Cross-Border Cooperation Czech Republic—Republic of Poland 2007–2013 and the OperationalProgramme INTERREG VA Czech Republic-Poland 2014–2020. There are also funds available that areintended for other entities, e.g., local governments, NGOs, labour market institutions, etc. which areaimed at the development of cross-border entrepreneurship, among other goals.
Both regions (together with Opole Voivodeship—Poland and the Local Government ŽilinaRegion—Slovakia) are members of the European Grouping of Territorial Cooperation TRITIA (TRITIA),which was established in 2013. In 2013, the implementation of the strategy for the system cooperationof the regions forming the European Grouping of Territorial Cooperation TRITIA was conducted,in which economic goals and the main tasks for achieving cross-border cooperation in the field ofentrepreneurship were established [48].
The objectives and activities that foster the development of cross-border entrepreneurship areincluded in Table 1.
Table 1. Objectives and actions supporting the development of cross-border entrepreneurship initiatedby European grouping of territorial cooperation TRITIA, Ltd. TRITIA.
Kind of Objectives/Support Discription of Activities
Overall objective
Creating an environment for employment growth and thedevelopment of cross-border economic space based onentrepreneurship, geographic location, local human resources,common history and the complementary strengths of all the regions
Specific objectives
1. Establishing conditions for the development andinstitutionalization of the different elements of cooperationleading to the establishment of cross-border economic space
2. Supporting the development of human resources andadministrative/institutional potential of thecross-border region
3. Supporting cross-border initiatives in research, developmentand innovation.
147
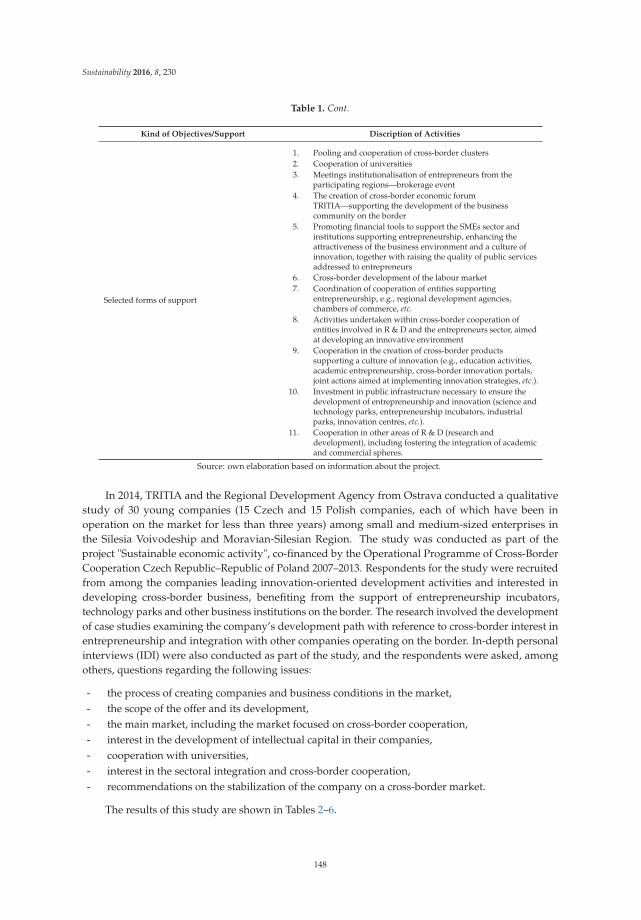
Sustainability 2016, 8, 230
Table 1. Cont.
Kind of Objectives/Support Discription of Activities
Selected forms of support
1. Pooling and cooperation of cross-border clusters2. Cooperation of universities3. Meetings institutionalisation of entrepreneurs from the
participating regions—brokerage event4. The creation of cross-border economic forum
TRITIA—supporting the development of the businesscommunity on the border
5. Promoting financial tools to support the SMEs sector andinstitutions supporting entrepreneurship, enhancing theattractiveness of the business environment and a culture ofinnovation, together with raising the quality of public servicesaddressed to entrepreneurs
6. Cross-border development of the labour market7. Coordination of cooperation of entities supporting
entrepreneurship, e.g., regional development agencies,chambers of commerce, etc.
8. Activities undertaken within cross-border cooperation ofentities involved in R & D and the entrepreneurs sector, aimedat developing an innovative environment
9. Cooperation in the creation of cross-border productssupporting a culture of innovation (e.g., education activities,academic entrepreneurship, cross-border innovation portals,joint actions aimed at implementing innovation strategies, etc.).
10. Investment in public infrastructure necessary to ensure thedevelopment of entrepreneurship and innovation (science andtechnology parks, entrepreneurship incubators, industrialparks, innovation centres, etc.).
11. Cooperation in other areas of R & D (research anddevelopment), including fostering the integration of academicand commercial spheres.
Source: own elaboration based on information about the project.
In 2014, TRITIA and the Regional Development Agency from Ostrava conducted a qualitativestudy of 30 young companies (15 Czech and 15 Polish companies, each of which have been inoperation on the market for less than three years) among small and medium-sized enterprises inthe Silesia Voivodeship and Moravian-Silesian Region. The study was conducted as part of theproject "Sustainable economic activity", co-financed by the Operational Programme of Cross-BorderCooperation Czech Republic–Republic of Poland 2007–2013. Respondents for the study were recruitedfrom among the companies leading innovation-oriented development activities and interested indeveloping cross-border business, benefiting from the support of entrepreneurship incubators,technology parks and other business institutions on the border. The research involved the developmentof case studies examining the company’s development path with reference to cross-border interest inentrepreneurship and integration with other companies operating on the border. In-depth personalinterviews (IDI) were also conducted as part of the study, and the respondents were asked, amongothers, questions regarding the following issues:
- the process of creating companies and business conditions in the market,- the scope of the offer and its development,- the main market, including the market focused on cross-border cooperation,- interest in the development of intellectual capital in their companies,- cooperation with universities,- interest in the sectoral integration and cross-border cooperation,- recommendations on the stabilization of the company on a cross-border market.
The results of this study are shown in Tables 2–6.
148
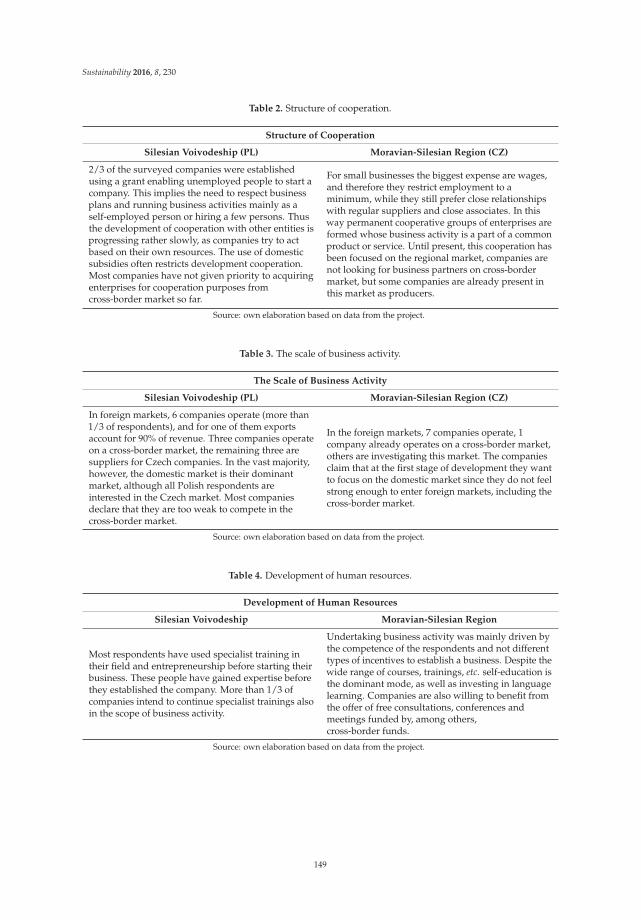
Sustainability 2016, 8, 230
Table 2. Structure of cooperation.
Structure of Cooperation
Silesian Voivodeship (PL) Moravian-Silesian Region (CZ)
2/3 of the surveyed companies were establishedusing a grant enabling unemployed people to start acompany. This implies the need to respect businessplans and running business activities mainly as aself-employed person or hiring a few persons. Thusthe development of cooperation with other entities isprogressing rather slowly, as companies try to actbased on their own resources. The use of domesticsubsidies often restricts development cooperation.Most companies have not given priority to acquiringenterprises for cooperation purposes fromcross-border market so far.
For small businesses the biggest expense are wages,and therefore they restrict employment to aminimum, while they still prefer close relationshipswith regular suppliers and close associates. In thisway permanent cooperative groups of enterprises areformed whose business activity is a part of a commonproduct or service. Until present, this cooperation hasbeen focused on the regional market, companies arenot looking for business partners on cross-bordermarket, but some companies are already present inthis market as producers.
Source: own elaboration based on data from the project.
Table 3. The scale of business activity.
The Scale of Business Activity
Silesian Voivodeship (PL) Moravian-Silesian Region (CZ)
In foreign markets, 6 companies operate (more than1/3 of respondents), and for one of them exportsaccount for 90% of revenue. Three companies operateon a cross-border market, the remaining three aresuppliers for Czech companies. In the vast majority,however, the domestic market is their dominantmarket, although all Polish respondents areinterested in the Czech market. Most companiesdeclare that they are too weak to compete in thecross-border market.
In the foreign markets, 7 companies operate, 1company already operates on a cross-border market,others are investigating this market. The companiesclaim that at the first stage of development they wantto focus on the domestic market since they do not feelstrong enough to enter foreign markets, including thecross-border market.
Source: own elaboration based on data from the project.
Table 4. Development of human resources.
Development of Human Resources
Silesian Voivodeship Moravian-Silesian Region
Most respondents have used specialist training intheir field and entrepreneurship before starting theirbusiness. These people have gained expertise beforethey established the company. More than 1/3 ofcompanies intend to continue specialist trainings alsoin the scope of business activity.
Undertaking business activity was mainly driven bythe competence of the respondents and not differenttypes of incentives to establish a business. Despite thewide range of courses, trainings, etc. self-education isthe dominant mode, as well as investing in languagelearning. Companies are also willing to benefit fromthe offer of free consultations, conferences andmeetings funded by, among others,cross-border funds.
Source: own elaboration based on data from the project.
149
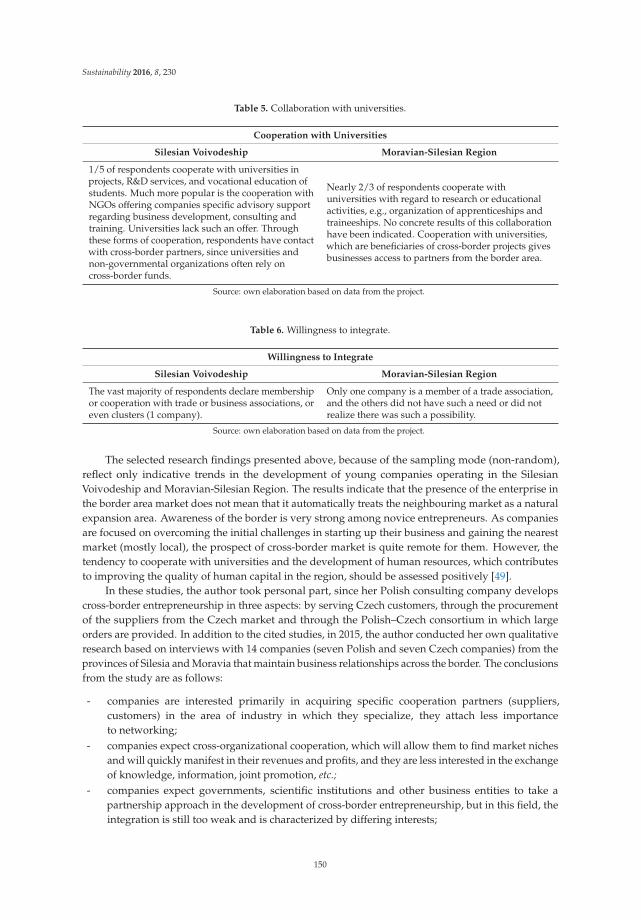
Sustainability 2016, 8, 230
Table 5. Collaboration with universities.
Cooperation with Universities
Silesian Voivodeship Moravian-Silesian Region
1/5 of respondents cooperate with universities inprojects, R&D services, and vocational education ofstudents. Much more popular is the cooperation withNGOs offering companies specific advisory supportregarding business development, consulting andtraining. Universities lack such an offer. Throughthese forms of cooperation, respondents have contactwith cross-border partners, since universities andnon-governmental organizations often rely oncross-border funds.
Nearly 2/3 of respondents cooperate withuniversities with regard to research or educationalactivities, e.g., organization of apprenticeships andtraineeships. No concrete results of this collaborationhave been indicated. Cooperation with universities,which are beneficiaries of cross-border projects givesbusinesses access to partners from the border area.
Source: own elaboration based on data from the project.
Table 6. Willingness to integrate.
Willingness to Integrate
Silesian Voivodeship Moravian-Silesian Region
The vast majority of respondents declare membershipor cooperation with trade or business associations, oreven clusters (1 company).
Only one company is a member of a trade association,and the others did not have such a need or did notrealize there was such a possibility.
Source: own elaboration based on data from the project.
The selected research findings presented above, because of the sampling mode (non-random),reflect only indicative trends in the development of young companies operating in the SilesianVoivodeship and Moravian-Silesian Region. The results indicate that the presence of the enterprise inthe border area market does not mean that it automatically treats the neighbouring market as a naturalexpansion area. Awareness of the border is very strong among novice entrepreneurs. As companiesare focused on overcoming the initial challenges in starting up their business and gaining the nearestmarket (mostly local), the prospect of cross-border market is quite remote for them. However, thetendency to cooperate with universities and the development of human resources, which contributesto improving the quality of human capital in the region, should be assessed positively [49].
In these studies, the author took personal part, since her Polish consulting company developscross-border entrepreneurship in three aspects: by serving Czech customers, through the procurementof the suppliers from the Czech market and through the Polish–Czech consortium in which largeorders are provided. In addition to the cited studies, in 2015, the author conducted her own qualitativeresearch based on interviews with 14 companies (seven Polish and seven Czech companies) from theprovinces of Silesia and Moravia that maintain business relationships across the border. The conclusionsfrom the study are as follows:
- companies are interested primarily in acquiring specific cooperation partners (suppliers,customers) in the area of industry in which they specialize, they attach less importanceto networking;
- companies expect cross-organizational cooperation, which will allow them to find market nichesand will quickly manifest in their revenues and profits, and they are less interested in the exchangeof knowledge, information, joint promotion, etc.;
- companies expect governments, scientific institutions and other business entities to take apartnership approach in the development of cross-border entrepreneurship, but in this field, theintegration is still too weak and is characterized by differing interests;
150
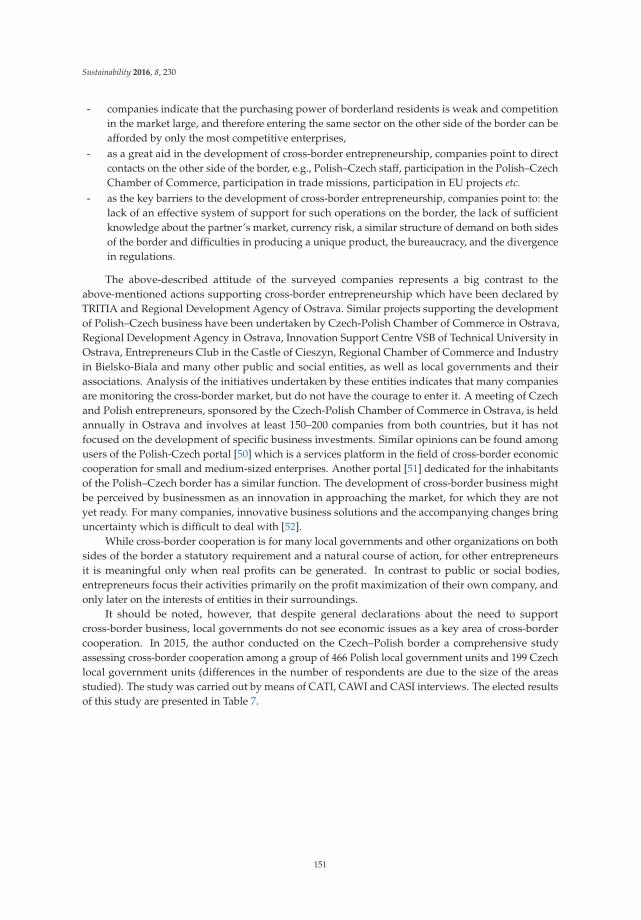
Sustainability 2016, 8, 230
- companies indicate that the purchasing power of borderland residents is weak and competitionin the market large, and therefore entering the same sector on the other side of the border can beafforded by only the most competitive enterprises,
- as a great aid in the development of cross-border entrepreneurship, companies point to directcontacts on the other side of the border, e.g., Polish–Czech staff, participation in the Polish–CzechChamber of Commerce, participation in trade missions, participation in EU projects etc.
- as the key barriers to the development of cross-border entrepreneurship, companies point to: thelack of an effective system of support for such operations on the border, the lack of sufficientknowledge about the partner’s market, currency risk, a similar structure of demand on both sidesof the border and difficulties in producing a unique product, the bureaucracy, and the divergencein regulations.
The above-described attitude of the surveyed companies represents a big contrast to theabove-mentioned actions supporting cross-border entrepreneurship which have been declared byTRITIA and Regional Development Agency of Ostrava. Similar projects supporting the developmentof Polish–Czech business have been undertaken by Czech-Polish Chamber of Commerce in Ostrava,Regional Development Agency in Ostrava, Innovation Support Centre VSB of Technical University inOstrava, Entrepreneurs Club in the Castle of Cieszyn, Regional Chamber of Commerce and Industryin Bielsko-Biala and many other public and social entities, as well as local governments and theirassociations. Analysis of the initiatives undertaken by these entities indicates that many companiesare monitoring the cross-border market, but do not have the courage to enter it. A meeting of Czechand Polish entrepreneurs, sponsored by the Czech-Polish Chamber of Commerce in Ostrava, is heldannually in Ostrava and involves at least 150–200 companies from both countries, but it has notfocused on the development of specific business investments. Similar opinions can be found amongusers of the Polish-Czech portal [50] which is a services platform in the field of cross-border economiccooperation for small and medium-sized enterprises. Another portal [51] dedicated for the inhabitantsof the Polish–Czech border has a similar function. The development of cross-border business mightbe perceived by businessmen as an innovation in approaching the market, for which they are notyet ready. For many companies, innovative business solutions and the accompanying changes bringuncertainty which is difficult to deal with [52].
While cross-border cooperation is for many local governments and other organizations on bothsides of the border a statutory requirement and a natural course of action, for other entrepreneursit is meaningful only when real profits can be generated. In contrast to public or social bodies,entrepreneurs focus their activities primarily on the profit maximization of their own company, andonly later on the interests of entities in their surroundings.
It should be noted, however, that despite general declarations about the need to supportcross-border business, local governments do not see economic issues as a key area of cross-bordercooperation. In 2015, the author conducted on the Czech–Polish border a comprehensive studyassessing cross-border cooperation among a group of 466 Polish local government units and 199 Czechlocal government units (differences in the number of respondents are due to the size of the areasstudied). The study was carried out by means of CATI, CAWI and CASI interviews. The elected resultsof this study are presented in Table 7.
151
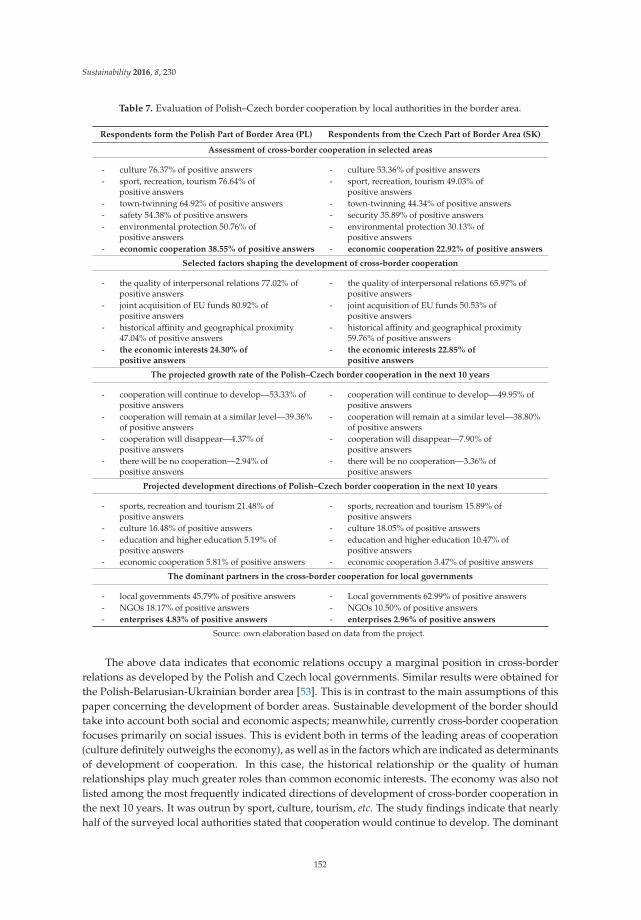
Sustainability 2016, 8, 230
Table 7. Evaluation of Polish–Czech border cooperation by local authorities in the border area.
Respondents form the Polish Part of Border Area (PL) Respondents from the Czech Part of Border Area (SK)
Assessment of cross-border cooperation in selected areas
- culture 76.37% of positive answers- sport, recreation, tourism 76.64% of
positive answers- town-twinning 64.92% of positive answers- safety 54.38% of positive answers- environmental protection 50.76% of
positive answers- economic cooperation 38.55% of positive answers
- culture 53.36% of positive answers- sport, recreation, tourism 49.03% of
positive answers- town-twinning 44.34% of positive answers- security 35.89% of positive answers- environmental protection 30.13% of
positive answers- economic cooperation 22.92% of positive answers
Selected factors shaping the development of cross-border cooperation
- the quality of interpersonal relations 77.02% ofpositive answers
- joint acquisition of EU funds 80.92% ofpositive answers
- historical affinity and geographical proximity47.04% of positive answers
- the economic interests 24.30% ofpositive answers
- the quality of interpersonal relations 65.97% ofpositive answers
- joint acquisition of EU funds 50.53% ofpositive answers
- historical affinity and geographical proximity59.76% of positive answers
- the economic interests 22.85% ofpositive answers
The projected growth rate of the Polish–Czech border cooperation in the next 10 years
- cooperation will continue to develop—53.33% ofpositive answers
- cooperation will remain at a similar level—39.36%of positive answers
- cooperation will disappear—4.37% ofpositive answers
- there will be no cooperation—2.94% ofpositive answers
- cooperation will continue to develop—49.95% ofpositive answers
- cooperation will remain at a similar level—38.80%of positive answers
- cooperation will disappear—7.90% ofpositive answers
- there will be no cooperation—3.36% ofpositive answers
Projected development directions of Polish–Czech border cooperation in the next 10 years
- sports, recreation and tourism 21.48% ofpositive answers
- culture 16.48% of positive answers- education and higher education 5.19% of
positive answers- economic cooperation 5.81% of positive answers
- sports, recreation and tourism 15.89% ofpositive answers
- culture 18.05% of positive answers- education and higher education 10.47% of
positive answers- economic cooperation 3.47% of positive answers
The dominant partners in the cross-border cooperation for local governments
- local governments 45.79% of positive answers- NGOs 18.17% of positive answers- enterprises 4.83% of positive answers
- Local governments 62.99% of positive answers- NGOs 10.50% of positive answers- enterprises 2.96% of positive answers
Source: own elaboration based on data from the project.
The above data indicates that economic relations occupy a marginal position in cross-borderrelations as developed by the Polish and Czech local governments. Similar results were obtained forthe Polish-Belarusian-Ukrainian border area [53]. This is in contrast to the main assumptions of thispaper concerning the development of border areas. Sustainable development of the border shouldtake into account both social and economic aspects; meanwhile, currently cross-border cooperationfocuses primarily on social issues. This is evident both in terms of the leading areas of cooperation(culture definitely outweighs the economy), as well as in the factors which are indicated as determinantsof development of cooperation. In this case, the historical relationship or the quality of humanrelationships play much greater roles than common economic interests. The economy was also notlisted among the most frequently indicated directions of development of cross-border cooperation inthe next 10 years. It was outrun by sport, culture, tourism, etc. The study findings indicate that nearlyhalf of the surveyed local authorities stated that cooperation would continue to develop. The dominant
152
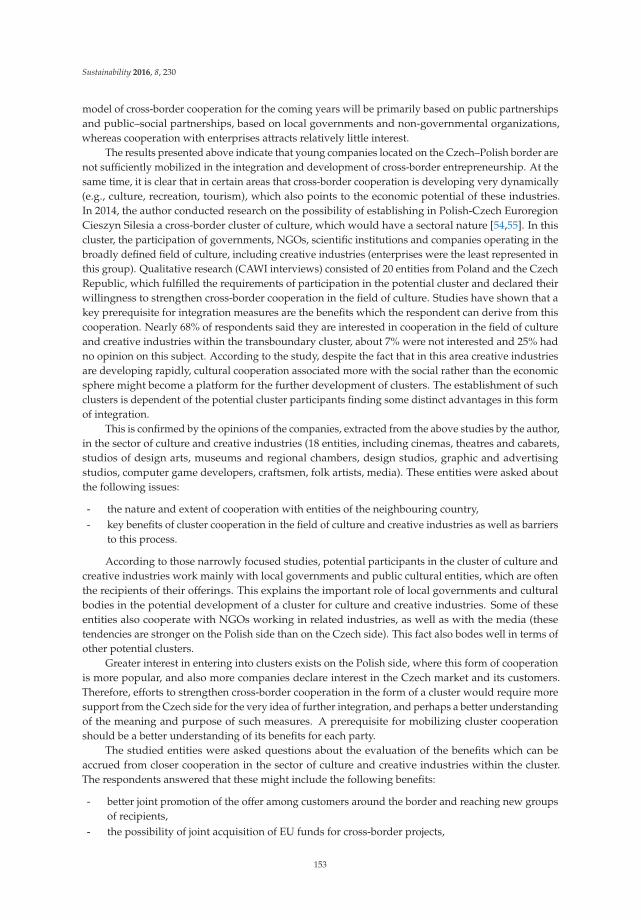
Sustainability 2016, 8, 230
model of cross-border cooperation for the coming years will be primarily based on public partnershipsand public–social partnerships, based on local governments and non-governmental organizations,whereas cooperation with enterprises attracts relatively little interest.
The results presented above indicate that young companies located on the Czech–Polish border arenot sufficiently mobilized in the integration and development of cross-border entrepreneurship. At thesame time, it is clear that in certain areas that cross-border cooperation is developing very dynamically(e.g., culture, recreation, tourism), which also points to the economic potential of these industries.In 2014, the author conducted research on the possibility of establishing in Polish-Czech EuroregionCieszyn Silesia a cross-border cluster of culture, which would have a sectoral nature [54,55]. In thiscluster, the participation of governments, NGOs, scientific institutions and companies operating in thebroadly defined field of culture, including creative industries (enterprises were the least represented inthis group). Qualitative research (CAWI interviews) consisted of 20 entities from Poland and the CzechRepublic, which fulfilled the requirements of participation in the potential cluster and declared theirwillingness to strengthen cross-border cooperation in the field of culture. Studies have shown that akey prerequisite for integration measures are the benefits which the respondent can derive from thiscooperation. Nearly 68% of respondents said they are interested in cooperation in the field of cultureand creative industries within the transboundary cluster, about 7% were not interested and 25% hadno opinion on this subject. According to the study, despite the fact that in this area creative industriesare developing rapidly, cultural cooperation associated more with the social rather than the economicsphere might become a platform for the further development of clusters. The establishment of suchclusters is dependent of the potential cluster participants finding some distinct advantages in this formof integration.
This is confirmed by the opinions of the companies, extracted from the above studies by the author,in the sector of culture and creative industries (18 entities, including cinemas, theatres and cabarets,studios of design arts, museums and regional chambers, design studios, graphic and advertisingstudios, computer game developers, craftsmen, folk artists, media). These entities were asked aboutthe following issues:
- the nature and extent of cooperation with entities of the neighbouring country,- key benefits of cluster cooperation in the field of culture and creative industries as well as barriers
to this process.
According to those narrowly focused studies, potential participants in the cluster of culture andcreative industries work mainly with local governments and public cultural entities, which are oftenthe recipients of their offerings. This explains the important role of local governments and culturalbodies in the potential development of a cluster for culture and creative industries. Some of theseentities also cooperate with NGOs working in related industries, as well as with the media (thesetendencies are stronger on the Polish side than on the Czech side). This fact also bodes well in terms ofother potential clusters.
Greater interest in entering into clusters exists on the Polish side, where this form of cooperationis more popular, and also more companies declare interest in the Czech market and its customers.Therefore, efforts to strengthen cross-border cooperation in the form of a cluster would require moresupport from the Czech side for the very idea of further integration, and perhaps a better understandingof the meaning and purpose of such measures. A prerequisite for mobilizing cluster cooperationshould be a better understanding of its benefits for each party.
The studied entities were asked questions about the evaluation of the benefits which can beaccrued from closer cooperation in the sector of culture and creative industries within the cluster.The respondents answered that these might include the following benefits:
- better joint promotion of the offer among customers around the border and reaching new groupsof recipients,
- the possibility of joint acquisition of EU funds for cross-border projects,
153
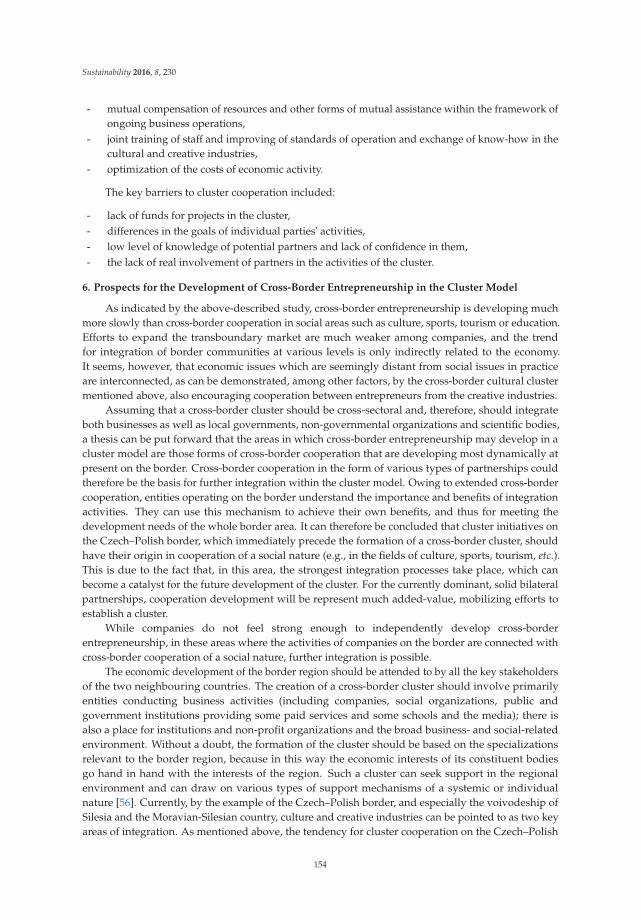
Sustainability 2016, 8, 230
- mutual compensation of resources and other forms of mutual assistance within the framework ofongoing business operations,
- joint training of staff and improving of standards of operation and exchange of know-how in thecultural and creative industries,
- optimization of the costs of economic activity.
The key barriers to cluster cooperation included:
- lack of funds for projects in the cluster,- differences in the goals of individual parties' activities,- low level of knowledge of potential partners and lack of confidence in them,- the lack of real involvement of partners in the activities of the cluster.
6. Prospects for the Development of Cross-Border Entrepreneurship in the Cluster Model
As indicated by the above-described study, cross-border entrepreneurship is developing muchmore slowly than cross-border cooperation in social areas such as culture, sports, tourism or education.Efforts to expand the transboundary market are much weaker among companies, and the trendfor integration of border communities at various levels is only indirectly related to the economy.It seems, however, that economic issues which are seemingly distant from social issues in practiceare interconnected, as can be demonstrated, among other factors, by the cross-border cultural clustermentioned above, also encouraging cooperation between entrepreneurs from the creative industries.
Assuming that a cross-border cluster should be cross-sectoral and, therefore, should integrateboth businesses as well as local governments, non-governmental organizations and scientific bodies,a thesis can be put forward that the areas in which cross-border entrepreneurship may develop in acluster model are those forms of cross-border cooperation that are developing most dynamically atpresent on the border. Cross-border cooperation in the form of various types of partnerships couldtherefore be the basis for further integration within the cluster model. Owing to extended cross-bordercooperation, entities operating on the border understand the importance and benefits of integrationactivities. They can use this mechanism to achieve their own benefits, and thus for meeting thedevelopment needs of the whole border area. It can therefore be concluded that cluster initiatives onthe Czech–Polish border, which immediately precede the formation of a cross-border cluster, shouldhave their origin in cooperation of a social nature (e.g., in the fields of culture, sports, tourism, etc.).This is due to the fact that, in this area, the strongest integration processes take place, which canbecome a catalyst for the future development of the cluster. For the currently dominant, solid bilateralpartnerships, cooperation development will be represent much added-value, mobilizing efforts toestablish a cluster.
While companies do not feel strong enough to independently develop cross-borderentrepreneurship, in these areas where the activities of companies on the border are connected withcross-border cooperation of a social nature, further integration is possible.
The economic development of the border region should be attended to by all the key stakeholdersof the two neighbouring countries. The creation of a cross-border cluster should involve primarilyentities conducting business activities (including companies, social organizations, public andgovernment institutions providing some paid services and some schools and the media); there isalso a place for institutions and non-profit organizations and the broad business- and social-relatedenvironment. Without a doubt, the formation of the cluster should be based on the specializationsrelevant to the border region, because in this way the economic interests of its constituent bodiesgo hand in hand with the interests of the region. Such a cluster can seek support in the regionalenvironment and can draw on various types of support mechanisms of a systemic or individualnature [56]. Currently, by the example of the Czech–Polish border, and especially the voivodeship ofSilesia and the Moravian-Silesian country, culture and creative industries can be pointed to as two keyareas of integration. As mentioned above, the tendency for cluster cooperation on the Czech–Polish
154
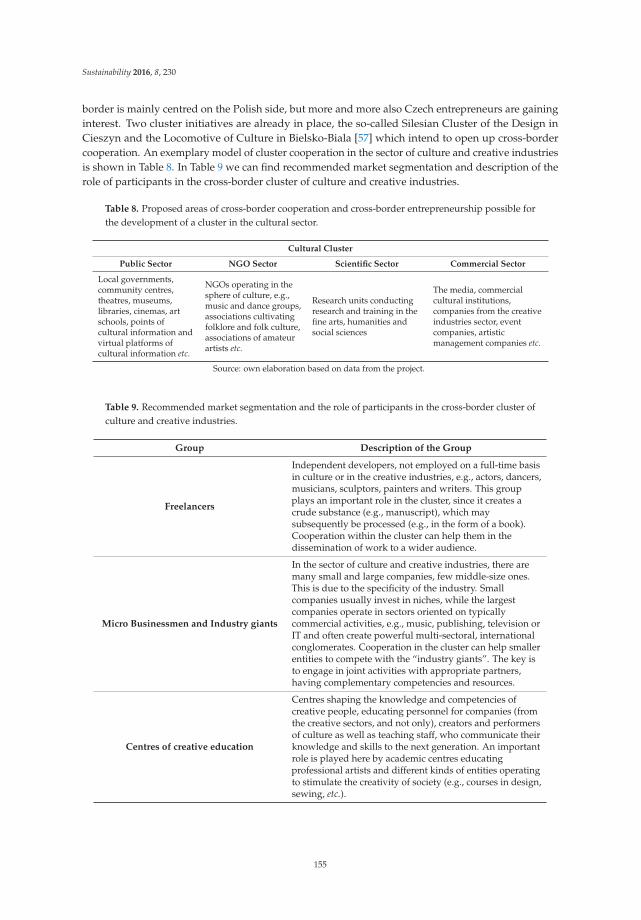
Sustainability 2016, 8, 230
border is mainly centred on the Polish side, but more and more also Czech entrepreneurs are gaininginterest. Two cluster initiatives are already in place, the so-called Silesian Cluster of the Design inCieszyn and the Locomotive of Culture in Bielsko-Biala [57] which intend to open up cross-bordercooperation. An exemplary model of cluster cooperation in the sector of culture and creative industriesis shown in Table 8. In Table 9 we can find recommended market segmentation and description of therole of participants in the cross-border cluster of culture and creative industries.
Table 8. Proposed areas of cross-border cooperation and cross-border entrepreneurship possible forthe development of a cluster in the cultural sector.
Cultural Cluster
Public Sector NGO Sector Scientific Sector Commercial Sector
Local governments,community centres,theatres, museums,libraries, cinemas, artschools, points ofcultural information andvirtual platforms ofcultural information etc.
NGOs operating in thesphere of culture, e.g.,music and dance groups,associations cultivatingfolklore and folk culture,associations of amateurartists etc.
Research units conductingresearch and training in thefine arts, humanities andsocial sciences
The media, commercialcultural institutions,companies from the creativeindustries sector, eventcompanies, artisticmanagement companies etc.
Source: own elaboration based on data from the project.
Table 9. Recommended market segmentation and the role of participants in the cross-border cluster ofculture and creative industries.
Group Description of the Group
Freelancers
Independent developers, not employed on a full-time basisin culture or in the creative industries, e.g., actors, dancers,musicians, sculptors, painters and writers. This groupplays an important role in the cluster, since it creates acrude substance (e.g., manuscript), which maysubsequently be processed (e.g., in the form of a book).Cooperation within the cluster can help them in thedissemination of work to a wider audience.
Micro Businessmen and Industry giants
In the sector of culture and creative industries, there aremany small and large companies, few middle-size ones.This is due to the specificity of the industry. Smallcompanies usually invest in niches, while the largestcompanies operate in sectors oriented on typicallycommercial activities, e.g., music, publishing, television orIT and often create powerful multi-sectoral, internationalconglomerates. Cooperation in the cluster can help smallerentities to compete with the “industry giants”. The key isto engage in joint activities with appropriate partners,having complementary competencies and resources.
Centres of creative education
Centres shaping the knowledge and competencies ofcreative people, educating personnel for companies (fromthe creative sectors, and not only), creators and performersof culture as well as teaching staff, who communicate theirknowledge and skills to the next generation. An importantrole is played here by academic centres educatingprofessional artists and different kinds of entities operatingto stimulate the creativity of society (e.g., courses in design,sewing, etc.).
155
Sustainability 2016, 8, 230
Table 9. Cont.
Group Description of the Group
Public cultural institutions
Museums, cultural centers, libraries, theaters, cinemas,concert halls, galleries and historic buildings, conducting awhole spectrum of socio-cultural activities, providingvisitors a variety of cultural forms of entertainment (e.g.,the performances, festivals, music concerts), acquiringknowledge and new skills (e.g., craft workshops, drawing),as well as developing their creative expression. Their offerattracts residents, domestic and foreign tourists, as well asartists looking for possibilities of establishing contacts withother artists or just inspiration for the development of theirown work.
Gatekeepers
Persons or entities that determine which products islaunched on the market, e.g., art gallery manager, chiefeditor of the publishing house, the artistic director of thetheatre, etc.
Creative hidden people
Talented people, who use their talent to work for entitiesoutside the creative industries. They occupy positions inthe project departments (designers, architects), marketing(copywriters, graphic designers), IT (IT specialists), as wellas in other spheres, where their creative abilities are used.
Non-governmental organizations(NGOs)
Organizations of authors, but also those who want to workto strengthen these sectors in the region. Theseorganizations are often involved in the development ofsocio-cultural heritage of the given region, includingsupport of cooperation and integration in the environmentof creators, promoting the work of young talents,supporting public participation in culture and its activitywith respect to fostering national heritage, promotion ofcultural heritage of a region in the country and abroad.
Public authorities
Public authorities can initiate and support thedevelopment of creative industries in the region in manydifferent ways, both directly (e.g., through financing orco-financing of business, science and culture-relatedactivities) as well as indirectly, reinforcing the environmentin which these entities operate.
Source: own elaboration [57].
Cooperation of organizations, commercial entities and institutions within the cluster of cultureand creative industries fits perfectly with the determinants of cross-border cooperation as well ascross-border entrepreneurship. In terms of cross-border cluster operation, one can talk about furtherintegration within a specific industry, sector e.g., culture, as well as the creation of mechanisms toencourage improvement of competitiveness and development of entities operating within a cluster.So far, there are not many examples of networking available. This may be due to many reasons: toostrong an impact of barriers hindering this type of cooperation in the border area, and insufficientawareness of the benefits, advantages and conditions of networking cooperation.
Although the issue of partnership and sustainable cooperation is not an unfamiliar subject toany of the entities operating on the border (e.g., due to the large number of cross-border projects indifferent areas), among the companies there is a lack of spontaneous tendency to develop cross-borderentrepreneurship. While the majority of surveyed companies declare that they are interested in suchcooperation, they do not take any actions towards its effective establishment. It is a large dissonancecompared to the intensive cross-border cooperation occurring in the social sphere in terms of culture.As the author recommends, it is therefore possible to draw on the good cooperation that exists between
156
Sustainability 2016, 8, 230
local governments in order to intensify economic relations. Such opportunities have emerged on thebasis of previous studies on the establishment of transboundary cultural clusters. Research cited inthis study confirms the important role local governments and the non-governmental sector has in thecross border development entrepreneurship of which can be transferred to enterprises. Extremelyimportant is the education of potential participants of networks and clusters in terms of the specifics ofthis form of cooperation.
7. Conclusions
Cross-border entrepreneurship is an important aspect in the development of cross-bordercooperation, which should contribute to ensuring there are equal development opportunities inperipheral areas at risk of marginalization. It is favoured by both natural integration trends in theborder regions as well as the high availability of EU funds from the INTERREG program for thedevelopment of cross-border cooperation. In the studied area of the Czech–Polish border, effectsof cross-border cooperation are clearly visible in the social sphere, primarily in the fields of culture,education, sports and tourism, administration, etc. However, this cooperation has developed to a muchlesser extent in the economic sphere. For most companies operating in border regions, the markets ofneighbouring countries are treated equally to other, much more distant foreign markets. It is difficultto identify clear trends for economic cooperation here.
The results of research and several years of involvement by the author in cross-borderentrepreneurship, from a scientific and practical point of view, show that the development ofcross-border cooperation—supported by local authorities—is limited to bilateral contact and projects.It is difficult to indicate a direction that allows for further strengthening of cooperation in the economicfield, although further cluster cooperation seems a natural path.
Despite a series of actions aimed at systematic promotion of economic cooperation on theborderline, it is difficult to identify a significant number of such examples in Silesia Voivodeshipand the Moravian-Silesian Region. This is in contrast to the strategy of cross-border cooperation forthe border area, which has been implemented since 2013. In this document, economic cooperation isof key importance. Another real problem of cross-border cooperation is the stability of partnershipsand lack of tendency to transform bilateral cooperation into networking cooperation. This meansthat cooperation between the same partners strengthens, but it does not expand to other entities.In these circumstances, cluster cooperation can be a model especially worth promoting among allentities interested in border development, among local governments as well as non-governmentalorganizations and entrepreneurs.
Although sustainable development of the border should be based on both social and economicprocesses, the sphere of entrepreneurship is now clearly ignored. It can be seen i.a. in the resultsof research carried out among local governments. They do not appreciate the economic aspects ofcross-border cooperation, and the most promising directions of further integration are considered to beculture, education, tourism, etc. These sectors, however, also have certain economic potential, whichmeans that there are opportunities for the involvement of entrepreneurs in cross-border cooperation inthese areas.
The study results confirmed that between the Polish and Czech companies operating in the borderarea, there are differences in developmental processes, approaches to businesses, types of offerings,etc. This is not conducive to the natural processes of integration. It can therefore not be said that thechances of economic integration in each of the branches are identical.
In trying to solve the research problem relating to the possible development of cross-borderentrepreneurship on the Polish–Czech border, the author turned to the concept of cluster cooperation,which has been more developed on the Polish side. Prospects for the development of clusters on thePolish–Czech borderland have been linked with the sectors that are developing most quickly in thisarea, i.e., the sector of culture and creative industries. As the second criterion, the author took intoaccount the involvement of partners from different sectors: administration and local government,
157
Sustainability 2016, 8, 230
science and non-governmental organizations from both sides of the border. The studies conducted inthis field have shown that culture and creative industries is the sphere where the entities of the Polishand Czech border areas see the greatest opportunities for further integration.
In the opinion of the author, the catalyst for cross-border entrepreneurship, at least in some sectors(e.g., in the field of creative industries), may centre on the very sophisticated cross-border cooperationat the public and social levels (i.e., the cooperation of local governments and non-governmentalorganizations), in which enterprises operating on each side of the border can be engaged. It also givesimpetus to further expansion of this cooperation and transforming bilateral relationships to ones basedon networking and clustering. Such opportunities have already been verified by the author in previousstudies analysing the conditions conducive to the emergence of cross-border cultural clusters.
According to the author, in the study area, it is difficult to extract natural tendencies and thedesire of companies to develop cross-border entrepreneurship, but a factor that can boost economicintegration is rapidly developing cross-border cooperation in the social field, e.g., in culture [47,48]etc. Although it is not a universal solution that can be applied to any industry, at least in sectorsdistinguished by intense cross-border relations, including business entities in this cooperation canbring measurable results, reflected also in the development of the border area. The condition for thismechanism is the awareness of the benefits which both parties can gain from the development ofco-operation, also including entrepreneurs. Another important consideration affecting the efficiencyof cross-border cooperation that determines the participation of entrepreneurs is the creation ofmechanisms for its further development, including the gradual transformation of bilateral agreementsinto networking and clustering cooperation.
In conclusion, as long as the sectors such as culture and creative industries (or other sectors in otherborder regions) will be indicated directly or indirectly according to regional specializations, whosedevelopment is supported by all stakeholders of cross-border cooperation (including i.a. governments,research bodies, NGOs and entrepreneurs), then the cross-border cooperation can be transformed intothat of clusters. This cooperation has its origin in typically social activities (as mentioned above, EUbilateral projects implemented mainly by local governments and non-governmental organizations),but under favorable conditions, it can also extend to business activities that generate economic benefitsand contribute to the development of cross-border regions by strengthening regional specializations.
Conflicts of Interest: The author declares no conflict of interest.
References
1. Bleeke, J.; Ernst, D. The way to win in cross-border alliances. Harvard Bus. Rev. 1991, 69, 127–135.2. Program INTERREG VA Czech Republic-Poland 2014–2020. Available online: https://www.ewt.gov.pl/
media/5504/Program_INTERREG_V_A_Czechy_Polska.pdf (accessed on 15 November 2015).3. The OECD Study on Local Partnerships, OECD, Paris 1990. Available online: http://www.oecd.org/
cfe/leed/theoecdstudyonlocalpartnerships.htm (accessed on 20 November 2015).4. Ray, C. Neo-endogenous Rural Development in the EU. In Book Handbook of Rural Studies; Cloke, P.,
Marsden, T., Mooney, P., Eds.; Sage: London, UK, 2006; pp. 278–291.5. Simard, J.F.; Chiasson, G. Introduction: Territorial Governance—A New Take on Development. Can. J.
Reg. Sci. 2008, 31, 471–485.6. European Chapter of Border and Cross-Border Regions. Available online: http://www.aebr.eu/files/
publications/110915_Charta_EN_clean.pdf (accessed on 15 November 2015).7. European Outline Convention on Transfrontier Co-operation between Territorial Communities or Authorities.
Available online: https://rm.coe.int/CoERMPublicCommonSearchServices/DisplayDCTMContent?documentId=0900001680078b0c (accessed on 15 November 2015).
8. European Charter of Regional Self-Government. Available online: http://www.cvce.eu/en/obj/ draft_european_charter_of_regional_self_government_5_june_1997-en-78ae4dcf-6346-4aa8-8474-7535e4091bf7.html(accessed on 15 November 2015).
158
Sustainability 2016, 8, 230
9. Perkowski, M. Współpraca transgraniczna. Available online: http://www.prawoipartnerstwo.pl/stara/publikacje/Wspolpraca.pdf (accessed on 15 November 2015). (In Polish)
10. Rozporzadzenie Rady z 21 Czerwca 1999 r.; Wprowadzajace Ogólne Przepisy Dotyczace FunduszyStrukturalnych nr 1260/1999/WE. Available online: http://ec.europa.eu/regional_policy/sources/docoffic/official/regulation/content/pl/02_pdf/00_1_sf_1_pl.pdf (accessed on 15 November 2015). (In Polish)
11. Geddes, M. Partnership Making Policy, Report: Enhancing the Capacity of Partnerships to Influence Policy; Availableonline: http://www.oecd.org/cfe/leed/36279186.pdf (accessed on 15 November 2015).
12. Rozporzadzenie Rady z 11 lipca 2006 r. nr (WE) nr 1083/2006, Ustanawiajace Przepisy Ogólne DotyczaceEuropejskiego Funduszu Rozwoju Regionalnego, Europejskiego Funduszu Społecznego Oraz FunduszuSpójnosci i Uchylajace Rozporzadzenie (WE) nr 1260/1999. Available online: http://www.oecd.org/cfe/leed/36279186.pdf (accessed on 16 November 2015). (In Polish)
13. Lepik, K. Euroregions as mechanisms for strengthening cross-border cooperation in the Baltic Sea region.Trames 2009, 13, 265–284. [CrossRef]
14. Kramsch, O.; Hooper, B. Cross Border Governance in the European Union; Routledge: New York, NY, USA, 2004.15. Perkmann, M. Policy Entrepreneurship and Multi-Level Governance. A Comparative Study of European
Cross-Border Regions. Environ. Plan. C Gov. Policy 2007, 25, 861–879. [CrossRef]16. Harguindéguy, J.; Bray, Z. Does cross-border co-operation empower European regions? The case of
INTERREG III-A France-Spain. Environ. Plan. C Gov. Policy 2009, 27, 747–760. [CrossRef]17. Kurowska-Pysz, J. Problem trwałosci klastrów dofinansowanych ze srodków Unii Europejskiej w aspekcie
nowych uwarunkowan wdrazania projektów w latach 2014-2020. In Book Zarzadzanie i inzynieria produkcji.Wybrane zagadnienia; Kurowska-Pysz, J., Ed.; Wydawnictwo Naukowe Wyzszej Szkoły Biznesu w DabrowieGórniczej: Dabrowa Górnicza, Poland, 2015. (In Polish)
18. Trott, P. Innovation Management and New Product Development; Pearson Education Ltd.: Edinburgh, UK, 2008.19. Etzkowitz, H. The triple helix. In University-Industry-Government Innovation in Action; Routledge: London,
UK, 2009; pp. 15–22.20. Carayannis, E.; Barth, T.; Campbell, D. The Quintuple Helix innovation model: Global warming as a
challenge and driver for innovation. J. Innov. Entrep. 2012. [CrossRef]21. Olesinski, Z. Zarzadzanie Relacjami Miedzyorganizacyjnymi; Wydawnictwo CH Beck: Warszawa, Poland, 2010.
(In Polish)22. Henning, M.; Moodysson, J.; Nilsson, M. Innovation and Regional Transformation. In From Clusters to New
Combinations; Region Skane: Malmö, Spain, 2010.23. Lazerson, M.; Lorenzoni, G. The Firms that Feed Industrial Districts: A Return to the Italian Source.
Ind. Corp. Chang. 1999, 8, 235–265. [CrossRef]24. Bathelt, H. Cluster Relations in the Media Industry: Exploring the “Distanced Neighbour” Paradox in
Leipzig. Reg. Stud. 2005, 39, 105–127. [CrossRef]25. Sheppard, E. Positionality and globalization in economic geography. In The Changing Economic Geography of
Globalization: Reinventing Space; Giovanna, V., Ed.; Taylor & Francis: Oxfordshire, UK, 2005.26. Lipnack, J.; Stamps, J. The age of network. In Organizing Principles for the 21st Century; Oliver Wight
Publication: Gloucester, UK, 1994.27. Pachura, P. Analiza potencjału budowy efektywnych struktur transgranicznych sieci innowacyjnych na
przykładzie województwa slaskiego oraz regionów Czech i Słowacji, Ministerstwo Rozwoju Regionalnego,Czestochowa 2009, 9. Available online: https://www.ewaluacja.gov.pl/Wyniki/Documents/2_059.pdf(accessed on 30 November 2015). (In Polish).
28. Brito, C.; Correia, R. Regions as networks. Towards a conceptual framework of territorial dynamic,Research Work in Progress. 2010, 357, pp. 20–23. Available online: http://www.fep.up.pt/investigacao/workingpapers/10.01.18_wp357.pdf (accessed on 30 November 2015).
29. Fromhold-Eisebith, E.; Eisebith, G. How to institutionalize innovative clusters? Comparing explicit top-downand implicit bottom-up approaches. Res. Policy 2005, 34, 1250–1268. [CrossRef]
30. Porter, M. The Cooperative Advantage of Nations; Harvard Business Review: New York, NY, USA, 1990;Available online: http://dl1.cuni.cz/pluginfile.php/50387/mod_resource/content/0/Porter-competitive-advantage.pdf (accessed on 30 November 2015).
31. Rosenfeld, S.A. Community College/Cluster Connections: Specialization and Competitiveness in the UnitedStates and Europe. Econ. Dev. Q. 2000, 14, 51–62. [CrossRef]
159
Sustainability 2016, 8, 230
32. Almodovar, J.; Teixeira, A. Conceptualizing clusters through the lens of networks: A critical synthesis.FEP Working Papers, 2009. Available online: http://www.fep.up.pt/investigacao/workingpapers/09.07.15_wp328.pdf (accessed on 20 December 2015).
33. Maskell, P.; Kebir, L. What qualifies as a cluster theory? Available online: http://www3.druid.dk/wp/20050009.pdf (accessed on 30 November 2015).
34. Lepik, K.L.; Krigul, M. Cross-border cooperation institution in building a knowledge cross-border region.Probl. Perspect. Manag. 2009, 7, 33–45.
35. Rialland, A. Cluster Dynamics and Innovation; IGLO-MP2020 Working Paper; Norwegian University of Scienceand Technology: Trondheim, Norway, 2009.
36. Ketels, C.; Lindqvist, G.; Sölvell, Ö. Strengthening Clusters and Competitiveness in Europe. The Role ofCluster Organisations, the Cluster Observatory, 2012. Available online: https://www.google.com.hk/ url?sa=t&rct=j&q=&esrc=s&source=web&cd=1&ved=0ahUKEwjatNi3wp7LAhVBhSwKHa9HCWcQFggb MAA&url=http%3a%2f%2fwww.clusterportal-bw.de%2fservice%2fpublikationen%2fclusterpolitik-und-clusterpolitische-massnahmen%2fpublikation%2fPublikationen%2fdownload%2fdokument%2fstrengthening- clusters-and-competitiviness-in-europe%2f&usg=AFQjCNGM483M6JL2-3T08HLuEWhUYNqvAA&sig2=lS6kD_sy6cBB-vSU0J6lXw (accessed on 21 November 2015).
37. Hisrich, R.D. Entrepreneurship/intrapreneurship. Am. Psychol. 1990, 45, 209–222. [CrossRef]38. Burns, P. Entrepreneurship and Small Business; Palgrave MacMillan: Houndmills, UK, 2007.39. Davidsson, P. The domain of entrepreneurship research: Some suggestions. In Book Cognitive
Approaches to Entrepreneurship Research; Katz, J.A., Shepherd, D.A., Elsevier, J.A.I., Eds.; Book Series:Advances in Entrepreneurship, Firm Emergence and Growth, Emerald Insight; Available online:http://www.emeraldinsight.com/doi/book/10.1016/S1074-7540(2003)6 (accessed on 21 November 2015).
40. Schuler, R.S.; Tarique, I.; Jackson, S.E. Managing Human Resourses in Cross-Border Aliancess, Advances inMergers and Acquisitions (Advances in Mergers and Acquisitions, Volume 3); Emerald Group Publishing Limited:Bingley, UK; pp. 103–129.
41. Drucker, P. Innovation and Entrepreneurship, Practice and Principles; Harper&Row: New York, NY, USA, 1985.42. Abele, L.; Liduma, D.; Leitane, I.; Mežinska, A. Analysis of factors forming competitive business environment
in cross-border region. Econ. Manag. 2012, 17, 1308–1313. [CrossRef]43. Smallbone, D.; Welter, F. Cross-border entrepreneurship. Entrep. Reg. Dev. Int. J. 2012, 24, 43–63. [CrossRef]44. Resko, D. Przedsiebiorczosc transgraniczna w wybranych jednostkach terytorialnych pogranicza
polsko-słowackiego. Stud. Reg. Lokalne 2010, 2, 121–131. (In Polish).45. Smallbone, D.; Welter, F.; Xheneti, M. Cross-Border Entrepreneurship and Economic Development in Europe’s
Border; Edward Elgar: Cheltenham, UK; Northampton, MA, USA, 2012.46. The project “Sustainable economic activities”, co-financed by the Operational programme of cross-border
co-operation Czech Republic—Poland 2007–2013. Available online: http://www.egtctritia.eu/pl/projekty/nasze-projekty/zrownowazona-dzialalnosc-gospodarcza (accessed on 21 December 2015).
47. Report doing business, World Bank Group 2015. Available online: http://www.doingbusiness.org/(accessed on 21 December 2015).
48. The project “Strategies for System Cooperation of Public Institutions of Moravian-Silesian Region,the Voivodeship of Silesia and Opole” co-financed by the European Regional Development Fundunder the Operational Programme of Cross-Border Cooperation Czech Republic - Republic of Poland2007–2013. Available online: http://www.slaskie.pl/strona_n.php?jezyk= pl&grupa=9&dzi=1312275679&art=1312275911&id_menu=455 (accessed on 21 December 2015).
49. Szczepanska-Woszczyna, K. Rola edukacji w rozwoju regionu, Polityka gospodarcza gminy (rozwój ZagłebiaDabrowskiego wczoraj i dzis). Zeszyty Naukowe WSB 2001, 2, 149–159. (In Polish)
50. Services platform for cross-border cooperation between Czech and Polish SME. Available online:http://www.cespolgroup.com/pl/ (accessed on 21 December 2015).
51. Platform for cooperation of Polish-Czech societies. Available online: http://www.anotak.info/pl/biznes(accessed on 21 December 2015).
52. Szczepanska-Woszczyna, K. Innovation process in the social space of the organization. Reg. Form. Dev. Stud.2014, 3, 220–229.
160

Sustainability 2016, 8, 230
53. Klimczuk., A.; Klimczuk-Kochanska, M.; Plawgo, B. Współpraca transgraniczna małych i srednichprzedsiebiorstw jako czynnik rozwoju regionalnego na przykładzie podregionu białostocko-suwalskiegoi podregionu krosniensko-przemyskiego w Polsce, obwodu Zakarpackiego na Ukrainie oraz obwodugrodzienskiego na Białorusi. In book Współpraca transgraniczna małych i srednich przedsiebiorstw jako czynnikrozwoju regionalnego; Plawgo, B., Ed.; Białostocka Fundacja Kształcenia Kadr: Białystok, 2015; Availableonline: http://ssrn.com/abstract=2604198 (accessed on 21 December 2015). (In Polish)
54. Kurowska-Pysz, J. Assessment of trends for the development of cross border cultural clusters.Forum Sci. Oecon. 2014, 3, 31–51.
55. Kurowska-Pysz, J. Proces zarzadzania wiedza w klastrach—Kluczowe uwarunkowania. Mark. I Rynek 2015,12, 17–23. (In Polish)
56. Thissen, M.; Oort, F.; Diodato, D.; Ruijs, A. Regional Competitiveness and Smart Specialization in Europe; EdwardElgar Publishing Limited: Cheltenham, UK, 2013.
57. Szultka, S. Klastry w Sektorach Kreatywnych—Motory Rozwoju Miast i Regionów; Polska Agencja RozwojuPrzedsiebiorczosci: Warszawa, Poland, 2012. (In Polish)
© 2016 by the author. Licensee MDPI, Basel, Switzerland. This article is an open accessarticle distributed under the terms and conditions of the Creative Commons Attribution(CC BY) license (http://creativecommons.org/licenses/by/4.0/).
161
sustainability
Article
The Design of a Sustainable Location-Routing-InventoryModel Considering Consumer Environmental Behavior
Jinhuan Tang 1,*, Shoufeng Ji 2 and Liwen Jiang 2
1 School of Economics and Management, Shenyang Aerospace University, Shenyang 110136, China2 School of Business Administration, Northeast University, Shenyang 110169, China;
[email protected] (S.J.); [email protected] (L.J.)* Corresponding: [email protected]; Tel.: +86-151-4016-3732
Academic Editors: Adam Jabłonski and Giuseppe IoppoloReceived: 12 January 2016; Accepted: 19 February 2016; Published: 29 February 2016
Abstract: Our aim is to design a sustainable supply chain (SSC) network, which takes intoconsideration consumer environmental behaviors (CEBs). CEBs not only affect consumers’ demandfor products with low carbon emissions, they also affect their willingness to pay premium prices forproducts with low carbon emissions. We incorporate CEBs into the SSC network model involvinglocation, routing and inventory. Firstly, a multi-objective optimization model comprised of both thecosts and the carbon emissions of a joint location-routing-inventory model is proposed and solved,using a multi-objective particle swarm optimization (MOPSO) algorithm. Then, a revenue functionincluding CEBs is presented on the basis of a Pareto set of the trade-off between costs and carbonemissions. A computational experiment and sensitivity analysis are conducted, employing data fromthe China National Petroleum Corporation (CNPC). The results clearly indicate that our researchcan be applied to actual supply chain operations. In addition, some practical managerial insights forenterprises are offered.
Keywords: sustainable supply chain network; consumer environmental behaviors; location-routing-inventory; MOPSO
1. Introduction
Along with the heightened concerns over the past few decades relating to sustainable supplychains (SSC), governments, enterprises and consumers are becoming increasingly aware of the needto reduce carbon emissions. Governments have introduced a number of regulations, such as carbontaxes, cap-and-trade mechanisms and carbon constraints to mandate carbon emission reductions inSSC management [1]. In addition, a few socially responsible enterprises have engaged in voluntaryemission reduction programs. Companies such as BP and Nike have taken actions to reduce emissionsin order to improve their public image. Wal-Mart and Tesco require their suppliers to reveal theircarbon emissions on product labels, where they can be seen by consumers and society. In addition,consumers with higher levels of environmental consciousness are willing to pay a premium price forlow carbon products [2–5]. The demand for low carbon products has become greater and greater [6–8].It can be safely assumed that low carbon products will become more competitively priced in the future.Clearly, the drive for environmental improvement is increasing.
Traditionally, a supply chain network design problem focuses on minimizing the fixed andoperational costs that companies directly incur. Only recently, however, have some studies startedtaking carbon emissions into account [9–11]. Many studies indicate that there is a trade-off between theenvironment and economics in a supply chain [12–14]. However, it is possible to significantly reduce
Sustainability 2016, 8, 211; doi:10.3390/su8030211 www.mdpi.com/journal/sustainability162
Sustainability 2016, 8, 211
carbon emissions without greatly increasing costs, using proper supply chain operations [15,16]. Ingeneral, there is a paradox between cost and carbon emissions in SSC management.
Companies are never going to reduce their carbon emissions until factors such as cost, profits,brand awareness and consumer pressure are involved. Currently, the main drive for carbon emissionreduction can be classified into two categories. The first is mandatory emission reductions, whichincludes features such as carbon taxes and carbon cap policies [17]. This approach to carbon emissionsis punitive. The alternative method is to encourage enterprises to voluntarily reduce their carbonemissions. This encouragement, in turn, can take the form of two types of motivation. One type isthrough policies such as carbon allowances and cap-and-trade mechanisms. The second type takeson board market considerations. For example, studies have shown that green products have themarketing potential to endow an enterprise with a good public image, which in turn can improve therelevant products’ pricing structure or increase consumer demand [8,18]. Looking further into thefuture, the effects of exploiting the marketing potential of products with low carbon emissions willincrease substantially. Creating a SSC network is both a challenge and an opportunity. Presumably, theinformation already available to society at large has made consumers more environmentally mature,and these mature consumers would like to purchase products with smaller carbon footprints. In thisstudy, we propose the design of a SSC network from a market-driven perspective. Specifically, thepurpose of this study is to optimize the profitability of a company through CEB. We decide on thedesign of the SSC network after considering the number and location of warehouses, the routes frommanufacturers to warehouses and from warehouses to retailers, and the inventory polices of thevarious facilities. Firstly, a multi-objective model is constructed to create a trade-off between costand carbon emissions. Then, a general revenue objective factoring in CEBs is modeled, based on therelationship between cost and carbon emissions. This study allows us to achieve the best of bothworlds, i.e., maximizing the profits of companies, while reducing carbon emissions as much as possible.These achievements also represent the main points of innovation in this paper.
The remainder of the paper is organized as follows: Section 2 reviews the relevant literature.Problem descriptions and assumptions are presented in Section 3. Section 4 describes themulti-objective model that creates the trade-off between cost and carbon emissions, and then constructsthe general revenue objective function taking CEBs into consideration. The approach used as a solutionfor the model is given in Section 5. Results of the computational experiment and a sensitivity analysisare conducted in Section 6; the managerial insights are also illustrated in this section. Finally, ourconclusions are presented in Section 7.
2. Literature Review
A key driver of any supply chain is its distribution network. This network, however, is generallyalso the main source of carbon emissions. The operations of a supply chain network consist ofthree major components, namely location, routing and inventory (LRI). However, most existingliterature integrates only any two of the above, i.e., location-routing problems [19], inventory-routingproblems [20], and location-inventory problems [21], as their target topics. Ahmadi-Javid and Azad [22]presented for the first time a model to simultaneously optimize location, routing and inventorydecisions in a supply chain network. Ahmadi-Javid and Seddighi [23] studied a ternary integrationproblem that incorporated location, routing and inventory decisions in designing a multi-sourcedistribution network. They then solved the model using a three-phase heuristic. On the whole, veryfew researchers have studied the ternary integration LRI problem, and fewer still have incorporatedcarbon emissions into an LRI problem when designing a supply chain network. This is a very importantissue, which has unfortunately been largely ignored.
Numerous studies concentrate on the trade-off between the environment and the economy insupply chain management [12,24]. According to the most recent papers, three types of research havebeen conducted and corresponding suggestions made: (i) Translate carbon emissions into cost byintroducing carbon regulations, such as a carbon tax, cap-and-trade mechanisms, etc. Kroes et al. [25]
163
Sustainability 2016, 8, 211
investigated the relationship between a firm’s environmental performance compliance and theirmarketing success in the context of stringent cap-and-trade regulations. Benjaafar et al. [12] presenteda cost optimization model via translating carbon emissions into unit costs by carbon price. The twostudies proved that there is a close relationship between economic costs and carbon emissions. Similarresearch was conducted by Hua et al. [24], which studied managing carbon footprints in an inventorysystem under a carbon emission trading mechanism. (ii) A mandatory carbon cap is used to reduceemissions. This policy specifically prohibits companies from emitting any carbon emissions in excessof their carbon cap. Diabat et al. [26] proposed a mixed-integer program model with carbon capconstraints when designing a supply chain network. A carbon-constraint economic order quantity(EOQ) model was provided to reduce emissions by properly adjusting order quantities [16]. The effectsof carbon-constraint measures are significant. However, it is relatively difficult to implement suchpolicies, as they are currently unacceptable to many companies. Businesses, which are profit-driven,lack the motivation to participate in this non-profitable activity. (iii) Provide a set of Pareto solutions,which shows the trade-off between cost and carbon emissions. The advantage of this method is that itcan give a set of non-dominated solutions. In addition, the decision makers can choose their preferredconfiguration. Wygonik and Goodchild [27] presented trade-offs between cost, service quality and thecarbon emissions of an urban delivery system. Wang et al. [28] provided a bi-objective optimizationmodel for a green supply chain network design. One of the two objectives was cost minimization;the other was to minimize carbon emissions. The Pareto results showed that the bi-objective modelis an effective tool for solving this kind of problem. However, the terminal decision will be made bymanagers, and thus, personal preferences will inevitably be involved.
The worldwide reduction framework would involve drawing more companies into carbonreduction activities and also into assuming social responsibilities. In order to determine how to makeenterprises voluntarily reduce emissions in the context of an earnings-dominated market, it is firstnecessary to learn how best to improve the potential motivation for corporations to reduce theircarbon emissions. The use of carbon labeling is an effective means to encourage consumers to buyenvironmentally friendly products. There is, however, a definite need to better understand consumers’responses to eco-labels [28]. Consumers’ willingness to pay a premium price for products with lowercarbon emissions has been shown to be increasing [4,29]. Vanclay et al. [30] defined three levels ofcarbon labeling (from low to high) as green, yellow and black. They then found that after labeling, theblack-labeled (highest carbon emission) product sales decreased by six percent, while green-labeledproduct sales increased by four percent, when all other conditions were basically unchanged. Theseresults imply that the potential effectiveness of carbon labels in emission reductions is significant.However, green products usually cost more than conventional products, which in turn makes greengoods more expensive [3].The key issue is whether consumers will be willing to pay a premium pricefor the green goods. If not, governments may have to subsidize producers who manufacture greenproducts [5]. Some studies have shown that the higher the CEBs, the higher the price consumers arewilling to pay for environmentally friendly products [2].
Economic globalization and rapid high-tech development have intensified market competitionto unprecedented levels. New patterns of product competition will emerge over the next few years,and the manufacture of green products as part of that competition is an irresistible trend. Conrad [3]studied the effects of consumer environmental concerns on price, choice of product and market sharein the context of duopoly. Liu et al. [8] proved that, as consumers’ environmental awareness increases,retailers and manufacturers with superior eco-friendly operations will benefit in the long run. A modelconsidering the effect of environmental conscious consumers on firms’ adoption of cleaner technologiesshowed that, as pollution intensifies, consumers play a much more positive role in the companies’environmental activities. The consumers’ attitudes encourage firms to reduce carbon emissions, evenin the absence of emission regulations [7]. However, many studies focus on emission reductionthrough governmental regulations, and rarely through market forces [31]. Actually, consumer response
164
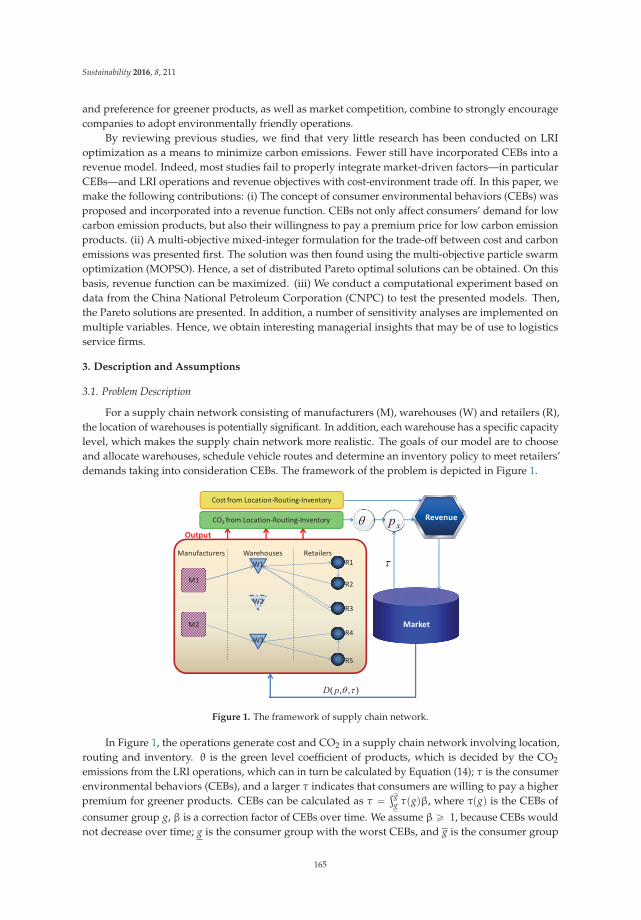
Sustainability 2016, 8, 211
and preference for greener products, as well as market competition, combine to strongly encouragecompanies to adopt environmentally friendly operations.
By reviewing previous studies, we find that very little research has been conducted on LRIoptimization as a means to minimize carbon emissions. Fewer still have incorporated CEBs into arevenue model. Indeed, most studies fail to properly integrate market-driven factors—in particularCEBs—and LRI operations and revenue objectives with cost-environment trade off. In this paper, wemake the following contributions: (i) The concept of consumer environmental behaviors (CEBs) wasproposed and incorporated into a revenue function. CEBs not only affect consumers’ demand for lowcarbon emission products, but also their willingness to pay a premium price for low carbon emissionproducts. (ii) A multi-objective mixed-integer formulation for the trade-off between cost and carbonemissions was presented first. The solution was then found using the multi-objective particle swarmoptimization (MOPSO). Hence, a set of distributed Pareto optimal solutions can be obtained. On thisbasis, revenue function can be maximized. (iii) We conduct a computational experiment based ondata from the China National Petroleum Corporation (CNPC) to test the presented models. Then,the Pareto solutions are presented. In addition, a number of sensitivity analyses are implemented onmultiple variables. Hence, we obtain interesting managerial insights that may be of use to logisticsservice firms.
3. Description and Assumptions
3.1. Problem Description
For a supply chain network consisting of manufacturers (M), warehouses (W) and retailers (R),the location of warehouses is potentially significant. In addition, each warehouse has a specific capacitylevel, which makes the supply chain network more realistic. The goals of our model are to chooseand allocate warehouses, schedule vehicle routes and determine an inventory policy to meet retailers’demands taking into consideration CEBs. The framework of the problem is depicted in Figure 1.
M1
M2
Manufacturers Warehouses RetailersW1
W2
W3
R1
R2
R3
R4
R5
Market
( , , )
Output
CO2 from Location Routing Inventory
Cost from Location Routing Inventory
Revenue
Figure 1. The framework of supply chain network.
In Figure 1, the operations generate cost and CO2 in a supply chain network involving location,routing and inventory. θ is the green level coefficient of products, which is decided by the CO2
emissions from the LRI operations, which can in turn be calculated by Equation (14); τ is the consumerenvironmental behaviors (CEBs), and a larger τ indicates that consumers are willing to pay a higherpremium for greener products. CEBs can be calculated as τ “ şg
g τpgqβ, where τpgq is the CEBs ofconsumer group g, β is a correction factor of CEBs over time. We assume β ě 1, because CEBs wouldnot decrease over time; g is the consumer group with the worst CEBs, and g is the consumer group
165
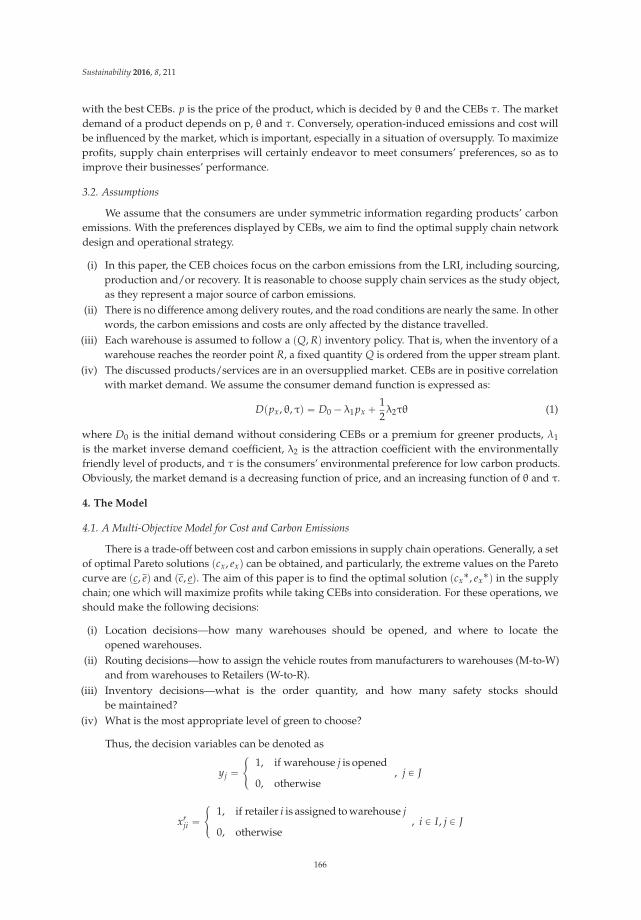
Sustainability 2016, 8, 211
with the best CEBs. p is the price of the product, which is decided by θ and the CEBs τ. The marketdemand of a product depends on p, θ and τ. Conversely, operation-induced emissions and cost willbe influenced by the market, which is important, especially in a situation of oversupply. To maximizeprofits, supply chain enterprises will certainly endeavor to meet consumers’ preferences, so as toimprove their businesses’ performance.
3.2. Assumptions
We assume that the consumers are under symmetric information regarding products’ carbonemissions. With the preferences displayed by CEBs, we aim to find the optimal supply chain networkdesign and operational strategy.
(i) In this paper, the CEB choices focus on the carbon emissions from the LRI, including sourcing,production and/or recovery. It is reasonable to choose supply chain services as the study object,as they represent a major source of carbon emissions.
(ii) There is no difference among delivery routes, and the road conditions are nearly the same. In otherwords, the carbon emissions and costs are only affected by the distance travelled.
(iii) Each warehouse is assumed to follow a pQ, Rq inventory policy. That is, when the inventory of awarehouse reaches the reorder point R, a fixed quantity Q is ordered from the upper stream plant.
(iv) The discussed products/services are in an oversupplied market. CEBs are in positive correlationwith market demand. We assume the consumer demand function is expressed as:
Dppx, θ, τq “ D0 ´ λ1 px ` 12λ2τθ (1)
where D0 is the initial demand without considering CEBs or a premium for greener products, λ1
is the market inverse demand coefficient, λ2 is the attraction coefficient with the environmentallyfriendly level of products, and τ is the consumers’ environmental preference for low carbon products.Obviously, the market demand is a decreasing function of price, and an increasing function of θ and τ.
4. The Model
4.1. A Multi-Objective Model for Cost and Carbon Emissions
There is a trade-off between cost and carbon emissions in supply chain operations. Generally, a setof optimal Pareto solutions pcx, exq can be obtained, and particularly, the extreme values on the Paretocurve are pc, eq and pc, eq. The aim of this paper is to find the optimal solution pcx
˚, ex˚q in the supply
chain; one which will maximize profits while taking CEBs into consideration. For these operations, weshould make the following decisions:
(i) Location decisions—how many warehouses should be opened, and where to locate theopened warehouses.
(ii) Routing decisions—how to assign the vehicle routes from manufacturers to warehouses (M-to-W)and from warehouses to Retailers (W-to-R).
(iii) Inventory decisions—what is the order quantity, and how many safety stocks shouldbe maintained?
(iv) What is the most appropriate level of green to choose?
Thus, the decision variables can be denoted as
yj “#
1, if warehouse j is opened
0, otherwise, j P J
xrji “
#1, if retailer i is assigned to warehouse j
0, otherwise, i P I, j P J
166
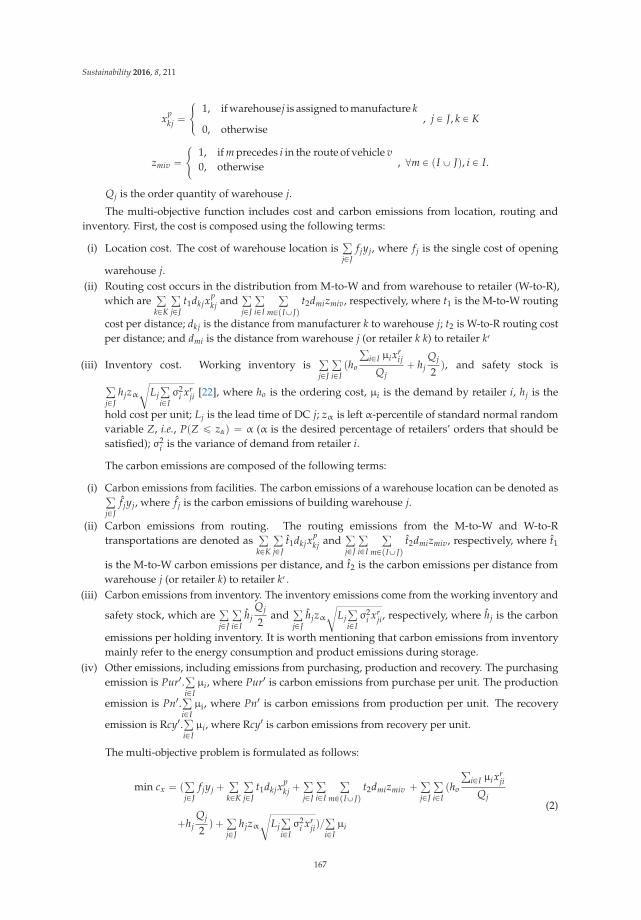
Sustainability 2016, 8, 211
xpkj “
#1, if warehousej is assigned to manufacture k
0, otherwise, j P J, k P K
zmiv “#
1, if m precedes i in the route of vehicle v0, otherwise , @m P pI Y Jq, i P I.
Qj is the order quantity of warehouse j.
The multi-objective function includes cost and carbon emissions from location, routing andinventory. First, the cost is composed using the following terms:
(i) Location cost. The cost of warehouse location isřjPJ
f jyj, where f j is the single cost of opening
warehouse j.(ii) Routing cost occurs in the distribution from M-to-W and from warehouse to retailer (W-to-R),
which areř
kPK
řjPJ
t1dkjxpkj and
řjPJ
řiPI
řmPpIYJq
t2dmizmiv, respectively, where t1 is the M-to-W routing
cost per distance; dkj is the distance from manufacturer k to warehouse j; t2 is W-to-R routing costper distance; and dmi is the distance from warehouse j (or retailer k k) to retailer k1
(iii) Inventory cost. Working inventory isřjPJ
řiPI
pho
řiPI μixr
ij
Qj` hj
Qj
2q, and safety stock is
řjPJ
hjzαc
LjřiPI
σ2i xr
ji [22], where ho is the ordering cost, μi is the demand by retailer i, hj is the
hold cost per unit; Lj is the lead time of DC j; zα is left α-percentile of standard normal randomvariable Z, i.e., PpZ ď zαq “ α (α is the desired percentage of retailers’ orders that should besatisfied); σ2
i is the variance of demand from retailer i.
The carbon emissions are composed of the following terms:
(i) Carbon emissions from facilities. The carbon emissions of a warehouse location can be denoted asřjPJ
f jyj, where f j is the carbon emissions of building warehouse j.
(ii) Carbon emissions from routing. The routing emissions from the M-to-W and W-to-Rtransportations are denoted as
řkPK
řjPJ
t1dkjxpkj and
řjPJ
řiPI
řmPpIYJq
t2dmizmiv, respectively, where t1
is the M-to-W carbon emissions per distance, and t2 is the carbon emissions per distance fromwarehouse j (or retailer k) to retailer k1 .
(iii) Carbon emissions from inventory. The inventory emissions come from the working inventory and
safety stock, which areřjPJ
řiPI
hjQj
2and
řjPJ
hjzαc
LjřiPI
σ2i xr
ji, respectively, where hj is the carbon
emissions per holding inventory. It is worth mentioning that carbon emissions from inventorymainly refer to the energy consumption and product emissions during storage.
(iv) Other emissions, including emissions from purchasing, production and recovery. The purchasingemission is Pur1.ř
iPIμi, where Pur1 is carbon emissions from purchase per unit. The production
emission is Pn1.řiPI
μi, where Pn1 is carbon emissions from production per unit. The recovery
emission is Rcy1.řiPI
μi, where Rcy1 is carbon emissions from recovery per unit.
The multi-objective problem is formulated as follows:
min cx “ přjPJ
f jyj ` řkPK
řjPJ
t1dkjxpkj ` ř
jPJ
řiPI
řmPpIYJq
t2dmizmiv ` řjPJ
řiPI
pho
řiPI μixr
ji
Qj
`hjQj
2q ` ř
jPJhjzα
cLj
řiPI
σ2i xr
jiq{řiPI
μi
(2)
167
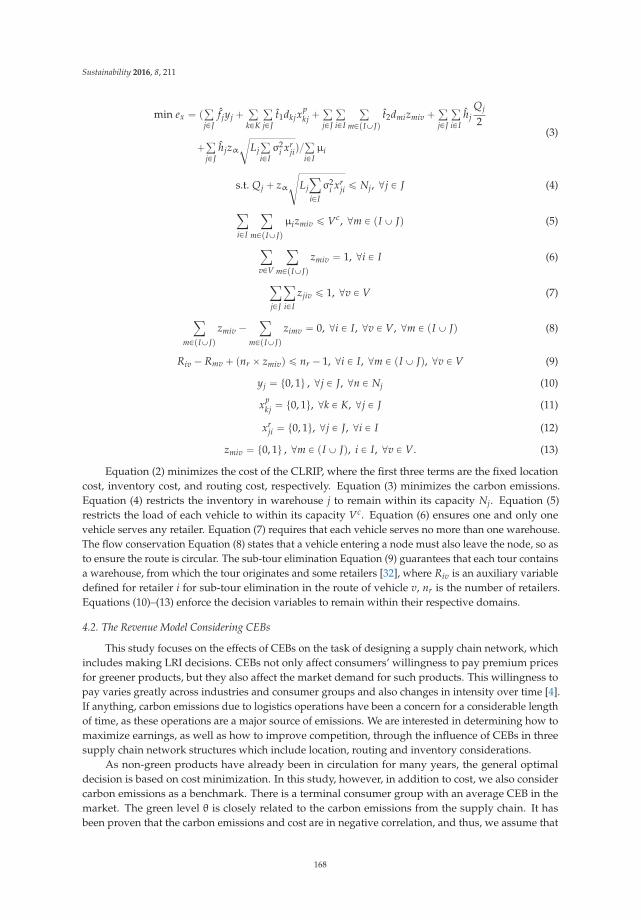
Sustainability 2016, 8, 211
min ex “ přjPJ
f jyj ` řkPK
řjPJ
t1dkjxpkj ` ř
jPJ
řiPI
řmPpIYJq
t2dmizmiv ` řjPJ
řiPI
hjQj
2
`řjPJ
hjzαc
LjřiPI
σ2i xr
jiq{řiPI
μi
(3)
s.t. Qj ` zαd
LjÿiPI
σ2i xr
ji ď Nj, @j P J (4)
ÿiPI
ÿmPpIYJq
μizmiv ď Vc, @m P pI Y Jq (5)
ÿvPV
ÿmPpIYJq
zmiv “ 1, @i P I (6)
ÿjPJ
ÿiPI
zjiv ď 1, @v P V (7)
ÿmPpIYJq
zmiv ´ÿ
mPpIYJqzimv “ 0, @i P I, @v P V, @m P pI Y Jq (8)
Riv ´ Rmv ` pnr ˆ zmivq ď nr ´ 1, @i P I, @m P pI Y Jq, @v P V (9)
yj “ t0, 1u , @j P J, @n P Nj (10)
xpkj “ t0, 1u, @k P K, @j P J (11)
xrji “ t0, 1u, @j P J, @i P I (12)
zmiv “ t0, 1u , @m P pI Y Jq, i P I, @v P V. (13)
Equation (2) minimizes the cost of the CLRIP, where the first three terms are the fixed locationcost, inventory cost, and routing cost, respectively. Equation (3) minimizes the carbon emissions.Equation (4) restricts the inventory in warehouse j to remain within its capacity Nj. Equation (5)restricts the load of each vehicle to within its capacity Vc. Equation (6) ensures one and only onevehicle serves any retailer. Equation (7) requires that each vehicle serves no more than one warehouse.The flow conservation Equation (8) states that a vehicle entering a node must also leave the node, so asto ensure the route is circular. The sub-tour elimination Equation (9) guarantees that each tour containsa warehouse, from which the tour originates and some retailers [32], where Riv is an auxiliary variabledefined for retailer i for sub-tour elimination in the route of vehicle v, nr is the number of retailers.Equations (10)–(13) enforce the decision variables to remain within their respective domains.
4.2. The Revenue Model Considering CEBs
This study focuses on the effects of CEBs on the task of designing a supply chain network, whichincludes making LRI decisions. CEBs not only affect consumers’ willingness to pay premium pricesfor greener products, but they also affect the market demand for such products. This willingness topay varies greatly across industries and consumer groups and also changes in intensity over time [4].If anything, carbon emissions due to logistics operations have been a concern for a considerable lengthof time, as these operations are a major source of emissions. We are interested in determining how tomaximize earnings, as well as how to improve competition, through the influence of CEBs in threesupply chain network structures which include location, routing and inventory considerations.
As non-green products have already been in circulation for many years, the general optimaldecision is based on cost minimization. In this study, however, in addition to cost, we also considercarbon emissions as a benchmark. There is a terminal consumer group with an average CEB in themarket. The green level θ is closely related to the carbon emissions from the supply chain. It hasbeen proven that the carbon emissions and cost are in negative correlation, and thus, we assume that
168
Sustainability 2016, 8, 211
the optimal cost corresponds to a poor performance in relation to carbon emissions, and vice versa.Specifically, with an operation map, we can connect inputs rc, cs to corresponding outputs re, es. Thenθ can be denoted as
θ “ e{ex (14)
where ex is the actual carbon emission, and thus (θ ´ 1) is the carbon abatement ratio. p is the price ofnon-green products, pc, eq represents the cost and carbon emissions, and px is the price with pcx, exq.As we know, the marginal cost of carbon reduction increases by degrees. The “low hanging fruit”effect also indicates that initial basic improvement is easier, but the cleanup is harder. Thus, the abovesituation is considered, and the price of a product with green level θ is
px “ pθ2 (15)
It is worth noting that product price is a quadratic function of θ, since the environmentalimprovement has an increasing marginal cost, and production price is worked out to the costing.The quadratic function is commonly used to describe the cost related to the product’s environmentalimprovement. That is, each additional increment of emissions reduction is more difficult, and hencecostlier to achieve [8]. Also, from the market’s perspective, consumers with CEBs are willing to pay apremium price for green products. The greener the product, the more expensive it will be. In addition,for an advanced green product, too, even a small improvement will result in a significant price increase.This increase is deemed to be reasonable.
The aim is to find an optimal portfolio pcx, exq under this context. The basic profit function can bedefined as ź
“ ppx ´ cx ´ c0qD ´ ε (16)
where constant c0 is the unit cost of raw materials, and ε is other expenditure, which can be ignored inmost cases.
Substituting Equations (1)–(15) into Equation (16), then:ź“ ppθ2 ´ cx ´ c0qpD0 ´ λ1 pθ2 ` 1
2λ2τθq (17)
Based on Equation (17), if there is no CEB, the enterprise loses the motivation to reduce carbonemissions, which is consistent with the traditional model. We assume the traditional model has revenueof ΠC, with the only measure being the cost, and we mark it as model PC. In this condition, θ “ 1,τ “ 0, thus:
ΠC “ pp ´ c ´ c0qpD0 ´ λ1 pq (18)
Enterprises have an incentive to join in carbon reduction practices only when Π ´ Πc ą 0.c0 is the same constant in Π and Πc, and thus can be ignored. Then, enterprises will
participate in carbon emissions when ppθ2 ´ cxqpD0 ´ λ1 pθ2 ` 12λ2τθq ą pp ´ cqpD0 ´ λ1 pq, and thus
cx ă pθ2 ´ pp ´ cqpD0 ´ λ1 pqD0 ´ λ1 pθ2 ` 1
2λ2τθ
. Actually, θ is a function of ex; the relationship between cx and ex is
important, and it will be solved in the next section.
5. Solving Approach
5.1. Particle Swarm Optimization Algorithm
The particle swarm optimization (PSO) algorithm was first proposed by Kennedy andEberhart [32]. It is a population-based optimization technique and is becoming very popular, duemainly to its simplicity of implementation and ability to quickly converge to a reasonably goodsolution [33]. It has been extensively applied to many complex network optimization problems. In thePSO heuristic procedure, a swarm of particles is retained in the search process. Each particle follows
169
Sustainability 2016, 8, 211
a specific trajectory in the search space, and each step of the particle determines a trial solution.Each particle has knowledge of its previous best experience, as well as the best global experienceof the entire swarm. The current best fitness of, i.e., the best solution found so far by particle pis represented by xpbestp , while the global best fitness among all particles is represented by xgbest.The velocity and position of particle p at iteration (time) t in dimension d are represented by vpdptqand xpdptq, respectively. Each particle updates its direction at time t according to Equation (19) in thefollowing [32]:
vpdptq “ ωvpdpt ´ 1q ` c1r1ptqpxpbestpd´ xpdptqq ` c2r2ptqpxgbest ´ xpdptqq (19)
where ω is the inertia influencing the local and global ability of the particle; usually a value between0.2 to 0.6 is recommended; c1 and c2 are cognitive and social learning rates, respectively, and r1ptq andr2ptq are two uniform random numbers such that r1, r2 P r0, 1s.
The position of particle p is then updated according to Equation (20) in the following
xpdptq “ xpdpt ´ 1q ` vpdptq (20)
The update of velocity and the position process is repeated for every dimension and for allparticles in the swarm. Eventually the swarm as a whole, like a flock of birds collectively foraging forfood, is likely to move close to an optimum of the fitness function [33].
5.2. The Hybrid PSO
The multi-objective model contains location and routing assignments involving binarydecisions. Multi-objective programming problems with binary variables cannot be directly processedusing the Multi-objective Particle Swarm Optimization (MOPSO) heuristic procedure. FollowingShankar et al. [33], the velocity of a particle should be modified if xd is binary. The modified velocitycan be updated as:
vpdptq “ vpdpt ´ 1q ` r1ptqpxpbestpd´ xpdpt ´ 1qq ` r2ptqpxgbest ´ xpdpt ´ 1qq (21)
where r1ptq and r2ptq are two random numbers. The position of particle p can be updated as:
xpdptq “$&%
0, If ρpd ă spvpdptqq1, If ρpd ě spvpdptqq
(22)
where ρpd is a uniformly distributed random number such that ρpd P r0, 1s and spvpdptqqis the probability threshold given by spvpdq “ 1
1 ` expp´vpdptqq . In the MOPSO heuristic
procedure, the velocity and positions of the continuous particles are updated according toEquations (19) and (20), respectively, while those of the binary variables are updated accordingto Equations (21) and (22), respectively.
5.3. An Improved Constraint of the MOPSO
In order to improve the ability of the heuristic procedure to search the edges crossing unconnectedparts of the feasible region, and also to obtain global non-dominated solutions, some infeasiblesolutions that are near the feasible solutions are retained in the swarm at the beginning of the searchprocess. A constraint that restricts the infeasibility degree of the constraints is used. At the end of thesolution process, all particles retained in the swarm must be feasible. Any infeasible particles will bedeleted from the external file gradually, throughout the progress of the search process. A dynamicself-adapting process is needed to control the infeasibility degree in the heuristic procedure. In themulti-objective programming model, the �th inequality constraint can be written as g�pxq ď 0 and the�’th equality constraint can be written as h�1 pxq ´ δ “ 0. The infeasibility of a trail solution x can bequantized as follows:
170
Sustainability 2016, 8, 211
Cpxq “ÿ�
maxpg�pxq, 0q `ÿ�1
maxp|h�1 pxq ´ δ| , 0q (23)
In Equation (23), δ is a permissible deviation, such that δ ą 0 and is very small. If x P X, Cpxq “ 0.A dynamic infeasibility threshold ε is used that guarantees the final solutions are all feasible. Thisthreshold is defined as:
ε “#
ε0 ˆ p1 ´ 5t{4Tq, if t ď 0.8T0, if t ą 0.8T
(24)
where ε0 is the initial allowable deviation of all the constraints. Obviously, ε decreases with theincrease in the number of evolutionary generations. In the searching process, the solution x is retainedif Cpxq ď ε; otherwise it is discarded.
5.4. Selecting the Optimal Particles
The solution of the MOPSO optimization problem is different from a single objective optimizationproblem. With a single objective problem, it is easy to know which particles are the personal best(pbest) and global best (gbest). With the MOPSO, however, it is difficult to judge which particles arepbest and gbest, because the particles are often non-dominate solutions. However, it is important topick suitable pbest and gbest particles, since each particle must change its position, as guided by pbestand gbest. Each particle moves toward the non-dominated frontier during the search process [34].
The selection for pbest is relatively simple compared to gbest. A method called Prandom is usedin this study, according to which a single pbest is maintained. Pbest is replaced if a new value < pbest,or else, if the new value is found to be mutually non-dominating with pbest, one of the two is randomlyselected to be the new best [35]. Before the selection for gbest, there are still some works to illustrate.In the MOPSO algorithm, we usually store the non-dominate solutions in archive, and the archive hasa limited capacity. Thus, in order to maintain the archive, the crowding distance should be measuredas a base for reserving or discarding non-dominate solutions. The crowding distance dtij can becalculated as:
dtij “gffe kÿ
l“1
flpXiq ´ flpXjq2 (25)
where flpXq denotes the objective functions in the dimension l. According to Equation (25), thecrowding distance matrix can be indicated as:
DT “
»————–
dt11 dt12 ¨ ¨ ¨ dt1ndt21 dt22 ¨ ¨ ¨ dt2n
......
......
dtn1 dtn2 ¨ ¨ ¨ dtnn
fiffiffiffiffifl (26)
where n is the number of non-dominate solutions in the archive. Set S and A represents the populationswith particles and archive storing, non-dominate solutions. The particles in S can be divided into twotypes. One set (S1) is comprised of particles that are dominated by at least one of the non-dominatesolutions in A. The other set (S2) is comprised of particles that are not dominated by any one solutionin A. S “ S1 Y S2. In the same way, archive A can also be divided into three types. Set A1 is thenon-dominate solutions, which dominate at least one of the particles in S. Set A2 is the non-dominatesolutions which have the same position with the particles in S. Set A3 is comprised of the othernon-dominate solutions. A “ A1 Y A2 Y A3. Figure 2 shows the mapping relations of S and A.
171
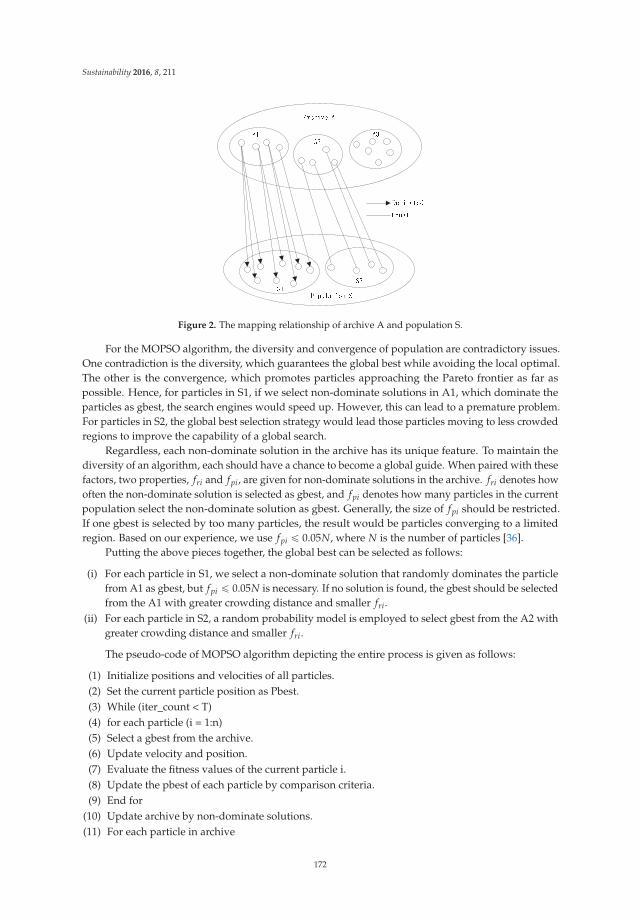
Sustainability 2016, 8, 211
Figure 2. The mapping relationship of archive A and population S.
For the MOPSO algorithm, the diversity and convergence of population are contradictory issues.One contradiction is the diversity, which guarantees the global best while avoiding the local optimal.The other is the convergence, which promotes particles approaching the Pareto frontier as far aspossible. Hence, for particles in S1, if we select non-dominate solutions in A1, which dominate theparticles as gbest, the search engines would speed up. However, this can lead to a premature problem.For particles in S2, the global best selection strategy would lead those particles moving to less crowdedregions to improve the capability of a global search.
Regardless, each non-dominate solution in the archive has its unique feature. To maintain thediversity of an algorithm, each should have a chance to become a global guide. When paired with thesefactors, two properties, fri and fpi, are given for non-dominate solutions in the archive. fri denotes howoften the non-dominate solution is selected as gbest, and fpi denotes how many particles in the currentpopulation select the non-dominate solution as gbest. Generally, the size of fpi should be restricted.If one gbest is selected by too many particles, the result would be particles converging to a limitedregion. Based on our experience, we use fpi ď 0.05N, where N is the number of particles [36].
Putting the above pieces together, the global best can be selected as follows:
(i) For each particle in S1, we select a non-dominate solution that randomly dominates the particlefrom A1 as gbest, but fpi ď 0.05N is necessary. If no solution is found, the gbest should be selectedfrom the A1 with greater crowding distance and smaller fri.
(ii) For each particle in S2, a random probability model is employed to select gbest from the A2 withgreater crowding distance and smaller fri.
The pseudo-code of MOPSO algorithm depicting the entire process is given as follows:
(1) Initialize positions and velocities of all particles.(2) Set the current particle position as Pbest.(3) While (iter_count < T)(4) for each particle (i = 1:n)(5) Select a gbest from the archive.(6) Update velocity and position.(7) Evaluate the fitness values of the current particle i.(8) Update the pbest of each particle by comparison criteria.(9) End for
(10) Update archive by non-dominate solutions.(11) For each particle in archive
172
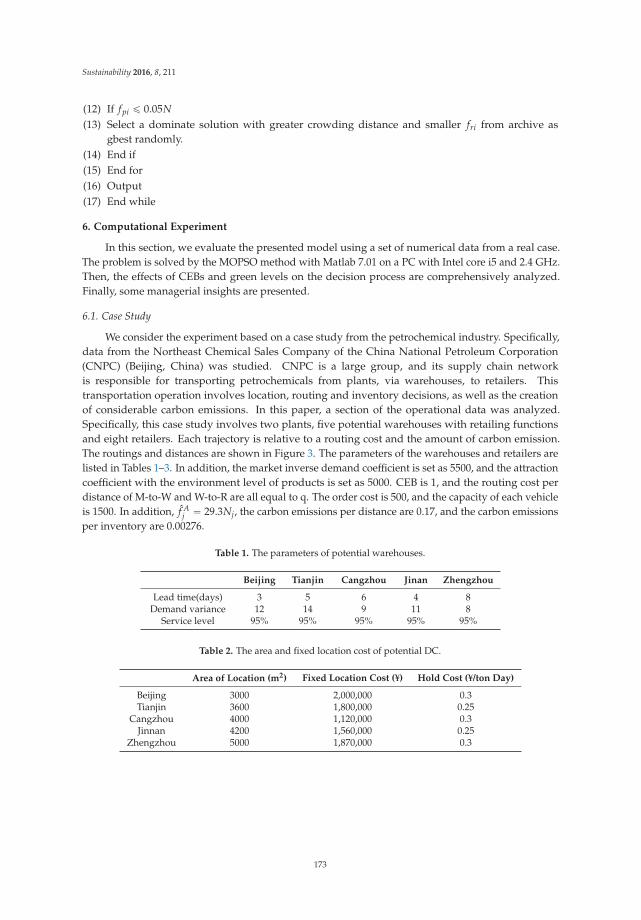
Sustainability 2016, 8, 211
(12) If fpi ď 0.05N(13) Select a dominate solution with greater crowding distance and smaller fri from archive as
gbest randomly.(14) End if(15) End for(16) Output(17) End while
6. Computational Experiment
In this section, we evaluate the presented model using a set of numerical data from a real case.The problem is solved by the MOPSO method with Matlab 7.01 on a PC with Intel core i5 and 2.4 GHz.Then, the effects of CEBs and green levels on the decision process are comprehensively analyzed.Finally, some managerial insights are presented.
6.1. Case Study
We consider the experiment based on a case study from the petrochemical industry. Specifically,data from the Northeast Chemical Sales Company of the China National Petroleum Corporation(CNPC) (Beijing, China) was studied. CNPC is a large group, and its supply chain networkis responsible for transporting petrochemicals from plants, via warehouses, to retailers. Thistransportation operation involves location, routing and inventory decisions, as well as the creationof considerable carbon emissions. In this paper, a section of the operational data was analyzed.Specifically, this case study involves two plants, five potential warehouses with retailing functionsand eight retailers. Each trajectory is relative to a routing cost and the amount of carbon emission.The routings and distances are shown in Figure 3. The parameters of the warehouses and retailers arelisted in Tables 1–3. In addition, the market inverse demand coefficient is set as 5500, and the attractioncoefficient with the environment level of products is set as 5000. CEB is 1, and the routing cost perdistance of M-to-W and W-to-R are all equal to q. The order cost is 500, and the capacity of each vehicleis 1500. In addition, f A
j “ 29.3Nj, the carbon emissions per distance are 0.17, and the carbon emissionsper inventory are 0.00276.
Table 1. The parameters of potential warehouses.
Beijing Tianjin Cangzhou Jinan Zhengzhou
Lead time(days) 3 5 6 4 8Demand variance 12 14 9 11 8
Service level 95% 95% 95% 95% 95%
Table 2. The area and fixed location cost of potential DC.
Area of Location (m2) Fixed Location Cost (¥) Hold Cost (¥/ton Day)
Beijing 3000 2,000,000 0.3Tianjin 3600 1,800,000 0.25
Cangzhou 4000 1,120,000 0.3Jinnan 4200 1,560,000 0.25
Zhengzhou 5000 1,870,000 0.3
173
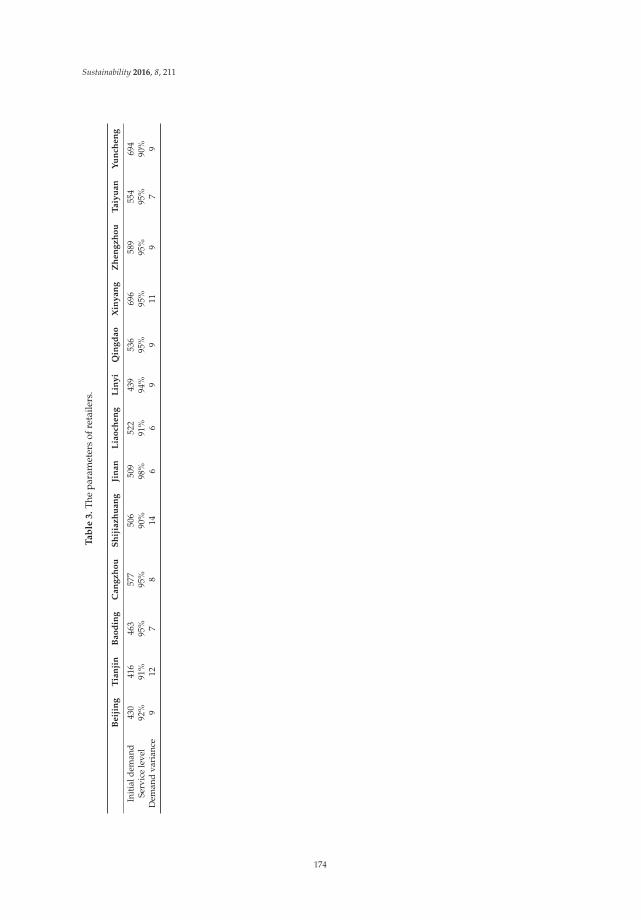
Sustainability 2016, 8, 211
Ta
ble
3.
The
para
met
ers
ofre
taile
rs.
Beij
ing
Tia
nji
nB
ao
din
gC
an
gzh
ou
Sh
ijia
zh
uan
gJi
nan
Lia
och
en
gL
iny
iQ
ing
dao
Xin
yan
gZ
hen
gzh
ou
Taiy
uan
Yu
nch
en
g
Init
iald
eman
d43
041
646
357
750
650
952
243
953
669
658
955
469
4Se
rvic
ele
vel
92%
91%
95%
95%
90%
98%
91%
94%
95%
95%
95%
95%
90%
Dem
and
vari
ance
912
78
146
69
911
97
9
174
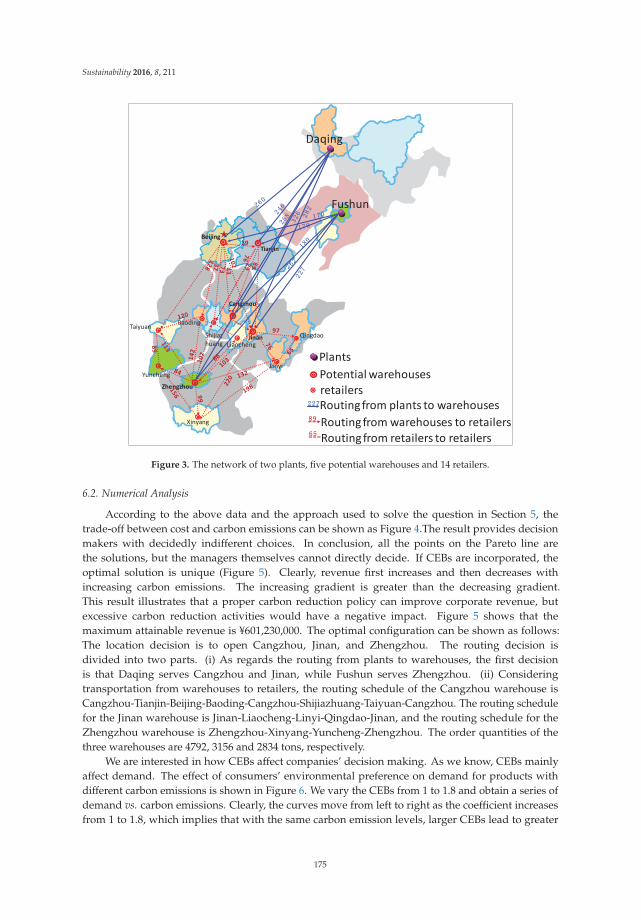
Sustainability 2016, 8, 211
Daqing
Fushun
Qingdao
Xinyang
Zhengzhou
Beijing
Tianjin
Shijiazhuang
Baoding
Cangzhou
JinanLiaocheng
Yuncheng
Taiyuan
29
PlantsPotentialwarehousesretailers
Linyi
Routing from plants to warehousesRouting from warehouses to retailersRouting from retailers to retailers
Figure 3. The network of two plants, five potential warehouses and 14 retailers.
6.2. Numerical Analysis
According to the above data and the approach used to solve the question in Section 5, thetrade-off between cost and carbon emissions can be shown as Figure 4.The result provides decisionmakers with decidedly indifferent choices. In conclusion, all the points on the Pareto line arethe solutions, but the managers themselves cannot directly decide. If CEBs are incorporated, theoptimal solution is unique (Figure 5). Clearly, revenue first increases and then decreases withincreasing carbon emissions. The increasing gradient is greater than the decreasing gradient.This result illustrates that a proper carbon reduction policy can improve corporate revenue, butexcessive carbon reduction activities would have a negative impact. Figure 5 shows that themaximum attainable revenue is ¥601,230,000. The optimal configuration can be shown as follows:The location decision is to open Cangzhou, Jinan, and Zhengzhou. The routing decision isdivided into two parts. (i) As regards the routing from plants to warehouses, the first decisionis that Daqing serves Cangzhou and Jinan, while Fushun serves Zhengzhou. (ii) Consideringtransportation from warehouses to retailers, the routing schedule of the Cangzhou warehouse isCangzhou-Tianjin-Beijing-Baoding-Cangzhou-Shijiazhuang-Taiyuan-Cangzhou. The routing schedulefor the Jinan warehouse is Jinan-Liaocheng-Linyi-Qingdao-Jinan, and the routing schedule for theZhengzhou warehouse is Zhengzhou-Xinyang-Yuncheng-Zhengzhou. The order quantities of thethree warehouses are 4792, 3156 and 2834 tons, respectively.
We are interested in how CEBs affect companies’ decision making. As we know, CEBs mainlyaffect demand. The effect of consumers’ environmental preference on demand for products withdifferent carbon emissions is shown in Figure 6. We vary the CEBs from 1 to 1.8 and obtain a series ofdemand vs. carbon emissions. Clearly, the curves move from left to right as the coefficient increasesfrom 1 to 1.8, which implies that with the same carbon emission levels, larger CEBs lead to greater
175
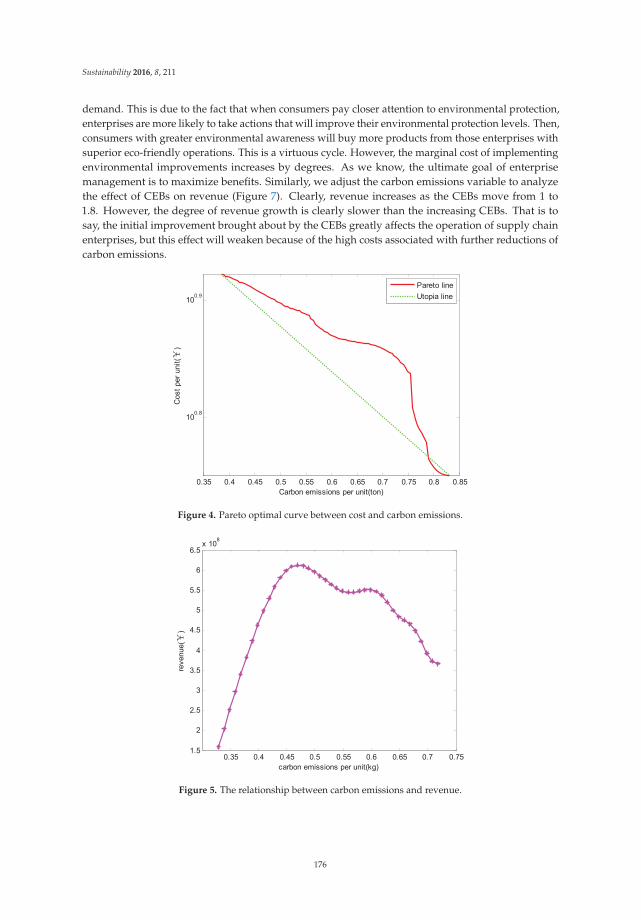
Sustainability 2016, 8, 211
demand. This is due to the fact that when consumers pay closer attention to environmental protection,enterprises are more likely to take actions that will improve their environmental protection levels. Then,consumers with greater environmental awareness will buy more products from those enterprises withsuperior eco-friendly operations. This is a virtuous cycle. However, the marginal cost of implementingenvironmental improvements increases by degrees. As we know, the ultimate goal of enterprisemanagement is to maximize benefits. Similarly, we adjust the carbon emissions variable to analyzethe effect of CEBs on revenue (Figure 7). Clearly, revenue increases as the CEBs move from 1 to1.8. However, the degree of revenue growth is clearly slower than the increasing CEBs. That is tosay, the initial improvement brought about by the CEBs greatly affects the operation of supply chainenterprises, but this effect will weaken because of the high costs associated with further reductions ofcarbon emissions.
Figure 4. Pareto optimal curve between cost and carbon emissions.
Figure 5. The relationship between carbon emissions and revenue.
176
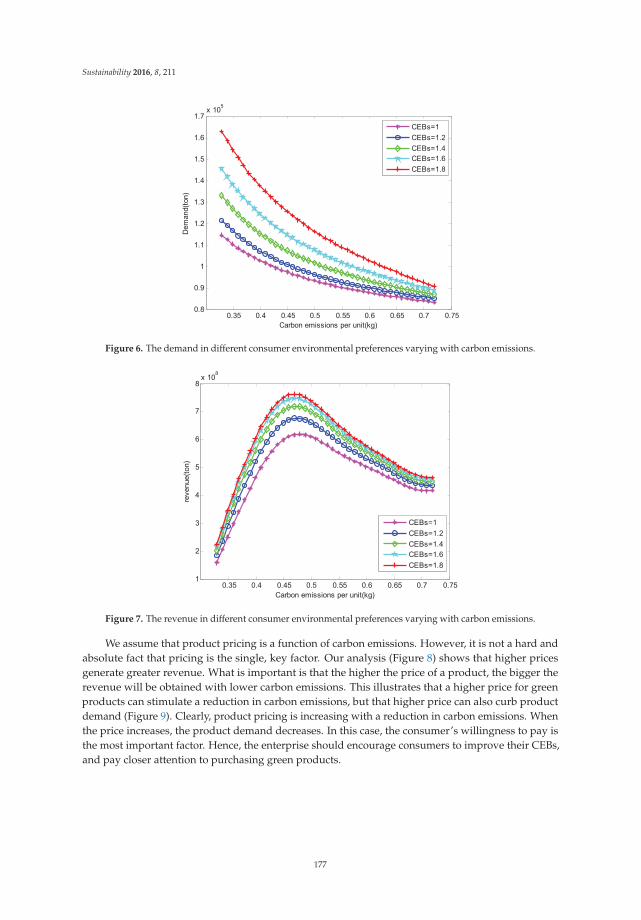
Sustainability 2016, 8, 211
Figure 6. The demand in different consumer environmental preferences varying with carbon emissions.
Figure 7. The revenue in different consumer environmental preferences varying with carbon emissions.
We assume that product pricing is a function of carbon emissions. However, it is not a hard andabsolute fact that pricing is the single, key factor. Our analysis (Figure 8) shows that higher pricesgenerate greater revenue. What is important is that the higher the price of a product, the bigger therevenue will be obtained with lower carbon emissions. This illustrates that a higher price for greenproducts can stimulate a reduction in carbon emissions, but that higher price can also curb productdemand (Figure 9). Clearly, product pricing is increasing with a reduction in carbon emissions. Whenthe price increases, the product demand decreases. In this case, the consumer’s willingness to pay isthe most important factor. Hence, the enterprise should encourage consumers to improve their CEBs,and pay closer attention to purchasing green products.
177
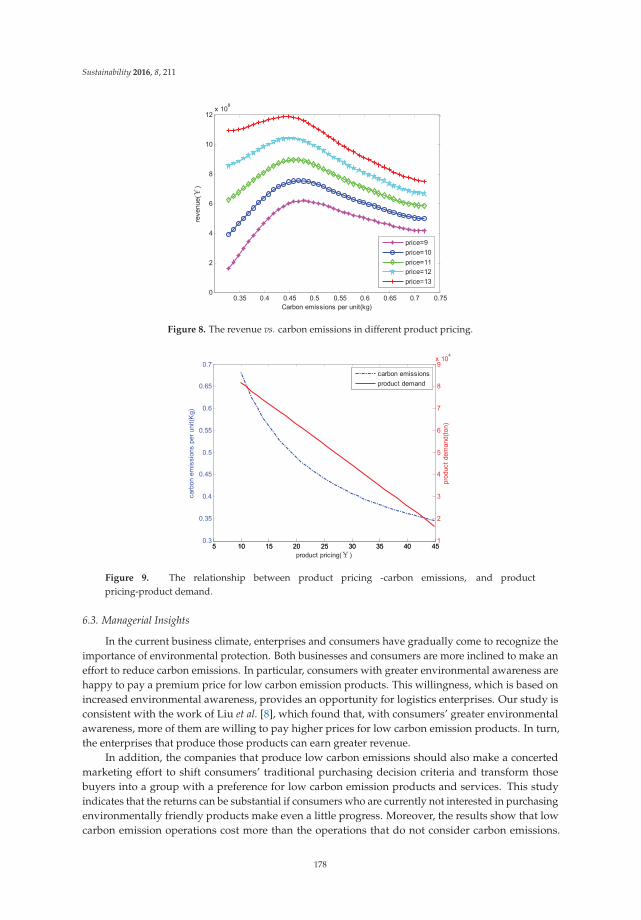
Sustainability 2016, 8, 211
Figure 8. The revenue vs. carbon emissions in different product pricing.
Figure 9. The relationship between product pricing -carbon emissions, and productpricing-product demand.
6.3. Managerial Insights
In the current business climate, enterprises and consumers have gradually come to recognize theimportance of environmental protection. Both businesses and consumers are more inclined to make aneffort to reduce carbon emissions. In particular, consumers with greater environmental awareness arehappy to pay a premium price for low carbon emission products. This willingness, which is based onincreased environmental awareness, provides an opportunity for logistics enterprises. Our study isconsistent with the work of Liu et al. [8], which found that, with consumers’ greater environmentalawareness, more of them are willing to pay higher prices for low carbon emission products. In turn,the enterprises that produce those products can earn greater revenue.
In addition, the companies that produce low carbon emissions should also make a concertedmarketing effort to shift consumers’ traditional purchasing decision criteria and transform thosebuyers into a group with a preference for low carbon emission products and services. This studyindicates that the returns can be substantial if consumers who are currently not interested in purchasingenvironmentally friendly products make even a little progress. Moreover, the results show that lowcarbon emission operations cost more than the operations that do not consider carbon emissions.
178
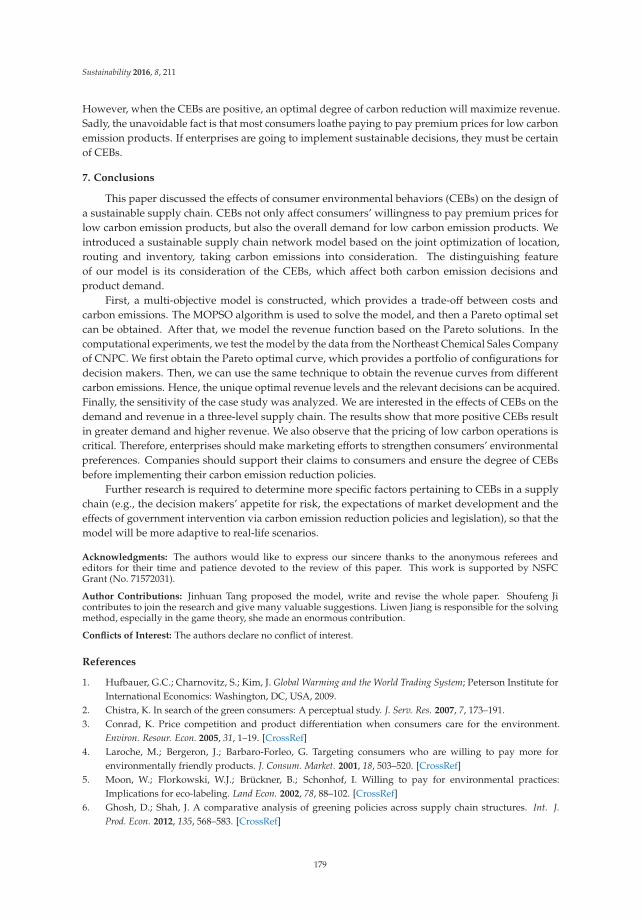
Sustainability 2016, 8, 211
However, when the CEBs are positive, an optimal degree of carbon reduction will maximize revenue.Sadly, the unavoidable fact is that most consumers loathe paying to pay premium prices for low carbonemission products. If enterprises are going to implement sustainable decisions, they must be certainof CEBs.
7. Conclusions
This paper discussed the effects of consumer environmental behaviors (CEBs) on the design ofa sustainable supply chain. CEBs not only affect consumers’ willingness to pay premium prices forlow carbon emission products, but also the overall demand for low carbon emission products. Weintroduced a sustainable supply chain network model based on the joint optimization of location,routing and inventory, taking carbon emissions into consideration. The distinguishing featureof our model is its consideration of the CEBs, which affect both carbon emission decisions andproduct demand.
First, a multi-objective model is constructed, which provides a trade-off between costs andcarbon emissions. The MOPSO algorithm is used to solve the model, and then a Pareto optimal setcan be obtained. After that, we model the revenue function based on the Pareto solutions. In thecomputational experiments, we test the model by the data from the Northeast Chemical Sales Companyof CNPC. We first obtain the Pareto optimal curve, which provides a portfolio of configurations fordecision makers. Then, we can use the same technique to obtain the revenue curves from differentcarbon emissions. Hence, the unique optimal revenue levels and the relevant decisions can be acquired.Finally, the sensitivity of the case study was analyzed. We are interested in the effects of CEBs on thedemand and revenue in a three-level supply chain. The results show that more positive CEBs resultin greater demand and higher revenue. We also observe that the pricing of low carbon operations iscritical. Therefore, enterprises should make marketing efforts to strengthen consumers’ environmentalpreferences. Companies should support their claims to consumers and ensure the degree of CEBsbefore implementing their carbon emission reduction policies.
Further research is required to determine more specific factors pertaining to CEBs in a supplychain (e.g., the decision makers’ appetite for risk, the expectations of market development and theeffects of government intervention via carbon emission reduction policies and legislation), so that themodel will be more adaptive to real-life scenarios.
Acknowledgments: The authors would like to express our sincere thanks to the anonymous referees andeditors for their time and patience devoted to the review of this paper. This work is supported by NSFCGrant (No. 71572031).
Author Contributions: Jinhuan Tang proposed the model, write and revise the whole paper. Shoufeng Jicontributes to join the research and give many valuable suggestions. Liwen Jiang is responsible for the solvingmethod, especially in the game theory, she made an enormous contribution.
Conflicts of Interest: The authors declare no conflict of interest.
References
1. Hufbauer, G.C.; Charnovitz, S.; Kim, J. Global Warming and the World Trading System; Peterson Institute forInternational Economics: Washington, DC, USA, 2009.
2. Chistra, K. In search of the green consumers: A perceptual study. J. Serv. Res. 2007, 7, 173–191.3. Conrad, K. Price competition and product differentiation when consumers care for the environment.
Environ. Resour. Econ. 2005, 31, 1–19. [CrossRef]4. Laroche, M.; Bergeron, J.; Barbaro-Forleo, G. Targeting consumers who are willing to pay more for
environmentally friendly products. J. Consum. Market. 2001, 18, 503–520. [CrossRef]5. Moon, W.; Florkowski, W.J.; Brückner, B.; Schonhof, I. Willing to pay for environmental practices:
Implications for eco-labeling. Land Econ. 2002, 78, 88–102. [CrossRef]6. Ghosh, D.; Shah, J. A comparative analysis of greening policies across supply chain structures. Int. J.
Prod. Econ. 2012, 135, 568–583. [CrossRef]
179
Sustainability 2016, 8, 211
7. Gil-Moltó, M.J.; Varvarigos, D. Emission taxes and the adoption of cleaner technologies: The case ofenvironmentally conscious consumers. Resour. Energy Econ. 2013, 35, 486–504. [CrossRef]
8. Liu, Z.L.; Anderson, T.D.; Cruz, J.M. Consumer environmental awareness and competition in two-stagesupply chains. Eur. J. Oper. Res. 2012, 218, 602–613. [CrossRef]
9. Elhedhli, S.; Merrick, R. Green supply chain network design to reduce carbon emissions. Transp. Res. Part D2012, 17, 370–379. [CrossRef]
10. Paksoy, T.; Özceylan, E.; Weber, G.W.; Barsoum, N.; Weber, G.W.; Vasant, P. A multi objective model foroptimization of a green supply chain network. Glob. J. Technol. Optim. 2011, 2, 84–96.
11. Paksoy, T.; Özceylan, E. Environmentally conscious optimization of supply chain networks. J. Oper. Res. Soc.2013, 65, 855–872. [CrossRef]
12. Benjaafar, S.; Li, Y.; Daskin, M. Carbon footprint and the management of supply chains: Insights from simplemodels. IEEE Trans. Autom. Sci. Eng. 2013, 10, 99–115. [CrossRef]
13. Kim, N.S.; Janic, M.; Van Wee, B. Trade-off between carbon dioxide emissions and logistics costs based onmultiobjective optimization. Transp. Res. Rec. J. Transp. Res. Board 2009, 2139, 107–116. [CrossRef]
14. Wang, F.; Lai, X.F.; Shi, N. A multi-objective optimization for green supply chain network design.Decis. Support Syst. 2011, 51, 262–269. [CrossRef]
15. Chaabane, A.; Ramudhin, A.; Paquet, M. Design of sustainable supply chains under the emission tradingscheme. Int. J. Prod. Econ. 2012, 135, 37–49. [CrossRef]
16. Chen, X.; Benjaafar, S.; Elomri, A. The carbon-constrained EOQ. Oper. Res. Lett. 2013, 41, 172–179. [CrossRef]17. Babiker, M.H.; Criqui, P.; Ellerman, A.D.; Reilly, J.M.; Viguier, L.L. Assessing the impact of carbon tax
differentiation in the European Union. Environ. Model. Assess. 2003, 8, 187–197. [CrossRef]18. Jabali, O.; Woensel, T.V.; de Kok, A.G. Analysis of Travel Times and CO2 Emissions in Time-Dependent
Vehicle Routing. Prod. Oper. Manag. 2012, 21, 1060–1074. [CrossRef]19. Nagy, G.; Salhi, S. Location-routing: Issues, models and methods. Eur. J. Oper. Res. 2007, 177, 649–672.
[CrossRef]20. Dror, M.; Ball, M. Inventory/routing: Reduction from an annual to a short-period problem. Naval Res.
Logist. (NRL) 1987, 34, 891–905. [CrossRef]21. Shen, Z.J.M.; Coullard, C.; Daskin, M.S. A joint location-inventory model. Transp. Sci. 2003, 37, 40–55.
[CrossRef]22. AhmadiJavid, A.; Azad, N. Incorporating location, routing and inventory decisions in supply chain network
design. Transp. Res. Part E Logist. Transp. Rev. 2010, 46, 582–597. [CrossRef]23. Ahmadi-Javid, A.; Seddighi, A.H. A location-routing-inventory model for designing multisource distribution
networks. Eng. Optim. 2012, 44, 637–656. [CrossRef]24. Hua, G.W.; Cheng, T.C.E.; Wang, S.Y. Managing carbon footprints in inventory management. Int. J. Prod. Econ.
2011, 132, 178–185. [CrossRef]25. Kroes, J.; Subramanian, R.; Subramanyam, R. Operational compliance levers, environmental performance,
and firm performance under cap and trade regulation. Manuf. Serv. Oper. Manag. 2012, 14, 186–201.[CrossRef]
26. Diabat, A.; David, S. A Carbon-Capped Supply Chain Network Problem. In Proceedings of the IEEEInternational Conference on Industrial Engineering and Engineering Management, Hong Kong, China, 8–11December 2009; IEEE press: Piscataway, NJ, USA, 2010; pp. 523–527.
27. Wygonik, E.; GooDChild, A. Evaluating CO2 emissions, cost and service quality trade-offs in an urbandelivery system case study. IATSS Res. 2011, 35, 7–15. [CrossRef]
28. Thøgersen, J. Promoting Green Consumer Behavior with Eco-Labels. In New Tools for Environmental Protection:Education, Information, and Voluntary Measures; Dietz, T., Stern, P., Eds.; National Academy Press: Washington,DC, USA, 2002; pp. 83–104.
29. Young, W.; Hwang, K.; McDonald, S.; Oates, C.J. Sustainable consumption: Green consumer behaviourwhen purchasing products. Sustain. Dev. 2010, 18, 20–31. [CrossRef]
30. Vanclay, J.K.; Shortiss, J.; Aulsebrook, A.; Gillespie, A.M.; Howell, B.C.; Johanni, R.; Maher, M.J.; Mitchell, K.M.Customer response to carbon labeling of groceries. J. Consum. Policy 2011, 34, 153–160. [CrossRef]
31. Tang, C.S.; Zhou, S. Research advances in environmentally and socially sustainable operations. Eur. J.Oper. Res. 2012, 223, 585–594. [CrossRef]
180

Sustainability 2016, 8, 211
32. Desrochers, M.; Laporte, G. Improvements and extensions to the Miller-Tucker-Zemlin subtour eliminationconstraints. Oper. Res. Lett. 1991, 10, 27–36. [CrossRef]
33. Kennedy, J.; Eberhart, R. Particle swarm optimization. In Proceedings of the IEEE International Conferenceon Neural Networks, Perth, Australia, 27 November–1 December 1995; pp. 1942–1948.
34. Shankar, B.L.; Basavarajappa, S.; Chen, J.C.; Kadadevaramath, R.S. Location and allocation decisions formulti-echelon supply chain network–a multi-objective evolutionary approach. Expert Syst. Appl. 2013, 40,551–562. [CrossRef]
35. Everson, R.M.; Fieldsend, J.E.; Singh, S. Full Elite Sets for Multi-Objective Optimisation. In AdaptiveComputing in Design and Manufacture V; Springer: London, UK, 2002; pp. 343–354.
36. Ling, H.F.; Zhou, X.Z.; Jiang, X.L.; Xiao, Y.H. Improved constrained multi-objective particle optimizationalgorithm. J. Comput. Appl. 2012, 32, 1320–1324.
© 2016 by the authors. Licensee MDPI, Basel, Switzerland. This article is an open accessarticle distributed under the terms and conditions of the Creative Commons Attribution(CC BY) license (http://creativecommons.org/licenses/by/4.0/).
181
sustainability
Article
Scalability of Sustainable Business Models inHybrid Organizations
Adam Jabłonski
The Department of Management, the University of Dabrowa Górnicza (Wyzsza Szkoła Biznesu w DabrowieGórniczej), Zygmunta Cieplaka Str. 1c, Dabrowa Górnicza 41-300, Poland; [email protected];Tel.: +48-32-262-2805
Academic Editor: Giuseppe IoppoloReceived: 21 October 2015; Accepted: 17 February 2016; Published: 23 February 2016
Abstract: The dynamics of change in modern business create new mechanisms for companymanagement to determine their pursuit and the achievement of their high performance.This performance maintained over a long period of time becomes a source of ensuring businesscontinuity by companies. An ontological being enabling the adoption of such assumptions is sucha business model that has the ability to generate results in every possible market situation and,moreover, it has the features of permanent adaptability. A feature that describes the adaptability ofthe business model is its scalability. Being a factor ensuring more work and more efficient work withan increasing number of components, scalability can be applied to the concept of business models asthe company’s ability to maintain similar or higher performance through it. Ensuring the company’sperformance in the long term helps to build the so-called sustainable business model that oftenbalances the objectives of stakeholders and shareholders, and that is created by the implementedprinciples of value-based management and corporate social responsibility. This perception of businesspaves the way for building hybrid organizations that integrate business activities with pro-socialones. The combination of an approach typical of hybrid organizations in designing and implementingsustainable business models pursuant to the scalability criterion seems interesting from the cognitivepoint of view. Today, hybrid organizations are great spaces for building effective and efficientmechanisms for dialogue between business and society. This requires the appropriate business model.The purpose of the paper is to present the conceptualization and operationalization of scalability ofsustainable business models that determine the performance of a hybrid organization in the networkenvironment. The paper presents the original concept of applying scalability in sustainable businessmodels with detailed interpretation. The paper and its findings are based on longitudinal researchwith participant observation, bibliographic research and the author’s own experience in the processesof building and implementing business models in the years 2005–2015. At the time, the authorobserved the conceptualization and operationalization of several business models of companiesoperating in the Polish market.
Keywords: scalability; sustainability; business models; hybrid organisations; network environment
1. Introduction
The dynamics of change in modern business create new mechanisms for company management todetermine their pursuit and achievement of their high performance. This performance maintained overa long period of time becomes a source of ensuring business continuity by companies. An ontologicalbeing enabling the adoption of such assumptions is such a business model that has the ability togenerate results in every possible market situation and, moreover, it has the features of permanentadaptability. A feature that describes the adaptability of the business model is its scalability. Being
Sustainability 2016, 8, 194; doi:10.3390/su8030194 www.mdpi.com/journal/sustainability182
Sustainability 2016, 8, 194
a factor ensuring more work and more efficient work with an increasing number of components,scalability can be applied to the concept of business models as the company’s ability to maintainsimilar or higher efficiency through it. Ensuring the company’s performance in the long term helpsto build the so-called sustainable business model that often balances the objectives of stakeholdersand shareholders, and that is created by the implemented principles of value-based managementand corporate social responsibility. This perception of business paves the way for building hybridorganizations that integrate business activities with pro-social ones. The combination of an approachtypical of hybrid organizations in designing and implementing sustainable business models pursuantto the scalability criterion seems interesting from the cognitive point of view. Today, hybridorganizations are great spaces for building effective and efficient mechanisms for dialogue betweenbusiness and society. This requires the appropriate business model. The purpose of the paper is topresent the conceptualization and operationalization of scalability of sustainable business models thatdetermine the performance of a hybrid organization in the network environment. The paper presentsthe original concept of applying scalability in sustainable business models with detailed interpretation.
2. The Methodology of Research
The research phases focus on the following issues:
(a) the review of the relevant literature and its analysis covering domestic and foreign references aswell as Internet sources,
(b) the practical analysis of research and its multidimensional synthesis aimed at scientific inference,including preliminary research and the main research,
(c) the development of a six-phase research model,(d) the implementation of the analysis and inference process, completed with the development of
a holistic sustainable business model in building the long-term value of a socially responsiblecompany with a reduced character, possible for use in the further development of the theory ofmanagement science and applicable in the practice of modern business by company managers.
They are used to answer the following questions: Which strategic factors and their relationshipsin the adopted business models have the greatest impact on building the long-term value of a sociallyresponsible company? What should the structure of such a business model be?
Research is expected to result in a sustainable business model becoming a source of building thelong-term value of a socially responsible company.
In order to achieve the objective of the book and the defined objectives of the research, differentresearch methods have been used after in-depth analysis, including both analysis and synthesis ofprimary and secondary data, including:
(1) Longitudinal research with participant observation conducted in the period of 2005 to 2015, whenthe author observed, in a continuous system, several business models of companies operating inthe Polish market. These companies represented various sectors of the economy. However, itwas important that these companies had a formal or semi-formal business model that could beassessed and verified.
(2) Bibliographic research—the literature studies on the evaluation of management in theoryand practice: the concept of Network Environment, the concept of CSR (Corporate SocialResponsibility), the concept of Value-Based Management, the concept of Shareholders andthe concept of Stakeholders, the concept of Business Models, and the concept of BusinessSustainability and Business Scalability.
(3) The experience of the author resulting from his long managerial, research and teaching work inthe area of management theory and practice.
(4) Extended interviews revealing the specific character of the functioning of companies in today’smarket economy.
183
Sustainability 2016, 8, 194
According to J.R. Kimberly [1] (p. 329), longitudinal organizational research consists ofthose techniques, methodologies, and activities which permit the observation, description, and/orclassification of organizational phenomena in such a way that processes can be identified andempirically documented. Longitudinal research essentially investigates processes across multipletime periods. Since the time duration between data collection efforts is defined by the researcher andby the unit under investigation, the length of a longitudinal study and number of data collectionperiods vary across designs. Longitudinal designs vary along six parameters: length of study; durationbetween data collection efforts; number of data collection periods; method of data collection; researchobjectives; and unit of analysis [2]. Janson (1981) suggests two broad classes of longitudinal research,(1) correlative longitudinal research (including studies of both normal representative populationsand non-representative populations); and (2) experimental manipulative research [3]. Longitudinalresearch is associated with the implementation of repeatable measurements of the same individualsor population over a long time, meaning a period of time that enables the detection of changes.Longitudinal research is often called prospective research. In longitudinal research, the author studiedthe cause and effect relationships occurring in the conceptualization and operationalization of theobserved business models. The cause and effect relationships were mainly related to the attributes(components) of business models of the surveyed companies. The author studied and identifiedevents important to the development of the processes of change and the development of companybusiness models and their attributes to understand and explain the processes of business modelconfiguration changes. The reflections contained in the paper are based, among others, on the author’sown observations of the actual business models in business practice. They can therefore be used as abenchmark for the management mechanisms used by managers in the design and operationalizationof sustainable business models of companies.
Bibliographic research involved a multidimensional review of the literature. Conductingbibliographic research, the author followed the assumptions defined by Z. Jourdan, R. Kelly Rainer,and T.E. Marshall [4].
The structure of bibliographic review and the framework of theoretical development followed theassumptions of M. Massaro, J. Dumay, J. Guthrie and included the following steps:
(1) Writing a literature review protocol.(2) Defining the questions that the literature review is setting out to answer.(3) Determining the type of studies and carrying out a comprehensive literature search.(4) Measuring article impact.(5) Defining an analytical framework.(6) Establishing literature review reliability.(7) Testing literature review validity.(8) Coding data using the developed framework.(9) Developing insights and critique through analyzing the dataset.
(10) Developing future research paths and questions [5].
The above methodological assumptions were necessary to effectively present the scientificargument of the author.
The assumptions of the literature review included, inter alia, defining actual economic mechanismsoccurring in the macroeconomic, sectoral and microeconomic dimensions.
Due to this fact, this issue addressed according to the adopted methodology is particularlyimportant in terms of the following assumptions describing actual economic mechanisms occurring inthe macroeconomic, sectoral and microeconomic dimensions. Furthermore, an important factor in thedevelopment of this issue is the fact that two parallel streams of building sustainable business modelsdevelop. One concerns the creation of entities developing according to the sustainability business trendand the other one concerns the trend of building social organizations including non-profit entities.
184
Sustainability 2016, 8, 194
In this context, economic entities aiming to make a profit try to balance their goals, processesand actions to maintain dynamic, strategic balance with reasonable profit and the other entitiesare determined to offer social services that follow the sustainability business principles. From thisperspective, the following macroeconomic, sector and microeconomic assumptions determine thecurrent dimension of the business.
Macroeconomic assumptions [6]:In the situation of the global economic crisis and increased public awareness of the quality of life,
professed values have changed significantlySocial inequality in the world results in waves of discontent and conflict.
(1) Access to knowledge, information and goods is very easy. The only limitation is money.(2) Free movement of goods and services enables the migration of people in search of a better quality
of life. This results in the intercultural and ideological exchange of the population.(3) The aging of European society and the stronger role of Asian countries are changing views on
the functions of companies in the economy.(4) The global ecosystem of the world has a significant impact on the economic sub-systems of
individual continents, regions and countries.(5) The current world is the world of communication via the Internet and a network society.(6) Civilization changes are creating new needs and conditions of business(7) The network environment is a key business environment.(8) Virtualization determines the development of contemporary business.(9) Market mechanisms are global and unpredictable.
(10) Access to information, knowledge and many resources is simple and universal.
Sector assumptions [7–10]:
(1) The place and role of sectors and sectoral conditions in the economy are dramatically changing.(2) In many cases, sectors are blurred and fragmented; they overlap, merge or are eliminated.(3) Socially unacceptable economic sectors are supplanted by high technology sectors, and industrial
sectors are turned into service sectors.(4) Regions compete with each other and their value is built for society. As a consequence, local
decision-making systems create a need for the emergence of new economy sectors.(5) Classic sector analyses do not fulfill their role, because the life cycles of sectors become shorter
and also because of the dynamics and unpredictability of the expectations that society has.
Microeconomic assumptions [11–19]:
(1) Currently, a company is not perceived only as a financial instrument, but as a source of socialcapital as well.
(2) A company becomes a tool for redistribution of value for its stakeholders.(3) Autocratic management methods based on bloodthirsty maximization of value for shareholders
are not accepted in many cases, both in companies and in society.(4) A company plays an educational, cultural and economic role for the whole society.(5) A company becomes a factor in population migration towards prosperity and better quality
of life.(6) A company becomes a source of permanent innovation. Without innovative products, processes
and management methods, companies are not able to survive in the market.(7) Mechanisms based on the symbiosis of many conflicting interest groups and their synergies
towards ensuring business continuity determine the new areas of decision-making systems.(8) Due to the uncertainty of the company towards individuals, mechanisms based on a system
approach to management are playing a stronger role. Only tight management systems can
185
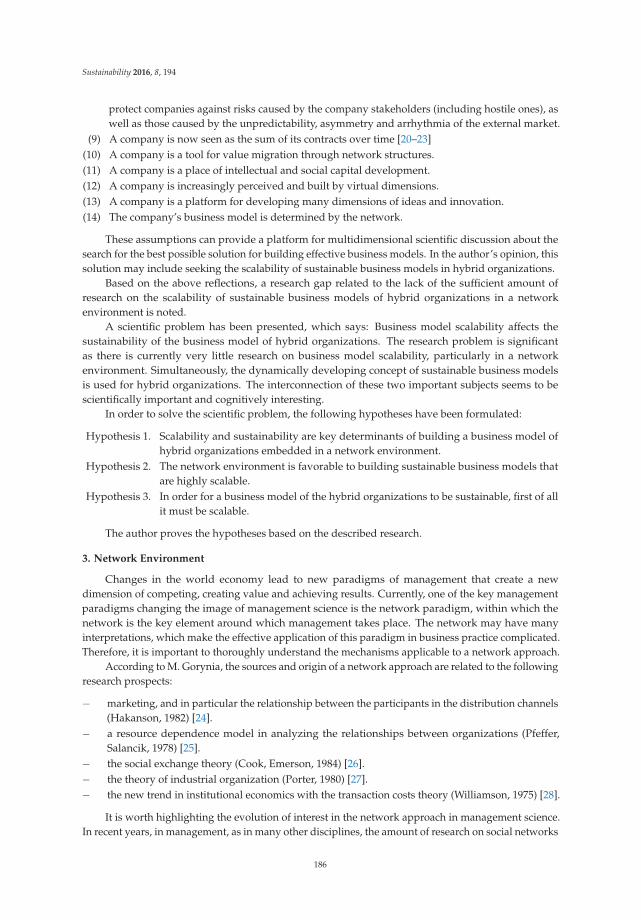
Sustainability 2016, 8, 194
protect companies against risks caused by the company stakeholders (including hostile ones), aswell as those caused by the unpredictability, asymmetry and arrhythmia of the external market.
(9) A company is now seen as the sum of its contracts over time [20–23](10) A company is a tool for value migration through network structures.(11) A company is a place of intellectual and social capital development.(12) A company is increasingly perceived and built by virtual dimensions.(13) A company is a platform for developing many dimensions of ideas and innovation.(14) The company’s business model is determined by the network.
These assumptions can provide a platform for multidimensional scientific discussion about thesearch for the best possible solution for building effective business models. In the author’s opinion, thissolution may include seeking the scalability of sustainable business models in hybrid organizations.
Based on the above reflections, a research gap related to the lack of the sufficient amount ofresearch on the scalability of sustainable business models of hybrid organizations in a networkenvironment is noted.
A scientific problem has been presented, which says: Business model scalability affects thesustainability of the business model of hybrid organizations. The research problem is significantas there is currently very little research on business model scalability, particularly in a networkenvironment. Simultaneously, the dynamically developing concept of sustainable business modelsis used for hybrid organizations. The interconnection of these two important subjects seems to bescientifically important and cognitively interesting.
In order to solve the scientific problem, the following hypotheses have been formulated:
Hypothesis 1. Scalability and sustainability are key determinants of building a business model ofhybrid organizations embedded in a network environment.
Hypothesis 2. The network environment is favorable to building sustainable business models thatare highly scalable.
Hypothesis 3. In order for a business model of the hybrid organizations to be sustainable, first of allit must be scalable.
The author proves the hypotheses based on the described research.
3. Network Environment
Changes in the world economy lead to new paradigms of management that create a newdimension of competing, creating value and achieving results. Currently, one of the key managementparadigms changing the image of management science is the network paradigm, within which thenetwork is the key element around which management takes place. The network may have manyinterpretations, which make the effective application of this paradigm in business practice complicated.Therefore, it is important to thoroughly understand the mechanisms applicable to a network approach.
According to M. Gorynia, the sources and origin of a network approach are related to the followingresearch prospects:
´ marketing, and in particular the relationship between the participants in the distribution channels(Hakanson, 1982) [24].
´ a resource dependence model in analyzing the relationships between organizations (Pfeffer,Salancik, 1978) [25].
´ the social exchange theory (Cook, Emerson, 1984) [26].´ the theory of industrial organization (Porter, 1980) [27].´ the new trend in institutional economics with the transaction costs theory (Williamson, 1975) [28].
It is worth highlighting the evolution of interest in the network approach in management science.In recent years, in management, as in many other disciplines, the amount of research on social networks
186
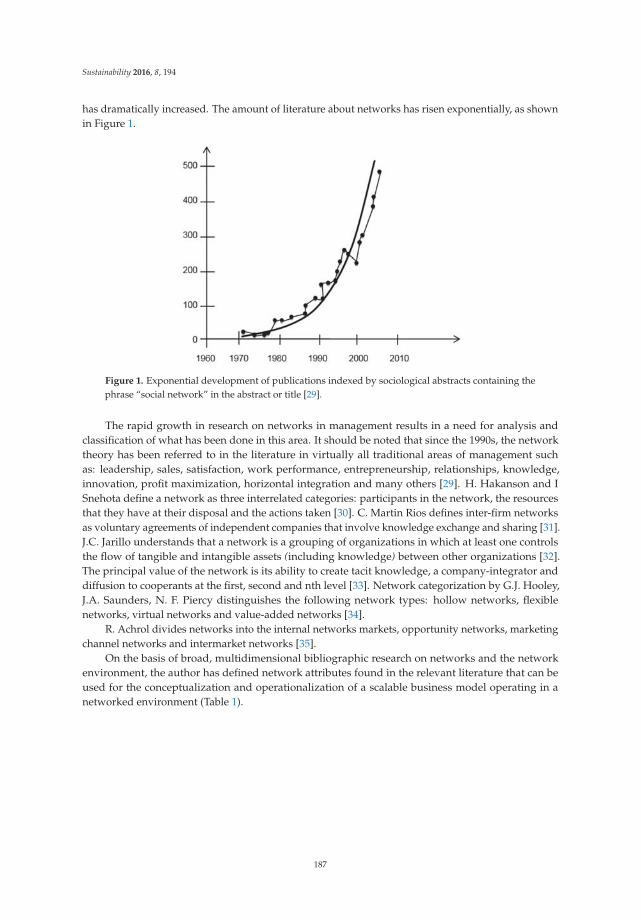
Sustainability 2016, 8, 194
has dramatically increased. The amount of literature about networks has risen exponentially, as shownin Figure 1.
Figure 1. Exponential development of publications indexed by sociological abstracts containing thephrase “social network” in the abstract or title [29].
The rapid growth in research on networks in management results in a need for analysis andclassification of what has been done in this area. It should be noted that since the 1990s, the networktheory has been referred to in the literature in virtually all traditional areas of management suchas: leadership, sales, satisfaction, work performance, entrepreneurship, relationships, knowledge,innovation, profit maximization, horizontal integration and many others [29]. H. Hakanson and ISnehota define a network as three interrelated categories: participants in the network, the resourcesthat they have at their disposal and the actions taken [30]. C. Martin Rios defines inter-firm networksas voluntary agreements of independent companies that involve knowledge exchange and sharing [31].J.C. Jarillo understands that a network is a grouping of organizations in which at least one controlsthe flow of tangible and intangible assets (including knowledge) between other organizations [32].The principal value of the network is its ability to create tacit knowledge, a company-integrator anddiffusion to cooperants at the first, second and nth level [33]. Network categorization by G.J. Hooley,J.A. Saunders, N. F. Piercy distinguishes the following network types: hollow networks, flexiblenetworks, virtual networks and value-added networks [34].
R. Achrol divides networks into the internal networks markets, opportunity networks, marketingchannel networks and intermarket networks [35].
On the basis of broad, multidimensional bibliographic research on networks and the networkenvironment, the author has defined network attributes found in the relevant literature that can beused for the conceptualization and operationalization of a scalable business model operating in anetworked environment (Table 1).
187
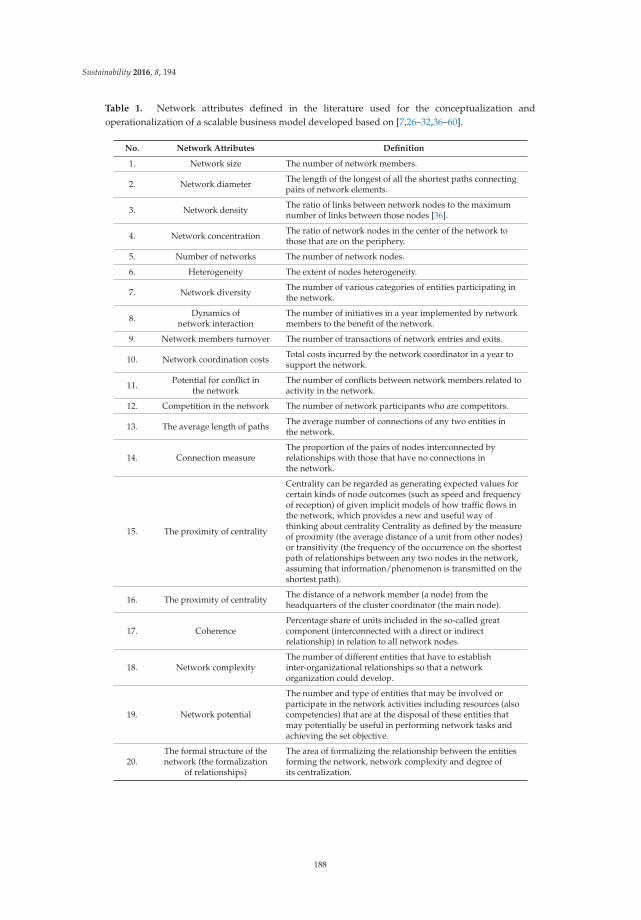
Sustainability 2016, 8, 194
Table 1. Network attributes defined in the literature used for the conceptualization andoperationalization of a scalable business model developed based on [7,26–32,36–60].
No. Network Attributes Definition
1. Network size The number of network members.
2. Network diameter The length of the longest of all the shortest paths connectingpairs of network elements.
3. Network density The ratio of links between network nodes to the maximumnumber of links between those nodes [36].
4. Network concentration The ratio of network nodes in the center of the network tothose that are on the periphery.
5. Number of networks The number of network nodes.
6. Heterogeneity The extent of nodes heterogeneity.
7. Network diversity The number of various categories of entities participating inthe network.
8. Dynamics ofnetwork interaction
The number of initiatives in a year implemented by networkmembers to the benefit of the network.
9. Network members turnover The number of transactions of network entries and exits.
10. Network coordination costs Total costs incurred by the network coordinator in a year tosupport the network.
11. Potential for conflict inthe network
The number of conflicts between network members related toactivity in the network.
12. Competition in the network The number of network participants who are competitors.
13. The average length of paths The average number of connections of any two entities inthe network.
14. Connection measureThe proportion of the pairs of nodes interconnected byrelationships with those that have no connections inthe network.
15. The proximity of centrality
Centrality can be regarded as generating expected values forcertain kinds of node outcomes (such as speed and frequencyof reception) of given implicit models of how traffic flows inthe network, which provides a new and useful way ofthinking about centrality Centrality as defined by the measureof proximity (the average distance of a unit from other nodes)or transitivity (the frequency of the occurrence on the shortestpath of relationships between any two nodes in the network,assuming that information/phenomenon is transmitted on theshortest path).
16. The proximity of centrality The distance of a network member (a node) from theheadquarters of the cluster coordinator (the main node).
17. CoherencePercentage share of units included in the so-called greatcomponent (interconnected with a direct or indirectrelationship) in relation to all network nodes.
18. Network complexityThe number of different entities that have to establishinter-organizational relationships so that a networkorganization could develop.
19. Network potential
The number and type of entities that may be involved orparticipate in the network activities including resources (alsocompetencies) that are at the disposal of these entities thatmay potentially be useful in performing network tasks andachieving the set objective.
20.The formal structure of thenetwork (the formalization
of relationships)
The area of formalizing the relationship between the entitiesforming the network, network complexity and degree ofits centralization.
188
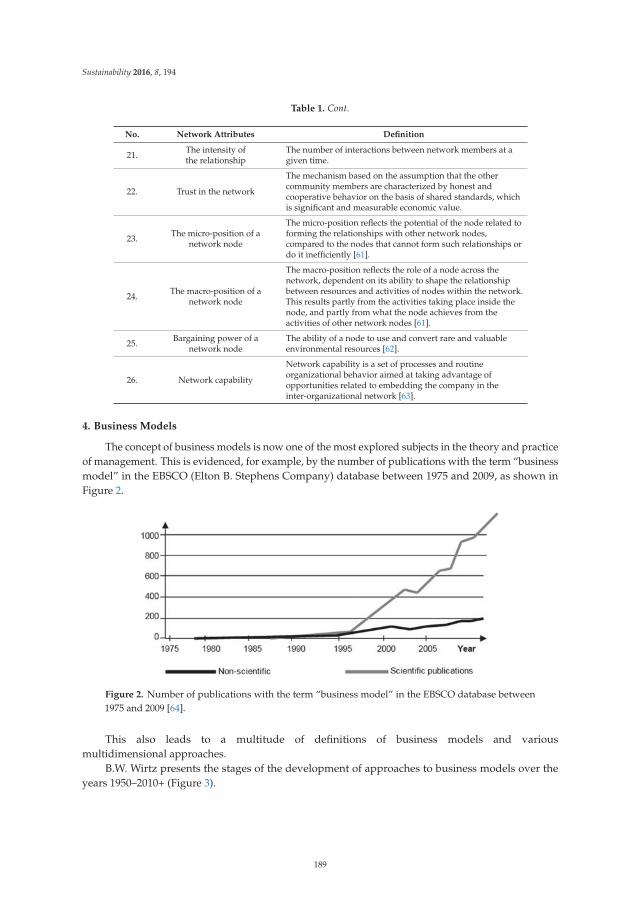
Sustainability 2016, 8, 194
Table 1. Cont.
No. Network Attributes Definition
21. The intensity ofthe relationship
The number of interactions between network members at agiven time.
22. Trust in the network
The mechanism based on the assumption that the othercommunity members are characterized by honest andcooperative behavior on the basis of shared standards, whichis significant and measurable economic value.
23. The micro-position of anetwork node
The micro-position reflects the potential of the node related toforming the relationships with other network nodes,compared to the nodes that cannot form such relationships ordo it inefficiently [61].
24. The macro-position of anetwork node
The macro-position reflects the role of a node across thenetwork, dependent on its ability to shape the relationshipbetween resources and activities of nodes within the network.This results partly from the activities taking place inside thenode, and partly from what the node achieves from theactivities of other network nodes [61].
25. Bargaining power of anetwork node
The ability of a node to use and convert rare and valuableenvironmental resources [62].
26. Network capability
Network capability is a set of processes and routineorganizational behavior aimed at taking advantage ofopportunities related to embedding the company in theinter-organizational network [63].
4. Business Models
The concept of business models is now one of the most explored subjects in the theory and practiceof management. This is evidenced, for example, by the number of publications with the term “businessmodel” in the EBSCO (Elton B. Stephens Company) database between 1975 and 2009, as shown inFigure 2.
Figure 2. Number of publications with the term “business model” in the EBSCO database between1975 and 2009 [64].
This also leads to a multitude of definitions of business models and variousmultidimensional approaches.
B.W. Wirtz presents the stages of the development of approaches to business models over theyears 1950–2010+ (Figure 3).
189
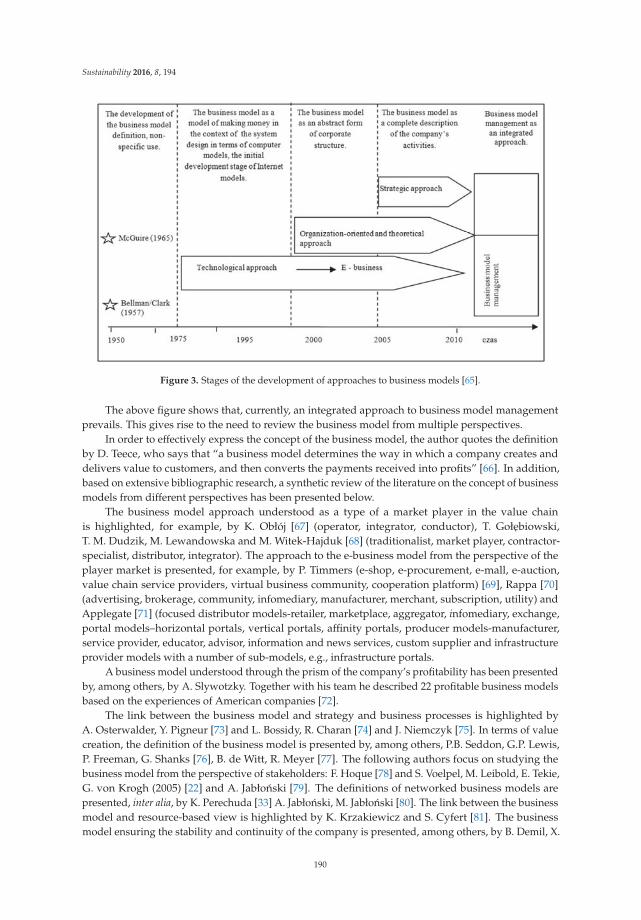
Sustainability 2016, 8, 194
Figure 3. Stages of the development of approaches to business models [65].
The above figure shows that, currently, an integrated approach to business model managementprevails. This gives rise to the need to review the business model from multiple perspectives.
In order to effectively express the concept of the business model, the author quotes the definitionby D. Teece, who says that “a business model determines the way in which a company creates anddelivers value to customers, and then converts the payments received into profits” [66]. In addition,based on extensive bibliographic research, a synthetic review of the literature on the concept of businessmodels from different perspectives has been presented below.
The business model approach understood as a type of a market player in the value chainis highlighted, for example, by K. Obłój [67] (operator, integrator, conductor), T. Gołebiowski,T. M. Dudzik, M. Lewandowska and M. Witek-Hajduk [68] (traditionalist, market player, contractor-specialist, distributor, integrator). The approach to the e-business model from the perspective of theplayer market is presented, for example, by P. Timmers (e-shop, e-procurement, e-mall, e-auction,value chain service providers, virtual business community, cooperation platform) [69], Rappa [70](advertising, brokerage, community, infomediary, manufacturer, merchant, subscription, utility) andApplegate [71] (focused distributor models-retailer, marketplace, aggregator, infomediary, exchange,portal models–horizontal portals, vertical portals, affinity portals, producer models-manufacturer,service provider, educator, advisor, information and news services, custom supplier and infrastructureprovider models with a number of sub-models, e.g., infrastructure portals.
A business model understood through the prism of the company’s profitability has been presentedby, among others, by A. Slywotzky. Together with his team he described 22 profitable business modelsbased on the experiences of American companies [72].
The link between the business model and strategy and business processes is highlighted byA. Osterwalder, Y. Pigneur [73] and L. Bossidy, R. Charan [74] and J. Niemczyk [75]. In terms of valuecreation, the definition of the business model is presented by, among others, P.B. Seddon, G.P. Lewis,P. Freeman, G. Shanks [76], B. de Witt, R. Meyer [77]. The following authors focus on studying thebusiness model from the perspective of stakeholders: F. Hoque [78] and S. Voelpel, M. Leibold, E. Tekie,G. von Krogh (2005) [22] and A. Jabłonski [79]. The definitions of networked business models arepresented, inter alia, by K. Perechuda [33] A. Jabłonski, M. Jabłonski [80]. The link between the businessmodel and resource-based view is highlighted by K. Krzakiewicz and S. Cyfert [81]. The businessmodel ensuring the stability and continuity of the company is presented, among others, by B. Demil, X.
190
Sustainability 2016, 8, 194
Lecocq [82], K.D. Sandberg [83], A. Afuah, C. Tucci [84]. B. Nogalski [85] defines a business modelfrom the development perspective. A hybrid business model is presented by S.J. Deodhar, K. Saxena,R.K. Gupta, M. Ruohonen [86], and A. Jabłonski [87]. The definition of a sustainable business model ispresented, among others, by W. Stubbs and C. Cocklin [88] and F. Boons, F. Lüdeke-Freund [89] and A.Jabłonski [90], while A. Neely, R. Delbridge [91] focus on a geometric business model.
The above approaches describe the particular complexity of the concept of business models inmanagement science. The bibliographic research indicates a multidimensional look at the businessmodel and creates further implications for research.
5. Sustainable Business Models
If we assume that the company’s business model is based on the principles of balancing thebusiness from a number of perspectives, it will become a sustainable business model. This definitionis also consistent with the assumptions relevant to a sustainable company. The sustainable businessmodel can be better understood by understanding:
- the role of different sustainability drivers,- causal relationships in relation to the various actions to be taken,- the impact of these actions on sustainable results,- the potential and actual impact on the financial results [92].
T. Dyllick and K. Hockerts present a model based on the concept of corporate sustainability(balancing and integrating the activities of the company) mapped in the form of a triangle. In threecorners of the triangle there are: focus on business case, natural case and societal case [93].W. McDonough and M. Braungart present the model of corporate sustainability in the form of afractal triangle, whose corners include: ecology–ecology, equity–equity and economy–economy [94].
An interesting sustainable business model based on the original concept of SMART (sustainabilitymodeling and reporting system) has been developed by M. Daud Ahmed and D. Sundaram [95]. In thismodel they define the sustainable business transformation roadmap, where its key elements include:
- design,- transformation,- monitoring and control,- discovery and learning,- strategy.
M. Yunus, B. Moingeon, L. Lehmann-Ortega [96] define the concept of a social business model,which can be a sustainable business model. They have developed five principles of building a socialbusiness model consisting of two areas:
(1) Framework common also for innovative models.(2) Areas specific to social models.
The similarities with conventional and innovative business models include:
(1) The challenges of conventional wisdom and fundamental assumptions.(2) The discovery of complementary business partners.(3) Undertakings in improving process experiments.
Specific objectives for social business models include:
(1) Creating favorable conditions for social orientation in terms of profit by the shareholders.(2) Clear, specific objectives for profit for society.
191
Sustainability 2016, 8, 194
The social business model is adopted by the social company. P. Kotler, H. Kartajaya and I. Setiawandefine three measures of the success of a social company that will indicate whether the company willbe able to strengthen the economic foundations of society. Using these measures, it is easy to saywhich company is a social company and which is not. First of all, such a company attains disposableincome. Secondly, it extends this income. Thirdly, it increases it [97] (p. 136). B. Nogalski notes that inorder to implement a new model (and, therefore, change), harmony between organizational structures,support systems, processes, workforce skills, resources and the incentive system, and the time horizonis necessary. All these elements and supporting processes (including corporate culture that should alsobe adapted to the business model) should support the implementation of changes in the model andthe strategy in a consistent manner [98] (p. 123). Harmony and match are the factors conducive to theapplication of the principles of sustainability.
An interesting approach to the business model based on sustainability has been introduced byA. Osterwalder and Y. Pigneur [99] (p. 62), who have presented the concept of innovative businessmodels of responsible companies in the form of a coordinate system. They determine the relationshipbetween corporations and non-profit organizations, believing that corporations in their businessmodels should move towards the development of social potential and its impact on business (currentlythe undervalued area in corporation management). In contrast, non-profit organizations shoulddevelop their business models towards seeking greater profit potential (currently the undervaluedarea in non-profit organizations management).
F. Boons and F. Lüdeke-Freund present sustainable business models that enable socialentrepreneurs to create social value and maximize social profit; of significance is the business models’ability to act as market device that helps in creating and further developing markets for innovationswith a social purpose [89] (p. 20). S. Schaltegger, F. Lüdeke-Freund, and E. Hansen present that basedon the understanding of a business case for sustainability, a business model for sustainability can bedefined as supporting voluntary or mainly voluntary activities which solve or moderate social and/orenvironmental problems. By doing so, it creates positive business effects which can be measured or atleast argued for. A business model for sustainability is actively managed in order to create customerand social value by integrating social, environmental, and business activities [100].
Looking at the business model from the point of view of fulfilling the needs and requirements ofstakeholders as a source of competitive advantage in the market, a key factor in building an effectivestrategy might be:
(1) Treating the organization as a system which determines the adoption of an appropriatemanagement philosophy, an optimal organizational structure, and an appropriate shape ofintra-process relationships.
(2) Building the appropriate structure of dynamic marketing focused on the business partnershipwith stakeholder groups in a balance of forces between stakeholders’ impact on the companyand vice versa.
(3) Focus on internal and external communication for the collectivization of joint activities in anin-out-in system, inside the organization–outside the organization–inside the organization.
(4) The resource-based approach, taking into account all members of the organization to achieve keyobjectives of the company.
The adoption of such a shape of the model of the defined strategy line can make it possible toanswer the following questions strategically for the company:
(1) Who is responsible for the interpretation and the formation of objectives?(2) Which stakeholders do we have a relationship with?(3) How do services and innovative processes proceed?(4) What are the incentives and the structure of the incentive system to stakeholders?(5) What rights and responsibilities do we have towards the company?
192
Sustainability 2016, 8, 194
(6) What are the decision-making processes between the company and supervisory authorities?(7) How recognizable is the company brand?(8) How have company resources been defined qualitatively and quantitatively in the processes [101]
(pp. 35–36)?
These questions also shift the focus of the business model on both internal and external factors,where trust is an important factor.
In this case, trust can be based on values, motivation and structures, which indicates how highlythe values, motivation and structures that help to achieve the strategic objectives of the organizationare valued. Furthermore, in this context, the following are important: clarity, fairness and stability ofthe procedures used [102] (p. 109). Building the model using the concept of Sustainable Enterprisesrequires the company to integrate the key strategic factors constituting the business model towardssustainability in the economic, environmental and social area:
- economic sustainability—it requires an increase in the profitability of the company through theefficient use of resources (human, raw materials, finance), effective projects and undertakings,good management, planning and control,
- ecological sustainability—it is essential that harmful and irreversible consequences for theenvironment are prevented through the efficient use of natural resources, promoting renewableresources, soil and water protection, and skillful waste management,
- social sustainability—requires the response to the needs of society including all otherstakeholders [103] (p. 277).
In summary, the sustainable business model building the long-term value of a socially responsiblecompany is a model built by the combined use of the corporate social responsibility and value-basedmanagement concepts which guarantees that the needs of shareholders and other stakeholder groupsare fulfilled, by balancing the company potential skillfully to generate value allocated in a sustainableway, allowing the continuity of company management. The sustainable business model is a hybridmodel, i.e., a model built in a subject- object system. Components of this model are entities gatheredaround business-forming relationships, influencing the company value drivers and strategic factorsrelated to the theory of corporate social responsibility, company value–based management, thestakeholder theory, and the shareholder theory, which are in a mutual relationship based on theprinciples of sustainability. This model is a holistic model of reduced nature, which could be appliedin various sectors of the economy that are treated as a subsystem of the whole ecosystem. This meansthat the model and its construction are included in mid-range theory [90] (pp. 400–403).
6. Hybrid Organizations
The functioning of contemporary companies often requires them to use a dual perspectivein defining their strategic goals. They should be cost-effective and, at the same time, opento social purposes. Then they can take advantage of the potential inherent in the network ofcompany stakeholders.
A company where the ability to generate value for shareholders and the widely understoodbusiness community is ensured is called a hybrid company.
This approach determines the rules for providing the context for scientific discussion. This contextproviding a framework for discussion relates to presenting the picture of reality determining theconduct of business today. A company which currently performs many economic and social functionsis searching for a new strategic reference.
This strategic reference becomes more complex and complicated. The market of customers thatare often prosumers co-developing an offer with the company creates changes in cooperation andco-development. It all has a hybrid dimension. The hybrid dimension refers to the place and role of thecompany and its functions and combining objectives and activities as well as the cooperation betweenthe ontological beings of the company such as strategy, a business model and business processes.
193
Sustainability 2016, 8, 194
In general terms, a hybrid is a combination of different elements in a coherent whole. Creatinghybrids involves combining two or more different approaches (methodologies) to form a new singleapproach (methodology).
A heterosis effect (called hybridization in the case of deliberate procedures) is a hybrid showinglonger life and increased fertility. The individual elements in a hybrid can work together, and they canalso compete with each other. The motivation for creating hybrid systems can be a conviction that thereis a positive synergistic effect of their use. Hybridity may consist of the pragmatic and coordinated(parallel, serial, hierarchical and virtual) cooperation of many factors with each other, consequently,however, forming a coherent whole which is the combination of elements derived from other systems.As regards inorganic systems, in a hybrid-artifact (a computer program, method) showing increasedusability, the quality of solutions, etc., will be evaluated positively. A. Ultsch uses the term “hybrid” inthe context of hermaphrodite forms created through a merger or crossing [104]. The hybrid model inphysics is the model that couples two or more devices that are used for shaping physical processes invarious ways, for example analog-digital devices are used here. The hybrid system is a drive systemwhere two different energy sources or generally different power sources co-work. A hybrid scheme inelectronics is used to describe the parameters of electronic circuits. A hybrid drive is a combination oftwo types of drives to move a single device. A hybrid vehicle is a vehicle that has at least (usually) anengine with two drives. Three basic types of hybrid can be distinguished in terms of action: parallel,serial and mixed action.
A hybrid approach in business can combine numerous divisions according to selected criteria forclassification, in particular the following [105] (p. 4):
(1) By the extremes: for profit–non-profit [106,107].(2) By the social sector of: the market–civil society–state [108–110].(3) By the type of integration: external–integrated–built-in [111,112].(4) By the goods produced: private–public [113–115].(5) By the product status: goods–services [116].(6) By the agents of value creation: manufacturers–consumers [117–119].(7) By ownership (corporate governance): private–cooperative–public [105,107,110].
Hybrids offer alternative solutions, probably the optimal ones, when significant limitations inobtaining contractors occur [120] (p. 19).
Hybrid organizations can exist on either side of the for profit/non-profit divide, blurring thisboundary by adopting social and environmental missions like nonprofits, but generating income toaccomplish their mission like for-profits. Hybrids are built on the assertion that neither traditionalfor-profit or non-profit models adequately address the social and environmental problems we currentlyface. Entrepreneurs of hybrids seek to build viable organizations and markets to address specificsocial and environmental issues.( . . . ) Hybrid organizations are underpinned by a new and growingdemographic of individuals who place a higher value on healthy living, environmental and socialjustice, and ecological sustainability in the products and services they purchase, the companies inwhich they invest, the politicians and policies they support, the companies for which they workand, ultimately, the lifestyles they lead. This demographic is recognized with labels such as CulturalCreatives and Lifestyles of Health and Sustainability (LOHAS) [121] (p. 126).
One of the key approaches to hybrids in terms of the common implementation of social andeconomic goals has been proposed by F.M. Santos. He defines four important proposals related tosocial entrepreneurship:
Proposition 1. The distinctive domain of action of social entrepreneurship is addressing neglectedproblems in society involving positive externalities.
Proposition 2. Social entrepreneurs are more likely to operate in areas with localized positiveexternalities that benefit a powerless segment of the population.
194
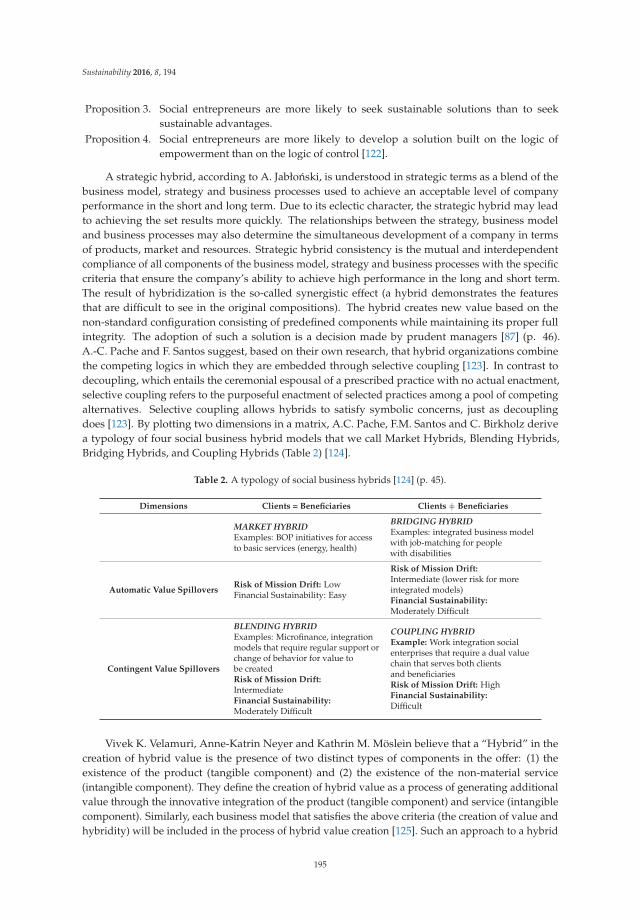
Sustainability 2016, 8, 194
Proposition 3. Social entrepreneurs are more likely to seek sustainable solutions than to seeksustainable advantages.
Proposition 4. Social entrepreneurs are more likely to develop a solution built on the logic ofempowerment than on the logic of control [122].
A strategic hybrid, according to A. Jabłonski, is understood in strategic terms as a blend of thebusiness model, strategy and business processes used to achieve an acceptable level of companyperformance in the short and long term. Due to its eclectic character, the strategic hybrid may leadto achieving the set results more quickly. The relationships between the strategy, business modeland business processes may also determine the simultaneous development of a company in termsof products, market and resources. Strategic hybrid consistency is the mutual and interdependentcompliance of all components of the business model, strategy and business processes with the specificcriteria that ensure the company’s ability to achieve high performance in the long and short term.The result of hybridization is the so-called synergistic effect (a hybrid demonstrates the featuresthat are difficult to see in the original compositions). The hybrid creates new value based on thenon-standard configuration consisting of predefined components while maintaining its proper fullintegrity. The adoption of such a solution is a decision made by prudent managers [87] (p. 46).A.-C. Pache and F. Santos suggest, based on their own research, that hybrid organizations combinethe competing logics in which they are embedded through selective coupling [123]. In contrast todecoupling, which entails the ceremonial espousal of a prescribed practice with no actual enactment,selective coupling refers to the purposeful enactment of selected practices among a pool of competingalternatives. Selective coupling allows hybrids to satisfy symbolic concerns, just as decouplingdoes [123]. By plotting two dimensions in a matrix, A.C. Pache, F.M. Santos and C. Birkholz derivea typology of four social business hybrid models that we call Market Hybrids, Blending Hybrids,Bridging Hybrids, and Coupling Hybrids (Table 2) [124].
Table 2. A typology of social business hybrids [124] (p. 45).
Dimensions Clients = Beneficiaries Clients “ Beneficiaries
MARKET HYBRIDExamples: BOP initiatives for accessto basic services (energy, health)
BRIDGING HYBRIDExamples: integrated business modelwith job-matching for peoplewith disabilities
Automatic Value SpilloversRisk of Mission Drift: LowFinancial Sustainability: Easy
Risk of Mission Drift:Intermediate (lower risk for moreintegrated models)Financial Sustainability:Moderately Difficult
Contingent Value Spillovers
BLENDING HYBRIDExamples: Microfinance, integrationmodels that require regular support orchange of behavior for value tobe createdRisk of Mission Drift:IntermediateFinancial Sustainability:Moderately Difficult
COUPLING HYBRIDExample: Work integration socialenterprises that require a dual valuechain that serves both clientsand beneficiariesRisk of Mission Drift: HighFinancial Sustainability:Difficult
Vivek K. Velamuri, Anne-Katrin Neyer and Kathrin M. Möslein believe that a “Hybrid” in thecreation of hybrid value is the presence of two distinct types of components in the offer: (1) theexistence of the product (tangible component) and (2) the existence of the non-material service(intangible component). They define the creation of hybrid value as a process of generating additionalvalue through the innovative integration of the product (tangible component) and service (intangiblecomponent). Similarly, each business model that satisfies the above criteria (the creation of value andhybridity) will be included in the process of hybrid value creation [125]. Such an approach to a hybrid
195
Sustainability 2016, 8, 194
creates a new dimension to the implementation of key strategic objectives of the company. Beingreceptive to many economic and social aspects and their interconnections generates new dynamics ofthe company. This is the basis for building business models that are evolutionary in their nature andbased on the stability generating the continuity of business.
7. Scalability
Scalability aims to provide more work and more efficient work with an increasing number ofcomponents. It is, among other things, a feature of computer networks consisting of the ability toexpand continuously. Scalability is sometimes defined as “the ease with which a system or componentcan be modified depending on the type of problem”. A scalable system has three basic features:
- The system can adapt to its increased use.- The system can accommodate larger amounts of data.- The system is easy to maintain technically and works with reasonable efficiency.
Scalability is not only speed. Effectiveness and scalability of the system vary and correlatewith each other. Effectiveness measures how quickly and efficiently the system can perform certaincalculations, while scalability measures the trend of effectiveness with an increased load [126].
Daniel A. Menascé and Virgilio A.F. Almeida think that the system is scalable if there is a“simple” way to update the system to enable support for increased trade while maintaining properefficiency. Simple means that no change in the system architecture or software should be requiredto scale the system [127]. The Universal Scalability Law (USL) in computing is a model used forforecasting the scalability of hardware and software. It uses the system performance as a functionof load to forecast system scalability. The USL function is used to create a model from the formulaand data frame. The USL model produces two coefficients as result: sigma models the contentionand kappa the coherency delay of the system. The Universal Scalability Law was formulated byNeil J. Gunther [128,129].
Scalability is an essential element for studies in strategic management, yet is unrecognized fullyand sufficiently. The concept of scalability can thus be adapted now to the important debate on themechanisms of strategic management.
Business model scalability is the capacity of the business model to maintain similar or bettereffectiveness while continuously increasing or reducing the number of its components and whileconstantly adjusting the boundaries of its impact (e.g., in a network environment).
Scaling in the business model thus refers to, inter alia, adding or removing a component and/orcomponents of the business model in order to improve its effectiveness. Scalability is a key parameterthat determines the company’s ability to grow, and it is based on the contention that not every unit ofrevenue is generated by an equal cost unit. Assessing the capability of business models to increase thecompany’s value, investors first of all appreciate models that allow companies to have higher revenuesand create higher and higher profitability. However, a common feature of e-business models especiallyis that they have high market value at low or even no profits in the long term. Market value is highbecause of attributes, which are characteristic of business models such as an innovative solution in thearea of social networks, a unique technical solution forming interesting value added, etc. Therefore,their scalability is important then.
In the literature, for example, Amit and Zott [130], Rappa [131], and Bouwman and MacInnes [132]define scalability as a key factor of innovative business models contributing to the achievement ofresults by the company. Scalability, therefore, is an important feature of the business model as it isincluded in its configuration, whereas strategy sets a business model in motion and gives its resourcesthe right direction, in line with the expectations of business model decision-makers, and scalablebusiness processes are used to implement operational objectives and will be more effective when abusiness model is highly scalable as well.
196
Sustainability 2016, 8, 194
According to Christian Nielsen and Morten Lund, scalable business models have thefollowing characteristics:
- The business potential is characterized by exponentially increasing returns to scale- They remove themselves from otherwise typical capacity constraints of that type of business- Partners enrich the value proposition without hurting profits- Stakeholders take multiple roles and create value for one another- The business model becomes a platform that attracts new partners, including competitors [133]
(pp. 16–17).
Based on the literature review and interviews with entrepreneurs and investors, Georg Stampfl,Reinhard Prügl and Vincent Osterloh identify the key factors in scaling the business model and someconsequences of scalability. Their discussions are illustrated by examples of well-known Internetcompanies. Their findings show that the factors that affect the scalability of the business model includetechnology, cost and earnings structure, institutional capacity for adaptation (i.e., the ability to adapt todifferent legal standards), and network effects and user orientation [134] (pp. 219–220).
According to R. Green, a scalable business model is a simple concept. The model is scalable whenincreased revenues cost less to deliver than current revenues. In other words, the operating marginincreases with increasing revenues [135].
The following are 10 tips to build the most scalable company:
(1) If investors are needed, start with a scalable idea.(2) Create a business plan and model that is attractive to investors.(3) Use a product with a minimum necessary functionality (MVP) to authenticate a model.(4) Build a strong team to get out of the critical path.(5) Subcontract what is not strategic to optimize financial leverage.(6) Focus on indirect and marketing channels to quickly convey a message.(7) Make the most of automation.(8) Attract and use investment funds.(9) Take into account the possibility of buying licenses and franchising.
(10) Define a business that is flexible and constantly improving [136].
E-commerce system scalability is one of the key factors in e-business. This is so because the tradeon e-commerce websites is periodic: there are high seasons, there are variations between days, andcampaigns and events can attract the attention of an unexpectedly large number of customers. The mostimportant part of scalability management is that the company is trying to avoid such technologicalsystems that have a predetermined maximum performance (new performance requires an entirelydifferent platform/technology/system structure). In this context, performance can be seen as:
- the number of the same users/connections that the system can handle without errors/problems;- the number of transactions possible at the same time;- the maximum data transfer (download, etc.).
Speaking of accessibility, we mean the time of the system operation from the point of view ofthe customer. It is a concept closely related to scalability and contracts at the service level becauseit is a measure of how good the access is that customers have to services in real time, i.e., starting acall, receiving a response and returning to the transaction when it is possible. Technical measures toensure availability range from session control to transaction maintenance to databases supporting therequired operations [137] (p. 59).
Business model scalability can be applied to startup organizations.According to S. Blank and B. Dorf, a startup is a temporary organization dedicated to looking for
a scalable, repeatable and profitable business model [138] (p. 19). Such a definition clearly indicatesstartup characteristics such as:
197
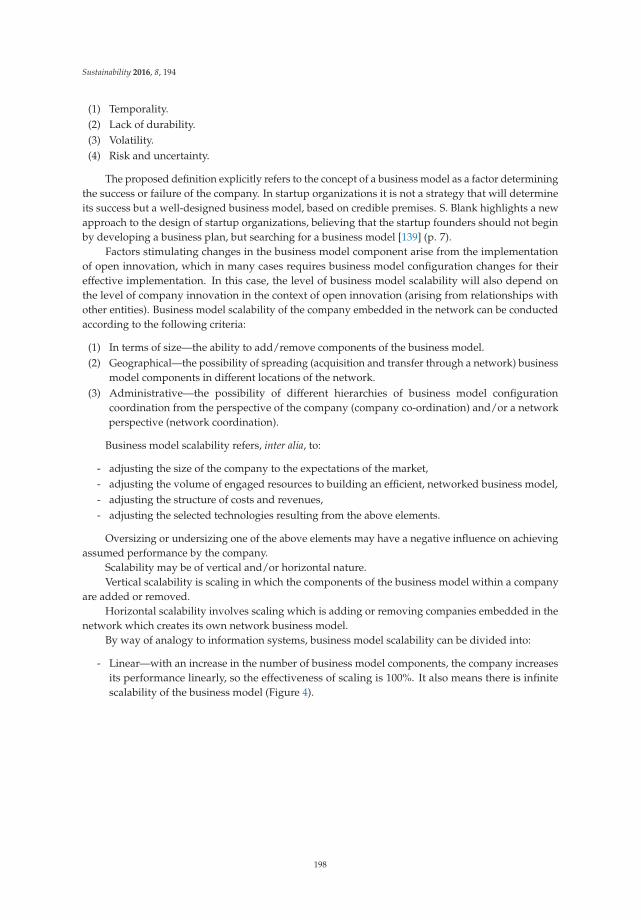
Sustainability 2016, 8, 194
(1) Temporality.(2) Lack of durability.(3) Volatility.(4) Risk and uncertainty.
The proposed definition explicitly refers to the concept of a business model as a factor determiningthe success or failure of the company. In startup organizations it is not a strategy that will determineits success but a well-designed business model, based on credible premises. S. Blank highlights a newapproach to the design of startup organizations, believing that the startup founders should not beginby developing a business plan, but searching for a business model [139] (p. 7).
Factors stimulating changes in the business model component arise from the implementationof open innovation, which in many cases requires business model configuration changes for theireffective implementation. In this case, the level of business model scalability will also depend onthe level of company innovation in the context of open innovation (arising from relationships withother entities). Business model scalability of the company embedded in the network can be conductedaccording to the following criteria:
(1) In terms of size—the ability to add/remove components of the business model.(2) Geographical—the possibility of spreading (acquisition and transfer through a network) business
model components in different locations of the network.(3) Administrative—the possibility of different hierarchies of business model configuration
coordination from the perspective of the company (company co-ordination) and/or a networkperspective (network coordination).
Business model scalability refers, inter alia, to:
- adjusting the size of the company to the expectations of the market,- adjusting the volume of engaged resources to building an efficient, networked business model,- adjusting the structure of costs and revenues,- adjusting the selected technologies resulting from the above elements.
Oversizing or undersizing one of the above elements may have a negative influence on achievingassumed performance by the company.
Scalability may be of vertical and/or horizontal nature.Vertical scalability is scaling in which the components of the business model within a company
are added or removed.Horizontal scalability involves scaling which is adding or removing companies embedded in the
network which creates its own network business model.By way of analogy to information systems, business model scalability can be divided into:
- Linear—with an increase in the number of business model components, the company increasesits performance linearly, so the effectiveness of scaling is 100%. It also means there is infinitescalability of the business model (Figure 4).
198
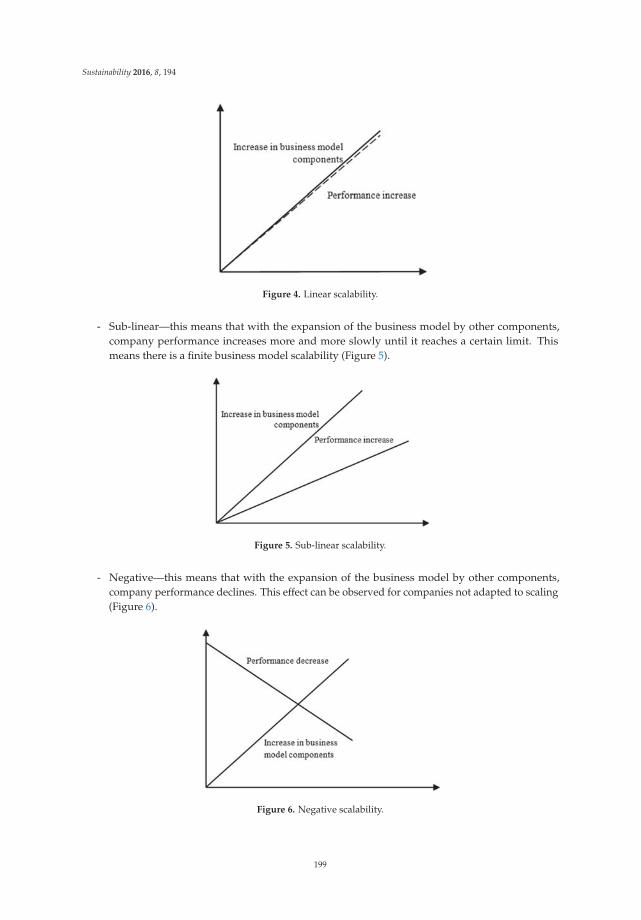
Sustainability 2016, 8, 194
Figure 4. Linear scalability.
- Sub-linear—this means that with the expansion of the business model by other components,company performance increases more and more slowly until it reaches a certain limit. Thismeans there is a finite business model scalability (Figure 5).
Figure 5. Sub-linear scalability.
- Negative—this means that with the expansion of the business model by other components,company performance declines. This effect can be observed for companies not adapted to scaling(Figure 6).
Figure 6. Negative scalability.
199
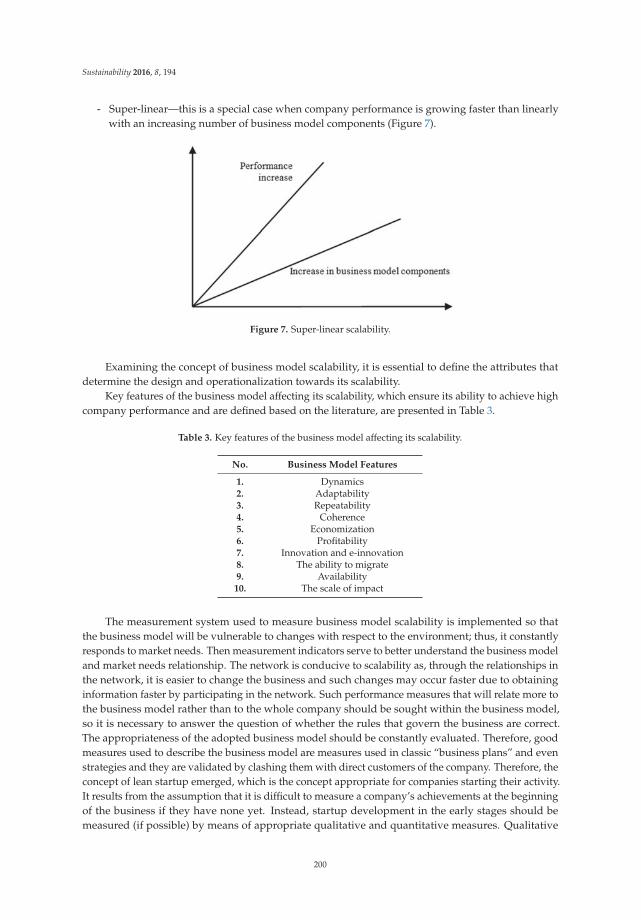
Sustainability 2016, 8, 194
- Super-linear—this is a special case when company performance is growing faster than linearlywith an increasing number of business model components (Figure 7).
Figure 7. Super-linear scalability.
Examining the concept of business model scalability, it is essential to define the attributes thatdetermine the design and operationalization towards its scalability.
Key features of the business model affecting its scalability, which ensure its ability to achieve highcompany performance and are defined based on the literature, are presented in Table 3.
Table 3. Key features of the business model affecting its scalability.
No. Business Model Features
1. Dynamics2. Adaptability3. Repeatability4. Coherence5. Economization6. Profitability7. Innovation and e-innovation8. The ability to migrate9. Availability10. The scale of impact
The measurement system used to measure business model scalability is implemented so thatthe business model will be vulnerable to changes with respect to the environment; thus, it constantlyresponds to market needs. Then measurement indicators serve to better understand the business modeland market needs relationship. The network is conducive to scalability as, through the relationships inthe network, it is easier to change the business and such changes may occur faster due to obtaininginformation faster by participating in the network. Such performance measures that will relate more tothe business model rather than to the whole company should be sought within the business model,so it is necessary to answer the question of whether the rules that govern the business are correct.The appropriateness of the adopted business model should be constantly evaluated. Therefore, goodmeasures used to describe the business model are measures used in classic “business plans” and evenstrategies and they are validated by clashing them with direct customers of the company. Therefore, theconcept of lean startup emerged, which is the concept appropriate for companies starting their activity.It results from the assumption that it is difficult to measure a company’s achievements at the beginningof the business if they have none yet. Instead, startup development in the early stages should bemeasured (if possible) by means of appropriate qualitative and quantitative measures. Qualitative
200
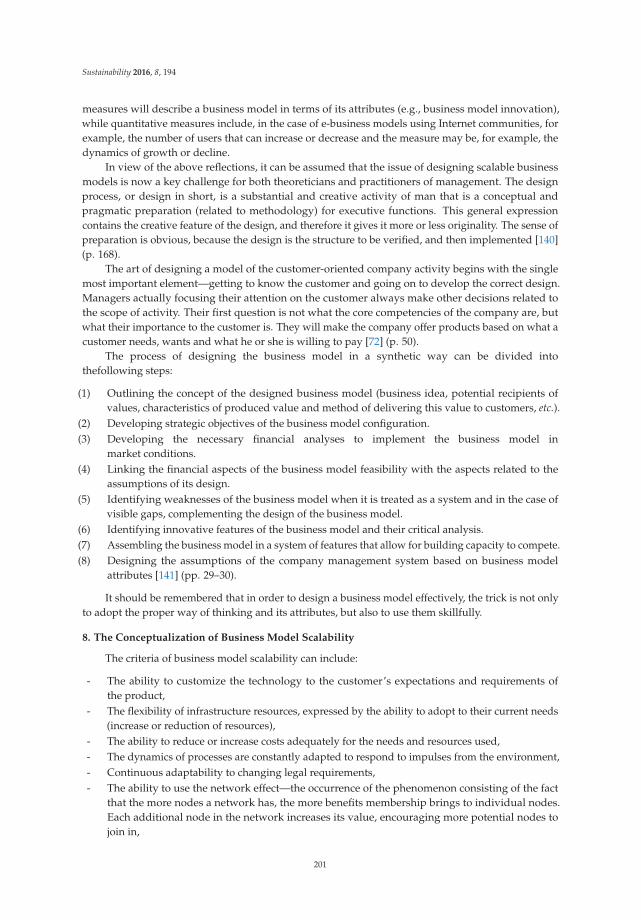
Sustainability 2016, 8, 194
measures will describe a business model in terms of its attributes (e.g., business model innovation),while quantitative measures include, in the case of e-business models using Internet communities, forexample, the number of users that can increase or decrease and the measure may be, for example, thedynamics of growth or decline.
In view of the above reflections, it can be assumed that the issue of designing scalable businessmodels is now a key challenge for both theoreticians and practitioners of management. The designprocess, or design in short, is a substantial and creative activity of man that is a conceptual andpragmatic preparation (related to methodology) for executive functions. This general expressioncontains the creative feature of the design, and therefore it gives it more or less originality. The sense ofpreparation is obvious, because the design is the structure to be verified, and then implemented [140](p. 168).
The art of designing a model of the customer-oriented company activity begins with the singlemost important element—getting to know the customer and going on to develop the correct design.Managers actually focusing their attention on the customer always make other decisions related tothe scope of activity. Their first question is not what the core competencies of the company are, butwhat their importance to the customer is. They will make the company offer products based on what acustomer needs, wants and what he or she is willing to pay [72] (p. 50).
The process of designing the business model in a synthetic way can be divided intothefollowing steps:
(1) Outlining the concept of the designed business model (business idea, potential recipients ofvalues, characteristics of produced value and method of delivering this value to customers, etc.).
(2) Developing strategic objectives of the business model configuration.(3) Developing the necessary financial analyses to implement the business model in
market conditions.(4) Linking the financial aspects of the business model feasibility with the aspects related to the
assumptions of its design.(5) Identifying weaknesses of the business model when it is treated as a system and in the case of
visible gaps, complementing the design of the business model.(6) Identifying innovative features of the business model and their critical analysis.(7) Assembling the business model in a system of features that allow for building capacity to compete.(8) Designing the assumptions of the company management system based on business model
attributes [141] (pp. 29–30).
It should be remembered that in order to design a business model effectively, the trick is not onlyto adopt the proper way of thinking and its attributes, but also to use them skillfully.
8. The Conceptualization of Business Model Scalability
The criteria of business model scalability can include:
- The ability to customize the technology to the customer’s expectations and requirements ofthe product,
- The flexibility of infrastructure resources, expressed by the ability to adopt to their current needs(increase or reduction of resources),
- The ability to reduce or increase costs adequately for the needs and resources used,- The dynamics of processes are constantly adapted to respond to impulses from the environment,- Continuous adaptability to changing legal requirements,- The ability to use the network effect—the occurrence of the phenomenon consisting of the fact
that the more nodes a network has, the more benefits membership brings to individual nodes.Each additional node in the network increases its value, encouraging more potential nodes tojoin in,
201
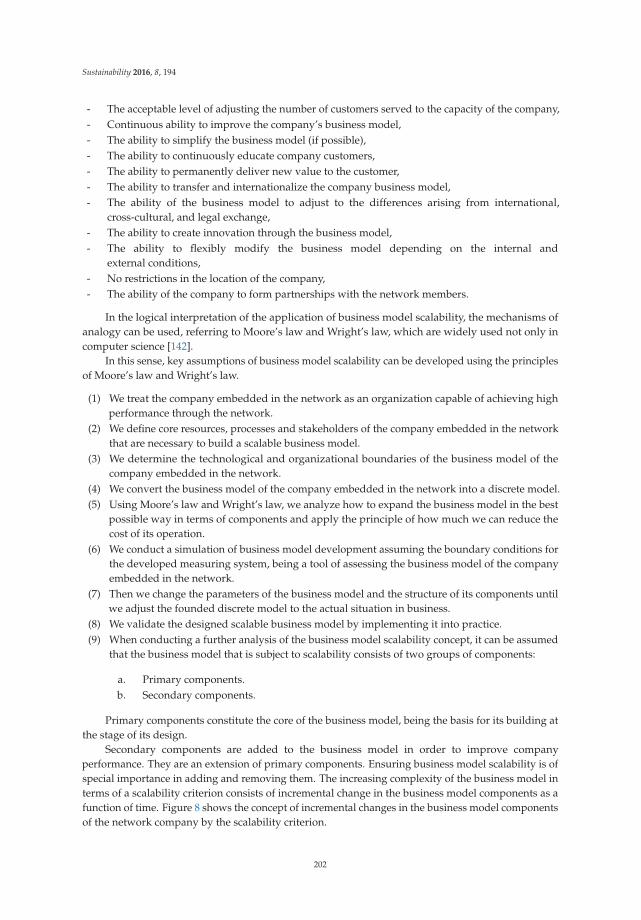
Sustainability 2016, 8, 194
- The acceptable level of adjusting the number of customers served to the capacity of the company,- Continuous ability to improve the company’s business model,- The ability to simplify the business model (if possible),- The ability to continuously educate company customers,- The ability to permanently deliver new value to the customer,- The ability to transfer and internationalize the company business model,- The ability of the business model to adjust to the differences arising from international,
cross-cultural, and legal exchange,- The ability to create innovation through the business model,- The ability to flexibly modify the business model depending on the internal and
external conditions,- No restrictions in the location of the company,- The ability of the company to form partnerships with the network members.
In the logical interpretation of the application of business model scalability, the mechanisms ofanalogy can be used, referring to Moore’s law and Wright’s law, which are widely used not only incomputer science [142].
In this sense, key assumptions of business model scalability can be developed using the principlesof Moore’s law and Wright’s law.
(1) We treat the company embedded in the network as an organization capable of achieving highperformance through the network.
(2) We define core resources, processes and stakeholders of the company embedded in the networkthat are necessary to build a scalable business model.
(3) We determine the technological and organizational boundaries of the business model of thecompany embedded in the network.
(4) We convert the business model of the company embedded in the network into a discrete model.(5) Using Moore’s law and Wright’s law, we analyze how to expand the business model in the best
possible way in terms of components and apply the principle of how much we can reduce thecost of its operation.
(6) We conduct a simulation of business model development assuming the boundary conditions forthe developed measuring system, being a tool of assessing the business model of the companyembedded in the network.
(7) Then we change the parameters of the business model and the structure of its components untilwe adjust the founded discrete model to the actual situation in business.
(8) We validate the designed scalable business model by implementing it into practice.(9) When conducting a further analysis of the business model scalability concept, it can be assumed
that the business model that is subject to scalability consists of two groups of components:
a. Primary components.b. Secondary components.
Primary components constitute the core of the business model, being the basis for its building atthe stage of its design.
Secondary components are added to the business model in order to improve companyperformance. They are an extension of primary components. Ensuring business model scalability is ofspecial importance in adding and removing them. The increasing complexity of the business model interms of a scalability criterion consists of incremental change in the business model components as afunction of time. Figure 8 shows the concept of incremental changes in the business model componentsof the network company by the scalability criterion.
202
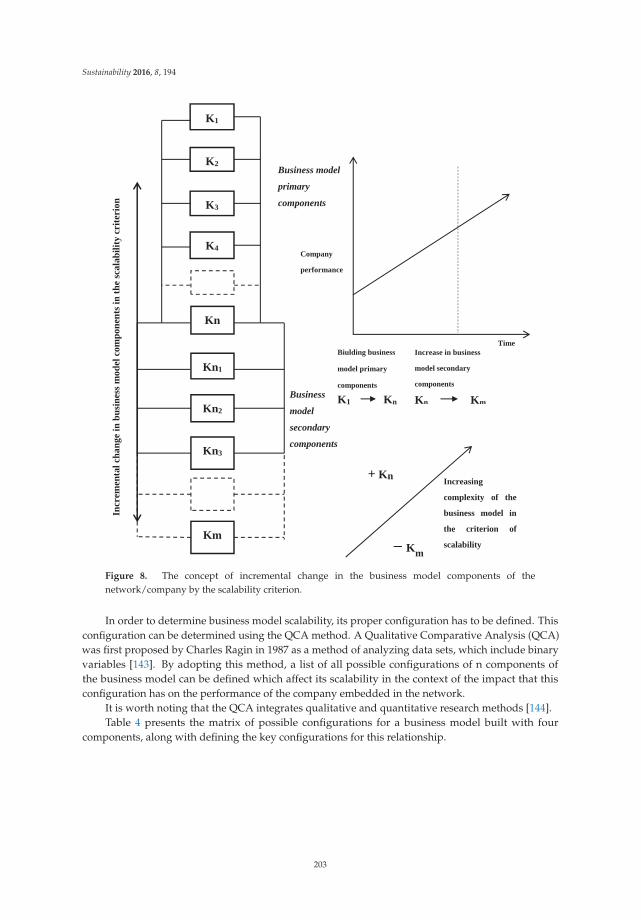
Sustainability 2016, 8, 194
Incr
emen
tal c
hang
e in
bus
ines
s mod
el c
ompo
nent
s in
the
scal
abili
ty c
rite
rion
Biulding business
model primary
components
K1 Kn
Increase in business
model secondary
components
Kn Km
Time
+ Kn Increasing
complexity of the
business model in
the criterion of
scalability
Business model
primary
components
Business
model
secondary
components
Km
K1
Kn
Kn2
K4
K3
Kn1
K2
Kn3
Km
Company
performance
Figure 8. The concept of incremental change in the business model components of thenetwork/company by the scalability criterion.
In order to determine business model scalability, its proper configuration has to be defined. Thisconfiguration can be determined using the QCA method. A Qualitative Comparative Analysis (QCA)was first proposed by Charles Ragin in 1987 as a method of analyzing data sets, which include binaryvariables [143]. By adopting this method, a list of all possible configurations of n components ofthe business model can be defined which affect its scalability in the context of the impact that thisconfiguration has on the performance of the company embedded in the network.
It is worth noting that the QCA integrates qualitative and quantitative research methods [144].Table 4 presents the matrix of possible configurations for a business model built with four
components, along with defining the key configurations for this relationship.
203
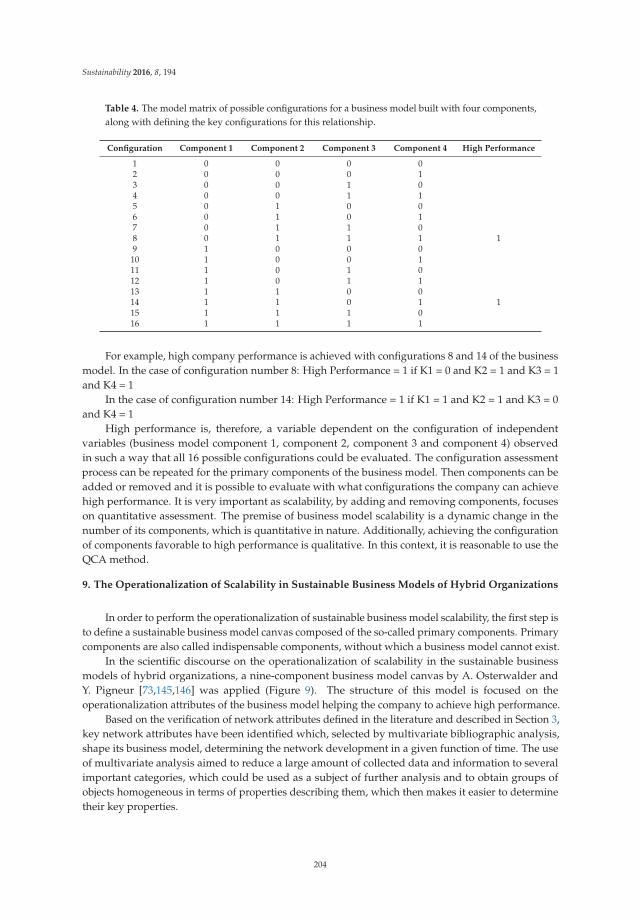
Sustainability 2016, 8, 194
Table 4. The model matrix of possible configurations for a business model built with four components,along with defining the key configurations for this relationship.
Configuration Component 1 Component 2 Component 3 Component 4 High Performance
1 0 0 0 02 0 0 0 13 0 0 1 04 0 0 1 15 0 1 0 06 0 1 0 17 0 1 1 08 0 1 1 1 19 1 0 0 010 1 0 0 111 1 0 1 012 1 0 1 113 1 1 0 014 1 1 0 1 115 1 1 1 016 1 1 1 1
For example, high company performance is achieved with configurations 8 and 14 of the businessmodel. In the case of configuration number 8: High Performance = 1 if K1 = 0 and K2 = 1 and K3 = 1and K4 = 1
In the case of configuration number 14: High Performance = 1 if K1 = 1 and K2 = 1 and K3 = 0and K4 = 1
High performance is, therefore, a variable dependent on the configuration of independentvariables (business model component 1, component 2, component 3 and component 4) observedin such a way that all 16 possible configurations could be evaluated. The configuration assessmentprocess can be repeated for the primary components of the business model. Then components can beadded or removed and it is possible to evaluate with what configurations the company can achievehigh performance. It is very important as scalability, by adding and removing components, focuseson quantitative assessment. The premise of business model scalability is a dynamic change in thenumber of its components, which is quantitative in nature. Additionally, achieving the configurationof components favorable to high performance is qualitative. In this context, it is reasonable to use theQCA method.
9. The Operationalization of Scalability in Sustainable Business Models of Hybrid Organizations
In order to perform the operationalization of sustainable business model scalability, the first step isto define a sustainable business model canvas composed of the so-called primary components. Primarycomponents are also called indispensable components, without which a business model cannot exist.
In the scientific discourse on the operationalization of scalability in the sustainable businessmodels of hybrid organizations, a nine-component business model canvas by A. Osterwalder andY. Pigneur [73,145,146] was applied (Figure 9). The structure of this model is focused on theoperationalization attributes of the business model helping the company to achieve high performance.
Based on the verification of network attributes defined in the literature and described in Section 3,key network attributes have been identified which, selected by multivariate bibliographic analysis,shape its business model, determining the network development in a given function of time. The useof multivariate analysis aimed to reduce a large amount of collected data and information to severalimportant categories, which could be used as a subject of further analysis and to obtain groups ofobjects homogeneous in terms of properties describing them, which then makes it easier to determinetheir key properties.
204
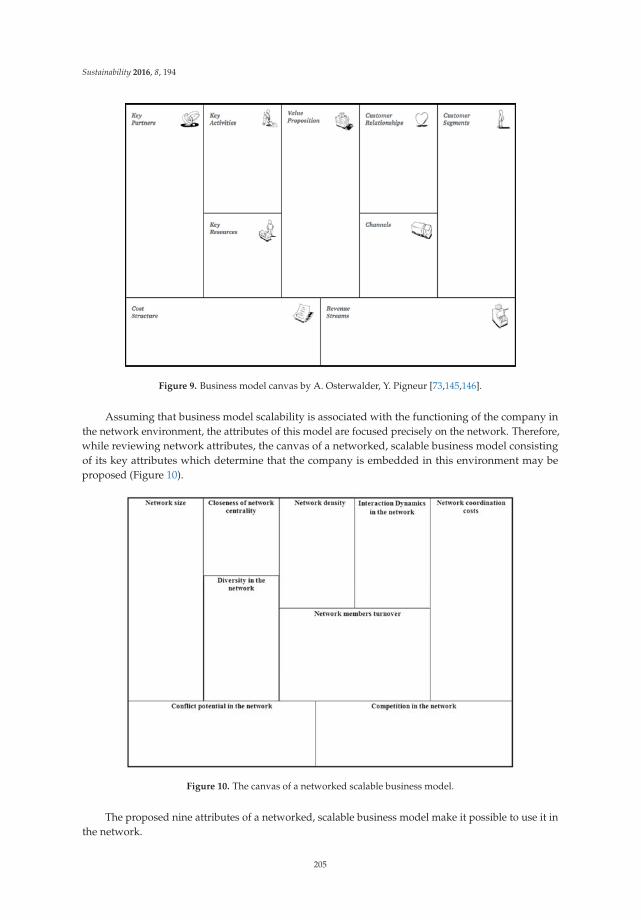
Sustainability 2016, 8, 194
Figure 9. Business model canvas by A. Osterwalder, Y. Pigneur [73,145,146].
Assuming that business model scalability is associated with the functioning of the company inthe network environment, the attributes of this model are focused precisely on the network. Therefore,while reviewing network attributes, the canvas of a networked, scalable business model consistingof its key attributes which determine that the company is embedded in this environment may beproposed (Figure 10).
Figure 10. The canvas of a networked scalable business model.
The proposed nine attributes of a networked, scalable business model make it possible to use it inthe network.
205
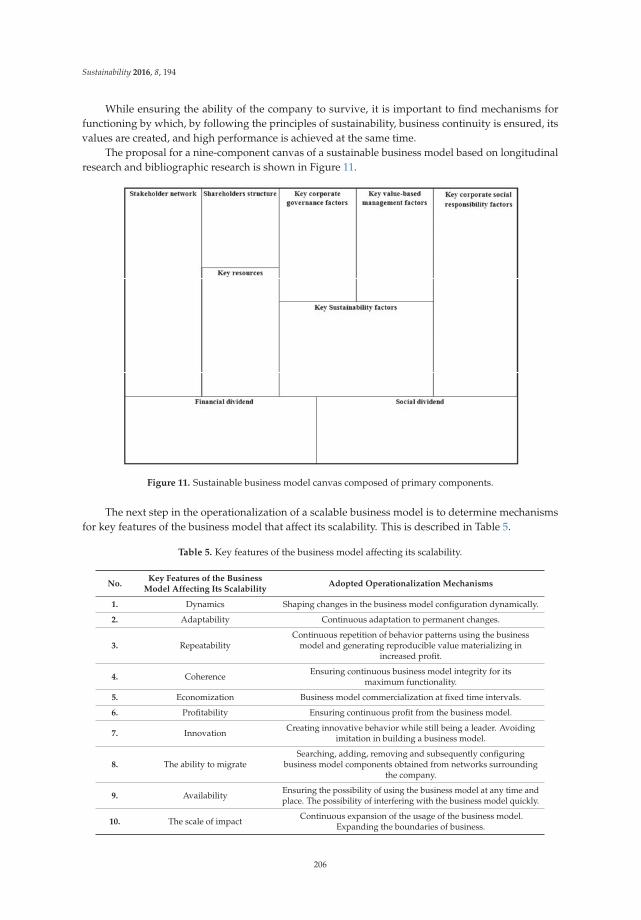
Sustainability 2016, 8, 194
While ensuring the ability of the company to survive, it is important to find mechanisms forfunctioning by which, by following the principles of sustainability, business continuity is ensured, itsvalues are created, and high performance is achieved at the same time.
The proposal for a nine-component canvas of a sustainable business model based on longitudinalresearch and bibliographic research is shown in Figure 11.
Figure 11. Sustainable business model canvas composed of primary components.
The next step in the operationalization of a scalable business model is to determine mechanismsfor key features of the business model that affect its scalability. This is described in Table 5.
Table 5. Key features of the business model affecting its scalability.
No.Key Features of the Business
Model Affecting Its ScalabilityAdopted Operationalization Mechanisms
1. Dynamics Shaping changes in the business model configuration dynamically.
2. Adaptability Continuous adaptation to permanent changes.
3. RepeatabilityContinuous repetition of behavior patterns using the business
model and generating reproducible value materializing inincreased profit.
4. Coherence Ensuring continuous business model integrity for itsmaximum functionality.
5. Economization Business model commercialization at fixed time intervals.
6. Profitability Ensuring continuous profit from the business model.
7. Innovation Creating innovative behavior while still being a leader. Avoidingimitation in building a business model.
8. The ability to migrateSearching, adding, removing and subsequently configuring
business model components obtained from networks surroundingthe company.
9. Availability Ensuring the possibility of using the business model at any time andplace. The possibility of interfering with the business model quickly.
10. The scale of impact Continuous expansion of the usage of the business model.Expanding the boundaries of business.
206
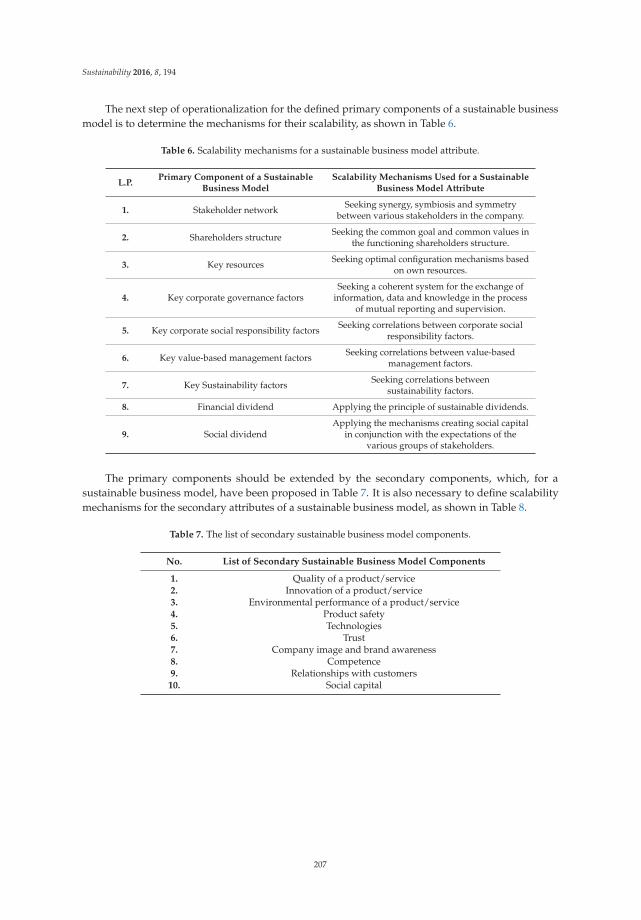
Sustainability 2016, 8, 194
The next step of operationalization for the defined primary components of a sustainable businessmodel is to determine the mechanisms for their scalability, as shown in Table 6.
Table 6. Scalability mechanisms for a sustainable business model attribute.
L.P.Primary Component of a Sustainable
Business ModelScalability Mechanisms Used for a Sustainable
Business Model Attribute
1. Stakeholder network Seeking synergy, symbiosis and symmetrybetween various stakeholders in the company.
2. Shareholders structure Seeking the common goal and common values inthe functioning shareholders structure.
3. Key resources Seeking optimal configuration mechanisms basedon own resources.
4. Key corporate governance factorsSeeking a coherent system for the exchange of
information, data and knowledge in the processof mutual reporting and supervision.
5. Key corporate social responsibility factors Seeking correlations between corporate socialresponsibility factors.
6. Key value-based management factors Seeking correlations between value-basedmanagement factors.
7. Key Sustainability factors Seeking correlations betweensustainability factors.
8. Financial dividend Applying the principle of sustainable dividends.
9. Social dividendApplying the mechanisms creating social capital
in conjunction with the expectations of thevarious groups of stakeholders.
The primary components should be extended by the secondary components, which, for asustainable business model, have been proposed in Table 7. It is also necessary to define scalabilitymechanisms for the secondary attributes of a sustainable business model, as shown in Table 8.
Table 7. The list of secondary sustainable business model components.
No. List of Secondary Sustainable Business Model Components
1. Quality of a product/service2. Innovation of a product/service3. Environmental performance of a product/service4. Product safety5. Technologies6. Trust7. Company image and brand awareness8. Competence9. Relationships with customers10. Social capital
207
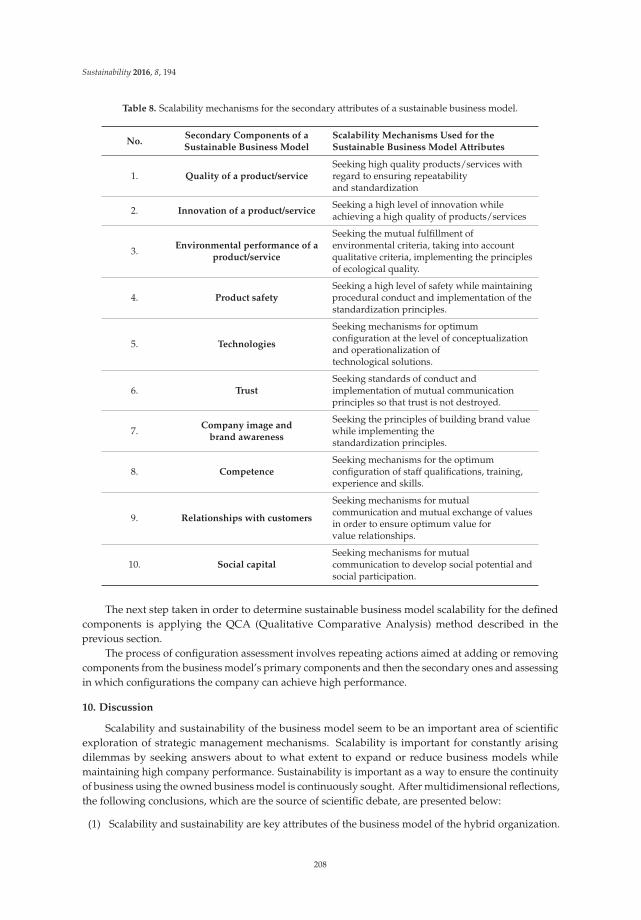
Sustainability 2016, 8, 194
Table 8. Scalability mechanisms for the secondary attributes of a sustainable business model.
No.Secondary Components of aSustainable Business Model
Scalability Mechanisms Used for theSustainable Business Model Attributes
1. Quality of a product/serviceSeeking high quality products/services withregard to ensuring repeatabilityand standardization
2. Innovation of a product/serviceSeeking a high level of innovation whileachieving a high quality of products/services
3. Environmental performance of aproduct/service
Seeking the mutual fulfillment ofenvironmental criteria, taking into accountqualitative criteria, implementing the principlesof ecological quality.
4. Product safetySeeking a high level of safety while maintainingprocedural conduct and implementation of thestandardization principles.
5. Technologies
Seeking mechanisms for optimumconfiguration at the level of conceptualizationand operationalization oftechnological solutions.
6. TrustSeeking standards of conduct andimplementation of mutual communicationprinciples so that trust is not destroyed.
7. Company image andbrand awareness
Seeking the principles of building brand valuewhile implementing thestandardization principles.
8. CompetenceSeeking mechanisms for the optimumconfiguration of staff qualifications, training,experience and skills.
9. Relationships with customers
Seeking mechanisms for mutualcommunication and mutual exchange of valuesin order to ensure optimum value forvalue relationships.
10. Social capitalSeeking mechanisms for mutualcommunication to develop social potential andsocial participation.
The next step taken in order to determine sustainable business model scalability for the definedcomponents is applying the QCA (Qualitative Comparative Analysis) method described in theprevious section.
The process of configuration assessment involves repeating actions aimed at adding or removingcomponents from the business model’s primary components and then the secondary ones and assessingin which configurations the company can achieve high performance.
10. Discussion
Scalability and sustainability of the business model seem to be an important area of scientificexploration of strategic management mechanisms. Scalability is important for constantly arisingdilemmas by seeking answers about to what extent to expand or reduce business models whilemaintaining high company performance. Sustainability is important as a way to ensure the continuityof business using the owned business model is continuously sought. After multidimensional reflections,the following conclusions, which are the source of scientific debate, are presented below:
(1) Scalability and sustainability are key attributes of the business model of the hybrid organization.
208
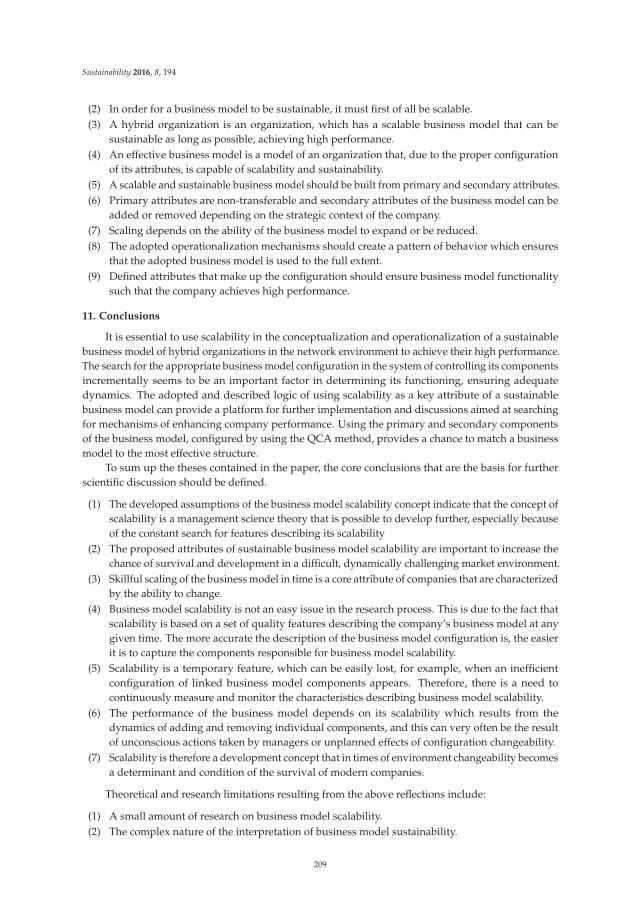
Sustainability 2016, 8, 194
(2) In order for a business model to be sustainable, it must first of all be scalable.(3) A hybrid organization is an organization, which has a scalable business model that can be
sustainable as long as possible, achieving high performance.(4) An effective business model is a model of an organization that, due to the proper configuration
of its attributes, is capable of scalability and sustainability.(5) A scalable and sustainable business model should be built from primary and secondary attributes.(6) Primary attributes are non-transferable and secondary attributes of the business model can be
added or removed depending on the strategic context of the company.(7) Scaling depends on the ability of the business model to expand or be reduced.(8) The adopted operationalization mechanisms should create a pattern of behavior which ensures
that the adopted business model is used to the full extent.(9) Defined attributes that make up the configuration should ensure business model functionality
such that the company achieves high performance.
11. Conclusions
It is essential to use scalability in the conceptualization and operationalization of a sustainablebusiness model of hybrid organizations in the network environment to achieve their high performance.The search for the appropriate business model configuration in the system of controlling its componentsincrementally seems to be an important factor in determining its functioning, ensuring adequatedynamics. The adopted and described logic of using scalability as a key attribute of a sustainablebusiness model can provide a platform for further implementation and discussions aimed at searchingfor mechanisms of enhancing company performance. Using the primary and secondary componentsof the business model, configured by using the QCA method, provides a chance to match a businessmodel to the most effective structure.
To sum up the theses contained in the paper, the core conclusions that are the basis for furtherscientific discussion should be defined.
(1) The developed assumptions of the business model scalability concept indicate that the concept ofscalability is a management science theory that is possible to develop further, especially becauseof the constant search for features describing its scalability
(2) The proposed attributes of sustainable business model scalability are important to increase thechance of survival and development in a difficult, dynamically challenging market environment.
(3) Skillful scaling of the business model in time is a core attribute of companies that are characterizedby the ability to change.
(4) Business model scalability is not an easy issue in the research process. This is due to the fact thatscalability is based on a set of quality features describing the company’s business model at anygiven time. The more accurate the description of the business model configuration is, the easierit is to capture the components responsible for business model scalability.
(5) Scalability is a temporary feature, which can be easily lost, for example, when an inefficientconfiguration of linked business model components appears. Therefore, there is a need tocontinuously measure and monitor the characteristics describing business model scalability.
(6) The performance of the business model depends on its scalability which results from thedynamics of adding and removing individual components, and this can very often be the resultof unconscious actions taken by managers or unplanned effects of configuration changeability.
(7) Scalability is therefore a development concept that in times of environment changeability becomesa determinant and condition of the survival of modern companies.
Theoretical and research limitations resulting from the above reflections include:
(1) A small amount of research on business model scalability.(2) The complex nature of the interpretation of business model sustainability.
209
Sustainability 2016, 8, 194
(3) Variability in the environment that gives rise to new research dilemmas related to the featuresand attributes of business models.
The author believes that on the basis of longitudinal and bibliographic research, it can be assumedthat the hypotheses are proven.
Hypothesis 1. Scalability and sustainability are key determinants of building a business model ofthe hybrid organizations embedded in a network environment.
Hypothesis 2. The network environment is favorable to building sustainable business models thatare highly scalable.
Hypothesis 3. In order for a business model of the hybrid organizations to be sustainable, it mustfirst of all be scalable.
The author has proven the hypotheses based on the above research.
Conflicts of Interest: Conflicts of Interest: The author declares no conflict of interest.
References
1. Kimberly, J.R. Issues in the Design of Longitudinal Organizational Research. Sociol. Methods Res. 1976, 4,321–348. [CrossRef]
2. Venkatesh, A.; Vitalari, N.P. Longitudinal Surveys in Information Systems Research: An Examination ofIssues, Methods, and Applications. In The Information Systems Challenge: Survey Research Methods; HarvardUniversity Press: Location, UK, 1991; pp. 115–144.
3. Janson, C. Some Problems of Longitudinal Research in the Social Sciences. In Longitudinal Research: Methodsand Uses in Behavioral Science; Schulsinger, F., Mednick, S., Knop, J., Eds.; Martinus Nijhoff Publishing: Boston,MA, USA, 1981.
4. Jourdan, Z.; Rainer, K.; Marshall, T. Business Intelligence: An Analysis of the Literature. Inform. Syst. Manag.2008, 25, 121–131. [CrossRef]
5. Massaro, M.; Dumay, J.; Guthrie, J. On the Shoulders of Giants: Undertaking a Structured Literature Reviewin Accounting, Accounting. Audit. Account. J. 2015, 28, 267–284.
6. World Economic Outlook: Adjusting to Lower Commodity Prices. In World Economic Situation and Prospects2015; OECD Economic Outlook, Volume 2015/1 © OECD 2015–Preliminary Version; International MonetaryFund: Washington, DC, USA, 2015.
7. Porter, M.E. Competitive Advantage, Creating and Sustaining Superior Performance; The Free Press: New York,NY, USA, 1985.
8. Mintzberg, H.; Ahlstrand, B.; Lampel, J. Strategy safari: The complete guide through the wilds of strategicmanagement, FT Prentice Hall, London 1998. In Competitive Advantage: Creating and Sustaining SuperiorPerformance; Porter, M.E., Ed.; The Free Press: New York, NY, USA, 1985.
9. Volberda, H.W., Elfring, T., Eds.; Rethinking Strategy; SAGE: London, UK, 2001.10. Farjoun, M. Towards an organic perspective on strategy. Strateg. Manag. J. 2002, 23, 561–594. [CrossRef]11. Freeman, R.E. Strategic Management: A Stakeholder Approach; Pitman: Boston, MA, USA, 1984.12. Clarkson, M. A risk Based Model of Stakeholder Theory. In Proceedings of the Second Toronto Conference
of Stakeholder Theory; Centre for Corporate Social Performance and Ethics, University of Toronto: Toronto,ON, Canada, 1994.
13. Lantgry, B. Stakeholders and Moral Responsibilities of Business. Bus. Ethics Quart. 1994, 4, 431–443.14. Harrison, J.G. Strategic Management of Organisation and Stakeholder; West: St. Paul, MN, USA, 1994.15. Mitchell, R.K. Toward A Theory of Stakeholder. Identification and Salience: Defining the Principle of Who
and What Really Counts. Acad. Manag. Rev. 1997, 22, Article 4.16. Freeman, E.; Reed, D. Stockholders and Stakeholders: A New Perspective on Corporate Governance.
Calif. Manag. Rev. 1983, 25, 88–106. [CrossRef]17. Svendsen, A. The Stakeholder Strategy. In Profiting from Collaborative Business Relationships; Berret-Koehler
Publishers, Inc.: San Francisco, CA, USA, 1998.
210
Sustainability 2016, 8, 194
18. Morin, R.A.; Jarrell, S.L. Driving Shareholder Value: Value–Building Techniques for Creating Shareholder Wealth;McGraw-Hill: New York, NY, USA, 2001.
19. Martin, J.D.; Petty, J.W.; Wallace, J.S. Value–Based Management with Corporate Social Responsibility; UniversityPress: Oxford, UK, 2009.
20. Fu, R.; Qiu, L.; Quyang, L. A Networking-based View of Business Model Innovation: Theory and Method,A Networking-based View of Business Model Innovation. Commun. IIMA 2006, 6, Article 7.
21. Calia, R.C.; Guerrini, F.M.; Moura, G.L. Innovation networks: From technological development to businessmodel reconfiguration. Technovation 2007, 27, 426–432. [CrossRef]
22. Voelpel, S.; Leibold, M.; Tekie, E.; von Krogh, G. Escaping the Red Queen Effect in Competitive Strategy:Sense-testing Business Models. Eur. Manag. J. 2005, 23, 37–49. [CrossRef]
23. Wirtz, B.W.; Schilke, O.; Ullrich, S. Strategic Development of Business Models Implications of the Web 2.0 forCreating Value on the Internet. Long Range Plan. 2010, 43, 272–290. [CrossRef]
24. Hakanson, H. International Marketing and Purchasing of Industrial Goods: An Interaction Approach; Wiley:Chichester, UK, 1982.
25. Pfeffer, J.; Salancik, G. The External Control of Organisations; Harper and Row: New York, NY, USA, 1978.26. Cook, K.S.; Emerson, R. Exchange Networks and the Analysis of Complex Organisations, Research of the Sociology
of Organisations; JAI press: Greenwich, CT, USA, 1984; Volume 3.27. Porter, M.E. Competitive Strategy: Techniques for Analyzing Industries and Competitors; The Free Press: New York,
NY, USA, 1980.28. Williamson, O.E. Markets and Hierarchies, Analysis and Antitrust Implications: A Study in the Economics of
Internal Organization; Free Press: New York, NY, USA, 1975.29. Borgatti, S.P. The Network Paradigm in Organizational Research: A Review and Typology. J. Manag. 2003,
29, 991–1013.30. Hakanson, H.; Snehota, I. Developing Relationships in Business Networks; Routledge: London, UK, 2005.31. Martin-Rios, C. Why do firms seek to share human resource management knowledge? The importance of
inter-firm networks. J. Bus. Res. 2014, 67, 190–199. [CrossRef]32. Jarillo, J.C. Strategic Networks; Creating the Borderless Organization, Butterworth—Heinemann: Oxford,
UK, 1995.33. Perechuda, K. Dyfuzja Wiedzy w Przedsiebiorstwie Sieciowym. Wizualizacja i Kompozycja; Wydawnictwo
Uniwersytetu Ekonomicznego we Wrocławiu: Wrocław, Poland, 2013. (In Polish)34. Hooley, G.J.; Saunders, J.A.; Piercy, N.F. Marketing Strategy and Competitive Positioning; Prentice Hall:
Englewood Cliffs, NJ, USA, 1998.35. Achrol, R. Changes in the theory of interorganizational relations in marketing: Toward network paradigm.
J. Acad. Mark. Sci. 1997, 25, 56–71. [CrossRef]36. Czakon, W. Sieci w Zarzadzaniu Strategicznym; Oficyna a Wolters Kluwer Business: Warszawa, Poland, 2012.37. Gorynia, M.; Jankowska, B. Teorie internacjonalizacji. Gospodarka Narodowa. 2007, 10, 21–44. (In Polish)38. Jaki, A. Mechanizmy rozwoju paradygmatów zarzadzania. Przeglad Organizacji 2014, 2, 8–13.39. Płoszaj, A. Sieci Instytucji Otoczenia Biznesu; Scholar: Warszawa, Poland, 2013. (In Polish)40. Kozminski, A.K.; Latusek-Jurczak, D. Rozwój Teorii Organizacji, Od Systemu do Sieci; Oficyna a Wolters Kluwer
business: Warszawa, Poland, 2011. (In Polish)41. Nogalski, B.; Srednicka, J. Dyfuzja logiki sieci i jej znaczenie dla współpracy organizacyjnej w warunkach
niepewnosci i nieciagłosci współczesnej gospodarki. In Nauki o Zarzadzaniu Wobec Nieprzewidywalnosci iZłozonosci Zmian, Praca Zbiorowa pod Redakcja J. Rokity, Górnoslaska Wyzsza Szkoła Handlowa im; WojciechaKorfantego: Katowice, Poland, 2011. (In Polish)
42. Brilman, J. Nowoczesne Koncepcje i Metody Zarzadzania; Polskie Wydawnictwo Ekonomiczne: Warszawa,Poland, 2002. (In Polish)
43. Stachowicz, J. Rola i udział koryfeusza nauk zarzadzania w okresie wyłaniania sie nowego paradygmatunauk o zarzadzaniu. In Irena Hejduk i Andrzej Herman; Przyszłosci, D., Ed.; Difin: Warszawa, Poland, 2014.(In Polish)
44. Noga, A. Sieci w Ujeciu Teorii Ekonomii. In Relacje Miedzyorganizacyjne w Naukach o Zarzadzaniu; Pracazbiorowa pod red. naukowa; Kozminskiego, A.K., Latusek-Jurczak, D., Eds.; Oficyna a Wolters Kluwerbusiness: Warszawa, Poland, 2014. (In Polish)
211
Sustainability 2016, 8, 194
45. Niemczyk, J. Strategia, od Planu do Sieci; Wydawnictwo Uniwersytetu Ekonomicznego we Wrocławiu:Wrocław, Poland, 2013. (In Polish)
46. Hakansson, H.; Snehota, I. No business is an island: The network concept of business strategy. Scand. J. Mgmt.2006, 22, 256–270. [CrossRef]
47. Watts, D.J. Networks Dynamics and the Small-World Phenomenon. Am. J. Soc. 1999, 105, 493–527.48. Ciesielski, M., Ed.; Sieci w Gospodarce; Polskie Wydawnictwo Ekonomiczne: Warszawa, Poland, 2013.
(In Polish)49. De Man, A.P. The Network Economy. Strategy, Structure and Management; Edward Elgar: Cheltenham, UK, 2004.50. Niemczyk, J.; Stanczyk-Hugiet, E.; Jasinski, B. Sieci Miedzyorganizacyjne, Współczesne Wyzwanie dla Teorii i
Praktyki Zarzadzania; C.H. Beck: Warszawa, Poland, 2012. (In Polish)51. Rybicki, J.M. Myslenie Geometryczne w Teorii Strategii Organizacji; Wydawnictwo Uniwersytetu Gdanskiego:
Gdansk, Poland, 2013. (In Polish)52. Hakansson, H.; Ford, D. How should companies interact in business networks? J. Bus. Res. 2002, 55, 133–139.
[CrossRef]53. Krzakiewicz, K. Zastosowanie podejscia sieciowego w zarzadzaniu strategicznym. In Organizacja i
Zarzadzanie; Zeszyt piecdziesiaty drugi, Zeszyty naukowe nr 1147; Politechnika Łódzka: Łódz, Poland, 2013.(In Polish)
54. Cyfert, S. Granice Organizacji; Wydawnictwo Uniwersytetu Ekonomicznego w Poznaniu: Poznan, Poland,2012. (In Polish)
55. Cyfert, S.; Krzakiewicz, K. Granice w swiecie sieciowych i wirtualnych organizacji. In Granice StrukturalnejZłozonosci Organizacji; Redakcja Naukowa Agnieszka Sopinski, Sylwester Gregorczyk; Oficyna Wydawnicza,Szkoła Główna Handlowa: Warszawa, Poland, 2014. (In Polish)
56. Zimniewicz, S. Orkiestracja sieci według Li & Fung Ltd. In Zarzadzanie Łancuchami Dostaw; Ciesielski, M.,Ed.; PWE: Warszawa, Poland, 2011. (In Polish)
57. Perechuda, K. Wirtualizacja procesów opartych na wiedzy podstawa nowoczesnego niewolnictwa. Noweparadygmaty i determinanty przestrzeni przepływów w przedsiebiorstwie sieciowym. In Wirtualizacja,Problemy, Wyzwania, Skutki; Zacher, L.W., Ed.; Poltext: Warszawa, Poland, 2013. (In Polish)
58. Goold, M.; Campbell, A. Structured Networks towards the Well-Designed Matrix. Long Range Plan. 2003, 36,427–439. [CrossRef]
59. Powell, W.W.; White, D.R. Network Dynamics and Field Evolution: The Growth of InterorganizationalCollaboration in the Life Sciences. Am. J. Sociol. 2005, 110, 1132–1205. [CrossRef]
60. Cygler, J.; Sroka, W. Structural pathologies in inter-organizational networks and their consequences.Procedia Soc. Behav. Sci. 2014, 110, 52–63. [CrossRef]
61. Stanczyk-Hugiet, E.; Gorgól, J. Elementy sieci miedzyorganizacyjnych–aspekty organizacyjno-zarzadcze.In Sieci Miedzyorganizacyjne. Współczesne Wyzwanie dla Teorii i Praktyki Zarzadzania; Niemczyk, J.,Stanczyk-Hugiet, E., Jasinski, B., Eds.; C.H. Beck: Warszawa, Poland, 2012. (In Polish)
62. Yuchtman, R.F.; Seashore, S. A system resource approach to organizationaleffectiveness. Am. Sociol. Rev.1967, 32, 891–903. [CrossRef]
63. Mitrega, M. Zdolnosci sieciowe małych i srednich przedsiebiorstwa a jakosc relacji z klientami. Handel Wewn.2010, 2, 27–32. (In Polish)
64. Zott, C.; Amit, R.; Massa, L. The Business Model: Theoretical Roots, Recent Developments, and FutureResearch. Available online: http://www.iese.edu/research/pdfs/DI-0862-E.pdf (accessed on June 2010).
65. Wirtz, B.W. Business Model Management Design–Instrumente–Erfolgsfaktoren von Geschäftsmodellen; GablerVerlag/Springer Fachmedien Wiesbaden GmbH: Berlin, Germany, 2011.
66. Teece, D.J. Business Models, Business Strategy and Innovation. Long Range Plan. 2010, 43, 172–194. [CrossRef]67. Obłój, K. Pasja i Dyscyplina Strategii, Jak z Marzen i Decyzji Zbudowac Sukces Firmy; Poltext: Warszawa, Poland,
2010. (In Polish)68. Gołebiowski, T.; Dudzik, T.M.; Lewandowska, M.; Witek-Hajduk, M. Modele Biznesu Polskich Przedsiebiorstw;
Szkoła Główna Handlowa: Warszawa, Poland, 2008. (In Polish)69. Timmers, P. Electronic Commerce: Strategies and Models from Business-to-Business Trading; Wiley & Sons:
Chichester, UK, 1999.
212
Sustainability 2016, 8, 194
70. Rappa, M. Managing the Digital Enterprise: Business Models on the Web, 2002, Retrieved May 14. Availableonline: http://digitalenterprise.org/models/models.html (accessed on 14 May 2002).
71. Applegate, L.M. E-Business Models: Making Sense of the Internet Business Landscape. In InformationTechnology and the New Enterprise: Future Models for Managers; Applegate, L.M., Dickson, G.W., DeSanctis, G.,Eds.; Prentice Hall: Upper Saddle River, NJ, USA, 2000.
72. Slyvotzky, A.J.; Morrison, D.J.; Andelman, B. Strefa Zysku; PWE: Warszawa, Poland, 2000.73. Osterwalder, A.; Pigneur, Y. An e-Business Model Ontology for Modeling e-Business. In Proceedings of the
15th Bled Electronic Commerce Conference e-Reality: Constructing the e-Economy, Bled, Slovenia, 17–19June 2002.
74. Bossidy, L.; Charan, R. Szósty Zmysł w Zarzadzaniu Firma. Tworzenie Wykonalnych Planów i Modeli Biznesowych;MT Biznes: Warszawa, Poland, 2010. (In Polish)
75. Niemczyk, J. Modele biznesowe. In Zarzadzanie. Kanony i Trendy; Morawski, M., Niemczyk, J., Perechuda, K.,Stanczyk-Hugiet, E., Eds.; Beck, C.H.: Warszawa, Poland, 2010. (In Polish)
76. Seddon, P.B.; Lewis, G.P.; Freeman, P.; Shanks, G. The Case for Viewing Business Models as Abstractions ofStrategy. Commun. Assoc. Inform. Syst. 2004, 13, 426–442.
77. De Witt, B.; Meyer, R. Synteza Strategii, Tworzenie Strategii Konkurencyjnej Przez Tworzenie Paradoksów; PolskieWydawnictwo Ekonomiczne: Warszawa, Poland, 2007.
78. Hoque, F. The Alignment Effect: How to Get Real Business Value Out of Technology; Financial Times PrenticeHall: Upper Saddle River, NJ, USA, 2002.
79. Jabłonski, A. Modele biznesu w sektorach pojawiajacych sie i schyłkowych. In Tworzenie PrzewagiKonkurencyjnej Przedsiebiorstwa Opartej na Jakosci i Kryteriach Ekologicznych; Wydawnictwo Wyzszej SzkołyBiznesu w Dabrowie Górniczej: Dabrowa Górnicza, Poland, 2008. (In Polish)
80. Jabłonski, A.; Jabłonski, M. Projektowanie sieciowych modeli biznesu. Ekonomika i OrganizacjaPrzedsiebiorstwa. 2013, 12, 29–39. (In Polish)
81. Cyfert, S.; Krzakiewicz, K. Wykorzystanie koncepcji modeli biznesu w zasobowej teorii firmy. In RozwójSzkoły Zasobowej Zarzadzania Strategicznego; Krupskiego, R., Ed.; Prace Naukowe Wałbrzyskiej WyzszejSzkoły Zarzadzania i Przedsiebiorczosci: Wałbrzych, Poland, 2011. (In Polish)
82. Demil, B.; Lecocq, X. Business model evolution: In search of dynamic consistency. Long Range Plan. 2010, 43,2–3. [CrossRef]
83. Sandberg, K.D. Is It Time to Trade In Your Business Model? Harvard University Update 2002.84. Afuah, A.; Tucci, C. Biznes Internetowy Strategie i Modele; Oficyna ekonomiczna: Kraków, Czech Republic,
2003. (In Polish)85. Nogalski, B. Modele biznesu jako narzedzia reorientacji strategicznej przedsiebiorstw. MBA 2009, 2, 3–14.86. Deodhar, S.J.; Saxena, K.; Gupta, R.K.; Ruohonen, M. Strategies for software-based hybrid business models.
J. Strateg. Inform. Syst. 2012, 21, 274–294. (In Polish) [CrossRef]87. Jabłonski, A. Spójnosc Hybrydy Strategicznej w Srodowisku Sieciowym; Difin: Warszawa, Poland, 2015.
(In Polish)88. Stubbs, W.; Cocklin, C. Conceptualizing a “sustainability business model”. Org. Environ. 2008, 21, 103–127.
[CrossRef]89. Boons, F.; Lüdeke-Freund, F. Business models for sustainable innovation: State of the art and steps towards a
research agenda. J. Clean. Prod. 2013, 45, 9–19. [CrossRef]90. Jabłonski, A. Modele Zrównowazonego Biznesu w Budowie Długoterminowej Wartosci Przedsiebiorstw z
Uwzglednieniem ich Społecznej Odpowiedzialnosci; Difin: Warszawa, Poland, 2013. (In Polish)91. Neely, A.; Delbridge, R. Effective Business Models: What Do They Mean for Whitehall. 2007. Available
online: http://www.nationalschool.gov.uk/sunningdaleiinstitute.92. Epstein, M.J.; Rejc Buhovac, A. Solving the sustainability implementation challenge. Org. Dyn. 2010, 39,
306–315. [CrossRef]93. Dyllick, T.; Hockerts, K. Beyond the business case for corporate sustainability. Bus. Strategy Environ. 2002, 11.
[CrossRef]94. Mc Donough, W.; Braugnart, M. The next industrial revolution. The Atlantic Monthly, October 1998.
213
Sustainability 2016, 8, 194
95. Daud Ahmed, M.; Sundaram, D. Sustainability modelling and reporting: From roadmap to implementation.Decis. Support Syst. 2012, 53, 611–624. [CrossRef]
96. Yunus, M.; Moingeon, B.; Lehman-Ortega, L. Biulding Social Business Models: Lessons from the GrameenExperience. Long Range Plann. 2010, 43, 308–325. [CrossRef]
97. Kotler, P.; Kartajaya, H.; Setiawan, I. Marketing 3.0, Dobry produkt? Zadowolony klient? Spełniony Człowiek!;MT Biznes: Warszawa, Poland, 2010. (In Polish)
98. Nogalski, B. Idea strategii “błekitnego oceanu” w rozwiazywaniu kluczowych problemów polskichprzedsiebiorstw w zakresie zarzadzania. In Ku Nowym Paradygmatom Nauk o Zarzadzaniu, Praca Zbiorowa podRedakcja J. Rokity, Wydawnictwo Górnoslaskiej Wyzszej Szkoły Handlowej im; Wojciecha Korfantego: Katowice,Poland, 2008. (In Polish)
99. Osterwalder, A.; Pigneur, Y. Aligning Profit and Purpose through Business Model Innovation. In ResponsibleManagement Practices for the 21 Century; Palazzo, G., Wentland, M., Eds.; Pearson Education France: Paris,France, 2011.
100. Schaltegger, S.; Lüdeke-Freund, F.; Hansen, E. Business Cases for Sustainability: The Role of Business ModelInnovation for Corporate Sustainability. Int. J. Innov. Sustain. Dev. 2012, 6, 95–119. [CrossRef]
101. Schwarz, P. Organisation in Nonprofit-Organisationen, Grundlagen, Strukturen; Haupt Verlag: Bern,Switzerland, 2005.
102. Grudzewski, W.M.; Hejduk, I.K.; Sankowska, A.; Wantuchowicz, M. Zarzadzanie Zaufaniem w OrganizacjachWirtualnych; Difin: Warszawa, Poland, 2007. (In Polish)
103. Abidin, N.Z.; Pasquire, C.L. Revolutionize value management: A mode towards sustainability.Int. J. Proj. Manag. 2007, 25, 275–282. [CrossRef]
104. Ultsch, A. The Integration of Connectionist Models with Knowledge-Based Systems: Hybrid Systems.In Proceedings of the IEEE SMC 98 International Conference, San Diego, CA, USA, 14 October 1998.
105. Grassl, W. Business Models of Social Enterprise: A Design Approach to Hybridity. ACRN J. Entrep. Perspect.2012, 1, 37–60.
106. Brozek, K.O. Exploring the Continuum of Social and Financial Returns: When Does a Nonprofit Become aSocial Enterprise? Community Dev. Invest. Rev. 2009, 5, 7–17.
107. Boyd, B.; Henning, N.; Reyna, E.; Wang, D.E.; Welch, M.D. Hybrid Organizations: New Business Models forEnvironmental Leadership; Greenleaf: Sheffield, UK, 2009.
108. Brandsen, T.; Van de Donk, W.; Putters, K. Griffins or Chameleons? Hybridity as a Permanent and InevitableCharacteristic of the Third Sector. Int. J. Public Admin. 2005, 28, 9–10. [CrossRef]
109. Defourny, J.; Nyssens, M. Conceptions of Social Enterprise in Europe and the United States: Convergencesand Divergences. J. Soc. Entrep. 2010, 1, 32–53.
110. Billis, D. Hybrid Organizations and the Third Sector; Basingstoke: Palgrave, Macmillan, 2010.111. Alter, S.K. Social Enterprise Models and Their Mission and Money Relationships. In Social Entrepreneurship:
New Models of Sustainable Social Change; Nicholls, A., Ed.; Oxford University Press: Oxford, UK, 2006.112. Malki, S. Social Entrepreneurship and Complexity Models: Goldstein. Hazy Silberstang 2009.113. Bruni, L.S. Zamagni, Civil Economy: Efficiency, Equity, Public Happiness; Peter Lang: Bern, Switzerland, 2007.114. Becchetti, L.; Bruni, L.; Zamagni, S. Microeconomia: Scelte, Relazioni, Economiacivile; ilMulino: Bologna, Italy,
2011. (In Polish)115. Bruni, L. L’ethos del mercato. In Un’introduzioneaifondamentiantropologici e Relazio-nalidell’economia;
Mondadori: Milan Italy, 2010. (In Polish)116. Lusch, R.F.; Vargo, S.L. Service-dominant Logic: A Necessary Step. European. J. Mark. 2011, 45, 1298–1309.
[CrossRef]117. Ramírez, R. Value Co-Production: Intellectual Origins and Implications for Practice and Research.
Strateg. Manag. J. 1999, 20, 49–65.118. Payne, A.F.; Storbacka, K.; Frow, P. Managing the Co-Creation of Value. J. Acad. Mark. Sci. 2008, 36, 83–96.
[CrossRef]119. Lessig, L. Remix: Making Art and Commerce Thrive in the Hybrid Economy; Penguin Press: New York, NY,
USA, 2008.120. Ménard, C.; Gibbons, R.; Roberts, J. Hybrid Modes of Organization, Alliances, Joint Ventures, Networks, and
Other “Strange” Animals; Handbook of Organizational Economics, Princeton University Press: Princeton, NJ,USA, 2011.
214
Sustainability 2016, 8, 194
121. Haigh, N.; Hoffman, A.J. Hybrid organizations: The next chapter of sustainable business. Org. Dyn. 2012, 41,126–134. [CrossRef]
122. Santos, F. A Positive Theory of Social Entrepreneurship. J. Bus. Ethics 2012, 111, 335–351. [CrossRef]123. Pache, A.-C.; Santos, F. Inside the hybrid organization: Selective coupling as a response to competing
institutional logics. Acad. Manag. J. 2013, 56, 972–1001. [CrossRef]124. Santos, F.M.; Pache, A.-C.; Birkholz, C. Making Hybrids Work: Aligning business models and organizational
design for social entreprises. Calif. Manag. Rev. 2015, 57, 36–58. [CrossRef]125. Velamuri, V.K.; Neyer, A.K.; Möslein, K.M. Hybrid Value Creation, Understanding the Value
Creating Attributes, MKWI 2010–Integration von Produkt und Dienstleistung–Hybride Wertschöpfung.2003. Available online: http://webdoc.sub.gwdg.de/univerlag/ 2010/mkwi/03_ anwendungen/integration_ von_produkt_und_dienstleistung_-_ hybride_wertschoepfung/01_hybrid_value_creation.pdf(accessed on 19 February 2016).
126. Khare, A.; Huang, Y.; Doan, H.; Kanwal, M.S. A Fresh Graduate’s Guide to Software Development Tools andTechnologies. Available online: http://www.comp.nus.edu.sg/~seer/book/2e/Ch06.%20Scalability.pdf(accessed on 19 February 2016).
127. Menascé, D.A.; Virgilio Almeida, A.F. Challenges in Scaling E-Business Sites. In Proceedings of the 2000Computer Measurement Group Conference, Orlando, FL, USA, 10–15 December 2000.
128. Gunther, N.J. A general theory of computational scalability based on rational functions. 2008; arXiv:0808.1431.Available online: http://arxiv.org/abs/0808.1431 (accessed on 25 August 2008).
129. Gunther, N.J. Guerrilla Capacity Planning: A Tactical Approach to Planning for Highly Scalable Applications andServices, 1st ed.; Springer: Heidelberg, Germany, 2007.
130. Amit, R.; Zott, C. Value Creation in E-Business. Strateg. Manag. J. 2001, 22, 493–520. [CrossRef]131. Rappa, M.A. The utility business model and the future of computing services. IBM Syst. J. 2004, 43, 32–42.
[CrossRef]132. Bouwman, H.; MacInnes, I. Dynamic Business Model Framework for Value Webs. In Proceedings of the 39th
Annual Hawaii International Conference on System Sciences (HICSS2006), Kauai, HI, USA, 4–7 January 2006.133. Nielsen, C.; Morten, L. The Concept of Business Model Scalability. 2015. Available online: http://vbn.aau.dk/
files/208921589/BM_Scalability_WP.pdf (accessed on 30 December 2015).134. Björkdahl, J.; Holmén, M. Business model innovation–the challenges ahead. Int. J. Prod. Dev. 2013, 18,
213–215.135. Green, R. Scalable Business Model. 2014. Available online: http://www.briefing.com/ investor/
learning-center/general-concepts/scalable-business-models/ (accessed on 28 October 2014).136. Information taken from. Available online: http://www.forbes.com/sites/martinzwilling/2013/09/06/
10-tips-for-building-the-most-scalable-startup/ (accessed on 19 February 2016).137. WP3–E-Business Model Roadmap Deliverable 3.1 (Revised): “E-Factors Report Part 1: Overview, and
Current Trends on E-Business Models”, Task Leader: University of Jyväskylä (Finland). Available online:http://www.wi1.uni-muenster.de/wi/studies/archive/izi/ss05/E-FACTORS_D3_1.pdf (accessed on 19February 2016).
138. Blank, S.; Dorf, B. Podrecznik Startupu, Budowa Wielkiej Firmy krok po Kroku; Helion: Gliwice, Poland, 2013.139. Blank, S. Why the Lean Start-Up Changes Everything. Available online: https://hbr.org/2013/
05/ why-the-lean-start-up-changes-everything (accessed on 19 February 2016). (In Polish)140. Stabryła, A. Generalne formuły postepowania badawczego w procesie projektowania. Zeszyty Naukowe
Małopolskiej Wyzszej Szkoły Ekonomicznej w Tarnowie 2012, 1, 167–180. (In Polish)141. Jabłonski, A.; Jabłonski, M. System zarzadzania a atrybuty modeli biznesu. Probl. Jakosci. 2014, 4, 26–30.142. Moore, G.E. Cramming more components onto integrated circuits. Electron. Maga. 1965, 38, 82–85. (In Polish).
[CrossRef]143. Ragin, C.C. The comparative method. In Moving Beyond Qualitative and Quantitative Strategies; University of
California Press: Berkeley, CA, USA, 1987.144. Rohwer, G. Qualitative comparative analysis: A discussion of interpretations. Eur. Sociol. Rev. 2010.
[CrossRef]
215

Sustainability 2016, 8, 194
145. Osterwalder, A.; Pigneur, Y.; Tucci, C.L. Clarifying business models: Origins, present, and future of theconcept. Commun. AIS 2005, 16, 1–25.
146. Osterwalder, A. The Business Model Ontology a Proposition in a Design Science Approach, Licenciéen Sciences Politiques de l’Université de Lausanne Diplômé postgrade en Informatique et Organisation(DPIO)de l’Ecole des HEC de l’Université de Lausanne Pour l’obtention du grade de Docteuren Informatique de Gestion. 2004. Available online: http://www.hec.unil.ch/aosterwa/PhD/Osterwalder_PhD_BM_Ontology.pdf (accessed on 19 February 2016). (In Polish)
© 2016 by the author. Licensee MDPI, Basel, Switzerland. This article is an open accessarticle distributed under the terms and conditions of the Creative Commons Attribution(CC BY) license (http://creativecommons.org/licenses/by/4.0/).
216
sustainability
Article
The Effect of the Internal Side of SocialResponsibility on Firm Competitive Successin the Business Services Industry
M. Isabel Sánchez-Hernández 1, Dolores Gallardo-Vázquez 2, Agnieszka Barcik 3
and Piotr Dziwinski 4,*
1 Business Administration and Sociology Department, School of Economics, University of Extremadura,Ave. Elvas s/n, Badajoz 06006, Spain; [email protected]
2 Financial Economics and Accountancy Department, School of Economics, University of Extremadura,Ave. Elvas s/n, Badajoz 06006, Spain; [email protected]
3 Department of Management and Transport, University of Bielsko-Biała, Willowa 2,Bielsko-Biala 43-309, Poland; [email protected]
4 Department of Law and Administration, The University of Dabrowa Górnicza, Cieplaka 1c,Dabrowa Górnicza 43-300, Poland
* Correspondence: [email protected]; Tel.: +48-606-113-729
Academic Editor: Adam JabłonskiReceived: 27 December 2015; Accepted: 14 February 2016; Published: 18 February 2016
Abstract: This work focuses on the internal side of social responsibility of organizations in a regionalcontext. Through a survey of 590 managers in classical business services (human-capital intensive)and representative of the productive economy of the Region of Extremadura (Spain), an empiricalanalysis is conducted. First, a factor analysis is conducted to explore the main dimensions of theinternal face of Social Responsibility and second, a structural equations model is developed to lookfor a relationship with business competitiveness. Business performance and innovation are alsoconsidered in the model. The main contribution of the article is the establishment of a set of indicatorsthat will help to build an ongoing and meaningful dialogue with employees improving their quality oflife at work that will also serve as important guidance for the increasing of the firm’s competitivenessthrough responsible human resources practices. Some suggestions for a research agenda emerge fromthis first attempt to approach the internal side of responsibility in business.
Keywords: human recources management (HRM); internal social responsibility (ISR); service sector;social responsibility (SR)
1. Introduction
The rise of service economy has been the predominant pattern over the last few years [1–3].We know a great deal about the organization and management of Social Responsibility (SR) andthe link with Human Resources Management (HRM), but comparatively little about how applicablethis is to the service sector. In this work, we identify the components of the internal side of SocialResponsibility in the services industry.
Freeman [4] gave a broad definition of stakeholders as any group or individual who can affector is affected by the achievement of the organization’s objectives. This author also highlights howstakeholders are simply constituents within and outside the organization, who have a stake in anorganization’s functioning and outcomes. The well-known Stakeholder Theory offers an instrumentalvalue in providing a framework for guiding the actions of organizational members to ensure that therelationships that contribute to their financial viability are managed responsibly [5,6]. Some authors
Sustainability 2016, 8, 179; doi:10.3390/su8020179 www.mdpi.com/journal/sustainability217
Sustainability 2016, 8, 179
refer to the moral claim on the actions of the firms to define the stakeholders [7] such as consumers,employees, competitors, suppliers, government, as well as other actors in society. It is evident that thefirm responds to multiple stakeholders for different reasons and in various ways [8,9].
According to the Stakeholder Theory, it is generally recognized that Social Responsibility (SR) hastwo dimensions: the external dimension and the internal one. On the one hand, the external dimensionof SR is reflected in a large relationship of organizations with their communities. Companies interactwith their external stakeholders when they provide business operations by guaranteeing economicactivity, tax revenues, investing in the local economic system, concluding contracts with the localdistributors, respecting human rights, and encouraging protection activities on environment byconsidering environmental concerns in business operations. On the other hand, the understudiedinternal side of SR has the emphasis on employees. Mason and Simmons [10] say that employeesexpect SR values similar to other stakeholders, arguing that employees seek functional, economic,psychological, and ethical benefits from their employing organizations. In this sense, if employersprovide challenging, stimulating and fulfilling work, some functional benefits will be obtained and itwill also be perceived as indicative of a socially responsible employer and a main driver of InternalSocial Responsibility (ISR) practices [11,12].
In general terms, SR has been considered to be “an organization’s obligation to maximize itspositive impact on stakeholders and to minimize its negative impact” [13]. However, the heterogeneityof definitions has been highlighted by Matten and Moon [14], (p.405) when they said “SR is an umbrellaterm overlapping with some, and being synonymous with other, conceptions of business-societyrelation”. According to the renewed definition by the European Commission, SR is the responsibilityof enterprises for their impacts on society with reference to collaborate with stakeholders "to integratesocial, environmental and ethical concerns, respect for human rights and consumer concerns into theirbusiness operations and their core strategy” [15] (p.7). Taking into account that classical organizationalboundaries have become obsolete because “what once was ‘outside’ the organization is now ‘inside’and vice versa” [16] (p.449) we found in this fact a fundamental reason for the emergence of the internalface of SR. Nowadays, the external side of SR and the internal one are more related than ever showinghigher interconnectivity as have been shown by Sánchez-Hernández and Grayson [17]. According tothis work, companies should discover the social and environmental potential of employees in orderto integrate their interests and skills into the overall SR efforts. This will be the way to internalizea Social Responsible Strategy within the organization creating dynamic capabilities likely to lead tocompetitive advantages. The interaction of Strategy and HRM issues [18] explains how employeesare important to a firm’s success. According to the Resource-Based Theory (RBT) of the firm, humancapital is a key factor explaining performance differences across firms [19]. In this respect, Crook [20]has pointed out the importance of “specific” employees, referring to the best and brightest humancapital available in the labor market, to achieve high performance. Shoemaker [16] argued that treatingHRM and SR separately is an outdated approach because organizations develop towards open systemswhere cooperative action is based on the willingness of employees to bring in and expand their talentsas part of communities of work.
Despite the huge academic literature devoted to SR, literature about ISR is surprisingly scarceand empirical studies are inexistent as far as we know. However, the need for real improvement inorganizational capability for doing well, and also for doing well in respect to stakeholders, as a basis forcompetitive strategy and competitive advantage, has received widespread attention in the academicand professional management literature [21]. In addition, competitive advantage is increasinglyachieved through the mobilization of the accumulated know-how of individual employees to createvalue through processes that are not easily imitable [22]. Consequently, ISR has to be analyzed for oneimportant reason: because employees are stakeholders able to create social value for the companymediating between the company and the consumers.
Worried about the under-studied internal side of SR, this work focuses upon regional businessesin Extremadura (Autonomous Region in the southwest of Spain) interacting with the local community
218
Sustainability 2016, 8, 179
by investing in the regional economic system, contracting with the local distributors, taking intoaccount environmental concerns (external side of SR) and also recruiting employees, guaranteeingjobs, wages, training, and employees quality of life (the internal one).
The paper exposes what could be considered socially responsible management of humanresources, called sustainable HRM—what actions related to human capital any organization couldperform to state that employees’ management is sustainable. In previous work, the authors havedeveloped and empirically validated an SR scale in the regional context of study [23]. Now, we addressinternal practices considered sustainable in academic management literature by isolating the internalaspects of the general scale mentioned. For the definition of indicators that reflect these actions, wehave covered several areas. All of them include some determinants of pleasant working conditions,and are oriented to the pursuit of social welfare [24–29].
There are many different areas that could be addressed. Thus, we start to refer to the actionsdevoted to support the employment of people at risk of social exclusion [30,31] and, at the same time,the fact that the company values the contribution of disabled people to the business world [32–34].Moreover, the interest in the employee’s quality of life [29,35], the importance of payments of wagesabove the industry average and the existence of pension plans [36,37], or the fact that employeecompensation will be related to their skills and results [38,39], are aspects that determine a responsiblemanagement into the organization. We can add the standards of health and safety beyond the legalminimum (because every company has to fulfill the law) [40], the commitment with the job creation [41]and the training and development programs for employees [32,42]. In addition, it is important toconsider the conciliation of professional and personal lives [43,44] and the equal opportunities forall employees [32,42,45–47]. In the line of social commitment, the participation of the organization insocial projects [48,49] and the organization of volunteer activities in collaboration with NGOs [49,50],define new responsible actions in management.
Moreover, to be responsible, the organization must have dynamic mechanisms of dialogue withemployees. In this respect, Preuss and others [51] conclude after some case study analyses thatdialogue with employee representatives and trade unions could play an active role in SR and, in somecases, even a pivotal one. While the company is doing SR actions, it must raise awareness and informemployees on SR and the actions committed. Finally, the fact that the organization was an activemember of any association that promotes the implementation of SR, as could be the case of the UnitedNations Global Compact for instance, is considered very important [52].
After this theoretical introduction, employees could be considered the center of any responsiblebusiness. European firms pursue SR for concerns of stakeholders such as government, regulatorybodies, customers or pressure groups. This is the external SR orientation. However, the aim of thispaper is to study the ISR of organizations. In this sense, we say that SR behavior and values shouldalso include internal aspects of management related to intra-organizational elements, organizationalcapabilities and HRM. As follows, through a survey of managers, we first carry on a factor analysisto explore the main dimensions of the ISR. Once the multidimensionality of this new construct isempirically determined, interpreted, and understood, the empirical analysis continues by lookingfor a relationship between ISR and business competitiveness. The work finishes with conclusions,limitations of the study, and lines of research for the near future.
2. Method
2.1. Sample and Procedure
The information for this investigation was collected from business services managers in theAutonomous Community of Extremadura, in southwestern Spain. The broad argument to chooseservices in this work is that the match between HRM and SR strategy should be greater in services thanin manufacturing, highlighting the internal side of SR. According to Legge [53], services are competingin the knowledge-based economy. Services are used to characterize high skilled people and high cost
219
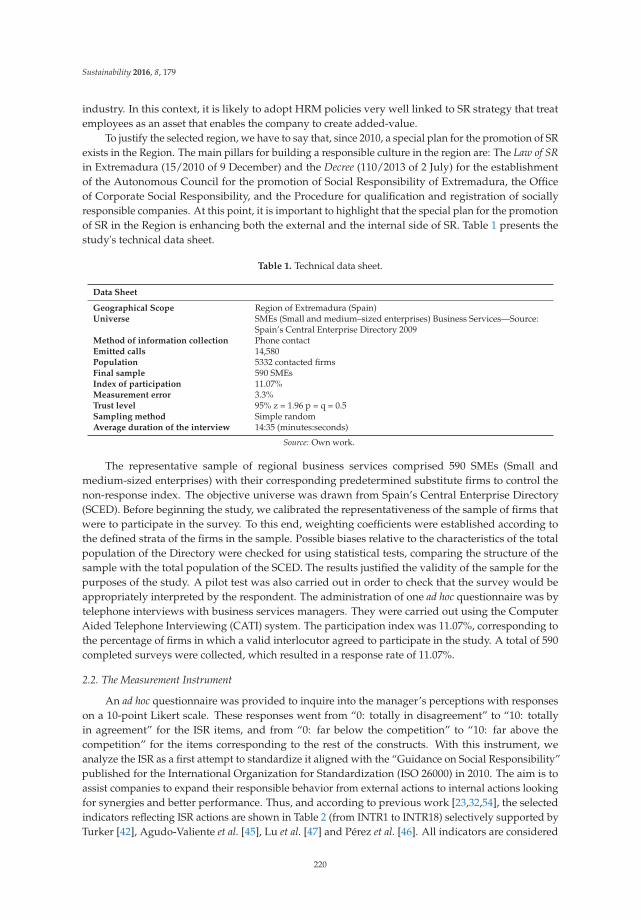
Sustainability 2016, 8, 179
industry. In this context, it is likely to adopt HRM policies very well linked to SR strategy that treatemployees as an asset that enables the company to create added-value.
To justify the selected region, we have to say that, since 2010, a special plan for the promotion of SRexists in the Region. The main pillars for building a responsible culture in the region are: The Law of SRin Extremadura (15/2010 of 9 December) and the Decree (110/2013 of 2 July) for the establishmentof the Autonomous Council for the promotion of Social Responsibility of Extremadura, the Officeof Corporate Social Responsibility, and the Procedure for qualification and registration of sociallyresponsible companies. At this point, it is important to highlight that the special plan for the promotionof SR in the Region is enhancing both the external and the internal side of SR. Table 1 presents thestudy's technical data sheet.
Table 1. Technical data sheet.
Data Sheet
Geographical Scope Region of Extremadura (Spain)Universe SMEs (Small and medium–sized enterprises) Business Services—Source:
Spain’s Central Enterprise Directory 2009Method of information collection Phone contactEmitted calls 14,580Population 5332 contacted firmsFinal sample 590 SMEsIndex of participation 11.07%Measurement error 3.3%Trust level 95% z = 1.96 p = q = 0.5Sampling method Simple randomAverage duration of the interview 14:35 (minutes:seconds)
Source: Own work.
The representative sample of regional business services comprised 590 SMEs (Small andmedium-sized enterprises) with their corresponding predetermined substitute firms to control thenon-response index. The objective universe was drawn from Spain’s Central Enterprise Directory(SCED). Before beginning the study, we calibrated the representativeness of the sample of firms thatwere to participate in the survey. To this end, weighting coefficients were established according tothe defined strata of the firms in the sample. Possible biases relative to the characteristics of the totalpopulation of the Directory were checked for using statistical tests, comparing the structure of thesample with the total population of the SCED. The results justified the validity of the sample for thepurposes of the study. A pilot test was also carried out in order to check that the survey would beappropriately interpreted by the respondent. The administration of one ad hoc questionnaire was bytelephone interviews with business services managers. They were carried out using the ComputerAided Telephone Interviewing (CATI) system. The participation index was 11.07%, corresponding tothe percentage of firms in which a valid interlocutor agreed to participate in the study. A total of 590completed surveys were collected, which resulted in a response rate of 11.07%.
2.2. The Measurement Instrument
An ad hoc questionnaire was provided to inquire into the manager’s perceptions with responseson a 10-point Likert scale. These responses went from “0: totally in disagreement” to “10: totallyin agreement” for the ISR items, and from “0: far below the competition” to “10: far above thecompetition” for the items corresponding to the rest of the constructs. With this instrument, weanalyze the ISR as a first attempt to standardize it aligned with the “Guidance on Social Responsibility”published for the International Organization for Standardization (ISO 26000) in 2010. The aim is toassist companies to expand their responsible behavior from external actions to internal actions lookingfor synergies and better performance. Thus, and according to previous work [23,32,54], the selectedindicators reflecting ISR actions are shown in Table 2 (from INTR1 to INTR18) selectively supported byTurker [42], Agudo-Valiente et al. [45], Lu et al. [47] and Pérez et al. [46]. All indicators are considered
220
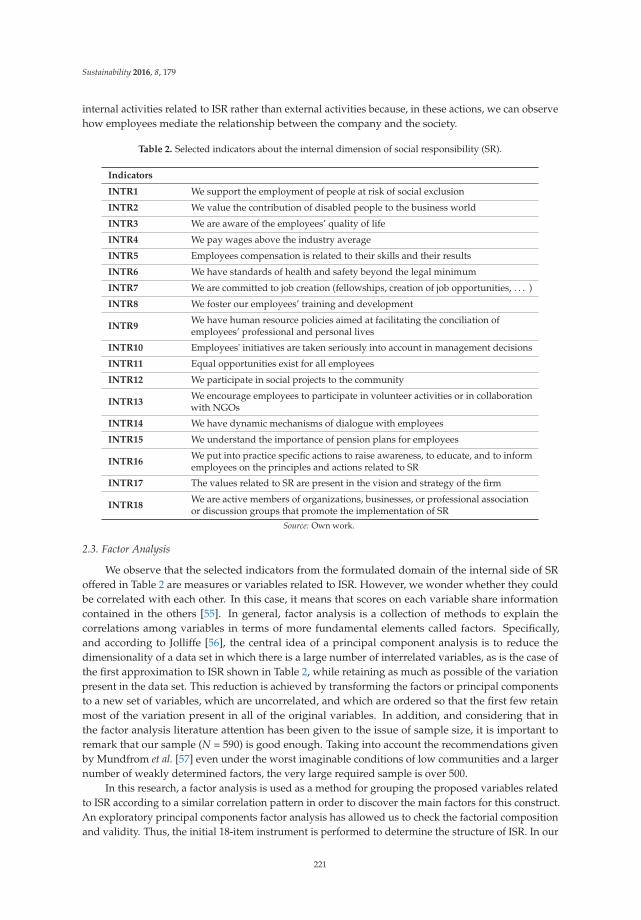
Sustainability 2016, 8, 179
internal activities related to ISR rather than external activities because, in these actions, we can observehow employees mediate the relationship between the company and the society.
Table 2. Selected indicators about the internal dimension of social responsibility (SR).
Indicators
INTR1 We support the employment of people at risk of social exclusion
INTR2 We value the contribution of disabled people to the business world
INTR3 We are aware of the employees’ quality of life
INTR4 We pay wages above the industry average
INTR5 Employees compensation is related to their skills and their results
INTR6 We have standards of health and safety beyond the legal minimum
INTR7 We are committed to job creation (fellowships, creation of job opportunities, . . . )
INTR8 We foster our employees’ training and development
INTR9We have human resource policies aimed at facilitating the conciliation ofemployees’ professional and personal lives
INTR10 Employees' initiatives are taken seriously into account in management decisions
INTR11 Equal opportunities exist for all employees
INTR12 We participate in social projects to the community
INTR13We encourage employees to participate in volunteer activities or in collaborationwith NGOs
INTR14 We have dynamic mechanisms of dialogue with employees
INTR15 We understand the importance of pension plans for employees
INTR16We put into practice specific actions to raise awareness, to educate, and to informemployees on the principles and actions related to SR
INTR17 The values related to SR are present in the vision and strategy of the firm
INTR18We are active members of organizations, businesses, or professional associationor discussion groups that promote the implementation of SR
Source: Own work.
2.3. Factor Analysis
We observe that the selected indicators from the formulated domain of the internal side of SRoffered in Table 2 are measures or variables related to ISR. However, we wonder whether they couldbe correlated with each other. In this case, it means that scores on each variable share informationcontained in the others [55]. In general, factor analysis is a collection of methods to explain thecorrelations among variables in terms of more fundamental elements called factors. Specifically,and according to Jolliffe [56], the central idea of a principal component analysis is to reduce thedimensionality of a data set in which there is a large number of interrelated variables, as is the case ofthe first approximation to ISR shown in Table 2, while retaining as much as possible of the variationpresent in the data set. This reduction is achieved by transforming the factors or principal componentsto a new set of variables, which are uncorrelated, and which are ordered so that the first few retainmost of the variation present in all of the original variables. In addition, and considering that inthe factor analysis literature attention has been given to the issue of sample size, it is important toremark that our sample (N = 590) is good enough. Taking into account the recommendations givenby Mundfrom et al. [57] even under the worst imaginable conditions of low communities and a largernumber of weakly determined factors, the very large required sample is over 500.
In this research, a factor analysis is used as a method for grouping the proposed variables relatedto ISR according to a similar correlation pattern in order to discover the main factors for this construct.An exploratory principal components factor analysis has allowed us to check the factorial compositionand validity. Thus, the initial 18-item instrument is performed to determine the structure of ISR. In our
221
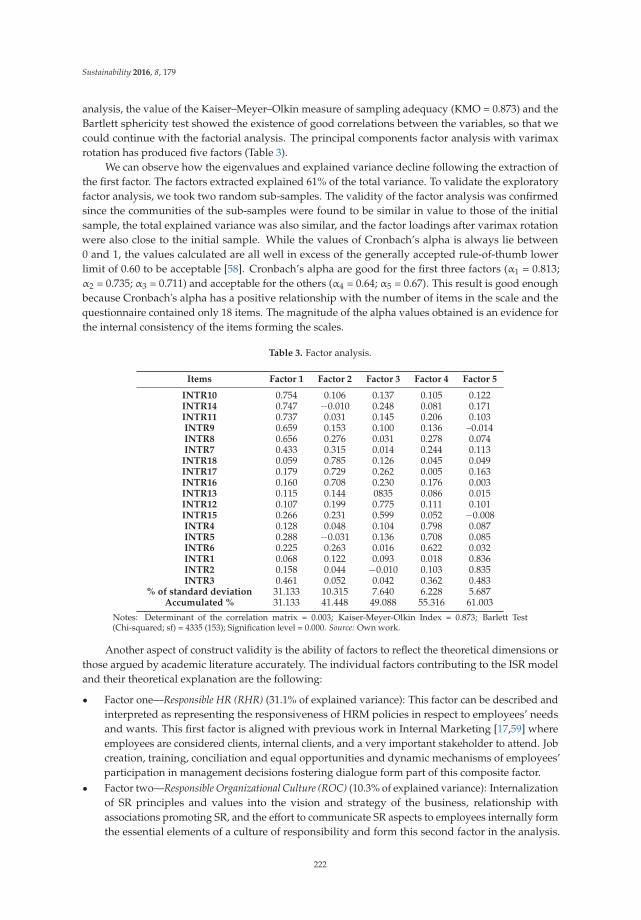
Sustainability 2016, 8, 179
analysis, the value of the Kaiser–Meyer–Olkin measure of sampling adequacy (KMO = 0.873) and theBartlett sphericity test showed the existence of good correlations between the variables, so that wecould continue with the factorial analysis. The principal components factor analysis with varimaxrotation has produced five factors (Table 3).
We can observe how the eigenvalues and explained variance decline following the extraction ofthe first factor. The factors extracted explained 61% of the total variance. To validate the exploratoryfactor analysis, we took two random sub-samples. The validity of the factor analysis was confirmedsince the communities of the sub-samples were found to be similar in value to those of the initialsample, the total explained variance was also similar, and the factor loadings after varimax rotationwere also close to the initial sample. While the values of Cronbach’s alpha is always lie between0 and 1, the values calculated are all well in excess of the generally accepted rule-of-thumb lowerlimit of 0.60 to be acceptable [58]. Cronbach’s alpha are good for the first three factors (α1 = 0.813;α2 = 0.735; α3 = 0.711) and acceptable for the others (α4 = 0.64; α5 = 0.67). This result is good enoughbecause Cronbach's alpha has a positive relationship with the number of items in the scale and thequestionnaire contained only 18 items. The magnitude of the alpha values obtained is an evidence forthe internal consistency of the items forming the scales.
Table 3. Factor analysis.
Items Factor 1 Factor 2 Factor 3 Factor 4 Factor 5
INTR10 0.754 0.106 0.137 0.105 0.122INTR14 0.747 ´0.010 0.248 0.081 0.171INTR11 0.737 0.031 0.145 0.206 0.103INTR9 0.659 0.153 0.100 0.136 –0.014INTR8 0.656 0.276 0.031 0.278 0.074INTR7 0.433 0.315 0.014 0.244 0.113INTR18 0.059 0.785 0.126 0.045 0.049INTR17 0.179 0.729 0.262 0.005 0.163INTR16 0.160 0.708 0.230 0.176 0.003INTR13 0.115 0.144 0835 0.086 0.015INTR12 0.107 0.199 0.775 0.111 0.101INTR15 0.266 0.231 0.599 0.052 ´0.008INTR4 0.128 0.048 0.104 0.798 0.087INTR5 0.288 ´0.031 0.136 0.708 0.085INTR6 0.225 0.263 0.016 0.622 0.032INTR1 0.068 0.122 0.093 0.018 0.836INTR2 0.158 0.044 ´0.010 0.103 0.835INTR3 0.461 0.052 0.042 0.362 0.483
% of standard deviation 31.133 10.315 7.640 6.228 5.687Accumulated % 31.133 41.448 49.088 55.316 61.003
Notes: Determinant of the correlation matrix = 0.003; Kaiser-Meyer-Olkin Index = 0.873; Barlett Test(Chi-squared; sf) = 4335 (153); Signification level = 0.000. Source: Own work.
Another aspect of construct validity is the ability of factors to reflect the theoretical dimensions orthose argued by academic literature accurately. The individual factors contributing to the ISR modeland their theoretical explanation are the following:
‚ Factor one—Responsible HR (RHR) (31.1% of explained variance): This factor can be described andinterpreted as representing the responsiveness of HRM policies in respect to employees’ needsand wants. This first factor is aligned with previous work in Internal Marketing [17,59] whereemployees are considered clients, internal clients, and a very important stakeholder to attend. Jobcreation, training, conciliation and equal opportunities and dynamic mechanisms of employees’participation in management decisions fostering dialogue form part of this composite factor.
‚ Factor two—Responsible Organizational Culture (ROC) (10.3% of explained variance): Internalizationof SR principles and values into the vision and strategy of the business, relationship withassociations promoting SR, and the effort to communicate SR aspects to employees internally formthe essential elements of a culture of responsibility and form this second factor in the analysis.
222
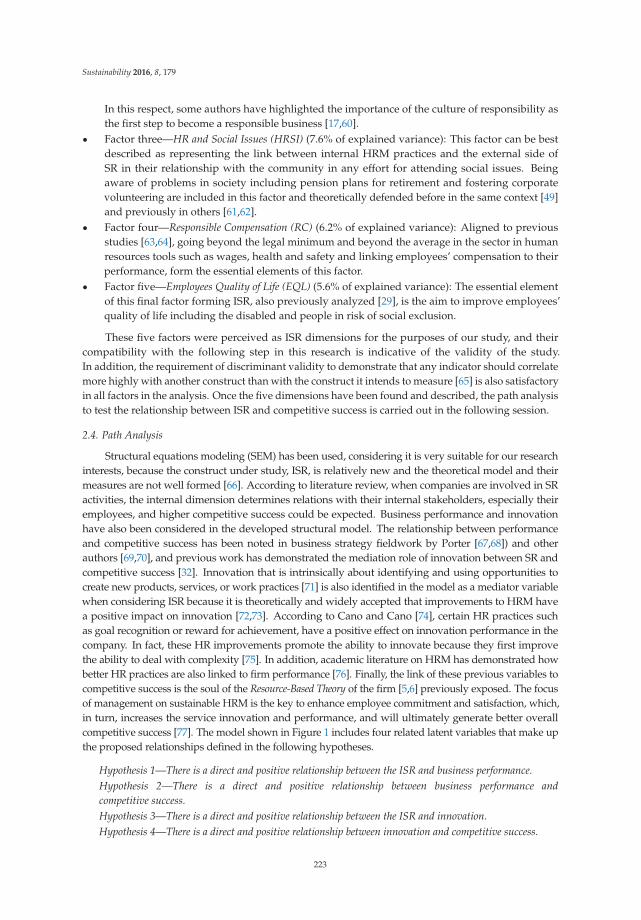
Sustainability 2016, 8, 179
In this respect, some authors have highlighted the importance of the culture of responsibility asthe first step to become a responsible business [17,60].
‚ Factor three—HR and Social Issues (HRSI) (7.6% of explained variance): This factor can be bestdescribed as representing the link between internal HRM practices and the external side ofSR in their relationship with the community in any effort for attending social issues. Beingaware of problems in society including pension plans for retirement and fostering corporatevolunteering are included in this factor and theoretically defended before in the same context [49]and previously in others [61,62].
‚ Factor four—Responsible Compensation (RC) (6.2% of explained variance): Aligned to previousstudies [63,64], going beyond the legal minimum and beyond the average in the sector in humanresources tools such as wages, health and safety and linking employees’ compensation to theirperformance, form the essential elements of this factor.
‚ Factor five—Employees Quality of Life (EQL) (5.6% of explained variance): The essential elementof this final factor forming ISR, also previously analyzed [29], is the aim to improve employees’quality of life including the disabled and people in risk of social exclusion.
These five factors were perceived as ISR dimensions for the purposes of our study, and theircompatibility with the following step in this research is indicative of the validity of the study.In addition, the requirement of discriminant validity to demonstrate that any indicator should correlatemore highly with another construct than with the construct it intends to measure [65] is also satisfactoryin all factors in the analysis. Once the five dimensions have been found and described, the path analysisto test the relationship between ISR and competitive success is carried out in the following session.
2.4. Path Analysis
Structural equations modeling (SEM) has been used, considering it is very suitable for our researchinterests, because the construct under study, ISR, is relatively new and the theoretical model and theirmeasures are not well formed [66]. According to literature review, when companies are involved in SRactivities, the internal dimension determines relations with their internal stakeholders, especially theiremployees, and higher competitive success could be expected. Business performance and innovationhave also been considered in the developed structural model. The relationship between performanceand competitive success has been noted in business strategy fieldwork by Porter [67,68]) and otherauthors [69,70], and previous work has demonstrated the mediation role of innovation between SR andcompetitive success [32]. Innovation that is intrinsically about identifying and using opportunities tocreate new products, services, or work practices [71] is also identified in the model as a mediator variablewhen considering ISR because it is theoretically and widely accepted that improvements to HRM havea positive impact on innovation [72,73]. According to Cano and Cano [74], certain HR practices suchas goal recognition or reward for achievement, have a positive effect on innovation performance in thecompany. In fact, these HR improvements promote the ability to innovate because they first improvethe ability to deal with complexity [75]. In addition, academic literature on HRM has demonstrated howbetter HR practices are also linked to firm performance [76]. Finally, the link of these previous variables tocompetitive success is the soul of the Resource-Based Theory of the firm [5,6] previously exposed. The focusof management on sustainable HRM is the key to enhance employee commitment and satisfaction, which,in turn, increases the service innovation and performance, and will ultimately generate better overallcompetitive success [77]. The model shown in Figure 1 includes four related latent variables that make upthe proposed relationships defined in the following hypotheses.
Hypothesis 1—There is a direct and positive relationship between the ISR and business performance.Hypothesis 2—There is a direct and positive relationship between business performance andcompetitive success.Hypothesis 3—There is a direct and positive relationship between the ISR and innovation.Hypothesis 4—There is a direct and positive relationship between innovation and competitive success.
223
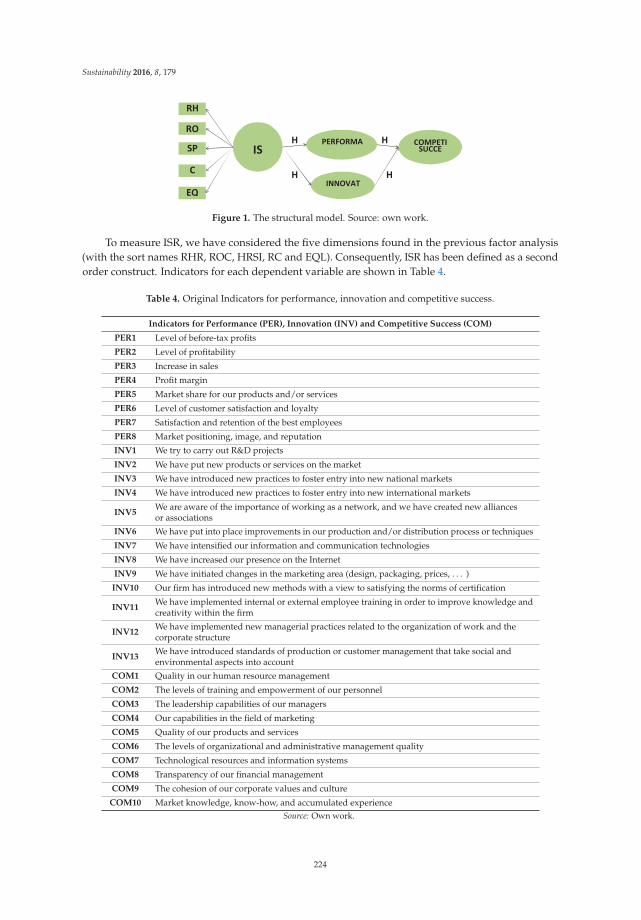
Sustainability 2016, 8, 179
PERFORMA
INNOVAT
COMPETISUCCE
RH
RO
SP
C
EQ
H H
H H
IS
Figure 1. The structural model. Source: own work.
To measure ISR, we have considered the five dimensions found in the previous factor analysis(with the sort names RHR, ROC, HRSI, RC and EQL). Consequently, ISR has been defined as a secondorder construct. Indicators for each dependent variable are shown in Table 4.
Table 4. Original Indicators for performance, innovation and competitive success.
Indicators for Performance (PER), Innovation (INV) and Competitive Success (COM)
PER1 Level of before-tax profits
PER2 Level of profitability
PER3 Increase in sales
PER4 Profit margin
PER5 Market share for our products and/or services
PER6 Level of customer satisfaction and loyalty
PER7 Satisfaction and retention of the best employees
PER8 Market positioning, image, and reputation
INV1 We try to carry out R&D projects
INV2 We have put new products or services on the market
INV3 We have introduced new practices to foster entry into new national markets
INV4 We have introduced new practices to foster entry into new international markets
INV5We are aware of the importance of working as a network, and we have created new alliancesor associations
INV6 We have put into place improvements in our production and/or distribution process or techniques
INV7 We have intensified our information and communication technologies
INV8 We have increased our presence on the Internet
INV9 We have initiated changes in the marketing area (design, packaging, prices, . . . )
INV10 Our firm has introduced new methods with a view to satisfying the norms of certification
INV11We have implemented internal or external employee training in order to improve knowledge andcreativity within the firm
INV12We have implemented new managerial practices related to the organization of work and thecorporate structure
INV13We have introduced standards of production or customer management that take social andenvironmental aspects into account
COM1 Quality in our human resource management
COM2 The levels of training and empowerment of our personnel
COM3 The leadership capabilities of our managers
COM4 Our capabilities in the field of marketing
COM5 Quality of our products and services
COM6 The levels of organizational and administrative management quality
COM7 Technological resources and information systems
COM8 Transparency of our financial management
COM9 The cohesion of our corporate values and culture
COM10 Market knowledge, know-how, and accumulated experienceSource: Own work.
224
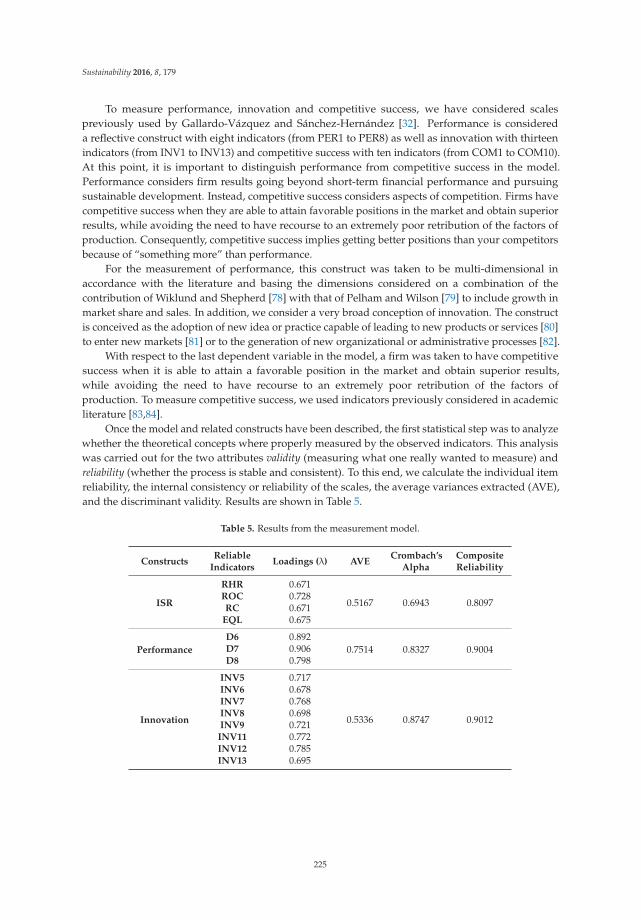
Sustainability 2016, 8, 179
To measure performance, innovation and competitive success, we have considered scalespreviously used by Gallardo-Vázquez and Sánchez-Hernández [32]. Performance is considereda reflective construct with eight indicators (from PER1 to PER8) as well as innovation with thirteenindicators (from INV1 to INV13) and competitive success with ten indicators (from COM1 to COM10).At this point, it is important to distinguish performance from competitive success in the model.Performance considers firm results going beyond short-term financial performance and pursuingsustainable development. Instead, competitive success considers aspects of competition. Firms havecompetitive success when they are able to attain favorable positions in the market and obtain superiorresults, while avoiding the need to have recourse to an extremely poor retribution of the factors ofproduction. Consequently, competitive success implies getting better positions than your competitorsbecause of “something more” than performance.
For the measurement of performance, this construct was taken to be multi-dimensional inaccordance with the literature and basing the dimensions considered on a combination of thecontribution of Wiklund and Shepherd [78] with that of Pelham and Wilson [79] to include growth inmarket share and sales. In addition, we consider a very broad conception of innovation. The constructis conceived as the adoption of new idea or practice capable of leading to new products or services [80]to enter new markets [81] or to the generation of new organizational or administrative processes [82].
With respect to the last dependent variable in the model, a firm was taken to have competitivesuccess when it is able to attain a favorable position in the market and obtain superior results,while avoiding the need to have recourse to an extremely poor retribution of the factors ofproduction. To measure competitive success, we used indicators previously considered in academicliterature [83,84].
Once the model and related constructs have been described, the first statistical step was to analyzewhether the theoretical concepts where properly measured by the observed indicators. This analysiswas carried out for the two attributes validity (measuring what one really wanted to measure) andreliability (whether the process is stable and consistent). To this end, we calculate the individual itemreliability, the internal consistency or reliability of the scales, the average variances extracted (AVE),and the discriminant validity. Results are shown in Table 5.
Table 5. Results from the measurement model.
ConstructsReliable
IndicatorsLoadings (λ) AVE
Crombach’sAlpha
CompositeReliability
ISR
RHR 0.671
0.5167 0.6943 0.8097ROC 0.728RC 0.671
EQL 0.675
Performance
D6 0.8920.7514 0.8327 0.9004D7 0.906
D8 0.798
Innovation
INV5 0.717
0.5336 0.8747 0.9012
INV6 0.678INV7 0.768INV8 0.698INV9 0.721
INV11 0.772INV12 0.785INV13 0.695
225
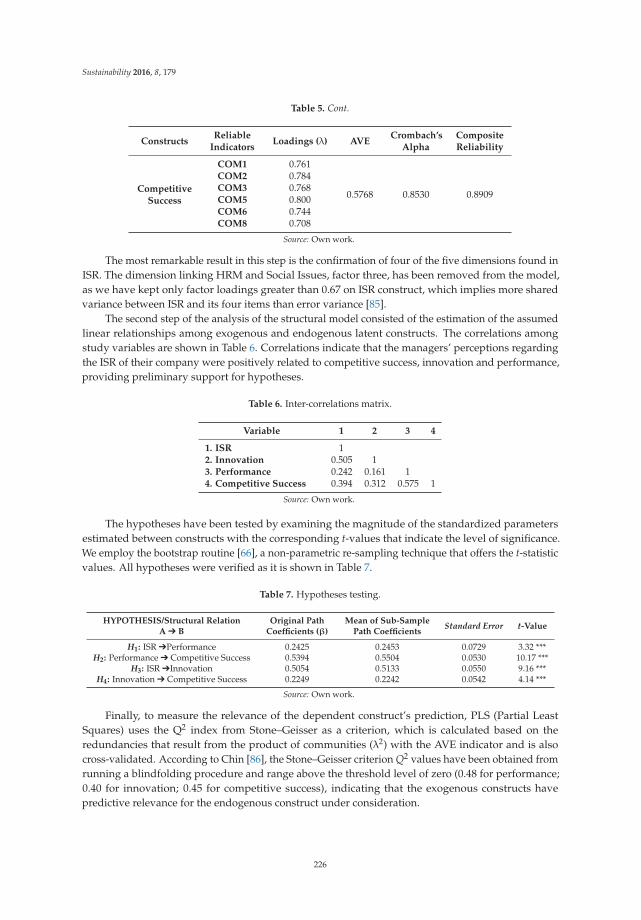
Sustainability 2016, 8, 179
Table 5. Cont.
ConstructsReliable
IndicatorsLoadings (λ) AVE
Crombach’sAlpha
CompositeReliability
CompetitiveSuccess
COM1 0.761
0.5768 0.8530 0.8909
COM2 0.784COM3 0.768COM5 0.800COM6 0.744COM8 0.708
Source: Own work.
The most remarkable result in this step is the confirmation of four of the five dimensions found inISR. The dimension linking HRM and Social Issues, factor three, has been removed from the model,as we have kept only factor loadings greater than 0.67 on ISR construct, which implies more sharedvariance between ISR and its four items than error variance [85].
The second step of the analysis of the structural model consisted of the estimation of the assumedlinear relationships among exogenous and endogenous latent constructs. The correlations amongstudy variables are shown in Table 6. Correlations indicate that the managers’ perceptions regardingthe ISR of their company were positively related to competitive success, innovation and performance,providing preliminary support for hypotheses.
Table 6. Inter-correlations matrix.
Variable 1 2 3 4
1. ISR 12. Innovation 0.505 13. Performance 0.242 0.161 14. Competitive Success 0.394 0.312 0.575 1
Source: Own work.
The hypotheses have been tested by examining the magnitude of the standardized parametersestimated between constructs with the corresponding t-values that indicate the level of significance.We employ the bootstrap routine [66], a non-parametric re-sampling technique that offers the t-statisticvalues. All hypotheses were verified as it is shown in Table 7.
Table 7. Hypotheses testing.
HYPOTHESIS/Structural RelationA � B
Original PathCoefficients (β)
Mean of Sub-SamplePath Coefficients
Standard Error t-Value
H1: ISR �Performance 0.2425 0.2453 0.0729 3.32 ***H2: Performance � Competitive Success 0.5394 0.5504 0.0530 10.17 ***
H3: ISR �Innovation 0.5054 0.5133 0.0550 9.16 ***H4: Innovation � Competitive Success 0.2249 0.2242 0.0542 4.14 ***
Source: Own work.
Finally, to measure the relevance of the dependent construct’s prediction, PLS (Partial LeastSquares) uses the Q2 index from Stone–Geisser as a criterion, which is calculated based on theredundancies that result from the product of communities (λ2) with the AVE indicator and is alsocross-validated. According to Chin [86], the Stone–Geisser criterion Q2 values have been obtained fromrunning a blindfolding procedure and range above the threshold level of zero (0.48 for performance;0.40 for innovation; 0.45 for competitive success), indicating that the exogenous constructs havepredictive relevance for the endogenous construct under consideration.
226
Sustainability 2016, 8, 179
3. Results and Discussion
While acknowledging that the regional context of the study puts limits on the generalization of ourfindings, we nonetheless see a number of interesting conclusions. The main contribution of the articleis the establishment of a set of indicators that define ISR as a result of a dynamic process that providesinformation about a firm's actions in responsible HRM. This article argues in favor of a strongerfocus upon the management of ISR policies and practices in enterprises. Our results show the mainfactors determining the ISR structure as they have been perceived by a big sample of services businessmanagers in the region under study. The obtained empirical evidence is a contribution to the SRresearch where there is a lack in studies devoted to the internal side. Therefore, this study contributesto the generation of knowledge on internal responsible behavior of companies. As demonstrated,ISR in service business, which is more influenced by human resources practices, is defined by fivewell-delimited dimensions such as: responsible human resources practices; organizational cultureof responsibility; social projects promotion; significant compensation policies and employee qualityof life. A point of interest that needs to be highlighted is the important role that HRM could playin the SR strategy of any business, an aspect that has been analyzed with the developed structuralequation model.
It has been demonstrated empirically that ISR has an effect on increasing the firm’scompetitiveness. The conceptual model has been tested empirically confirming the four hypothesesH1, H2, H3 and H4. Consequently, the model has been validated where innovation and performancehave the role of mediator variables between ISR and competitive success in accordance with previouswork in general SR [23,32], where ISR was not isolated from the holistic construct of firm responsibility.
4. Conclusions
Although an abundance of research exists on the general topic of SR, little has been runtoward identifying, or perhaps more importantly, measuring its internal aspects in business services.This investigation provides ample foundation for further research on this topic and contributes to abetter appreciation and understanding of the role of responsible HRM practices.
To conclude, it should be noted that results from the analysis should be interpreted for SMEs,overcoming the limitations coming from the regional context of study and also from the selection ofthe sample limited to the service sector, and limited to a single Spanish Autonomous Community.Consequently, our results are not directly extrapolated to other environments that differed greatly intheir defining variables. However, since the predominance of business services and the predominanceof SMEs are characteristic for the whole Spanish territory, and even the whole European Union, we canaccept the results satisfactorily. We believe that our study represents a substantial contribution to theknowledge of ISR, but, in the near future, qualitative and quantitative research should be done on thetopic. Managers have to be aware that one of the most important stakeholders the company has is theemployee. Employees have to be considered an internal client [59,87] and, consequently, SR shouldstart inside the company. In fact, we question whether there is sufficient focus upon investment inemployees, which could be regarded as an important driver of external SR practice [88].
Some suggestions for a research agenda emerge from this attempt to approach the internal side ofresponsibility in business. First, new studies in the same direction but in other sectors and regionshave to be addressed, and second, and related to SR and internal management, we suggest an analysisof the theoretical and hypothetical relationship between the internal and the external side of SR inorder to determine the direct effect in external SR fostered by responsible HR policies internally. In linewith other authors [59,89], we remark on the importance of internal marketing as a way to sell theresponsible company culture internally to employees to somehow help external SR to develop at thesame time that companies improve their competitive success. The more important the concept andpractice of ISR becomes, the more likely the companies will improve their competitive advantage.It should be taken as an important opportunity for the responsible reinvention of management.
227
Sustainability 2016, 8, 179
In conclusion, ISR and HRM are interrelated concepts influencing the business competitive success,and their effectiveness depends on responsible practices inside the spheres of the company.
Acknowledgments: Acknowledgments: The authors are grateful to all the managers in business services whoparticipated in the survey and contributed to the paper.
Author Contributions: Author Contributions: M. Isabel Sánchez-Hernandez designed the research, analyzedthe data and wrote the manuscript, Dolores Gallardo-Vázquez collected data and performed research, AgnieszkaBarcik analyzed the data and revised the research and paper, and Piotr Dziwinski analyzed the data, revised theresearch and corrected the final version of manuscript.
Conflicts of Interest: Conflicts of Interest: The authors declare no conflict of interest.
References
1. Peneder, M.; Kaniovski, S.; Dachs, B. What follows tertiarisation? Structural change and the role ofknowledge-based services. Serv. Ind. J. 2003, 23, 47–66. [CrossRef]
2. Ehret, M.; Wirtz, J. Division of labor between firms: Business services, non-ownership-value and the rise ofthe service economy. Serv. Sci. 2010, 2, 136–145. [CrossRef]
3. Buera, F.J.; Kaboski, J.P. Scale and the origins of structural change. J. Econ. Theory 2012, 147, 684–712.[CrossRef]
4. Freeman, R.E. Strategic Management: A Stakeholder Approach, 1st ed.; Harpercollins College Div., Pitman Series:Marshfield, MA, USA, 1994.
5. Donaldson, T.; Preston, L. The Stakeholder Theory of the Corporation: Concepts, Evidence, and Implications.Acad. Manag. Rev. 1995, 1, 65–91.
6. Freeman, R.E.; Harrison, J.E.; Wicks, A.C. Managing for Stakeholders: Survival, Reputation, and Success; YaleUniversity Press: New Haven, CT, USA, 2007.
7. Kaler, J. Evaluating stakeholder theory. J. Bus. Eth. 2006, 69, 249–268. [CrossRef]8. Berrone, P.; Surroca, J.; Tribo, J.A. Corporate ethical identity as a determinant of firm performance: A test of
the mediating role of stakeholder satisfaction. J. Bus. Eth. 2007, 76, 35–53. [CrossRef]9. Verbeke, A.; Tung, V. The Future of Stakeholder Management Theory: A Temporal Perspective. J. Bus. Eth.
2013, 112, 529–543. [CrossRef]10. Mason, C.; Simmons, J. Embedding Corporate Social Responsibility in Corporate Governance: A Stakeholder
Systems Approach. J. Bus. Eth. 2013, 119, 77–86. [CrossRef]11. Mont, O.; Leire, C. Socially responsible purchasing in supply chains: Drivers and barriers in Sweden.
Soc. Responsib. J. 2009, 5, 389–407. [CrossRef]12. Barcik, A.; Dziwinski, P. Relations with employees in CSR strategies at Polish enterprises with regard to
compliance mechanism. Responsib. Sustain. 2015, 3, 13–26.13. Ferrell, O.C.; Fraedrich, J.; Ferrell, L. Business Ethics: Ethical Decision Making and Cases; Houghton Mifflin:
Boston, MA, USA, 2008.14. Matten, D.; Moon, M. “Implicit” and “explicit” CSR: A conceptual framework for a comparative
understanding of Corporate Social Responsibility. Acad. Manag. Rev. 2008, 33, 404–424. [CrossRef]15. Commission of the European Communities, COM. Communication from the Commission to the European
Parliament, the Council, the European Economic and Social Committee and the Committee of theRegions. Available online: http://eur-lex.europa.eu/legal-content/EN/TXT/?uri=CELEX%3A52011DC0681(accessed on 17 February 2016).
16. Schoemaker, M.; Nijhof, A.; Jonker, J. Human value management. The influence of the contemporarydevelopments of corporate social responsibility and social capital on HRM. Manag. Rev. 2006, 17, 448–465.
17. Sánchez-Hernández, M.I.; Grayson, D. Internal marketing for engaging employees on the corporateresponsibility journey. Intang. Cap. 2012, 8, 275–307. [CrossRef]
18. Barney, J. Firm resources and sustained competitive advantage. J. Manag. 1991, 17, 99–120. [CrossRef]19. Acedo, F.J.; Barroso, C.; Galán, J.L. The resource-based theory: Dissemination and main trends.
Strateg. Manag. J. 2006, 27, 621–636. [CrossRef]20. Crook, T.R.; Todd, S.Y.; Combs, J.G.; Woehr, D.J.; Ketchen, D.J., Jr. Does human capital matter? A
meta-analysis of the relationship between human capital and firm performance. J. Appl. Psychol. 2011, 96,443–456. [CrossRef] [PubMed]
228
Sustainability 2016, 8, 179
21. Porter, M.E.; Kramer, M.R. The link between competitive advantage and corporate social responsibility.Harv. Bus. Rev. 2006, 84, 78–92. [PubMed]
22. Varey, R.J. Internal marketing: A review and some interdisciplinary research challenges. Int. J. Serv.Ind. Manag. 1995, 6, 40–63. [CrossRef]
23. Gallardo-Vázquez, D.; Sánchez-Hernández, M.I. Measuring Corporate Social Responsibility for competitivesuccess at a regional level. J. Clean. Prod. 2014, 72, 14–22. [CrossRef]
24. Carroll, A. A three-dimensional conceptual model of corporate performance. Acad. Manag. Rev. 1979, 4,497–505.
25. Aupperle, K.; Carroll, A.B.; Hatfield, J. An empirical examination of the relationship between corporatesocial responsibility and profitability. Acad. Manag. J. 1985, 28, 446–463. [CrossRef]
26. Wood, D.J.; Jones, R.E. Stakeholder mismatching: A theoretical problem in empirical research on corporatesocial performance. Int. J. Organ. Anal. 1995, 3, 229–267. [CrossRef]
27. Quazi, A.M.; O'Brien, D. An empirical test of a cross-national model of corporate social responsibility.J. Bus. Eth. 2000, 25, 33–51. [CrossRef]
28. Maignan, I.; Ferrell, O.C. Measuring Corporate Citizenship in Two Countries: The Case of the United Statesand France. J. Bus. Eth. 2000, 23, 283–297. [CrossRef]
29. Sánchez-Hernández, M.I.; García-Míguelez, M.P. Improving Employees Quality of Life. In Best Practices inMarketing and Their Impact on Quality of Life; Alves, H., Vázquez, J.L., Eds.; Springer Dordrecht Heidelberg:New York, NY, USA; London, UK, 2013; pp. 241–254.
30. Zinn, J.O. Introduction: Risk, social inclusion and the life course. Soc. Policy Soc. 2013, 12, 253–264. [CrossRef]31. Hayman, L.W.; McIntyre, R.B.; Abbey, A. The bad taste of social ostracism: The effects of exclusion on the
eating behaviors of African-American women. Psychol. Health 2014, 3, 1–16. [CrossRef] [PubMed]32. Gallardo-Vázquez, D.; Sánchez-Hernández, M.I. Corporate Social Responsibility in Extremadura; Fundación
Obra Social La Caixa: Badajoz, Spain, 2012. (In Spanish)33. Bruyére, S.; Filiberto, D. The green economy and job creation: Inclusion of people with disabilities in the
USA. Int. J. Green Econ. 2013, 7, 257–275. [CrossRef]34. Kulkarni, M.; Rodrigues, C. Engagerment with disability: Analysis of annual reports of Indian organizations.
Int. J. Human Resour. Manag. 2014, 25, 1547–1566. [CrossRef]35. Cullinane, S.J.; Bosak, J.; Flood, P.C.; Demerouti, E. Job design under lean manufacturing and the quality of
working life: A job demands and resources perspective. Int. J. Human Resour. Manag. 2014, 25, 2996–3015.[CrossRef]
36. Amstrong, M. Amstrong’s Handbook of Reward Management Practice. In Improving Performance throughReward, 4th ed.; Kogan Page: London, UK, 2012.
37. Esping-Andersen, G. The Three Worlds of Welfare Capitalism; John Wiley & Sons: Chichester, UK, 2013.38. Cohen, E. CSR for HR: A Necessary Partnership for Advancing Responsible Business Practices; Greenleaf Publishing
Limited: Sheffield, UK, 2010.39. Long, C.S.; Perumal, P. Examining the impact of human resource management practices on employees’
turnover intention. Int. J. Bus. Soc. 2014, 15, 111–126.40. Lozano, R.; Huisingh, D. Inter-linking issues and dimensions in sustainability reporting. J. Clean. Prod. 2011,
19, 99–107. [CrossRef]41. Bischoff, C.; Wood, G. Micro and small enterprises and employment creation: A case study of manufacturing
micro and small enterprises in South Africa. Dev. South. Afr. 2013, 30, 564–579. [CrossRef]42. Turker, D. Measuring Corporate Social Responsibility: A Scale Development Study. J. Bus. Eth. 2009, 85,
411–427. [CrossRef]43. Vázquez-Carrasco, R.; López-Pérez, M.E.; Centeno, E. A qualitative approach to the challengues for women
in management: Are they really starting in the 21st century? Qual. Quant. 2012, 46, 1337–1357. [CrossRef]44. Tato-Jiménez, J.L.; Bañegil-Palacios, T.M. Effects of formal and informal practices of reconciling work and
life on the performance of Spanish listed companies. Res. J. Bus. Manag. 2015, 9, 391–403. [CrossRef]45. Agudo-Valiente, J.M.; Garcés-Ayerbe, C.; Salvador-Figueras, M. Social responsibility practices and evaluation
of corporate social performance. J. Cleaner Prod. 2012, 35, 25–38. [CrossRef]46. Pérez, A.; Martínez, P. Rodríguez del Bosque, I. The development of a stakeholder-based scale for measuring
corporate social responsibility in the banking industry. Serv. Bus. 2012, 7, 459–481. [CrossRef]
229
Sustainability 2016, 8, 179
47. Lu, R.X.A.; Lee, P.K.C.; Cheng, T.C. Socially responsible supplier development: Construct development andmeasurement validation. Int. J. Prod. Econ. 2012, 140, 160–167. [CrossRef]
48. Hillman, A.J.; Keim, G.D. Shareholder value, stakeholder management, and social issues: What's the bottomline? Strateg. Manag. J. 2001, 22, 125–139. [CrossRef]
49. Sanchez-Hernandez, M.I.; Gallardo-Vázquez, D. Approaching corporate volunteering in Spain. Corpor. Gov.2013, 13, 397–411. [CrossRef]
50. Knutsen, W.L.; Chan, Y. The Phenomenon of Staff Volunteering: How Far Can You Stretch the PsychologicalContract in a Nonprofit Organization? VOLUNTAS Int. J. Volunt. Nonprofit Organ. 2015, 26, 1–22. [CrossRef]
51. Preuss, L.; Haunschild, A.; Matten, D. The rise of CSR: Implications for HRM and employee representation.Int. J. Hum. Resour. Manag. 2009, 20, 953–973. [CrossRef]
52. Cetindamar, D. Corporate social responsibility practices and environmentally responsible behavior: Thecase of the United Nations Global Compact. J. Bus. Eth. 2007, 76, 163–176. [CrossRef]
53. Legge, K. Human Resource Management: Rhetorics and Realities. MacMillan Press: London, UK, 1995.54. Gallardo-Vázquez, D.; Sánchez-Hernández, M.I. Structural analysis of the strategic orientation to
environmental protection in SME's. BQR—Bus. Res. Q. 2014, 17, 115–128. [CrossRef]55. Cudeck, R. Exploratory Factor Analysis. In Handbook of Applied Multivariate Statistics and Mathematical
Modeling; Tinsley, H., Brown, S., Eds.; Academic Press: San Diego, CA, USA, 2000; pp. 265–296.56. Jolliffe, I. Principal Component Analysis; John Wiley & Sons: Chichester, UK, 2005.57. Mundfrom, D.J.; Shaw, D.G.; Ke, T.L. Minimum sample size recommendations for conducting factor analyses.
Int. J. Test. 2005, 5, 159–168. [CrossRef]58. Nunnally, J.C.; Bernstein, I.H. Psychometric Theory, 3rd ed.; McGraw Hill: New York, NY, USA, 1994.59. Sánchez-Hernández, M.I.; Miranda, F.J. Linking internal market orientation and new service performance.
Eur. J. Innov. Manag. 2011, 14, 207–226. [CrossRef]60. Pohl, M. Corporate Culture and CSR-How They Interrelate and Consequences for Successful Implementation.
In The ICCA Handbook on Corporate Social Responsibility; Hennigfeld, J., Pohl, M., Tolhurst, N., Eds.; JohnWiley & Sons: Chichester, UK, 2006.
61. Muthuri, J.N.; Matten, D.; Moon, J. Employee volunteering and social capital: Contributions to corporatesocial responsibility. Br. J. Manag. 2009, 20, 75–89. [CrossRef]
62. Kim, H.R.; Lee, M.; Lee, H.T.; Kim, N.M. Corporate social responsibility and employee–companyidentification. J. Bus. Eth. 2010, 95, 557–569. [CrossRef]
63. Mahoney, L.S.; Thorne, L. Corporate social responsibility and long-term compensation: Evidence fromCanada. J. Bus. Eth. 2005, 57, 241–253. [CrossRef]
64. Collier, J.; Esteban, R. Corporate social responsibility and employee commitment. Bus. Eth. A Eur. Rev. 2007,16, 19–33. [CrossRef]
65. Barclay, D.; Higgins, C.; Thompson, R. The partial least squares (PLS) approach to causal modeling: Personalcomputer adoption and use as an illustration. Technol. Stud. 1995, 2, 285–309.
66. Chin, W. Issues and Opinion on Structural Equation Modelling. MIS Q. 1998, 2, vii–xv.67. Porter, M.E. Competitive Strategy: Techniques for Analyzing Industries and Competitors; The Free Press: New York,
NY, USA, 1980.68. Porter, M.E. Towards a dynamic theory of strategy. Strateg. Manag. J. 1991, 12, 95–117. [CrossRef]69. Spanos, Y.E.; Lioukas, S. An Examination into the Causal Logic of Rent Generation: Contrasting Porter’s
Competitive Strategy Framework and the Resource Based Perspective. Strateg. Manag. J. 2001, 22, 907–934.[CrossRef]
70. Wagner, M.; Schaltegger, S. Introduction: How Does Sustainability Performance Relate to BusinessCompetitiveness? Greener Manag. Int. 2003, 44, 5–16. [CrossRef]
71. Van de Ven, A.H. Central problems in the management of innovation. Manag. Sci. 1986, 32, 590–660.[CrossRef]
72. Sánchez-Hernández, M.I.; Gallardo-Vazquez, D.; Dziwinski, P.; Barcik, A. Innovation through corporatesocial responsibility—Insights from Spain and Poland. In Handbook of Research on Internationalization ofEntrepreneurial Innovation in the Global Economy; IGI Global: Hershey, PA, USA, 2015; pp. 313–328.
73. Subramaniam, M.; Youndt, M.A. The influence of intellectual capital on the types of innovative capabilities.Acad. Manag. J. 2005, 48, 450–463. [CrossRef]
230
Sustainability 2016, 8, 179
74. Cano, C.P.; Cano, P.Q. Human resources management and its impact on innovation performance incompanies. Int. J. Technol. Manag. 2006, 35, 11–28. [CrossRef]
75. Lund Vinding, A. Absorptive capacity and innovative performance: A human capital approach. Econ. Innov.New Technol. 2006, 15, 507–517. [CrossRef]
76. Mavondo, F.T.; Chimhanzi, J.; Stewart, J. Learning orientation and market orientation: Relationship withinnovation, human resource practices and performance. Eur. J. Mark. 2005, 39, 1235–1263. [CrossRef]
77. Little, M.M.; Dean, A.M. Links between service climate, employee commitment and employees’ servicequality capability. Manag. Serv. Qual. Int. J. 2006, 16, 460–476. [CrossRef]
78. Wiklund, J.; Shepperd, D. Knowledge-based resources, entrepreneurial orientation and the performance ofsmall and medium-sized businesses. Strateg. Manag. J. 2003, 24, 1307–1314. [CrossRef]
79. Pelham, A.; Wilson, D. A longitudinal study of the impact of market structure, firm structure, strategy, andmarket orientation culture on dimensions of small-firm performance. Am. Mark. Assoc. 1996, 24, 27–43.[CrossRef]
80. Yalcinkaya, G.; Calantone, R.J.; Griffith, D.A. An examination of exploration and exploitation capabilities:Implications for product innovation and market performance. J. Int. Mark. 2007, 15, 63–93. [CrossRef]
81. Medrano-Sáez, N.; Olarte-Pascual, M.C. Marketing Innovation as an Opportunity in a Situation ofUncertainty: The Spanish Case, 327–341. In Soft Computing in Management and Business Economics; Springer:Berlin Heidelberg, Germany, 2012.
82. Carmona-Lavado, A.; Cuevas-Rodríguez, G.; Cabello-Medina, C. Social and organizational capital: Buildingthe context for innovation. Ind. Mark. Manag. 2010, 39, 681–690. [CrossRef]
83. Hughes, M.; Ireland, R.D.; Morgan, R.E. Stimulating dynamic value: Social capital and business incubationas a pathway to competitive success. Long Range Plan. 2007, 40, 154–177. [CrossRef]
84. Abraham, S.C. Strategic Planning: A Practical Guide for Competitive Success; Emerald Group Publishing:Bingley, UK, 2012.
85. Carmines, E.G.; Richard, A.Z. Reliability and Validity Assessment; Sage Publications: Beverly Hills, CA,USA, 1979.
86. Chin, W.W. Issues and opinion on structural equation modeling. MIS Q. 1988, 22, vii–xvi.87. Ahmed, P.K.; Rafiq, M. Internal Marketing—Tools and Concepts for Customer-Focused Management;
Butterworth-Heinemann Publications: Oxford, UK, 2002.88. Bansal, H.S.; Mendelson, M.B.; Sharma, B. The impact of internal marketing activities on external marketing
outcomes. J. Qual. Manag. 2001, 6, 61–76. [CrossRef]89. Ariza-Montes, J.A.; Muniz, R.N.M.; Leal-Rodríguez, A.L.; Leal-Millán, A.G. Workplace bullying among
managers: A multifactorial perspective and understanding. Int. J. Environ. Res. Public Health 2014, 11,2657–2682. [CrossRef] [PubMed]
© 2016 by the authors. Licensee MDPI, Basel, Switzerland. This article is an open accessarticle distributed under the terms and conditions of the Creative Commons Attribution(CC BY) license (http://creativecommons.org/licenses/by/4.0/).
231
sustainability
Article
Automobile Industry Strategic Alliance PartnerSelection: The Application of a Hybrid DEA andGrey Theory Model
Chia-Nan Wang 1, Xuan-Tho Nguyen 1,* and Yen-Hui Wang 2
1 Department of Industrial Engineering and Management, National Kaohsiung University of AppliedSciences, No. 415 Chien Kung Road, Sanmin District, Kaohsiung City 80778, Taiwan;[email protected]
2 Department of Information Management, Chihlee University of Technology, New Taipei City 22050, Taiwan;[email protected]
* Correspondence: [email protected]; Tel.: +886-970-456-070
Academic Editor: Adam JabłonskiReceived: 21 December 2015; Accepted: 6 February 2016; Published: 17 February 2016
Abstract: Finding the right strategic alliance partner is a critical success factor for many enterprises.Therefore, the purpose of this study is to propose an effective approach based on grey theory and dataenvelopment analysis (DEA) for selecting better partners for alliance. This study used grey forecastingto predict future business performances and used DEA for the partner selection of alliances. Thisresearch was implemented with realistic public data in four consecutive financial years (2009–2012) ofthe world’s 20 biggest automobile enterprises. Nissan Motor Co., Ltd was set to be the target decisionmaking unit (DMU). The empirical results showed that, among 19 candidate DMUs, Renault (DMU10)and Daimler (DMU11) were the two feasible beneficial alliance partners for Nissan. Although thisresearch is specifically applied to the automobile industry, the proposed method could also be appliedto other manufacturing industries.
Keywords: strategic alliance; data envelopment analysis; grey prediction; automobile industry
1. Introduction
The automobile industry is a pillar of the global economy and a main driver of macroeconomicgrowth and innovation. Its cycle intertwines with all major business cycles [1]. Since it has stronglinkages with other parts of the economy, this industry has been severely affected by the economicrecession starting in 2008. In spite of manufacturers trying various strategies, production is still belowits pre-crisis level.
This research investigation began with the top 50 automobile enterprises, by using the WorldRanking OICAs’ survey of 2012 [2]. However, the study was obliged to focus on the top 20, due toa lack of public data. These enterprises played major roles and could fully represent the automobileindustry. Among them, Nissan Motor Company was ranked sixth by production volume. Establishedin Japan in 1933, Nissan manufactures vehicles in 20 countries now. It also provides products andservices in more than 160 countries. Figure 1 shows Nissan’s global retail sales volume and marketshare. Except for 2008, the enterprise had increased its sale volume and market share year by year(3,569,000–5,650,000 units and 5.6%–6.7% from 2005 to 2014) [3].
Sustainability 2016, 8, 173; doi:10.3390/su8020173 www.mdpi.com/journal/sustainability232
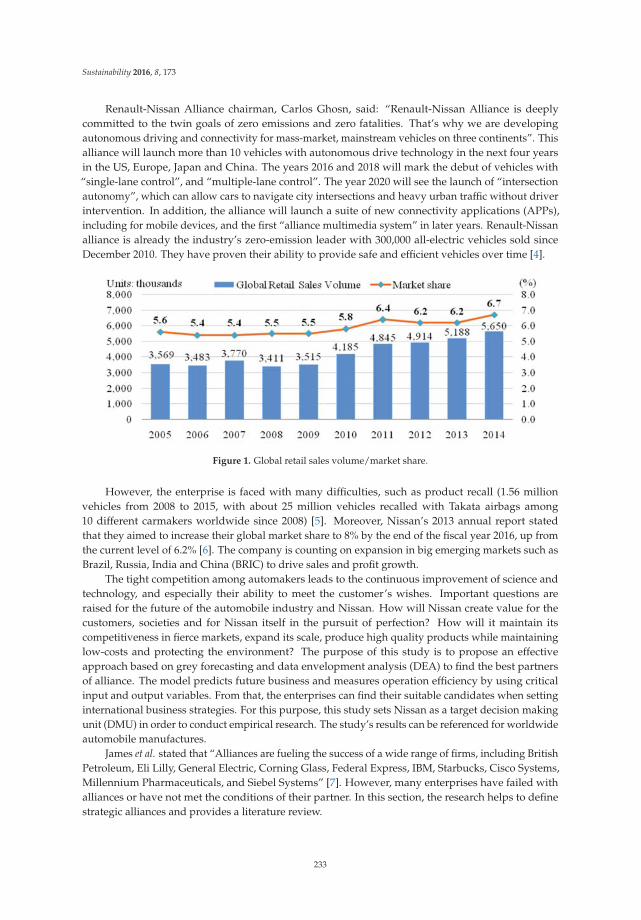
Sustainability 2016, 8, 173
Renault-Nissan Alliance chairman, Carlos Ghosn, said: “Renault-Nissan Alliance is deeplycommitted to the twin goals of zero emissions and zero fatalities. That’s why we are developingautonomous driving and connectivity for mass-market, mainstream vehicles on three continents”. Thisalliance will launch more than 10 vehicles with autonomous drive technology in the next four yearsin the US, Europe, Japan and China. The years 2016 and 2018 will mark the debut of vehicles with“single-lane control”, and “multiple-lane control”. The year 2020 will see the launch of “intersectionautonomy”, which can allow cars to navigate city intersections and heavy urban traffic without driverintervention. In addition, the alliance will launch a suite of new connectivity applications (APPs),including for mobile devices, and the first “alliance multimedia system” in later years. Renault-Nissanalliance is already the industry’s zero-emission leader with 300,000 all-electric vehicles sold sinceDecember 2010. They have proven their ability to provide safe and efficient vehicles over time [4].
Figure 1. Global retail sales volume/market share.
However, the enterprise is faced with many difficulties, such as product recall (1.56 millionvehicles from 2008 to 2015, with about 25 million vehicles recalled with Takata airbags among10 different carmakers worldwide since 2008) [5]. Moreover, Nissan’s 2013 annual report statedthat they aimed to increase their global market share to 8% by the end of the fiscal year 2016, up fromthe current level of 6.2% [6]. The company is counting on expansion in big emerging markets such asBrazil, Russia, India and China (BRIC) to drive sales and profit growth.
The tight competition among automakers leads to the continuous improvement of science andtechnology, and especially their ability to meet the customer’s wishes. Important questions areraised for the future of the automobile industry and Nissan. How will Nissan create value for thecustomers, societies and for Nissan itself in the pursuit of perfection? How will it maintain itscompetitiveness in fierce markets, expand its scale, produce high quality products while maintaininglow-costs and protecting the environment? The purpose of this study is to propose an effectiveapproach based on grey forecasting and data envelopment analysis (DEA) to find the best partnersof alliance. The model predicts future business and measures operation efficiency by using criticalinput and output variables. From that, the enterprises can find their suitable candidates when settinginternational business strategies. For this purpose, this study sets Nissan as a target decision makingunit (DMU) in order to conduct empirical research. The study’s results can be referenced for worldwideautomobile manufactures.
James et al. stated that “Alliances are fueling the success of a wide range of firms, including BritishPetroleum, Eli Lilly, General Electric, Corning Glass, Federal Express, IBM, Starbucks, Cisco Systems,Millennium Pharmaceuticals, and Siebel Systems” [7]. However, many enterprises have failed withalliances or have not met the conditions of their partner. In this section, the research helps to definestrategic alliances and provides a literature review.
233
Sustainability 2016, 8, 173
Mockler difined “Strategic alliances are agreements between companies (partners) to reachobjectives of common interest” [8]. International strategic alliances (ISAs) are voluntary, long-term,contractual, cross-border relationships between two firms, designed to achieve specific objectives [9].These definitions emphasize the importance of common business goals with the involved companies.Cravens et al., distinguished strategic alliance as a horizontal collaborative relationship that does notinclude any kind of equity exchange or creation of a new entity as in joint ventures [10]. Chan et al.stated that: Strategic alliance is a cooperative agreement between different organizations. The purposeof action aims at achieving the competitive advantages and sharing resources in product design,production, marketing and/or distribution [11]. The types of alliances range from simple agreementswith no equity ties to more formal arrangements involving equity ownership and shared managerialcontrol over joint activities. The alliance activities can be supplier–buyer partnerships, outsourcingagreements, technical collaboration, joint research projects, shared new product development, sharedmanufacturing arrangements, common distribution agreements, and cross-selling arrangements.The type that should be applied depends on the structures or objectives of each enterprise.
Besides that, the alliance should conform to competition laws, with the world’s largest and mostinfluential anti-trust law systems existing in the United States and European Union. However, businesscooperation could be seen as one kind of alliance as well. This research focuses on the selection ofbusiness partners, so anti-trust law issues are not major focus of this study.
Candace et al. had investigated 89 high technology alliances and suggested that direct-competitoralliances might be an inefficient means for innovating [12]. Cho et al. observed the trend of worldtelecommunication and sought to answer whether alliance strategies needed to be regulated by thegovernment. By reviewing global alliance strategies in some countries, the research pointed towardssome reasonable recommendations for regulation of telecommunication enterprises [13]. Kauser andShaw investigated strategic alliance agreements among UK firms and their European, Japanese andUS partners. The results indicated that the majority of UK firms engaged in international partnershipsfor marketing of relevant activities and for entering a foreign market. The findings had also indicatedthat the majority of UK managers were satisfied with the overall performance of their internationalstrategic alliances [14]. Those papers had investigated alliances in various type of firms, however,the lack of focus on the automobile industry is one of the impetuses for this research.
Forecast time series have been used quite regularly by researchers. There are various forecastingmodels which have different mathematical backgrounds such as fuzzy predictors, neural networks,trend extrapolation, and grey prediction. Grey system theory as an interdisciplinary scientific area wasfirst introduced in the early 1980s by Deng in 1982 [15].From then on, the theory has become a quitepopular method to deal with the uncertainty problems under partially unknown parameters and pooror missing information. Superior to conventional statistical models, grey models claim only a limitedamount of data to evaluate the action of unknown systems [16].
The techniques of frontier analysis had been described by Farrel in 1957 [17], but a mathematicalframework to handle frontier analysis was established only after two decades. The DEA was introducedby Charnes et al. [18]. They proposed a “data oriented” approach for measuring the performance ofmultiple DMUs, by converting multiple input into multiple output. DMU could include manufacturingunits, schools, universities, bank branches, hospitals, power plants, etc. Recently, there have beenvarious DEA applications in private and public sectors of different countries.
Martín and Roman used DEA to analyze the technical efficiency and performance of eachindividual Spanish airport. They used the results to put forward some policy considerations inpreparation for the process of privatization of the Spanish airport system [19]. Wang et al. applieddata envelopment analysis and the heuristic technique approach to help department stores find themost proper partners for strategic alliances. The results indicated that candidate selection of strategicalliances could be an effective strategy for enterprises to find out the right partners for cooperation [20].Wang et al. used Grey and DEA techniques to measure production and marketing efficiencies of23 companies in the printing circuit board industry. The results showed that 15 companies require
234
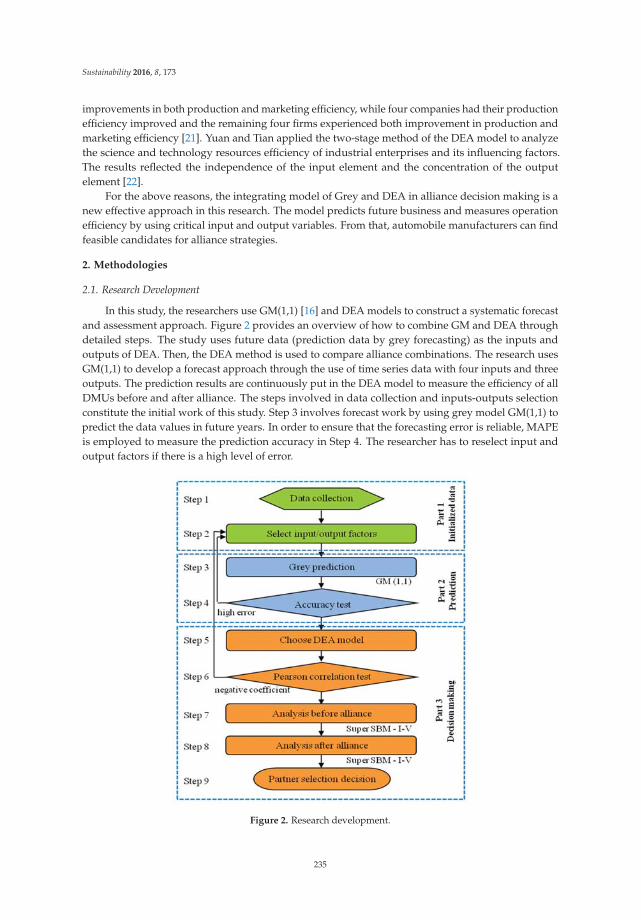
Sustainability 2016, 8, 173
improvements in both production and marketing efficiency, while four companies had their productionefficiency improved and the remaining four firms experienced both improvement in production andmarketing efficiency [21]. Yuan and Tian applied the two-stage method of the DEA model to analyzethe science and technology resources efficiency of industrial enterprises and its influencing factors.The results reflected the independence of the input element and the concentration of the outputelement [22].
For the above reasons, the integrating model of Grey and DEA in alliance decision making is anew effective approach in this research. The model predicts future business and measures operationefficiency by using critical input and output variables. From that, automobile manufacturers can findfeasible candidates for alliance strategies.
2. Methodologies
2.1. Research Development
In this study, the researchers use GM(1,1) [16] and DEA models to construct a systematic forecastand assessment approach. Figure 2 provides an overview of how to combine GM and DEA throughdetailed steps. The study uses future data (prediction data by grey forecasting) as the inputs andoutputs of DEA. Then, the DEA method is used to compare alliance combinations. The research usesGM(1,1) to develop a forecast approach through the use of time series data with four inputs and threeoutputs. The prediction results are continuously put in the DEA model to measure the efficiency of allDMUs before and after alliance. The steps involved in data collection and inputs-outputs selectionconstitute the initial work of this study. Step 3 involves forecast work by using grey model GM(1,1) topredict the data values in future years. In order to ensure that the forecasting error is reliable, MAPEis employed to measure the prediction accuracy in Step 4. The researcher has to reselect input andoutput factors if there is a high level of error.
Figure 2. Research development.
235
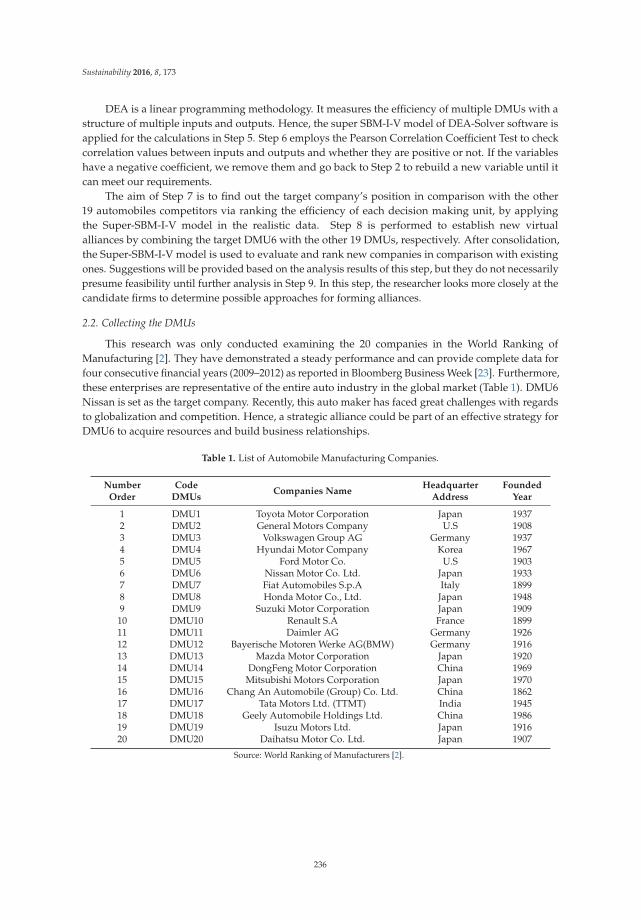
Sustainability 2016, 8, 173
DEA is a linear programming methodology. It measures the efficiency of multiple DMUs with astructure of multiple inputs and outputs. Hence, the super SBM-I-V model of DEA-Solver software isapplied for the calculations in Step 5. Step 6 employs the Pearson Correlation Coefficient Test to checkcorrelation values between inputs and outputs and whether they are positive or not. If the variableshave a negative coefficient, we remove them and go back to Step 2 to rebuild a new variable until itcan meet our requirements.
The aim of Step 7 is to find out the target company’s position in comparison with the other19 automobiles competitors via ranking the efficiency of each decision making unit, by applyingthe Super-SBM-I-V model in the realistic data. Step 8 is performed to establish new virtualalliances by combining the target DMU6 with the other 19 DMUs, respectively. After consolidation,the Super-SBM-I-V model is used to evaluate and rank new companies in comparison with existingones. Suggestions will be provided based on the analysis results of this step, but they do not necessarilypresume feasibility until further analysis in Step 9. In this step, the researcher looks more closely at thecandidate firms to determine possible approaches for forming alliances.
2.2. Collecting the DMUs
This research was only conducted examining the 20 companies in the World Ranking ofManufacturing [2]. They have demonstrated a steady performance and can provide complete data forfour consecutive financial years (2009–2012) as reported in Bloomberg Business Week [23]. Furthermore,these enterprises are representative of the entire auto industry in the global market (Table 1). DMU6Nissan is set as the target company. Recently, this auto maker has faced great challenges with regardsto globalization and competition. Hence, a strategic alliance could be part of an effective strategy forDMU6 to acquire resources and build business relationships.
Table 1. List of Automobile Manufacturing Companies.
NumberOrder
CodeDMUs
Companies NameHeadquarter
AddressFounded
Year
1 DMU1 Toyota Motor Corporation Japan 19372 DMU2 General Motors Company U.S 19083 DMU3 Volkswagen Group AG Germany 19374 DMU4 Hyundai Motor Company Korea 19675 DMU5 Ford Motor Co. U.S 19036 DMU6 Nissan Motor Co. Ltd. Japan 19337 DMU7 Fiat Automobiles S.p.A Italy 18998 DMU8 Honda Motor Co., Ltd. Japan 19489 DMU9 Suzuki Motor Corporation Japan 190910 DMU10 Renault S.A France 189911 DMU11 Daimler AG Germany 192612 DMU12 Bayerische Motoren Werke AG(BMW) Germany 191613 DMU13 Mazda Motor Corporation Japan 192014 DMU14 DongFeng Motor Corporation China 196915 DMU15 Mitsubishi Motors Corporation Japan 197016 DMU16 Chang An Automobile (Group) Co. Ltd. China 186217 DMU17 Tata Motors Ltd. (TTMT) India 194518 DMU18 Geely Automobile Holdings Ltd. China 198619 DMU19 Isuzu Motors Ltd. Japan 191620 DMU20 Daihatsu Motor Co. Ltd. Japan 1907
Source: World Ranking of Manufacturers [2].
236
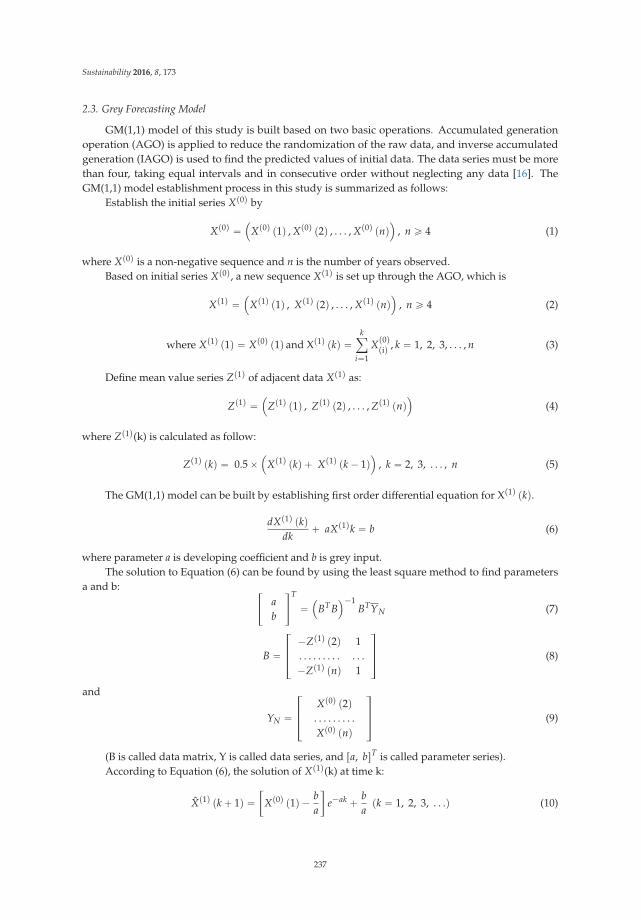
Sustainability 2016, 8, 173
2.3. Grey Forecasting Model
GM(1,1) model of this study is built based on two basic operations. Accumulated generationoperation (AGO) is applied to reduce the randomization of the raw data, and inverse accumulatedgeneration (IAGO) is used to find the predicted values of initial data. The data series must be morethan four, taking equal intervals and in consecutive order without neglecting any data [16]. TheGM(1,1) model establishment process in this study is summarized as follows:
Establish the initial series Xp0q by
Xp0q “´
Xp0q p1q , Xp0q p2q , . . . , Xp0q pnq¯
, n ě 4 (1)
where Xp0q is a non-negative sequence and n is the number of years observed.Based on initial series Xp0q, a new sequence Xp1q is set up through the AGO, which is
Xp1q “´
Xp1q p1q , Xp1q p2q , . . . , Xp1q pnq¯
, n ě 4 (2)
where Xp1q p1q “ Xp0q p1q and Xp1q pkq “kÿ
i“1
Xp0qpiq , k “ 1, 2, 3, . . . , n (3)
Define mean value series Zp1q of adjacent data Xp1q as:
Zp1q “´
Zp1q p1q , Zp1q p2q , . . . , Zp1q pnq¯
(4)
where Zp1q(k) is calculated as follow:
Zp1q pkq “ 0.5 ˆ´
Xp1q pkq ` Xp1q pk ´ 1q¯
, k “ 2, 3, . . . , n (5)
The GM(1,1) model can be built by establishing first order differential equation for Xp1q pkq.
dXp1q pkqdk
` aXp1qk “ b (6)
where parameter a is developing coefficient and b is grey input.The solution to Equation (6) can be found by using the least square method to find parameters
a and b: «ab
ffT
“´
BT B¯´1
BTYN (7)
B “»—– ´Zp1q p2q 1
. . . . . . . . . . . .´Zp1q pnq 1
fiffifl (8)
and
YN “»—– Xp0q p2q
. . . . . . . . .Xp0q pnq
fiffifl (9)
(B is called data matrix, Y is called data series, and ra, bsT is called parameter series).According to Equation (6), the solution of Xp1q(k) at time k:
Xp1q pk ` 1q “„
Xp0q p1q ´ ba
je´ak ` b
apk “ 1, 2, 3, . . .q (10)
237
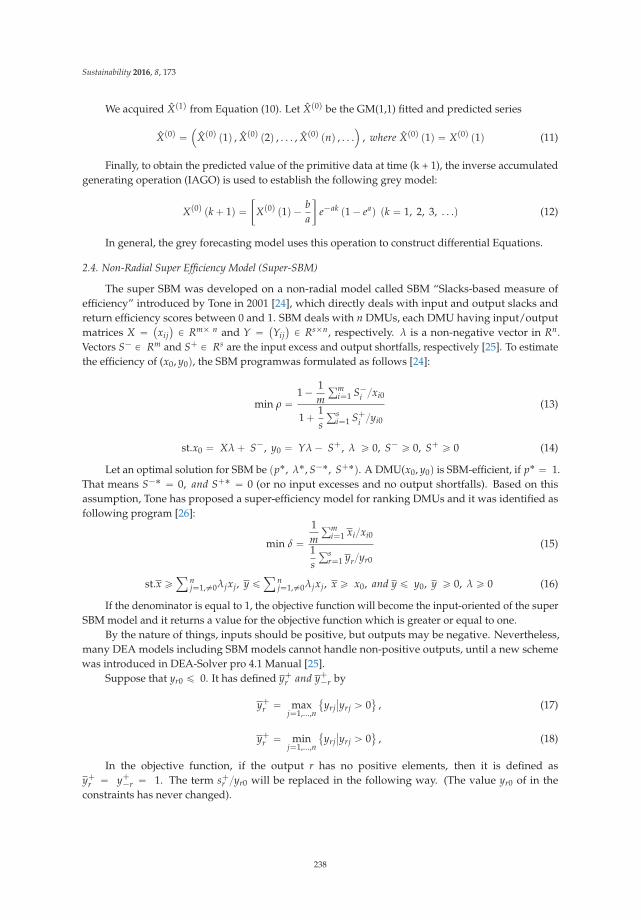
Sustainability 2016, 8, 173
We acquired Xp1q from Equation (10). Let Xp0q be the GM(1,1) fitted and predicted series
Xp0q “´
Xp0q p1q , Xp0q p2q , . . . , Xp0q pnq , . . .¯
, where Xp0q p1q “ Xp0q p1q (11)
Finally, to obtain the predicted value of the primitive data at time (k + 1), the inverse accumulatedgenerating operation (IAGO) is used to establish the following grey model:
Xp0q pk ` 1q “„
Xp0q p1q ´ ba
je´ak p1 ´ eaq pk “ 1, 2, 3, . . .q (12)
In general, the grey forecasting model uses this operation to construct differential Equations.
2.4. Non-Radial Super Efficiency Model (Super-SBM)
The super SBM was developed on a non-radial model called SBM “Slacks-based measure ofefficiency” introduced by Tone in 2001 [24], which directly deals with input and output slacks andreturn efficiency scores between 0 and 1. SBM deals with n DMUs, each DMU having input/outputmatrices X “ `
xij˘ P Rmˆ n and Y “ `
Yij˘ P Rsˆn, respectively. λ is a non-negative vector in Rn.
Vectors S´ P Rm and S` P Rs are the input excess and output shortfalls, respectively [25]. To estimatethe efficiency of (x0, y0q, the SBM programwas formulated as follows [24]:
min ρ “1 ´ 1
mřm
i“1 S´i {xi0
1 ` 1s
řsi“1 S`
i {yi0
(13)
st.x0 “ Xλ ` S´, y0 “ Yλ ´ S`, λ ě 0, S´ ě 0, S` ě 0 (14)
Let an optimal solution for SBM be pp˚, λ˚, S´˚, S`˚q. A DMU(x0, y0q is SBM-efficient, if p˚ “ 1.That means S´˚ “ 0, and S`˚ “ 0 (or no input excesses and no output shortfalls). Based on thisassumption, Tone has proposed a super-efficiency model for ranking DMUs and it was identified asfollowing program [26]:
min δ “1m
řmi“1 xi{xi0
1s
řsr“1 yr{yr0
(15)
st.x ěÿ
nj“1,‰0λjxj, y ď
ÿnj“1,‰0λjxj, x ě x0, and y ď y0, y ě 0, λ ě 0 (16)
If the denominator is equal to 1, the objective function will become the input-oriented of the superSBM model and it returns a value for the objective function which is greater or equal to one.
By the nature of things, inputs should be positive, but outputs may be negative. Nevertheless,many DEA models including SBM models cannot handle non-positive outputs, until a new schemewas introduced in DEA-Solver pro 4.1 Manual [25].
Suppose that yr0 ď 0. It has defined yr and y`r by
yr “ maxj“1,...,n
�yrj
ˇyrj ą 0
(, (17)
yr “ minj“1,...,n
�yrj
ˇyrj ą 0
(, (18)
In the objective function, if the output r has no positive elements, then it is defined asyr “ y`
r “ 1. The term sr {yr0 will be replaced in the following way. (The value yr0 of in theconstraints has never changed).
238
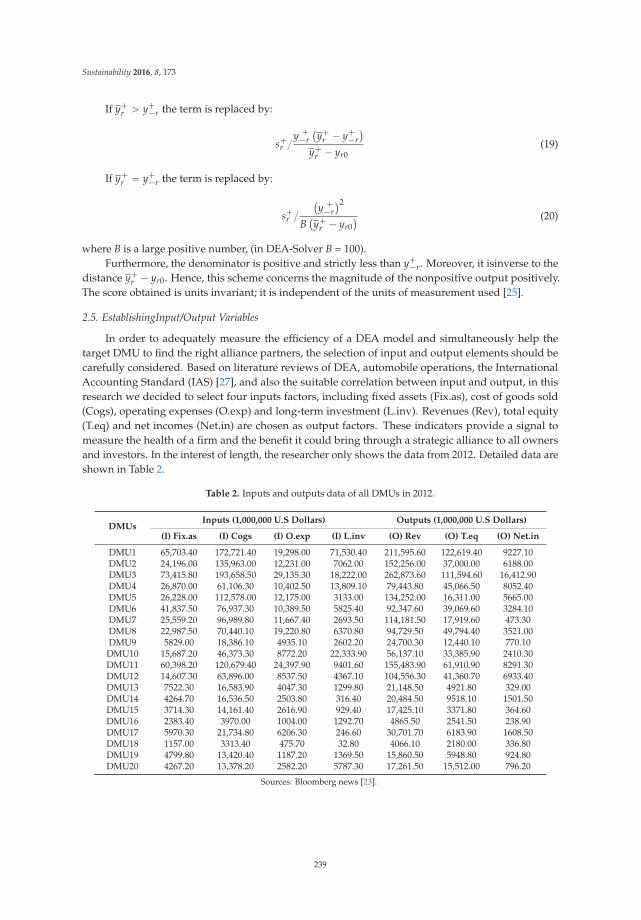
Sustainability 2016, 8, 173
If yr ą y`r the term is replaced by:
sr { y `r
`yr ´ y`
r˘
yr ´ yr0(19)
If yr “ y`r the term is replaced by:
sr {`y `
r˘2
B`yr ´ yr0
˘ (20)
where B is a large positive number, (in DEA-Solver B = 100).Furthermore, the denominator is positive and strictly less than y`
r. Moreover, it isinverse to thedistance yr ´ yr0. Hence, this scheme concerns the magnitude of the nonpositive output positively.The score obtained is units invariant; it is independent of the units of measurement used [25].
2.5. EstablishingInput/Output Variables
In order to adequately measure the efficiency of a DEA model and simultaneously help thetarget DMU to find the right alliance partners, the selection of input and output elements should becarefully considered. Based on literature reviews of DEA, automobile operations, the InternationalAccounting Standard (IAS) [27], and also the suitable correlation between input and output, in thisresearch we decided to select four inputs factors, including fixed assets (Fix.as), cost of goods sold(Cogs), operating expenses (O.exp) and long-term investment (L.inv). Revenues (Rev), total equity(T.eq) and net incomes (Net.in) are chosen as output factors. These indicators provide a signal tomeasure the health of a firm and the benefit it could bring through a strategic alliance to all ownersand investors. In the interest of length, the researcher only shows the data from 2012. Detailed data areshown in Table 2.
Table 2. Inputs and outputs data of all DMUs in 2012.
DMUsInputs (1,000,000 U.S Dollars) Outputs (1,000,000 U.S Dollars)
(I) Fix.as (I) Cogs (I) O.exp (I) L.inv (O) Rev (O) T.eq (O) Net.in
DMU1 65,703.40 172,721.40 19,298.00 71,530.40 211,595.60 122,619.40 9227.10DMU2 24,196.00 135,963.00 12,231.00 7062.00 152,256.00 37,000.00 6188.00DMU3 73,415.80 193,658.50 29,135.30 18,222.00 262,873.60 111,594.60 16,412.90DMU4 26,870.00 61,106.30 10,402.50 13,809.10 79,443.80 45,066.50 8052.40DMU5 26,228.00 112,578.00 12,175.00 3133.00 134,252.00 16,311.00 5665.00DMU6 41,837.50 76,937.30 10,389.50 5825.40 92,347.60 39,069.60 3284.10DMU7 25,559.20 96,989.80 11,667.40 2693.50 114,181.50 17,919.60 473.30DMU8 22,987.50 70,440.10 19,220.80 6370.80 94,729.50 49,794.40 3521.00DMU9 5829.00 18,386.10 4935.10 2602.20 24,700.30 12,440.10 770.10DMU10 15,687.20 46,373.30 8772.20 22,333.90 56,137.10 33,385.90 2410.30DMU11 60,398.20 120,679.40 24,397.90 9401.60 155,483.90 61,910.90 8291.30DMU12 14,607.30 63,896.00 8537.50 4367.10 104,556.30 41,360.70 6933.40DMU13 7522.30 16,583.90 4047.30 1299.80 21,148.50 4921.80 329.00DMU14 4264.70 16,536.50 2503.80 316.40 20,484.50 9518.10 1501.50DMU15 3714.30 14,161.40 2616.90 929.40 17,425.10 3371.80 364.60DMU16 2383.40 3970.00 1004.00 1292.70 4865.50 2541.50 238.90DMU17 5970.30 21,734.80 6206.30 246.60 30,701.70 6183.90 1608.50DMU18 1157.00 3313.40 475.70 32.80 4066.10 2180.00 336.80DMU19 4799.80 13,420.40 1187.20 1369.50 15,860.50 5948.80 924.80DMU20 4267.20 13,378.20 2582.20 5787.30 17,261.50 15,512.00 796.20
Sources: Bloomberg news [23].
239
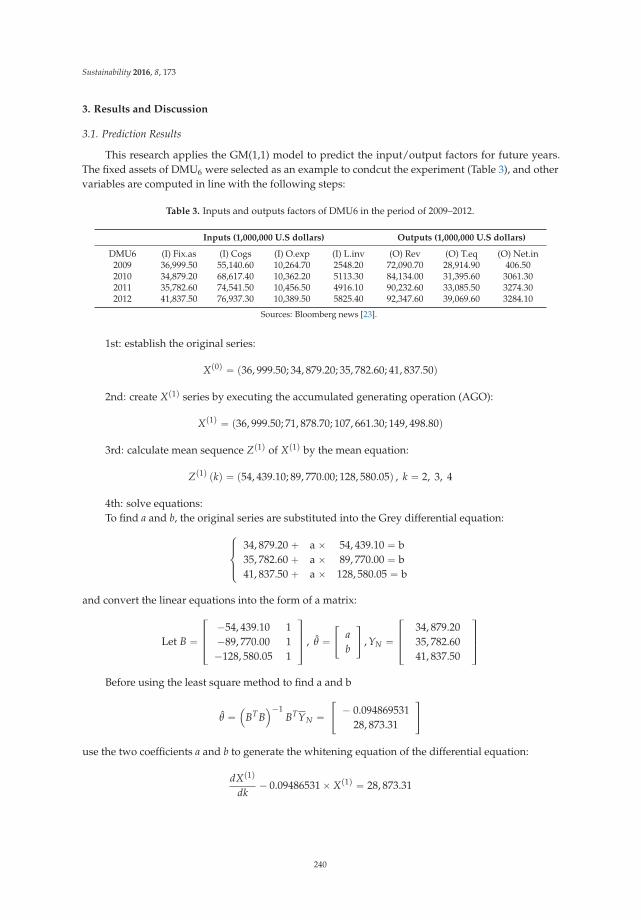
Sustainability 2016, 8, 173
3. Results and Discussion
3.1. Prediction Results
This research applies the GM(1,1) model to predict the input/output factors for future years.The fixed assets of DMU6 were selected as an example to condcut the experiment (Table 3), and othervariables are computed in line with the following steps:
Table 3. Inputs and outputs factors of DMU6 in the period of 2009–2012.
Inputs (1,000,000 U.S dollars) Outputs (1,000,000 U.S dollars)
DMU6 (I) Fix.as (I) Cogs (I) O.exp (I) L.inv (O) Rev (O) T.eq (O) Net.in2009 36,999.50 55,140.60 10,264.70 2548.20 72,090.70 28,914.90 406.502010 34,879.20 68,617.40 10,362.20 5113.30 84,134.00 31,395.60 3061.302011 35,782.60 74,541.50 10,456.50 4916.10 90,232.60 33,085.50 3274.302012 41,837.50 76,937.30 10,389.50 5825.40 92,347.60 39,069.60 3284.10
Sources: Bloomberg news [23].
1st: establish the original series:
Xp0q “ p36, 999.50; 34, 879.20; 35, 782.60; 41, 837.50q
2nd: create Xp1q series by executing the accumulated generating operation (AGO):
Xp1q “ p36, 999.50; 71, 878.70; 107, 661.30; 149, 498.80q
3rd: calculate mean sequence Zp1q of Xp1q by the mean equation:
Zp1q pkq “ p54, 439.10; 89, 770.00; 128, 580.05q , k “ 2, 3, 4
4th: solve equations:To find a and b, the original series are substituted into the Grey differential equation:
$’&’%
34, 879.20 ` a ˆ 54, 439.10 “ b35, 782.60 ` a ˆ 89, 770.00 “ b41, 837.50 ` a ˆ 128, 580.05 “ b
and convert the linear equations into the form of a matrix:
Let B “»—– ´54, 439.10 1
´89, 770.00 1´128, 580.05 1
fiffifl , θ “
«ab
ff, YN “
»—– 34, 879.20
35, 782.6041, 837.50
fiffifl
Before using the least square method to find a and b
θ “´
BT B¯´1
BTYN “«
´ 0.09486953128, 873.31
ff
use the two coefficients a and b to generate the whitening equation of the differential equation:
dXp1qdk
´ 0.09486531 ˆ Xp1q “ 28, 873.31
240
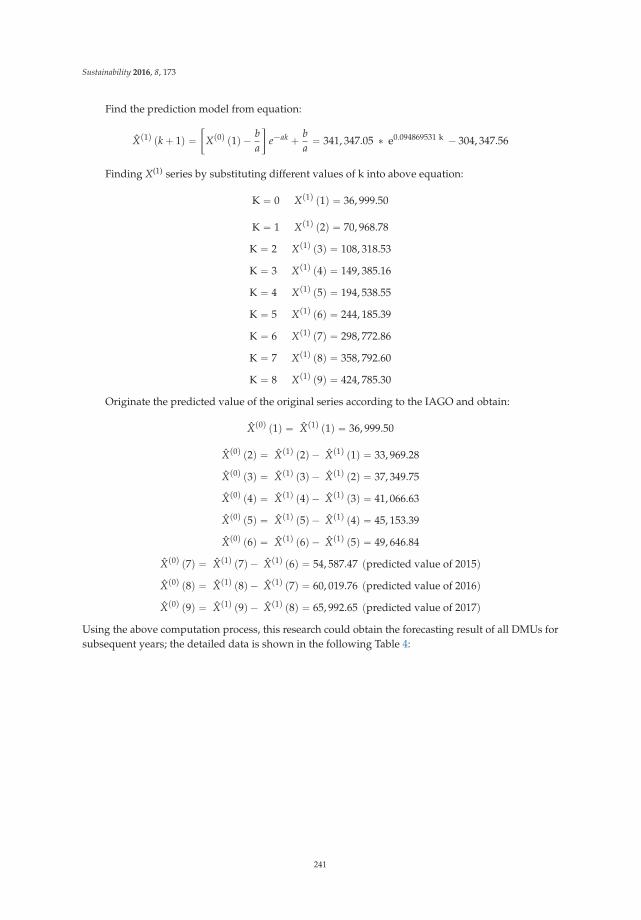
Sustainability 2016, 8, 173
Find the prediction model from equation:
Xp1q pk ` 1q “„
Xp0q p1q ´ ba
je´ak ` b
a“ 341, 347.05 ˚ e0.094869531 k ´ 304, 347.56
Finding X(1) series by substituting different values of k into above equation:
K “ 0 Xp1q p1q “ 36, 999.50
K “ 1 Xp1q p2q “ 70, 968.78
K “ 2 Xp1q p3q “ 108, 318.53
K “ 3 Xp1q p4q “ 149, 385.16
K “ 4 Xp1q p5q “ 194, 538.55
K “ 5 Xp1q p6q “ 244, 185.39
K “ 6 Xp1q p7q “ 298, 772.86
K “ 7 Xp1q p8q “ 358, 792.60
K “ 8 Xp1q p9q “ 424, 785.30
Originate the predicted value of the original series according to the IAGO and obtain:
Xp0q p1q “ Xp1q p1q “ 36, 999.50
Xp0q p2q “ Xp1q p2q ´ Xp1q p1q “ 33, 969.28
Xp0q p3q “ Xp1q p3q ´ Xp1q p2q “ 37, 349.75
Xp0q p4q “ Xp1q p4q ´ Xp1q p3q “ 41, 066.63
Xp0q p5q “ Xp1q p5q ´ Xp1q p4q “ 45, 153.39
Xp0q p6q “ Xp1q p6q ´ Xp1q p5q “ 49, 646.84
Xp0q p7q “ Xp1q p7q ´ Xp1q p6q “ 54, 587.47 ppredicted value of 2015qXp0q p8q “ Xp1q p8q ´ Xp1q p7q “ 60, 019.76 ppredicted value of 2016qXp0q p9q “ Xp1q p9q ´ Xp1q p8q “ 65, 992.65 ppredicted value of 2017q
Using the above computation process, this research could obtain the forecasting result of all DMUs forsubsequent years; the detailed data is shown in the following Table 4:
241

Sustainability 2016, 8, 173
Ta
ble
4.
Pred
icte
din
puts
and
outp
uts
valu
eof
allD
MU
sin
2016
and
2017
(cal
cula
ted
byG
M).
Inp
uts
(1,0
00,0
00
U.S
Do
llars
)O
utp
uts
(1,0
00,0
00
U.S
Do
llars
)
DM
Us
(I)
Fix
ed
Ass
ets
(I)
Co
sto
fG
oo
ds
So
ld(I
)O
pera
tin
gE
xp
en
ses
(I)
Lo
ng
-Term
Inv
est
men
ts(O
)R
ev
en
ues
(O)
To
tal
Eq
uit
y(O
)N
et
Inco
me
2016
2017
2016
2017
2016
2017
2016
2017
2016
2017
2016
2017
2016
2017
176
,687
.080
,030
.221
7,15
8.9
231,
159.
221
,093
.221
,674
.412
4,61
4.0
143,
671.
428
3,27
4.9
306,
795.
816
6,88
8.2
181,
102.
186
,510
.616
3,02
1.6
238
,145
.742
,570
.817
8,53
4.5
190,
828.
113
,791
.714
,196
.543
66.8
3925
.119
3,19
1.1
204,
363.
337
,327
.837
,250
.572
18.4
7225
.43
175,
325.
521
8,06
8.3
440,
708.
454
1,51
2.0
70,4
84.0
88,4
46.5
13,9
15.8
12,9
26.1
597,
532.
673
3,90
1.5
309,
703.
840
0,58
1.0
39,3
79.8
48,5
92.5
448
,927
.656
,836
.797
,854
.310
9,97
0.5
13,6
80.6
14,5
98.0
30,1
58.2
36,4
13.7
125,
928.
414
1,02
9.0
94,6
63.7
113,
980.
018
,263
.222
,307
.35
30,1
15.6
31,3
36.1
132,
009.
913
6,89
8.3
12,6
47.2
12,8
09.7
4785
.453
21.4
146,
889.
914
9,80
6.7
255,
175.
448
0,69
2.6
9401
.791
42.5
660
,019
.865
,992
.797
,057
.810
2,67
2.3
10,4
71.0
10,4
84.7
7474
.280
14.2
111,
709.
311
6,94
9.5
60,4
99.7
67,7
63.5
3806
.039
39.1
790
,406
.112
2,17
7.9
467,
417.
769
4,65
0.7
48,3
55.5
69,0
39.4
4189
.945
86.4
553,
201.
882
3,16
5.7
19,8
17.2
20,3
92.2
666.
261
4.5
835
,211
.139
,412
.188
,989
.295
,371
.222
,491
.623
,502
.571
13.9
7335
.811
2,88
1.3
119,
350.
763
,448
.467
,790
.184
0.9
634.
99
7800
.284
53.0
17,0
34.6
16,7
40.1
4814
.048
13.7
3,80
8.5
4288
.323
,871
.223
,731
.117
,023
.618
,511
.625
39.4
3452
.410
15,6
96.1
15,7
16.8
58,1
70.3
61,2
20.3
8950
.389
57.0
26,3
98.2
27,3
97.1
63,9
02.8
65,6
84.6
39,1
60.3
40,6
31.7
517.
436
0.8
1193
,944
.010
4,88
4.2
168,
675.
618
3,52
1.6
30,4
41.0
32,1
20.4
11,3
99.9
11,9
29.0
212,
500.
522
9,66
7.8
88,9
05.4
97,3
80.6
15,0
01.0
17,3
20.3
1214
,614
.514
,620
.711
1,82
1.0
128,
629.
111
,900
.112
,919
.788
90.3
10,6
59.5
168,
383.
518
9,64
1.2
66,6
00.4
75,0
28.9
16,0
66.7
19,6
33.6
1374
83.8
7475
.013
,790
.713
,258
.636
82.3
3611
.620
85.2
2361
.618
,188
.017
,676
.669
89.7
7626
.8(2
6.9)
(15.
5)14
8247
.397
42.0
18,3
20.8
18,6
91.4
2980
.031
07.2
584.
867
7.3
21,4
75.1
21,6
12.5
18,3
59.5
21,6
33.1
1061
.796
9.0
1537
52.8
3769
.312
,944
.612
,671
.431
34.7
3283
.519
5.9
139.
717
,123
.717
,060
.568
88.1
8292
.920
53.7
3194
.616
10,9
76.2
16,1
22.6
2782
.925
77.6
1169
.512
28.2
2212
.425
12.8
3431
.631
93.3
5032
.959
27.1
72.9
57.5
1712
,773
.615
,467
.848
,191
.758
,533
.918
,354
.124
,129
.131
5.3
336.
370
,654
.486
,707
.720
,429
.527
,357
.720
09.5
2060
.918
1887
.221
20.0
4968
.655
20.2
691.
876
3.2
569.
912
14.5
6098
.067
76.8
4676
.156
89.8
761.
093
8.4
1950
78.6
5165
.017
,717
.119
,116
.214
24.2
1495
.029
95.5
3645
.721
,553
.323
,418
.115
,263
.319
,376
.827
46.9
3565
.420
4868
.450
42.3
16,8
40.6
17,8
60.6
3156
.833
24.7
10,0
75.6
11,5
95.4
22,0
55.2
23,4
79.8
40,8
87.8
52,1
26.0
1894
.923
57.8
Sour
ce:C
alcu
late
dby
rese
arch
er.
242
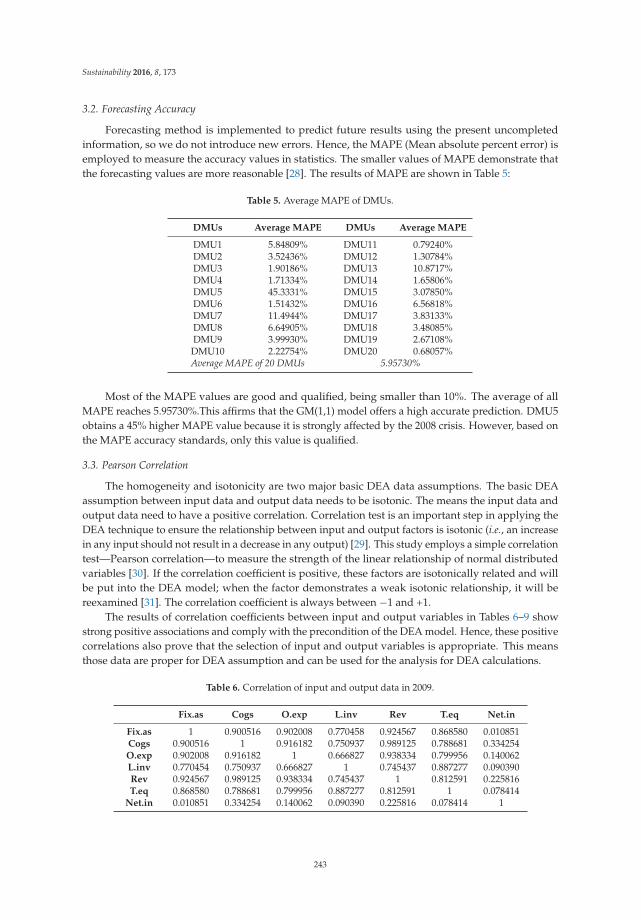
Sustainability 2016, 8, 173
3.2. Forecasting Accuracy
Forecasting method is implemented to predict future results using the present uncompletedinformation, so we do not introduce new errors. Hence, the MAPE (Mean absolute percent error) isemployed to measure the accuracy values in statistics. The smaller values of MAPE demonstrate thatthe forecasting values are more reasonable [28]. The results of MAPE are shown in Table 5:
Table 5. Average MAPE of DMUs.
DMUs Average MAPE DMUs Average MAPE
DMU1 5.84809% DMU11 0.79240%DMU2 3.52436% DMU12 1.30784%DMU3 1.90186% DMU13 10.8717%DMU4 1.71334% DMU14 1.65806%DMU5 45.3331% DMU15 3.07850%DMU6 1.51432% DMU16 6.56818%DMU7 11.4944% DMU17 3.83133%DMU8 6.64905% DMU18 3.48085%DMU9 3.99930% DMU19 2.67108%DMU10 2.22754% DMU20 0.68057%Average MAPE of 20 DMUs 5.95730%
Most of the MAPE values are good and qualified, being smaller than 10%. The average of allMAPE reaches 5.95730%.This affirms that the GM(1,1) model offers a high accurate prediction. DMU5obtains a 45% higher MAPE value because it is strongly affected by the 2008 crisis. However, based onthe MAPE accuracy standards, only this value is qualified.
3.3. Pearson Correlation
The homogeneity and isotonicity are two major basic DEA data assumptions. The basic DEAassumption between input data and output data needs to be isotonic. The means the input data andoutput data need to have a positive correlation. Correlation test is an important step in applying theDEA technique to ensure the relationship between input and output factors is isotonic (i.e., an increasein any input should not result in a decrease in any output) [29]. This study employs a simple correlationtest—Pearson correlation—to measure the strength of the linear relationship of normal distributedvariables [30]. If the correlation coefficient is positive, these factors are isotonically related and willbe put into the DEA model; when the factor demonstrates a weak isotonic relationship, it will bereexamined [31]. The correlation coefficient is always between ´1 and +1.
The results of correlation coefficients between input and output variables in Tables 6–9 showstrong positive associations and comply with the precondition of the DEA model. Hence, these positivecorrelations also prove that the selection of input and output variables is appropriate. This meansthose data are proper for DEA assumption and can be used for the analysis for DEA calculations.
Table 6. Correlation of input and output data in 2009.
Fix.as Cogs O.exp L.inv Rev T.eq Net.in
Fix.as 1 0.900516 0.902008 0.770458 0.924567 0.868580 0.010851Cogs 0.900516 1 0.916182 0.750937 0.989125 0.788681 0.334254O.exp 0.902008 0.916182 1 0.666827 0.938334 0.799956 0.140062L.inv 0.770454 0.750937 0.666827 1 0.745437 0.887277 0.090390Rev 0.924567 0.989125 0.938334 0.745437 1 0.812591 0.225816T.eq 0.868580 0.788681 0.799956 0.887277 0.812591 1 0.078414
Net.in 0.010851 0.334254 0.140062 0.090390 0.225816 0.078414 1
243
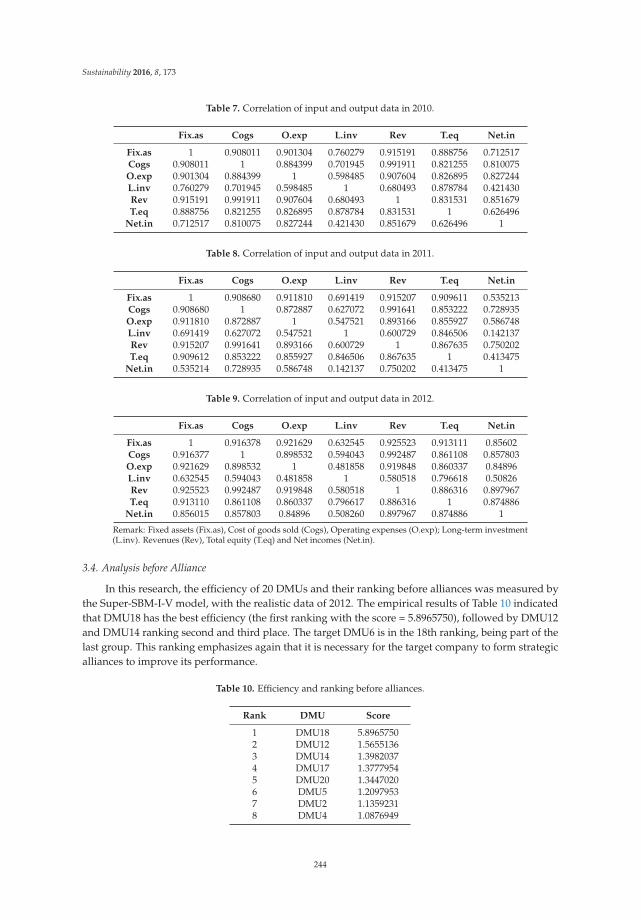
Sustainability 2016, 8, 173
Table 7. Correlation of input and output data in 2010.
Fix.as Cogs O.exp L.inv Rev T.eq Net.in
Fix.as 1 0.908011 0.901304 0.760279 0.915191 0.888756 0.712517Cogs 0.908011 1 0.884399 0.701945 0.991911 0.821255 0.810075O.exp 0.901304 0.884399 1 0.598485 0.907604 0.826895 0.827244L.inv 0.760279 0.701945 0.598485 1 0.680493 0.878784 0.421430Rev 0.915191 0.991911 0.907604 0.680493 1 0.831531 0.851679T.eq 0.888756 0.821255 0.826895 0.878784 0.831531 1 0.626496
Net.in 0.712517 0.810075 0.827244 0.421430 0.851679 0.626496 1
Table 8. Correlation of input and output data in 2011.
Fix.as Cogs O.exp L.inv Rev T.eq Net.in
Fix.as 1 0.908680 0.911810 0.691419 0.915207 0.909611 0.535213Cogs 0.908680 1 0.872887 0.627072 0.991641 0.853222 0.728935O.exp 0.911810 0.872887 1 0.547521 0.893166 0.855927 0.586748L.inv 0.691419 0.627072 0.547521 1 0.600729 0.846506 0.142137Rev 0.915207 0.991641 0.893166 0.600729 1 0.867635 0.750202T.eq 0.909612 0.853222 0.855927 0.846506 0.867635 1 0.413475
Net.in 0.535214 0.728935 0.586748 0.142137 0.750202 0.413475 1
Table 9. Correlation of input and output data in 2012.
Fix.as Cogs O.exp L.inv Rev T.eq Net.in
Fix.as 1 0.916378 0.921629 0.632545 0.925523 0.913111 0.85602Cogs 0.916377 1 0.898532 0.594043 0.992487 0.861108 0.857803O.exp 0.921629 0.898532 1 0.481858 0.919848 0.860337 0.84896L.inv 0.632545 0.594043 0.481858 1 0.580518 0.796618 0.50826Rev 0.925523 0.992487 0.919848 0.580518 1 0.886316 0.897967T.eq 0.913110 0.861108 0.860337 0.796617 0.886316 1 0.874886
Net.in 0.856015 0.857803 0.84896 0.508260 0.897967 0.874886 1
Remark: Fixed assets (Fix.as), Cost of goods sold (Cogs), Operating expenses (O.exp); Long-term investment(L.inv). Revenues (Rev), Total equity (T.eq) and Net incomes (Net.in).
3.4. Analysis before Alliance
In this research, the efficiency of 20 DMUs and their ranking before alliances was measured bythe Super-SBM-I-V model, with the realistic data of 2012. The empirical results of Table 10 indicatedthat DMU18 has the best efficiency (the first ranking with the score = 5.8965750), followed by DMU12and DMU14 ranking second and third place. The target DMU6 is in the 18th ranking, being part of thelast group. This ranking emphasizes again that it is necessary for the target company to form strategicalliances to improve its performance.
Table 10. Efficiency and ranking before alliances.
Rank DMU Score
1 DMU18 5.89657502 DMU12 1.56551363 DMU14 1.39820374 DMU17 1.37779545 DMU20 1.34470206 DMU5 1.20979537 DMU2 1.13592318 DMU4 1.0876949
244
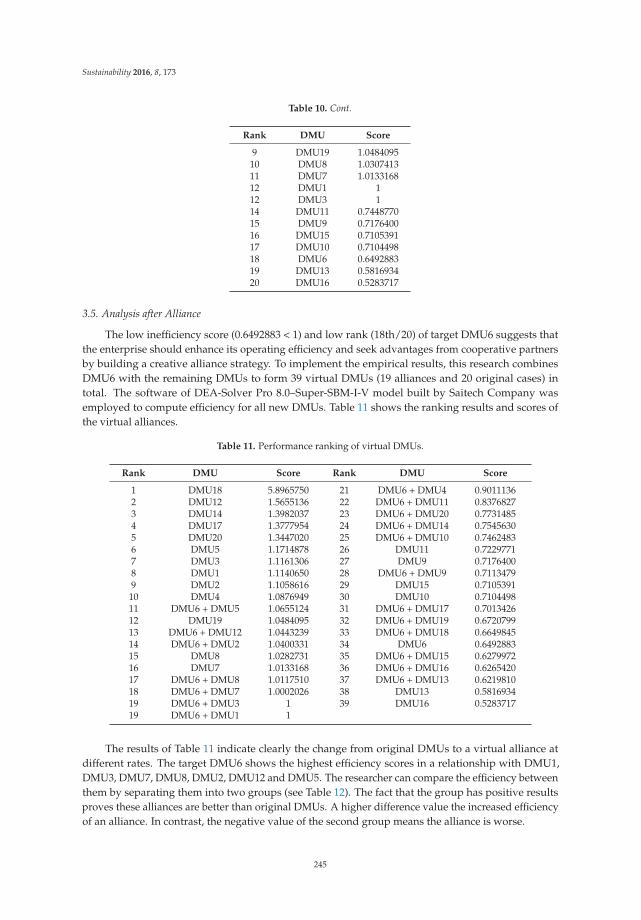
Sustainability 2016, 8, 173
Table 10. Cont.
Rank DMU Score
9 DMU19 1.048409510 DMU8 1.030741311 DMU7 1.013316812 DMU1 112 DMU3 114 DMU11 0.744877015 DMU9 0.717640016 DMU15 0.710539117 DMU10 0.710449818 DMU6 0.649288319 DMU13 0.581693420 DMU16 0.5283717
3.5. Analysis after Alliance
The low inefficiency score (0.6492883 < 1) and low rank (18th/20) of target DMU6 suggests thatthe enterprise should enhance its operating efficiency and seek advantages from cooperative partnersby building a creative alliance strategy. To implement the empirical results, this research combinesDMU6 with the remaining DMUs to form 39 virtual DMUs (19 alliances and 20 original cases) intotal. The software of DEA-Solver Pro 8.0–Super-SBM-I-V model built by Saitech Company wasemployed to compute efficiency for all new DMUs. Table 11 shows the ranking results and scores ofthe virtual alliances.
Table 11. Performance ranking of virtual DMUs.
Rank DMU Score Rank DMU Score
1 DMU18 5.8965750 21 DMU6 + DMU4 0.90111362 DMU12 1.5655136 22 DMU6 + DMU11 0.83768273 DMU14 1.3982037 23 DMU6 + DMU20 0.77314854 DMU17 1.3777954 24 DMU6 + DMU14 0.75456305 DMU20 1.3447020 25 DMU6 + DMU10 0.74624836 DMU5 1.1714878 26 DMU11 0.72297717 DMU3 1.1161306 27 DMU9 0.71764008 DMU1 1.1140650 28 DMU6 + DMU9 0.71134799 DMU2 1.1058616 29 DMU15 0.7105391
10 DMU4 1.0876949 30 DMU10 0.710449811 DMU6 + DMU5 1.0655124 31 DMU6 + DMU17 0.701342612 DMU19 1.0484095 32 DMU6 + DMU19 0.672079913 DMU6 + DMU12 1.0443239 33 DMU6 + DMU18 0.664984514 DMU6 + DMU2 1.0400331 34 DMU6 0.649288315 DMU8 1.0282731 35 DMU6 + DMU15 0.627997216 DMU7 1.0133168 36 DMU6 + DMU16 0.626542017 DMU6 + DMU8 1.0117510 37 DMU6 + DMU13 0.621981018 DMU6 + DMU7 1.0002026 38 DMU13 0.581693419 DMU6 + DMU3 1 39 DMU16 0.528371719 DMU6 + DMU1 1
The results of Table 11 indicate clearly the change from original DMUs to a virtual alliance atdifferent rates. The target DMU6 shows the highest efficiency scores in a relationship with DMU1,DMU3, DMU7, DMU8, DMU2, DMU12 and DMU5. The researcher can compare the efficiency betweenthem by separating them into two groups (see Table 12). The fact that the group has positive resultsproves these alliances are better than original DMUs. A higher difference value the increased efficiencyof an alliance. In contrast, the negative value of the second group means the alliance is worse.
245
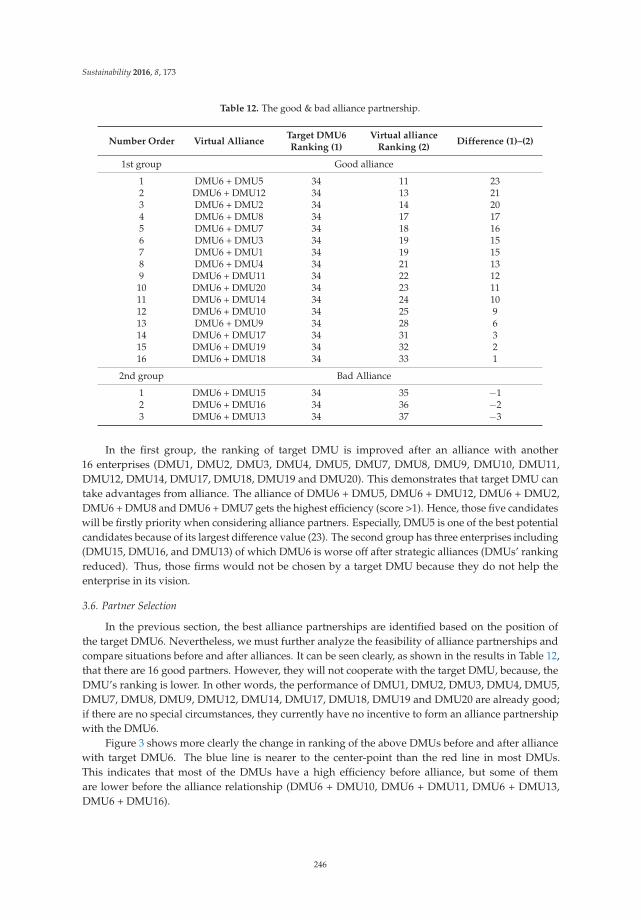
Sustainability 2016, 8, 173
Table 12. The good & bad alliance partnership.
Number Order Virtual AllianceTarget DMU6Ranking (1)
Virtual allianceRanking (2)
Difference (1)–(2)
1st group Good alliance
1 DMU6 + DMU5 34 11 232 DMU6 + DMU12 34 13 213 DMU6 + DMU2 34 14 204 DMU6 + DMU8 34 17 175 DMU6 + DMU7 34 18 166 DMU6 + DMU3 34 19 157 DMU6 + DMU1 34 19 158 DMU6 + DMU4 34 21 139 DMU6 + DMU11 34 22 1210 DMU6 + DMU20 34 23 1111 DMU6 + DMU14 34 24 1012 DMU6 + DMU10 34 25 913 DMU6 + DMU9 34 28 614 DMU6 + DMU17 34 31 315 DMU6 + DMU19 34 32 216 DMU6 + DMU18 34 33 1
2nd group Bad Alliance
1 DMU6 + DMU15 34 35 ´12 DMU6 + DMU16 34 36 ´23 DMU6 + DMU13 34 37 ´3
In the first group, the ranking of target DMU is improved after an alliance with another16 enterprises (DMU1, DMU2, DMU3, DMU4, DMU5, DMU7, DMU8, DMU9, DMU10, DMU11,DMU12, DMU14, DMU17, DMU18, DMU19 and DMU20). This demonstrates that target DMU cantake advantages from alliance. The alliance of DMU6 + DMU5, DMU6 + DMU12, DMU6 + DMU2,DMU6 + DMU8 and DMU6 + DMU7 gets the highest efficiency (score >1). Hence, those five candidateswill be firstly priority when considering alliance partners. Especially, DMU5 is one of the best potentialcandidates because of its largest difference value (23). The second group has three enterprises including(DMU15, DMU16, and DMU13) of which DMU6 is worse off after strategic alliances (DMUs’ rankingreduced). Thus, those firms would not be chosen by a target DMU because they do not help theenterprise in its vision.
3.6. Partner Selection
In the previous section, the best alliance partnerships are identified based on the position ofthe target DMU6. Nevertheless, we must further analyze the feasibility of alliance partnerships andcompare situations before and after alliances. It can be seen clearly, as shown in the results in Table 12,that there are 16 good partners. However, they will not cooperate with the target DMU, because, theDMU’s ranking is lower. In other words, the performance of DMU1, DMU2, DMU3, DMU4, DMU5,DMU7, DMU8, DMU9, DMU12, DMU14, DMU17, DMU18, DMU19 and DMU20 are already good;if there are no special circumstances, they currently have no incentive to form an alliance partnershipwith the DMU6.
Figure 3 shows more clearly the change in ranking of the above DMUs before and after alliancewith target DMU6. The blue line is nearer to the center-point than the red line in most DMUs.This indicates that most of the DMUs have a high efficiency before alliance, but some of themare lower before the alliance relationship (DMU6 + DMU10, DMU6 + DMU11, DMU6 + DMU13,DMU6 + DMU16).
246
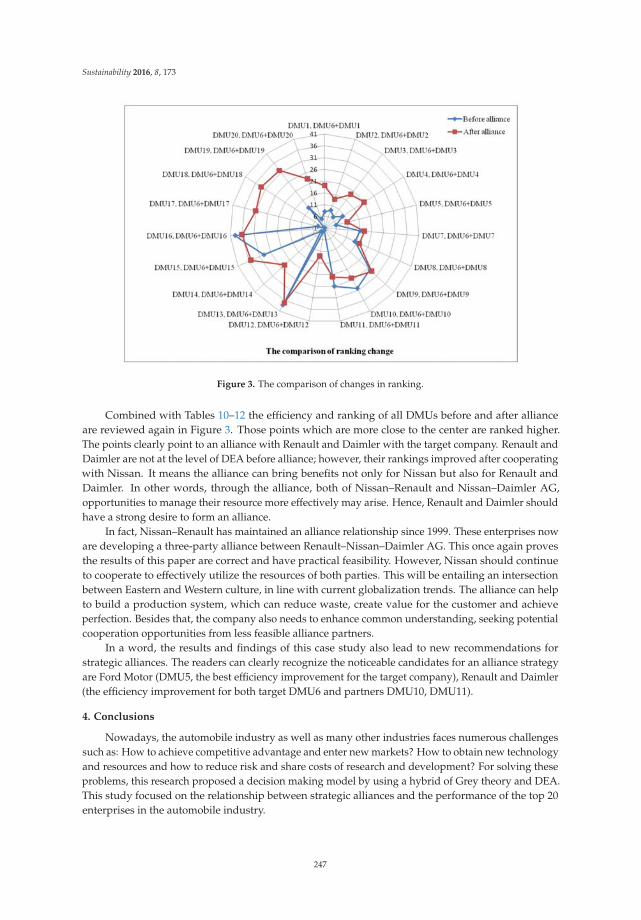
Sustainability 2016, 8, 173
Figure 3. The comparison of changes in ranking.
Combined with Tables 10–12 the efficiency and ranking of all DMUs before and after allianceare reviewed again in Figure 3. Those points which are more close to the center are ranked higher.The points clearly point to an alliance with Renault and Daimler with the target company. Renault andDaimler are not at the level of DEA before alliance; however, their rankings improved after cooperatingwith Nissan. It means the alliance can bring benefits not only for Nissan but also for Renault andDaimler. In other words, through the alliance, both of Nissan–Renault and Nissan–Daimler AG,opportunities to manage their resource more effectively may arise. Hence, Renault and Daimler shouldhave a strong desire to form an alliance.
In fact, Nissan–Renault has maintained an alliance relationship since 1999. These enterprises noware developing a three-party alliance between Renault–Nissan–Daimler AG. This once again provesthe results of this paper are correct and have practical feasibility. However, Nissan should continueto cooperate to effectively utilize the resources of both parties. This will be entailing an intersectionbetween Eastern and Western culture, in line with current globalization trends. The alliance can helpto build a production system, which can reduce waste, create value for the customer and achieveperfection. Besides that, the company also needs to enhance common understanding, seeking potentialcooperation opportunities from less feasible alliance partners.
In a word, the results and findings of this case study also lead to new recommendations forstrategic alliances. The readers can clearly recognize the noticeable candidates for an alliance strategyare Ford Motor (DMU5, the best efficiency improvement for the target company), Renault and Daimler(the efficiency improvement for both target DMU6 and partners DMU10, DMU11).
4. Conclusions
Nowadays, the automobile industry as well as many other industries faces numerous challengessuch as: How to achieve competitive advantage and enter new markets? How to obtain new technologyand resources and how to reduce risk and share costs of research and development? For solving theseproblems, this research proposed a decision making model by using a hybrid of Grey theory and DEA.This study focused on the relationship between strategic alliances and the performance of the top 20enterprises in the automobile industry.
247
Sustainability 2016, 8, 173
Based on the realistic public data of automobile enterprises from 2009 to 2012, this studyused GM(1,1) model to predict the future change in value of the specific input/output variables.The accuracy forecast value had been tested by average MAPE and a reliable percentage of 5.9573%was obtained.
Nissan was used as a case study to determine the potential benefits of strategic alliances betweenfirms. The DEA-Super SBM model was applied to evaluate efficiency all real DMUs and virtual DMUs.The empirical results showed that 16 candidates are suitable for Nissan to form strategic alliances with,of which Ford, BMW, General Motors, Honda, and Fiat are strongly recommended. However, onlytwo partnerships are feasible for Nissan (Nissan–Renault and Nissan–Daimler). If a firm decides toform an alliance, it is necessary to conduct extensive an assessment of performance before and afterthe alliance in terms of many aspects.
In conclusion, by combining Grey theory and the Super SBM model, this research proposed a newaccurate and appropriate approach to forecast and evaluate automobile firms. This model provides areference for decision making for automaker strategists when developing alliance strategies.
The DEA is one kind of sensitive method for factor selection. The selection of input/outputvariables could be different, and the results would be impacted. Therefore, robust checking is necessary.The different input/output variables and removing outlierd from DMUs should be re-calculatedand re-discussed.
For future study, sensitive analysis for different inputs or outputs of DMUs or data of differentyears can be discussed further. Moreover, the methodology should be further developed by usingqualitative data and should be applied in different industries.
Author Contributions: Author Contributions: In this paper, Chia-Nan Wang contributed to design the theoreticalverifications. Xuan-Tho Nguyen collected and analyzed data and prepared for the manuscript. Yen-Hui Wang isinvolved in results discussion. All authors have both read and approved the manuscript.
Conflicts of Interest: Conflicts of Interest: The authors declare no conflict of interest.
References
1. Haugh, D.; Mourougane, A.; Chatal, O. The automobile industry in and beyond the crisis. OECD Econ. Dep.Work. Pap. 2010, 2009. [CrossRef]
2. OICA. World Ranking of Manufacturers. Available online: http://www.oica.net/wp-content/uploads/2013/03/worldpro2012-modification-ranking.pdf (accessed on 20 May 2014).
3. Global Retail Sales Volume/Market Share. Available online: http://www.nissan-global.com/EN/DOCUMENT/PDF/AR/2014/p23_e.pdf (accessed on 12 August 2015).
4. Renault-Nissan to Launch More than 10 Driverless Cars through 2020. Available online: http://www.autoevolution.com/news/renault-nissan-to-launch-more-than-10-driverless-cars-through-2020-103503.html(accessed on 25 January 2016).
5. Toyota and Nissan Recall 6.5 Million Cars Over Airbags. Available online: http://www.bbc.com/news/business-32716802 (accessed on 13 May 2015).
6. Nisan Annual Report. Available online: http://www.nissan-global.com/EN/DOCUMENT/PDF/AR/2013/AR2013_E_All.pdf (accessed on 20 May 2014).
7. James, D.B.; Benjamin, G.C.; Michael, S.R. Mastering Alliance Strategy; John Wiley & Sons, Inc: New York, NY,USA, 2003; pp. 1–19.
8. Mockler, R.J. Multinational strategic alliances: A manager’s perspective. Strateg. Chang. 1997, 6, 391–405.[CrossRef]
9. Brouthers, K.D.; Bamossy, G.J. Post-formation processes in eastern and western European joint ventures.J. Manag. Stud. 2006, 43, 203–229. [CrossRef]
10. Cravens, D.W.; Shipp, S.H.; Cravens, K.S. Analysis of cooperative inter-organizational relationships, strategicalliance formation, and strategic alliance effectiveness. J. Strateg. Mark. 1993, 1, 55–70. [CrossRef]
11. Chan, S.H.; Kensinger, J.W.; Keown, A.J.; Martin, J.D. Do strategic alliances create value? J. Financ. Econ.1997, 46, 199–221. [CrossRef]
248
Sustainability 2016, 8, 173
12. Candace, E.Y.; Thomas, A.T. Strategic alliances with competing firms and shareholder value. J. Manag.Mark. Res. 2011, 6, 1–10.
13. Cho, B.S.; Kang, S.W.; Cha, S.M. Trends in telecommunication strategic alliance regulation. In Proceedings ofthe IEEE Technology Management for the Global Future, Istanbul, Turkey, 8–13 July 2006; IEEE: Piscataway,NJ, USA, 2006; Volume 4, pp. 1994–2004.
14. Kauser, S.; Shaw, V. International strategic alliances: Objectives, motives and success. J. Glob. Mark. 2004, 17,7–43. [CrossRef]
15. Deng, J.L. Control problems of Grey systems. Syst. Control Lett. 1982, 5, 288–294.16. Deng, J.L. Introduction to Grey system theory. J. Grey Syst. 1989, 1, 1–24.17. Farrell, M.J. The measurement of productivity efficiency. J. R. Stat. Soc. 1957, 120, 499–513.18. Charnes, A.; Cooper, W.W.; Rhodes, E. Measuring the efficiency of decision making units. Eur. J. Oper. Res.
1978, 2, 429–444. [CrossRef]19. Martín, J.C.; Roman, C. An application of DEA to measure the efficiency of Spanish airports prior to
privatization. J. Air Transp. Manag. 2001, 7, 149–157. [CrossRef]20. Wang, C.N.; Li, K.Z.; Ho, C.T.; Yang, K.L.; Wang, C.H. A model for candidate selection of strategic alliances:
Case on industry of department store. In Proceedings of the Second International Conference on InnovativeComputing, Information and Control, Kumamoto, Japan, 5–7 September 2007; IEEE: Piscataway, NJ,USA, 2007.
21. Wang, R.T.; Ho, C.T.B.; Oh, K. Measuring production and marketing efficiency using grey relation analysisand data envelopment analysis. Int. J. Prod. Res. 2010, 48, 183–199. [CrossRef]
22. Yuan, L.N.; Tian, L.N. A new DEA model on science and technology resources of industrial enterprises.Int. Conf. Mach. Learn. Cybern. 2012, 3, 986–990.
23. Bloomberg Business Week. Available online: http://www.business-week.com/ (accessed on 5 May 2014).24. Tone, K.A. Slacks-based measure of efficiency in data envelopment analysis. Eur. J. Oper. Res. 2001, 130,
498–509. [CrossRef]25. Düzakın, E.; Düzakın, H. Measuring the performance of manufacturing firms with super slacks based model
of data envelopment analysis: An application of 500 major industrial enterprises in Turkey. Eur. J. Oper. Res.2007, 182, 1412–1432. [CrossRef]
26. Tone, K. A slacks-based measure of super-efficiency in data envelopment analysis. Eur. J. Oper. Res. 2002,143, 32–41. [CrossRef]
27. IAS (International Accounting Standards). Available online: http://www.iasplus.com/en/standards/ias(accessed on 20 May 2014).
28. Stevenson, W.J.; Sum, C.C. Operations Management: An Asian Perspective; McGraw-Hill Education (Asia):Singapore, 2010.
29. Golany, B.; Roll, Y. An application procedure for DEA. Omega 1989, 17, 237–250. [CrossRef]30. Pruessner, J.C.; Kirschbaum, C.; Meinlschmid, G.; Hellhammer, D.H. Two formulas for computation of the
area under the curve represent measures of total hormone concentration versus time-dependent change.Psychoneuroendocrinology 2003, 28, 916–931. [CrossRef]
31. Lo, F.Y.; Chien, C.F.; Lin, J.T. A DEA study to evaluate the relative efficiency and investigate the districtreorganization of the Taiwan power company. IEEE Trans. Power Syst. 2001, 16, 170–178. [CrossRef]
© 2016 by the authors. Licensee MDPI, Basel, Switzerland. This article is an open accessarticle distributed under the terms and conditions of the Creative Commons Attribution(CC BY) license (http://creativecommons.org/licenses/by/4.0/).
249
sustainability
Article
Does Business Model Affect CSR Involvement?A Survey of Polish Manufacturing andService Companies
Marzanna Katarzyna Witek-Hajduk and Piotr Zaborek *
Institute of International Marketing and Management, Collegium of World Economy,Warsaw School of Economics, 162 Niepodległosci Ave., Warsaw 02-554, Poland* Correspondence: [email protected]; Tel: +48-502119774
Academic Editor: Adam JabłonskiReceived: 27 November 2015; Accepted: 12 January 2016; Published: 15 February 2016
Abstract: The study explores links between types of business models used by companies andtheir involvement in CSR. As the main part of our conceptual framework we used a businessmodel taxonomy developed by Dudzik and Witek-Hajduk, which identifies five types of models:traditionalists, market players, contractors, distributors, and integrators. From shared characteristicsof the business model profiles, we proposed that market players and integrators will showsignificantly higher levels of involvement in CSR than the three other classes of companies.Among other things, both market players and integrators relied strongly on building own brand valueand fostering harmonious supply channel relations, which served as a rationale for our hypothesis.The data for the study were obtained through a combined CATI and CAWI survey on a group of385 managers of medium and large enterprises. The sample was representative for the three Polishindustries of chemical manufacturing, food production, and retailing. Statistical methods includedconfirmatory factor analysis and one-way ANOVA with contrasts and post hoc tests. The findingssupported our hypothesis, showing that market players and integrators were indeed more engaged inCSR than other groups of firms. This may suggest that managers in control of these companies couldbolster the integrity of their business models by increasing CSR involvement. Another importantcontribution of the study was to propose and validate a versatile scale for assessing CSR involvement,which showed measurement invariance for all involved industries.
Keywords: business models; CSR; sustainable development; medium and large companies; Poland
1. Introduction
The concepts of Corporate Social Responsibility (CSR) and business models have been frequentlyaddressed in academic studies in the last decades. Both of these concepts are often listed among the keyconcerns in contemporary management theory and practice. They are looked at from various researchperspectives, including macroeconomic [1], microeconomic [2], management [3,4], and marketing [5].There is no lack of conceptual studies trying to integrate CSR with developing strategies and businessmodels. For example, Pyszka [6] is proposing a mechanism whereby traditional business models canbe transformed into CSR-enabled ones, with the aim of enhancing a company’s competitive advantage,in particular its innovativeness. When it comes to practical guidance for managers, some authorsdeveloped various sets of tools that practitioners can use to diagnose the current state of CSR andsustainability involvement and implement needed changes, bearing in mind the short- and long-termeconomic benefits for the company. In this vein, Bocken et al. [7] offer a number of value-mapping toolsto support sustainable business modeling, including the interests of the four major stakeholder groups,here labeled as environment, society, customer, and network actors. The topic of the interlink between
Sustainability 2016, 8, 93; doi:10.3390/su8020093 www.mdpi.com/journal/sustainability250
Sustainability 2016, 8, 93
CSR, sustainability, business models, and strategy is also ever-present in business and trade journals,where various authors often depict these management concepts as means of enhancing competitivenessand achieving other benefits [8]. What these published works, both academic and otherwise, have incommon is a lack of empirical proof (as in the case of conceptual papers) or reliance on qualitative andanecdotal evidence e.g., [9,10]. In fact, there is a surprising dearth of works exploring the quantitativeevidence for possible links between types of adopted business models and the level of CSR practices.As such, the aim of our paper is to address this issue and attempt to bridge the knowledge gap.Building on previous studies, we conclude that the type of business model used should affect a firm’sCSR involvement, and then test this proposition with survey data collected from managers of mediumand large companies in Polish manufacturing and service industries.
The paper is structured as follows. First, we summarize relevant literature sources on CSR todiscuss various understandings of the concept. Next, we survey popular definitions and taxonomiesof business models. The third section looks at previous studies where associations between businessmodels and CSR were investigated. Then, we detail the business model definition and classificationadopted in this paper and set out the rationale for our hypotheses. The methods section comes next,followed by findings. The paper concludes with a discussion of theoretical and practical implicationsof the study, limitations, and suggestions for further research.
2. Corporate Social Responsibility in Literature
Corporate Social Responsibility and related concepts (e.g., sustainable development) have beenplaying an increasingly prominent role in recent years, both in economic and academic research.Despite its popularity—and perhaps in part because of it—authors of numerous publications in thisarea have not shown a uniform understanding of these constructs, which are sometimes vague andtends to vary from publication to publication. This is reflected in how many distinct terms wereused, including Corporate Sustainability and Responsibility, Corporate Citizenship, Corporate SocialRectitude, Corporate Social Performance, Corporate Social Responsiveness, Social Performance, orSustainable Responsible Business. In fact, in a review of the CSR literature Dahlsrud [11] counted nofewer than 37 different definitions of the concept. Below we shortly outline the history of the idea ofsustainable responsibility and wrap up by offering the definition that we assumed in our study.
In terms of social duties of business, for many years the dominant perspective was that ofFriedman [12], who maintained that what firms should care for was generating profits, and socialresponsibilities were no concern of business; indeed, his strongly held conviction was that any actionon the part of managers that did not amount to increased profits was tantamount to theft. However, thenotion of firms supporting social goals is not new, since the first publications on this topic appearedin the 1930s, e.g., [13,14], and the first formalized definitions date back to the 1950s–60s [15–20].Rapid growth in CSR has been particularly evident since the 70s, when accelerating globalization madethe impact of companies on society and environment a more pertinent problem than ever before [21].At that time, it was proposed that CSR could offer effective solutions for outstanding societal issues, inlarge part due to the strong effects of businesses, in particular multinationals, on economy, politics,environment, and local communities [22]. In the 1980s the idea of sustainable development emerged torepresent such “development that meets the needs of the present without compromising the ability ofthe future generations to meet their own needs” [23]. Its proponents advocate sustainable developmentin economy, society, and the natural environment that would aim to eradicate poverty and moderateexcessive consumption in both developed and developing countries [24]. As noted by Vos [25], manydefinitions of sustainability are similar in that they identify three aspects of the term: economic, social,and environmental.
The growing importance of CSR was recognized by the International Organization forStandardization (ISO), which set up a special task group for social responsibility. As a result ofthe group’s work, a system of guidelines was revealed in 2010 to help businesses operate in a more“ethical and transparent way that contributes to the health and welfare of society” [26]. The ISO 2600manual outlines specific benefits that can be derived from implementing CSR principles, includingenhancing competitive advantage; attracting and retaining employees, shareholders, and clients;
251
Sustainability 2016, 8, 93
improving the morale, commitment, and productivity of employees; and fostering better image andgoodwill from clients, suppliers, local communities, and other stakeholders of the company.
The first definition of CSR that gained wide acceptance was that of Caroll [27]. Caroll proposeda CSR pyramid with four levels representing CSR dimensions: (1) economical (at the base of thepyramid; denoting all activities yielding profit for the company’s owners), (2) legal (acting withinthe law regulating environmental protection, consumer and employee relations, and adhering tocontractual agreements), (3) ethical (acting in an ethical and honest way towards stakeholders), and(4) philanthropic (the firm as a good citizen should undertake special programs for the benefit ofthe society). Later on, Schwartz and Caroll [28], building on the previous model, came up with anon-hierarchical structure with only three dimensions—economical, legal, and ethical—whereby thephilanthropic element was split between economical and ethical areas, depending on the dominantunderlying motivations behind specific charitable activities. Another popular conceptualization ofCSR, known as the triple bottom line (TBL), calls for companies to operate in ways that are sociallyresponsible, eco-friendly, and economically valuable [29]. The three focal points of TBL are people(involving responsible business practices towards employees, customers, society at large, and localcommunities), the planet (activities aimed at protecting the natural environment), and economic value,or profits earned after contributing to the other two CSR dimensions. According to the TBL perspective,its three dimensions are equal in terms of importance, which should be reflected in corporate reporting.Therefore, not only financial metrics should be reported, but also accounts of the company’s socialand ecological performance. Such integrative reports should merge both short-term and long-termperspectives [30]. One of the most recent outlooks on CSR and the last one reviewed in this section isthat of Chen and Wongsurawat [31], whose definition we chose to adopt in our research. These authorslooked to combine Caroll’s [27] perspective and TBL with the ISO recommendations. In their viewCSR should encompass: (1) competitiveness (i.e., cooperation with stakeholders in building strongmarket position of the company and its products); (2) transparency (removing barriers for members ofthe public to accessing corporate information; the aim here is to provide means for fast and efficientcommunication with a wider audience on the firm’s activities with potential social and environmentalimpacts); (3) responsibility (complying with legal regulations and contractual terms pertaining todifferent stakeholder groups); (4) accountability (making thoughtful and justified business decisionsaccommodating the interests of various groups of stakeholders).
To sum up the discussion so far on popular conceptualizations of CSR, and to present our ownunderstanding of the concept used in this work, we distinguish the following four aspects of theCSR involvement: (1) value chain relations (entailing conscientious attitude in interactions withsuppliers, customers, and other supply chain partners); (2) community relations (communication,cooperation, and support for local and wider social partners); (3) natural environment (commitment torunning business operations with the smallest possible negative impacts on the environment); and(4) employee relations (all corporate socially responsible activities aimed at employees). In keepingwith the above taxonomy of CSR, we developed a Likert-type scale for use in the survey questionnaire.The measurement scale was outlined in more detail in the methods section.
3. Overview of Conceptualizations of Business Models
The interest in business models has grown, particularly since the 1990s, when a number of seminalpapers were published. The dominant theme for many papers was Internet business, which coincidedwith—and was sparked by—the dot-com boom and bust, e.g., [32–35]. Academic writing on businessmodels, even more so than on CSR, is affected by a lack of consensus as to what constitutes a businessmodel. So far many definitions and typologies had been proffered, some more popular than others,but no single dominant approach emerged. On the other hand, and quite similar to CSR, most viewsof business models have considerable overlap, which makes it easier and more meaningful to comparefindings across different works. In this section we summarize the more popular ways to think aboutbusiness models, and present our own approach that was used in the questionnaire design to collectresponses from managers.
252
Sustainability 2016, 8, 93
One way to look at business models was offered by Afuah and Tucci [33], who proposed thatit is how a firm builds up and deploys its resources to provide customers with products of valuesuperior to competitors’ offerings in order to generate profits. According to Linder and Cantrell [36], abusiness model is a logical basis for creating a company’s value , reflected in a coherent action planaimed at developing a strategy that meets customer expectations through the optimal use of resourcesand relations. Here, a business model specifies such elements as: types of customers, products orservices, pricing policy, customer benefits, distribution channels, unique competences, and revenuesources. Betz [37] considers a business model as a composition of three elements necessary for thefirm to operate: benefits or values for customers and business partners, revenue sources, and logisticsarrangements. Osterwalder et al. [38] give the following constituting elements of business modelsas part of their strategic template for crafting new or documenting existing business models: valueproposition for customers, corporate infrastructure (including key activities, key resources, and partnernetwork), targeted customers (composed of market segmentation, distribution channels, and customerrelationships), cost structures, and revenue streams.
In terms of business model typologies, many authors propose divergent classifications basedon different sets of criteria, with many of them mostly relevant to e-business [32,33,35,39–42]. Just ahandful of authors attempted to develop a more universal typology system, suitable for classifying awider range of business models, including traditional, “bricks-and-mortar” companies [36,37,43–46].
4. Earlier Studies on the Links between Business Models and CSR
Even though the problem of how companies with different types of business models get involvedin CSR has arguably both practical and theoretical merits, it has rarely been explored as a topicof an academic study. Some authors proposed to introduce new paradigms in management toeffectively counteract social and environmental degradation, e.g., [47–50], but only a few incorporatedelements of business models in their analyses of CSR, e.g., [51–54]. In recent years, several newpertinent management concepts emerged, such as so-called “sustainable business models” [55–57],“sustainability business models” [58], “business models for sustainability” [51], and “sustaining supplychain management” [59–61]. All of these new constructs build on the theory of corporate sustainabilitymanagement, which—at a general level—aims to integrate multiple corporate activities and impacts insocietal, environmental, and economic areas. Those authors give different definitions of sustainablebusiness models (SBM); for example, they say that it is “a model where sustainability concepts are thedriving force of the firm and its decision making” [58], or ”a new model of the firm where sustainabilityconcepts play an integral role in shaping the mission or driving force of the firm and its decisionmaking” [62]. Regarding the interplay between business models and CSR, some authors suggestthe existence of a feedback loop, whereby certain types of business models can foster stronger CSRinvolvement [63], while implementing CSR has the potential to transform business models in thelong run [53]. In the same vein, Schaltegger and Wagner [64] observe that business models of firmsfollowing CSR principles are changing both through purposeful effort and unconscious adjustments.This points to the conclusion that not only strategic management but also daily operational tasks arefactors in shaping a business model setup. This view finds support in Elkington [55], who noted thatbusiness models are determinants of organizational behaviors, and as such have influence on strategicmanagement as well as operations, including assorted CSR activities. The literature, but also morecasual observations and common experience, imply that sustainable management, CSR, and businessmodels are in constant interaction, and firms intending to improve their CSR metrics have to worktowards revising their business model [65]. Indeed, deep changes to a business model can be a way ofachieving radical improvement to a firm’s CSR status through creating more environmental and socialvalue in an economically viable manner [58,66,67], or—to put it another way—capturing economicvalue while generating social and environmental values [7]. Accordingly, the concept of businessmodels could be a useful tool for reconciling and integrating the often divergent needs and wants ofstakeholders in terms of the sustainable development of a company [68]. For that purpose, firms shouldmake a conscious effort to plan and manage the sustainability aspects of their business models [51].
253
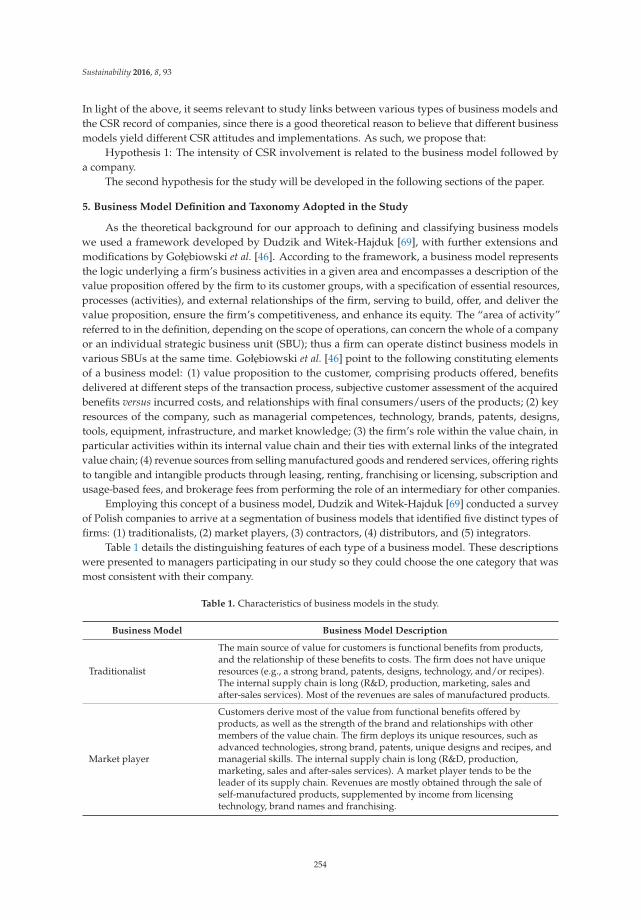
Sustainability 2016, 8, 93
In light of the above, it seems relevant to study links between various types of business models andthe CSR record of companies, since there is a good theoretical reason to believe that different businessmodels yield different CSR attitudes and implementations. As such, we propose that:
Hypothesis 1: The intensity of CSR involvement is related to the business model followed bya company.
The second hypothesis for the study will be developed in the following sections of the paper.
5. Business Model Definition and Taxonomy Adopted in the Study
As the theoretical background for our approach to defining and classifying business modelswe used a framework developed by Dudzik and Witek-Hajduk [69], with further extensions andmodifications by Gołebiowski et al. [46]. According to the framework, a business model representsthe logic underlying a firm’s business activities in a given area and encompasses a description of thevalue proposition offered by the firm to its customer groups, with a specification of essential resources,processes (activities), and external relationships of the firm, serving to build, offer, and deliver thevalue proposition, ensure the firm’s competitiveness, and enhance its equity. The “area of activity”referred to in the definition, depending on the scope of operations, can concern the whole of a companyor an individual strategic business unit (SBU); thus a firm can operate distinct business models invarious SBUs at the same time. Gołebiowski et al. [46] point to the following constituting elementsof a business model: (1) value proposition to the customer, comprising products offered, benefitsdelivered at different steps of the transaction process, subjective customer assessment of the acquiredbenefits versus incurred costs, and relationships with final consumers/users of the products; (2) keyresources of the company, such as managerial competences, technology, brands, patents, designs,tools, equipment, infrastructure, and market knowledge; (3) the firm’s role within the value chain, inparticular activities within its internal value chain and their ties with external links of the integratedvalue chain; (4) revenue sources from selling manufactured goods and rendered services, offering rightsto tangible and intangible products through leasing, renting, franchising or licensing, subscription andusage-based fees, and brokerage fees from performing the role of an intermediary for other companies.
Employing this concept of a business model, Dudzik and Witek-Hajduk [69] conducted a surveyof Polish companies to arrive at a segmentation of business models that identified five distinct types offirms: (1) traditionalists, (2) market players, (3) contractors, (4) distributors, and (5) integrators.
Table 1 details the distinguishing features of each type of a business model. These descriptionswere presented to managers participating in our study so they could choose the one category that wasmost consistent with their company.
Table 1. Characteristics of business models in the study.
Business Model Business Model Description
Traditionalist
The main source of value for customers is functional benefits from products,and the relationship of these benefits to costs. The firm does not have uniqueresources (e.g., a strong brand, patents, designs, technology, and/or recipes).The internal supply chain is long (R&D, production, marketing, sales andafter-sales services). Most of the revenues are sales of manufactured products.
Market player
Customers derive most of the value from functional benefits offered byproducts, as well as the strength of the brand and relationships with othermembers of the value chain. The firm deploys its unique resources, such asadvanced technologies, strong brand, patents, unique designs and recipes, andmanagerial skills. The internal supply chain is long (R&D, production,marketing, sales and after-sales services). A market player tends to be theleader of its supply chain. Revenues are mostly obtained through the sale ofself-manufactured products, supplemented by income from licensingtechnology, brand names and franchising.
254
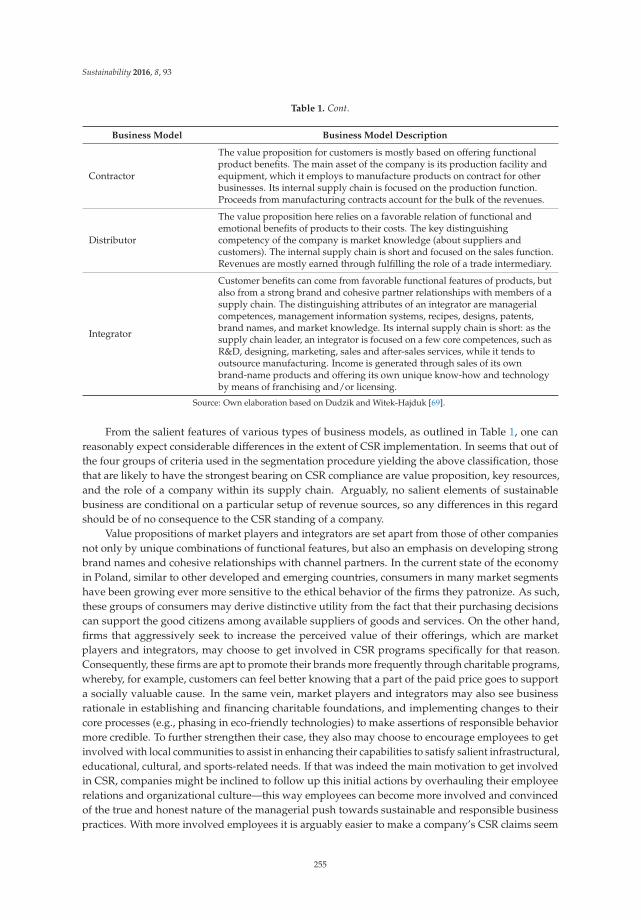
Sustainability 2016, 8, 93
Table 1. Cont.
Business Model Business Model Description
Contractor
The value proposition for customers is mostly based on offering functionalproduct benefits. The main asset of the company is its production facility andequipment, which it employs to manufacture products on contract for otherbusinesses. Its internal supply chain is focused on the production function.Proceeds from manufacturing contracts account for the bulk of the revenues.
Distributor
The value proposition here relies on a favorable relation of functional andemotional benefits of products to their costs. The key distinguishingcompetency of the company is market knowledge (about suppliers andcustomers). The internal supply chain is short and focused on the sales function.Revenues are mostly earned through fulfilling the role of a trade intermediary.
Integrator
Customer benefits can come from favorable functional features of products, butalso from a strong brand and cohesive partner relationships with members of asupply chain. The distinguishing attributes of an integrator are managerialcompetences, management information systems, recipes, designs, patents,brand names, and market knowledge. Its internal supply chain is short: as thesupply chain leader, an integrator is focused on a few core competences, such asR&D, designing, marketing, sales and after-sales services, while it tends tooutsource manufacturing. Income is generated through sales of its ownbrand-name products and offering its own unique know-how and technologyby means of franchising and/or licensing.
Source: Own elaboration based on Dudzik and Witek-Hajduk [69].
From the salient features of various types of business models, as outlined in Table 1, one canreasonably expect considerable differences in the extent of CSR implementation. In seems that out ofthe four groups of criteria used in the segmentation procedure yielding the above classification, thosethat are likely to have the strongest bearing on CSR compliance are value proposition, key resources,and the role of a company within its supply chain. Arguably, no salient elements of sustainablebusiness are conditional on a particular setup of revenue sources, so any differences in this regardshould be of no consequence to the CSR standing of a company.
Value propositions of market players and integrators are set apart from those of other companiesnot only by unique combinations of functional features, but also an emphasis on developing strongbrand names and cohesive relationships with channel partners. In the current state of the economyin Poland, similar to other developed and emerging countries, consumers in many market segmentshave been growing ever more sensitive to the ethical behavior of the firms they patronize. As such,these groups of consumers may derive distinctive utility from the fact that their purchasing decisionscan support the good citizens among available suppliers of goods and services. On the other hand,firms that aggressively seek to increase the perceived value of their offerings, which are marketplayers and integrators, may choose to get involved in CSR programs specifically for that reason.Consequently, these firms are apt to promote their brands more frequently through charitable programs,whereby, for example, customers can feel better knowing that a part of the paid price goes to supporta socially valuable cause. In the same vein, market players and integrators may also see businessrationale in establishing and financing charitable foundations, and implementing changes to theircore processes (e.g., phasing in eco-friendly technologies) to make assertions of responsible behaviormore credible. To further strengthen their case, they also may choose to encourage employees to getinvolved with local communities to assist in enhancing their capabilities to satisfy salient infrastructural,educational, cultural, and sports-related needs. If that was indeed the main motivation to get involvedin CSR, companies might be inclined to follow up this initial actions by overhauling their employeerelations and organizational culture—this way employees can become more involved and convincedof the true and honest nature of the managerial push towards sustainable and responsible businesspractices. With more involved employees it is arguably easier to make a company’s CSR claims seem
255
Sustainability 2016, 8, 93
more genuine to its customers, which can foster higher loyalty and greater sales. Quite naturally,the other business models—traditionalists, contractors, and distributors—with their lower interest increating strong brands will not experience the same motivation, and therefore may display weakerCSR involvement.
Another distinctive feature of market players and integrators is their reliance on unique resourcesto underlie their competitive advantages. Among these resources are superior managerial competences,innovative and productive organizational culture, proprietary technology, and market knowledge.Many of these capabilities have better chances of being achieved in corporate settings where employeesare loyal, highly motivated, and emotionally involved with their workplace. Such conditions areamong the likely benefits of implementing CSR programs aimed at improving employee relations,which is another reason to believe that these two business models will show higher CSR ratings.
In terms of a value chain position and relations, market players and integrators follow more activeand “social” policies as compared to other categories of firms. Here, the goals and ways of operatingcreate a strong incentive to develop close partnerships with other crucial supply chain members so thatmarket players and integrators could assume the role of a dominant value chain member. This role iscritical to their business strategies, which rely on the ability to shape value chains to achieve a higherlevel of efficiency and effectiveness than the networks controlled by competitors. One of the mainprerequisites to achieving such a goal is a high level of trust and commitment among cooperatingfirms, which is promoted by ethical and responsible behavior from all involved parties. As such, thisis another reason to expect more social responsibility (this time aimed at business partners) amongmarket players and integrators than other firms with business models less dependent for success onthe quality of everyday channel relations.
To conclude, considering the attributes of the identified types of business models and relatingthem to the CSR dimensions, it is possible to propose which types of companies will be most likely tooperate in the manner consistent with the principles of responsible business. In particular, it can beexpected that market players and integrators show higher levels of CSR implementations. On the otherhand, the attributes of traditionalists, contractors, and distributors could create less of an incentive tofunction in a more sustainable way.
Consequently, it is possible to supplement the previous general hypothesis with a morespecific proposition:
Hypothesis 2: Among the five types of business models, the highest level of CSR involvementwill be found in market players and integrators.
The other possible distinctions between business models are difficult to extrapolate from an apriori analysis based on previous research, conceptual papers, and the authors’ own observationsand experiences.
The empirical part of the research was dedicated to validating the two hypotheses. The methodsemployed and obtained outcomes are described next.
6. Methods
The study involved a net sample of 385 mangers from medium and large enterprises, whowere contacted through a combination of CATI and CAWI methods. In particular, the respondentsanswered via phone (the CATI part) while looking at the web-based version of the questionnaire (theCAWI component). The inclusion of the web component was essential to make respondents fullyunderstand the rather lengthy business model characteristics presented in Table 1, and choose themodel that best described their firms. The respondents were initially contacted via an e-mail outliningthe research project, inviting them to participate, and offering a link to a dedicated web-page with adigital questionnaire. Within a few days of receiving the e-mail, phone calls followed during whichinterviews were conducted or arrangements were made to set up a later interview date. Despite severalcontact attempts, not all selected sample members could participate: the gross sample initially drawn
256
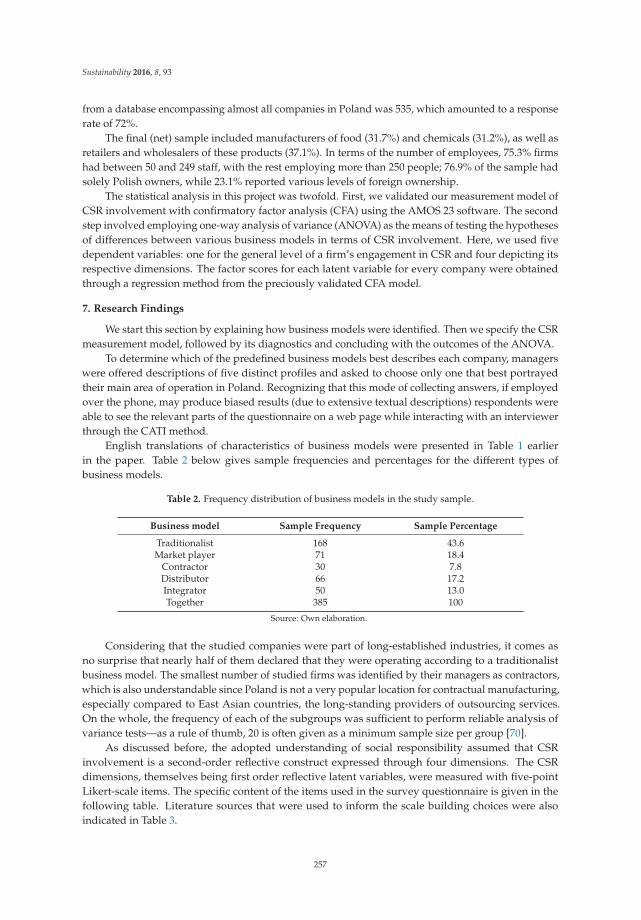
Sustainability 2016, 8, 93
from a database encompassing almost all companies in Poland was 535, which amounted to a responserate of 72%.
The final (net) sample included manufacturers of food (31.7%) and chemicals (31.2%), as well asretailers and wholesalers of these products (37.1%). In terms of the number of employees, 75.3% firmshad between 50 and 249 staff, with the rest employing more than 250 people; 76.9% of the sample hadsolely Polish owners, while 23.1% reported various levels of foreign ownership.
The statistical analysis in this project was twofold. First, we validated our measurement model ofCSR involvement with confirmatory factor analysis (CFA) using the AMOS 23 software. The secondstep involved employing one-way analysis of variance (ANOVA) as the means of testing the hypothesesof differences between various business models in terms of CSR involvement. Here, we used fivedependent variables: one for the general level of a firm’s engagement in CSR and four depicting itsrespective dimensions. The factor scores for each latent variable for every company were obtainedthrough a regression method from the preciously validated CFA model.
7. Research Findings
We start this section by explaining how business models were identified. Then we specify the CSRmeasurement model, followed by its diagnostics and concluding with the outcomes of the ANOVA.
To determine which of the predefined business models best describes each company, managerswere offered descriptions of five distinct profiles and asked to choose only one that best portrayedtheir main area of operation in Poland. Recognizing that this mode of collecting answers, if employedover the phone, may produce biased results (due to extensive textual descriptions) respondents wereable to see the relevant parts of the questionnaire on a web page while interacting with an interviewerthrough the CATI method.
English translations of characteristics of business models were presented in Table 1 earlierin the paper. Table 2 below gives sample frequencies and percentages for the different types ofbusiness models.
Table 2. Frequency distribution of business models in the study sample.
Business model Sample Frequency Sample Percentage
Traditionalist 168 43.6Market player 71 18.4
Contractor 30 7.8Distributor 66 17.2Integrator 50 13.0Together 385 100
Source: Own elaboration.
Considering that the studied companies were part of long-established industries, it comes asno surprise that nearly half of them declared that they were operating according to a traditionalistbusiness model. The smallest number of studied firms was identified by their managers as contractors,which is also understandable since Poland is not a very popular location for contractual manufacturing,especially compared to East Asian countries, the long-standing providers of outsourcing services.On the whole, the frequency of each of the subgroups was sufficient to perform reliable analysis ofvariance tests—as a rule of thumb, 20 is often given as a minimum sample size per group [70].
As discussed before, the adopted understanding of social responsibility assumed that CSRinvolvement is a second-order reflective construct expressed through four dimensions. The CSRdimensions, themselves being first order reflective latent variables, were measured with five-pointLikert-scale items. The specific content of the items used in the survey questionnaire is given in thefollowing table. Literature sources that were used to inform the scale building choices were alsoindicated in Table 3.
257
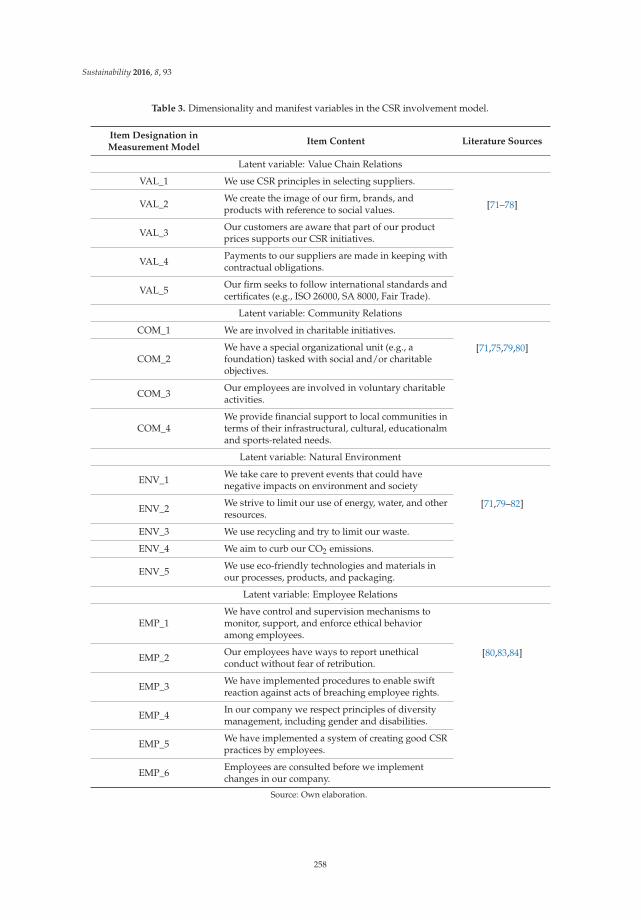
Sustainability 2016, 8, 93
Table 3. Dimensionality and manifest variables in the CSR involvement model.
Item Designation inMeasurement Model
Item Content Literature Sources
Latent variable: Value Chain Relations
VAL_1 We use CSR principles in selecting suppliers.
[71–78]VAL_2 We create the image of our firm, brands, andproducts with reference to social values.
VAL_3 Our customers are aware that part of our productprices supports our CSR initiatives.
VAL_4 Payments to our suppliers are made in keeping withcontractual obligations.
VAL_5 Our firm seeks to follow international standards andcertificates (e.g., ISO 26000, SA 8000, Fair Trade).
Latent variable: Community Relations
COM_1 We are involved in charitable initiatives.
[71,75,79,80]COM_2
We have a special organizational unit (e.g., afoundation) tasked with social and/or charitableobjectives.
COM_3 Our employees are involved in voluntary charitableactivities.
COM_4We provide financial support to local communities interms of their infrastructural, cultural, educationalmand sports-related needs.
Latent variable: Natural Environment
ENV_1 We take care to prevent events that could havenegative impacts on environment and society
[71,79–82]ENV_2 We strive to limit our use of energy, water, and otherresources.
ENV_3 We use recycling and try to limit our waste.
ENV_4 We aim to curb our CO2 emissions.
ENV_5 We use eco-friendly technologies and materials inour processes, products, and packaging.
Latent variable: Employee Relations
EMP_1We have control and supervision mechanisms tomonitor, support, and enforce ethical behavioramong employees.
[80,83,84]EMP_2 Our employees have ways to report unethicalconduct without fear of retribution.
EMP_3 We have implemented procedures to enable swiftreaction against acts of breaching employee rights.
EMP_4 In our company we respect principles of diversitymanagement, including gender and disabilities.
EMP_5 We have implemented a system of creating good CSRpractices by employees.
EMP_6 Employees are consulted before we implementchanges in our company.
Source: Own elaboration.
258
Sustainability 2016, 8, 93
The validity of the above model was tested with confirmatory factor analysis using the maximumlikelihood estimation.
Considering that the sample was composed of firms representing three distinct industries (i.e.,food production, chemical manufacturing, and commerce, both wholesale and retail), it was essentialto test the model structure for measurement invariance. Measurement invariance is found whenall relevant subgroups could be equally well represented by the same pattern of regression weightsand covariances in the model. A common way to test for measurement invariance is to compare anunconstrained model (assuming that all groups have all parameters estimated independently) with amodel where regression weights and covariances are set to be equal across all groups. Then chi-squarestatistics are computed for alternative models and the chi-square differential is obtained. Evidence formeasurement invariance is found when the chi-square difference is insignificant [85] and so—consistentwith the principle of parsimony—the simpler (i.e., constrained) option should be retained. In thecurrent study, the chi-square value representing discrepancies between the two models was 47.426,with 40 degrees of freedom and a p-value of 0.196. This implies that the model where all firms arepooled together as a single group is superior, as the more complex solution with different parametersacross groups does not offer markedly better accuracy. From a practical perspective, our researchappears to suggest that CSR involvement (at least when measured using the metrics deployed in oursurvey) is a universal characteristic reflected in a similar way (following the same structural patterns)in firms with various backgrounds.
The resultant CFA diagram, with its standardized regression parameters and squared multiplecorrelations, is depicted in Figure 1.
In order to evaluate the model fit with the sample data, we used a set of common indices as setout in Table 4.
259
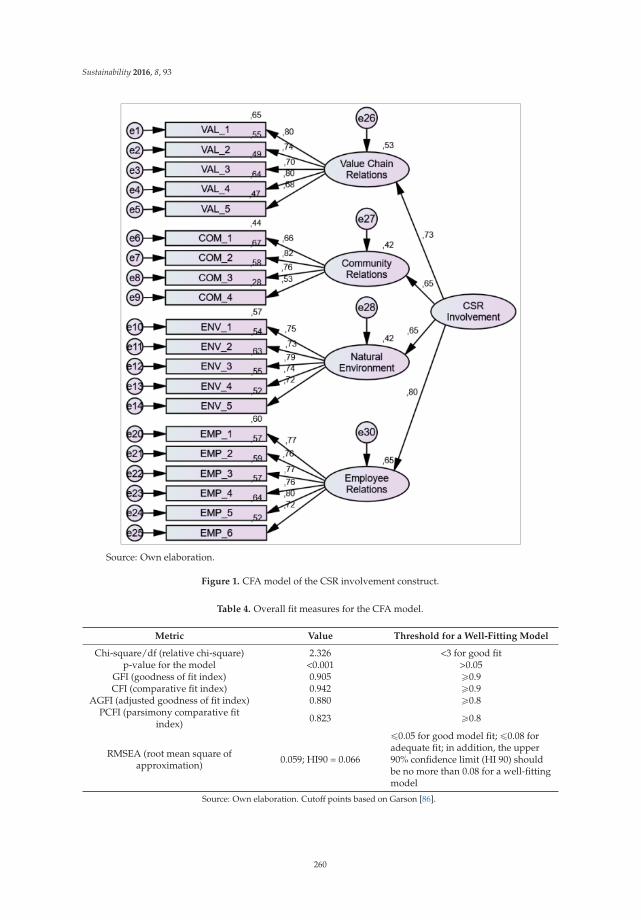
Sustainability 2016, 8, 93
Source: Own elaboration.
Figure 1. CFA model of the CSR involvement construct.
Table 4. Overall fit measures for the CFA model.
Metric Value Threshold for a Well-Fitting Model
Chi-square/df (relative chi-square) 2.326 <3 for good fitp-value for the model <0.001 >0.05
GFI (goodness of fit index) 0.905 ě0.9CFI (comparative fit index) 0.942 ě0.9
AGFI (adjusted goodness of fit index) 0.880 ě0.8PCFI (parsimony comparative fit
index) 0.823 ě0.8
RMSEA (root mean square ofapproximation) 0.059; HI90 = 0.066
ď0.05 for good model fit; ď0.08 foradequate fit; in addition, the upper90% confidence limit (HI 90) shouldbe no more than 0.08 for a well-fittingmodel
Source: Own elaboration. Cutoff points based on Garson [86].
260
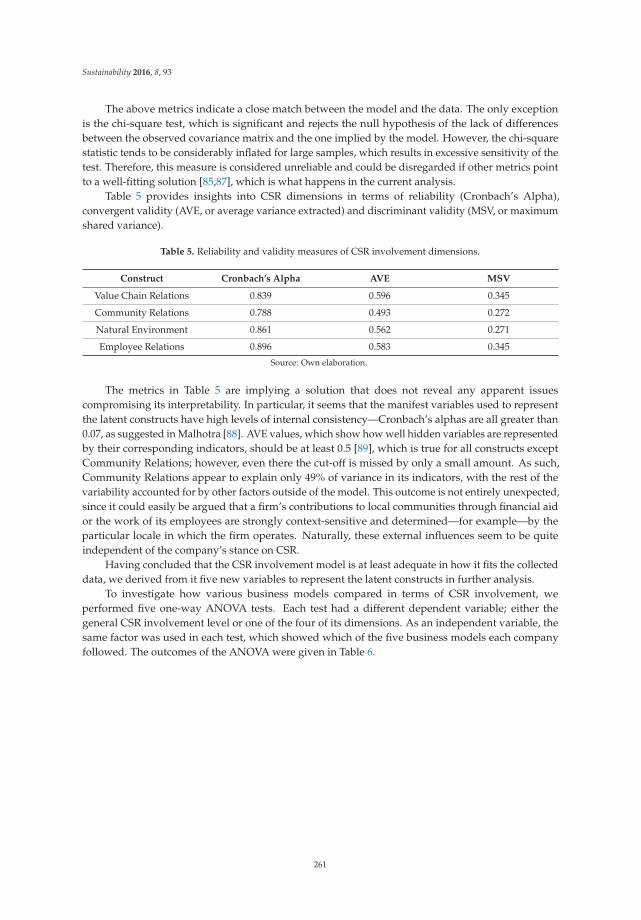
Sustainability 2016, 8, 93
The above metrics indicate a close match between the model and the data. The only exceptionis the chi-square test, which is significant and rejects the null hypothesis of the lack of differencesbetween the observed covariance matrix and the one implied by the model. However, the chi-squarestatistic tends to be considerably inflated for large samples, which results in excessive sensitivity of thetest. Therefore, this measure is considered unreliable and could be disregarded if other metrics pointto a well-fitting solution [85,87], which is what happens in the current analysis.
Table 5 provides insights into CSR dimensions in terms of reliability (Cronbach’s Alpha),convergent validity (AVE, or average variance extracted) and discriminant validity (MSV, or maximumshared variance).
Table 5. Reliability and validity measures of CSR involvement dimensions.
Construct Cronbach’s Alpha AVE MSV
Value Chain Relations 0.839 0.596 0.345
Community Relations 0.788 0.493 0.272
Natural Environment 0.861 0.562 0.271
Employee Relations 0.896 0.583 0.345
Source: Own elaboration.
The metrics in Table 5 are implying a solution that does not reveal any apparent issuescompromising its interpretability. In particular, it seems that the manifest variables used to representthe latent constructs have high levels of internal consistency—Cronbach’s alphas are all greater than0.07, as suggested in Malhotra [88]. AVE values, which show how well hidden variables are representedby their corresponding indicators, should be at least 0.5 [89], which is true for all constructs exceptCommunity Relations; however, even there the cut-off is missed by only a small amount. As such,Community Relations appear to explain only 49% of variance in its indicators, with the rest of thevariability accounted for by other factors outside of the model. This outcome is not entirely unexpected,since it could easily be argued that a firm’s contributions to local communities through financial aidor the work of its employees are strongly context-sensitive and determined—for example—by theparticular locale in which the firm operates. Naturally, these external influences seem to be quiteindependent of the company’s stance on CSR.
Having concluded that the CSR involvement model is at least adequate in how it fits the collecteddata, we derived from it five new variables to represent the latent constructs in further analysis.
To investigate how various business models compared in terms of CSR involvement, weperformed five one-way ANOVA tests. Each test had a different dependent variable; either thegeneral CSR involvement level or one of the four of its dimensions. As an independent variable, thesame factor was used in each test, which showed which of the five business models each companyfollowed. The outcomes of the ANOVA were given in Table 6.
261
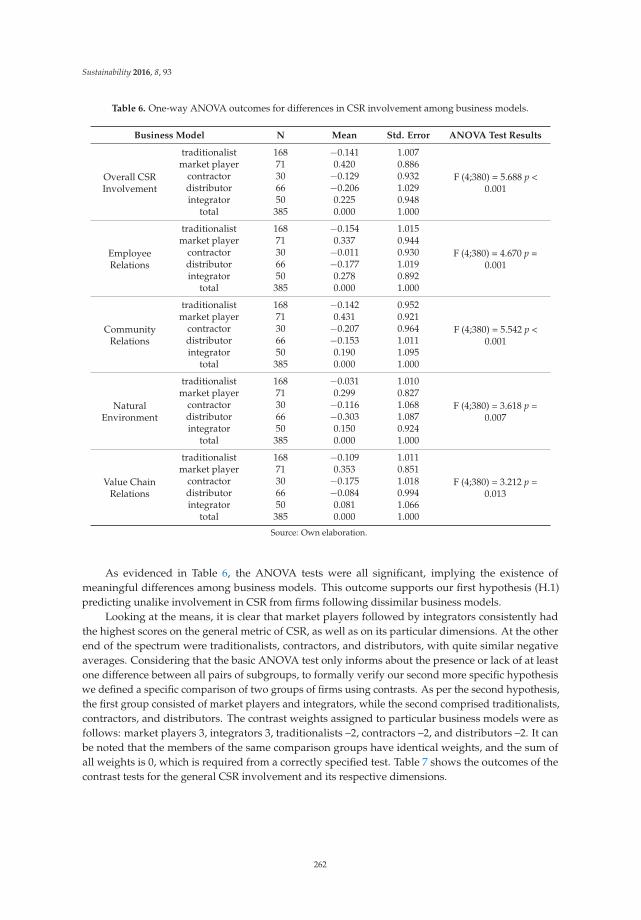
Sustainability 2016, 8, 93
Table 6. One-way ANOVA outcomes for differences in CSR involvement among business models.
Business Model N Mean Std. Error ANOVA Test Results
Overall CSRInvolvement
traditionalist 168 ´0.141 1.007
F (4;380) = 5.688 p <0.001
market player 71 0.420 0.886contractor 30 ´0.129 0.932distributor 66 ´0.206 1.029integrator 50 0.225 0.948
total 385 0.000 1.000
EmployeeRelations
traditionalist 168 ´0.154 1.015
F (4;380) = 4.670 p =0.001
market player 71 0.337 0.944contractor 30 ´0.011 0.930distributor 66 ´0.177 1.019integrator 50 0.278 0.892
total 385 0.000 1.000
CommunityRelations
traditionalist 168 ´0.142 0.952
F (4;380) = 5.542 p <0.001
market player 71 0.431 0.921contractor 30 ´0.207 0.964distributor 66 ´0.153 1.011integrator 50 0.190 1.095
total 385 0.000 1.000
NaturalEnvironment
traditionalist 168 ´0.031 1.010
F (4;380) = 3.618 p =0.007
market player 71 0.299 0.827contractor 30 ´0.116 1.068distributor 66 ´0.303 1.087integrator 50 0.150 0.924
total 385 0.000 1.000
Value ChainRelations
traditionalist 168 ´0.109 1.011
F (4;380) = 3.212 p =0.013
market player 71 0.353 0.851contractor 30 ´0.175 1.018distributor 66 ´0.084 0.994integrator 50 0.081 1.066
total 385 0.000 1.000
Source: Own elaboration.
As evidenced in Table 6, the ANOVA tests were all significant, implying the existence ofmeaningful differences among business models. This outcome supports our first hypothesis (H.1)predicting unalike involvement in CSR from firms following dissimilar business models.
Looking at the means, it is clear that market players followed by integrators consistently hadthe highest scores on the general metric of CSR, as well as on its particular dimensions. At the otherend of the spectrum were traditionalists, contractors, and distributors, with quite similar negativeaverages. Considering that the basic ANOVA test only informs about the presence or lack of at leastone difference between all pairs of subgroups, to formally verify our second more specific hypothesiswe defined a specific comparison of two groups of firms using contrasts. As per the second hypothesis,the first group consisted of market players and integrators, while the second comprised traditionalists,contractors, and distributors. The contrast weights assigned to particular business models were asfollows: market players 3, integrators 3, traditionalists –2, contractors –2, and distributors –2. It canbe noted that the members of the same comparison groups have identical weights, and the sum ofall weights is 0, which is required from a correctly specified test. Table 7 shows the outcomes of thecontrast tests for the general CSR involvement and its respective dimensions.
262
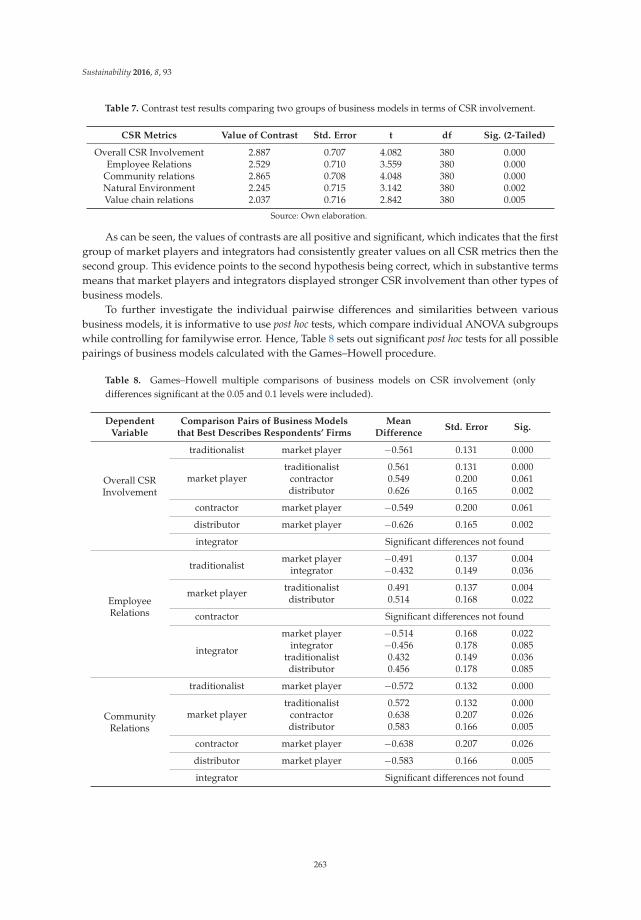
Sustainability 2016, 8, 93
Table 7. Contrast test results comparing two groups of business models in terms of CSR involvement.
CSR Metrics Value of Contrast Std. Error t df Sig. (2-Tailed)
Overall CSR Involvement 2.887 0.707 4.082 380 0.000Employee Relations 2.529 0.710 3.559 380 0.000
Community relations 2.865 0.708 4.048 380 0.000Natural Environment 2.245 0.715 3.142 380 0.002Value chain relations 2.037 0.716 2.842 380 0.005
Source: Own elaboration.
As can be seen, the values of contrasts are all positive and significant, which indicates that the firstgroup of market players and integrators had consistently greater values on all CSR metrics then thesecond group. This evidence points to the second hypothesis being correct, which in substantive termsmeans that market players and integrators displayed stronger CSR involvement than other types ofbusiness models.
To further investigate the individual pairwise differences and similarities between variousbusiness models, it is informative to use post hoc tests, which compare individual ANOVA subgroupswhile controlling for familywise error. Hence, Table 8 sets out significant post hoc tests for all possiblepairings of business models calculated with the Games–Howell procedure.
Table 8. Games–Howell multiple comparisons of business models on CSR involvement (onlydifferences significant at the 0.05 and 0.1 levels were included).
DependentVariable
Comparison Pairs of Business Modelsthat Best Describes Respondents’ Firms
MeanDifference
Std. Error Sig.
Overall CSRInvolvement
traditionalist market player ´0.561 0.131 0.000
market playertraditionalist 0.561 0.131 0.000
contractor 0.549 0.200 0.061distributor 0.626 0.165 0.002
contractor market player ´0.549 0.200 0.061
distributor market player ´0.626 0.165 0.002
integrator Significant differences not found
EmployeeRelations
traditionalistmarket player ´0.491 0.137 0.004
integrator ´0.432 0.149 0.036
market player traditionalist 0.491 0.137 0.004distributor 0.514 0.168 0.022
contractor Significant differences not found
integrator
market player ´0.514 0.168 0.022integrator ´0.456 0.178 0.085
traditionalist 0.432 0.149 0.036distributor 0.456 0.178 0.085
CommunityRelations
traditionalist market player ´0.572 0.132 0.000
market playertraditionalist 0.572 0.132 0.000
contractor 0.638 0.207 0.026distributor 0.583 0.166 0.005
contractor market player ´0.638 0.207 0.026
distributor market player ´0.583 0.166 0.005
integrator Significant differences not found
263
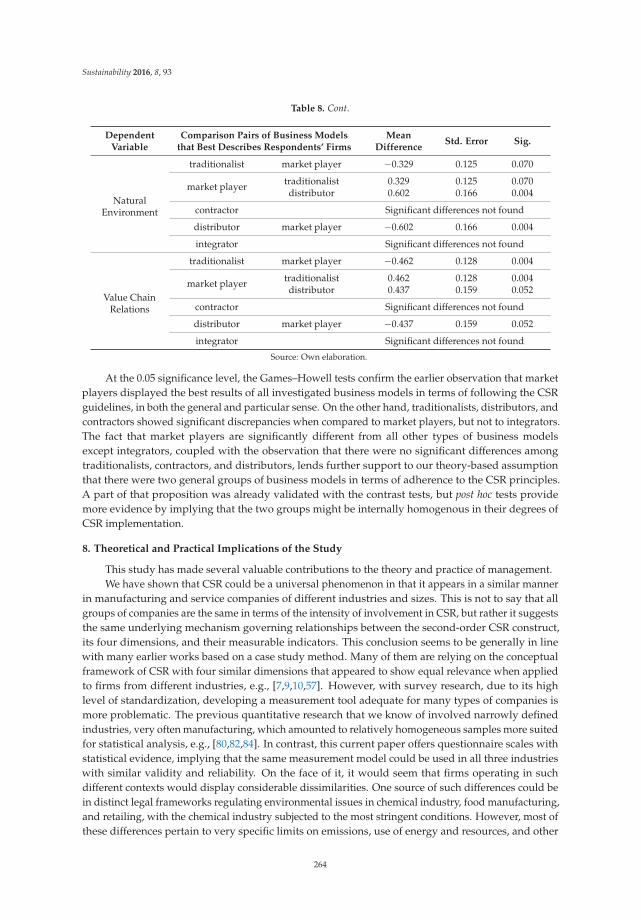
Sustainability 2016, 8, 93
Table 8. Cont.
DependentVariable
Comparison Pairs of Business Modelsthat Best Describes Respondents’ Firms
MeanDifference
Std. Error Sig.
NaturalEnvironment
traditionalist market player ´0.329 0.125 0.070
market player traditionalist 0.329 0.125 0.070distributor 0.602 0.166 0.004
contractor Significant differences not found
distributor market player ´0.602 0.166 0.004
integrator Significant differences not found
Value ChainRelations
traditionalist market player ´0.462 0.128 0.004
market player traditionalist 0.462 0.128 0.004distributor 0.437 0.159 0.052
contractor Significant differences not found
distributor market player ´0.437 0.159 0.052
integrator Significant differences not found
Source: Own elaboration.
At the 0.05 significance level, the Games–Howell tests confirm the earlier observation that marketplayers displayed the best results of all investigated business models in terms of following the CSRguidelines, in both the general and particular sense. On the other hand, traditionalists, distributors, andcontractors showed significant discrepancies when compared to market players, but not to integrators.The fact that market players are significantly different from all other types of business modelsexcept integrators, coupled with the observation that there were no significant differences amongtraditionalists, contractors, and distributors, lends further support to our theory-based assumptionthat there were two general groups of business models in terms of adherence to the CSR principles.A part of that proposition was already validated with the contrast tests, but post hoc tests providemore evidence by implying that the two groups might be internally homogenous in their degrees ofCSR implementation.
8. Theoretical and Practical Implications of the Study
This study has made several valuable contributions to the theory and practice of management.We have shown that CSR could be a universal phenomenon in that it appears in a similar manner
in manufacturing and service companies of different industries and sizes. This is not to say that allgroups of companies are the same in terms of the intensity of involvement in CSR, but rather it suggeststhe same underlying mechanism governing relationships between the second-order CSR construct,its four dimensions, and their measurable indicators. This conclusion seems to be generally in linewith many earlier works based on a case study method. Many of them are relying on the conceptualframework of CSR with four similar dimensions that appeared to show equal relevance when appliedto firms from different industries, e.g., [7,9,10,57]. However, with survey research, due to its highlevel of standardization, developing a measurement tool adequate for many types of companies ismore problematic. The previous quantitative research that we know of involved narrowly definedindustries, very often manufacturing, which amounted to relatively homogeneous samples more suitedfor statistical analysis, e.g., [80,82,84]. In contrast, this current paper offers questionnaire scales withstatistical evidence, implying that the same measurement model could be used in all three industrieswith similar validity and reliability. On the face of it, it would seem that firms operating in suchdifferent contexts would display considerable dissimilarities. One source of such differences could bein distinct legal frameworks regulating environmental issues in chemical industry, food manufacturing,and retailing, with the chemical industry subjected to the most stringent conditions. However, most ofthese differences pertain to very specific limits on emissions, use of energy and resources, and other
264
Sustainability 2016, 8, 93
aspects of environmental protection, while our measurement scales ask about those things only in ageneral way that seems to be applicable to all studied companies.
Arguably the most natural area where CSR could be applied in a similar fashion across all threeindustries is employee relations. This is not only because of the intrinsic versatility of human resources,which can take a similar form in many different settings, but also in large part due to the same systemof legal regulations applying to each and every firm. This comes as no surprise since “it is clear thatlaw and legal standards in various forms . . . play a considerable role in relation to the substance ofCSR, and for implementation and communication of CSR” [90].
Considering that the studied firms were medium and large in size, and most of those firms insaid industries in Poland are operating with various implementations of ISO systems, this couldalso be a unifying factor. The ISO systems have many regulations that determine how firms shouldorganize their assorted functions and processes, including guidelines that are consistent with CSRprinciples (e.g., environmental protection, employee relations, external stakeholder relations, valuechain cooperation). The capability of ISO standards to drive similar implementations of responsiblebusiness practices was shown before in papers by other authors [91,92].
Given the discussion so far, it seems that our multiple measurement scale could be a versatile andcapable tool for studying CSR in companies across various business contexts.
One practical application of our outcomes could be in the area of public policy. Even though mostgovernments in developed countries make efforts to support responsible business standards, thereare reasons to believe that these actions have only limited effectiveness [93]. As such, our findingssuggest that local and national governments, as well as other policymakers interested in promotingsustainable growth and ethical standards in business, should support above all enterprises operatingin line with the business models of market players and integrators. The present research indicatesthat these business models are most CSR-oriented, which should bring about the best effects in termsof—for example—environmental protection, employee relations, harmonious cooperation with localcommunities, and conscientious attitude towards other stakeholders. In other words, here publicpolicy measures would be the most aligned with the intrinsic tendencies of these types of businessesto act in a responsible fashion.
Another possibly useful insight for mangers is our observation that CSR involvement mightcontribute to enhancing brand equity, leading to a higher brand value and increased value forshareholders. This corroborates some earlier research, involving quantitative surveys, demonstratingthat CSR can build trust with customers, which in turn enhances corporate reputation and resultsin greater brand equity [94]. This stems from the fact that market players and integrators both hadhigher levels of CSR implementation, and one likely reason for that could be related to them buildingstronger brands among consumers and business partners, which is among the defining features of theirbusiness models. It should be noted, though, that this is more of a supposition than a finding based ondirect evidence. Despite a degree of uncertainty, such a relationship points to an interesting topic of afollow-up study explicitly investigating the links between business models, CSR involvement, andbrand value.
Our research seems to substantiate a theoretical proposition of a feedback link between CSRand business models, which can be found in many conceptual papers, e.g., [95]. According to theoryand—mostly qualitative—observations, firms that adopt successful CSR programs and initiatives tendto experience changes in organizational culture, which becomes more CSR-oriented and promotesfurther responsible corporate behaviors, including deeper structural changes to strategies and businessmodels [96]. This mechanism could arguably result in a self-perpetuating virtuous circle, drivingsustainability commitment to become ever deeper. Based on the current study, it can be noted that thebusiness models supporting CSR, and in turn being supported by it, are market players and integrators.Their CSR metrics, markedly better than those of other types of companies, can be interpreted aspointing to the presence of such a feedback mechanism.
265
Sustainability 2016, 8, 93
The tendency of market players and integrators to act in a more socially responsible way towardstheir stakeholders, including value chain members, could serve other companies as a sign of goodcandidates for mutually beneficial partnerships. Indeed, it is more so because the business classificationscheme employed in the study is easy to use by practitioners, who can readily identify market playersand integrators among their potential partners.
The study findings could also provide a measure of reassurance to those consumers who are keento support ethical companies but are uncertain about the sincerity of their CSR claims. According to arecent segmentation study of Polish households, those who are sensitive to cause-related marketingand are willing to pay more for products of firms that contribute to solving relevant social problemsmake up almost 30% of the adult population [97]. It seems that CSR in most active companies(market players and integrators) is not “skin deep” but tends to be implemented quite thoroughly andcomprehensively. Therefore, it is believable that many of the CSR claims used as promotional devicesare genuine projections of strategic orientation and organizational culture values in firms with the twomost “sustainability-friendly” business models.
9. Limitations and Directions for Further Research
Similar to other projects of this kind, one rather obvious constraining feature of the study thatcould limit the scope of possible generalizations is the nature of the surveyed population. It couldbe contended that locating the survey in Poland in the context of the three industries can make itproblematic to infer beyond this research setting to other countries or types of companies. However, thepatterns that transpired in our data seem to be of a general nature, well grounded in theory, andexplainable in terms of their underlying causal mechanism. These likely causal mechanisms, tying upthe two types of business models with a more active stance in social responsibility, as explained earlierin the paper, could conceivably be found in firms using the same business models from beyond ourresearch population. It would be, nevertheless, interesting to see if the outcomes can be replicated indifferent research settings.
Another idea for supplementary research is a qualitative multiple-case study where causalmechanisms, leading from types of business models to various levels of CSR involvement, could beprobed in depth. Such an investigation could serve to validate our literature and experience-basedsuppositions about the reasons for differences between business models, and possibly identify newpatterns of relevant factors. Those new factors might involve propositions of mediating or moderatingvariables that could be controlled for in survey research to outline a more complete picture ofassociations between business models and CSR.
New research, in addition to including mediating and moderating variables, could also look atfinancial metrics (e.g., profit margin, ROA, ROE), and how these correspond to CSR levels among firmswith different business models. It is plausible that correlations from CSR involvement to financialoutcomes might vary in significance and strength in different business model groups.
Author Contributions: Author Contributions: Most of the tasks involved in writing the paper were done jointlyby both authors. These include: developing the concept and design, analysis and interpretation, writing the article,and its critical revision. Statistical analysis was performed by Piotr Zaborek.
Conflicts of Interest: Conflicts of Interest: The authors declare that they have no competing interests.
References
1. Ferrrero, I.; Hoffman, M.; McNulty, R. Must Milton Friedman Embrace Stakeholder Theory? Bus.Soc. Rev.2014, 119, 37–59. [CrossRef]
2. Moczadlo, R. Creating Competitive Advantages—The European CSR-Strategy Compared with Porter’s andKramer’s Shared Value Approach. Econviews 2015, 28, 243–256.
3. Nwagbara, U.; Reid, P. Corporate Social Responsibility (CSR) and Management Trends: Changing Timesand Changing Strategies. Econ. Insights Trends Chall. 2013, 65, 12–19.
266
Sustainability 2016, 8, 93
4. Michelini, L.; Fiorentino, D. New Business Models for Creating Shared Value. Soc. Responsib. J. 2012, 8,561–577. [CrossRef]
5. Liu, M.T.; Wong, I.A.; Shi, G.; Chu, R.; Brock, J. The Impact of Corporate Social Responsibility (CSR) andperceived brand quality on customer-based brand preference. J. Serv. Market. 2014, 28, 181–194.
6. Pyszka, A. A CSR driven innovative business model. Int. J. Contemp. Manag. 2011, 4, 98–100.7. Bocken, N.; Short, S.; Rana, P.; Evans, S. A value mapping tool for sustainable business modelling. Corp. Gov.
2013, 13, 482–497.8. Creasey, D. Corporate responsibility: You can’t afford to ignore it. Gov. Dir. 2015, 67, 161–163.9. Hogevold, N. A corporate effort towards a sustainable business model: A case study from the Norwegian
Furniture Industry. Eur. Bus. Rev. 2011, 23, 392–400.10. Pelham, F. Will sustainability change the business model of event industry? Worldw. Sustain.Tour. Themes
2011, 3, 187–192.11. Dahlsrud, A. How corporate social responsibility is defined: An analysis of 37 Definitions. Corp. Soc.
Responsib. Environ. Manag. 2008, 15, 1–13. [CrossRef]12. Friedman, M. The Social Responsibility of Business is to Increase Its Profits. Available online:
http://www.colorado.edu/studentgroups/libertarians/issues/friedman-soc-resp-business.html (accessedon 15 January 2016).
13. Barnard, C.I. The Function of the Executive; Harvard College: Harvard, UK, 1938.14. Clark, J.M. Social Control of Business, 2nd ed.; Augustus M Kelley Pubs: Westport, CT, USA, 1939.15. Bowen, R. Social Responsibility of the Businessman; Harper and Borthers: New York, NY, USA, 1953.16. Frederick, W.C. The growing concern over business responsibility. Calif. Manag. Rev. 1960, 2, 54–61.
[CrossRef]17. Eells, R.; Walton, C. Conceptual Foundations of Business; Richard D. Irwin, Inc., 1961.18. Davis, K.; Blomstrom, R.L. Business and Its Environment; McGraw-Hill: New York, NY, USA, 1966.19. Davis, K. Understanding the social responsibility puzzle: What does the businessman owe to society?
Bus. Horiz. 1967, 10, 45–50. [CrossRef]20. McGuire, J. Business and Society; McGraw-Hill: New York, NY, USA, 1963.21. Fitch, H.G. Achieving corporate social responsibility. Acad. Manag. Rev. 1976, 1, 38–46. [CrossRef]22. Beesley, M.E.; Evans, T. Corporate Responsibility: A Reassessment; Croom Helm: London, UK, 1978.23. Brundtland, G. Report of the World Commission on Environment and Development: Our Common Future.
1987. Available online: http://www.un-documents.net/our-common-future.pdf (accessed on 10 May 2015).24. People and the planet. The Royal Society Science Policy Centre report 01/12. April 2012 DES2470. Available
online: http://www.interacademies.net/File.aspx?id=25028. 1699–1710 (accessed on 13 February 2015).25. Vos, R.O. Defining sustainability: A conceptual orientation. J. Chem. Technol. Biotechnol. 2007, 82, 334–339.
[CrossRef]26. ISO 2600 Guidance on Social Responsibility. 2010. Available online: http://www.iso.org/iso/
catalogue_detail?csnumber=42546 (accessed on 01 May 2015).27. Carroll, A. The Pyramid of Corporate Social Responsibility: Toward the Moral Management of Organizational
Stakeholders. Bus. Horiz. 1991, 34, 39–48. [CrossRef]28. Schwarz, M.S.; Carroll, A.B. Corporate social responsibility: A three-domain approach. Bus. Ethics Q. 2003,
13, 503–530. [CrossRef]29. Elkington, J. Cannibals With Forks: The Triple Bottom Line of 21st Century Business; New Society Publishers:
Stony Creek, CT, USA, 1998.30. Aras, G.; Crowther, D. The Durable Corporation; Gower Publishing: Farnham, England, UK, 2009.31. Chen, C.H.; Wongsurawat, W. Core constructs of corporate social responsibility: A path analysis. Asia Pac. J.
Bus. Adm. 2011, 3, 47–61. [CrossRef]32. Rappa, M. Managing the Digital Enterprise: Business Models on the Web. North Carolina State University,
2001. Available online: http://digitalenterprise.org/models.33. Afuah, A.N.; Tucci, C.L. Internet Business Models and Strategies: Text and Cases; McGraw-Hill: New York, NY,
USA, 2003.34. Applegate, L.M. E-Business Models: Making Sense of the Internet Business Landscape. In Information
Technology and the New Enterprise: Future Models for Managers; Applegate, L.M., Dickson, G.W., DeSanctis, G.,Eds.; Prentice Hall: Upper Saddle River, NJ, USA, 2000.
267
Sustainability 2016, 8, 93
35. Applegate, L.M. Emerging E-Business Models: Lessons from the Field; Harvard Business School: Boston, MA,USA, 2001.
36. Linder, J.; Cantrell, S. Changing Business Models: Surveying the Landscape. Accent. Inst. Strateg. Chang. 2004,7–9. Available online: http://course.shufe.edu.cn/jpkc/zhanlue/upfiles/edit/201002/20100224120954.pdf(accessed on 3 December 2013).
37. Betz, F. Strategic Business Models. Eng. Manag. J. 2002, 14, 21–27. [CrossRef]38. Osterwalder, A.; Pigneur, Y.; Tucci, C. Clarifying Business Models: Origins, Present, and Future of the
Concept. Commun. Assoc. Inf. Syst. 2005, 15, 751–775.39. Timmers, P. Business Models for Electronic Commerce. Electron. Mark. 1998, 2, 3–8. [CrossRef]40. Weill, P.; Vitale, M.R. Place to Space: Migrating to E-Business Models; Harvard Business School Press: Boston,
MA, USA, 2001.41. Hartman, A.; Sifinis, J.; Kador, J. E-Biznes: Strategie Sukcesu W Gospodarce Internetowej. Sprawdzone Metody
Organizacji Przedsiewziec E-Biznesowych; K.E. Liber: Warszawa, Poland, 2001.42. Doligalski, T.; Zaborek, P.; Romanczuk, S. Value Proposition and Firm Performance: Segmentation of Polish
Online Companies. Int. J. Perform. Manag. 2015, 16, 133–148. [CrossRef]43. Slywotzky, A.J.; Morrison, D.; Andelman, B. Strefa Zysku. Strategiczne Modele Działalnosci; PWE: Warszawa,
Poland, 2000.44. Chesbrough, H.; Rosenbloom, R.S. The Role of the Business Model in Capturing Value from Innovation:
Evidence from Xerox Corporation's Technology Spin-off Companies. Ind. Corp. Change 2002, 11, 529–555.[CrossRef]
45. Malone, T.W.; Weill, P.; Lai, R.K.; D’Urso, V.T.; Herman, G.; Apel, T.G.; Woerner, S.L. Do Some Business ModelsPerform Better than Others?; MIT Sloan Executive Education: Cambridge, UK, 2006.
46. Gołebiowski, T.; Dudzik, T.; Lewandowska, M.; Witek-Hajduk, M.K. Modele Biznesu Polskich Przedsiebiorstw;Oficyna Wydawnicza SGH: Warszawa, Poland, 2008.
47. Doppelt, B. Leading Change Toward Sustainability; Greenleaf Publishing: Sheffield, UK, 2003.48. Dunphy, D.; Griffiths, A.; Benn, S. Organizational Change for Corporate Sustainability; Routledge: London, UK,
2003.49. Griffiths, A.; Petrick, J.A. Corporate Architecture for Sustainability. Int. J. Oper. Prod. Manag. 2001, 21,
1573–1585. [CrossRef]50. Shrivastava, P. Ecocentric management for a risk society. Acad. Manag. Rev. 1995, 20, 118–137.51. Lüdeke-Freund, F. Towards a conceptual framework of business models for sustainability. In Proceedings of
the Knowledge Collaboration & Learning for Sustainable Innovation Conference, Delft, The Netherlands,25–29 Octorber 2010; Wever, R., Quist, J., Tukker, A., Woudstra, J., Boons, F., Beute, N., Eds.; pp. 25–29.
52. Schaltegger, S.; Müller, M. CSR zwischen unternehmerischer Vergangenheitsbewältigung undZukunftsgestaltung. In Corporate Social Responsibility: Trend oder Modeerscheinung?; Müller, M., Schaltegger, S.,Eds.; Oekom Publishing: München, Germany, 2005; pp. 17–35.
53. Weber, M. The business case for corporate social responsibility: A company-level measurement approach forCSR. Eur. Manag. J. 2008, 26, 247–261. [CrossRef]
54. Seelos, C.; Mair, J. Profitable Business Models and Market Creation in the Context of Deep Poverty: AStrategic View. Acad. Manag. Perspect. 2007, 21, 49–63. [CrossRef]
55. Elkington, J. Enter the Triple Bottom Line. In The Triple Bottom Line, Does It All Add Up?; Henriques, A.,Richardson, J., Eds.; Earthscan: London, UK, 2004.
56. Birkin, F.; Cashman, A.; Koh, S.; Liu, Z. New Sustainable Business Models in China. Bus. Strategy Environ.2009, 18, 64–77. [CrossRef]
57. Høgevold, N.M.; Svensson, G.; Wagner, B.; Petzer, D.J.; Klopper, H.B.; Varela, J.C.S.; Padin, C.; Ferro, C.Sustainable business models. Balt. J. Manag. 2014, 9, 357–380. [CrossRef]
58. Stubbs, W.; Cocklin, C. Conceptualizing a ”Sustainability Business Model”. Organ. Environ. 2008, 21, 103–127.[CrossRef]
59. Seuring, B.M.; Müller, M. From a literature review to a conceptual framework for sustainable supply chainmanagement. J. Clean. Prod. 2008, 16, 1699–1710. [CrossRef]
60. Ashby, A.; Leat, M.; Hudson-Smith, M. Making connections: A review of supply chain management andsustainability literature. Supply Chain Manag. Int. J. 2012, 17, 497–517.
268
Sustainability 2016, 8, 93
61. Gimenez, C.; Tachizawa, E.M. Extending sustainability to suppliers: A systematic literature review. SupplyChain Manag. Int. Rev. 2012, 17, 531–543.
62. Wicks, A.C. Overcoming the separation thesis: The need for a reconsideration of business and societyresearch. Bus. Soc. 1996, 35, 89–118. [CrossRef]
63. Lüdeke-Freund, F. Business Model Concepts in Corporate Sustainability Contexts. From Rhetoric toa Generic Template for Business Models for Sustainability. Centre for Sustainability Management,2009. Available online: http://www2.leuphana.de/umanagement/csm/content/nama/downloads/download_publikationen/Business_Models_for_Sustainability.pdf (accessed on 18 January 2016).
64. Schaltegger, S.; Wagner, M. Integrative management of sustainability performance, measurement andreporting. Int. J. Account. Audit. Perform. Eval. 2006, 3, 1–19. [CrossRef]
65. Yip, G. Using Strategy to Change Your Business Model. Bus. Strategy Rev. 2004, 15, 17–24. [CrossRef]66. Porter, M.; Kramer, M. Creating Shared Value. Harv. Bus. Rev. 2011, 89, 62–77. Available online:
http://hbr.org/2011/01/the-big-ideacreating-shared-value (accessed on 18 January 2016).67. Yunus, M.; Moingeon, B.; Lehmann-Ortega, L. Building Social Business Models: Lessons from the Grameen
Experience. Long Range Plan. 2010, 43, 308–325. [CrossRef]68. Osterwalder, A. The Business Model Ontology. In A Proposition In A Design Science Approach. Dissertation;
Universite de Lausanne: Lausanne, Switzerland, 2004. Available online: http://www.hec.unil.ch/aosterwa/PhD/Osterwalder_PhD_BM_Ontology.pdf (accessed on 15 June 2015).
69. Dudzik, T.M.; Witek-Hajduk, M.K. Typologia modeli biznesu. Gospod. Materiałowa i Logistyka 2007, 9, 18–23.70. Mooi, E.; Sarstedt, M. A Concise Guide to Market Research: The Process, Data and Methods Using IBM SPSS
Statistics, 2nd ed.; Springer-Verlag: Berlin, Germany, 2014.71. Elkington, J. Cannibals with forks: The triple bottom line of the 21st Century Business. Environ. Qual. Manag.
1998, 8, 37–51. [CrossRef]72. Maloni, J.M.; Brown, M.E. Corporate Social Responsibility in the Supply Chain: An Application in the Food
Industry. J. Bus. Ethics 2006, 68, 35–52. [CrossRef]73. Hsueh, C.F.; Chang, M.S. Social Responsibility for Supply Chain Integration. Eur. J. Oper. Res. 2008, 190,
116–129. [CrossRef]74. Cruz, M.; Matsypura, D. Supply chain networks with corporate social responsibility through integrated
environmental decision-making. Int. J. Prod. Res. 2009, 47, 621–648. [CrossRef]75. Mishra, S.; Suar, D. Does Corporate Social Responsibility Influence Firm Performance of Indian Companies?
J. Bus. Ethics 2010, 95, 571–601. [CrossRef]76. Maignan, I.; Ferrell, O.C.; Hult, T. Corporate Citizenship: Cultural Antecedents and Business Benefits. J. Acad.
Mark. Sci. 1999, 27, 455–469. [CrossRef]77. Baskarana, V.; Nachiappanb, S.; Rahmanc, S. Supplier assessment based on corporate social responsibility
criteria in Indian automotive and textile industry sectors. Int. J. Sustain. Eng. 2011, 4, 359–369. [CrossRef]78. Thresh Kumar, D.; Palaniappanb, M.; Kannanc, D.; Shankara, K.M. Analyzing the CSR issues behind the
supplier selection process using ISM approach, Resources. Conserv. Recycl. 2014, 92, 268–278. [CrossRef]79. Saleh, M.; Zulkifli, N.; Muhamad, R. Looking for evidence of the relationship between corporate social
responsibility and corporate financial performance in an emerging market. Asia Pac. J. Bus. Adm. 2011, 3,165–190. [CrossRef]
80. Zaborek, P. CSR and Financial Performance: The Case of Polish Small and Medium Manufacturers. Int. J.Manag. Econ. 2014, 43, 53–73.
81. Lagoarde-Segot, T. Corporate Social Responsibility as a Bolster for Economic Performance: Evidence fromEmerging Markets. Glob. Bus. Organ. Excell. 2011, 6, 38–53. [CrossRef]
82. Torgusa, N.; O’Donohue, W.; Hecker, R. Capabilities, Proactive CSR and Financial Performance in SMEs:Empirical Evidence from an Australian Manufacturing Industry Sector. J. Bus. Ethics 2012, 109, 483–500.[CrossRef]
83. Buciuniene, I.; Kazlauskaite, R. The linkage between HRM, CSR and performance outcomes. Balt. J. Manag.2012, 7, 5–24. [CrossRef]
84. Tang, Z.; Eirikur, H.; Rotenberg, S. How Corporate Social Responsibility Engagement Strategy Moderatesthe CSR—Financial Performance Relationship. J. Manag. Stud. 2012, 49, 1274–1303. [CrossRef]
85. Byrne, B. Structural Equation Modeling with AMOS: Basic Concepts, Applications and Programming, 2nd ed.;Routledge: New York, NY, USA, 2010.
269
Sustainability 2016, 8, 93
86. Garson, D. Structural Equation Modeling: Statistical Association Publishing Blue Book Series; StatisticalAssociation Publishing: Asheboro, NC, USA, 2012.
87. Bowen, N.; Guo, S. Structural Equation Modeling: Pocket Guides to Social Research Methods; Oxford UniversityPress: New York, NY, USA, 2012.
88. Malhotra, N. Marketing Research: An Applied Orientation, 6th ed.; Prentice Hall: Upper Saddle River, NJ,USA, 2010.
89. Hair, J.; Black, W.; Babin, B.; Anderson, R. Multivariate Data Analysis, 7th ed.; Prentice-Hall: Upper SaddleRiver, NJ, USA, 2007.
90. Buhmann, K. Corporate Social Responsibility: What role for law? Some aspects of law and CSR. Corp. Gov.Int. J. Bus. Soc. 2006, 6, 188–202. [CrossRef]
91. Zinenko, A.; Rovira, M.R.; Montiel, I. The fit of the social responsibility standard ISO 26000 with other CSRinstruments: Redundant or complementary? Sustainability Accounting. Manag. Policy J. 2015, 6, 498–526.
92. Moratis, L.; Widjaja, A.T. Determinants of CSR standards adoption: Exploring the case of ISO 26000 and theCSR performance ladder in the Netherlands. Soc. Responsib. J. 2015, 10, 516–536. [CrossRef]
93. Steuer, R. The Role of Governments in Corporate Social Responsibility: Characterising Public Policies inEurope. Policy Sci. 2010, 43, 27–49.
94. Fatma, M.; Rahman, Z.; Khan, I. Building company reputation and brand equity through CSR: The mediatingrole of trust. Int. J. Bank Mark. 2015, 33, 840–856. [CrossRef]
95. Maas, S.; Reniers, G. Development of a CSR model for practice: Connecting five inherent areas of sustainablebusiness. J. Clean. Prod. 2014, 64, 104–114. [CrossRef]
96. Calabrese, A.; Costa, R.; Menchini, T.; Rosati, F.; Sanfelice, G. Turning Corporate Social Responsibility-drivenOpportunities in Competitive Advantages: A Two-dimensional Model. Knowl. Process Manag. 2013, 20,50–58. [CrossRef]
97. Zaborek, P.; Mironska, D. Segmentation of Polish consumers based on their attitudes towards cause relatedmarketing. Gospodarka Materiałowa i Logistyka. PWE 2014, 10, 2–10.
© 2016 by the authors. Licensee MDPI, Basel, Switzerland. This article is an open accessarticle distributed under the terms and conditions of the Creative Commons Attribution(CC BY) license (http://creativecommons.org/licenses/by/4.0/).
270
sustainability
Article
Analytical Business Model for SustainableDistributed Retail Enterprises in aCompetitive Market
Courage Matobobo and Isaac O. Osunmakinde *
School of Computing, College of Science, Engineering and Technology, University of South Africa, P.O. Box 392,UNISA, Pretoria 0003, South Africa; [email protected]* Correspondence: [email protected]; Tel.: +27-11-670-9155
Academic Editors: Adam Jabłonski and Giuseppe IoppoloReceived: 12 November 2015; Accepted: 21 January 2016; Published: 4 February 2016
Abstract: Retail enterprises are organizations that sell goods in small quantities to consumers forpersonal consumption. In distributed retail enterprises, data is administered per branch. It isimportant for retail enterprises to make use of data generated within the organization to determineconsumer patterns and behaviors. Large organizations find it difficult to ascertain customerpreferences by merely observing transactions. This has led to quantifiable losses, such as loss of marketshare to competitors and targeting the wrong market. Although some enterprises have implementedclassical business models to address these challenging issues, they still lack analytics-based marketingprograms to gain a competitive advantage to deal with likely catastrophic events. This researchdevelops an analytical business (ARANN) model for distributed retail enterprises in a competitivemarket environment to address the current laxity through the best arrangement of shelf products perbranch. The ARANN model is built on association rules, complemented by artificial neural networksto strengthen the results of both mutually. According to experimental analytics, the ARANN modeloutperforms the state of the art model, implying improved confidence in business informationmanagement within the dynamically changing world economy.
Keywords: sustainable business models; retail enterprises; analytical business model; analytics;distributed enterprises
1. Introduction
Business information (BI) analytics are groups of methodologies, organizational techniquesand tools used collectively to gain information, analyze it and predict the outcomes of solutions toproblems [1]. The field of BI analytics through the use of operational data generated from transactionalsystems has given business users better insight into the problems they face [2]. These insights can assistbusiness users or managers to make better and informed decisions. BI analytics are commonly appliedin sustainable retail enterprises. Retail enterprises purchase goods from manufacturers or wholesalersin large quantities. They break up the bulk and resell those goods in smaller quantities directly toconsumers. Consumers can go around the shop, pick the items of their choice from the shop shelves,place them into their baskets and then the contents of each basket are captured into transactionalsystems. These transactional systems generate data that can be used for analysis purposes. Thereare two major types of retail enterprises: centralized and distributed retail enterprises. This paperconcentrates on distributed retail enterprises as a way of alleviating analytics issues of enterprises in acompetitive market environment.
A distributed retail enterprise issues decision rights to the branches or groups nearest to the datacollection [3]. Each branch can make its own decisions, depending on the data generated. A distributed
Sustainability 2016, 8, 140; doi:10.3390/su8020140 www.mdpi.com/journal/sustainability271
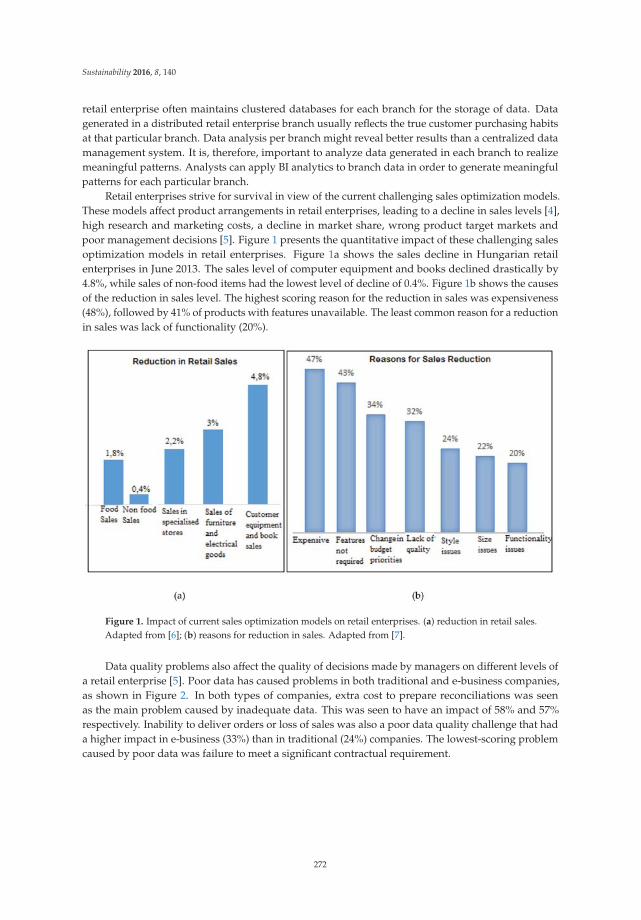
Sustainability 2016, 8, 140
retail enterprise often maintains clustered databases for each branch for the storage of data. Datagenerated in a distributed retail enterprise branch usually reflects the true customer purchasing habitsat that particular branch. Data analysis per branch might reveal better results than a centralized datamanagement system. It is, therefore, important to analyze data generated in each branch to realizemeaningful patterns. Analysts can apply BI analytics to branch data in order to generate meaningfulpatterns for each particular branch.
Retail enterprises strive for survival in view of the current challenging sales optimization models.These models affect product arrangements in retail enterprises, leading to a decline in sales levels [4],high research and marketing costs, a decline in market share, wrong product target markets andpoor management decisions [5]. Figure 1 presents the quantitative impact of these challenging salesoptimization models in retail enterprises. Figure 1a shows the sales decline in Hungarian retailenterprises in June 2013. The sales level of computer equipment and books declined drastically by4.8%, while sales of non-food items had the lowest level of decline of 0.4%. Figure 1b shows the causesof the reduction in sales level. The highest scoring reason for the reduction in sales was expensiveness(48%), followed by 41% of products with features unavailable. The least common reason for a reductionin sales was lack of functionality (20%).
Figure 1. Impact of current sales optimization models on retail enterprises. (a) reduction in retail sales.Adapted from [6]; (b) reasons for reduction in sales. Adapted from [7].
Data quality problems also affect the quality of decisions made by managers on different levels ofa retail enterprise [5]. Poor data has caused problems in both traditional and e-business companies,as shown in Figure 2. In both types of companies, extra cost to prepare reconciliations was seenas the main problem caused by inadequate data. This was seen to have an impact of 58% and 57%respectively. Inability to deliver orders or loss of sales was also a poor data quality challenge that hada higher impact in e-business (33%) than in traditional (24%) companies. The lowest-scoring problemcaused by poor data was failure to meet a significant contractual requirement.
272
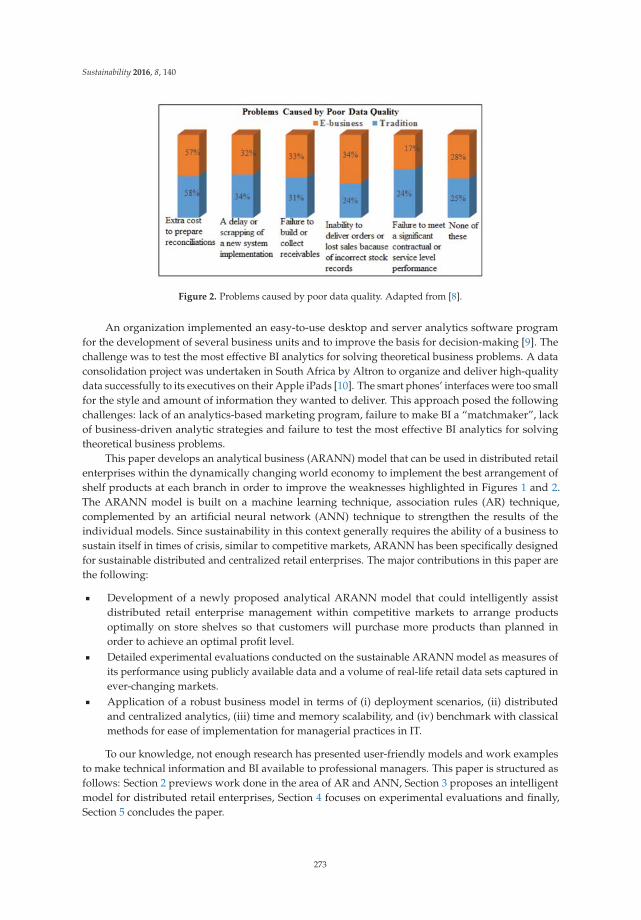
Sustainability 2016, 8, 140
Figure 2. Problems caused by poor data quality. Adapted from [8].
An organization implemented an easy-to-use desktop and server analytics software programfor the development of several business units and to improve the basis for decision-making [9]. Thechallenge was to test the most effective BI analytics for solving theoretical business problems. A dataconsolidation project was undertaken in South Africa by Altron to organize and deliver high-qualitydata successfully to its executives on their Apple iPads [10]. The smart phones’ interfaces were too smallfor the style and amount of information they wanted to deliver. This approach posed the followingchallenges: lack of an analytics-based marketing program, failure to make BI a “matchmaker”, lackof business-driven analytic strategies and failure to test the most effective BI analytics for solvingtheoretical business problems.
This paper develops an analytical business (ARANN) model that can be used in distributed retailenterprises within the dynamically changing world economy to implement the best arrangement ofshelf products at each branch in order to improve the weaknesses highlighted in Figures 1 and 2.The ARANN model is built on a machine learning technique, association rules (AR) technique,complemented by an artificial neural network (ANN) technique to strengthen the results of theindividual models. Since sustainability in this context generally requires the ability of a business tosustain itself in times of crisis, similar to competitive markets, ARANN has been specifically designedfor sustainable distributed and centralized retail enterprises. The major contributions in this paper arethe following:
‚ Development of a newly proposed analytical ARANN model that could intelligently assistdistributed retail enterprise management within competitive markets to arrange productsoptimally on store shelves so that customers will purchase more products than planned inorder to achieve an optimal profit level.
‚ Detailed experimental evaluations conducted on the sustainable ARANN model as measures ofits performance using publicly available data and a volume of real-life retail data sets captured inever-changing markets.
‚ Application of a robust business model in terms of (i) deployment scenarios, (ii) distributedand centralized analytics, (iii) time and memory scalability, and (iv) benchmark with classicalmethods for ease of implementation for managerial practices in IT.
To our knowledge, not enough research has presented user-friendly models and work examplesto make technical information and BI available to professional managers. This paper is structured asfollows: Section 2 previews work done in the area of AR and ANN, Section 3 proposes an intelligentmodel for distributed retail enterprises, Section 4 focuses on experimental evaluations and finally,Section 5 concludes the paper.
273
Sustainability 2016, 8, 140
2. Background Studies
2.1. Related Work
Besides the analytics software programs and projects mentioned above, classical applications ofAR and ANN are highlighted here. From the research conducted in [11], the authors applied AR tomedical data containing combinations of categorical and numerical attributes to discover useful rulesand from this experiment, useful and concise AR were discovered for prediction purposes. In [12], theauthors implemented a system for the discovery of AR in web log usage data as an object-orientedapplication and discovered excellent associations within the data. They put forward “interestingnessmeasures” as future work. In [13], the researchers applied an AR algorithm to a large database ofcustomer transactions from a large retailing company to test the effectiveness of the algorithm and itexhibited excellent performance. In the study conducted in [14], it was observed that AR is effective inrevealing associations though it does not take into account special interests. A comprehensive surveywas conducted in [15] regarding AR on quantitative data in data mining. The authors examined itusing different parameters and they concluded that the direct application of AR might produce a largenumber of redundant rules. This is also supported in the article in [16].
AR was applied in [4] to a sport company struggling with the arrangement of sports items inaccordance with customer purchasing patterns. The retail company had no computerized mechanismfor providing the best item arrangement. The study was performed to identify purchasing patternsthat could be adopted by the retail enterprise. The authors analyzed historical data to identify theassociated patterns from transactional data. From the study, they found relationships between sportsitems purchased and the best ways of arranging items, either side by side or in the same retail area, sothat the items were frequently purchased together to yield high sales. In this study, AR was used formining relationships between items purchased.
AR was applied in [11] to medical data containing combinations of categorical and numericalattributes to discover useful rules and from this experiment, useful and concise associations werediscovered for prediction purposes. Ordonez [17] used AR to predict the level of contraction in fourarteries and risk factors. The experiment predicted accurate profiles of patients with localized heartproblems, specific risk factors and the level of disease in one artery.
ANN have been used in the past to search for patterns and predict future sales [18]. In researchconducted in [19], the authors evaluated the predictive accuracy of ANNs and logistic regression (LR)in marketing campaigns of a Portuguese banking institution and their results showed that ANNs aremore efficient and faster than LR. In [20], the researchers applied ANNs to a Pima Indians diabetesdatabase and it generated rules with strong associations, thereby enhancing the decision-makingprocess by doctors. In research conducted in [21], ANNs were applied for retail segmentation. Theauthors compared an ANN technique based on Hopfield networks against k-means and mixture modelclustering algorithms. The results showed the usefulness of ANNs in retailing for segmenting markets.Many articles mentioned in [22] consider ANNs to be a promising machine learning technique.
In research conducted in [23], it was observed that the combination of data mining methodsand a neural network model can greatly improve the efficiency of data mining methods. Craven andShavlik [24] also supported ANN in data mining because of the ability to learn the target conceptbetter than when using data mining methods. However, they presented two limitations that makeANNs poor data mining tools: excessive training times and incomprehensible learning. The proposedanalytical model seeks to use AR complemented by ANNs to implement the best arrangement of shelfproducts, branch by branch, in order to use the cooperative result to make managerial decisions.
This research is undertaken to improve the following challenges of current sales optimizationmodels: lack of analytics-based marketing programs, lack of business-driven analytic strategies andfailure to leverage BI to become “matchmakers”. To our knowledge, not enough research has presentedworking examples and considered non-expert users in proposing models that are user-friendly to
274
Sustainability 2016, 8, 140
professional managers. Sections 2.2 and 2.3 explain the building blocks of the analytic model wherethe processed data from different branches is entered.
2.2. Association Rules
AR mining is an unsupervised data mining method to find interesting associations in large sets ofdata items [25]. It was originally derived from point-of-sale data that describes which products arepurchased simultaneously. AR discovers interesting associations that are often used by businesses suchas retail enterprises for decision-making purposes; an example could be to find out which products arefrequently purchased simultaneously by different customers [26]. It is one of the most common andwidely used techniques in data mining, aimed at finding interesting relations [27,28] or correlationsbetween large data items [29]. AR provides decision-makers at retail enterprises with marketinginsights for cross-selling by providing information about product associations [30]. The most commonAR algorithm used in market basket analysis is Apriori. However, the Apriori algorithm has animportant drawback of generating numerous candidate item sets that must be repeatedly contrastedwith the whole database [31]. We are going to use two measures to quantify the interestingness of arule: support and confidence.
2.2.1. Support Value
Support determines how frequently a rule is contained in a given dataset. It is defined as thefraction of transactions that contains A Y B to the total number of transactions in the database [32]and this can be expressed as shown in Equation (1):
SupportpA ñ Bq “ PpA Y Bq “ npA Y BqN
(1)
If support (AñB) is greater than or equal to the minimum support threshold (min_sup) then it isa frequent item set. An item set is frequent if support (AñB) ě min_sup().
2.2.2. Confidence Value
Confidence is the ratio of the number of transactions containing A and B to the number oftransactions containing A, and can be further expressed as shown in Equation (2):
Con f idencepA ñ Bq “ PpB{Aq “ npA Y BqnpAq (2)
If confidence (AñB) is greater than or equal to the minimum confidence (min_con) then we areconfident about the rule generated.
Furthermore, rules that satisfy both the minimum support threshold (min_sup) and the minimumconfidence threshold (min_con) are called strong AR. A rule is strong if support (AñB) ě min_sup ^confidence (AñB) ě min_con. These two measures are used as inputs in the ANN technique.
2.3. Artificial Neural Networks
ANNs simulate the behavior of biological systems and are used to discover patterns andrelationships. They are useful for studying complex relationships between input and output variablesin a system [33]. The main advantage of an ANN is the ability to extract patterns and detect trends thatare too complex to be noticed by other computer techniques or humans [34]. In [35], the research doneshows that ANNs are now commonly used to solve data mining problems because of the followingadvantages: robustness, self-organizing adaptiveness, parallel processing, distributed storage and ahigh degree of fault tolerance. The ANN sums the inputs xi against corresponding weights wi andcompares the ANN output to the threshold value, a. The threshold is determined by the inputs used.
275
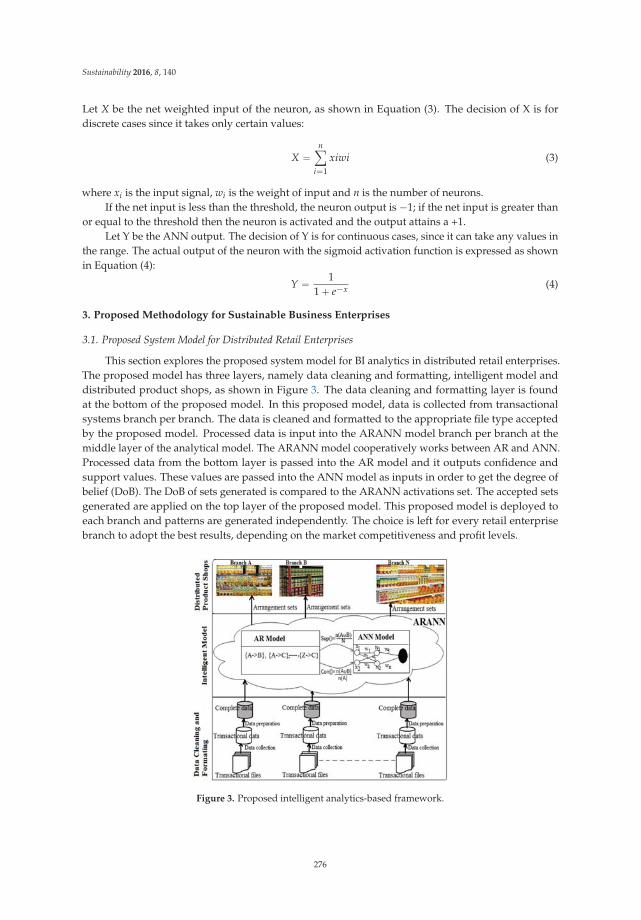
Sustainability 2016, 8, 140
Let X be the net weighted input of the neuron, as shown in Equation (3). The decision of X is fordiscrete cases since it takes only certain values:
X “nÿ
i“1
xiwi (3)
where xi is the input signal, wi is the weight of input and n is the number of neurons.If the net input is less than the threshold, the neuron output is ´1; if the net input is greater than
or equal to the threshold then the neuron is activated and the output attains a +1.Let Y be the ANN output. The decision of Y is for continuous cases, since it can take any values in
the range. The actual output of the neuron with the sigmoid activation function is expressed as shownin Equation (4):
Y “ 11 ` e´x (4)
3. Proposed Methodology for Sustainable Business Enterprises
3.1. Proposed System Model for Distributed Retail Enterprises
This section explores the proposed system model for BI analytics in distributed retail enterprises.The proposed model has three layers, namely data cleaning and formatting, intelligent model anddistributed product shops, as shown in Figure 3. The data cleaning and formatting layer is foundat the bottom of the proposed model. In this proposed model, data is collected from transactionalsystems branch per branch. The data is cleaned and formatted to the appropriate file type acceptedby the proposed model. Processed data is input into the ARANN model branch per branch at themiddle layer of the analytical model. The ARANN model cooperatively works between AR and ANN.Processed data from the bottom layer is passed into the AR model and it outputs confidence andsupport values. These values are passed into the ANN model as inputs in order to get the degree ofbelief (DoB). The DoB of sets generated is compared to the ARANN activations set. The accepted setsgenerated are applied on the top layer of the proposed model. This proposed model is deployed toeach branch and patterns are generated independently. The choice is left for every retail enterprisebranch to adopt the best results, depending on the market competitiveness and profit levels.
Figure 3. Proposed intelligent analytics-based framework.
276
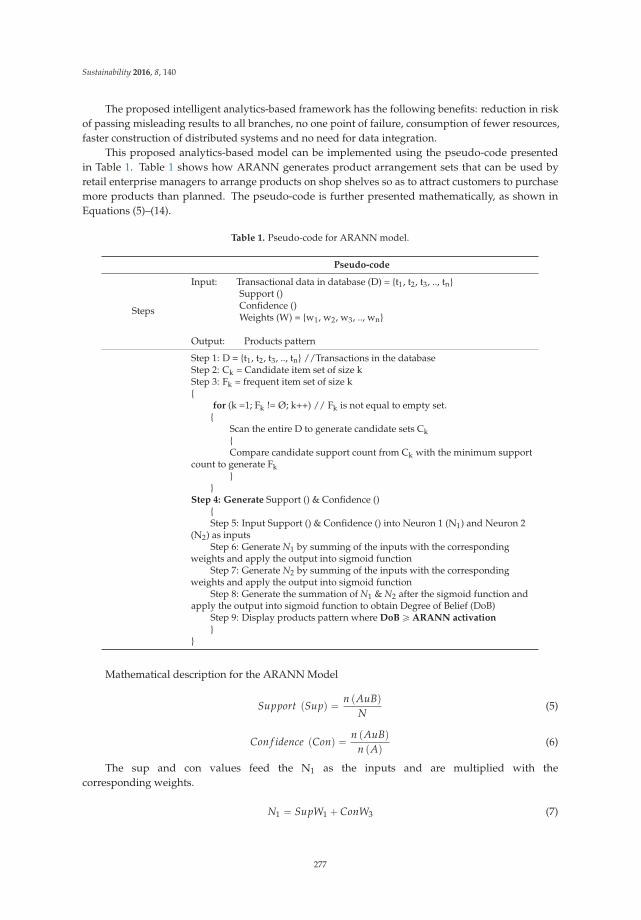
Sustainability 2016, 8, 140
The proposed intelligent analytics-based framework has the following benefits: reduction in riskof passing misleading results to all branches, no one point of failure, consumption of fewer resources,faster construction of distributed systems and no need for data integration.
This proposed analytics-based model can be implemented using the pseudo-code presentedin Table 1. Table 1 shows how ARANN generates product arrangement sets that can be used byretail enterprise managers to arrange products on shop shelves so as to attract customers to purchasemore products than planned. The pseudo-code is further presented mathematically, as shown inEquations (5)–(14).
Table 1. Pseudo-code for ARANN model.
Pseudo-code
Steps
Input: Transactional data in database (D) = {t1, t2, t3, .., tn}Support ()Confidence ()Weights (W) = {w1, w2, w3, .., wn}
Output: Products pattern
Step 1: D = {t1, t2, t3, .., tn} //Transactions in the databaseStep 2: Ck = Candidate item set of size kStep 3: Fk = frequent item set of size k{
for (k =1; Fk != Ø; k++) // Fk is not equal to empty set.{
Scan the entire D to generate candidate sets Ck{Compare candidate support count from Ck with the minimum support
count to generate Fk}
}Step 4: Generate Support () & Confidence ()
{Step 5: Input Support () & Confidence () into Neuron 1 (N1) and Neuron 2
(N2) as inputsStep 6: Generate N1 by summing of the inputs with the corresponding
weights and apply the output into sigmoid functionStep 7: Generate N2 by summing of the inputs with the corresponding
weights and apply the output into sigmoid functionStep 8: Generate the summation of N1 & N2 after the sigmoid function and
apply the output into sigmoid function to obtain Degree of Belief (DoB)Step 9: Display products pattern where DoB ě ARANN activation}
}
Mathematical description for the ARANN Model
Support pSupq “ n pAuBqN
(5)
Con f idence pConq “ n pAuBqn pAq (6)
The sup and con values feed the N1 as the inputs and are multiplied with thecorresponding weights.
N1 “ SupW1 ` ConW3 (7)
277
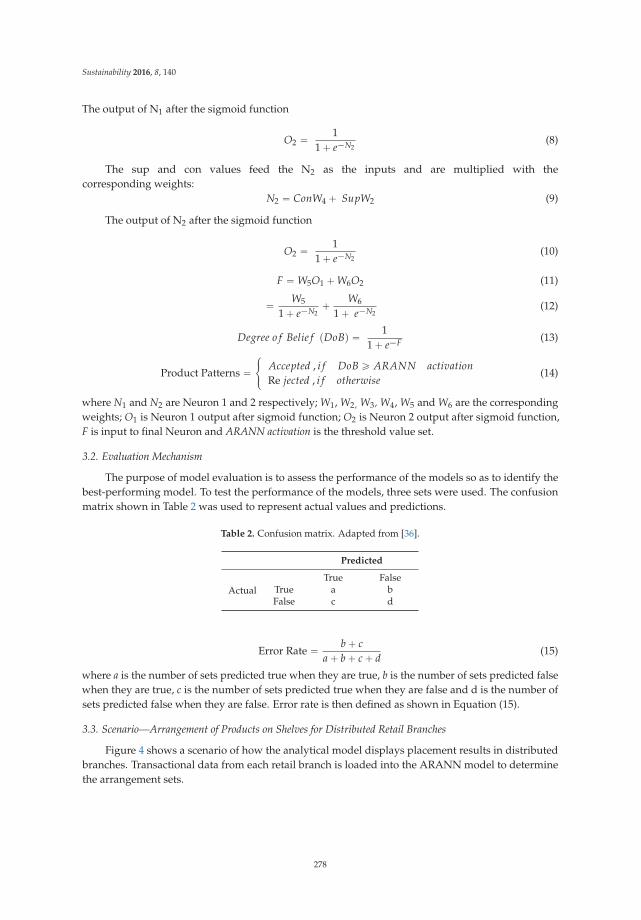
Sustainability 2016, 8, 140
The output of N1 after the sigmoid function
O2 “ 11 ` e´N2
(8)
The sup and con values feed the N2 as the inputs and are multiplied with thecorresponding weights:
N2 “ ConW4 ` SupW2 (9)
The output of N2 after the sigmoid function
O2 “ 11 ` e´N2
(10)
F “ W5O1 ` W6O2 (11)
“ W5
1 ` e´N2` W6
1 ` e´N2(12)
Degree o f Belie f pDoBq “ 11 ` e´F (13)
Product Patterns “#
Accepted , i f DoB ě ARANN activationRe jected , i f otherwise
(14)
where N1 and N2 are Neuron 1 and 2 respectively; W1, W2, W3, W4, W5 and W6 are the correspondingweights; O1 is Neuron 1 output after sigmoid function; O2 is Neuron 2 output after sigmoid function,F is input to final Neuron and ARANN activation is the threshold value set.
3.2. Evaluation Mechanism
The purpose of model evaluation is to assess the performance of the models so as to identify thebest-performing model. To test the performance of the models, three sets were used. The confusionmatrix shown in Table 2 was used to represent actual values and predictions.
Table 2. Confusion matrix. Adapted from [36].
Predicted
ActualTrue False
True a bFalse c d
Error Rate “ b ` ca ` b ` c ` d
(15)
where a is the number of sets predicted true when they are true, b is the number of sets predicted falsewhen they are true, c is the number of sets predicted true when they are false and d is the number ofsets predicted false when they are false. Error rate is then defined as shown in Equation (15).
3.3. Scenario—Arrangement of Products on Shelves for Distributed Retail Branches
Figure 4 shows a scenario of how the analytical model displays placement results in distributedbranches. Transactional data from each retail branch is loaded into the ARANN model to determinethe arrangement sets.
278
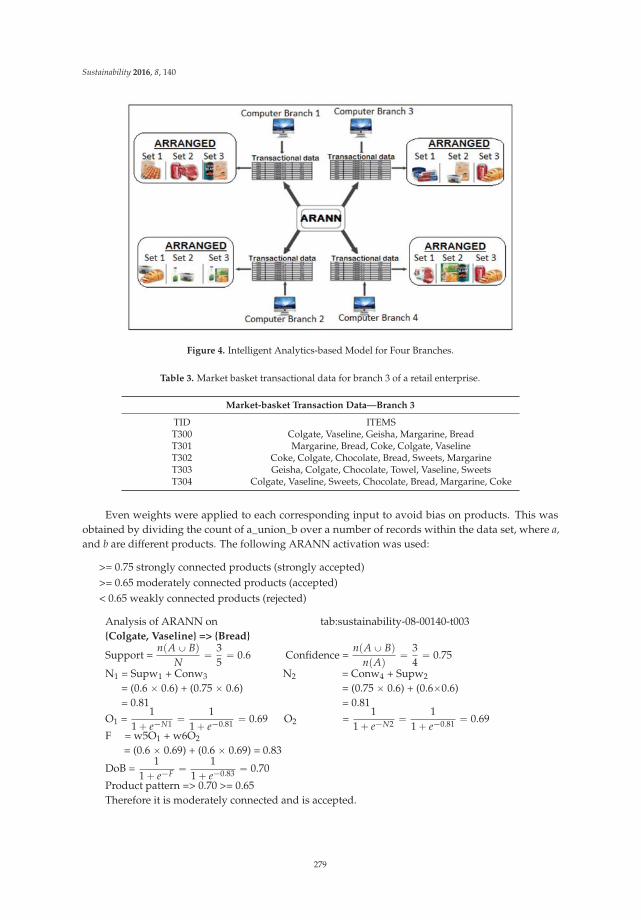
Sustainability 2016, 8, 140
Figure 4. Intelligent Analytics-based Model for Four Branches.
Table 3. Market basket transactional data for branch 3 of a retail enterprise.
Market-basket Transaction Data—Branch 3
TID ITEMST300 Colgate, Vaseline, Geisha, Margarine, BreadT301 Margarine, Bread, Coke, Colgate, VaselineT302 Coke, Colgate, Chocolate, Bread, Sweets, MargarineT303 Geisha, Colgate, Chocolate, Towel, Vaseline, SweetsT304 Colgate, Vaseline, Sweets, Chocolate, Bread, Margarine, Coke
Even weights were applied to each corresponding input to avoid bias on products. This wasobtained by dividing the count of a_union_b over a number of records within the data set, where a,and b are different products. The following ARANN activation was used:
>= 0.75 strongly connected products (strongly accepted)>= 0.65 moderately connected products (accepted)< 0.65 weakly connected products (rejected)
Analysis of ARANN on tab:sustainability-08-00140-t003{Colgate, Vaseline} => {Bread}
Support =npA Y Bq
N“ 3
5“ 0.6 Confidence =
npA Y BqnpAq “ 3
4“ 0.75
N1 = Supw1 + Conw3 N2 = Conw4 + Supw2
= (0.6 ˆ 0.6) + (0.75 ˆ 0.6) = (0.75 ˆ 0.6) + (0.6ˆ0.6)= 0.81 = 0.81
O1 =1
1 ` e´N1 “ 11 ` e´0.81 “ 0.69 O2 =
11 ` e´N2 “ 1
1 ` e´0.81 “ 0.69
F = w5O1 + w6O2
= (0.6 ˆ 0.69) + (0.6 ˆ 0.69) = 0.83
DoB =1
1 ` e´F “ 11 ` e´0.83 “ 0.70
Product pattern => 0.70 >= 0.65Therefore it is moderately connected and is accepted.
279
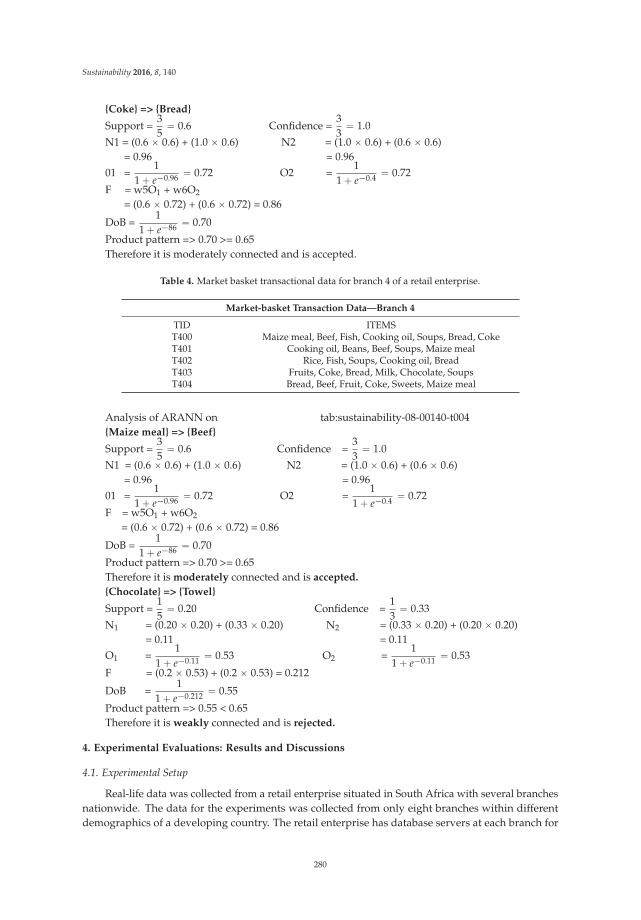
Sustainability 2016, 8, 140
{Coke} => {Bread}
Support =35
“ 0.6 Confidence =33
“ 1.0N1 = (0.6 ˆ 0.6) + (1.0 ˆ 0.6) N2 = (1.0 ˆ 0.6) + (0.6 ˆ 0.6)
= 0.96 = 0.9601 =
11 ` e´0.96 “ 0.72 O2 =
11 ` e´0.4 “ 0.72
F = w5O1 + w6O2
= (0.6 ˆ 0.72) + (0.6 ˆ 0.72) = 0.86
DoB =1
1 ` e´86 “ 0.70
Product pattern => 0.70 >= 0.65Therefore it is moderately connected and is accepted.
Table 4. Market basket transactional data for branch 4 of a retail enterprise.
Market-basket Transaction Data—Branch 4
TID ITEMST400 Maize meal, Beef, Fish, Cooking oil, Soups, Bread, CokeT401 Cooking oil, Beans, Beef, Soups, Maize mealT402 Rice, Fish, Soups, Cooking oil, BreadT403 Fruits, Coke, Bread, Milk, Chocolate, SoupsT404 Bread, Beef, Fruit, Coke, Sweets, Maize meal
Analysis of ARANN on tab:sustainability-08-00140-t004{Maize meal} => {Beef}
Support =35
“ 0.6 Confidence =33
“ 1.0N1 = (0.6 ˆ 0.6) + (1.0 ˆ 0.6) N2 = (1.0 ˆ 0.6) + (0.6 ˆ 0.6)
= 0.96 = 0.9601 =
11 ` e´0.96 “ 0.72 O2 =
11 ` e´0.4 “ 0.72
F = w5O1 + w6O2
= (0.6 ˆ 0.72) + (0.6 ˆ 0.72) = 0.86
DoB =1
1 ` e´86 “ 0.70
Product pattern => 0.70 >= 0.65Therefore it is moderately connected and is accepted.
{Chocolate} => {Towel}
Support =15
“ 0.20 Confidence =13
“ 0.33N1 = (0.20 ˆ 0.20) + (0.33 ˆ 0.20) N2 = (0.33 ˆ 0.20) + (0.20 ˆ 0.20)
= 0.11 = 0.11O1 =
11 ` e´0.11 “ 0.53 O2 =
11 ` e´0.11 “ 0.53
F = (0.2 ˆ 0.53) + (0.2 ˆ 0.53) = 0.212
DoB =1
1 ` e´0.212 “ 0.55
Product pattern => 0.55 < 0.65Therefore it is weakly connected and is rejected.
4. Experimental Evaluations: Results and Discussions
4.1. Experimental Setup
Real-life data was collected from a retail enterprise situated in South Africa with several branchesnationwide. The data for the experiments was collected from only eight branches within differentdemographics of a developing country. The retail enterprise has database servers at each branch for
280
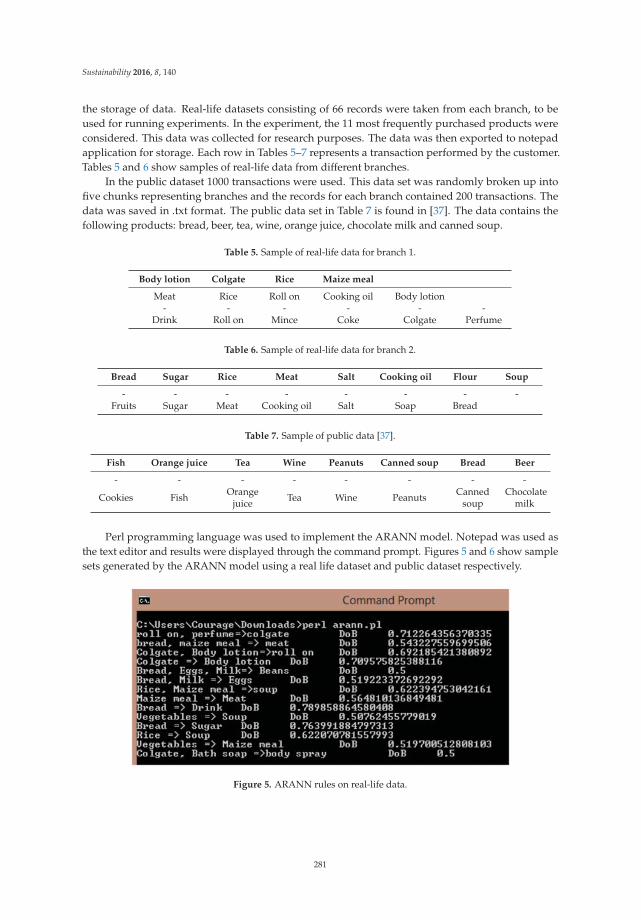
Sustainability 2016, 8, 140
the storage of data. Real-life datasets consisting of 66 records were taken from each branch, to beused for running experiments. In the experiment, the 11 most frequently purchased products wereconsidered. This data was collected for research purposes. The data was then exported to notepadapplication for storage. Each row in Tables 5–7 represents a transaction performed by the customer.Tables 5 and 6 show samples of real-life data from different branches.
In the public dataset 1000 transactions were used. This data set was randomly broken up intofive chunks representing branches and the records for each branch contained 200 transactions. Thedata was saved in .txt format. The public data set in Table 7 is found in [37]. The data contains thefollowing products: bread, beer, tea, wine, orange juice, chocolate milk and canned soup.
Table 5. Sample of real-life data for branch 1.
Body lotion Colgate Rice Maize meal
Meat Rice Roll on Cooking oil Body lotion- - - - - -
Drink Roll on Mince Coke Colgate Perfume
Table 6. Sample of real-life data for branch 2.
Bread Sugar Rice Meat Salt Cooking oil Flour Soup
- - - - - - - -Fruits Sugar Meat Cooking oil Salt Soap Bread
Table 7. Sample of public data [37].
Fish Orange juice Tea Wine Peanuts Canned soup Bread Beer
- - - - - - - -
Cookies Fish Orangejuice Tea Wine Peanuts Canned
soupChocolate
milk
Perl programming language was used to implement the ARANN model. Notepad was used asthe text editor and results were displayed through the command prompt. Figures 5 and 6 show samplesets generated by the ARANN model using a real life dataset and public dataset respectively.
Figure 5. ARANN rules on real-life data.
281
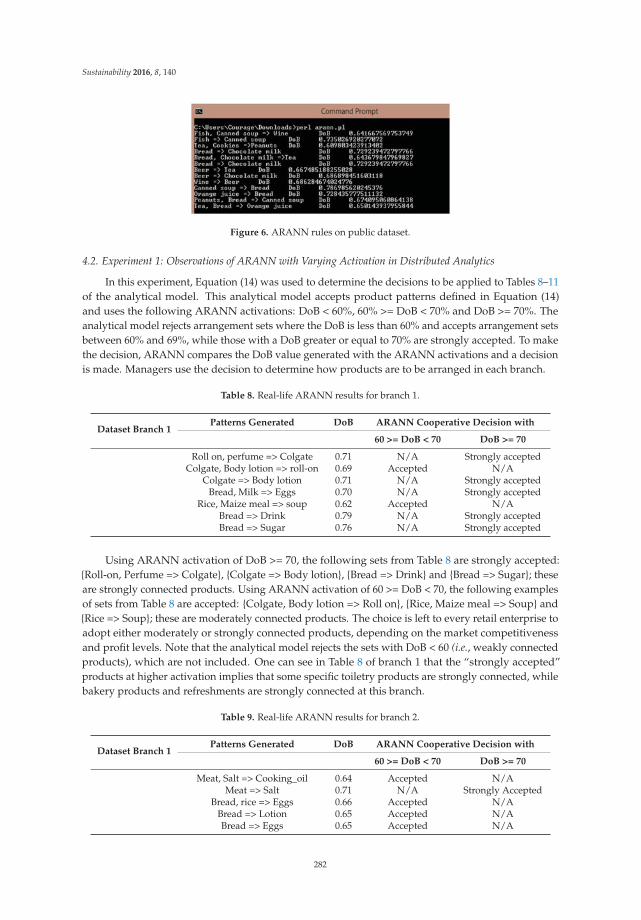
Sustainability 2016, 8, 140
Figure 6. ARANN rules on public dataset.
4.2. Experiment 1: Observations of ARANN with Varying Activation in Distributed Analytics
In this experiment, Equation (14) was used to determine the decisions to be applied to Tables 8–11of the analytical model. This analytical model accepts product patterns defined in Equation (14)and uses the following ARANN activations: DoB < 60%, 60% >= DoB < 70% and DoB >= 70%. Theanalytical model rejects arrangement sets where the DoB is less than 60% and accepts arrangement setsbetween 60% and 69%, while those with a DoB greater or equal to 70% are strongly accepted. To makethe decision, ARANN compares the DoB value generated with the ARANN activations and a decisionis made. Managers use the decision to determine how products are to be arranged in each branch.
Table 8. Real-life ARANN results for branch 1.
Dataset Branch 1Patterns Generated DoB ARANN Cooperative Decision with
60 >= DoB < 70 DoB >= 70
Roll on, perfume => Colgate 0.71 N/A Strongly acceptedColgate, Body lotion => roll-on 0.69 Accepted N/A
Colgate => Body lotion 0.71 N/A Strongly acceptedBread, Milk => Eggs 0.70 N/A Strongly accepted
Rice, Maize meal => soup 0.62 Accepted N/ABread => Drink 0.79 N/A Strongly acceptedBread => Sugar 0.76 N/A Strongly accepted
Using ARANN activation of DoB >= 70, the following sets from Table 8 are strongly accepted:{Roll-on, Perfume => Colgate}, {Colgate => Body lotion}, {Bread => Drink} and {Bread => Sugar}; theseare strongly connected products. Using ARANN activation of 60 >= DoB < 70, the following examplesof sets from Table 8 are accepted: {Colgate, Body lotion => Roll on}, {Rice, Maize meal => Soup} and{Rice => Soup}; these are moderately connected products. The choice is left to every retail enterprise toadopt either moderately or strongly connected products, depending on the market competitivenessand profit levels. Note that the analytical model rejects the sets with DoB < 60 (i.e., weakly connectedproducts), which are not included. One can see in Table 8 of branch 1 that the “strongly accepted”products at higher activation implies that some specific toiletry products are strongly connected, whilebakery products and refreshments are strongly connected at this branch.
Table 9. Real-life ARANN results for branch 2.
Dataset Branch 1Patterns Generated DoB ARANN Cooperative Decision with
60 >= DoB < 70 DoB >= 70
Meat, Salt => Cooking_oil 0.64 Accepted N/AMeat => Salt 0.71 N/A Strongly Accepted
Bread, rice => Eggs 0.66 Accepted N/ABread => Lotion 0.65 Accepted N/ABread => Eggs 0.65 Accepted N/A
282
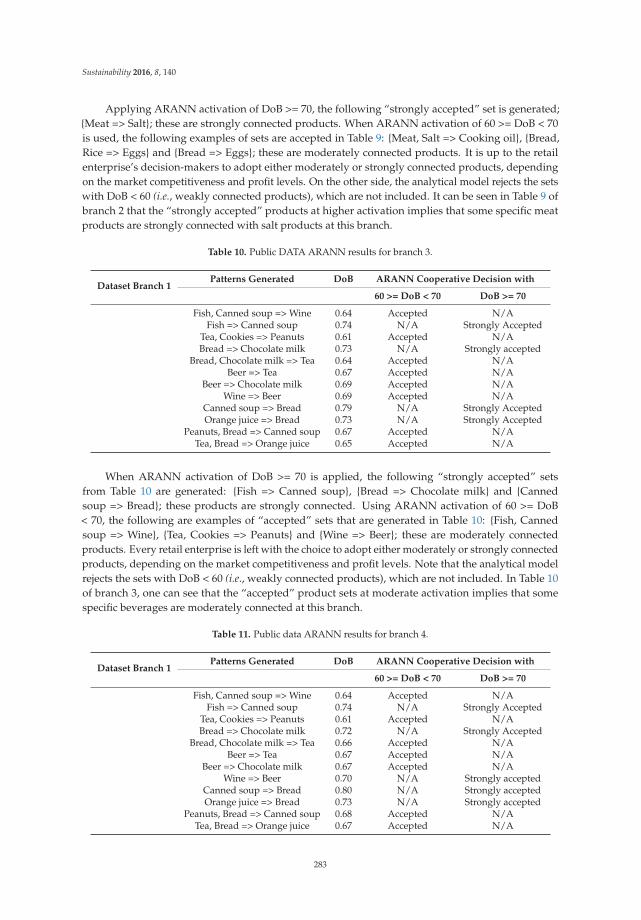
Sustainability 2016, 8, 140
Applying ARANN activation of DoB >= 70, the following “strongly accepted” set is generated;{Meat => Salt}; these are strongly connected products. When ARANN activation of 60 >= DoB < 70is used, the following examples of sets are accepted in Table 9: {Meat, Salt => Cooking oil}, {Bread,Rice => Eggs} and {Bread => Eggs}; these are moderately connected products. It is up to the retailenterprise’s decision-makers to adopt either moderately or strongly connected products, dependingon the market competitiveness and profit levels. On the other side, the analytical model rejects the setswith DoB < 60 (i.e., weakly connected products), which are not included. It can be seen in Table 9 ofbranch 2 that the “strongly accepted” products at higher activation implies that some specific meatproducts are strongly connected with salt products at this branch.
Table 10. Public DATA ARANN results for branch 3.
Dataset Branch 1Patterns Generated DoB ARANN Cooperative Decision with
60 >= DoB < 70 DoB >= 70
Fish, Canned soup => Wine 0.64 Accepted N/AFish => Canned soup 0.74 N/A Strongly Accepted
Tea, Cookies => Peanuts 0.61 Accepted N/ABread => Chocolate milk 0.73 N/A Strongly accepted
Bread, Chocolate milk => Tea 0.64 Accepted N/ABeer => Tea 0.67 Accepted N/A
Beer => Chocolate milk 0.69 Accepted N/AWine => Beer 0.69 Accepted N/A
Canned soup => Bread 0.79 N/A Strongly AcceptedOrange juice => Bread 0.73 N/A Strongly Accepted
Peanuts, Bread => Canned soup 0.67 Accepted N/ATea, Bread => Orange juice 0.65 Accepted N/A
When ARANN activation of DoB >= 70 is applied, the following “strongly accepted” setsfrom Table 10 are generated: {Fish => Canned soup}, {Bread => Chocolate milk} and {Cannedsoup => Bread}; these products are strongly connected. Using ARANN activation of 60 >= DoB< 70, the following are examples of “accepted” sets that are generated in Table 10: {Fish, Cannedsoup => Wine}, {Tea, Cookies => Peanuts} and {Wine => Beer}; these are moderately connectedproducts. Every retail enterprise is left with the choice to adopt either moderately or strongly connectedproducts, depending on the market competitiveness and profit levels. Note that the analytical modelrejects the sets with DoB < 60 (i.e., weakly connected products), which are not included. In Table 10of branch 3, one can see that the “accepted” product sets at moderate activation implies that somespecific beverages are moderately connected at this branch.
Table 11. Public data ARANN results for branch 4.
Dataset Branch 1Patterns Generated DoB ARANN Cooperative Decision with
60 >= DoB < 70 DoB >= 70
Fish, Canned soup => Wine 0.64 Accepted N/AFish => Canned soup 0.74 N/A Strongly Accepted
Tea, Cookies => Peanuts 0.61 Accepted N/ABread => Chocolate milk 0.72 N/A Strongly Accepted
Bread, Chocolate milk => Tea 0.66 Accepted N/ABeer => Tea 0.67 Accepted N/A
Beer => Chocolate milk 0.67 Accepted N/AWine => Beer 0.70 N/A Strongly accepted
Canned soup => Bread 0.80 N/A Strongly acceptedOrange juice => Bread 0.73 N/A Strongly accepted
Peanuts, Bread => Canned soup 0.68 Accepted N/ATea, Bread => Orange juice 0.67 Accepted N/A
283
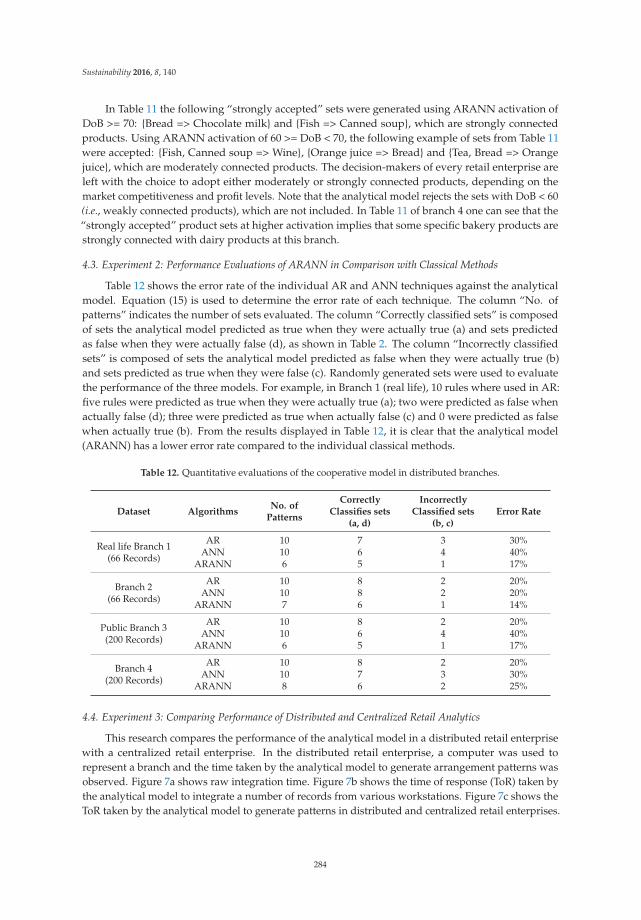
Sustainability 2016, 8, 140
In Table 11 the following “strongly accepted” sets were generated using ARANN activation ofDoB >= 70: {Bread => Chocolate milk} and {Fish => Canned soup}, which are strongly connectedproducts. Using ARANN activation of 60 >= DoB < 70, the following example of sets from Table 11were accepted: {Fish, Canned soup => Wine}, {Orange juice => Bread} and {Tea, Bread => Orangejuice}, which are moderately connected products. The decision-makers of every retail enterprise areleft with the choice to adopt either moderately or strongly connected products, depending on themarket competitiveness and profit levels. Note that the analytical model rejects the sets with DoB < 60(i.e., weakly connected products), which are not included. In Table 11 of branch 4 one can see that the“strongly accepted” product sets at higher activation implies that some specific bakery products arestrongly connected with dairy products at this branch.
4.3. Experiment 2: Performance Evaluations of ARANN in Comparison with Classical Methods
Table 12 shows the error rate of the individual AR and ANN techniques against the analyticalmodel. Equation (15) is used to determine the error rate of each technique. The column “No. ofpatterns” indicates the number of sets evaluated. The column “Correctly classified sets” is composedof sets the analytical model predicted as true when they were actually true (a) and sets predictedas false when they were actually false (d), as shown in Table 2. The column “Incorrectly classifiedsets” is composed of sets the analytical model predicted as false when they were actually true (b)and sets predicted as true when they were false (c). Randomly generated sets were used to evaluatethe performance of the three models. For example, in Branch 1 (real life), 10 rules where used in AR:five rules were predicted as true when they were actually true (a); two were predicted as false whenactually false (d); three were predicted as true when actually false (c) and 0 were predicted as falsewhen actually true (b). From the results displayed in Table 12, it is clear that the analytical model(ARANN) has a lower error rate compared to the individual classical methods.
Table 12. Quantitative evaluations of the cooperative model in distributed branches.
Dataset AlgorithmsNo. of
Patterns
CorrectlyClassifies sets
(a, d)
IncorrectlyClassified sets
(b, c)Error Rate
Real life Branch 1(66 Records)
AR 10 7 3 30%ANN 10 6 4 40%
ARANN 6 5 1 17%
Branch 2(66 Records)
AR 10 8 2 20%ANN 10 8 2 20%
ARANN 7 6 1 14%
Public Branch 3(200 Records)
AR 10 8 2 20%ANN 10 6 4 40%
ARANN 6 5 1 17%
Branch 4(200 Records)
AR 10 8 2 20%ANN 10 7 3 30%
ARANN 8 6 2 25%
4.4. Experiment 3: Comparing Performance of Distributed and Centralized Retail Analytics
This research compares the performance of the analytical model in a distributed retail enterprisewith a centralized retail enterprise. In the distributed retail enterprise, a computer was used torepresent a branch and the time taken by the analytical model to generate arrangement patterns wasobserved. Figure 7a shows raw integration time. Figure 7b shows the time of response (ToR) taken bythe analytical model to integrate a number of records from various workstations. Figure 7c shows theToR taken by the analytical model to generate patterns in distributed and centralized retail enterprises.
284
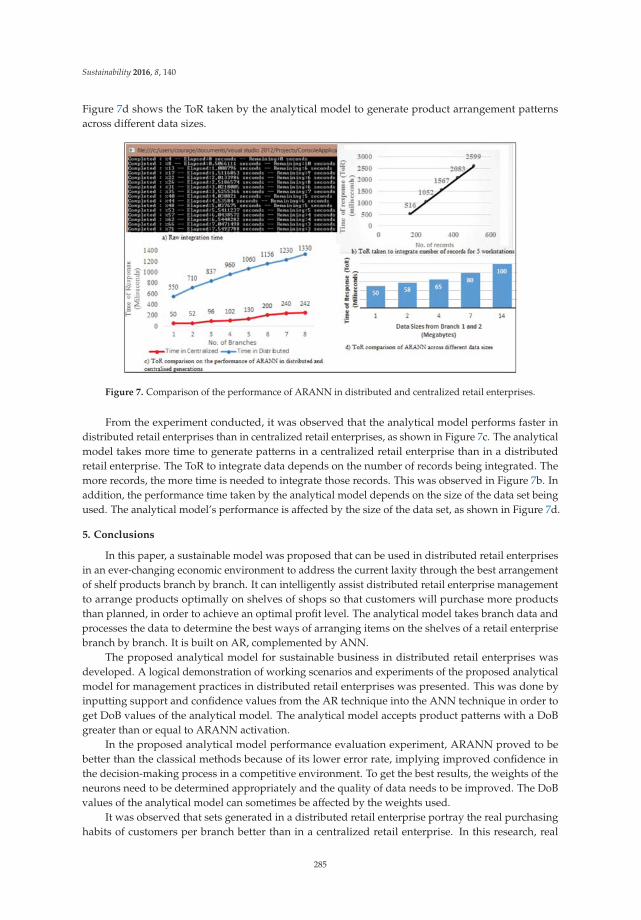
Sustainability 2016, 8, 140
Figure 7d shows the ToR taken by the analytical model to generate product arrangement patternsacross different data sizes.
Figure 7. Comparison of the performance of ARANN in distributed and centralized retail enterprises.
From the experiment conducted, it was observed that the analytical model performs faster indistributed retail enterprises than in centralized retail enterprises, as shown in Figure 7c. The analyticalmodel takes more time to generate patterns in a centralized retail enterprise than in a distributedretail enterprise. The ToR to integrate data depends on the number of records being integrated. Themore records, the more time is needed to integrate those records. This was observed in Figure 7b. Inaddition, the performance time taken by the analytical model depends on the size of the data set beingused. The analytical model’s performance is affected by the size of the data set, as shown in Figure 7d.
5. Conclusions
In this paper, a sustainable model was proposed that can be used in distributed retail enterprisesin an ever-changing economic environment to address the current laxity through the best arrangementof shelf products branch by branch. It can intelligently assist distributed retail enterprise managementto arrange products optimally on shelves of shops so that customers will purchase more productsthan planned, in order to achieve an optimal profit level. The analytical model takes branch data andprocesses the data to determine the best ways of arranging items on the shelves of a retail enterprisebranch by branch. It is built on AR, complemented by ANN.
The proposed analytical model for sustainable business in distributed retail enterprises wasdeveloped. A logical demonstration of working scenarios and experiments of the proposed analyticalmodel for management practices in distributed retail enterprises was presented. This was done byinputting support and confidence values from the AR technique into the ANN technique in order toget DoB values of the analytical model. The analytical model accepts product patterns with a DoBgreater than or equal to ARANN activation.
In the proposed analytical model performance evaluation experiment, ARANN proved to bebetter than the classical methods because of its lower error rate, implying improved confidence inthe decision-making process in a competitive environment. To get the best results, the weights of theneurons need to be determined appropriately and the quality of data needs to be improved. The DoBvalues of the analytical model can sometimes be affected by the weights used.
It was observed that sets generated in a distributed retail enterprise portray the real purchasinghabits of customers per branch better than in a centralized retail enterprise. In this research, real
285
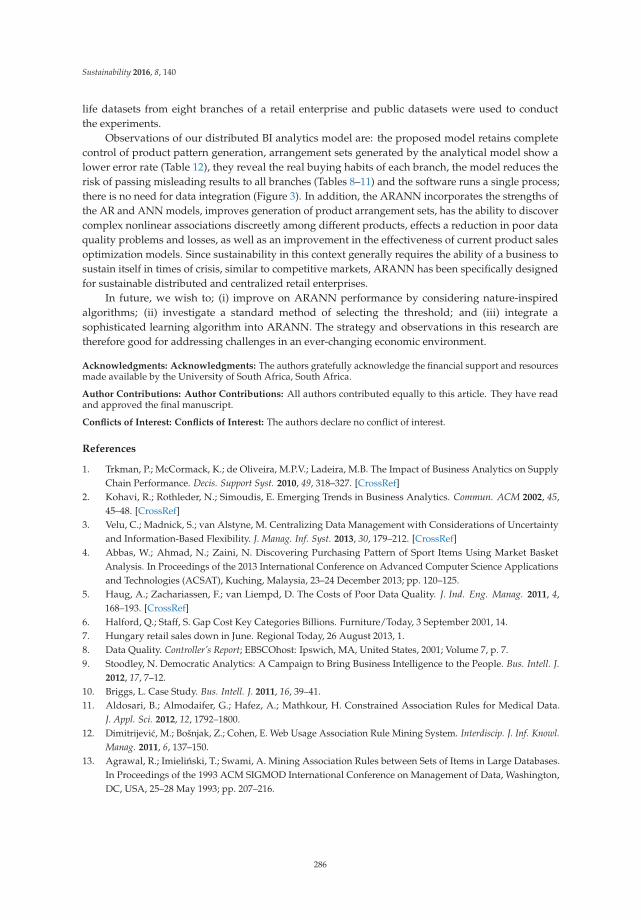
Sustainability 2016, 8, 140
life datasets from eight branches of a retail enterprise and public datasets were used to conductthe experiments.
Observations of our distributed BI analytics model are: the proposed model retains completecontrol of product pattern generation, arrangement sets generated by the analytical model show alower error rate (Table 12), they reveal the real buying habits of each branch, the model reduces therisk of passing misleading results to all branches (Tables 8–11) and the software runs a single process;there is no need for data integration (Figure 3). In addition, the ARANN incorporates the strengths ofthe AR and ANN models, improves generation of product arrangement sets, has the ability to discovercomplex nonlinear associations discreetly among different products, effects a reduction in poor dataquality problems and losses, as well as an improvement in the effectiveness of current product salesoptimization models. Since sustainability in this context generally requires the ability of a business tosustain itself in times of crisis, similar to competitive markets, ARANN has been specifically designedfor sustainable distributed and centralized retail enterprises.
In future, we wish to; (i) improve on ARANN performance by considering nature-inspiredalgorithms; (ii) investigate a standard method of selecting the threshold; and (iii) integrate asophisticated learning algorithm into ARANN. The strategy and observations in this research aretherefore good for addressing challenges in an ever-changing economic environment.
Acknowledgments: Acknowledgments: The authors gratefully acknowledge the financial support and resourcesmade available by the University of South Africa, South Africa.
Author Contributions: Author Contributions: All authors contributed equally to this article. They have readand approved the final manuscript.
Conflicts of Interest: Conflicts of Interest: The authors declare no conflict of interest.
References
1. Trkman, P.; McCormack, K.; de Oliveira, M.P.V.; Ladeira, M.B. The Impact of Business Analytics on SupplyChain Performance. Decis. Support Syst. 2010, 49, 318–327. [CrossRef]
2. Kohavi, R.; Rothleder, N.; Simoudis, E. Emerging Trends in Business Analytics. Commun. ACM 2002, 45,45–48. [CrossRef]
3. Velu, C.; Madnick, S.; van Alstyne, M. Centralizing Data Management with Considerations of Uncertaintyand Information-Based Flexibility. J. Manag. Inf. Syst. 2013, 30, 179–212. [CrossRef]
4. Abbas, W.; Ahmad, N.; Zaini, N. Discovering Purchasing Pattern of Sport Items Using Market BasketAnalysis. In Proceedings of the 2013 International Conference on Advanced Computer Science Applicationsand Technologies (ACSAT), Kuching, Malaysia, 23–24 December 2013; pp. 120–125.
5. Haug, A.; Zachariassen, F.; van Liempd, D. The Costs of Poor Data Quality. J. Ind. Eng. Manag. 2011, 4,168–193. [CrossRef]
6. Halford, Q.; Staff, S. Gap Cost Key Categories Billions. Furniture/Today, 3 September 2001, 14.7. Hungary retail sales down in June. Regional Today, 26 August 2013, 1.8. Data Quality. Controller’s Report; EBSCOhost: Ipswich, MA, United States, 2001; Volume 7, p. 7.9. Stoodley, N. Democratic Analytics: A Campaign to Bring Business Intelligence to the People. Bus. Intell. J.
2012, 17, 7–12.10. Briggs, L. Case Study. Bus. Intell. J. 2011, 16, 39–41.11. Aldosari, B.; Almodaifer, G.; Hafez, A.; Mathkour, H. Constrained Association Rules for Medical Data.
J. Appl. Sci. 2012, 12, 1792–1800.12. Dimitrijevic, M.; Bošnjak, Z.; Cohen, E. Web Usage Association Rule Mining System. Interdiscip. J. Inf. Knowl.
Manag. 2011, 6, 137–150.13. Agrawal, R.; Imielinski, T.; Swami, A. Mining Association Rules between Sets of Items in Large Databases.
In Proceedings of the 1993 ACM SIGMOD International Conference on Management of Data, Washington,DC, USA, 25–28 May 1993; pp. 207–216.
286
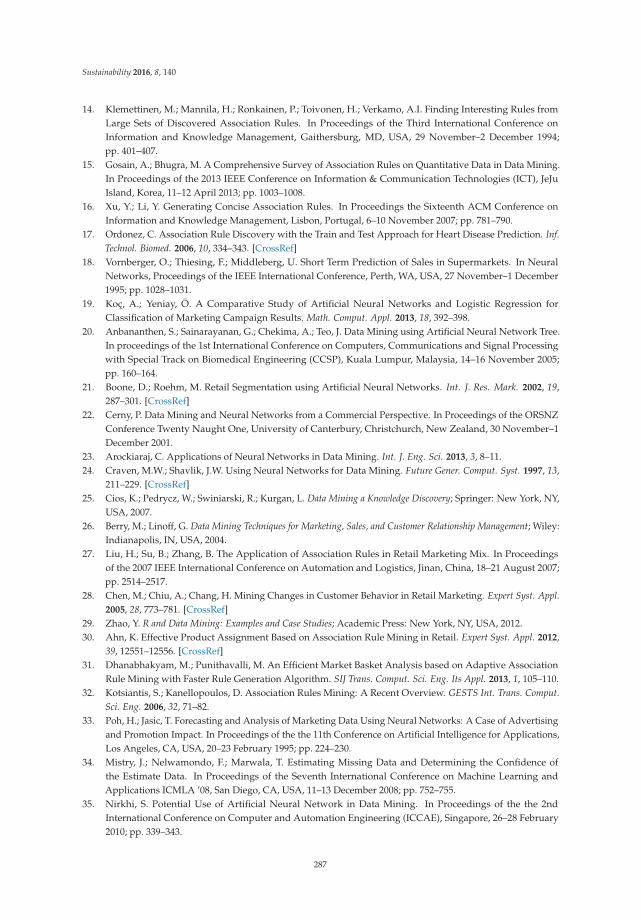
Sustainability 2016, 8, 140
14. Klemettinen, M.; Mannila, H.; Ronkainen, P.; Toivonen, H.; Verkamo, A.I. Finding Interesting Rules fromLarge Sets of Discovered Association Rules. In Proceedings of the Third International Conference onInformation and Knowledge Management, Gaithersburg, MD, USA, 29 November–2 December 1994;pp. 401–407.
15. Gosain, A.; Bhugra, M. A Comprehensive Survey of Association Rules on Quantitative Data in Data Mining.In Proceedings of the 2013 IEEE Conference on Information & Communication Technologies (ICT), JeJuIsland, Korea, 11–12 April 2013; pp. 1003–1008.
16. Xu, Y.; Li, Y. Generating Concise Association Rules. In Proceedings the Sixteenth ACM Conference onInformation and Knowledge Management, Lisbon, Portugal, 6–10 November 2007; pp. 781–790.
17. Ordonez, C. Association Rule Discovery with the Train and Test Approach for Heart Disease Prediction. Inf.Technol. Biomed. 2006, 10, 334–343. [CrossRef]
18. Vornberger, O.; Thiesing, F.; Middleberg, U. Short Term Prediction of Sales in Supermarkets. In NeuralNetworks, Proceedings of the IEEE International Conference, Perth, WA, USA, 27 November–1 December1995; pp. 1028–1031.
19. Koç, A.; Yeniay, Ö. A Comparative Study of Artificial Neural Networks and Logistic Regression forClassification of Marketing Campaign Results. Math. Comput. Appl. 2013, 18, 392–398.
20. Anbananthen, S.; Sainarayanan, G.; Chekima, A.; Teo, J. Data Mining using Artificial Neural Network Tree.In proceedings of the 1st International Conference on Computers, Communications and Signal Processingwith Special Track on Biomedical Engineering (CCSP), Kuala Lumpur, Malaysia, 14–16 November 2005;pp. 160–164.
21. Boone, D.; Roehm, M. Retail Segmentation using Artificial Neural Networks. Int. J. Res. Mark. 2002, 19,287–301. [CrossRef]
22. Cerny, P. Data Mining and Neural Networks from a Commercial Perspective. In Proceedings of the ORSNZConference Twenty Naught One, University of Canterbury, Christchurch, New Zealand, 30 November–1December 2001.
23. Arockiaraj, C. Applications of Neural Networks in Data Mining. Int. J. Eng. Sci. 2013, 3, 8–11.24. Craven, M.W.; Shavlik, J.W. Using Neural Networks for Data Mining. Future Gener. Comput. Syst. 1997, 13,
211–229. [CrossRef]25. Cios, K.; Pedrycz, W.; Swiniarski, R.; Kurgan, L. Data Mining a Knowledge Discovery; Springer: New York, NY,
USA, 2007.26. Berry, M.; Linoff, G. Data Mining Techniques for Marketing, Sales, and Customer Relationship Management; Wiley:
Indianapolis, IN, USA, 2004.27. Liu, H.; Su, B.; Zhang, B. The Application of Association Rules in Retail Marketing Mix. In Proceedings
of the 2007 IEEE International Conference on Automation and Logistics, Jinan, China, 18–21 August 2007;pp. 2514–2517.
28. Chen, M.; Chiu, A.; Chang, H. Mining Changes in Customer Behavior in Retail Marketing. Expert Syst. Appl.2005, 28, 773–781. [CrossRef]
29. Zhao, Y. R and Data Mining: Examples and Case Studies; Academic Press: New York, NY, USA, 2012.30. Ahn, K. Effective Product Assignment Based on Association Rule Mining in Retail. Expert Syst. Appl. 2012,
39, 12551–12556. [CrossRef]31. Dhanabhakyam, M.; Punithavalli, M. An Efficient Market Basket Analysis based on Adaptive Association
Rule Mining with Faster Rule Generation Algorithm. SIJ Trans. Comput. Sci. Eng. Its Appl. 2013, 1, 105–110.32. Kotsiantis, S.; Kanellopoulos, D. Association Rules Mining: A Recent Overview. GESTS Int. Trans. Comput.
Sci. Eng. 2006, 32, 71–82.33. Poh, H.; Jasic, T. Forecasting and Analysis of Marketing Data Using Neural Networks: A Case of Advertising
and Promotion Impact. In Proceedings of the the 11th Conference on Artificial Intelligence for Applications,Los Angeles, CA, USA, 20–23 February 1995; pp. 224–230.
34. Mistry, J.; Nelwamondo, F.; Marwala, T. Estimating Missing Data and Determining the Confidence ofthe Estimate Data. In Proceedings of the Seventh International Conference on Machine Learning andApplications ICMLA ’08, San Diego, CA, USA, 11–13 December 2008; pp. 752–755.
35. Nirkhi, S. Potential Use of Artificial Neural Network in Data Mining. In Proceedings of the the 2ndInternational Conference on Computer and Automation Engineering (ICCAE), Singapore, 26–28 February2010; pp. 339–343.
287

Sustainability 2016, 8, 140
36. Witten, I.; Frank, E.; Hall, M. Data Mining: Practical Machine Learning Tools and Techniques, 3rd ed.; MorganKaufmann: Amsterdam, The Netherlands, 2011; pp. 403–440.
37. Informatics. Available online: http://www.informatics.buu.ac.th/~ureerat/321641/Weka/Data%20Sets/supermarket/supermarket_basket_transactions_2005.arff (accessed on 21 January 2014).
© 2016 by the authors. Licensee MDPI, Basel, Switzerland. This article is an open accessarticle distributed under the terms and conditions of the Creative Commons Attribution(CC BY) license (http://creativecommons.org/licenses/by/4.0/).
288
sustainability
Article
CSR Reporting Practices of Polish Energy andMining Companies
Elzbieta Izabela Szczepankiewicz 1,* and Przemysław Mucko 2,*
1 Department of Accounting, Poznan University of Economics and Business, Al. Niepodległosci 10,61-875 Poznan, Poland
2 Faculty of Economics and Management, University of Szczecin, ul. A. Mickiewcza 64,71-101 Szczecin, Poland
* Corespondence: [email protected] (E.I.S.); [email protected] (P.M.);Tel.: +48-91-444-1944 (P.M.)
Academic Editor: Adam JabłonskiReceived: 31 December 2015; Accepted: 22 January 2016; Published: 29 January 2016
Abstract: Corporate Social Responsibility (CSR) reporting receives much attention nowadays.Communication with stakeholders is a part of assumed social responsibility, thus the quality ofinformation disclosed in CSR reports has a significant impact on fulfilment of the responsibility.The authors use content analysis of selected CSR reports to describe and assess patterns and structureof information disclosed in them. CSR reports of Polish companies have similar structures at avery high level of analysis, but a more detailed study reveals much diversity in approaches to thereport’s content. Even fairly similar companies may devote significantly different amounts of spaceto the same issue. The number of similar stakeholders varies irrespectively of the company’s size.Considerable diversity of reporting patterns results from the nature of CSR reporting, becauseit concerns highly entity-specific issues. Thus, such considerable diversity is not surprising.However, many initiatives and efforts are devoted to greater comparability of reporting, so a greaterdegree of uniformity can be expected. Similar conclusions may be drawn from integrated reports’analysis, though a small sample reflects the relative novelty of this trend.
Keywords: corporate social responsibility; sustainability reports; corporate financial statement;integrated reporting
1. Introduction
The basis of Corporate Social Responsibility (CSR) is the idea of sustainable development.Initially, CSR was interpreted in terms of economic development that respects environmentalpreservation and protection. Sustainable development is understood as overall socio-economicdevelopment integrating economic, political, social and environmental objectives. There are manydifferent approaches to interpreting sustainable development. According to Garriga and Melé [1],most of the current CSR theories are focused on one of the four main aspects:
(1) meeting economic objectives that secure long-term profits (instrumental theories)(2) using business power in a responsible way (political theories)(3) integrating social demands (social integration theories)(4) contributing to a good society by doing what is ethically correct (ethical theories)
Although these four approaches do not form a convenient framework for empirical research, animmediate question arises as to which of these forms prevails in practice: whether CSR is necessary togenerate long-term profits, or to achieve other aims, or perhaps it reflects a natural tendency for social
Sustainability 2016, 8, 126; doi:10.3390/su8020126 www.mdpi.com/journal/sustainability289
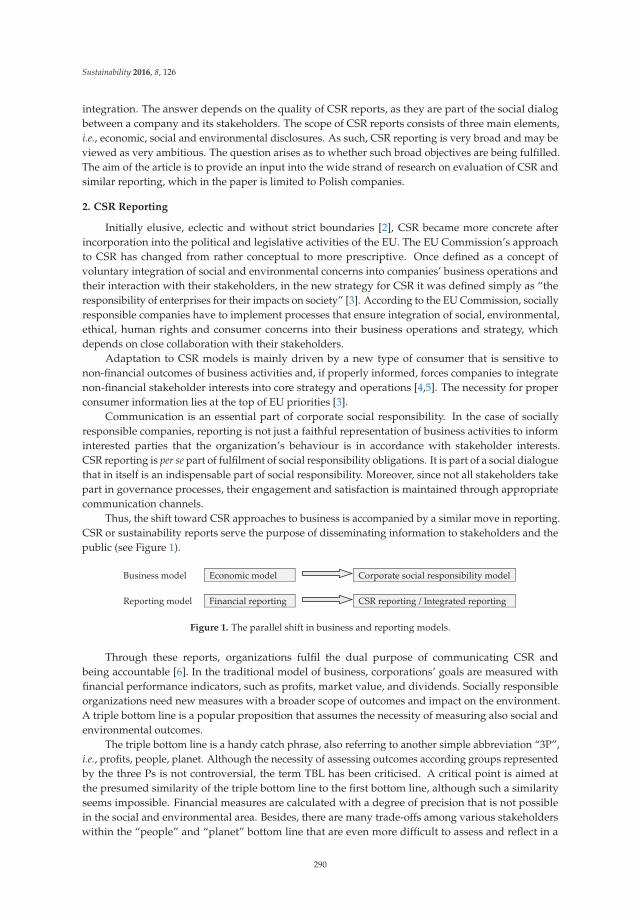
Sustainability 2016, 8, 126
integration. The answer depends on the quality of CSR reports, as they are part of the social dialogbetween a company and its stakeholders. The scope of CSR reports consists of three main elements,i.e., economic, social and environmental disclosures. As such, CSR reporting is very broad and may beviewed as very ambitious. The question arises as to whether such broad objectives are being fulfilled.The aim of the article is to provide an input into the wide strand of research on evaluation of CSR andsimilar reporting, which in the paper is limited to Polish companies.
2. CSR Reporting
Initially elusive, eclectic and without strict boundaries [2], CSR became more concrete afterincorporation into the political and legislative activities of the EU. The EU Commission’s approachto CSR has changed from rather conceptual to more prescriptive. Once defined as a concept ofvoluntary integration of social and environmental concerns into companies’ business operations andtheir interaction with their stakeholders, in the new strategy for CSR it was defined simply as “theresponsibility of enterprises for their impacts on society” [3]. According to the EU Commission, sociallyresponsible companies have to implement processes that ensure integration of social, environmental,ethical, human rights and consumer concerns into their business operations and strategy, whichdepends on close collaboration with their stakeholders.
Adaptation to CSR models is mainly driven by a new type of consumer that is sensitive tonon-financial outcomes of business activities and, if properly informed, forces companies to integratenon-financial stakeholder interests into core strategy and operations [4,5]. The necessity for properconsumer information lies at the top of EU priorities [3].
Communication is an essential part of corporate social responsibility. In the case of sociallyresponsible companies, reporting is not just a faithful representation of business activities to informinterested parties that the organization’s behaviour is in accordance with stakeholder interests.CSR reporting is per se part of fulfilment of social responsibility obligations. It is part of a social dialoguethat in itself is an indispensable part of social responsibility. Moreover, since not all stakeholders takepart in governance processes, their engagement and satisfaction is maintained through appropriatecommunication channels.
Thus, the shift toward CSR approaches to business is accompanied by a similar move in reporting.CSR or sustainability reports serve the purpose of disseminating information to stakeholders and thepublic (see Figure 1).
Business model Economic model Corporate social responsibility model
Reporting model Financial reporting CSR reporting / Integrated reporting
Figure 1. The parallel shift in business and reporting models.
Through these reports, organizations fulfil the dual purpose of communicating CSR andbeing accountable [6]. In the traditional model of business, corporations’ goals are measured withfinancial performance indicators, such as profits, market value, and dividends. Socially responsibleorganizations need new measures with a broader scope of outcomes and impact on the environment.A triple bottom line is a popular proposition that assumes the necessity of measuring also social andenvironmental outcomes.
The triple bottom line is a handy catch phrase, also referring to another simple abbreviation “3P”,i.e., profits, people, planet. Although the necessity of assessing outcomes according groups representedby the three Ps is not controversial, the term TBL has been criticised. A critical point is aimed atthe presumed similarity of the triple bottom line to the first bottom line, although such a similarityseems impossible. Financial measures are calculated with a degree of precision that is not possiblein the social and environmental area. Besides, there are many trade-offs among various stakeholderswithin the “people” and “planet” bottom line that are even more difficult to assess and reflect in a
290
Sustainability 2016, 8, 126
single indicator. Thus, the TBL is useful rather as a rhetorical phrase to form and maintain a broaderperspective in decision making processes [7,8].
Due to varied informational needs and behaviours of stakeholders, CSR communication maybe performed through many channels. However, written reports are preferred by stakeholders overother possible means [9]. The advantage of written reports comes from formal tools and mechanismsthat ensure reliability. Various regulations, guidelines, and standards help stakeholders obtain accessto reliable information. The best known initiatives aimed at improving CSR reporting or integratedreporting include [10]:
‚ IFAC Sustainability Framework 2.0 (2012)‚ ESG Framework (2011) and KPIs for ESG (2009)‚ Prince of Wales’ Accounting for Sustainability’s Connected Reporting Guidance (2009)‚ SustainAbility Global Reporters Program (2010)‚ AccountAbility’s AA1000 Standards (2008)‚ ISO 26000—Guidance on social responsibility (2010, 2012)‚ IRCSA—Framework for Integrated Reporting (2011)‚ Guidelines of Global Reporting Initiative (GRI): G 3-1 (2011) and G 4 (2012)‚ The International Framework Integrated Reporting of International Integrated Reporting Council
(IIRC) (2013)
The list gives an impression of a plethora of initiatives with a common (or at least similar)aim. However, nowadays, the most prominent and widely used framework is the Global ReportingInitiative [11,12]. GRI is an international independent, non-governmental organization that aims atassisting other organizations, both businesses and governments, in understanding and communicatingthese organizations’ impact on critical sustainability issues. The best known GRI product is theSustainability Reporting Standards, used by thousands of companies around the world.
In spite of many advantages, GRI reporting receives also some criticism. According to someresearch, companies that prepare reports in accordance with GRI do not necessarily behave in aresponsible way [13]. Boiral [14] reports that 90% of significant negative events were not disclosedin sustainability reports, which is a serious violation of the balance principle of GRI guidelines.Moreover, the concept of GRI reporting framework is not consistent with the essence of sustainabilitydevelopment, as the former is aimed at an organizational level, and the latter is relevant to theplanet [15].
Nevertheless, GRI reporting is useful for research purposes, since it improves comparability ofinformation which is otherwise difficult to compare. Since efficient communication of organizationalbehaviour is dependent upon comparability of reports, the GRI framework is used in the empiricalpart of this research.
3. Demand for Research on CSR Reporting of Polish Mining and Energy Companies
Mining and energy sectors are generally known for environmental and social issues. The caseof Polish industries seems even more complicated. Poland is the world’s 17th biggest emitter of CO2
from fuels, and the fifth in the EU [16]. The environmental issues in Poland are reinforced by thecountry’s strong reliance on coal energy [17]. About 86% of total gross power generation comes fromcoal and coal products [18]. The coal energy industry is under strong pressure resulting from EUclimate targets. The pressure has further influence on mining and energy companies and their socialand environmental impacts. Moreover, these two Polish industries are still characterized by inefficienthuman resource strategies and out-dated operating practices [19], which means that these industriesmay face additional tensions in their relations with societal stakeholders in the future.
Corporate social responsibility, and particularly CSR reporting and communication, is a methodto mitigate social and environmental problems in these industries [20,21]. Although Poland may rather
291
Sustainability 2016, 8, 126
be seen as a regular case in this regard, authors believe that there is a particular demand to study andimprove CSR reporting in mining and energy industries in this country.
4. Literature Review of Empirical Research
Corporate social responsibility and sustainability reporting draw much attention from theacademic community, which results in a broad strand of literature on theoretical aspects of theissue and empirical findings. However, for the purposes of this paper, there are several studies whichare relevant.
Roca and Searcy’s [12] study focused on the use of indicators in CSR and similar reports. On thebasis of 94 reports, they demonstrated a wide usage of various CSR indicators; they found nearly600 indicators in these reports. Generally, a great variety of indicators were disclosed, although fewwere used more commonly, i.e., in nearly half of all reports (indicators relating to funding, donations,sponsorship and community investments, greenhouse gas/CO2 equivalent emissions and the totalnumber of employees). The indicators evenly represented three bottom line elements (i.e., economic,social, and environment). The study also proved the importance of the GRI reporting framework.
Gamerschlag, Möller and Verbeeten [22] sought for determinants of social and environmentaldisclosures of the biggest German public companies (80 companies). They used a number of keywordsto assess the level of CSR reporting and found that it was correlated with the company’s visibility,shareholder structure, and relationships with US shareholders.
Boiral’s [14] study shows that contrary to the principles of GRI standards, 90% of negativeinformation was not disclosed or was reported only partially (104 of 116 negative events identified intheir study and affecting the reporting entities). Most of the 23 companies presented an exaggeratedimage of their positive achievements, virtuous commitments and external awards. Given the sensitivenature of engagement from stakeholders, such an overoptimistic and overemphasized image of acompany in CSR reports may in fact undermine the credibility of stakeholder dialogue.
There are few empirical analyses of annual reports of Polish companies focusing strictly on CSRreporting. Mucko [23] carried out a content analysis of narrative reporting of public food processingcompanies. Although this research had broader aims, it demonstrated very limited presence ofCSR issues. About 1% of information in narrative reports related to the environment, employees orcustomers, or suppliers (grammatical sentences were the unit of analysis). Szadziewska [24] analyseda wide spectrum of communication channels (websites, annual reports, environmental reports, andCSR and sustainability reports), but focused strictly on environmental disclosures. She revealedthat companies generally disclosed information about the environment, although most of them didnot measure their environmental performance. She concluded that companies would rather usethis information to create a positive image of themselves than to provide relevant, credible andcomprehensible information to its stakeholders. In more recent research on CSR relevant disclosuresof selected Polish public companies, she divided companies disclosing CSR information into threegroups, i.e., companies that: (1) disclose only regulation compliance issues, (2) provide informationalso on social problems and their solutions, and (3) publish much information relevant to CSR [25].Many articles provide a basic description that enables assessing the popularity of CSR reporting inPoland [26–29].
5. Concept of the Structure of Integrated Reports of Socially Responsible Companies in Poland
The specific nature of CSR reporting in Poland includes independently developed modelspresented in research literature. J. Samelak [30] proposed a model-based approach to the structure ofintegrated reports of socially responsible companies that makes up for the imperfections of financialreporting. The structure of the integrated report is divided into two parts: financial and non-financial.The first part includes traditional annual financial statements with the opinion of an auditor. The otherpart of the integrated report includes an activity report and a report on intangible resources and social
292
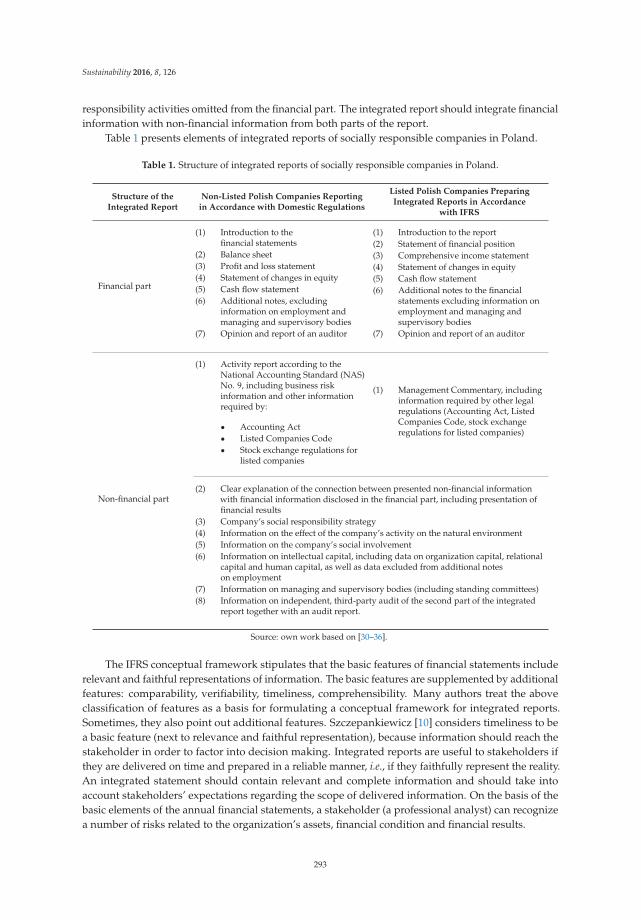
Sustainability 2016, 8, 126
responsibility activities omitted from the financial part. The integrated report should integrate financialinformation with non-financial information from both parts of the report.
Table 1 presents elements of integrated reports of socially responsible companies in Poland.
Table 1. Structure of integrated reports of socially responsible companies in Poland.
Structure of theIntegrated Report
Non-Listed Polish Companies Reportingin Accordance with Domestic Regulations
Listed Polish Companies PreparingIntegrated Reports in Accordance
with IFRS
Financial part
(1) Introduction to thefinancial statements
(2) Balance sheet(3) Profit and loss statement(4) Statement of changes in equity(5) Cash flow statement(6) Additional notes, excluding
information on employment andmanaging and supervisory bodies
(7) Opinion and report of an auditor
(1) Introduction to the report(2) Statement of financial position(3) Comprehensive income statement(4) Statement of changes in equity(5) Cash flow statement(6) Additional notes to the financial
statements excluding information onemployment and managing andsupervisory bodies
(7) Opinion and report of an auditor
Non-financial part
(1) Activity report according to theNational Accounting Standard (NAS)No. 9, including business riskinformation and other informationrequired by:
‚ Accounting Act‚ Listed Companies Code‚ Stock exchange regulations for
listed companies
(1) Management Commentary, includinginformation required by other legalregulations (Accounting Act, ListedCompanies Code, stock exchangeregulations for listed companies)
(2) Clear explanation of the connection between presented non-financial informationwith financial information disclosed in the financial part, including presentation offinancial results
(3) Company’s social responsibility strategy(4) Information on the effect of the company’s activity on the natural environment(5) Information on the company’s social involvement(6) Information on intellectual capital, including data on organization capital, relational
capital and human capital, as well as data excluded from additional noteson employment
(7) Information on managing and supervisory bodies (including standing committees)(8) Information on independent, third-party audit of the second part of the integrated
report together with an audit report.
Source: own work based on [30–36].
The IFRS conceptual framework stipulates that the basic features of financial statements includerelevant and faithful representations of information. The basic features are supplemented by additionalfeatures: comparability, verifiability, timeliness, comprehensibility. Many authors treat the aboveclassification of features as a basis for formulating a conceptual framework for integrated reports.Sometimes, they also point out additional features. Szczepankiewicz [10] considers timeliness to bea basic feature (next to relevance and faithful representation), because information should reach thestakeholder in order to factor into decision making. Integrated reports are useful to stakeholders ifthey are delivered on time and prepared in a reliable manner, i.e., if they faithfully represent the reality.An integrated statement should contain relevant and complete information and should take intoaccount stakeholders’ expectations regarding the scope of delivered information. On the basis of thebasic elements of the annual financial statements, a stakeholder (a professional analyst) can recognizea number of risks related to the organization’s assets, financial condition and financial results.
293
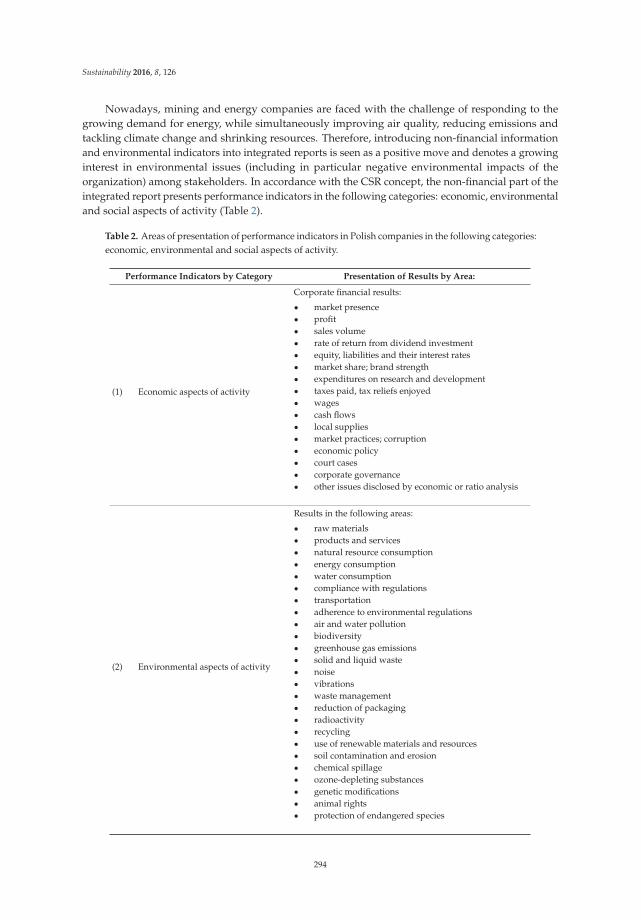
Sustainability 2016, 8, 126
Nowadays, mining and energy companies are faced with the challenge of responding to thegrowing demand for energy, while simultaneously improving air quality, reducing emissions andtackling climate change and shrinking resources. Therefore, introducing non-financial informationand environmental indicators into integrated reports is seen as a positive move and denotes a growinginterest in environmental issues (including in particular negative environmental impacts of theorganization) among stakeholders. In accordance with the CSR concept, the non-financial part of theintegrated report presents performance indicators in the following categories: economic, environmentaland social aspects of activity (Table 2).
Table 2. Areas of presentation of performance indicators in Polish companies in the following categories:economic, environmental and social aspects of activity.
Performance Indicators by Category Presentation of Results by Area:
(1) Economic aspects of activity
Corporate financial results:
‚ market presence‚ profit‚ sales volume‚ rate of return from dividend investment‚ equity, liabilities and their interest rates‚ market share; brand strength‚ expenditures on research and development‚ taxes paid, tax reliefs enjoyed‚ wages‚ cash flows‚ local supplies‚ market practices; corruption‚ economic policy‚ court cases‚ corporate governance‚ other issues disclosed by economic or ratio analysis
(2) Environmental aspects of activity
Results in the following areas:
‚ raw materials‚ products and services‚ natural resource consumption‚ energy consumption‚ water consumption‚ compliance with regulations‚ transportation‚ adherence to environmental regulations‚ air and water pollution‚ biodiversity‚ greenhouse gas emissions‚ solid and liquid waste‚ noise‚ vibrations‚ waste management‚ reduction of packaging‚ radioactivity‚ recycling‚ use of renewable materials and resources‚ soil contamination and erosion‚ chemical spillage‚ ozone-depleting substances‚ genetic modifications‚ animal rights‚ protection of endangered species
294
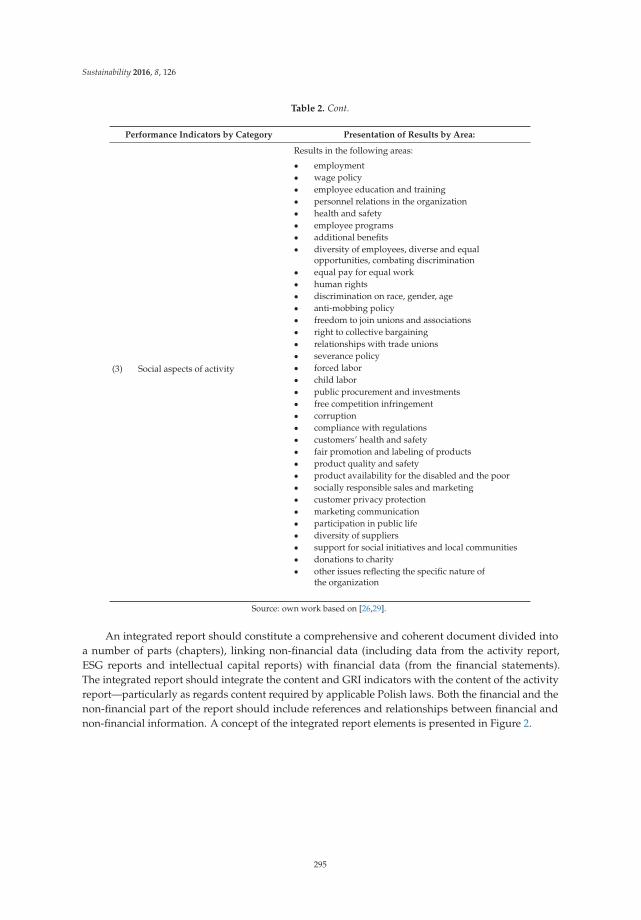
Sustainability 2016, 8, 126
Table 2. Cont.
Performance Indicators by Category Presentation of Results by Area:
(3) Social aspects of activity
Results in the following areas:
‚ employment‚ wage policy‚ employee education and training‚ personnel relations in the organization‚ health and safety‚ employee programs‚ additional benefits‚ diversity of employees, diverse and equal
opportunities, combating discrimination‚ equal pay for equal work‚ human rights‚ discrimination on race, gender, age‚ anti-mobbing policy‚ freedom to join unions and associations‚ right to collective bargaining‚ relationships with trade unions‚ severance policy‚ forced labor‚ child labor‚ public procurement and investments‚ free competition infringement‚ corruption‚ compliance with regulations‚ customers’ health and safety‚ fair promotion and labeling of products‚ product quality and safety‚ product availability for the disabled and the poor‚ socially responsible sales and marketing‚ customer privacy protection‚ marketing communication‚ participation in public life‚ diversity of suppliers‚ support for social initiatives and local communities‚ donations to charity‚ other issues reflecting the specific nature of
the organization
Source: own work based on [26,29].
An integrated report should constitute a comprehensive and coherent document divided intoa number of parts (chapters), linking non-financial data (including data from the activity report,ESG reports and intellectual capital reports) with financial data (from the financial statements).The integrated report should integrate the content and GRI indicators with the content of the activityreport—particularly as regards content required by applicable Polish laws. Both the financial and thenon-financial part of the report should include references and relationships between financial andnon-financial information. A concept of the integrated report elements is presented in Figure 2.
295
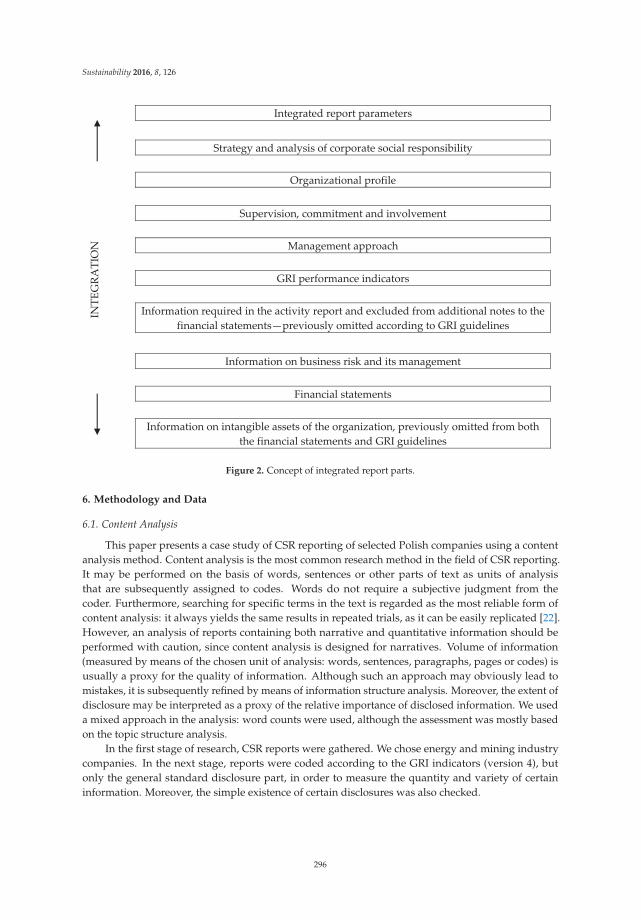
Sustainability 2016, 8, 126
Integrated report parameters
Strategy and analysis of corporate social responsibility
Organizational profile
INTE
GRA
TION
Supervision, commitment and involvement
Management approach
GRI performance indicators
Information required in the activity report and excluded from additional notes to thefinancial statements—previously omitted according to GRI guidelines
Information on business risk and its management
Financial statements
Information on intangible assets of the organization, previously omitted from boththe financial statements and GRI guidelines
Figure 2. Concept of integrated report parts.
6. Methodology and Data
6.1. Content Analysis
This paper presents a case study of CSR reporting of selected Polish companies using a contentanalysis method. Content analysis is the most common research method in the field of CSR reporting.It may be performed on the basis of words, sentences or other parts of text as units of analysisthat are subsequently assigned to codes. Words do not require a subjective judgment from thecoder. Furthermore, searching for specific terms in the text is regarded as the most reliable form ofcontent analysis: it always yields the same results in repeated trials, as it can be easily replicated [22].However, an analysis of reports containing both narrative and quantitative information should beperformed with caution, since content analysis is designed for narratives. Volume of information(measured by means of the chosen unit of analysis: words, sentences, paragraphs, pages or codes) isusually a proxy for the quality of information. Although such an approach may obviously lead tomistakes, it is subsequently refined by means of information structure analysis. Moreover, the extent ofdisclosure may be interpreted as a proxy of the relative importance of disclosed information. We useda mixed approach in the analysis: word counts were used, although the assessment was mostly basedon the topic structure analysis.
In the first stage of research, CSR reports were gathered. We chose energy and mining industrycompanies. In the next stage, reports were coded according to the GRI indicators (version 4), butonly the general standard disclosure part, in order to measure the quantity and variety of certaininformation. Moreover, the simple existence of certain disclosures was also checked.
296
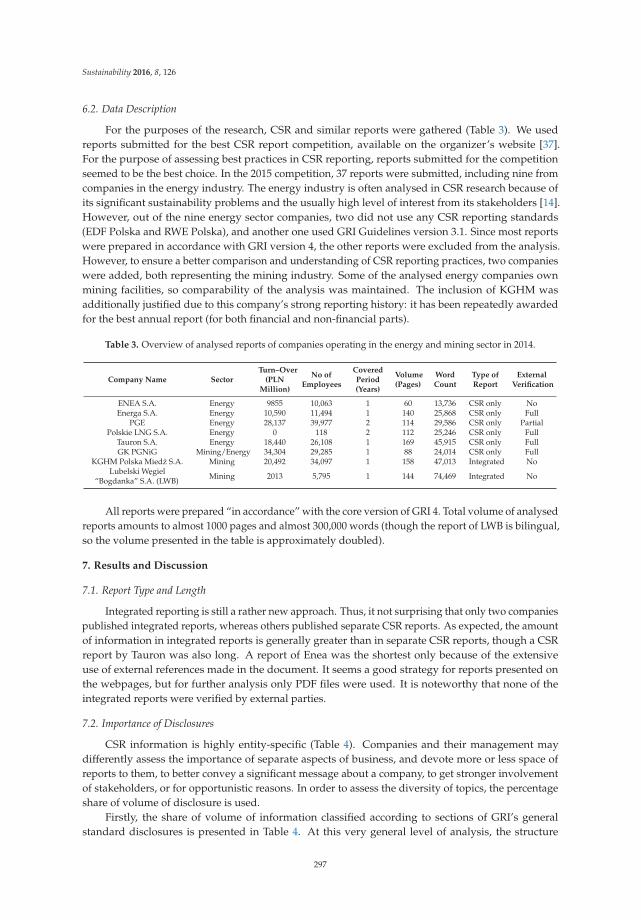
Sustainability 2016, 8, 126
6.2. Data Description
For the purposes of the research, CSR and similar reports were gathered (Table 3). We usedreports submitted for the best CSR report competition, available on the organizer’s website [37].For the purpose of assessing best practices in CSR reporting, reports submitted for the competitionseemed to be the best choice. In the 2015 competition, 37 reports were submitted, including nine fromcompanies in the energy industry. The energy industry is often analysed in CSR research because ofits significant sustainability problems and the usually high level of interest from its stakeholders [14].However, out of the nine energy sector companies, two did not use any CSR reporting standards(EDF Polska and RWE Polska), and another one used GRI Guidelines version 3.1. Since most reportswere prepared in accordance with GRI version 4, the other reports were excluded from the analysis.However, to ensure a better comparison and understanding of CSR reporting practices, two companieswere added, both representing the mining industry. Some of the analysed energy companies ownmining facilities, so comparability of the analysis was maintained. The inclusion of KGHM wasadditionally justified due to this company’s strong reporting history: it has been repeatedly awardedfor the best annual report (for both financial and non-financial parts).
Table 3. Overview of analysed reports of companies operating in the energy and mining sector in 2014.
Company Name SectorTurn–Over
(PLNMillion)
No ofEmployees
CoveredPeriod(Years)
Volume(Pages)
WordCount
Type ofReport
ExternalVerification
ENEA S.A. Energy 9855 10,063 1 60 13,736 CSR only NoEnerga S.A. Energy 10,590 11,494 1 140 25,868 CSR only Full
PGE Energy 28,137 39,977 2 114 29,586 CSR only PartialPolskie LNG S.A. Energy 0 118 2 112 25,246 CSR only Full
Tauron S.A. Energy 18,440 26,108 1 169 45,915 CSR only FullGK PGNiG Mining/Energy 34,304 29,285 1 88 24,014 CSR only Full
KGHM Polska Miedz S.A. Mining 20,492 34,097 1 158 47,013 Integrated NoLubelski Wegiel
“Bogdanka” S.A. (LWB) Mining 2013 5,795 1 144 74,469 Integrated No
All reports were prepared “in accordance” with the core version of GRI 4. Total volume of analysedreports amounts to almost 1000 pages and almost 300,000 words (though the report of LWB is bilingual,so the volume presented in the table is approximately doubled).
7. Results and Discussion
7.1. Report Type and Length
Integrated reporting is still a rather new approach. Thus, it not surprising that only two companiespublished integrated reports, whereas others published separate CSR reports. As expected, the amountof information in integrated reports is generally greater than in separate CSR reports, though a CSRreport by Tauron was also long. A report of Enea was the shortest only because of the extensiveuse of external references made in the document. It seems a good strategy for reports presented onthe webpages, but for further analysis only PDF files were used. It is noteworthy that none of theintegrated reports were verified by external parties.
7.2. Importance of Disclosures
CSR information is highly entity-specific (Table 4). Companies and their management maydifferently assess the importance of separate aspects of business, and devote more or less space ofreports to them, to better convey a significant message about a company, to get stronger involvementof stakeholders, or for opportunistic reasons. In order to assess the diversity of topics, the percentageshare of volume of disclosure is used.
Firstly, the share of volume of information classified according to sections of GRI’s generalstandard disclosures is presented in Table 4. At this very general level of analysis, the structure
297
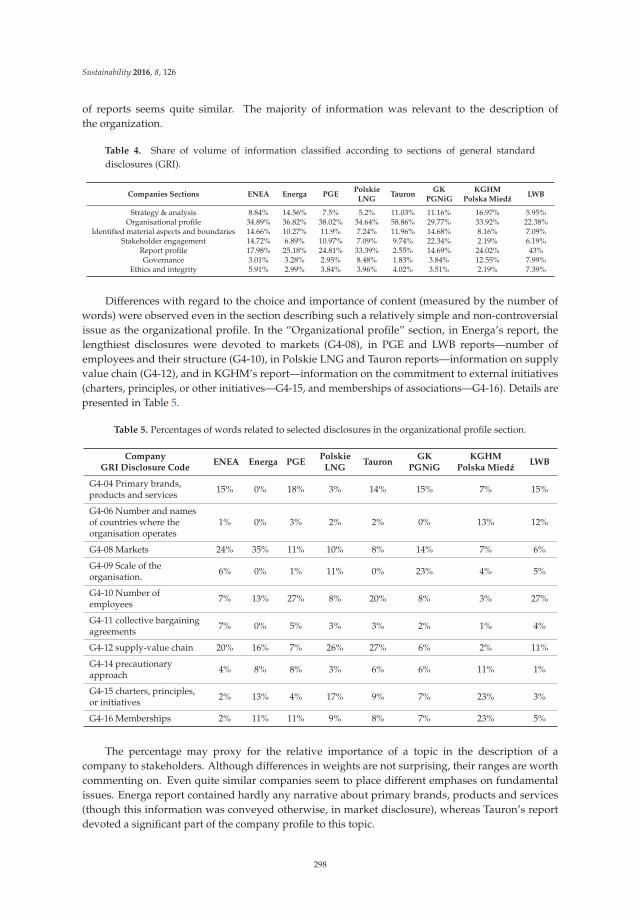
Sustainability 2016, 8, 126
of reports seems quite similar. The majority of information was relevant to the description ofthe organization.
Table 4. Share of volume of information classified according to sections of general standarddisclosures (GRI).
Companies Sections ENEA Energa PGEPolskie
LNGTauron
GKPGNiG
KGHMPolska Miedz
LWB
Strategy & analysis 8.84% 14.56% 7.5% 5.2% 11.03% 11.16% 16.97% 5.95%Organisational profile 34.89% 36.82% 38.02% 34.64% 58.86% 29.77% 33.92% 22.38%
Identified material aspects and boundaries 14.66% 10.27% 11.9% 7.24% 11.96% 14.68% 8.16% 7.09%Stakeholder engagement 14.72% 6.89% 10.97% 7.09% 9.74% 22.34% 2.19% 6.19%
Report profile 17.98% 25.18% 24.81% 33.39% 2.55% 14.69% 24.02% 43%Governance 3.01% 3.28% 2.95% 8.48% 1.83% 3.84% 12.55% 7.99%
Ethics and integrity 5.91% 2.99% 3.84% 3.96% 4.02% 3.51% 2.19% 7.39%
Differences with regard to the choice and importance of content (measured by the number ofwords) were observed even in the section describing such a relatively simple and non-controversialissue as the organizational profile. In the “Organizational profile” section, in Energa’s report, thelengthiest disclosures were devoted to markets (G4-08), in PGE and LWB reports—number ofemployees and their structure (G4-10), in Polskie LNG and Tauron reports—information on supplyvalue chain (G4-12), and in KGHM’s report—information on the commitment to external initiatives(charters, principles, or other initiatives—G4-15, and memberships of associations—G4-16). Details arepresented in Table 5.
Table 5. Percentages of words related to selected disclosures in the organizational profile section.
CompanyGRI Disclosure Code
ENEA Energa PGEPolskie
LNGTauron
GKPGNiG
KGHMPolska Miedz
LWB
G4-04 Primary brands,products and services 15% 0% 18% 3% 14% 15% 7% 15%
G4-06 Number and namesof countries where theorganisation operates
1% 0% 3% 2% 2% 0% 13% 12%
G4-08 Markets 24% 35% 11% 10% 8% 14% 7% 6%
G4-09 Scale of theorganisation. 6% 0% 1% 11% 0% 23% 4% 5%
G4-10 Number ofemployees 7% 13% 27% 8% 20% 8% 3% 27%
G4-11 collective bargainingagreements 7% 0% 5% 3% 3% 2% 1% 4%
G4-12 supply-value chain 20% 16% 7% 26% 27% 6% 2% 11%
G4-14 precautionaryapproach 4% 8% 8% 3% 6% 6% 11% 1%
G4-15 charters, principles,or initiatives 2% 13% 4% 17% 9% 7% 23% 3%
G4-16 Memberships 2% 11% 11% 9% 8% 7% 23% 5%
The percentage may proxy for the relative importance of a topic in the description of acompany to stakeholders. Although differences in weights are not surprising, their ranges are worthcommenting on. Even quite similar companies seem to place different emphases on fundamentalissues. Energa report contained hardly any narrative about primary brands, products and services(though this information was conveyed otherwise, in market disclosure), whereas Tauron’s reportdevoted a significant part of the company profile to this topic.
298
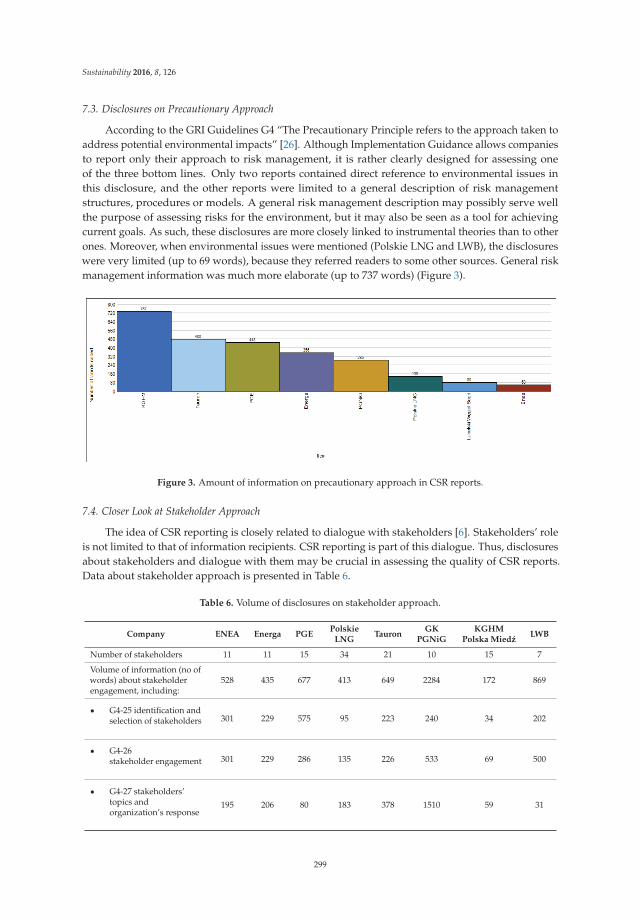
Sustainability 2016, 8, 126
7.3. Disclosures on Precautionary Approach
According to the GRI Guidelines G4 “The Precautionary Principle refers to the approach taken toaddress potential environmental impacts” [26]. Although Implementation Guidance allows companiesto report only their approach to risk management, it is rather clearly designed for assessing oneof the three bottom lines. Only two reports contained direct reference to environmental issues inthis disclosure, and the other reports were limited to a general description of risk managementstructures, procedures or models. A general risk management description may possibly serve wellthe purpose of assessing risks for the environment, but it may also be seen as a tool for achievingcurrent goals. As such, these disclosures are more closely linked to instrumental theories than to otherones. Moreover, when environmental issues were mentioned (Polskie LNG and LWB), the disclosureswere very limited (up to 69 words), because they referred readers to some other sources. General riskmanagement information was much more elaborate (up to 737 words) (Figure 3).
Figure 3. Amount of information on precautionary approach in CSR reports.
7.4. Closer Look at Stakeholder Approach
The idea of CSR reporting is closely related to dialogue with stakeholders [6]. Stakeholders’ roleis not limited to that of information recipients. CSR reporting is part of this dialogue. Thus, disclosuresabout stakeholders and dialogue with them may be crucial in assessing the quality of CSR reports.Data about stakeholder approach is presented in Table 6.
Table 6. Volume of disclosures on stakeholder approach.
Company ENEA Energa PGEPolskie
LNGTauron
GKPGNiG
KGHMPolska Miedz
LWB
Number of stakeholders 11 11 15 34 21 10 15 7
Volume of information (no ofwords) about stakeholderengagement, including:
528 435 677 413 649 2284 172 869
‚ G4-25 identification andselection of stakeholders 301 229 575 95 223 240 34 202
‚ G4-26stakeholder engagement 301 229 286 135 226 533 69 500
‚ G4-27 stakeholders’topics andorganization’s response
195 206 80 183 378 1510 59 31
299
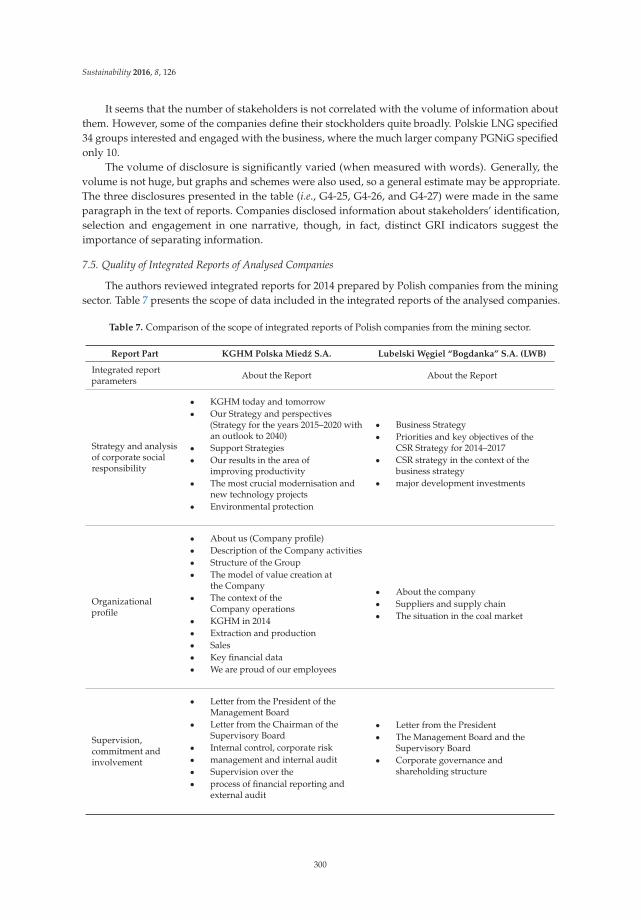
Sustainability 2016, 8, 126
It seems that the number of stakeholders is not correlated with the volume of information aboutthem. However, some of the companies define their stockholders quite broadly. Polskie LNG specified34 groups interested and engaged with the business, where the much larger company PGNiG specifiedonly 10.
The volume of disclosure is significantly varied (when measured with words). Generally, thevolume is not huge, but graphs and schemes were also used, so a general estimate may be appropriate.The three disclosures presented in the table (i.e., G4-25, G4-26, and G4-27) were made in the sameparagraph in the text of reports. Companies disclosed information about stakeholders’ identification,selection and engagement in one narrative, though, in fact, distinct GRI indicators suggest theimportance of separating information.
7.5. Quality of Integrated Reports of Analysed Companies
The authors reviewed integrated reports for 2014 prepared by Polish companies from the miningsector. Table 7 presents the scope of data included in the integrated reports of the analysed companies.
Table 7. Comparison of the scope of integrated reports of Polish companies from the mining sector.
Report Part KGHM Polska Miedz S.A. Lubelski Wegiel “Bogdanka” S.A. (LWB)
Integrated reportparameters About the Report About the Report
Strategy and analysisof corporate socialresponsibility
‚ KGHM today and tomorrow‚ Our Strategy and perspectives
(Strategy for the years 2015–2020 withan outlook to 2040)
‚ Support Strategies‚ Our results in the area of
improving productivity‚ The most crucial modernisation and
new technology projects‚ Environmental protection
‚ Business Strategy‚ Priorities and key objectives of the
CSR Strategy for 2014–2017‚ CSR strategy in the context of the
business strategy‚ major development investments
Organizationalprofile
‚ About us (Company profile)‚ Description of the Company activities‚ Structure of the Group‚ The model of value creation at
the Company‚ The context of the
Company operations‚ KGHM in 2014‚ Extraction and production‚ Sales‚ Key financial data‚ We are proud of our employees
‚ About the company‚ Suppliers and supply chain‚ The situation in the coal market
Supervision,commitment andinvolvement
‚ Letter from the President of theManagement Board
‚ Letter from the Chairman of theSupervisory Board
‚ Internal control, corporate risk‚ management and internal audit‚ Supervision over the‚ process of financial reporting and
external audit
‚ Letter from the President‚ The Management Board and the
Supervisory Board‚ Corporate governance and
shareholding structure
300
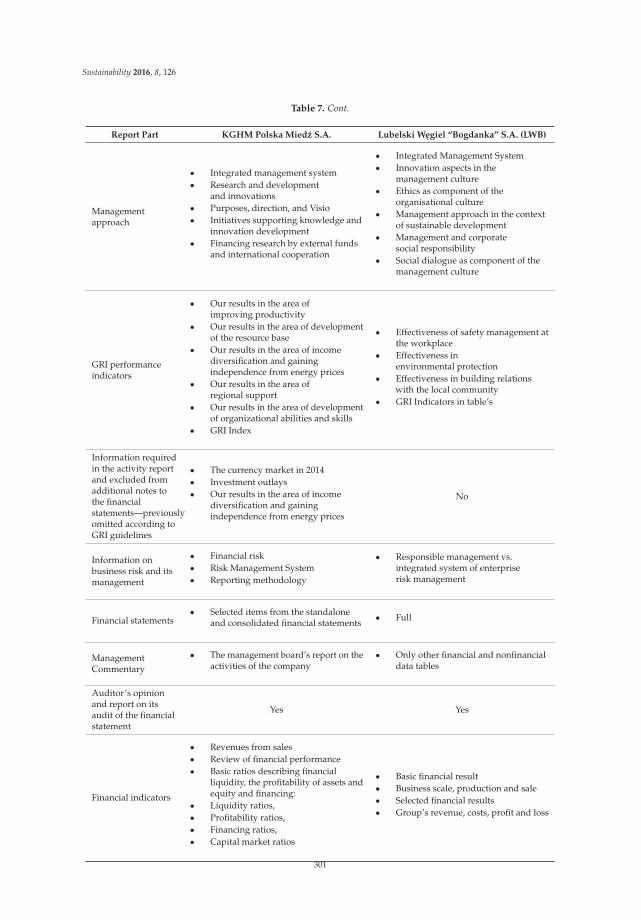
Sustainability 2016, 8, 126
Table 7. Cont.
Report Part KGHM Polska Miedz S.A. Lubelski Wegiel “Bogdanka” S.A. (LWB)
Managementapproach
‚ Integrated management system‚ Research and development
and innovations‚ Purposes, direction, and Visio‚ Initiatives supporting knowledge and
innovation development‚ Financing research by external funds
and international cooperation
‚ Integrated Management System‚ Innovation aspects in the
management culture‚ Ethics as component of the
organisational culture‚ Management approach in the context
of sustainable development‚ Management and corporate
social responsibility‚ Social dialogue as component of the
management culture
GRI performanceindicators
‚ Our results in the area ofimproving productivity
‚ Our results in the area of developmentof the resource base
‚ Our results in the area of incomediversification and gainingindependence from energy prices
‚ Our results in the area ofregional support
‚ Our results in the area of developmentof organizational abilities and skills
‚ GRI Index
‚ Effectiveness of safety management atthe workplace
‚ Effectiveness inenvironmental protection
‚ Effectiveness in building relationswith the local community
‚ GRI Indicators in table’s
Information requiredin the activity reportand excluded fromadditional notes tothe financialstatements—previouslyomitted according toGRI guidelines
‚ The currency market in 2014‚ Investment outlays‚ Our results in the area of income
diversification and gainingindependence from energy prices
No
Information onbusiness risk and itsmanagement
‚ Financial risk‚ Risk Management System‚ Reporting methodology
‚ Responsible management vs.integrated system of enterpriserisk management
Financial statements‚ Selected items from the standalone
and consolidated financial statements ‚ Full
ManagementCommentary
‚ The management board’s report on theactivities of the company
‚ Only other financial and nonfinancialdata tables
Auditor’s opinionand report on itsaudit of the financialstatement
Yes Yes
Financial indicators
‚ Revenues from sales‚ Review of financial performance‚ Basic ratios describing financial
liquidity, the profitability of assets andequity and financing:
‚ Liquidity ratios,‚ Profitability ratios,‚ Financing ratios,‚ Capital market ratios
‚ Basic financial result‚ Business scale, production and sale‚ Selected financial results‚ Group’s revenue, costs, profit and loss
301
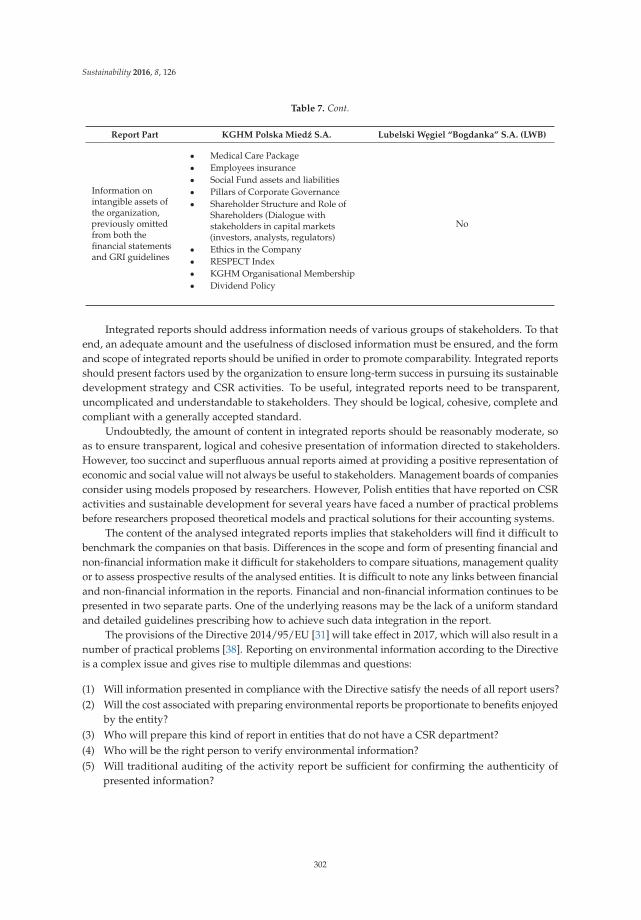
Sustainability 2016, 8, 126
Table 7. Cont.
Report Part KGHM Polska Miedz S.A. Lubelski Wegiel “Bogdanka” S.A. (LWB)
Information onintangible assets ofthe organization,previously omittedfrom both thefinancial statementsand GRI guidelines
‚ Medical Care Package‚ Employees insurance‚ Social Fund assets and liabilities‚ Pillars of Corporate Governance‚ Shareholder Structure and Role of
Shareholders (Dialogue withstakeholders in capital markets(investors, analysts, regulators)
‚ Ethics in the Company‚ RESPECT Index‚ KGHM Organisational Membership‚ Dividend Policy
No
Integrated reports should address information needs of various groups of stakeholders. To thatend, an adequate amount and the usefulness of disclosed information must be ensured, and the formand scope of integrated reports should be unified in order to promote comparability. Integrated reportsshould present factors used by the organization to ensure long-term success in pursuing its sustainabledevelopment strategy and CSR activities. To be useful, integrated reports need to be transparent,uncomplicated and understandable to stakeholders. They should be logical, cohesive, complete andcompliant with a generally accepted standard.
Undoubtedly, the amount of content in integrated reports should be reasonably moderate, soas to ensure transparent, logical and cohesive presentation of information directed to stakeholders.However, too succinct and superfluous annual reports aimed at providing a positive representation ofeconomic and social value will not always be useful to stakeholders. Management boards of companiesconsider using models proposed by researchers. However, Polish entities that have reported on CSRactivities and sustainable development for several years have faced a number of practical problemsbefore researchers proposed theoretical models and practical solutions for their accounting systems.
The content of the analysed integrated reports implies that stakeholders will find it difficult tobenchmark the companies on that basis. Differences in the scope and form of presenting financial andnon-financial information make it difficult for stakeholders to compare situations, management qualityor to assess prospective results of the analysed entities. It is difficult to note any links between financialand non-financial information in the reports. Financial and non-financial information continues to bepresented in two separate parts. One of the underlying reasons may be the lack of a uniform standardand detailed guidelines prescribing how to achieve such data integration in the report.
The provisions of the Directive 2014/95/EU [31] will take effect in 2017, which will also result in anumber of practical problems [38]. Reporting on environmental information according to the Directiveis a complex issue and gives rise to multiple dilemmas and questions:
(1) Will information presented in compliance with the Directive satisfy the needs of all report users?(2) Will the cost associated with preparing environmental reports be proportionate to benefits enjoyed
by the entity?(3) Who will prepare this kind of report in entities that do not have a CSR department?(4) Who will be the right person to verify environmental information?(5) Will traditional auditing of the activity report be sufficient for confirming the authenticity of
presented information?
302
Sustainability 2016, 8, 126
8. Conclusions
The conclusions of the research are still preliminary but, placed within the context of otheranalyses of CSR reporting of Polish companies [7,18,20–22], they provide some insight into its patternsand structures. CSR reports of Polish companies have similar structures at a very high level ofanalysis, but a more detailed study reveals much diversity in the approaches to the report’s content.Even fairly similar companies may devote significantly different amounts of space to the same issue.The number of similar stakeholders varies, irrespectively of the company’s size. Considerable diversityof reporting patterns results from the nature of CSR reporting, because it concerns highly entity-specificissues. Moreover, the publication of information related to CSR is completely voluntary. Thus, suchconsiderable diversity is not surprising. However, the guidelines and standards described in thefirst part of the paper are aimed at promoting inter alia harmonized and comparable information.The reports analysed in the research were prepared in accordance with GRI Gudelines version 4, so agreater degree of uniformity could be expected. However, research on this matter should be continuedin order to explain the limitations to achieving standardization of CSR reporting.
General conclusions regarding the analysis of Polish companies in the energy and mining sectorscan be formulated as follows:
(1) companies internally analyse their environmental impacts(2) companies use environmental-economic accounting(3) companies have implemented and operate quality management systems(4) companies have developed and implemented sustainable development concepts in management(5) companies have developed and implemented comprehensive environmental management concepts(6) companies have implemented and operate environmental management systems compliant with
GRI 3.1, GRI 4(7) companies have implemented and operate risk management systems as well as systems for
managing the impact of risk on sustainable company management
In Poland, the discussion of how to ensure adequate quality and comparability of CSR reportsand the integration of reports should be continued. It is also necessary to consider the problem ofthird-party attestation of such reports. In Poland, the financial part is reviewed by auditors, and only afew auditing companies attest non-financial matters in reports.
Acknowledgments: Acknowledgments: This paper has been written as part of the project No. 51109-XX2entitled “Business Concept of Annual Statements as a Tool for Communication with Stakeholders and for BuildingEconomic and Social Value of the Company in its Environment”. The project is carried out by the University ofEconomics in Poznan.
Author Contributions: Author Contributions: E.I. Szczepankiewicz was responsible and wrote Sections 2, 5 and7.5. P. Mucko wrote Section 3, performed literature review in Section 4, and did content analysis described inSections 6 and 7.1–7.4, (and wrote them). The rest of the paper is a result of joint cooperation.
Conflicts of Interest: Conflicts of Interest: The authors declare no conflict of interest.
References
1. Garriga, E.; Melé, D. Corporate Social Responsibility Theories: Mapping the Territory. J. Bus. Ethics 2004, 53,51–71. [CrossRef]
2. Carroll, A.B. The pyramid of corporate social responsibility: Toward the moral management of organizationalstakeholders. Bus. Horiz. 1991, 34, 39–48. [CrossRef]
3. European Commission. Communication from the Commission to the European Parliament, the Council, theEuropean Economic and Social Committee and the Committee of the Regions. A Renewed EU Strategy 2011–2014 forCorporate Social Responsibility; European Commission: Brussels, Belgium, 2011.
4. Bilan, Y. Sustainable Development of a Company: Building of New Level Relationship with the Consumersof XXI Century. Amfiteatru Econ. 2013, 15, 687–701.
303
Sustainability 2016, 8, 126
5. Vázquez, J.L.; Lanero, A.; García, M.P.; García, J. Altruism or strategy? A study of attributions of responsibilityin business and its impact on the consumer decision making process. Econ. Sociol. 2013, 6, 108–122. [CrossRef][PubMed]
6. Baviera-Puig, A.; Gómez-Navarro, T.; García-Melón, M.; García-Martínez, G. Assessing the communicationquality of CSR reports. A case study on four spanish food companies. Sustain. Switz. 2015, 7, 11010–11031.[CrossRef]
7. Shnayder, L.; Van, R.; Hekkert, M.P. Putting your money where your mouth is: Why sustainability reportingbased on the triple bottom line can be misleading. PLoS ONE 2015, 10, e0119036.
8. Norman, W.; MacDonald, C. Getting to the Bottom of “Triple Bottom Line”. Bus. Ethics Q. 2004, 14, 243–262.[CrossRef]
9. Kim, H.; Hur, W.-M.; Yeo, J. Corporate Brand Trust as a Mediator in the Relationship between ConsumerPerception of CSR, Corporate Hypocrisy, and Corporate Reputation. Sustainability 2015, 7, 3683–3694.[CrossRef]
10. Szczepankiewicz, E.-I. Definiowanie zakresu, zasiegu i jakosci zintegrowanego sprawozdania. Pr. Nauk.Uniw. Ekon. We Wrocławiu 2013, 174–186. (In Polish)
11. Brown, H.S.; de Jong, M.; Levy, D.L. Building institutions based on information disclosure: Lessons fromGRI’s sustainability reporting. J. Clean. Prod. 2009, 17, 571–580. [CrossRef]
12. Roca, L.C.; Searcy, C. An analysis of indicators disclosed in corporate sustainability reports. J. Clean. Prod.2012, 20, 103–118. [CrossRef]
13. Moneva, J.M.; Archel, P.; Correa, C. GRI and the camouflaging of corporate unsustainability. Account. Forum2006, 30, 121–137. [CrossRef]
14. Boiral, O. Sustainability reports as simulacra? A counter-account of A and A+ GRI reports. Account. Audit.Account. J. 2013, 26, 1036–1071. [CrossRef]
15. Gray, R. Is accounting for sustainability actually accounting for sustainability . . . and how would we know?An exploration of narratives of organisations and the planet. Account. Organ. Soc. 2010, 35, 47–62. [CrossRef]
16. The Organisation for Economic Co-operation and Development (OECD). CO2 Emissions from Fuel Combustion2015; IAE Statistics; OECD Publishing: Paris, France, 2015.
17. Pietrzyk-Sokulska, E.; Uberman, R.; Kulczycka, J. The impact of mining on the environment inPoland—myths and reality. Gospod. Surowcami Miner. 2015, 31, 45–64. [CrossRef]
18. European Association for Coal and Lignite (EURACOAL). Coal Industry Aross Europe; European Associationfor Coal and Lignite (EURACOAL) AISBL: Bruxelles, Belgium, 2013.
19. Bogdan, W.; Boniecki, D.; Labaye, E.; Marciniak, T.; Nowacki, M. Poland 2025: Europe’s New Growth Engine;McKinsey & Company: Boston, MA, USA, 2015.
20. Badera, J. Problems of the social non-acceptance of mining projects with particular emphasis on the EuropeanUnion—A literature review. Environ. Socio-Econ. Stud. 2014, 2, 27–34. [CrossRef]
21. Badera, J.; Kocon, P. Local community opinions regarding the socio-environmental aspects of lignite surfacemining: Experiences from central Poland. Energy Policy 2014, 66, 507–516. [CrossRef]
22. Gamerschlag, R.; Möller, K.; Verbeeten, F. Determinants of voluntary CSR disclosure: Empirical evidencefrom Germany. Rev. Manag. Sci. 2010, 5, 233–262. [CrossRef]
23. Mucko, P. Koncepcja zmian w Sprawozdawczosci Finansowej Spółek Publicznych; Wydawnictwo NaukoweUniwersytetu Szczecinskiego: Szczecin, Poland, 2008. (In Polish)
24. Szadziewska, A. Environmental reporting by large companies in Poland. Zesz. Teoretyczne Rachun. 2012, 68,97–119.
25. Szadziewska, A. Rachunkowosc jako zródło informacji na temat realizacji strategii społecznejodpowiedzialnosci biznesu. Zesz. Teoretyczne Rachun. 2014, 75, 95–123. (In Polish) [CrossRef]
26. Szczepankiewicz, E.I. Ewolucja sprawozdawczosci przedsiebiorstw—Problemy zapewnienia porównywalnoscizintegrowanych raportów z zakresu zrównowazonego rozwoju i CSR. Finanse Rynki Finans. Ubezpieczenia2014, 71, 135–148. (In Polish)
27. Krasodomska, J. Informacje niefinansowe jako element rocznego raportu spółki. Zesz. Nauk. Uniw. Ekon.W Krakowie 2010, 816, 45–57. (In Polish)
28. Szczepankiewicz, E.I. Informacje tworzace wartosc rynkowa w raportowaniu biznesowym. Kwart. Nauk OPrzedsiebiorstwie 2013, 3, 33–42. (In Polish)
304
Sustainability 2016, 8, 126
29. Ferens, A. Społeczna odpowiedzialnosc przedsiebiorstwa w zarzadczych raportach biznesowych.Finanse Rynki Finans. Ubezpieczenia 2014, 71, 31–41. (In Polish)
30. Samelak, J. Zintegrowane Sprawozdanie Przedsiebiorstwa Społecznie Odpowiedzialnego; WydawnictwoUniwersytetu Ekonomicznego: Poznan, Poland, 2013. (In Polish)
31. Szczepankiewicz, E. Ryzyka ujawniane w zintegrowanym sprawozdaniu przedsiebiorstwa społecznieodpowiedzialnego. Ekon. Organ. Przedsiebiorstwa 2013, 5, 71–82.
32. Accounting Standards Committee. National Accounting Standard (NAS) No. 9. Management Commentary;Accounting Standards Committee: Warsaw, Poland, 2014.
33. Republic of Polish. The Accounting Act. Available online: http://dokumenty.rcl.gov.pl/D2013000033001.pdf(accessed on 27 January 2016). (In Polish)
34. International Accounting Standards Board (IASB). IFRS Practice Statement: Management Commentary;International Accounting Standards Board: London, UK, 2010.
35. Szczepankiewicz, E.-I. Management Commentary jako nowe zródło informacji o działalnosci jednostkigospodarczej. Zesz. Teoretyczne Rachun. 2012, 66, 191–203. (In Polish)
36. Mucko, P. Atrybuty sprawozdania z działalnosci na tle sprawozdania finansowego. Zesz. Teoretyczne Rachun.2012, 66, 143–152. (In Polish)
37. Biblioteka Raportów. Konkurs Raporty Społeczne. Available online: http://raportyspoleczne.pl/biblioteka-raportow (accessed on 26 January 2016). (In Polish)
38. The European Parliament; The Council of the European Union. Directive 2014/95/EU of the EuropeanParlament and of the Council of 22 October 2014 amending Directive 2013/34/EU as Regards Disclosureof Non-financial and Diversity Information by Certain Large Undertakings and Groups. Availableonline: http://eur-lex.europa.eu/legal-content/EN/TXT/PDF/?uri=OJ:JOL_2014_330_R_0001&from=EN(accessed on 25 January 2016).
© 2016 by the authors. Licensee MDPI, Basel, Switzerland. This article is an open accessarticle distributed under the terms and conditions of the Creative Commons Attribution(CC BY) license (http://creativecommons.org/licenses/by/4.0/).
305
sustainability
Article
Inter-Organisational Coordination for SustainableLocal Governance: Public Safety Managementin Poland
Barbara Kozuch 1,† and Katarzyna Sienkiewicz-Małyjurek 2,*,†
1 Institute of Public Affairs, Jagiellonian University, Łojasiewicza 4 Str., Kraków 30-348, Poland;[email protected]
2 Faculty of Organisation and Management, Silesian University of Technology, Roosevelta 26 Str.,Zabrze 41-800, Poland
* Correspondence: [email protected]; Tel.: +48-32-277-7314† These authors contributed equally to this work.
Academic Editor: Adam JabłonskiReceived: 23 November 2015; Accepted: 25 January 2016; Published: 28 January 2016
Abstract: The goal of this article is to examine the basic characteristics and factors that impactinter-organisational coordination in sustainable local governance to address: 1. What are thefactors that effective inter-organisational coordination between independent units creating publicsafety system on local level in sustainable local governance depends on? 2. What are the principalfeatures of inter-organisational coordination in the public safety management system studied inthe context of sustainable local governance? The article’s goal was reached using desk researchanalysis and empirical research. The desk research covers an analysis of international scientificpublications. In turn, the empirical research was based on the example of public safety management.It covered interviews with practitioners dealing with public safety and a hermeneutic processwithin a focus group of scholars. As a result of the conducted research, interdependencies betweencoordination and other factors of inter-organisational collaboration were identified and the process ofinter-organisational coordination during the emergency situations was characterised.
Keywords: inter-organisational coordination; sustainable local governance; sustainability;inter-organisational collaboration; public safety management; emergency; business model
1. Introduction
Civilisational development created goods that facilitate life and raise its standards. At the sametime, an increase of hazards has taken place and side effects of technical advancement and spacedevelopment have come into being [1,2]. Simultaneously the hazard of industrial calamities is growing,degradation of resources and natural resources is occurring, while biological and chemical pollutionimpacts public life. Moreover, polarisation of society, poverty and privation, terrorism, crime, andviolence are expanding [3,4]. Spatial development is gaining significance in the perspective of socialdevelopment, which to a large extent is characterised by lack of organisation and harmony [5].
The consequences of unlimited civilisational growth, globalisation, urbanisation, and an economiccrisis have resulted in paying attention to durability and sustainable use of the possessed potential.Consequently, in the contemporary functioning of an organisation what gains more and moresignificance is the concept of sustainability, which consists in the realisation of rules of sustainabledevelopment and constructive confrontation of resources, goals, and strategic factors in order for theorganisation to exist and develop [6].
In our times, the basic significance in assuring safety and sustainability in the public sectoris attributed to regional and local development factors [7]. This is due to the fact that in the valid
Sustainability 2016, 8, 123; doi:10.3390/su8020123 www.mdpi.com/journal/sustainability306
Sustainability 2016, 8, 123
legislative solutions self-governments were given independence and freedom of decision making in thescope of realised tasks. Thanks to that, they have direct possibilities of creating safety and sustainabilityin the managed area. However, self-governments are able to realise the rules of safety and sustainabilityonly by collaborating with other public and private entities and with the society [8]. This interactionis characterized by inter-organisational collaboration defined as “any joint activity by two or moreagencies working together that is intended to increase public value by their working together ratherthan separately” [9] (p. 508). According to Arthur T. Himmelman, this collaboration includes exchangeof information that is favourable to all parties (networking), with altering of activities (coordinating)and sharing of resources (cooperating) [10]. A similar perspective is presented by Richard C. Feiock,In Won Lee, and Hyung Jun Park who claim that coordination is a vital instrument of managingnetworks [11]. On the other hand Ranjay Gulati, Franz Wohlgezogen, and Pavel Zhelyazkov treatcoordination as one of two indispensable facets of inter-organisational collaboration [12]. In our articlewe both agree with the allegation of the above-mentioned authors and in our analyses we assume aperspective that coordination is one of the principal elements of inter-organisational collaboration.This approach is based on the broadly known five Fayol’s functions: planning, organising, command,coordination, and control. By treating coordination as one of the functions of management we presentit in a broad scope, considering that it includes “the activities responsible to ensure the effectivenessof the collaborative work” [13] (p. 88). Consequently, in our approach coordination is a factor ofcollaboration, which refers to a decentralised approach to problem solving [14].
Despite a great deal of research in the public sector, inter-organisational collaboration is still achallenge. This results above all from decentralisation and narrowing of specialisation of each publicorganisation [15]. In public safety management problems without inter-organisational coordinationmay cause serious consequences and generate additional hazards, which was observed for exampleduring Hurricane Katrina and the World Trade Center attacks [16–19]. Moreover, contemporarydevelopment trends focused on internationalisation and at the same time regionalisation combinedwith a strong and stable local governance are also a challenge for coordination. Problems in this scopemay result from the overlapping nature of department jurisdictions [20]. There is also a research gapin the scope of the contextual variables in shaping collaborative efforts [21]. Moreover, despite theevident importance of coordinating actions during the time of threat, relatively little attention has beenpaid to it [22,23]. This means that there are theoretical and empirical gaps in the literature of the field.The necessity of theoretical justification of the sustainable approach to local governance and the lackof exhaustive analyses related to coordination generate the need to conduct research studies in thisscope. Thus the goal of this publication is to examine the basic characteristics and factors that impactinter-organisational coordination in the public safety management system as a part of a sustainablelocal governance to address: 1. What are the factors that effective inter-organisational coordinationbetween independent units creating public safety system on local level in sustainable local governancedepends on? 2. What are the principal features of inter-organisational coordination in the public safetymanagement system studied in the context of sustainable local governance?
The article’s goal was reached using desk research analysis and empirical research. The deskresearch covers an analysis of international scientific publications. In turn, the empirical research wasbased on the example of public safety management in Poland.
In our article we refer our research to organisational coordination, since we have been studyingthe actions taken in order to harmonise and synchronise the enterprises of various organisations, whichassumption is achieving of common goals and appropriate results [24]. Although we carry out ouranalyses in the public sector, we do not make any reference to the model of coordinating public policies.Our approach is close to the model of relational coordination [25,26] and decentralized intelligentadaptation [14].
The paper is organised as follows: First, we review sustainability in public safety management.Then, we discuss the general theory of coordination and explain the role of inter-organisationalcoordination in public safety management. In the part containing the research results we identified
307
Sustainability 2016, 8, 123
factors influencing and influenced by inter-organisational coordination. Next, we analyse the processand the features of inter-organisational coordination during emergency situations using the exampleof Polish circumstances. We emphasise that inter-organisational coordination is a central attribute ofsustainable public safety management. Our results contribute to better understanding of coordinationcomplexity in dynamic circumstances.
2. Methodology Research Method and Context
To achieve the purpose of the article, the desk research method and empirical investigations werecarried out.
The desk research was based on the analysis of international scientific literature and it coveredissues related to inter-organisational coordination and public safety management. Publicationsconnected with the general coordination theory, inter-organisational coordination in the public sectorand in dynamic context played a key role in this scope. We focused on foreign literature, indexedin generally acclaimed databases (Web of Science, Scopus) and works in English, in order to obtaina picture of inter-organisational coordination that would be as objective as possible. We have notcovered academic achievements in the scope of coordinating in specific conditions of the private sectorand within one organisation. We have focused on those publications dealing with inter-organisationalcoordination, which concern the problems of collaboration.
Moreover, based upon the research conducted so far [27], the relations occurring betweencoordination and other factors of effective inter-organisational collaboration were examined. Theseanalyses were carried out within a hermeneutic process within a focus group of scholarsconductedin December 2014 within a four-person group of researchers actively involved into investigatinginter-organisational collaboration. Two of them have been involved in research in this domain for over10 years, and the remaining two—for over 5 years. Discussions within two sessions were held in 2014on the grounds of practical instances and analyses of typical collaborative situations.
Empirical investigation was based on free-form interviews, which were conducted with 15 mediumand lower level employees employed at police and fire brigade units and medical emergency stationsin the area of the Silesian Province. They concerned the course of collaborative processes in publicsafety management. These interviews were conducted in September and October 2013. In the scope ofcoordination, this research covered the following issues:
(1) coordinating actions taken within collaboration with other units prior to, during, and afterthe threat
(2) enterprises in each unit within common action coordination(3) the course of the common action coordination process using a random example
In this article we presented the results and interpretation of the conducted analyses.The research was conducted in Poland, where—in an organisational aspect—the authorities
operate on two levels: government (central) and local government. The central level is responsiblefor the continuity of actions aiming at ensuring safety, it monitors and prevents hazards and theirconsequences. In turn the task of local governments is to identify hazards at the source, preventingthem and eliminating their consequences. However, the decentralization of public authority cededresponsibility in the field of public safety onto each local government level i.e., commune (Polish:gmina), district and also province. Local governments fulfil their tasks independently, while thegovernment administration has only a possibility to supervise their actions, which however, is limitedand briefly specified by regulations.
308
Sustainability 2016, 8, 123
The obligation to take action in case of the occurrence of a hazard is borne by the authority,which was first to receive information about it. This authority promptly informs about the event thathas occurred the authorities of a higher and lower level respectively, presenting at the same timetheir assessment of the situation and information on the intended actions [28]. If the event’s natureis supralocal, management of the action is taken over by the regional level. Similarly, in case of asupraregional hazard—management is taken over by the central authorities of state power.
Information on the necessity of taking action may be transferred directly from the hazard’slocation or by the 112 system, which operates in Poland on the local and provincial level. On the locallevel it is responsible for operating emergency numbers and organisation of emergency endeavoursin a given action area by means of emergency call centres. In turn, the provincial level facilitatescoordination of actions of a supralocal nature. All reports are registered in an ICT (Information andCommunication Technologies) system and their transfer to an appropriate intervention and rescue unitdepends on verification and justification of the report and disposing of the means of rescue entities [29].
An important issue in the operations of the public safety management system in Poland is theautonomy of the units participating in the actions. In a situation of hazard, these units operateautonomously, focusing on realising their statutory tasks and the scope of their cooperation resultsfrom the valid regulations. It is worth mentioning that a similar situation occurs in many places aroundthe world, including in the scope of coordinating foreign aid during calamities. In other countries thereare solutions that enable creation of inter-organisational teams [30–32]. That is why actions realised inthe examined area in Poland are mainly based on the complementary roles and competences of manyunits, properly coordinated work, and effective communication. Taking the above into account, thebasis of managing public safety is inter-organisational collaboration and the units taking part in itrealise their tasks simultaneously, complementing each other.
Our research covers the context of conducting actions in public safety management, which isdependent on the type, nature, place, and range of the hazard’s occurrence and course. Duringstabilisation, when routine action are carried out, the realisation of actions in the examined scope,including coordinating, is similar to other areas of local governance. General methods of coordinationapply here. Situation changes during extreme events. Each hazard is an individual event, which ischaracterised by peculiar specifics of development and duration. The principal challenges are thefollowing: high uncertainty, sudden and unexpected events; risk and possible mass casualty; increasedtime pressure and urgency, severe resource shortage, large-scale impact and damage, disruption ofinfrastructure support, multi-authority and massive people involvement, conflict of interest, andhigh demand for timely information [23]. Even the same type of hazard concerns a different location,which generates the need to take different actions. The differences in the duration of the hazard’soccurrence are also significant. For example, a fire in the summer time, during the occurrence ofdrought, will carry a greater risk of occurrence of additional hazards compared with the winter time.Moreover, the victims of each hazard are different, which also generates the need to adapt actions tothe needs. During extreme events the enterprises conducted in public safety management requireproper preparation, and above all coordination of actions. Moreover, the operation of rescue unitsmay seem similar, but in practice they differ by the level of organisation, they operate based on otherstandards and they are also characterised by a different organisational culture [19]. It is in line with theassumption of Arjen Boin and Paul ’t Hart [33], according to which there is no unique and best form oforganisation and in addition each emergency situation requires an individual approach that consists of(1) applying the general principles of organisational coordination; (2) lessons learned from experiencecoming from collaboration in similar situations; and (3) the specifics of a given event.
309
Sustainability 2016, 8, 123
3. Theoretical Background
3.1. Sustainable Public Safety Management
Public safety is one of the principal foundations of a rich and well functioning society [34].It constitutes an organised activity realised using personnel, financial, technical, information resourcesof many organisations, taken in order to minimise potential hazards, ensuring an undisturbed courseof social life as well as protecting people’s health, life, property, and the environment, which includeslaw observation and protection of order with focus on realizing the public interest [35]. Public safetymanagement covers a large scope of research, which extends from social policy, through local andcriminal policy, up to crisis management [36,37]. Its aim is to ensure the most favourable level of safetyusing the existing capabilities and limitations and taking into account the dynamics of the environment.The principal entities participating in public safety management include the following [38,39]:
‚ Local government‚ Response and rescue units, including: a core unit where taking actions in response to a specific type
of hazard fall into its competences; basic units which mostly respond collectively and mutuallycollaborate in public safety management; ancillary units which supplement actions taken by acore unit and basic units, and their knowledge and competences are critical in a specific situation
‚ Society: local communities and enterprises operating in a given territory‚ Media: radio, television, press, Internet‚ Non-governmental organisations‚ Research and development units
The listed groups of entities constitute mutually complementary units, which include not onlylawyers and experts on administrative sciences, but also specialists in the scope of management,sociology, economics, political sciences, technical sciences, environmentalists, etc. They form a publicsafety management system that constitutes a dynamic system of units, the aim of which is ensuringsafe and sustainable conditions of operating to all entities in a given administrative area by using thepossessed resources and within the valid formal rules and informal relations, characterised by theuniqueness and changeability of actions and constant adaptation to current conditions and arisingneeds [40].
In the stabilisation phase the local government plays the leading role in the public safetymanagement system in a given administrative area, ensuring conditions of sustainable localdevelopment. In this scope, preventing hazards achieved by education and building ofresilience is of priority importance. These functions are realised above all by education, media,non-governmental organisations, and local governments within the formation of culture andnational identity. Also the Police and State Fire Service prepare professional prevention programsaiming at excluding the occurrence of hazards. Local government fosters growth of the idea ofinter-organisational collaboration.
However, the core of the system covers actions taken by the response and rescue units [41]. Theseunits are appropriately prepared operation wise, they are trained and have appropriate skills andknowledge and they have at their disposal means and tools adequate to a given situation. Taking theabove into account, during realisation the leading role is taken over by intervention and rescue units,while the local governments supervise their actions. Moreover, the principal function in realisingintervention and rescue actions is fulfilled by: the Police, the State Fire Service, and medical rescuers.Most often these units participate in the actions in the first place. Depending on the type of hazardand the situation, other entities are engaged as well. The principal actions may be assisted by amongother the Municipal Guard, Boarder Guard, Railway Guards, Road Transport Inspection, the army,or non-governmental organisations. In turn, the Environmental Protection Inspectorate, SanitaryInspection, Construction Supervision Inspectorate, or social assistance workers may act as advisers
310
Sustainability 2016, 8, 123
and assist in decision making with their specialist knowledge. The type and degree of engagement ofeach unit depends on the level of complexity of a given situation [40].
In that context sustainability is the organisation’s ability to continuously learn, adapt, and develop,and also revitalize, reconstruct, and reorientate in order to offer high value to recipients in a longperiod of time [42]. In the public sector it constitutes a tool which enables partner participation inmaking use of public goods taking into account limitations of resources.
From the analysed perspective sustainable local governance is defined as a process run bylocal governmental bodies aimed to socially and economically boost a specific region or locality,while respecting environmental protection and land development, being committed to sustainablemanagement of the resources pool and tapping into cutting-edge public management tools, i.e.,coordination of inter-organisational collaboration [8] (p. 325). Its basis is a diagnosis of socialneeds, possessed resources, and condition of the environment, in which public services are offered.Based upon it, local development programs are created that serve sustaining of social life processes.Improvement of public institution actions, owing to collaboration, increases entrepreneurship andeffectiveness of sustainable activities of local governments. As a result of this, the competitiveness of agiven area grows, while the requiredenvironment quality standards are maintained.
Consequently, sustainability in public safety refers to efficient realisation of enterprises by takingactions that are appropriate to an existing need, without harm to society, economically justified andwith the highest degree of care for the natural environment. Sustainable public safety managementaims at well-balanced management of resources including local and natural ones as well as thosepossessed by each unit of the system being analysed. It constitutes a process realised by local responseand rescue units within inter-organisational collaboration using modern public management tools,which aims at minimising potential hazards and ensuring most favourable level of public safetysimultaneously respecting and ensuring of principal and integrated order. Taking into account the factthat it covers all orders of integrated development, it constitutes an interesting research area that isadequate to the issues being raised.
The characteristic features of public safety management make it an area of public governance,in which the need for coordination is especially visible. For that matter, it constitutes an interestingresearch area that is adequate to the issues being raised.
3.2. Coordination as a Factor of Inter-Organisational Collaboration
In local governance collaboration, which is one of the most important tasks of self-governmentalsub-sector organisation, combining activities in favour of local development, is of key significancein this scope [43,44]. Local government units constitute collaborating institutions, which requireappropriate coordination within co-governance. Based on the surveys and theoretical considerations,the literature state that collaboration between public sector organisations is one of several tools oflocal development management since it contributes to the growth of public services [45,46]. It ischaracterised by interdependence with simultaneous autonomy of functioning as well as settlementof collaboration rules by means of negotiation and based on organizational and legal factors. As itis emphasized by R. Lozano, collaboration constitutes a key element in running of the strategy ofsustainability [47].
Inter-organisational collaboration includes sustainable relations, which join each organisation inrealising their common goals. It is defined as a union of two or more organisations that is favourableto all parties and well-defined, which serves achieving of common goals [48] (p. 4). Among thecauses of establishing inter-organisational collaboration one may distinguish the following: highlevels of interdependence, need for resources and risk sharing, resource scarcity, previous historyof efforts to collaborate, situation in which each partner has resources that other partners need, andcomplex issues [49]. Identified on the base of empirical evidence, the principal benefits in the scopeof inter-organisational collaboration include among other [50–53]: consolidation of the resources ofcollaborating organisations, knowledge sharing, organisational learning, making use of the experience
311
Sustainability 2016, 8, 123
of other organisations, transfer of best practices, and creating innovative solutions. This is not anew concept, however it has enjoyed great interest only for about two decades [54]. Recently, moreimportance is given to the relational aspects.
The growing significance of inter-organisational collaboration in the activity of enterprisesand public institutions results to a large extent from the dynamics of changes in the organisations’environment, seeking competitive advantage and the fact that at present it is not possible to act alone.Although the practice of collaboration between organisations is broadly applied, the presumptionsof its implementation are generally known and it does not constitute a new phenomenon, it is a verydifficult process [55]. The results of empirical and theoretical studies, presented in the literature,indicate that this is mainly due to its complexity, different approaches to realisation of mutual actions,potential disturbance in the course of collaboration processes, etc. [56,57]. Moreover, legal requirementsor collaboration agreements do not constitute conditions sufficient enough to ensure sustainableinter-organisational collaboration. This is because its course is impacted by multiple factors withfeatures that refer to both external and internal conditions, relational factors, and instruments ofinter-organisational collaboration. They have a prerequisite nature. The most important one iscoordination [27].
Coordination is defined as “ . . . the act of managing interdependencies between activitiesperformed to achieve a goal” [58] (p. 6). It is a relational process based on task interdependencies [59].It originates from the need for simultaneous execution of activities falling under the powers of variousorganisations, and results from the specifics of their operations. From the traditional perspective,it refers to hierarchical control, whereas the organisational perspective pertains to centralised, dispersedcoordination or a combination of two types at the organisational level [60]. Coordination is a continualprocess and a component of the organisation. It depends on the specifics of the entities involved, thecircumstances as well as dynamics of change in the external environment in which the entities operate.It is assumed that good coordination is nearly invisible, only being noticed most clearly when it islacking [61].
In the subject literature there are two levels of coordination: intra- and inter-organisational [62].The former is related to coordination within an organisation, whereas the latter to coordinationbetween organisations. In the subject literature one may also find many types of coordinationbetween collaborating units, for example interim coordination, cross-agency coordination, relationalcoordination, network coordination, or network governance [63–66]. In all of the above-mentionedcases, the aim is to ensure sustainable inter-organisational collaboration by enhancing relations andtask integration. This process is based on shared goals, shared knowledge, and mutual respect [26].For the needs of this article, the term inter-organisational coordination was assumed.
Inter-organisational coordination is related to harmonising the actions of each unit in order tocommon and systematic rendering of specific services [63] (p. 118). It is defined as “the deliberate andorderly alignment or adjustment of partners’ actions to achieve jointly determined goals” [12] (p. 12).It is based on such mechanisms as: partner-specific communication, rules and procedures, routines,liaison, and integration roles, interim authorities, etc. [59] (pp. 909–910). However, in order to realisecommon actions, it uses above all informal interactions and pays less attention to the valid proceduresand organisational structures. These mechanisms, in particular, enable sustainable local governancethrough building durable relations between collaborating organisations. Key characteristics anddifferences of collaboration and coordination were presented in Table 1.
As it results from table 1 collaboration is a broader term than coordination. The subject literatureemphasises that the priority significance of coordination in inter-organisational collaboration resultsfrom its role in the continuous synchronization of tasks and the contribution of collaboratingorganisations. It is because it constitutes a relational process, which covers managing correlationbetween tasks and between the entities that perform these tasks [63]. It manifests itself throughsystematic and reliable communication, which strengthens social relations in order for better integrationof mutual enterprises. It emphasises the significance of the organisational structure, communication,
312
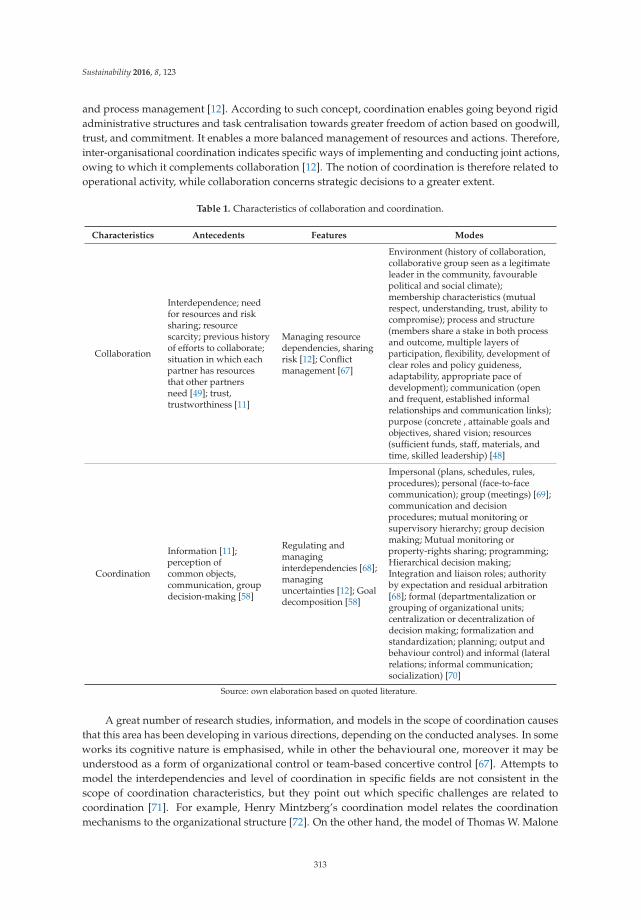
Sustainability 2016, 8, 123
and process management [12]. According to such concept, coordination enables going beyond rigidadministrative structures and task centralisation towards greater freedom of action based on goodwill,trust, and commitment. It enables a more balanced management of resources and actions. Therefore,inter-organisational coordination indicates specific ways of implementing and conducting joint actions,owing to which it complements collaboration [12]. The notion of coordination is therefore related tooperational activity, while collaboration concerns strategic decisions to a greater extent.
Table 1. Characteristics of collaboration and coordination.
Characteristics Antecedents Features Modes
Collaboration
Interdependence; needfor resources and risksharing; resourcescarcity; previous historyof efforts to collaborate;situation in which eachpartner has resourcesthat other partnersneed [49]; trust,trustworthiness [11]
Managing resourcedependencies, sharingrisk [12]; Conflictmanagement [67]
Environment (history of collaboration,collaborative group seen as a legitimateleader in the community, favourablepolitical and social climate);membership characteristics (mutualrespect, understanding, trust, ability tocompromise); process and structure(members share a stake in both processand outcome, multiple layers ofparticipation, flexibility, development ofclear roles and policy guideness,adaptability, appropriate pace ofdevelopment); communication (openand frequent, established informalrelationships and communication links);purpose (concrete , attainable goals andobjectives, shared vision; resources(sufficient funds, staff, materials, andtime, skilled leadership) [48]
Coordination
Information [11];perception ofcommon objects,communication, groupdecision-making [58]
Regulating andmanaginginterdependencies [68];managinguncertainties [12]; Goaldecomposition [58]
Impersonal (plans, schedules, rules,procedures); personal (face-to-facecommunication); group (meetings) [69];communication and decisionprocedures; mutual monitoring orsupervisory hierarchy; group decisionmaking; Mutual monitoring orproperty-rights sharing; programming;Hierarchical decision making;Integration and liaison roles; authorityby expectation and residual arbitration[68]; formal (departmentalization orgrouping of organizational units;centralization or decentralization ofdecision making; formalization andstandardization; planning; output andbehaviour control) and informal (lateralrelations; informal communication;socialization) [70]
Source: own elaboration based on quoted literature.
A great number of research studies, information, and models in the scope of coordination causesthat this area has been developing in various directions, depending on the conducted analyses. In someworks its cognitive nature is emphasised, while in other the behavioural one, moreover it may beunderstood as a form of organizational control or team-based concertive control [67]. Attempts tomodel the interdependencies and level of coordination in specific fields are not consistent in thescope of coordination characteristics, but they point out which specific challenges are related tocoordination [71]. For example, Henry Mintzberg’s coordination model relates the coordinationmechanisms to the organizational structure [72]. On the other hand, the model of Thomas W. Malone
313
Sustainability 2016, 8, 123
and Kevin Crowston is based on a concept of coordination as management of dependency betweenactions [61]. Moreover, on the one hand it is assumed that the problems of coordination may besolved by implementing appropriate mechanisms, of a general nature, which means that they maybe applied in various organisational systems. On the other hand, there are opinions stating that oneshould identify in detail the nature of the environment in which an organisation operates in caseof specific events and next develop appropriate procedures in relation to them [14]. We agree withthe second approach and also the assumption that the higher the degrees of interdependency andthe levels of tasks and environment uncertainty are, the more developed forms of coordination arerequired [12].These dependencies are especially visible in public safety management.
3.3. Basics of Inter-Organisational Coordination in Public Safety Management
According to Thomas E. Drabek [73], coordination is at the core of the practice of actions for safety.It is the philosopher’s stone of public administration, and a central factor in poor performance duringan response activities [74,75]. In actions for safety, coordination proceeds at diverse organisationallevels [76]. It occurs in an intra-organisational dimension as coordination within specific organisationsas well as an inter-organisation aspect as a regulator of external relations in an organisation. In thiscontext, it is possible to talk about capabilities for effective resources administration in the formof inter-organisational teams, partnerships, alliances, etc. [77]. This capability is determined bythe ability of specific organisations to adapt to dynamic conditions under which they operate, andto effective communication aimed at hammering out common agreements and a common stanceregarding manners for conducting operations. At the core are both legal regulations as well as formaland informal relations emerging within collaborated organisations. Vertical coordination puts intoplace rigid principles as to the division of responsibility, the execution of activities and the control ofoutcomes. However, a new approach incorporating organisational connections gives priority to themutual adaptation of entities and the integration of resources, authority and knowledge over formalmechanisms of authority [75,78].
Effective coordination is a necessary element of conducting action in public safety management.It is difficult to conduct in this area because it is connected with uncertainty, unexpected events,risk of hazards’ accumulation, urgency, and infrastructure interdependency [23]. Apart from that,the situational complexity creates conditions, in which participation of various agencies is requiredand collaboration between them is necessary for realisation of actions. What is more, the higher thenumber of various organisations trying to achieve a common goal, the less probable that they willact in a coordinated way in order to achieve this goal [79]. In this connection, inter-organisationalcoordination in public safety management is a big challenge. The differences between the generaltheory of coordination and coordination between organisations in public safety management werepresented in Table 2.
The principal difference between inter-organisational coordination in general and in public safetymanagement lies in the nature of joint action. This influences all characteristics of coordination.It also causes that failures have more serious consequences and the intrinsic and extrinsic motivation,concerns, and results depend on the creativity and skills in making decisions in changeable anduncertain conditions, with limited pieces of information.
In the deliberations concerning inter-organisational coordination, we assume that its significanceresults from counterbalancing in the scope of actions and the level of participation of many independentorganisations, taking into account social needs, natural environmental and spatial values as well aseconomic conditions. It facilitates achieving of the assumed goal avoiding excessive costs and damage.Consequently, inter-organisational coordination enables realisation of actions in changing, unsure, anddynamic conditions in accord with the philosophy of sustainability.
314
Sustainability 2016, 8, 123
Table 2. General and specific approach to coordination.
SpecificationGeneral Theory of
CoordinationCoordination in Public
Safety Management
Substance ofinter-organisationalagreement
Ways of shaping interactions Ways of shaping interactions betweenautonomous organizations
MotivationMore effectively managingtask interdependencies anduncertainties
More effectively managing taskinterdependencies in order to identify andremove the sources and consequences of hazards
Concern/risksOperational risk: inability tocoordinate acrossorganizational boundaries
Operational and situational risks: inability tocoordinate joint actions of autonomousorganisations in dynamic anduncertain circumstances
Typical positive resultsEfficiency, effectiveness,flexibility/adaptiveness ofjoint action
Effectiveness, flexibility, adaptiveness of jointaction in unique and rapidly changing situations
Typical failures Omission, incompatibilities,misallocation
Inadvertent omissions leading to chaos,incompatibilities in rescue procedures,inadequate response, insufficient prevention ofaccumulation of hazards, increasing number ofvictims, additional damages
Remedies against failures
Hierarchies, authority, andformalisation; institutions andconventions; inter-personallinkages and liaisons
Changing hierarchical positions, integratedauthority structures, improvement of rescueprocedures, shared organising of training andsimulations of events during the stabilisationphase, progressive adapting of regulations,advancing communication systems, creatinggood formal and informal relationships based ontrust and organisational concern
Source: own elaboration based on [12] (p. 66).
4. Research Results
4.1. Relations between Coordination and other Instruments of Inter-Organisational Collaboration
Our previous research indicated that coordination is one of the key factors of inter-organisationalcollaboration [27]. These factors have a mutual impact on each other, which in effect influences boththeir role and the efficiency of collaboration itself. Taking this into consideration, we have decided topresent our own reasoning based on chosen publications, which include the relations that characterisecoordination and other factors of efficient inter-organisational collaboration. In our investigation a3-level grade scale was applied to evaluate the impact of each factor, i.e.: 1—weak influence, 2—mediuminfluence, and 3—strong influence. Whereas the relations between the factors were analysed inreference to the following grade scale: 0—lack of impact or minor impact, 1—significant impact, and2—key impact.
Inter-organisational coordination was evaluated as a factor which has strong influence onthe course of actions. This mainly results from specific and complementary competences of eachorganisation, task distribution, and responsibilities. These factors create the foundations of efficientrealisation of actions. Taking this into account, inter-organisational coordination is of key importanceto the course of collaboration.
Studying the relations occurring between inter-organisational coordination and other factors ofefficient inter-organisational collaboration, our focus was directed to those factors that have a significantand key impact on the processes of action coordination between organisations. The relations, whichwere identified, are illustrated in Figure 1. It depicts those factors, which:
315
Sustainability 2016, 8, 123
‚ only impact the course of inter-organizational coordination‚ both impact and are a result of inter-organizational coordination‚ are only a result of inter-organizational coordination
In figure 1 factors having a significant impact were indicated by a thinner arrow, while the keyfactors were indicated by a thicker one.
As it results from the verified connections, the key factors of inter-organizational collaboration,which influence inter-organisational coordination processes are:
‚ communication in inter-organisational working teams,‚ constraints in inter-organisational collaboration,‚ leadership with organisational and communication skills,‚ organisation of collaborative work (e.g., time pressured, competitive, rapidly changing, stability),‚ management of inter-organisational collaboration (e.g., styles, transparency of decisions
and guidance),‚ inter-organisational trust,‚ professional communication between personnel from individual organisations.
These factors show that inter-organisational coordination depends mainly on organisational andrelational conditions, which exist between collaborating units. Whereas, the key factors influenced byinter-organisational coordination include:
‚ organisation of collaborative work,‚ support within collaborating organisations,‚ adaptability to changing work requirements,‚ flexibility and openness to changing circumstances of collaboration,‚ performance of inter-organisational collaboration,‚ self interest of individual organisations from collaboration.
These factors impact, above all, situation conditions in sustainable public safety managementand the will to collaborate. The other analysed factors are also of significance, but they are not thatimportant in inter-organisational coordination. Each of the said factors impacts the level of coordinationsustainability. However, the significance of each one individually depends on the existence of otherfactors, which may mutually strengthen or weaken its influence. Moreover, the nature of relationstaking place between inter-organisational coordination and other factors influencing and influencedby this process, is complex. This mainly results from the existing interdependency between all factorsof effective collaboration and their mutual stimulating.
316
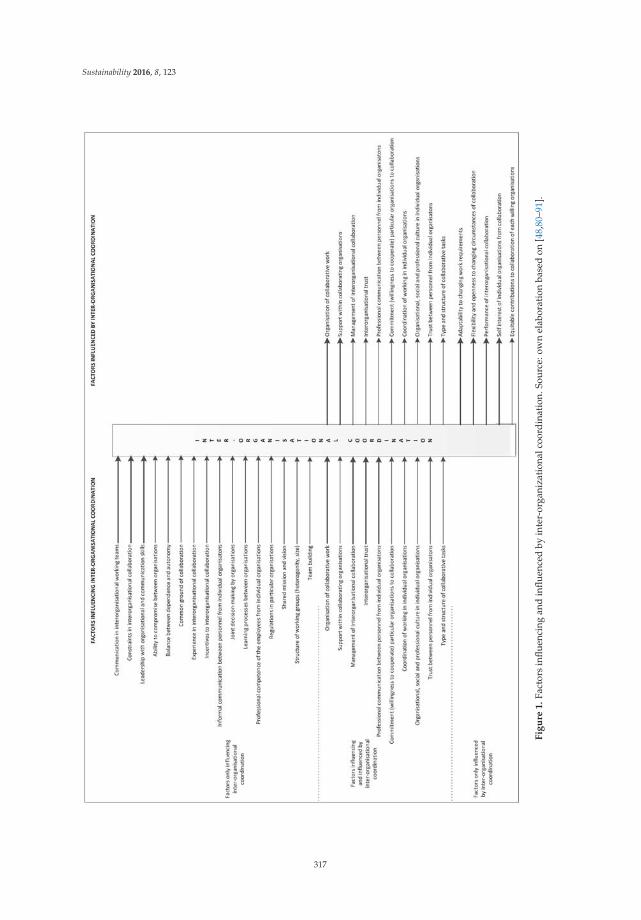
Sustainability 2016, 8, 123
Fig
ure
1.
Fact
ors
influ
enci
ngan
din
fluen
ced
byin
ter-
orga
niza
tion
alco
ordi
nati
on.S
ourc
e:ow
nel
abor
atio
nba
sed
on[4
8,80
–91]
.
317
Sustainability 2016, 8, 123
4.2. Inter-Organisational Coordination during Emergency Situations
The process of managing public safety in terms of phases may be presented in the following cycle:actions taken prior to the hazard occurrence, during the hazard, after the hazard has been obviated [29].Inter-organisational coordination takes place in all of the said phases, however its significance can beseen to the biggest degree in the phases in time and once the hazard has been obviated. Prior to theoccurrence of the hazard, coordination is necessary in such action as preparing mutual enterprises,common training, and team building. However, these actions are conducted in stable conditions, inwhich considered modifications and changes are possible. The effect of turbulence and uncertaintyof conditions in emergency situations is that inter-organisational coordination plays a key role in thephases prior to the occurrence and during the hazard.
The inter-organisational coordination of operations in emergency situations is executed by asingle commander-in-chief. Our own empirical research showed that in Poland, responsibility for thatis devolved on the Rescue Action Supervisor who is, in most cases, a fireman. Only in the event of aterrorist attack or demonstration command is taken over by a policeman with sufficient powers. Suchinter-organisational coordination involves collecting, analysing, and verifying information, as well asassigning a sequence of operations performed and entities engaged. A classic example illustrating thecoordination of operations in emergency management, is the flooding that took place in May and Juneof 2010 which engulfed the Czech Republic, Slovakia, Poland, Hungary, Ukraine, Austria, Germany,and Serbia. It was one of the largest floods in Poland in that during the period from 14 May to 30 June2010, around 76,800 interventions related to relief and recovery actions were reported [92]. At thattime, there was an increased demand for pumps with higher capacity than those the services alreadypossessed. Efforts at the national level were launched, and firemen from other EU states took part inthe operations. Persons charged with rescue actions in this event accomplished the following tasksbased on communication processes:
(1) prepare scenarios for potential situations, analyses, weather forecasts, collect information,anticipate demand;
(2) calculate forces and resources, assess potential, analyse situations, prepare proposals fordisposing forces depending on the demand, examine potential for requesting external forces;
(3) contribute to the formulation of solutions intended to accomplish operations, raise forces,dislocate forces, put forces into operation, continue monitoring the situation and its reporting;
(4) monitor the efficacy of the formulated solutions, participate in the work of military staffand teams, monitor the situation’s progress, collaborate with commanders with regard tospecific actions;
(5) control efficacy of operations conducted by operational groups, verify information handed over,e.g., by phone, with the actual situation.
Another example of operations coordination and emergency management in Poland was thehead-on collision of two high-speed passenger trains on 3 March 2012 near the town of Szczekociny.As a result, 16 people were killed and 57 passengers were injured. In the first train, an electriclocomotive was destroyed and the first two carriages were derailed, while in the other train thelocomotive and one carriage were derailed. Services from the national emergency management leveland fire brigades from four provinces were used in the rescue action, including 450 rescuers and400 policemen. The coordination process covered such operations as evacuation of the people affected,rendering first aid, searching destroyed carriages and the surrounding crash site, enabling access totrapped passengers, designating a temporary landing strip for helicopters of the Air Rescue Service,and securing the incident site. Coordination of basic operations did not pose a problem. However,contentious issues were exposed, and they referred to extra activities and details, e.g., places for tents.These examples confirm that both formal as well as posteriori relationships provide a basis for thecoordination of operations during emergency situations. Moreover, they allow us to ascertain that
318
Sustainability 2016, 8, 123
organisational factors and organisational behaviours constitute the key determinants for improvingcommunication and coordination in sustainable public safety management.
The quantity of information is essential for coordination and execution of effective operations indynamically changing circumstances requires application of cutting-edge organisational and technicalsolutions. In addition, ”some of the major challenges (...) include information mismanagement,resource allocation issues, and ineffective communication” [93] (p. 260). These challenges canlead to communication and consequently coordination breakdowns. To ensure efficacy of rescueactions and to streamline communication as well as coordination processes, there are emergencycoordination centres established and they make up complex organisational and technical structuresin line with administrative division at the local, regional, and national levels. Such centres alsooperate at the international level, e.g., Emergency Response Coordination Centre functions in theEU. It is a one-stop-shop providing an overview of the available civil protection assets and acts as acommunication hub between the participating states, the affected country and dispatched field experts.The main purpose of its existence is to facilitate collaboration in civil protection interventions in theevent of major emergencies, e.g., through pool resources that can be made available to help disaster-hitcountries and share best practices in disaster management [94].
Emergency coordination centres are a support centre for those in charge of rescue actions. Theyhandle information transfer as well as vertical and horizontal communication outside the incident site.They also oversee the course of action and if needed they bring and send extra resources to action.Thus, emergency coordination centres run the so-called “external coordination”. The centres operatein line with a mutual substitution principle. It means that a report which cannot be received for anyreason in a centre relevant for the caller’s domicile will be automatically redirected to another Centre.For receiving the reports operators are employed, there may be also officers delegated, assigned fromthe police or fire brigade, employees in emergency management departments as well as municipalpolicemen. In Poland the tasks conferred on the centres include [95]:
(1) handle alarm reports, excluding fire signalisation systems,(2) register and store data regarding alarm reports, including phone recordings with the complete
alarm report, personal data of the reporting person and other persons indicated when receivingthe report, information on the incident site and its type and shortened description of the eventfor the period of 3 years;
(3) conduct analyses related to functioning of the system in the area handled by the centre andproducing statistics with regard to numbers, types, and response time for alarm reports;
(4) collaborate and exchange information with emergency coordination centres;(5) exchange information and data, excluding personal data, for the purposes of analyses with the
Police, National Fire Service, administrators of medical rescue teams, and entities which phonenumbers are handled within the system.
In other countries, tasks accomplished by centres are essentially similar. For instance, in Sri Lankathey are as follows [96]:
(1) Maintaining and operating early warning towers and other early warning dissemination equipments(2) Dissemination of early warning messages and ensuring reception at remote vulnerable villagers(3) Coordination of donor assistance to strengthen capacity of technical agencies for early warning(4) Initiating awareness on activities related to early warning among various agencies and the public(5) Guiding district disaster management units in coordinating and implementing warning
dissemination-related activities in the province, district, and local authority levels.
Emergency coordination centres collaborate with services statutorily appointed for securityprotection as well as social rescue organisations. Their operations enable to reduce the waiting timefor assistance as well as time for rescue actions themselves, properly match forces and resources tothe operations, bolster information transfer as well as create a consistent database for events [97].
319
Sustainability 2016, 8, 123
Receipt of alarm reports in the centre by alarm number operators and dispatchers is carried out bymeans of information and communication technology systems. These systems ensure automatisationof receipt and registration of reports. They allow for identification of the phone number, location, andvisualisation of the place from which the emergency call comes. Besides, it also enables overseeing theactual state of calls handled, elimination of hoax calls, and their selection [98–100].
An interesting example of the emergency coordination centre is the Integrated Security Centreoperating in Ostrava in the Czech Republic since 2011. Its initial concept originated in the 1990swhen the urgency for collaboration among rescue services was identified. It is currently a part of theCzech Integrated Rescue System which covers a connections system as well as principles guidingcollaboration and emergency coordination of local and central authorities, as well as individuals andauthorised persons when the necessity arises to undertake rescue or humanitarian actions and toprepare and conduct emergency operations. The Integrated Security Centre houses such units as: firebrigade, police, medical emergency, and municipal authorities. They form the mainstay of the system.An auxiliary role is played by: municipal police, military forces, ministry of health, ministry of interior,remaining rescue units, security companies, and non-governmental organisations. The unit responsiblefor response activities is the fire brigade across all levels of the state organisation depending on thescale of the event. However, the conditions for conducting the operations are determined by thepublic administration. The functioning of the Centre has helped to eliminate problems related tocommunication and operations coordination and to boost inter-organisational collaboration whichthrough direct contacts and joint resolution of problems enables to continually improve collaborationprinciples within the system.
The analysis of the course of inter-organisational coordination during emergency situationsenables stating that coordination constitutes a liaison which bonds actions taken in the scope ofpublic safety management. Its significance results from the span of tasks that are realised, in whichperformance many entities are engaged, in each case in a different quantity and configuration. Theconducted actions are based on collaboration between each of the partners, which separate andautonomous units and whose competences complement each other. This leads to a conclusion thatinter-organisational coordination is a key factor of public safety management, which principal featuresare as follows:
‚ integrity of actions: the enterprises of each organisation are coherent and mutually complementary,while efficiency may be achieved only within mutual realisation of tasks;
‚ interdependence: each organisation is mutually dependent both in the scope of conducting actions,transferring information, as well as managing resources;
‚ mutuality: mutual enterprises are based on relations between each organisation;‚ multiplicity: there are many possibilities of coordinating actions within one enterprise;‚ adaptability: methods of coordination are adapted to existing conditions.
Moreover, inter-organisational coordination is a result of legal and organisational, social, andsituational conditions. The first above-mentioned conditions are related to the existing legal regulations,procedures, and by-laws. They specify the rules of coordinating commonly conducted actions. In turn,the social conditions cover inter-organisational relations, which through shaping of appropriatebehaviours, influence the enterprises’ efficiency. Whereas, situational conditions specify the currentcontext of actions’ realisation. They cause that flexibility and agility is required of organisationsparticipating in the actions. Both the factors and conditions of inter-organisational coordinationimpact the level of sustainable local governance. In principle, local governance is characterised byaccountability, transparency, openness, and publicness. These features are favourable to improvingsustainable local governance.
The analyses confirm the complexity of inter-organisational coordination and significance ofrelational aspects in the theory and practice of managing public safety.
320
Sustainability 2016, 8, 123
5. Discussion and Conclusions
In this article we analyse inter-organisational coordination in the public safety managementsystem. In our opinion the notion of collaboration is broader than coordination, which is consistentwith the analyses conducted by Arthur T. Himmelman [10]. We also adapted the opinion of RichardC. Feiock, In Won Lee, and Hyung Jun Park [11] and we believe that coordination and collaborationare not points on a simple scale of service integration, but differ in their forms and structure.Startingfrom Fayol’s understanding of coordination, we reinforce this notion as one of the key factors ofcollaboration. In our deliberations we also claim that in our research the context of realisation ofactions is of significant importance, since the mechanism of coordination, which regulate the ways ofeffective collaboration, result from it [101]. According to Elodie Gardet and Caroline Mothe groupsof representative mechanisms of coordination include the following [102]: exchange formalisation,trust, result division, guarantees against opportunistic behaviour, and conflict resolution. In turn,Jody Hoffer Gittell and Leigh Weiss on the base of a nine-hospital quantitative study of patientcare coordination analysed such coordination mechanisms as [103]: routines, information systems,meetings, and boundary spanners. In our research we have demonstrated that in the Polish context ofpublic safety management the formal mechanisms of coordination play the main role, which resultsfrom institutional arrangements. In the conditions of uncertainty and risk the formal decision-makingstructures constitute the foundation of conducting actions, although other mechanisms—such as trust,meetings, and routines—are also significant. To a greater extent these mechanisms are applied in theperiod of stabilisation, during action preparation. This proves that the priority significance of eachcoordination mechanism results from the situational context.
The analyses presented in this article are not free from limitations. These limitations result aboveall from the fact that the research is of a preliminary nature and it concerns a diagnosis of the levelof inter-organisational coordination in public safety management in relation to factors of effectiveinter-organisational collaboration. In the future, we plan to expand these research studies in relationto enhanced inter-organisational coordination endeavours. Moreover, the research is located in thePolish context. Taking that into account, it is necessary to study the course of inter-organisationalcoordination in other social and political conditions. It is also recommended to comprehensivelyanalyse the internal and external conditions of effective inter-organisational coordination, for whichpurpose the research on business models of public safety organisations may prove useful.
Despite these limitations we have been able to achieve the assumed goal of this publication. Weargue that inter-organisational coordination as an instrument of collaboration between autonomousunits is the key factor in sustainable public safety management. It binds the actions taken by eachorganisation, enables flexible adaptation of enterprises and possessed resources to the existingconditions, it configures the networks of public services’ delivery and it maximises the usage ofthe possessed abilities. As a result of this, it increases the efficiency of public safety management.
In conclusion we claim that:
(1) Inter-organisational coordination depends to a large extent on organisational and relationalconditions, which occur between collaborating units. They include among other such factorsas: communication in inter-organisational working teams, constraints in inter-organisationalcollaboration, leadership with organisational and communication skills, organisation ofcollaborative work (e.g., time pressured, competitive, rapidly changing, stability), managementof inter-organisational collaboration (e.g., styles, transparency of decisions, and guidance),inter-organisational trust, and professional communication between personnel fromindividual organisations.
(2) Coordination in public safety management is protean. During stabilization it is carried outby public administration and it involves determination of preventive operations. Some waysof that coordination can be applied in other areas of sustainable local government. Howeverduring the realisation phase the person in charge of rescue actions coordinates activities within
321
Sustainability 2016, 8, 123
the incident site. Outside the incident site the coordination function is fulfilled by emergencycoordination centres. This solution is the result of complexity embedded in the unique situationand efforts to be undertaken in face of hazard. Such coordination, particularly creation of formaland informal relationships based on trust and organisational concern, can be used in sheerinter-organisational collaboration.
(3) The principal features of inter-organisational coordination considered with regard to collaboratedmanagement are: integrity of actions, interdependence, mutuality, complexity, and adaptivenessto unique and rapidly changing situations. At the same time, inter-organisational coordination isa result of legal, organisational, social, and situational conditions. Features of inter-organisationalcoordination have a considerable impact on the level of sustainable public safety management.
Acknowledgments: Acknowledgments: The authors would like to thank an anonymous reviewers forconstructive comments and suggestions. Empirical data were collected within the authors’ own investigationscarried out in 2013–2015 in the project entitled “Coordination, communication and trust as factors driving effectiveinter-organisational collaboration in the system of public safety management”, financed by the Polish funds ofthe National Science Centre allocated on the basis of the decision No. DEC-2012/07/D/HS4/00537. Whereas,preparing of the publication was partly developed within the Statutory Research 2013–2016 of the Institute ofPublic Affairs of the Jagiellonian University in Cracow entitled “Managing Public Sector”.
Author Contributions: Author Contributions: Barbara Kozuch and Katarzyna Sienkiewicz-Małyjurek workedtogether to conceived, designed and performed the research, analyzed the data and wrote the paper.
Conflicts of Interest: Conflicts of Interest: The authors declare no conflict of interest.
References
1. Van Wassenhove, L.N. Humanitarian aid logistics: Supply chain management in high gear. J. Oper. Res. Soc.2006, 57, 475–489. [CrossRef]
2. Szymczak, M.; Sienkiewicz-Małyjurek, K. Information in the city traffic management system. The analysis ofthe use of information sources and the assessment in terms of their usefulness for city routes users. LogForum2011, 7, 37–50.
3. Slabbert, A.D.; Ukpere, W.I. Poverty as a transient reality in a globalised world: An economic choice. Int. J.Soc. Econ. 2011, 38, 858–868. [CrossRef]
4. Smith, N. Economic inequality and poverty: Where do we go from here? Int. J. Sociol. Soc. Policy 2010, 30,127–139. [CrossRef]
5. Sienkiewicz-Małyjurek, K. Spatial and organisational conditions of public safety in cities. In Current Problemsof Regional Development, Proceedings of the International Scientific Conference on Hradec EconomicalDays 2008: A Strategy for Development of the Region and the State Location, University Hradec Kralove,Czech Republic, 5–6 February 2008; Jedlicka, P., Ed.; pp. 95–99.
6. Jabłonski, A. Wieloparadygmatycznosc w zarzadzaniu a trwałosc modelu biznesu przedsiebiorstwa. Studia iPrace Kolegium Zarzadzania i Finansów Szkoły Głównej Handlowej w Warszawie 2014, 139, 51–72. (In Polish)
7. Kozłowski, S. Polska droga do zrównowazonego rozwoju. In Rozwój zrównowazony na szczeblu krajowym,regionalnym i lokalnym—doswiadczenia polskie i mozliwosci ich zastosowania na Ukrainie; Kozłowski, S.,Haładyj, A., Eds.; KUL: Lublin, Poland, 2006; pp. 159–166. (In Polish)
8. Kozuch, B.; Sienkiewicz-Małyjurek, K. Collaborative networks as a basis for internal economic securityin sustainable local governance. The case of Poland. In The Economic Security of Business Transactions.Management in Business; Raczkowski, K., Schneider, F., Eds.; Chartridge Books Oxford: Oxford, UK, 2013;pp. 313–328.
9. O’Leary, R.; Vij, N. Collaborative Public Management: Where Have We Been and Where Are We Going?Am. Rev. Public Adm. 2012, 42, 507–522. [CrossRef]
10. Himmelman, A.T. On coalitions and the transformation of power relations: Collaborative betterment andcollaborative empowerment. Am. J. Community Psychol. 2001, 29, 277–284. [CrossRef] [PubMed]
11. Feiock, R.C.; Lee, I.W.; Park, H.J. Administrators’ and Elected Officials’ Collaboration Networks: SelectingPartners to Reduce Risk in Economic Development. Public Adm. Rev. 2012, 72, S58–S68. [CrossRef]
12. Gulati, R.; Wohlgezogen, F.; Zhelyazkov, P. The Two Facets of Collaboration: Cooperation and Coordinationin Strategic Alliances. Acad. Manag. Ann. 2012, 6, 531–583. [CrossRef]
322
Sustainability 2016, 8, 123
13. Raposo, A.B.; Fuks, H. Defining Task Interdependencies and Coordination Mechanisms for CollaborativeSystems. In Cooperative Systems Design; Blay-Fornarino, M., Pinna-Dery, A.M., Schmidt, K., Zaraté, P., Eds.;IOS Press: Amsterdam, The Netherlands, 2002; pp. 88–103.
14. Leonard, H.B.; Howitt, A.M. Organising Response to Extreme Emergencies: The Victorian Bushfires of 2009.Aust. J. Public Adm. 2010, 69, 372–386. [CrossRef]
15. Gregory, R. All the King’s horses and all the King’s men: Putting New Zealand’s public sector back togetheragain. Int. Public Manag. Rev. 2003, 4, 41–58.
16. Comfort, L.K. Crisis Management in Hindsight: Cognition, Communication, Coordination, and Control.Public Adm. Rev. 2007, 67, 189–197. [CrossRef]
17. Leonard, H.B.; Howitt, A.M. Katrina as prelude: Preparing for and responding to Katrina-Class Disturbancesin the United States—Testimony to U.S. Senate Committee, 8 March 2006. J. Homel. Secur. Emerg. Manag.2006, 3, 1547–7355. [CrossRef]
18. Comfort, L.K.; Kapucu, N. Inter-organizational coordination in extreme events: The World Trade Centerattacks, 11 September 2001. Nat. Hazards 2006, 39, 309–327. [CrossRef]
19. Bharosa, N.; Lee, J.; Janssen, M. Challenges and obstacles in sharing and coordinating information duringmulti-agency disaster response: Propositions from field exercises. Inf. Syst. Front. 2010, 12, 49–65. [CrossRef]
20. Panday, P.K. Policy implementation in urban Bangladesh: Role of intra-organizational coordination.Public Organ. Rev. 2007, 7, 237–259. [CrossRef]
21. Meek, J.W. Nuances of Metropolitan Cooperative Networks. Public Adm. Rev. 2012, 72, S68–S69. [CrossRef]22. Chen, R.; Sharman, R.; Chakravarti, N.; Rao, H.R.; Upadhyaya, S.J. Emergency response information system
interoperability: Development of chemical incident response data model. J. Assoc. Inf. Syst. 2008, 9, 1–54.23. Chen, R.; Sharman, R.; Rao, H.R.; Upadhyaya, S.J. Coordination In Emergency Response Management,
Developing a framework to analyze coordination patterns occurring in the emergency response life cycle.Commun. ACM 2008, 51, 66–73. [CrossRef]
24. Melin, U.; Axelsson, K. Understanding Organizational Coordination and Information Systems—Mintzberg’sCoordination Mechanisms Revisited and Evaluated. Available online: http://aisel.aisnet.org/ecis2005/115/(accessed on 18 December 2015).
25. Gittell, J.H. Relationships between service providers and their impact on customers. J. Sci. Res. 2002, 4,299–311. [CrossRef]
26. Gittell, J.H. Relational coordination: coordinating work through relationships of shared goals, sharedknowledge and mutual respect. In Relational Perspectives in Organisational Studies: A Research Companion;Kyriakidou, O., Özbilgin, M.F., Eds.; Edward Elgar Publishers: Cheltenham, UK, 2006; pp. 74–94.
27. Kozuch, B.; Sienkiewcz-Małyjurek, K. Factors of effective inter-organisational collaboration: A frameworkfor public management. Transylvanian Review of Administrative Sciences, forthcoming.
28. Government Centre for Security. Act of 26 April 2007 on the Crisis Management. Available online: http://rcb.gov.pl/eng/wp-content/uploads/2011/03/ACT-on-Crisis-Management-final-version-31-12-2010.pdf(accessed on 25 January 2016).
29. Kozuch, B.; Sienkiewicz-Małyjurek, K. Information sharing in complex systems: A case study on publicsafety management. Procedia Soc. Behav. Sci. 2015, 213, 722–727. [CrossRef]
30. Waugh, W.L.; Streib, G. Collaboration and Leadership for Effective Emergency Management. Public Adm. Rev.2006, 66, 131–140. [CrossRef]
31. Kapucu, N.; Arslan, T.; Demiroz, F. Collaborative emergency management and national emergencymanagement network. Disaster Prev. Manag. 2010, 19, 452–468. [CrossRef]
32. Kapucu, N. Disaster and emergency management systems in urban areas. Cities 2012, 29, S41–S49. [CrossRef]33. Boin, A.; Hart, P. Organising for Effective Emergency Management: Lessons from Research. Austr. J.
Public Adm. 2010, 69, 357–371. [CrossRef]34. Choenni, S.; Leertouwer, E. Public Safety Mashups to Support Policy Makers. In Electronic Government and the
Information Systems Perspective, Proceedings of the First International Conference EGOVIS 2010, Bilbao, Spain,31 August–2 September 2010; Andersen, K.M., Francesconi, E., van Engers, A.G.T.M., Eds.; Springer-Verlag:Berlin Heidelberg, Germany, 2010; pp. 234–248.
35. Sienkiewicz-Małyjurek, K. Rola samorzadów lokalnych w kształtowaniu bezpieczenstwa publicznego.Samorz. Teryt. 2010, 7–8, 123–139. (In Polish)
323
Sustainability 2016, 8, 123
36. Tomasino, A.P. Public Safety Networks as a Type of Complex Adaptive System. In Unifying Themes inComplex Systems, Proceedings of the Eighth International Conference on Complex Systems, Volume VIII,Boston, MA, 26 June–1 July 2011; Sayama, H., Minai, A., Braha, D., Bar-Yam, Y., Eds.; New England ComplexSystems Institute Series on Complexity, NECSI Knowledge Press: Cambridge, MA, USA, 2011; pp. 1350–1364.
37. Williams, C.B.; Dias, M.; Fedorowicz, J.; Jacobson, D.; Vilvovsky, S.; Sawyer, S.; Tyworth, M. The formation ofinter-organizational information sharing networks in public safety: Cartographic insights on rational choiceand institutional explanations. Inf. Polity 2009, 14, 13–29.
38. Kozuch, B.; Sienkiewicz-Małyjurek, K. Collaborative Performance In Public Safety Management Process.In Transdisciplinary and Communicative Action, Proceedings of the 5th International Conference Lumen 2014,Targoviste, Romania, 21–22 November 2014; Frunza, A., Ciulei, T., Sandu, A., Eds.; Medimond S.r.l.: Bologna,Italy, 2015; pp. 401–409.
39. Kozuch, B.; Sienkiewicz-Małyjurek, K. Mapowanie procesów współpracy miedzyorganizacyjnej naprzykładzie działan realizowanych w bezpieczenstwie publicznym. Zarzadzanie Publiczne, 2015.forthcoming. (In Polish)
40. Sienkiewicz-Małyjurek, K.; Kozuch, B. System zarzadzania bezpieczenstwem publicznym w ujeciu teoriizłozonosci. Opracowanie modelowe. Bezpieczenstwo i Technika Pozarnicza 2015, 37, 33–43. (In Polish)
41. Kozuch, B.; Sienkiewicz-Małyjurek, K. New Requirements for Managers of Public Safety Systems. ProcediaSoc. Behav. Sci. 2014, 149, 472–478. [CrossRef]
42. Grudzewski, W.M.; Hejduk, I.K.; Sankowska, A.; Wantuchowicz, M. Sustainability w biznesie, czyliprzedsiebiorstwo przyszłosci, zmiany paradygmatów i koncepcji zarzadzania; Wydawnictwo Poltext: Warszawa,Poland, 2010. (In Polish)
43. Mah, D.N.; Hills, P. Collaborative governance for sustainable development: Wind resource assessment inXinjiang and Guangdong Provinces, China. Sustain. Dev. 2012, 20, 85–97. [CrossRef]
44. Røiseland, A. Understanding local governance: Institutional forms of collaboration. Public Adm. 2011, 89,879–893. [CrossRef]
45. Considine, M. Governance networks and the question of transformation. Public Adm. 2013, 91, 438–447.[CrossRef]
46. Lee, I.W.; Feiock, R.C.; Lee, Y. Competitors and Cooperators: A Micro-Level Analysis of Regional EconomicDevelopment Collaboration Networks. Public Adm. Rev. 2012, 72, 253–262. [CrossRef]
47. Lozano, R. Collaboration as a Pathway for Sustainability. Sustain. Dev. 2007, 15, 370–381. [CrossRef]48. Mattessich, P.W.; Murray-Close, M.; Monsey, B.R. Collaboration: What Makes It Work; Amherst H. Wilder
Foundation: Saint Paul, MN, USA, 2001.49. Thomson, A.M.; Perry, J.L. Collaboration process: Inside the black box. Public Adm. Rev. 2006, 66, 20–32.
[CrossRef]50. Arya, B.; Lin, Z. Understanding collaboration outcomes from an extended resource-based view perspective:
The roles of organizational characteristics, partner attributes, and network structures. J. Manag. 2007, 33,697–723. [CrossRef]
51. Hansen, M.T.; Nohria, N. How to build collaborative advantage. MIT Sloan Manag. Rev. 2004, 46, 4–12.52. Hardy, C.; Phillips, N.; Lawrence, T.B. Resources, Knowledge and Influence: The Organizational Effects of
Interorganizational Collaboration. J. Manag. Stud. 2003, 40, 321–347. [CrossRef]53. Powell, W.W.; Koput, K.W.; Smith-Doerr, L. Interorganizational collaboration and the locus of innovation:
Networks of learning in biotechnology. Adm. Sci. Q. 1996, 41, 116–146. [CrossRef]54. Berlin, J.M.; Carlström, E.D. Why is collaboration minimised at the accident scene? A critical study of a
hidden phenomenon. Disaster Prev. Manag. 2011, 20, 159–171. [CrossRef]55. Kaiser, F.M. Interagency Collaborative Arrangements and Activities: Types, Rationales, Considerations;
Congressional Research Service: Washington, DC, USA, 2011.56. McGuire, M. Collaborative Public Management: Assessing What We Know and How We Know It.
Public Adm. Rev. 2006, 66, 33–43. [CrossRef]57. Perrault, E.; McClelland, R.; Austin, C.; Sieppert, J. Working Together in Collaborations: Successful Process
Factors for Community Collaboration. Adm. Soc. Work 2011, 5, 282–298. [CrossRef]58. Malone, T.W.; Crowston, K. What is coordination theory and how can it help design cooperative work
systems. In Proceedings of the Conference on Computer Supported Cooperative Work, Los Angeles, CA,USA, 7–10 October 1990.
324
Sustainability 2016, 8, 123
59. Hartgerink, J.M.; Cramm, J.M.; Bakker, T.J.E.M.; van Eijsden, R.A.M.; Mackenbach, J.P.; Nieboer, A.P.The importance of relational coordination for integrated care delivery to older patients in the hospital.J. Nurs. Manag. 2014, 22, 248–256. [CrossRef] [PubMed]
60. Hossain, L.; Uddin, S. Design patterns: Coordination in complex and dynamic environments.Disaster Prev. Manag. 2012, 21, 336–350. [CrossRef]
61. Malone, T.W.; Crowston, K. The interdisciplinary study of coordination. ACM Comput. Surv. (CSUR) 1994,26, 87–119. [CrossRef]
62. Lie, A. Coordination processes and outcomes in the public service: The challenge of inter-organizationalfood safety coordination in Norway. Public Adm. 2011, 89, 401–417. [CrossRef] [PubMed]
63. Bond, J.B.; Gittell, J.H. Cross-agency coordination of offender reentry: Testing collaboration outcomes.J. Crim. Justice 2010, 38, 118–129. [CrossRef]
64. Jones, C.; Hesterly, W.S.; Borgatti, S.P. A General Theory of Network Governance: Exchange Conditions andSocial Mechanisms. Acad. Manag. Rev. 1997, 22, 911–945.
65. De Pablos Heredero, C.; Haider, S.; García Martínez, A. Relational coordination as an indicator of teamworkquality: Potential application to the success of e-learning at universities. Int. J. Emerg. Technol. Learn. 2015,10, 4–8. [CrossRef]
66. Provan, K.G.; Kenis, P. Modes of Network Governance: Structure, Management, and Effectiveness. J. PublicAdm. Res. Theory 2008, 18, 229–252. [CrossRef]
67. Carlson, E.J. Collaboration and Confrontation in Interorganizational Coordination: Preparing to Respond toDisasters. Available online: https://docs.google.com/viewer?url=https%3A%2F%2Fwww.ideals.illinois.edu%2Fbitstream%2Fhandle%2F2142%2F50617%2FElizabeth_Carlson.pdf%3Fsequence%3D1 (accessed on11 January 2016).
68. Grandori, A. An Organizational Assessment of Interfirm Coordination Modes. Organ. Stud. 1997, 18,897–925. [CrossRef]
69. Van De Ven, A.H.; Delbecq, A.L.; Koenig, R.J. Determinants of coordination modes within organizations.Am. Sociol. Rev. 1976, 41, 322–338.
70. Martinez, J.I.; Jarillo, J.C. The Evolution of Research on Coordination Mechanisms in MultinationalCorporations. J. Int. Bus. Stud. 1989, 20, 489–514. [CrossRef]
71. Hossain, L.; Kuti, M. Disaster response preparedness coordination through social networks. Disasters 2010,34, 755–786. [CrossRef] [PubMed]
72. Mintzberg, H. The Structuring of Organizations; Prentice-Hall: Englewood Cliffs, NJ, USA, 1979.73. Drabek, T.E. Community Processes: Coordination. In Handbook of Disaster Research; Rodríguez, H.,
Quarantelli, E.L., Dynes, R.R., Eds.; Springer Science + Business Media: New York, NY, USA, 2007;pp. 217–233.
74. Abbasi, A.; Owen, C.; Hossain, L.; Hamra, J. Social connectedness and adaptive team coordination duringfire events. Fire Saf. J. 2013, 59, 30–36. [CrossRef]
75. Morris, J.C.; Morris, E.D.; Jones, D.M. Reaching for the Philosopher’s Stone: Contingent Coordination andthe Military’s Response to Hurricane Katrina. Public Adm. Rev. 2007, 67, 94–106. [CrossRef]
76. Comfort, L.; Dunn, M.; Johnson, D.; Skertich, R.; Zagorecki, A. Coordination in complex systems: Increasingefficiency in disaster mitigation and response. Int. J. Emerg. Manag. 2004, 2, 63–80. [CrossRef]
77. Kapucu, N. Interorganizational Coordination in Dynamic Context: Networks in Emergency ResponseManagement. Connections 2005, 26, 33–48.
78. Wise, C.R. Organizing for Homeland Security after Katrina: Is Adaptive Management What’s Missing?Public Adm. Rev. 2006, 66, 302–318. [CrossRef]
79. Bolland, J.M.; Wilson, J.V. Three Faces of Integrative Coordination: A Model of Interorganizational Relationsin Community-Based Health and Human Services. HSR Health Services Res. 1994, 29, 341–366.
80. Leung, Z.C.S. Boundary Spanning in Interorganizational Collaboration. Adm. Soc. Work 2013, 37, 447–457.[CrossRef]
81. Patel, H.; Pettitt, M.; Wilson, J.R. Factors of collaborative working: A framework for a collaboration model.Appl. Ergon. 2012, 43, 1–26. [CrossRef] [PubMed]
82. Ales, M.W.; Rodrigues, S.B.; Snyder, R.; Conklin, M. Developing and Implementing an Effective Frameworkfor Collaboration: The Experience of the CS2day Collaborative. J. Contin. Educ. Health Prof. 2011, 31, 13–20.[CrossRef] [PubMed]
325
Sustainability 2016, 8, 123
83. Ansell, C.; Gash, A. Collaborative Governance in Theory and Practice. J. Public Adm. Res. Theory 2007, 18,543–571. [CrossRef]
84. Chen, B. Antecedents or Processes? Determinants of Perceived Effectiveness of InterorganizationalCollaborations for Public Service Delivery. Int. Public Manag. J. 2010, 13, 381–407. [CrossRef]
85. Daley, D.M. Interdisciplinary Problems and Agency Boundaries: Exploring Effective Cross-AgencyCollaboration. J. Public Adm. Res. Theory 2009, 19, 477–493. [CrossRef]
86. Emerson, K.; Nabatchi, T.; Balogh, S. An integrative framework for collaborative governance. J. Public Adm.Res. Theory 2011, 22, 1–30. [CrossRef]
87. Fedorowicz, J.; Gogan, J.L.; Williams, C.B. A collaborative network for first responders: Lessons from theCapWIN case. Gov. Inf. Q. 2007, 24, 785–807. [CrossRef]
88. Franco, M. Determining factors in the success of strategic alliances: An empirical study performed inPortuguese firms. Eur. J. Int. Manag. 2011, 5, 608–632. [CrossRef]
89. Olson, C.A.; Balmer, J.T.; Mejicano, G.C. Factors Contributing to Successful Interorganizational Collaboration:The Case of CS2day. J. Contin. Educ. Health Prof. 2011, 31, 3–12. [CrossRef] [PubMed]
90. Raišiene, A.G. Sustainable Development of Inter-Organizational Relationships and Social Innovations.J. Secur. Sustain. Issues 2012, 2, 65–76. [CrossRef]
91. Ranade, W.; Hudson, B. Conceptual issues in inter-agency collaboration. Local Gov. Stud. 2003, 29, 32–50.[CrossRef]
92. The National Headquarters of the State Fire Service of Poland. Biuletyn Informacyjny PanstwowejStrazy Pozarnej za Rok 2010. Available online: http://www.straz.gov.pl/aktualnosci/biuletyn_roczny_psp_za_rok_2010 (accessed on 26 January 2016). (In Polish).
93. Reddy, M.C.; Paul, S.A.; Abraham, J.; McNeese, M.; DeFlitch, C.; Yen, J. Challenges to effective crisismanagement: Using information and communication technologies to coordinate emergency medical servicesand emergency department teams. Int. J. Med. Inf. 2009, 78, 259–269. [CrossRef] [PubMed]
94. European Commission; Humanitarian Aid and Civil Protection. Emergency Response CoordinationCentre, ECHO Factsheet. Available online: http://ec.europa.eu/echo/files/aid/countries/factsheets/thematic/ERC_en.pdf (accessed on 20 September 2015).
95. Internetowy System Aktów Prawnych. Ustawa z Dnia 22 Listopada 2013 r. o Systemie PowiadamianiaRatunkowego (Dz.U. 2013 poz. 1635); Available online: http://isap.sejm.gov.pl/DetailsServlet?id=WDU20130001635 (accessed on 27 January 2016). (In Polish)
96. Asees, M.S. Tsunami Disaster Prevention in Sri Lanka. Available online: http://www. jamco.or.jp/en/symposium/21/3/ (accessed on 28 September 2015).
97. Sienkiewicz-Małyjurek, K. The Flow of Information About the Actions Required in Emergency Situations:Issues in Urban Areas in Poland. Int. J. Soc. Sustain. Econ. Soc. Cult. Context 2013, 8, 61–71.
98. Aedo, I.; Díaz, P.; Carroll, J.M.; Convertino, G.; Rosson, M.B. End-user oriented strategies to facilitatemulti-organizational adoption of emergency management information systems. Inf. Process. Manag. 2010, 46,11–21. [CrossRef]
99. Lee, W.B.; Wang, Y.; Wang, W.M.; Cheung, C.F. An unstructured information management system (UIMS)for emergency management. Expert Syst. Appl. 2012, 39, 12743–12758. [CrossRef]
100. Juan, L.J.; Li, Q.; Liua, C.; Khana, S.U.; Ghani, N. Community-based collaborative information system foremergency management. Comput. Oper. Res. 2014, 42, 116–124.
101. Grandori, A.; Soda, G. Inter-firm networks: Antecedents, mechanisms and forms. Organ. Stud. 1995, 16,183–214. [CrossRef]
102. Gardet, E.; Mothe, C. The dynamics of coordination in innovation networks. Eur. Manag. Rev. 2011, 8,213–229. [CrossRef]
103. Gittell, J.H.; Weiss, L. Coordination Networks Within and Across Organizations: A Multi-level Framework.J. Manag. Stud. 2004, 41, 127–153. [CrossRef]
© 2016 by the authors. Licensee MDPI, Basel, Switzerland. This article is an open accessarticle distributed under the terms and conditions of the Creative Commons Attribution(CC BY) license (http://creativecommons.org/licenses/by/4.0/).
326
Article
Environmental Aspects of Social Responsibility ofPublic Sector Organizations
Liliana Hawrysz * and Joachim Foltys
Department of Organization and Management, Faculty of Economy and Management,Opole University of Technology, Opole 45-758, Poland; [email protected]* Correspondence: [email protected]
Academic Editor: Adam JabłonskiReceived: 2 October 2015; Accepted: 9 December 2015; Published: 25 December 2015
Abstract: In addition to determining social responsibility policies that affect the market and socialactors, certain governments also set objectives related to their internal activity. For example, oneof the activities of the German government is to implement the concept of social responsibilityinto public institutions. In the Netherlands, one of the government tasks is to set an example forresponsible practices (government as a role model). The aim of this paper is to examine firstlywhether public sector entities set an example for responsible practices, especially with regard torespect for the environment, and secondly, whether public sector organizations in Poland significantlydiffer from organizations abroad in terms of their practices in the field of environmental protection.A questionnaire was a basis for data collection. The questionnaires were distributed to representativesof deliberately selected public sector organizations located primarily in Europe. The study wasconducted in 2012–2013 on a group of 220 public sector organizations (102 Polish and 118 otherEuropean). The paper presents only the selected part of research. Public sector organizations inPoland do not have internal mechanisms of environmental responsibility. There is a significantdiscrepancy between the state of the environmental responsibility of organizations located in Polandand abroad. Obtained results show that public sector organizations, those in Poland in particular, aremaking their first steps in developing internal environmental responsibility.
Keywords: CSR; government as a role model; public sector organizations; environment
1. Introduction
Corporate social responsibility derives from three dimensions: human, environmental andeconomic (Triple P: People, Planet, Profit) [1]. Business organizations intend to take responsibility fortheir development processes, which take place both inside and outside their organization. However,public sector organizations are mostly expected to support business entities in this respect [2]. The issuediscussed less often concerns public sector organizations as socially responsible entities, that is thoseseeking to increase the transparency and verifiability of actions taken, creating friendly conditionsfor reforms. However, besides determining CSR policies that affect the market and social actors,particular governments set objectives related to their own social activity. In the German governmentprogram (National Strategy for Sustainable Development), one of the government's actions is toimplement the CSR concept in public institutions. In the Netherlands, one of the government tasksis to set an example for responsible practices (government as a role model). In countries such asFrance, the United Kingdom and Belgium, the governments have set goals for sustainable/greenprocurement [3]. This way of perceiving public sector organizations shows a duality of their rolein relation to social responsibility. The dual role of public sector organizations is reduced to twodimensions, external and internal. The external dimension, far more recognizable in the literature [4–9],concerns promotion of the corporate social responsibility concept in the business environment. The
Sustainability 2016, 8, 19; doi:10.3390/su8010019 www.mdpi.com/journal/sustainability327
Sustainability 2016, 8, 19
internal dimension applies to public sector organizations as socially responsible entities, not onlybecause of the implementation of the tasks assigned to these units and undertaken in close correlationwith the objectives that an entity should pursue, but primarily as a result of efforts to build mutual trustand transparency in relationships with both the external and internal environment of the organization.These activities are designed to create a well-established, solid belief that the funds allocated to theadministration are spent efficiently, while providing maximum benefits for a society. The external andinternal dimensions should remain in balance. If any of these dimensions is ailing, the credibility ofthe organization is undermined. The external dimension is far more recognizable in the literature,which is why this paper focuses on the internal dimension. Environmental responsibility is one of themain aspects of social responsibility. Corporate Environmental Responsibility (CER) simply meansthe incorporation of responsibility assumptions towards the environment in the strategic policy ofthe organization [10]. As research findings indicate, four elements affect the effectiveness of actionsconcerning environmental responsibility (the internal dimension): implementing the environmentalpolicy into the organization strategic documents and everyday activities, stimulating employees’awareness, increasing the amount and scope of responsibility for the environment, concerns theintroduction of environmental responsibility into the core values of the organization [7]. The surveyquestions used in the paper are based on these key activities. Due to historical heritage, public sectororganizations in Poland have never been the leader of implementing modern methods of management.While leading European countries were improving their management tools, organizations in Polandhad just started to implement them. This time difference is the reason for comparing environmentalprotection practices in organizations located in and outside Poland to find out if they are as differentas expected.
There are empirical studies examining environmental sustainability in public sector organizations,but the majority of them have a single-country focus [11–15]. There are only a few studies that have amulti-country environmental focus [16,17], but none of them include Polish organizations.
The aim of this paper is to examine firstly whether public sector organizations set an example forresponsible practices, especially with regard to respect for the environment, and secondly, whetherpublic sector organizations in Poland significantly differ from organizations abroad in terms of theirpractices in the field of environmental protection. Therefore, two hypotheses were formulated for thepurpose of research.
Hypothesis 1. Public sector organizations set an example for responsible practices in respect forthe environmental protection.
Hypothesis 2. Public sector organizations in Poland differ significantly from organizations locatedabroad in terms of their practices concerning the environmental protection.
The basis for collecting information for research was a questionnaire sent to representative ofdeliberately selected public sector organizations located primarily in Europe. The study was conductedin 2012–2013 on a group of 220 public sector organizations.
2. Literature Review
The first model for social responsibility that focused on decision making was shaped byCarroll [18]. Hawken identified sustainability problems and discussed business-related solutions,which, in his opinion, could transform both companies and the economy, and possibly improveprofitability [19]. However, the financial aspect of the activity is not the main one in public sectororganization [20]. In the public sector, compared to the corporate sector, accountability expectations andobligations have always been higher. New public management reforms put pressure on public sectororganizations to demonstrate their financial and non-financial performance. The demand is particularlyrelevant for public sector organizations considering that they create public value while acting in anentrepreneurial way [17,21]. Public sector organizations are expected to be more environmentallyresponsible than private companies as they are legitimated by public contracts. Government andpublic sector organizations have a special role to play as guarantors of public values. Moore believes
328
Sustainability 2016, 8, 19
that citizens want from their governments some combination of the following that together encompasspublic value: (1) high-performing service-oriented public bureaucracies, (2) public organizations thatare efficient and effective in achieving desired social outcomes, and (3) public organizations thatoperate justly and fairly, and lead to just and fair conditions in the society at large [22]. That is whypublic sector organizations are obligated to citizens to operate in a sustainable way.
As previously mentioned, the role of public sector organizations in relation to social responsibilityis reduced to two dimensions: external and internal. As far as the external dimension of socialresponsibility of public sector organizations is concerned, four institutional models are identified inthe literature: observer, patron, promoter, and partner [3]. These models differ mainly in the degreeto which the state takes responsibility for coordinating activities related to the implementation ofthe CSR concept. In the first model (the observer), there is no leader responsible for coordinatingactivities related to corporate social responsibility and the burden of promoting this concepts rests onsocio-economic partners. In the second model (the patron), there is no leader either, but the burdenof promoting the concept of corporate social responsibility rests on the government administration.The third model (the promoter) is characterized by government coordination of activities promotingthe CRS concept by the institution acting as the leader. In addition, government is responsible forpublishing guidelines, standards and other forms of support for development of social responsibilityidea. The fourth model (the partner) is characterized by the presence of leading governmentalinstitution coordinating the activities of other ministries, as well as advisory bodies or centers forpromotion of social responsibility. Simultaneously, government actions create the framework forbottom-up initiatives of involved socio-economic partners, leading to a greater coherence of activitiesand effect of synergy [3]. A slightly different typology has been proposed in the document prepared bythe Ministry of Foreign Affairs of the Kingdom of the Netherlands and the World Bank [23,24]. In thistypology, the model of the observer has not been included and a forcing attitude appears instead,which consists in imposing the implementation of corporate social responsibility, for example byappropriate legislation, regulations, guidelines, audits, legal or fiscal penalties, etc. [23–25]. In theliterature, a great deal of attention is devoted to describing and diagnosing the institutional modelsof social responsibility promotion. The analysis shows that patron and partner and forcing attitudemodels [24] are the least favorable. In the case of successful models, we deal with active presence ofgovernment administration authorities in intensifying efforts to promote social responsibility.
The internal dimension applies to public sector organizations as socially responsible entities,because of the efforts to build mutual trust and transparency both in relationships with the externaland internal environment of the organization. These activities are designed to create a well-established,solid belief that the funds allocated to the administration are spent efficiently, while providingmaximum benefits for a society.
Hypothesis 1. Public sector organizations set an example for responsible practices in respect forthe environmental protection.
Hypothesis 2. Public sector organizations in Poland differ significantly from organizations locatedabroad in terms of their practices concerning the environmental protection.
According to Elkington, environmental responsibility is one of the dimensions of socialresponsibility, in addition to economic and social ones [26]. Corporate Environmental Responsibility(CER) simply means incorporation of responsibility assumptions towards the environment in thestrategic policy of the organization [10]. Among the organizations operating on the market, twoorientations that are not mutually exclusive in the movement for environmental responsibility can bedistinguished: obligatory and optional. Obligatory (external) orientation takes the form of three typesof isomorphism: coercive, mimetic and normative. Coercive isomorphism arises when organizationsinclude in their activities the need to respect the environment in response to legal regulations; mimeticisomorphism is the result of a reference of one organization to the other, more effective one, andnormative isomorphism is dictated by the requirement to improve organization’s collective image.
329
Sustainability 2016, 8, 19
Optional (internal) orientation involves organization’s commitment to build competitive advantagebased on the value and uniqueness [27].
Many authors agree that the absence of an institutional framework in promoting respect forthe environment contributes to the fact that companies undertake activities of a limited nature,which do not always meet the expectations of local communities. The macroeconomic nature ofthe majority of policies and guidelines does not have an operationalized character and thereforerequires actions at the microeconomic level [27]. Since an economic activity may result in anegative impact on the environment, there is a commitment to take responsibility for this condition.The commitment translates into developing such activities that are socially responsible, that aimat creating a society responsible for the environment on a voluntary basis and beyond the legalexpectations [28]. This means that obligatory orientation is a starting point for actions, but onlyoptional orientation makes these actions more meaningful. Optional orientation leads to the situationwhere responsibility for the environment is a fundamental need and commitment towards the nextgenerations, and not the consequence of strict respect for the law. Obligatory orientation in Polandin the movement for environmental responsibility stems from, inter alia, the environmental policyfor 2009–2012 with the perspective to 2016 [29]. The following are recognized as the most importantdirections of systemic actions:
‚ consideration of environmental principles in sector strategies‚ activation of the market to protect the environment‚ environmental management‚ participation of society in the environmental protection‚ development of research and technical progress‚ liability for environmental damage‚ ecological aspect in spatial planning
As research findings indicate, four elements affect the effectiveness of actions concerningenvironmental responsibility (the internal dimension). The first element is implementing theenvironmental policy into the organization strategic documents and everyday activities undertaken bythe organization. The second one is stimulating employees’ awareness and their responsibility for theenvironment. The third one is increasing the amount and scope of responsibility for the environment(e.g., to modify existing processes so that they will be more beneficial to the environment). Thefourth element concerns the introduction of environmental responsibility into the core values of theorganization [7].
An environmental policy is a publicly accessible document defining the organization’s intentionstoward the environment. Its content is the foundation for the entire system [30]. This policy determinesan overall direction for the organization’s environmental activities and establishes principles, whichwill guide the organization in environmental matters. An environmental policy becomes a point ofreference against which organizational activities will be assessed. Moreover, an environmental policyis crucial for the process of communication with employees, and local communities, depicting thepriorities of the organization for the environment protection [31]. Through the policy, the organizationdemonstrates that it is aware of its impact on the environment and surroundings and voluntarilycommits to minimize the negative impact on the environment. An environmental policy serves as alandmark—the benchmark for taken actions. Strategic initiatives that are crucial for developing theenvironmental policy are formulated [32,33].
An environmental policy itself is not sufficient as it outlines only a general direction foractivities. Without developing programs to measure and analyze the impact of the organizationon the environment, it is impossible to give the policy a lasting nature [34]. Without operationalization,the policy is merely declarative. Measurement and analysis programs provide access to information sothat decisions can be better, and above all, they take into account the welfare of local communities.In addition, these programs allow for identifying areas that need improvement, as well as setting
330
Sustainability 2016, 8, 19
priorities for undertaken activities [35]. They also allow effective risk management. Measurement andanalysis programs identifying organization’s impact on the environment allow for creating a referencepoint for the organization's activities [34]. Without measuring the scope of this impact, it is impossibleto manage the area in accordance with the principle “you cannot manage what you do not measure”.
Programs and actions for the most efficient use of natural resources are the recent trend inactivities undertaken on a broad international level [36]. Nations around the world recognize the valueof natural resources and they focus on their bigger protection and sustainable development. In 2012,the United Kingdom founded the Natural Capital Committee, whose role is to identify priorities foractions supporting and improving the use of natural resources. It has also begun preparations tointegrate the value of natural resources into the calculation of GDP by 2020 [37]. Therefore, it can beassumed that programs and actions for the most efficient use of natural resources will be growing insignificance in the next few years [36,38–40].
Because public sector organizations in Poland started to implement modern methods ofmanagement later than more developed countries, they are expected to be different.
Hypothesis 2. Public sector organizations in Poland differ significantly from organizations locatedabroad in terms of their practices concerning the environmental protection.
All these elements have internal character and consist of building individual environmentalresponsibility of employees in organizations and implementing responsibility in the organizationalculture. The paper attempts to answer the question as to whether public sector organizations,in addition to taking responsibility for coordinating activities related to implementing the concept ofcorporate social responsibility, have also developed internal mechanisms concerning CSR. Moreover,we will consider whether this has an impact on the economic environment, and if, at the same timethey can be seen as setting an example, this gives the organization credibility.
3. Methodology
The basis for collecting information for research was a questionnaire sent to representatives ofdeliberately selected public sector organizations located primarily in Europe. The study was conductedin 2012–2013 on a group of 220 public sector organizations. Three questions of a general nature werechosen from the questionnaire and subjected to statistical analysis. Questions were chosen in order toplace the actions taken by public organizations in an appropriate time context. Since the works on theenvironmental policy began in the international arena roughly in the 1970s, the actions undertaken byorganizations aimed at formulating their environmental policy served to keep up with internationaltrends and are characterized by focus on the past. Interest in data analysis software and programs forreducing negative impact on the environment are relatively new as they cover the past 10–15 years [35],but not everything has been refined in this area [34]. Therefore, it can be considered as a focus on thepresent. Orientation on activities and programs aimed at the most efficient use of natural resources isthe most current trend in the international arena, so far widely discussed [36,38–40], which is why theactions taken in this field are focused on the future.
4. Participants and Procedure
Research included public sector organizations, among others ministries and central offices,province offices, marshal offices, district offices, municipal offices, tax offices and chambers, andcustoms chambers. All public sector organizations registered in the EIPA database (EuropeanInstitution of Public Administration) were invited to participate in the study. In this way, 1739(according to EIPA data as of 30 November 2011) public sector organizations located outside Polandand 269 (according to EIPA data as of 30 November 2011) organizations located in Poland wereidentified. An invitation to participate in the study was sent via post to all organizations registered inthe EIPA database. Research was conducted from November 2012 to May 2013. A total number of2008 questionnaires were distributed to organizations’ representatives, 220 completed questionnaireswere returned, giving a rate of return of 11%. Not all of the questionnaires were suitable for further
331
Sustainability 2016, 8, 19
analysis. A total of 269 entities were located in Poland (according to EIPA data as of 30 November2011). All of these organizations were invited to participate in research. Only 102 organizations agreedto participate in research, which gave a return rate of 38%. However, outside Poland, the largest groupof organizations was represented by Belgium (12), Portugal (11), the Czech Republic (10), Italy (10),Finland (9 ), Germany (8), and Norway (6). The research was a trial project.
5. Instrument/Survey and Data Analysis
The questionnaire contained 46 questions with answers: yes, no, I do not know. The questionswere arranged in the following way: the first questions concerned general issues, and the followingquestions expanded them. Generally, the questionnaire related to three dimensions of the publicsector organizations’ functioning: human, environmental and economic. The aim of the study was toinvestigate the state and prospects of development of the Corporate Social Responsibility concept inpublic sector organizations in Poland and abroad. The paper presents only a part of the research onthe environmental aspects of corporate social responsibility. Other parts of the research are presentedin the papers [41,42].
The analysis of relationships between variables was conducted using a chi-square independencetest together with strength measures (Cramer’s V and C contingency coefficient). The significancelevel α = 0.05 was assumed. The results were considered statistically significant when the calculatedtest probability p satisfies the inequality p < 0.05.
Detailed results of the analysis of three most important environmental responsibility actions aresummarized in Table 1.
Table 1. Organizations’ environmental responsibility.
Environmental Responsibility Actions Poland Abroad χ² df p C V
have clearly defined environmental policy based on theprinciples of sustainable development 54% 57% 3.30 2 0.19 0.13 0.13
have developed programs of analysis and reduction oforganization’s negative influence on environment 22% 58% 2.27 2 0.00 0.36 0.34
actions or programs aimed to make the most efficientuse of natural resources are considered as priority 24% 56% 24.15 2 0.00 0.34 0.32
Source: own elaboration on the basis of survey results.
6. Results
6.1. Clearly Defined Environmental Policy Based on the Principles of Sustainable Development
In the research group, 54% of public sector organizations located in Poland and 57% oforganizations abroad declare that they have the defined environmental policy. The analysis resultof a chi-square test does not show the statistically significant relationship between a clearly definedenvironmental policy and location of the organization.
6.2. Developed Programs of Analysis and Reduction of Organization’s Negative Influence on Environment
In the studied group, 22% of organizations located in Poland and 58% abroad declare that theyhave developed a program for analyzing and reducing the negative impact of their activities on theenvironment. The analysis result of a chi-square test shows significant correlation between location ofthe organization and their programs for analyzing and reducing the negative impact of the organizationon the environment (χ² = 26.27, df = 2, p = 0.00000). Organizations located outside Poland often declarethat they have these kinds of programs. The strength of this correlation is average (C = 0.36, V = 0.34).
6.3. Actions or Programs Aimed to Make the Most Efficient Use of Natural Resources are Considered as Priority
In the surveyed group, 24% of organizations located in Poland and 56% located abroad declarethat they treat projects or programs aimed at the most effective use of natural resources as a priority in
332
Sustainability 2016, 8, 19
their actions. The analysis result of a chi-square test shows significant correlation between locationof the organization, and their declaration to treat projects and programs aimed at the most effectiveuse of natural resources as a priority (χ² = 24.15, df = 2, p = 0,00000). Organizations located outsidePoland more often declare that they treat projects or programs aimed at the most efficient use of naturalresources as a priority in their activities. The strength of this correlation is average (C = 0.34, V = 0.32).
7. Discussion
Research shows that more than half of public sector organizations located in Poland declare thatthey have clearly defined environmental policies concerning organization's intentions towards theenvironment. The content of these policies is the foundation for the entire system; it is the starting pointfor undertaking environmental actions and establishing principles that will guide the organizationin issues concerning the environment. Detailed analysis of environmental policies of organizationslocated in Poland shows that a large part of formulated policies concerns operation of external actors,primarily companies (e.g., introduction of rational and modern solutions for efficient water andwastewater management, improvement and rationalization of waste management system, systematicreduction of air pollution, water and soil pollution, reduction of traffic nuisance, monitoring of harmfulfactors in the city and their supervision and control, etc.). Only a small number of organizationsformulated environmental policies with regard to their own activities, e.g., reducing water andenergy use, reducing the amount of chemicals used, systematic training of office employees on theprocedures concerning the implementation of pro-environmental actions, support of projects relatedto the environmental education and sustainable development based on three-sector cooperation,promoting pro-environmental behaviors among employees, customers, suppliers and subcontractorsby bringing responsibility for the environment to their attention and promoting specific measures forenvironment protection, in particular promoting the principles of sustainable development, etc. [19].Formulating the environmental policy, public sector organizations focus largely on supporting theconcept of environmental responsibility in the business environment rather than on setting goals fortheir business activity. This way of formulating policies without taking into account the declarationstowards the environment issues has contributed to a lack of programs aiming at reducing the negativeimpact of the organization’s activity [21,22].
In these organizations, there was not simply a reference point for their formulation, but alsofor the optimal use of natural resources treated as a priority in the undertaken activities. The wayof formulating environmental policies in Polish public sector organizations is general in its natureand mostly does not directly concern the activities of that particular organization, making it difficultto develop programs of analysis and reduction of the negative impact of their operations on theenvironment. It also makes it difficult to treat projects and programs aimed at the most efficient use ofnatural resources as a priority in business activities. Polish and foreign organizations vary in termsof having data analyzing programs and optimal use of natural resources. The obtained results allowfor rejecting the first hypothesis. Public sector organizations do not set an example of responsiblepractices in respect for the environment. Hypothesis 2 was verified. The results show that public sectororganizations in Poland differ significantly from organizations located outside Poland in terms of theirpractices for the environmental protection. Activities undertaken in Polish organizations allow forclassifying the dominant, in their view, orientation to focus on the past trends, while more than half oforganizations located outside Poland are actively involved in the implementation of current trends.
Others studies show a higher degree of environmental responsibility of public sectororganizations [16]. However, it is really hard to compare the results of the studies because thereare only a few studies which have a multi-country environmental focus [16,17].
8. Limitation of the Study
The research was a trial project. Its aim was to examine the state and prospects for developmentof the Corporate Social Responsibility concept in public sector organizations in Poland and abroad.
333
Sustainability 2016, 8, 19
The issue of environmental responsibility accounted only for a small part of the study. Conductedanalyzes allowed for identifying a general trend in public sector organizations, which, however,requires clarification. Completed studies are in some way a snapshot of organizations and temporaryreflection of the situation. It is necessary to construct reliable indicators of environmental responsibilityand employ them in a given time interval, e.g., two years. This would make it possible to capturecertain trends, as well as a full picture of the examined phenomena. The presented results should beconsidered as a starting point for further, more extensive analyzes.
9. Conclusions
Public sector organizations in Poland do not have internal mechanisms of environmentalresponsibility. Some organizations declare that they have their environmental policy, but it is ofa general nature and does not include the declaration of particular organizations. This situation leadsto the conclusion that first steps in creating environmental responsibility have been taken, and nowfurther steps are awaited. In particular, it concerns public sector organizations located in Poland. Thestudy has identified a significant discrepancy between the state of the environmental responsibility ofcompanies located in Poland and abroad.
Author Contributions: Author Contributions: This work is a result of collaboration between all authors. AuthorLiliana Hawrysz designed the study and wrote the report. Author Joachim Foltys wrote the first draft of themanuscript. Authors Liliana Hawrysz and Joachim Foltys reviewed the draft manuscript. All the authors managedthe literature searches, read and approved the final manuscript.
Conflicts of Interest: Conflicts of Interest: The authors declare no conflict of interest.
References and Notes
1. Grigore, G. Corporate Social Responsibility-strategies in European style. Ann. Univ. Oradea, Econ. Sci. Ser.2008, 17, 662–665.
2. Letter of 4 November 2011 from the Minister for European Affairs and International Cooperation to theHouse of Representatives on Development through Sustainable Enterprise, Parliamentary Papers, House ofRepresentatives, 2011–2012 session, 32 605, No. 56.
3. Analiza Instytucjonalnych Modeli Promocji CSR w Wybranych Krajach, Analiza przygotowanadla Ministerstwa Gospodarki przez CSRinfo. Available online: http://odpowiedzialnybiznes.pl/public/files/analiza_instytucjonalna_promocji_csr_CSRinfo_2011.pdf (accessed on 2 September 2015).(In Polish)
4. Jankovic Milic, V.; Stankovic, J.; Marinkovic, S. The capacity of local governments to improvebusiness environment: Evidence from Serbia. Available online: http://papers.ssrn.com/sol3/papers.cfm?abstract_id=2554337 (accessed on 8 December 2015).
5. Pesmatzoglou, D.; Nikolaou, I.E.; Evangelinos, K.I.; Allan, S. Extractive multinationals and corporatesocial responsibility: A commitment towards achieving the goals of sustainable development or only amanagement strategy? J. Int. Develop. 2014, 26, 187–206.
6. Min, B.S. The effect of outside board members on energy efficiency in Korea. J. Asia-Pacific Bus. 2014, 15,54–72.
7. Shah, K.U. Strategic organizational drivers of corporate environmental responsibility in the Caribbean hotelindustry. Pol. Sci. 2011, 44, 321–344.
8. Comanescu, M. Increasing responsibility towards environment. Theor. Appl. Econ. 2010, 17, 59–72.9. Butcher, B.; Xu, Y. Chinese cooperatives and environmental social responsibility. Chin. Econ. 2014, 47, 63–80.
[CrossRef]10. Banerjee, S. Corporate environmentalism: The construct and its measurement. J. Bus. Resear. 2002, 55,
177–191. [CrossRef]11. Burritt, R.L.; Welch, S. Australian commonwealth entities: An analysis of their environmental disclosures.
Abacus 1997, 33, 69–87. [CrossRef]12. Fortes, H. The need for environmental reporting by companies: an examination of the use of environmental
reports by Swedish public companies. Green Manag. Int. 2002, 40, 77–92.
334
Sustainability 2016, 8, 19
13. Frost, G.R.; Seamer, M. Adoption of environmental reporting and management practices: An analysis ofNew South Wales public sector entities. Financ. Account. Manag. 2002, 18, 103–127. [CrossRef]
14. Lodhia, S.; Jacobs, K.; Park, Y.J. Driving public sector environmental reporting. The disclosure practices ofAustralian commonwealth departments. Pub. Manag. Rev. 2012, 14, 631–647. [CrossRef]
15. Goswami, K.; Lodhia, S. Sustainability disclosure patterns of South Australian local Councils: A case study.Publ. Money Manag. 2014, 34, 273–280. [CrossRef]
16. Lopatta, K.; Jaeschke, R. Sustainability reporting at German and Austrian universities. Int. J. Educ. Econ. Dev.2014, 5, 66–90. [CrossRef]
17. Greiling, D.; Traxler, A.A.; Stötzer, S. Sustainability reporting in the Austrian, German and Swiss publicsector. Int. J. Public Sect. Manag. 2015, 28, 404–428.
18. Carroll, A.B. A three-dimensional conceptual model of corporate social performance. Acad. Manag. Rev.1979, 4, 497–505.
19. Hashmi, M.A.; Al-Habib, M. Sustainability and carbon management practices in the Kingdom of SaudiArabia. J. Environ. Plann. Manag. 2013, 56, 140–157.
20. Moore, M.H. Creating Public Value. Strategic Management in Government; Harvard University Press:Cambridge, MA, USA, 1995; p. 31.
21. Moore, M.H. Public value as the focus of strategy. Aust. J. Pub. Admin. 1994, 53, 296–303.22. Bryson, J.M.; Crosby, B.C.; Bloomberg, L. Public value governance: Moving beyond traditional public
administration and the new public management. Pub. Admin. Rev. 2014, 74, 445–456. [CrossRef]23. Ingram, V.; de Grip, K.; de Wildt, M.R.; Ton, G.; Douma, M.; Boone, K.; van Hoeven, H. Corporate Social
Responsibility: the Role of Public Policy: A Systematic Literature Review of the Effects of Government SupportedInterventions on the Corporate Social Responsibility (CSR) Behaviour of Enterprises in Developing Countries;The Hague: Policy and Operations Evaluation Department (IOB), Ministry of Foreign Affairs of theNetherlands: Amsterdam, The Netherlands, 2013; p. 110.
24. Ward, H. Public Sector Roles in Strengthening Corporate Social Responsibility: Taking Stock. Available online:http://siteresources.worldbank.org/INTPSD/Resources/CSR/Taking_Stock.pdf (accessed on 9 December2015).
25. Fox, T.; Ward, H.; Howard, B. Public Sector Roles in Strengthening Corporate Social Responsibility: A BaselineStudy. Available online: http://www-wds.worldbank.org/external/default/WDSContentServer/WDSP/IB/2005/12/19/000090341_20051219091246/Rendered/PDF/346550CSR1CSR1interior.pdf (accessed on9 December 2015).
26. Elkington, J. Cannibals With Forks: The Triple Bottom Line of the 21st Century Business; Capstone PublishingLtd.: Oxford, UK, 1997.
27. Pesmatzoglou, D.; Nikolaou, I.E.; Evangelinos, K.I.; Allan, S. Extractive multinationals and corporate socialresponsibility: a commitment towards achieving the goals of sustainable development or only a managementstrategy? J. Int. Dev. 2014, 26, 187–206. [CrossRef]
28. Nowakowska, A. The reverse logistics management with RFID application. Adv. Logist. Syst. 2008, 2, 41–46.29. Warszawa. Polityka Ekologiczna Panstwa W Latach 2009-2012, Z Perspektywa Do Roku 2016. Available
online: https://www.mos.gov.pl/g2/big/2009_11/8183a2c86f4d7e2cdf8c3572bdba0bc6.pdf (accessed on2 September 2015).
30. Sulaiman, M.; Mokhtar, N. Ensuring sustainability: A preliminary study of environmental managementaccounting in Malaysia. Int. J. Bus. Manag. Sci. 2012, 5, 85–102.
31. Sands, J.; Lee, K.H. Environmental and sustainability management accounting (EMA) for the developmentof sustainability management and accountability. Issues Soc. Environ. Account. 2015, 9, 1–4.
32. Quental, N.; Lourenço, J.M.; da Silva, F.N. Sustainable development policy: Goals, targets and politicalcycles. Sus. Dev. 2011, 19, 15–29. [CrossRef]
33. Herea, W. Policy and strategy for improving sustainable social development programmes. Environ. Eng.Manag. J. 2010, 9, 861–868.
34. Burghelea, C. Analysis of sustainable tourism (ST) in Romania. Int. Audit. Risk Manag. 2015, 1, 31–42.35. Bass, S. A New Era in Sustainable Development, An IIED Briefing. Available online: http://pubs.iied.org/
pdfs/11071IIED.pdf (accessed on 4 September 2015).
335
Sustainability 2016, 8, 19
36. Schaefer, M.; Goldman, E.; Bartuska, A.M.; Sutton-Grier, A.; Lubchenco, J. Nature as capital: Advancing andincorporating ecosystem services in United States federal policies and programs. Proc. Natl. Acad. Sci. USA2015, 112, 7383–7389. [CrossRef] [PubMed]
37. Sullivan, S. The Natural Capital Myth; or will Accounting Save the World?; The Leverhulme Centre for the Studyof Value School of Environment, Education and Development, The University of Manchester: Oxford, UK,2014.
38. Zhu, X.; van Ierland, E.C. Economic modelling for water quantity and quality management: A welfareprogram approach. Water Resour. Manag. 2012, 26, 2491–2511. [CrossRef]
39. Meena, M.S.; Singh, K.M. Information and communications technologies for natural resources management.J. Environ. Manag. Tour. 2013, 2, 77–92.
40. Calil, J.; Beck, M.W.; Gleason, M.; Merrifield, M.; Klausmeyer, K.; Newkirk, S. Aligning natural resourceconservation and flood hazard mitigation in California. PLoS ONE 2015, 10, 1–14. [CrossRef] [PubMed]
41. Hawrysz, L. Patronage vs. Implementation of the Corporate Social Responsibility (CSR) Concept in the PublicSector. In Proceedings of Advanced Research in Scientific Areas, Zilina, The Slovak Republic, 2–6 December2013; EDIS—Publishing Institution of the University of ZilinaL: Zilina, The Slovak Republic, 2013; Volume 2,pp. 184–187.
42. Hawrysz, L. Rola organizacji sektora publicznego w kształtowaniu społecznej odpowiedzialnosci.Zrównowazony rozwój organizacji-aspekty społeczne 2015. (In Polish) [CrossRef]
© 2016 by the authors. Licensee MDPI, Basel, Switzerland. This article is an open accessarticle distributed under the terms and conditions of the Creative Commons Attribution(CC BY) license (http://creativecommons.org/licenses/by/4.0/).
336
Article
A New Systematic Approach to VulnerabilityAssessment of Innovation Capability ofConstruction Enterprises
Jingxiao Zhang 1,*, Haiyan Xie 2, Klaus Schmidt 2 and Hui Li 1,*
1 Institution of Construction Economics, Chang’an University; NO.161, Chang’an Road, Xi’an 710061, China2 Department of Technology, Illinois State University; Normal, IL 61790, USA; [email protected] (H.X.);
[email protected] (K.S.)* Correspondence: [email protected] (J.Z.); [email protected] (H.L.);
Tel.: +86-159-2973-9877 (J.Z.); +86-159-9138-5822 (H.L.)
Academic Editor: Adam JabłonskiReceived: 5 October 2015; Accepted: 18 December 2015; Published: 25 December 2015
Abstract: The purpose of this research is to study the vulnerability of construction enterprises’innovation capabilities (CEIC) and their respective primary influencing factors. This paper proposeda vulnerability system framework of CEIC, designed two comprehensive assessments for analysis,namely the entropy and set pair analysis method (E-SPA) and the principle cluster analysis andSPA method (P-SPA), and compared grades to verify the vulnerability assessments. Further, thepaper quantitatively assessed the major influencing factors in facilitating management, reducingvulnerability, and improving the ability of construction enterprises to respond to changes in theconstruction industry. The results showed that vulnerability could be effectively and systematicallyevaluated using E-SPA. However, managing or reducing entrepreneurial sensitivity and improvingthe ability to respond was critical to supporting sustainable CEIC. The case studies included in thispaper suggested that in ensuring sustainable CEIC, companies should concentrate on highly educatedhuman resources, R&D investments, intellectual property related innovations, and governmentsupport. This research provided a practical framework and established a sustainable strategy forcompanies to manage their vulnerability in developing innovation capability. In addition, thisresearch presented an innovative and effective way to quantitatively analyze vulnerability whichoffered a foundation to signify a new paradigm shift in construction sustainable development.
Keywords: construction enterprise; innovation capability; vulnerability assessment; innovationuncertainty; sustainable development
1. Introduction
As a critical driver of the sustainable development of a nation, a region, an industry, or anenterprise, innovation can provide a continual basis for sustainable socio-economic development andgrowth. Construction innovation, as a sustainable driver and a crucial condition, represents the pulseof construction economic development of any nation [1–3]. The innovative capabilities of constructionenterprises thus hold a key position in advancing industrial and national development [4,5]. Thecurrent innovation status of the construction industry reflects the complex features of the industry [6].As any nation or region will have demand for continued construction, statistics related to thisconstruction make up a major portion of an economy’s well-being. The innovation accomplishmentsof construction enterprises are affected by the innovation efforts of other firms, and are achievedthrough the continuing cooperation among industries for breakthroughs in products, processes, anddesigns. These breakthroughs reflect the strength and innovative desires and interests of construction
Sustainability 2016, 8, 17; doi:10.3390/su8010017 www.mdpi.com/journal/sustainability337
Sustainability 2016, 8, 17
companies. However, compared to other industries, there is a lack of focus on the diffusion rates ofinnovation in different sectors of construction, such as building and civil infrastructure. Dependingon the developmental level of an economy, the need for civil infrastructure may vary. However,innovation is needed at all levels of economic development [7]. Civil infrastructure companies arelarge in size and have potential for radical innovations, while residential construction companiesare usually small and give limited consideration as to how to effectively convert new research anddevelopment into innovation. Often, large companies do not invest sufficiently in innovation as theyalready dominate a major portion of the existing market. Smaller companies on the other hand need todemonstrate higher degrees of innovation in order to enter or even stay in the market [8]. A similarobservation was made by Hultgren and Tantawi [9] in the study of potential radical innovation inlarge firms.
However, researchers recently noticed that sustainable economic development has its vulnerability,which was considered as a new paradigm shift in the analysis of uncertainty in economic studies ofsystem sensitivity and response capability. Vulnerability research has a wide range of applications,including climate change prediction, natural disaster prevention, food security, and public healthimprovement [10–21]. Generally, innovation vulnerability relates to the risk or uncertainty of acompany’s innovation capability. Therefore, eliminating risks or identifying weaknesses is perhapsa preferred method of overcoming vulnerability. Elimination should, however, not simply lead tothe avoidance of uncertainty when studying innovation capability, because uncertainty can senseor trace new directions or paths of economic development and thereby represents an innovativestrength [18,19]. This new cognitive reasoning requires firms to treat uncertainty as part of innovationcapability and develop a strategy to overcome it, or manage uncertainty instead of eliminating it.Construction entrepreneurs should consider the opportunities stemming from uncertainties as well.With this understanding, it is a crucial prerequisite for successful promotion of construction enterprise’sinnovation capability (CEIC) to develop and implement a strategy when managing the uncertaintythat is part of CEIC. However, there is still a lack of quantitative research to assess the uncertaintyinvolved in innovation, particularly in relation to estimating innovation capability at a firm, industrial,or national level [22,23]. A similar discussion can be found in Costanza et al. [24] ”to say that we shouldnot do valuation of ecosystems is to deny the reality that we already do, always have and cannot avoiddoing so in the future”. The research by Costanza et al. [24] emphasized the importance of quantifyingecosystem values for the support of policy decisions or influencing public opinions. This researchstressed the necessity for quantitative research in innovation uncertainty. This research was based onan inverse perspective of the relationship between uncertainty and innovation capability. Furthermore,it studied the vulnerability of CEIC and worked to build a system approach to assess the vulnerabilityof CEIC [11,13,15–17,20,21,25–27]. This new approach aimed to manage and reduce the vulnerabilityof CEIC and to support the sustainable improvement of CEIC.
In order to assess the vulnerability of CEIC, this research quantitatively analyzed the individualvulnerabilities of the major influence factors of CEIC with the objective to manage and improve theirresponsive abilities. In order to achieve this goal, this research constructed a framework of vulnerabilityof CEIC, using two comprehensive methods of vulnerability assessment in socio-economic research.The two methods were the entropy and set pair analysis method (E-SPA) and the principle clusteranalysis and SPA method (P-SPA). This research also implemented these methods in eight constructionenterprises to analyze their CEIC, and compared the respective results. The results demonstrated thefunctions of the vulnerability framework in the uncertainty analysis of construction innovation. Theresults are applicable to other industries too.
This research expands the field of innovation functions of a company to enhance itscompetitiveness and sustainable development from an inverse perspective when managing innovationrisks. It identified new areas of economic growth with potential broad impact on multiple industries. Atan industrial level, the research may help governments, industrial associations, and other organizationsimplement targeted incentives for innovation planning, to reduce uncertainty and risk, to respond
338
Sustainability 2016, 8, 17
to an innovation-driven service economy, and to promote regional and national innovation. In thelong run, the research can help to enhance the positions of industries and facilitate national innovationstrategies for economic development and restructuring.
The rest of the paper is structured as follows. Section 2 focuses on the review of literature, links ofanalysis levels, and the research agenda. Section 3 provides the research methods. Section 4 builds thevulnerability framework based on the selected theories and methods and implements the researchprocedure and measurements to analyze the vulnerability of CEIC. Section 5 presents the researchresults, summarizes the conclusions, and highlights the implications of vulnerability assessment forinnovation capability in enterprises, and at industrial and national levels.
2. Literature Review
2.1. Innovation and Uncertainty
Enterprises are becoming more specialized than ever before. Based on the technologicalknow-how of a company, competition may lead to additional challenges with respect to innovation andhandling uncertainty. Adaptability paired with innovation therefore becomes a key factor to advancetechnological diversity and the willingness to experiment with new products and services. Accordingto Bell and Pavitt [27], firms rarely fail because of an inability to master a new field of technology, butbecause of the lack of adaptability and responsiveness to new industry demands and the inability toproactively embrace and discover new technological opportunities [28].
Companies are vulnerable to external factors if they are not well prepared or not strategicallyaligned with the new innovative technologies. Companies need to be willing to take risks in orderto succeed in the competitive construction industries. Finding the right approach to balancing riskversus a company’s vulnerability and its innovative capability is key to success. Facing constantcompetition in the advancement of any industry for new technology separates company strategies thatare sustainable from those that are not. Major differences in this approach seem to exist between largerand smaller companies in the same industries since key challenges for the strategic management oftechnology depend on a company’s size and its core business: small firms must focus on defining anddefending their product niche while large firms focus on building and exploiting competences basedon R&D or on complex production or information systems. Companies require continuous learning,the capacity to integrate specialists, and a willingness both to break down established functional anddivisional boundaries and to take a view to the long term [29].
Among a multitude of research, Schumpeter’s concept of long waves, a theory of technicalinnovation and structural change, shows that the successful diffusion of this technology dependson a wide variety of institutional changes. Freeman et al. points to a number of policies includingflexible working hours, training and less restrictive macroeconomic demand policies which wouldhelp to generate higher levels of innovation [30]. This concept could certainly be extended to thesustainability of an innovation friendly company environment. Innovation does not lead to successjust by itself if it is not supported by progressive and flexible federal, regional, and company specificpolicies. Otherwise, potential risk factors or the perception of uncertainty will hinder the advancementand sustainability of a progressive innovative environment.
Nevertheless, innovation processes are often criticized because they do not accurately portraythe process of industry movement, in which there were uncertain and dynamic interactions amongknowledge, resources, and environments [31]. Therefore, striving to remove uncertainty might lead tothe risk of hindering or even completely impeding innovation rather than promoting it. Despite muchsuccess in overcoming uncertainty, it has become clear that uncertainties can never be completelyremoved. Instead, uncertainty keeps emerging in new forms accompanying complex scientificprocesses, organization structures, and technical systems. Strategies should be prepared at differentlevels of acceptance of uncertainty and be utilized to benefit social-economic developments [18].Uncertainty is not a deficiency, but a structural feature embedded in any entrepreneurial entity.
339
Sustainability 2016, 8, 17
Likewise, uncertainty is not strictly a shortcoming, rather an important factor that can lead to growth.The endeavor to eliminate uncertainty holds the risk of jeopardizing rather than promoting innovation.
Dealing with uncertainty is a continuous process for construction innovation. The concept ofcoping with uncertainty, as opposed to removing it through planning and control, was presented andsubstantiated by Bohle [32]. This new cognitive approach to manage uncertainty in innovationprocesses is not just wishful thinking. For example, Bohle [32] proposed approaches such asexperience-led and subject-based actions in project management. They provided new ways ofdealing with uncertainty in project management. However, these methods have barely been furtherdeveloped into quantitative instruments for systematic promotion of innovation processes [32].This paper developed a new system with quantitative methods to manage the uncertainty inconstruction innovation. Meanwhile, the system has the ability to react and overcome uncertainty withcountermeasures, instead of eliminating uncertainty which might weaken the power of innovation.
2.2. Vulnerability
As an emerging area, systematic studies of vulnerability began with research on natural disasters,with the purpose to achieve sustainable development of the environment through reducing uncertainty,sensitivity, and vulnerability [10]. At present, scholars widely use the methodologies of vulnerabilityresearch to explore economic domains, such as financial vulnerability and household vulnerability [10,21,33–35]. For example, Dominitz and Manski [17] first discussed the vulnerability of a country’seconomic system. United Nations Development Programme (UNDP) [35] defined the concept ofeconomic vulnerability as the capability to suffer the damage due to the impact of unanticipated eventsin the process of economic development. Vulnerability relates to the sensitivity to disturbance insideand outside of a system and the lack of capability to respond to make necessary changes to the system’sstructure and functions. In addition, sensitivity and adaptability are key components of the evaluationof the vulnerability of a system [14,16,21,33,34,36–39].
Vulnerability management includes the assessment of a system’s sensitivity and adaptability bymanaging or restricting the potential hazards to realize the systematic promotion in the political, social,economic, or environmental fields. In recent years, examples of systems for which vulnerabilityassessments were performed include, but are not limited to, climate changes, natural disasters,ecological crises, food security, and public health. The research methods used include compositeindex method, fuzzy method, scenario analysis, and input-output method [14,16,21,25,33,34,36–39].Such assessments were conducted on behalf of a range of different organizations, from small businessesto large enterprises. For example, Gnangnon [25] endowed different weights to various economicgrowth-indicators to calculate economic vulnerability indices in developing countries. Turner et al. [21]proposed a framework of factors and linkages to study the potential effects of the vulnerability ofa couple of human–environment systems which was also related to the sensitivity and resilience ofthe system.
However, innovation capability is an important driver of any economic system, and the assessmentof the vulnerability of innovation capability has not drawn enough attention, especially in regardsto CEIC. Therefore, it is urgent to study how to measure the level of vulnerability, select indices, andmanage index information to conduct a vulnerability assessment of CEIC. In this research, the authorsfirst selected indices of vulnerability by using the entropy method. The entropy method is a commonmethod to generate the objective weight of index system [40,41]. The next method used in this researchis Set Pair Analysis (SPA), which is a novel method to target the uncertainty in a system [42,43]. Thecore thought of set pair analysis was to treat the confirmed uncertainty of the object to be studied as aconfirmed uncertainty system, and to analyze and study the connection and conversion of the researchobjects for the similarities and differences. The core concept of set pair analysis was the set pair and theconnection degree [42]. Another comparison method of principle cluster analysis (PCA) was also usedto assess vulnerability. PCA assessment is usually used for the vulnerability assessment of tourism
340
Sustainability 2016, 8, 17
economic systems or city economic systems [38,44–47]. Using Entropy SPA (E-SPA) and PCA-SPA(P-SPA), the authors analyzed cases of large construction companies to reveal their vulnerability levels.
2.3. Construction Enterprise’s Innovation Capability (CEIC)
From a system point of view, construction innovation capabilities at firm, regional, and nationallevels are three closely related categories, which support and influence each other, characterized bygeneral factors to realize the overall achievement of sustainable innovation. In innovation systems,the national, regional or industrial technical changes and economic growth are the outcomes ofthe innovation activities that take place among all firms. However, the changes are not simply thesummation of firm-level innovation capabilities, but the result of their interactions at national, regionalor industrial levels instead. At national or regional levels, innovation measurements are calculated byagencies such as European Innovation Scoreboard [48], OECD STI Outlook [49], Nordic InnovationMonitor [50], UNCTAD indicators [51] and World Bank indicators [52]. The measured innovationefficiencies refer to innovation input and output, innovation activity, innovation environment, etc. withrelevant indicators.
CEIC can be used as an important carrier for national and regional innovation strategies. It isusually implemented at a micro level to foster, form, and upgrade innovation capabilities [3,23,53–58],such as innovation environments, innovation investment capabilities, cooperative innovationcapabilities, intellectual property capabilities, and change-innovation capabilities [1]. Innovationcapabilities enable construction enterprises to create, deploy, and maintain advantageous businessperformance in the long run. The representations of innovation capabilities, such as distinctskills, processes, procedures, organizational structures, decision rules, and disciplines, undergirdenterprise-level sensing, seizing, and reconfiguring capacities.
At the enterprise-level, there are three main types of studies that focused on constructioninnovation capability. The first type of studies concentrated on analyzing and evaluating the majorchanges in overall innovation capability and specified the current status and history of innovationcapability, e.g., international comparative study [59–61]. The second type of studies focused on theevaluations of enterprise innovation capabilities in key sectors (or areas), a.k.a. primary businesses’innovation. For example, equipment manufacturing, strategic approaches for emerging markets, andprocess plant construction are considered as business innovation [1,2,4,62–65]. The third type focusedon evaluating and comparing the different types and sizes of CEIC [53,66–71], such as domesticand foreign-funded enterprises, large, small-and-medium and micro enterprises, or state-owned andprivate enterprises.
In terms of types of constitution, CEIC refers to industrial innovation, technological innovation,system innovation, organizational innovation, and collaborative innovation [1,3,72,73]. Theparticipants of CEIC involve government, business, universities, individuals, and community groups.The input factors of CEIC include capital investment, intellectual property, training, human resources(HR), etc. Researchers noticed that CEIC contributed to the enhancement of national competitiveadvantage, optimization of industrial resource allocation and the employment market, reduction ofenergy dissipation and pollution, and improvement of social welfare [3]. The systematic framework ofCEIC gradually transited from individual and closed-end efforts into open-ended and multilateralcooperative processes. The multilateral interactions help to form the cooperative effects to improvethe efficiency of labor, information, knowledge, technology, management and capital to implementCEIC strategies [4,74,75]. Even though the above studies focused on product capability, technologypatents, knowledge transfer, university–industry–government cooperation, or output efficiency, thereis still deficiency in holistic understanding of the social and organizational aspects of innovations. Forexample, as an important innovation resource, HR and the associated working conditions becomekey enablers and central factors of innovations. So, instead of studying the individual parametersof production, technology, and organization etc., this research studied CEICs systematically in aframework. Additionally, the generic innovation models [71,76] put forward that the frameworks with
341
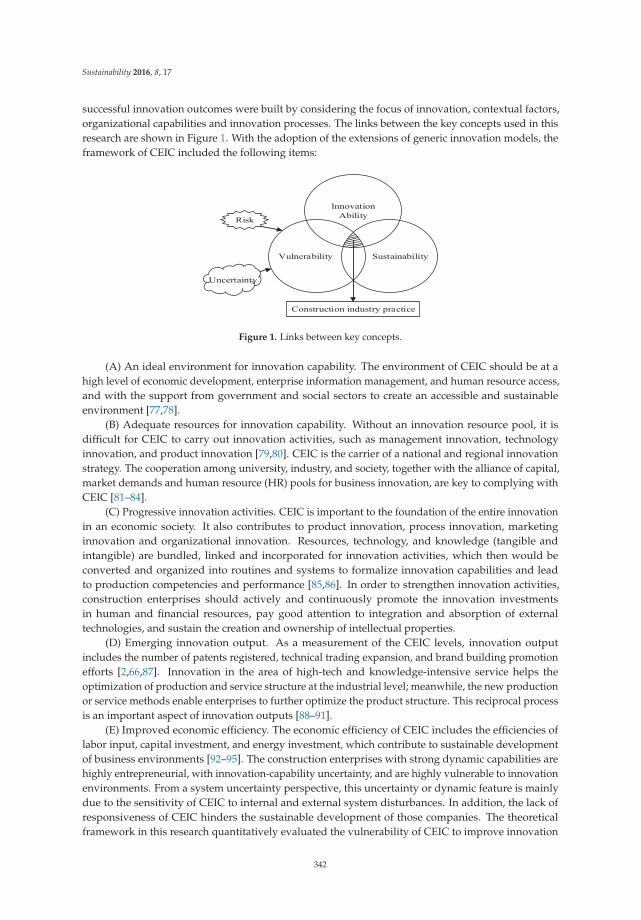
Sustainability 2016, 8, 17
successful innovation outcomes were built by considering the focus of innovation, contextual factors,organizational capabilities and innovation processes. The links between the key concepts used in thisresearch are shown in Figure 1. With the adoption of the extensions of generic innovation models, theframework of CEIC included the following items:
InnovationAbility
Vulnerability Sustainability
Construction industry practice
Risk
Uncertainty
Figure 1. Links between key concepts.
(A) An ideal environment for innovation capability. The environment of CEIC should be at ahigh level of economic development, enterprise information management, and human resource access,and with the support from government and social sectors to create an accessible and sustainableenvironment [77,78].
(B) Adequate resources for innovation capability. Without an innovation resource pool, it isdifficult for CEIC to carry out innovation activities, such as management innovation, technologyinnovation, and product innovation [79,80]. CEIC is the carrier of a national and regional innovationstrategy. The cooperation among university, industry, and society, together with the alliance of capital,market demands and human resource (HR) pools for business innovation, are key to complying withCEIC [81–84].
(C) Progressive innovation activities. CEIC is important to the foundation of the entire innovationin an economic society. It also contributes to product innovation, process innovation, marketinginnovation and organizational innovation. Resources, technology, and knowledge (tangible andintangible) are bundled, linked and incorporated for innovation activities, which then would beconverted and organized into routines and systems to formalize innovation capabilities and leadto production competencies and performance [85,86]. In order to strengthen innovation activities,construction enterprises should actively and continuously promote the innovation investmentsin human and financial resources, pay good attention to integration and absorption of externaltechnologies, and sustain the creation and ownership of intellectual properties.
(D) Emerging innovation output. As a measurement of the CEIC levels, innovation outputincludes the number of patents registered, technical trading expansion, and brand building promotionefforts [2,66,87]. Innovation in the area of high-tech and knowledge-intensive service helps theoptimization of production and service structure at the industrial level; meanwhile, the new productionor service methods enable enterprises to further optimize the product structure. This reciprocal processis an important aspect of innovation outputs [88–91].
(E) Improved economic efficiency. The economic efficiency of CEIC includes the efficiencies oflabor input, capital investment, and energy investment, which contribute to sustainable developmentof business environments [92–95]. The construction enterprises with strong dynamic capabilities arehighly entrepreneurial, with innovation-capability uncertainty, and are highly vulnerable to innovationenvironments. From a system uncertainty perspective, this uncertainty or dynamic feature is mainlydue to the sensitivity of CEIC to internal and external system disturbances. In addition, the lack ofresponsiveness of CEIC hinders the sustainable development of those companies. The theoreticalframework in this research quantitatively evaluated the vulnerability of CEIC to improve innovation
342
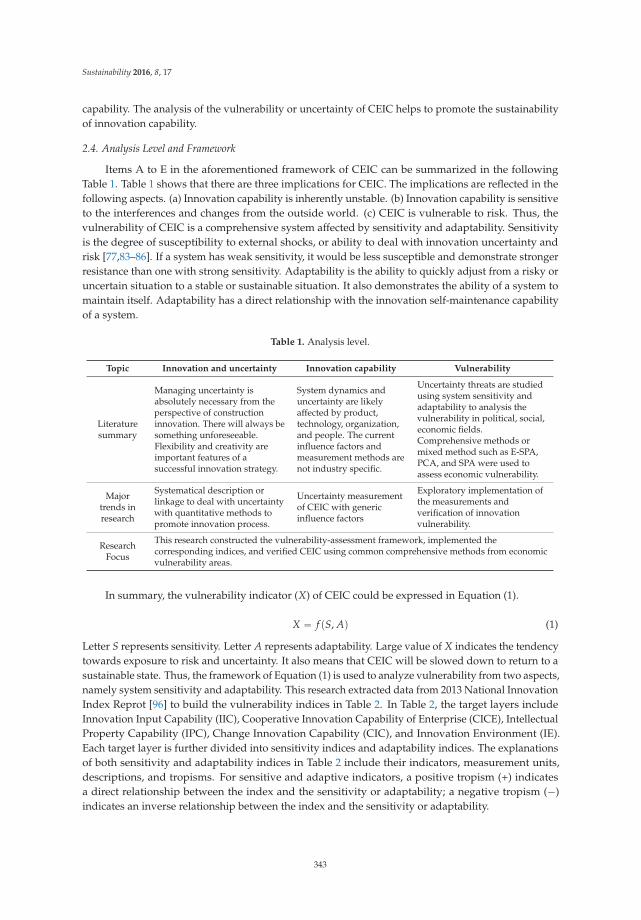
Sustainability 2016, 8, 17
capability. The analysis of the vulnerability or uncertainty of CEIC helps to promote the sustainabilityof innovation capability.
2.4. Analysis Level and Framework
Items A to E in the aforementioned framework of CEIC can be summarized in the followingTable 1. Table 1 shows that there are three implications for CEIC. The implications are reflected in thefollowing aspects. (a) Innovation capability is inherently unstable. (b) Innovation capability is sensitiveto the interferences and changes from the outside world. (c) CEIC is vulnerable to risk. Thus, thevulnerability of CEIC is a comprehensive system affected by sensitivity and adaptability. Sensitivityis the degree of susceptibility to external shocks, or ability to deal with innovation uncertainty andrisk [77,83–86]. If a system has weak sensitivity, it would be less susceptible and demonstrate strongerresistance than one with strong sensitivity. Adaptability is the ability to quickly adjust from a risky oruncertain situation to a stable or sustainable situation. It also demonstrates the ability of a system tomaintain itself. Adaptability has a direct relationship with the innovation self-maintenance capabilityof a system.
Table 1. Analysis level.
Topic Innovation and uncertainty Innovation capability Vulnerability
Literaturesummary
Managing uncertainty isabsolutely necessary from theperspective of constructioninnovation. There will always besomething unforeseeable.Flexibility and creativity areimportant features of asuccessful innovation strategy.
System dynamics anduncertainty are likelyaffected by product,technology, organization,and people. The currentinfluence factors andmeasurement methods arenot industry specific.
Uncertainty threats are studiedusing system sensitivity andadaptability to analysis thevulnerability in political, social,economic fields.Comprehensive methods ormixed method such as E-SPA,PCA, and SPA were used toassess economic vulnerability.
Majortrends inresearch
Systematical description orlinkage to deal with uncertaintywith quantitative methods topromote innovation process.
Uncertainty measurementof CEIC with genericinfluence factors
Exploratory implementation ofthe measurements andverification of innovationvulnerability.
ResearchFocus
This research constructed the vulnerability-assessment framework, implemented thecorresponding indices, and verified CEIC using common comprehensive methods from economicvulnerability areas.
In summary, the vulnerability indicator (X) of CEIC could be expressed in Equation (1).
X “ f pS, Aq (1)
Letter S represents sensitivity. Letter A represents adaptability. Large value of X indicates the tendencytowards exposure to risk and uncertainty. It also means that CEIC will be slowed down to return to asustainable state. Thus, the framework of Equation (1) is used to analyze vulnerability from two aspects,namely system sensitivity and adaptability. This research extracted data from 2013 National InnovationIndex Reprot [96] to build the vulnerability indices in Table 2. In Table 2, the target layers includeInnovation Input Capability (IIC), Cooperative Innovation Capability of Enterprise (CICE), IntellectualProperty Capability (IPC), Change Innovation Capability (CIC), and Innovation Environment (IE).Each target layer is further divided into sensitivity indices and adaptability indices. The explanationsof both sensitivity and adaptability indices in Table 2 include their indicators, measurement units,descriptions, and tropisms. For sensitive and adaptive indicators, a positive tropism (+) indicatesa direct relationship between the index and the sensitivity or adaptability; a negative tropism (´)indicates an inverse relationship between the index and the sensitivity or adaptability.
343
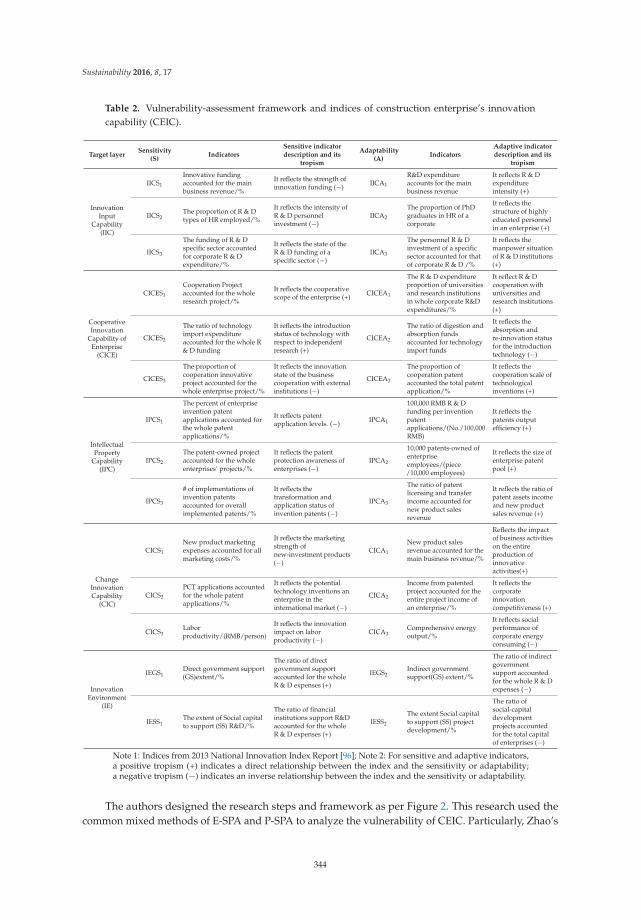
Sustainability 2016, 8, 17
Table 2. Vulnerability-assessment framework and indices of construction enterprise’s innovationcapability (CEIC).
Target layerSensitivity
(S)Indicators
Sensitive indicatordescription and its
tropism
Adaptability(A)
IndicatorsAdaptive indicatordescription and its
tropism
InnovationInput
Capability(IIC)
IICS1
Innovative fundingaccounted for the mainbusiness revenue/%
It reflects the strength ofinnovation funding (´) IICA1
R&D expenditureaccounts for the mainbusiness revenue
It reflects R & Dexpenditureintensity (+)
IICS2The proportion of R & Dtypes of HR employed/%
It reflects the intensity ofR & D personnelinvestment (´)
IICA2
The proportion of PhDgraduates in HR of acorporate
It reflects thestructure of highlyeducated personnelin an enterprise (+)
IICS3
The funding of R & Dspecific sector accountedfor corporate R & Dexpenditure/%
It reflects the state of theR & D funding of aspecific sector (´)
IICA3
The personnel R & Dinvestment of a specificsector accounted for thatof corporate R & D /%
It reflects themanpower situationof R & D institutions(+)
CooperativeInnovation
Capability ofEnterprise
(CICE)
CICES1
Cooperation Projectaccounted for the wholeresearch project/%
It reflects the cooperativescope of the enterprise (+) CICEA1
The R & D expenditureproportion of universitiesand research institutionsin whole corporate R&Dexpenditures/%
It reflect R & Dcooperation withuniversities andresearch institutions(+)
CICES2
The ratio of technologyimport expenditureaccounted for the whole R& D funding
It reflects the introductionstatus of technology withrespect to independentresearch (+)
CICEA2
The ratio of digestion andabsorption fundsaccounted for technologyimport funds
It reflects theabsorption andre-innovation statusfor the introductiontechnology (´)
CICES3
The proportion ofcooperation innovativeproject accounted for thewhole enterprise project/%
It reflects the innovationstate of the businesscooperation with externalinstitutions (´)
CICEA3
The proportion ofcooperation patentaccounted the total patentapplication/%
It reflects thecooperation scale oftechnologicalinventions (+)
IntellectualProperty
Capability(IPC)
IPCS1
The percent of enterpriseinvention patentapplications accounted forthe whole patentapplications/%
It reflects patentapplication levels. (´) IPCA1
100,000 RMB R & Dfunding per inventionpatentapplications/(No./100,000RMB)
It reflects thepatents outputefficiency (+)
IPCS2
The patent-owned projectaccounted for the wholeenterprises’ projects/%
It reflects the patentprotection awareness ofenterprises (´)
IPCA2
10,000 patents-owned ofenterpriseemployees/(piece/10,000 employees)
It reflects the size ofenterprise patentpool (+)
IPCS3
# of implementations ofinvention patentsaccounted for overallimplemented patents/%
It reflects thetransformation andapplication status ofinvention patents (´)
IPCA3
The ratio of patentlicensing and transferincome accounted fornew product salesrevenue
It reflects the ratio ofpatent assets incomeand new productsales revenue (+)
ChangeInnovationCapability
(CIC)
CICS1
New product marketingexpenses accounted for allmarketing costs/%
It reflects the marketingstrength ofnew-investment products(´)
CICA1
New product salesrevenue accounted for themain business revenue/%
Reflects the impactof business activitieson the entireproduction ofinnovativeactivities(+)
CICS2
PCT applications accountedfor the whole patentapplications/%
It reflects the potentialtechnology inventions anenterprise in theinternational market (´)
CICA2
Income from patentedproject accounted for theentire project income ofan enterprise/%
It reflects thecorporateinnovationcompetitiveness (+)
CICS3Laborproductivity/(RMB/person)
It reflects the innovationimpact on laborproductivity (´)
CICA3Comprehensive energyoutput/%
It reflects socialperformance ofcorporate energyconsuming (´)
InnovationEnvironment
(IE)
IEGS1Direct government support(GS)extent/%
The ratio of directgovernment supportaccounted for the wholeR & D expenses (+)
IEGS2Indirect governmentsupport(GS) extent/%
The ratio of indirectgovernmentsupport accountedfor the whole R & Dexpenses (´)
IESS1The extent of Social capitalto support (SS) R&D/%
The ratio of financialinstitutions support R&Daccounted for the wholeR & D expenses (+)
IESS2
The extent Social capitalto support (SS) projectdevelopment/%
The ratio ofsocial-capitaldevelopmentprojects accountedfor the total capitalof enterprises (´)
Note 1: Indices from 2013 National Innovation Index Report [96]; Note 2: For sensitive and adaptive indicators,a positive tropism (+) indicates a direct relationship between the index and the sensitivity or adaptability;a negative tropism (´) indicates an inverse relationship between the index and the sensitivity or adaptability.
The authors designed the research steps and framework as per Figure 2. This research used thecommon mixed methods of E-SPA and P-SPA to analyze the vulnerability of CEIC. Particularly, Zhao’s
344
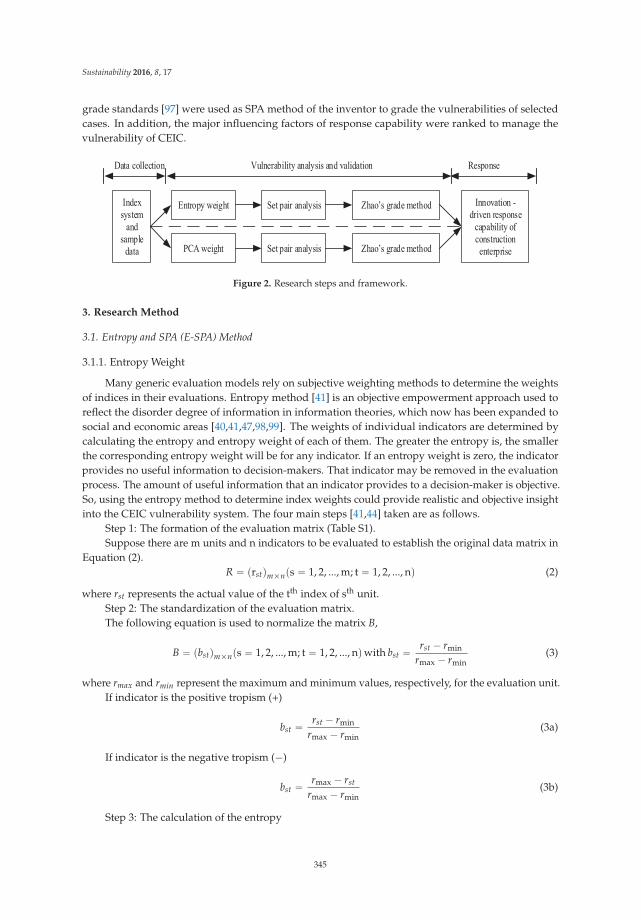
Sustainability 2016, 8, 17
grade standards [97] were used as SPA method of the inventor to grade the vulnerabilities of selectedcases. In addition, the major influencing factors of response capability were ranked to manage thevulnerability of CEIC.
Index system
and sample
data
Entropy weight
PCA weight
Set pair analysis Zhao’s grade method
Set pair analysis Zhao’s grade method
Innovation -driven response
capability of construction enterprise
Data collection Vulnerability analysis and validation Response
Figure 2. Research steps and framework.
3. Research Method
3.1. Entropy and SPA (E-SPA) Method
3.1.1. Entropy Weight
Many generic evaluation models rely on subjective weighting methods to determine the weightsof indices in their evaluations. Entropy method [41] is an objective empowerment approach used toreflect the disorder degree of information in information theories, which now has been expanded tosocial and economic areas [40,41,47,98,99]. The weights of individual indicators are determined bycalculating the entropy and entropy weight of each of them. The greater the entropy is, the smallerthe corresponding entropy weight will be for any indicator. If an entropy weight is zero, the indicatorprovides no useful information to decision-makers. That indicator may be removed in the evaluationprocess. The amount of useful information that an indicator provides to a decision-maker is objective.So, using the entropy method to determine index weights could provide realistic and objective insightinto the CEIC vulnerability system. The four main steps [41,44] taken are as follows.
Step 1: The formation of the evaluation matrix (Table S1).Suppose there are m units and n indicators to be evaluated to establish the original data matrix in
Equation (2).R “ prstqmˆnps “ 1, 2, ..., m; t “ 1, 2, ..., nq (2)
where rst represents the actual value of the tth index of sth unit.Step 2: The standardization of the evaluation matrix.The following equation is used to normalize the matrix B,
B “ pbstqmˆnps “ 1, 2, ..., m; t “ 1, 2, ..., nq with bst “ rst ´ rmin
rmax ´ rmin(3)
where rmax and rmin represent the maximum and minimum values, respectively, for the evaluation unit.If indicator is the positive tropism (+)
bst “ rst ´ rmin
rmax ´ rmin(3a)
If indicator is the negative tropism (´)
bst “ rmax ´ rst
rmax ´ rmin(3b)
Step 3: The calculation of the entropy
345
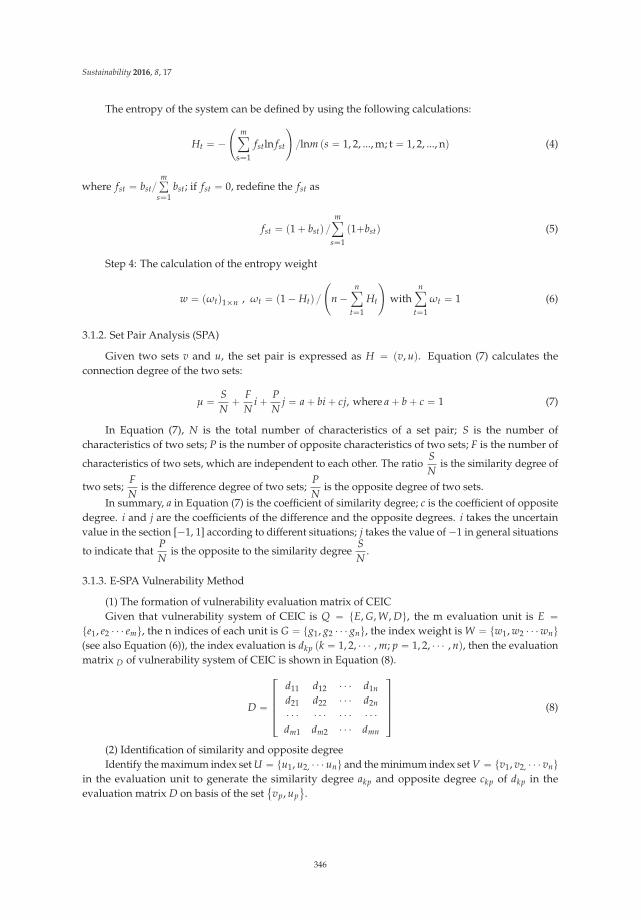
Sustainability 2016, 8, 17
The entropy of the system can be defined by using the following calculations:
Ht “ ´˜
mÿs“1
fstln fst
¸{lnm ps “ 1, 2, ..., m; t “ 1, 2, ..., nq (4)
where fst “ bst{mř
s“1bst; if fst “ 0, redefine the fst as
fst “ p1 ` bstq {mÿ
s“1
p1`bstq (5)
Step 4: The calculation of the entropy weight
w “ pωtq1ˆn , ωt “ p1 ´ Htq {˜
n ´nÿ
t“1
Ht
¸with
nÿt“1
ωt “ 1 (6)
3.1.2. Set Pair Analysis (SPA)
Given two sets v and u, the set pair is expressed as H “ pv, uq. Equation (7) calculates theconnection degree of the two sets:
μ “ SN
` FN
i ` PN
j “ a ` bi ` cj, where a ` b ` c “ 1 (7)
In Equation (7), N is the total number of characteristics of a set pair; S is the number ofcharacteristics of two sets; P is the number of opposite characteristics of two sets; F is the number of
characteristics of two sets, which are independent to each other. The ratioSN
is the similarity degree of
two sets;FN
is the difference degree of two sets;PN
is the opposite degree of two sets.In summary, a in Equation (7) is the coefficient of similarity degree; c is the coefficient of opposite
degree. i and j are the coefficients of the difference and the opposite degrees. i takes the uncertainvalue in the section [´1, 1] according to different situations; j takes the value of ´1 in general situations
to indicate thatPN
is the opposite to the similarity degreeSN
.
3.1.3. E-SPA Vulnerability Method
(1) The formation of vulnerability evaluation matrix of CEICGiven that vulnerability system of CEIC is Q “ tE, G, W, Du, the m evaluation unit is E “
te1, e2 ¨ ¨ ¨ emu, the n indices of each unit is G “ tg1, g2 ¨ ¨ ¨ gnu, the index weight is W “ tw1, w2 ¨ ¨ ¨ wnu(see also Equation (6)), the index evaluation is dkp pk “ 1, 2, ¨ ¨ ¨ , m; p “ 1, 2, ¨ ¨ ¨ , nq, then the evaluationmatrix D of vulnerability system of CEIC is shown in Equation (8).
D “
»———–
d11 d12 ¨ ¨ ¨ d1nd21 d22 ¨ ¨ ¨ d2n¨ ¨ ¨ ¨ ¨ ¨ ¨ ¨ ¨ ¨ ¨ ¨dm1 dm2 ¨ ¨ ¨ dmn
fiffiffiffifl (8)
(2) Identification of similarity and opposite degreeIdentify the maximum index set U “ tu1, u2, ¨ ¨ ¨ unu and the minimum index set V “ tv1, v2, ¨ ¨ ¨ vnu
in the evaluation unit to generate the similarity degree akp and opposite degree ckp of dkp in theevaluation matrix D on basis of the set
�vp, up
(.
346
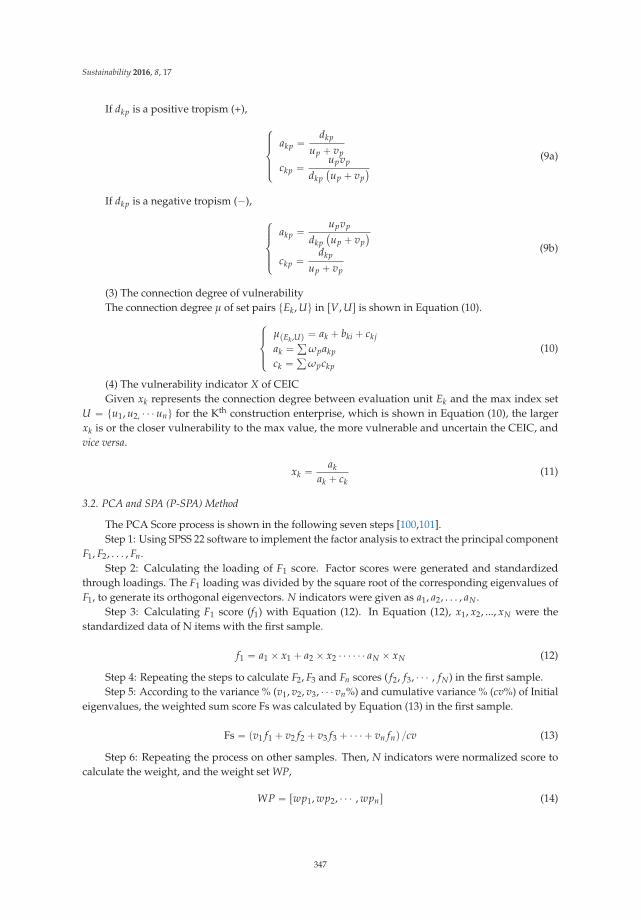
Sustainability 2016, 8, 17
If dkp is a positive tropism (+),
$’’&’’%
akp “ dkp
up ` vp
ckp “ upvp
dkp`up ` vp
˘ (9a)
If dkp is a negative tropism (´),
$’’&’’%
akp “ upvp
dkp`up ` vp
˘ckp “ dkp
up ` vp
(9b)
(3) The connection degree of vulnerabilityThe connection degree μ of set pairs tEk, Uu in rV, Us is shown in Equation (10).$’&
’%μpEk ,Uq “ ak ` bki ` ckj
ak “ řωpakp
ck “ řωpckp
(10)
(4) The vulnerability indicator X of CEICGiven xk represents the connection degree between evaluation unit Ek and the max index set
U “ tu1, u2, ¨ ¨ ¨ unu for the Kth construction enterprise, which is shown in Equation (10), the largerxk is or the closer vulnerability to the max value, the more vulnerable and uncertain the CEIC, andvice versa.
xk “ akak ` ck
(11)
3.2. PCA and SPA (P-SPA) Method
The PCA Score process is shown in the following seven steps [100,101].Step 1: Using SPSS 22 software to implement the factor analysis to extract the principal component
F1, F2, . . . , Fn.Step 2: Calculating the loading of F1 score. Factor scores were generated and standardized
through loadings. The F1 loading was divided by the square root of the corresponding eigenvalues ofF1, to generate its orthogonal eigenvectors. N indicators were given as a1, a2, . . . , aN .
Step 3: Calculating F1 score (f1) with Equation (12). In Equation (12), x1, x2, ..., xN were thestandardized data of N items with the first sample.
f1 “ a1 ˆ x1 ` a2 ˆ x2 ¨ ¨ ¨ ¨ ¨ ¨ aN ˆ xN (12)
Step 4: Repeating the steps to calculate F2, F3 and Fn scores ( f2, f3, ¨ ¨ ¨ , fN) in the first sample.Step 5: According to the variance % (v1, v2, v3, ¨ ¨ ¨ vn%) and cumulative variance % (cv%) of Initial
eigenvalues, the weighted sum score Fs was calculated by Equation (13) in the first sample.
Fs “ pv1 f1 ` v2 f2 ` v3 f3 ` ¨ ¨ ¨ ` vn fnq {cv (13)
Step 6: Repeating the process on other samples. Then, N indicators were normalized score tocalculate the weight, and the weight set WP,
WP “ rwp1, wp2, ¨ ¨ ¨ , wpns (14)
347
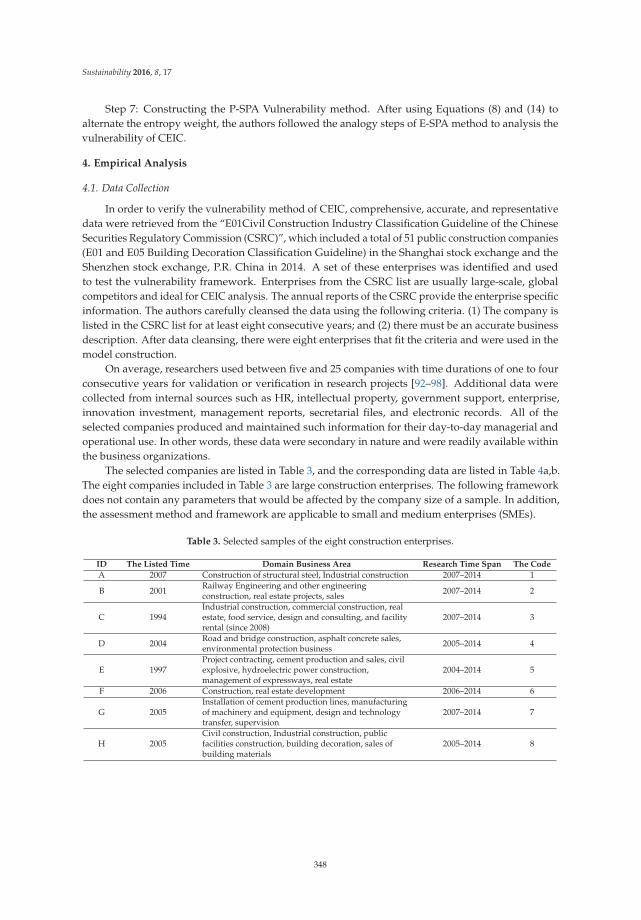
Sustainability 2016, 8, 17
Step 7: Constructing the P-SPA Vulnerability method. After using Equations (8) and (14) toalternate the entropy weight, the authors followed the analogy steps of E-SPA method to analysis thevulnerability of CEIC.
4. Empirical Analysis
4.1. Data Collection
In order to verify the vulnerability method of CEIC, comprehensive, accurate, and representativedata were retrieved from the “E01Civil Construction Industry Classification Guideline of the ChineseSecurities Regulatory Commission (CSRC)”, which included a total of 51 public construction companies(E01 and E05 Building Decoration Classification Guideline) in the Shanghai stock exchange and theShenzhen stock exchange, P.R. China in 2014. A set of these enterprises was identified and usedto test the vulnerability framework. Enterprises from the CSRC list are usually large-scale, globalcompetitors and ideal for CEIC analysis. The annual reports of the CSRC provide the enterprise specificinformation. The authors carefully cleansed the data using the following criteria. (1) The company islisted in the CSRC list for at least eight consecutive years; and (2) there must be an accurate businessdescription. After data cleansing, there were eight enterprises that fit the criteria and were used in themodel construction.
On average, researchers used between five and 25 companies with time durations of one to fourconsecutive years for validation or verification in research projects [92–98]. Additional data werecollected from internal sources such as HR, intellectual property, government support, enterprise,innovation investment, management reports, secretarial files, and electronic records. All of theselected companies produced and maintained such information for their day-to-day managerial andoperational use. In other words, these data were secondary in nature and were readily available withinthe business organizations.
The selected companies are listed in Table 3, and the corresponding data are listed in Table 4a,b.The eight companies included in Table 3 are large construction enterprises. The following frameworkdoes not contain any parameters that would be affected by the company size of a sample. In addition,the assessment method and framework are applicable to small and medium enterprises (SMEs).
Table 3. Selected samples of the eight construction enterprises.
ID The Listed Time Domain Business Area Research Time Span The Code
A 2007 Construction of structural steel, Industrial construction 2007–2014 1
B 2001 Railway Engineering and other engineeringconstruction, real estate projects, sales 2007–2014 2
C 1994Industrial construction, commercial construction, realestate, food service, design and consulting, and facilityrental (since 2008)
2007–2014 3
D 2004 Road and bridge construction, asphalt concrete sales,environmental protection business 2005–2014 4
E 1997Project contracting, cement production and sales, civilexplosive, hydroelectric power construction,management of expressways, real estate
2004–2014 5
F 2006 Construction, real estate development 2006–2014 6
G 2005Installation of cement production lines, manufacturingof machinery and equipment, design and technologytransfer, supervision
2007–2014 7
H 2005Civil construction, Industrial construction, publicfacilities construction, building decoration, sales ofbuilding materials
2005–2014 8
348
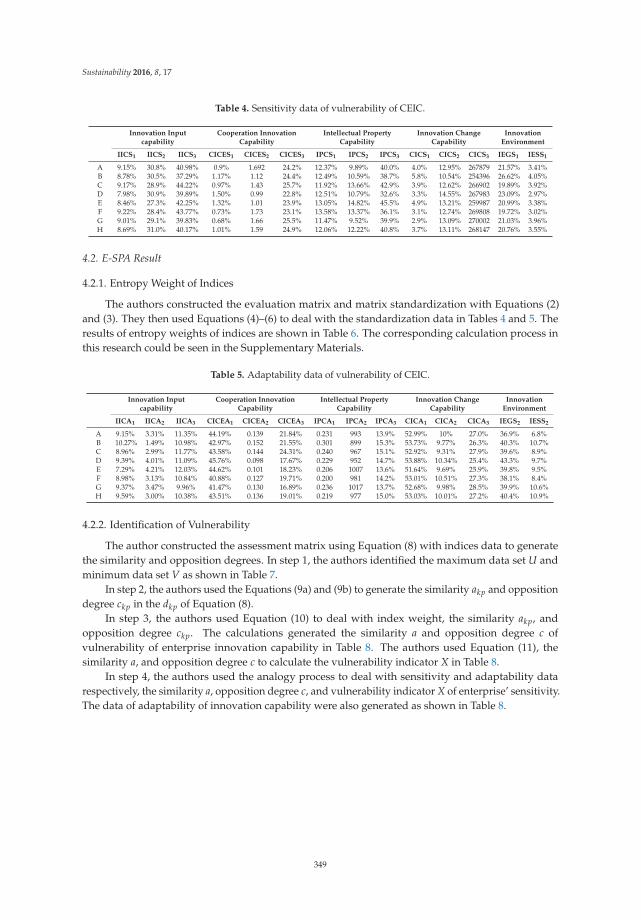
Sustainability 2016, 8, 17
Table 4. Sensitivity data of vulnerability of CEIC.
Innovation Inputcapability
Cooperation InnovationCapability
Intellectual PropertyCapability
Innovation ChangeCapability
InnovationEnvironment
IICS1 IICS2 IICS3 CICES1 CICES2 CICES3 IPCS1 IPCS2 IPCS3 CICS1 CICS2 CICS3 IEGS1 IESS1
A 9.15% 30.8% 40.98% 0.9% 1.692 24.2% 12.37% 9.89% 40.0% 4.0% 12.95% 267879 21.57% 3.41%B 8.78% 30.5% 37.29% 1.17% 1.12 24.4% 12.49% 10.59% 38.7% 5.8% 10.54% 254396 26.62% 4.05%C 9.17% 28.9% 44.22% 0.97% 1.43 25.7% 11.92% 13.66% 42.9% 3.9% 12.62% 266902 19.89% 3.92%D 7.98% 30.9% 39.89% 1.50% 0.99 22.8% 12.51% 10.79% 32.6% 3.3% 14.55% 267983 23.09% 2.97%E 8.46% 27.3% 42.25% 1.32% 1.01 23.9% 13.05% 14.82% 45.5% 4.9% 13.21% 259987 20.99% 3.38%F 9.22% 28.4% 43.77% 0.73% 1.73 23.1% 13.58% 13.37% 36.1% 3.1% 12.74% 269808 19.72% 3.02%G 9.01% 29.1% 39.83% 0.68% 1.66 25.5% 11.47% 9.52% 39.9% 2.9% 13.09% 270002 21.03% 3.96%H 8.69% 31.0% 40.17% 1.01% 1.59 24.9% 12.06% 12.22% 40.8% 3.7% 13.11% 268147 20.76% 3.55%
4.2. E-SPA Result
4.2.1. Entropy Weight of Indices
The authors constructed the evaluation matrix and matrix standardization with Equations (2)and (3). They then used Equations (4)–(6) to deal with the standardization data in Tables 4 and 5. Theresults of entropy weights of indices are shown in Table 6. The corresponding calculation process inthis research could be seen in the Supplementary Materials.
Table 5. Adaptability data of vulnerability of CEIC.
Innovation Inputcapability
Cooperation InnovationCapability
Intellectual PropertyCapability
Innovation ChangeCapability
InnovationEnvironment
IICA1 IICA2 IICA3 CICEA1 CICEA2 CICEA3 IPCA1 IPCA2 IPCA3 CICA1 CICA2 CICA3 IEGS2 IESS2
A 9.15% 3.31% 11.35% 44.19% 0.139 21.84% 0.231 993 13.9% 52.99% 10% 27.0% 36.9% 6.8%B 10.27% 1.49% 10.98% 42.97% 0.152 21.55% 0.301 899 15.3% 53.73% 9.77% 26.3% 40.3% 10.7%C 8.96% 2.99% 11.77% 43.58% 0.144 24.31% 0.240 967 15.1% 52.92% 9.31% 27.9% 39.6% 8.9%D 9.39% 4.01% 11.09% 45.76% 0.098 17.67% 0.229 952 14.7% 53.88% 10.34% 25.4% 43.3% 9.7%E 7.29% 4.21% 12.03% 44.62% 0.101 18.23% 0.206 1007 13.6% 51.64% 9.69% 25.9% 39.8% 9.5%F 8.98% 3.13% 10.84% 40.88% 0.127 19.71% 0.200 981 14.2% 53.01% 10.51% 27.3% 38.1% 8.4%G 9.37% 3.47% 9.96% 41.47% 0.130 16.89% 0.236 1017 13.7% 52.68% 9.98% 28.5% 39.9% 10.6%H 9.59% 3.00% 10.38% 43.51% 0.136 19.01% 0.219 977 15.0% 53.03% 10.01% 27.2% 40.4% 10.9%
4.2.2. Identification of Vulnerability
The author constructed the assessment matrix using Equation (8) with indices data to generatethe similarity and opposition degrees. In step 1, the authors identified the maximum data set U andminimum data set V as shown in Table 7.
In step 2, the authors used the Equations (9a) and (9b) to generate the similarity akp and oppositiondegree ckp in the dkp of Equation (8).
In step 3, the authors used Equation (10) to deal with index weight, the similarity akp, andopposition degree ckp. The calculations generated the similarity a and opposition degree c ofvulnerability of enterprise innovation capability in Table 8. The authors used Equation (11), thesimilarity a, and opposition degree c to calculate the vulnerability indicator X in Table 8.
In step 4, the authors used the analogy process to deal with sensitivity and adaptability datarespectively, the similarity a, opposition degree c, and vulnerability indicator X of enterprise’ sensitivity.The data of adaptability of innovation capability were also generated as shown in Table 8.
349

Sustainability 2016, 8, 17
Ta
ble
6.
Entr
opy
wei
ghta
ndPC
Aw
eigh
tofi
ndic
es.
Ind
ex
IIC
S1
IIC
S2
IIC
S3
CIC
ES
1C
ICE
S2
CIC
ES
3IP
CS
1IP
CS
2IP
CS
3C
ICS
1C
ICS
2C
ICS
3IE
GS
1IE
SS
1
Entr
opy
Wei
g0.
0432
038
0.04
9067
048
0.03
5248
156
0.03
8770
840.
0532
0616
40.
0405
3236
60.
0288
1968
20.
0388
6746
50.
0297
2658
50.
0306
3133
60.
0246
6039
70.
0474
9249
10.
0395
1915
80.
0447
8313
PCA
Wei
g0.
1068
2357
10.
0146
1821
0.02
7886
806
0.04
7262
562
0.00
3170
126
0.26
5283
625
0.18
5939
536
0.01
4947
161
0.16
3610
376
0.12
5805
123
0.18
5006
011
0.10
8780
112
0.04
8122
622
0.27
8513
069
Ind
ex
IIC
A1
IIC
A2
IIC
A3
CIC
EA
1C
ICE
A2
CIC
EA
3IP
CA
1IP
CA
2IP
CA
3C
ICA
1C
ICA
2C
ICA
3IE
GS
2IE
SS
2
Entr
opy
Wei
g0.
0230
1168
0.02
5365
134
0.03
2359
383
0.03
3075
712
0.04
1265
951
0.03
7907
817
0.03
3785
378
0.02
6661
727
0.04
8286
338
0.02
6045
051
0.02
8806
943
0.03
3478
911
0.02
4799
668
0.04
0621
69PC
AW
eig
0.09
0782
332
0.18
5267
733
0.01
4451
584
0.03
6046
266
0.21
9449
805
0.18
5363
984
0.18
5020
389
0.09
9616
493
0.17
4176
412
0.00
5760
201
0.26
1574
165
0.13
6289
993
0.00
5362
125
0.11
0553
235
Ta
ble
7.
The
max
data
setU
and
min
data
setV
.
V0.
0922
0.31
0.44
220.
0068
0.99
0.25
70.
1358
0.14
820.
455
0.05
80.
1455
2700
020.
1972
0.02
97
U0.
0798
0.27
30.
3729
0.01
51.
730.
228
0.11
470.
0952
0.32
60.
029
0.10
5425
4396
0.26
620.
0405
Sig
n.
´1´1
´11
1´1
´1´1
´1´1
´1´1
11
V0.
0729
0.01
490.
0996
0.40
880.
152
0.16
890.
289
90.
136
0.51
640.
0931
0.28
50.
433
0.10
9
U0.
1027
0.04
210.
1203
0.45
760.
098
0.24
310.
301
1017
0.15
30.
5388
0.10
510.
254
0.36
90.
068
Sig
n.
11
11
-11
11
11
1´1
´1´1
350
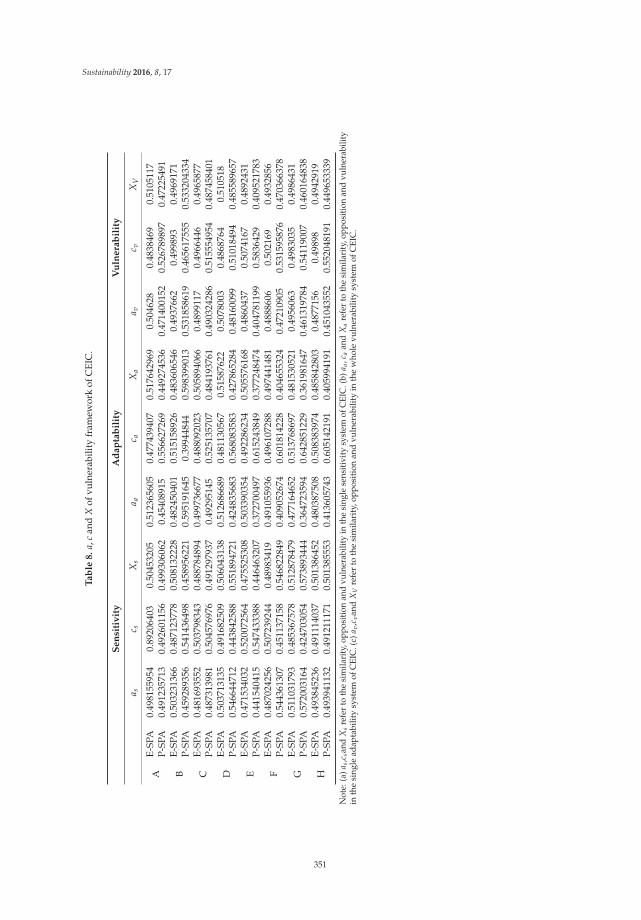
Sustainability 2016, 8, 17
Ta
ble
8.
a,c
and
Xof
vuln
erab
ility
fram
ewor
kof
CEI
C.
Se
nsi
tiv
ity
Ad
ap
tab
ilit
yV
uln
era
bil
ity
a sc s
Xs
a ac a
Xa
a vc v
XV
AE-
SPA
0.49
8155
954
0.89
2064
030.
5045
3205
0.51
2365
605
0.47
7439
407
0.51
7642
969
0.50
4628
0.48
3846
90.
5105
117
P-SP
A0.
4912
3571
30.
4926
0115
60.
4993
0606
20.
4540
8915
0.55
6627
269
0.44
9274
536
0.47
1400
152
0.52
6789
897
0.47
2254
91
BE-
SPA
0.50
3231
366
0.48
7123
778
0.50
8132
228
0.48
2450
401
0.51
5158
926
0.48
3606
546
0.49
3766
20.
4998
930.
4969
171
P-SP
A0.
4592
8935
60.
5414
3649
80.
4589
5622
10.
5951
9164
50.
3994
4844
0.59
8399
013
0.53
1858
619
0.46
5617
555
0.53
3204
334
CE-
SPA
0.48
1693
552
0.50
3798
343
0.48
8784
894
0.49
9736
677
0.48
8092
023
0.50
5894
066
0.48
9911
70.
4966
446
0.49
6587
7P-
SPA
0.48
7313
981
0.50
4576
976
0.49
1297
937
0.49
2951
450.
5251
3570
70.
4841
9376
10.
4903
2428
60.
5155
5495
40.
4874
5840
1
DE-
SPA
0.50
3713
135
0.49
1682
509
0.50
6043
138
0.51
2686
689
0.48
1130
567
0.51
5876
220.
5078
003
0.48
6876
40.
5105
18P-
SPA
0.54
6644
712
0.44
3842
588
0.55
1894
721
0.42
4835
683
0.56
8083
583
0.42
7865
284
0.48
1600
990.
5101
8494
0.48
5589
657
EE-
SPA
0.47
1534
032
0.52
0072
564
0.47
5525
308
0.50
3390
354
0.49
2286
234
0.50
5576
168
0.48
6043
70.
5074
167
0.48
9243
1P-
SPA
0.44
1540
415
0.54
7433
388
0.44
6463
207
0.37
2700
497
0.61
5243
849
0.37
7248
474
0.40
4781
199
0.58
3642
90.
4095
2178
3
FE-
SPA
0.48
7024
256
0.50
7239
244
0.48
9834
190.
4910
5593
60.
4961
0728
80.
4974
4148
10.
4888
606
0.50
2169
0.49
3285
6P-
SPA
0.54
4361
307
0.45
1137
158
0.54
6822
849
0.40
9052
674
0.60
1814
228
0.40
4655
324
0.47
2109
050.
5315
9587
60.
4703
6637
8
GE-
SPA
0.51
1031
793
0.48
5367
578
0.51
2878
479
0.47
7164
652
0.51
3768
697
0.48
1530
521
0.49
5606
30.
4983
035
0.49
8643
1P-
SPA
0.57
2003
164
0.42
4703
054
0.57
3893
444
0.36
4723
594
0.64
2851
229
0.36
1981
647
0.46
1319
784
0.54
1190
070.
4601
6483
8
HE-
SPA
0.49
3845
236
0.49
1114
037
0.50
1386
452
0.48
0387
508
0.50
8383
974
0.48
5842
803
0.48
7715
60.
4989
80.
4942
919
P-SP
A0.
4939
4113
20.
4912
1117
10.
5013
8555
30.
4136
0574
30.
6051
4219
10.
4059
9419
10.
4510
4355
20.
5520
4819
10.
4496
5333
9
Not
e:(a
)as,
c san
dX
sre
fer
toth
esi
mila
rity
,opp
ositi
onan
dvu
lner
abili
tyin
the
sing
lese
nsiti
vity
syst
emof
CEI
C.(
b)a a
,ca
and
Xa
refe
rto
the
sim
ilari
ty,o
ppos
ition
and
vuln
erab
ility
inth
esi
ngle
adap
tabi
lity
syst
emof
CEI
C.(
c)a v
,cva
ndX
Vre
fer
toth
esi
mila
rity
,opp
osit
ion
and
vuln
erab
ility
inth
ew
hole
vuln
erab
ility
syst
emof
CEI
C.
351
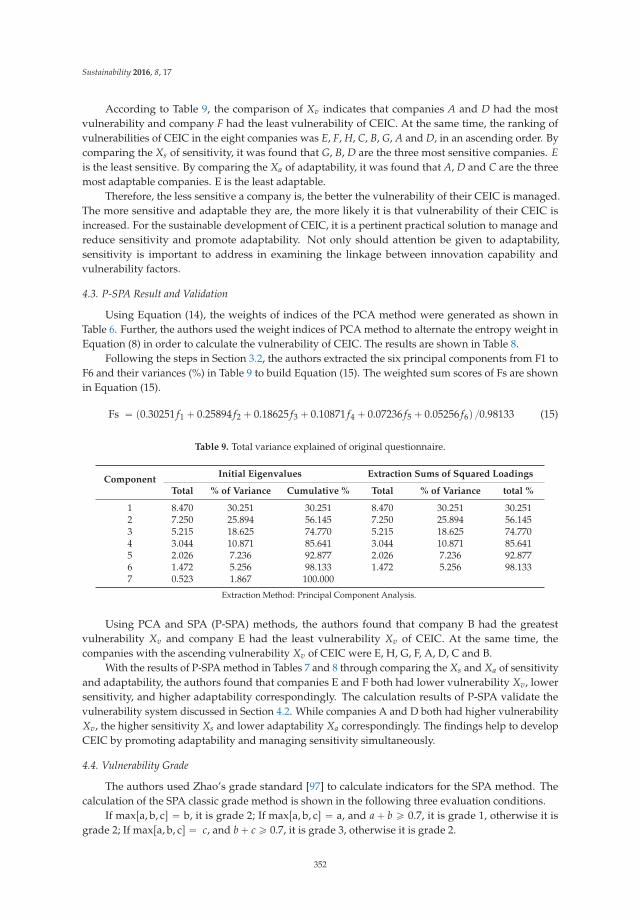
Sustainability 2016, 8, 17
According to Table 9, the comparison of Xv indicates that companies A and D had the mostvulnerability and company F had the least vulnerability of CEIC. At the same time, the ranking ofvulnerabilities of CEIC in the eight companies was E, F, H, C, B, G, A and D, in an ascending order. Bycomparing the Xs of sensitivity, it was found that G, B, D are the three most sensitive companies. Eis the least sensitive. By comparing the Xa of adaptability, it was found that A, D and C are the threemost adaptable companies. E is the least adaptable.
Therefore, the less sensitive a company is, the better the vulnerability of their CEIC is managed.The more sensitive and adaptable they are, the more likely it is that vulnerability of their CEIC isincreased. For the sustainable development of CEIC, it is a pertinent practical solution to manage andreduce sensitivity and promote adaptability. Not only should attention be given to adaptability,sensitivity is important to address in examining the linkage between innovation capability andvulnerability factors.
4.3. P-SPA Result and Validation
Using Equation (14), the weights of indices of the PCA method were generated as shown inTable 6. Further, the authors used the weight indices of PCA method to alternate the entropy weight inEquation (8) in order to calculate the vulnerability of CEIC. The results are shown in Table 8.
Following the steps in Section 3.2, the authors extracted the six principal components from F1 toF6 and their variances (%) in Table 9 to build Equation (15). The weighted sum scores of Fs are shownin Equation (15).
Fs “ p0.30251 f1 ` 0.25894 f2 ` 0.18625 f3 ` 0.10871 f4 ` 0.07236 f5 ` 0.05256 f6q {0.98133 (15)
Table 9. Total variance explained of original questionnaire.
ComponentInitial Eigenvalues Extraction Sums of Squared Loadings
Total % of Variance Cumulative % Total % of Variance total %
1 8.470 30.251 30.251 8.470 30.251 30.2512 7.250 25.894 56.145 7.250 25.894 56.1453 5.215 18.625 74.770 5.215 18.625 74.7704 3.044 10.871 85.641 3.044 10.871 85.6415 2.026 7.236 92.877 2.026 7.236 92.8776 1.472 5.256 98.133 1.472 5.256 98.1337 0.523 1.867 100.000
Extraction Method: Principal Component Analysis.
Using PCA and SPA (P-SPA) methods, the authors found that company B had the greatestvulnerability Xv and company E had the least vulnerability Xv of CEIC. At the same time, thecompanies with the ascending vulnerability Xv of CEIC were E, H, G, F, A, D, C and B.
With the results of P-SPA method in Tables 7 and 8 through comparing the Xs and Xa of sensitivityand adaptability, the authors found that companies E and F both had lower vulnerability Xv, lowersensitivity, and higher adaptability correspondingly. The calculation results of P-SPA validate thevulnerability system discussed in Section 4.2. While companies A and D both had higher vulnerabilityXv, the higher sensitivity Xs and lower adaptability Xa correspondingly. The findings help to developCEIC by promoting adaptability and managing sensitivity simultaneously.
4.4. Vulnerability Grade
The authors used Zhao’s grade standard [97] to calculate indicators for the SPA method. Thecalculation of the SPA classic grade method is shown in the following three evaluation conditions.
If maxra, b, cs “ b, it is grade 2; If maxra, b, cs “ a, and a ` b ě 0.7, it is grade 1, otherwise it isgrade 2; If maxra, b, cs “ c, and b ` c ě 0.7, it is grade 3, otherwise it is grade 2.
352
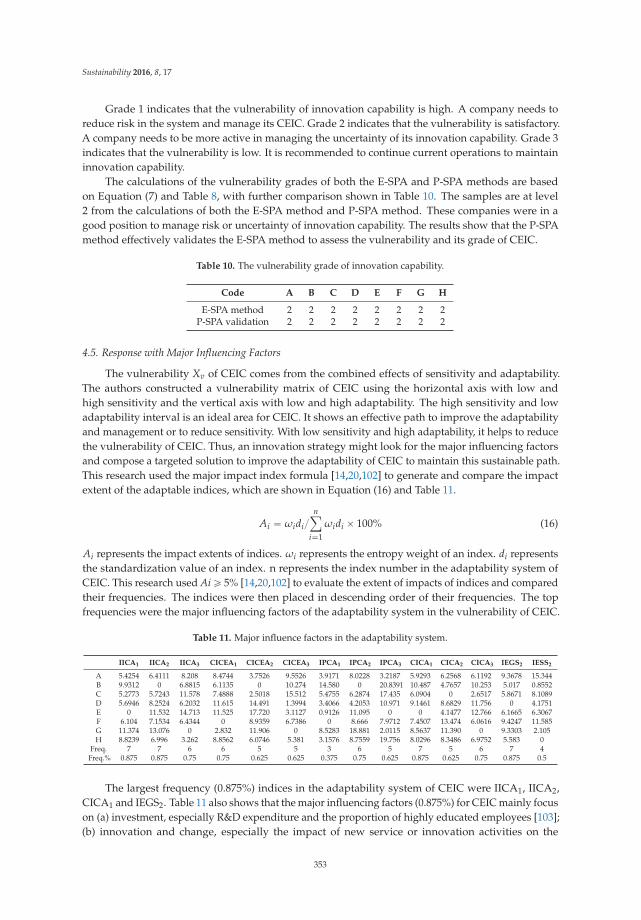
Sustainability 2016, 8, 17
Grade 1 indicates that the vulnerability of innovation capability is high. A company needs toreduce risk in the system and manage its CEIC. Grade 2 indicates that the vulnerability is satisfactory.A company needs to be more active in managing the uncertainty of its innovation capability. Grade 3indicates that the vulnerability is low. It is recommended to continue current operations to maintaininnovation capability.
The calculations of the vulnerability grades of both the E-SPA and P-SPA methods are basedon Equation (7) and Table 8, with further comparison shown in Table 10. The samples are at level2 from the calculations of both the E-SPA method and P-SPA method. These companies were in agood position to manage risk or uncertainty of innovation capability. The results show that the P-SPAmethod effectively validates the E-SPA method to assess the vulnerability and its grade of CEIC.
Table 10. The vulnerability grade of innovation capability.
Code A B C D E F G H
E-SPA method 2 2 2 2 2 2 2 2P-SPA validation 2 2 2 2 2 2 2 2
4.5. Response with Major Influencing Factors
The vulnerability Xv of CEIC comes from the combined effects of sensitivity and adaptability.The authors constructed a vulnerability matrix of CEIC using the horizontal axis with low andhigh sensitivity and the vertical axis with low and high adaptability. The high sensitivity and lowadaptability interval is an ideal area for CEIC. It shows an effective path to improve the adaptabilityand management or to reduce sensitivity. With low sensitivity and high adaptability, it helps to reducethe vulnerability of CEIC. Thus, an innovation strategy might look for the major influencing factorsand compose a targeted solution to improve the adaptability of CEIC to maintain this sustainable path.This research used the major impact index formula [14,20,102] to generate and compare the impactextent of the adaptable indices, which are shown in Equation (16) and Table 11.
Ai “ ωidi{nÿ
i“1
ωidi ˆ 100% (16)
Ai represents the impact extents of indices. ωi represents the entropy weight of an index. di representsthe standardization value of an index. n represents the index number in the adaptability system ofCEIC. This research used Ai ě 5% [14,20,102] to evaluate the extent of impacts of indices and comparedtheir frequencies. The indices were then placed in descending order of their frequencies. The topfrequencies were the major influencing factors of the adaptability system in the vulnerability of CEIC.
Table 11. Major influence factors in the adaptability system.
IICA1 IICA2 IICA3 CICEA1 CICEA2 CICEA3 IPCA1 IPCA2 IPCA3 CICA1 CICA2 CICA3 IEGS2 IESS2
A 5.4254 6.4111 8.208 8.4744 3.7526 9.5526 3.9171 8.0228 3.2187 5.9293 6.2568 6.1192 9.3678 15.344B 9.9312 0 6.8815 6.1135 0 10.274 14.580 0 20.8391 10.487 4.7657 10.253 5.017 0.8552C 5.2773 5.7243 11.578 7.4888 2.5018 15.512 5.4755 6.2874 17.435 6.0904 0 2.6517 5.8671 8.1089D 5.6946 8.2524 6.2032 11.615 14.491 1.3994 3.4066 4.2053 10.971 9.1461 8.6829 11.756 0 4.1751E 0 11.532 14.713 11.525 17.720 3.1127 0.9126 11.095 0 0 4.1477 12.766 6.1665 6.3067F 6.104 7.1534 6.4344 0 8.9359 6.7386 0 8.666 7.9712 7.4507 13.474 6.0616 9.4247 11.585G 11.374 13.076 0 2.832 11.906 0 8.5283 18.881 2.0115 8.5637 11.390 0 9.3303 2.105H 8.8239 6.996 3.262 8.8562 6.0746 5.381 3.1576 8.7559 19.756 8.0296 8.3486 6.9752 5.583 0
Freq. 7 7 6 6 5 5 3 6 5 7 5 6 7 4Freq.% 0.875 0.875 0.75 0.75 0.625 0.625 0.375 0.75 0.625 0.875 0.625 0.75 0.875 0.5
The largest frequency (0.875%) indices in the adaptability system of CEIC were IICA1, IICA2,CICA1 and IEGS2. Table 11 also shows that the major influencing factors (0.875%) for CEIC mainly focuson (a) investment, especially R&D expenditure and the proportion of highly educated employees [103];(b) innovation and change, especially the impact of new service or innovation activities on the
353
Sustainability 2016, 8, 17
market [78]; (c) government support, for example, large program support and taxation exemptions forapplication of certain innovation technologies [3,56,60,104–106].
The second-tier factors (0.75%) are IICA3, CICEA1, IPCA2 and CICA3. They emphasize the keyroles of HR investment and innovation in change, referring to the amount of HR of R&D institutionsand the management of corporate energy consumption. In addition, cooperative innovation ofenterprise and IP capability played major roles in sustainable CEIC, such as the enterprise investmentin university–industry cooperative innovation and the size of enterprise patent pools [69,84,107].
However, much attention should be given to output performance of IP capability (IPCA1, 0.375%)to promote IP marketing and to solve IP transformation problems [108,109]. The lack of socialcapital [3,110] support given to corporate total capital (IESS2, 0.5%) also leads to inadequate investmentin CEIC.
4.6. Discussion
As discussed in this paper, CEIC is vulnerable, and this vulnerability can be measured. Theresearchers applied and confirmed a quantitative system approach to address the vulnerability of anenterprise’s innovation efforts. Vulnerability research, as a new paradigm of sustainable development,uncertainty and risk, sheds light on how to best analyze the uncertainty of innovation capability.As an innovative method, SPA focuses on uncertainty and is widely applied in the economic andsocial fields [11,12,18,26,111–114], and is combined with some common comprehensive methods,such as E-SPA and P-SPA [44,100–102]. Innovation capability is an important driver of economicdevelopment and is closely linked to uncertainty and risk. However, within the new paradigm ofreducing uncertainty, very little research exists to develop a systematic approach to assessing thevulnerability of innovation capability [22,23].
In order to extend a generic model of construction innovation [71,76], this new vulnerabilityframework of CEIC focuses on the extent of innovation investment, IP capability, cooperativeinnovation, change innovation and the overall environment to foster companies’ innovation. Further,this research used the corresponding index in the 2013 National Innovation Survey System of MOST,China to match and test the proposed framework (see also Section 2.4) of the vulnerability system ofCEIC, which contained two subsystems referred to as the sensitivity and adaptability of a systematicapproach and includes the above five criteria and 28 indicators.
Meanwhile, this paper applied the E-SPA as the main method to analyze the case data toevaluate levels of vulnerability, comparing the results of P-SPA to confirm the empirical results.The authors used the E-SPA and P-SPA measurements regarding the vulnerability and uncertaintyof innovation capability and quantitatively bridged the gap in system assessments of vulnerabilityof CEIC. More importantly, this research justified the necessity for a new approach to examiningconstruction innovation uncertainty and built a foundation for overcoming construction innovationuncertainty, with a view to provide a basis for further research on this topic.
For two subsystems of CEIC, sensitivity referred to the ability of the system to withstand externalor internal interferences or pressures. The less the sensitivity, the greater a system’s resilience, and viceversa. Adaptability refers to the ability to respond to change which embodies an uncertain state orcrisis situations. In other words, the greater the adaptability of a company, the stronger will be theability of a company to respond to those challenges, and vice versa.
In this research, case studies showed that the sustainable CEIC needed to increase the innovationinvestment capability such as to enhance HR funding for highly skilled or talented individuals andR&D expenditure for individuals that show the greatest potential for innovation. Much attentionseems to be given to the collaboration innovation between universities and research institutions,with the objective to impact business and marketing strategies that already demonstrate a high levelperformance of intellectual property, which could increase social recognition and capital support, inorder to obtain more government assistance [104,115–118]. Thus, at the policy planning or strategiclevels, positive industrial and corporate environments may lead to an optimization of an enterprise’s
354
Sustainability 2016, 8, 17
innovation efforts and may attract sustainable government support. Furthermore, well establishedpolicy and strategic planning may encourage investment in corporate innovation. Topics for furtherresearch may include how to implement a practical strategy and operation of a market-orienteduniversity–industry cooperative innovation approach, and how to strengthen and improve theinnovation performance of intellectual property capabilities.
5. Conclusions
This study discussed the vulnerability framework of CEIC, and attempts to quantify an evaluationsystem for CEIC. It opened doors to future research in the theory and application areas in this field. Thisstudy proposed a new systematic approach to supplement the quantitative framework and methods inexamining the uncertainty regarding a company’s ability to innovate applied to the case of constructionenterprises. Uncertainty regarding CEIC should not simply be ignored. Rather, it should be managedintelligently and, in an ideal world, help to develop an environment conducive to ongoing innovation.Vulnerability, and the management thereof, is a new domain in the large field of socioeconomic research.This research built a vulnerability framework for CEIC, which examines the subsystems of sensitivityand adaptability and a number of factors including innovation investment capability, cooperationinnovation capability, intellectual property capability, change innovation capability, and innovationenvironment. Further, this research assessed the vulnerability of CEIC, using the comparative resultsof E-SPA and P-SPA methods for confirmation. It analyzed the major influencing factors in promotingsustainable CEIC.
Case studies showed that the two comparative methods confirm the same grade level ofvulnerability of CEIC. We identified a stronger practical approach to reduce the vulnerabilityof CEIC by managing or reducing sensitivity and strengthening adaptability to respond tonew economic environments. The major influencing factors of CEIC are focused on (a) thehighly educated HR innovation team, (b) R&D investment intensity, (c) substantial market-ledcorporate–university–industry cooperation on intellectual property performance, (d) governmentsupport and social capital support, and (e) change innovation in construction energy consumption.
In summary, this research provided a theoretical framework and an application method to assessand evaluate both the vulnerability and uncertainty involved in innovation. This research can beimplemented to evaluate and grade the vulnerability of CEIC at national, industrial or enterpriselevels with the corresponding sequential data and indices. A limitation of this research may resultdue to the sequential data boundary, i.e., at industrial or national levels, in conducting a systematicanalysis to conceptualize innovation capability. A possible future research project may be to expandthe dynamic data collection to analyze the vulnerability of construction innovation at both the macroand industrial levels.
Supplementary Materials: Supplementary Materials: Supplementary can be found atwww.mdpi.com/2071-1050/8/1/17/s1.
Acknowledgments: Acknowledgments: This research is supported by the National Nature Science Foundationof China (NO.71301013), Humanity and Social Science Program Foundation of Ministry of Education of China(NO.13YJA790150), China ASC Fund (NO. asc-kt2014022 and asc-kt2014023), China scholarship council, ShaanxiNature Science Fund (NO.2014JM2-7140), Shaanxi Social Science Fund (NO.2014HQ10, NO. 2015Z071 andNO. 2015Z075), Xi'an Science Technology Burea Fund(NO.CXY1512(2)), and Special Fund for Basic ScientificResearch of Central College (Humanities and Social Sciences), Chang’an University (NO.0009-2014 G 6285048 andNO. 310828155031).
Author Contributions: Author Contributions: Prof. Zhang and Prof. Li analyzed the data and contributed todrafting the paper. Prof. Zhang and Prof. Li contributed to the concept and design of the paper. Prof. Xie andProf. Schmidt contributed useful advice and modified the paper. Prof. Zhang is in charge of the final version ofthe paper.
Conflicts of Interest: Conflicts of Interest: The authors declare no conflict of interest.
355
Sustainability 2016, 8, 17
Abbreviations
The following abbreviations are used in this manuscript:
CEIC: Construction enterprises’ innovation capabilitiesE-SPA: The entropy and set pair analysis methodP-SPA: The principle cluster analysis and SPA methodR&D: Research and developmentUNCTAD: United Nations Conference on Trade and DevelopmentUNDP: United Nations Development ProgrammeOECD: Organization for Economic Co-operation and DevelopmentOECD STI: OECD Science, Technology and InnovationMOST, China: Ministry of Science and Technology of the People´s Republic of China
References
1. Akintoye, A.; Goulding, J.; Zawdie, G. Construction Innovation and Process Improvement; Wiley-Blackwell:Hoboken, NJ, USA, 2012.
2. Brochner, J. Construction contractors as service innovators. Build. Res. Inf. 2010, 38, 235–246. [CrossRef]3. Castro-Lacouture, D.; Irizarry, J.; Ashuri, B.; American Society of Civil Engineers; Construction Institute.
Construction research congress 2014 construction in a global network. In Proceedings of the 2014Construction Research Congress, Atlanta, GA, USA, 19–21 May 2014; American Society of Civil Engineers:Reston, VA, USA, 2014.
4. Forbes, L.H.; Ahmed, S.M.; Ebooks Corporation. Modern construction lean project delivery and integratedpractices. In Industrial Innovation Series; CRC Press: Boca Raton, FL, USA, 2011.
5. Goh, B.; Tjoa, A.; Xu, L.; Chaudhry, S. Intelligent enterprises for construction: Bridging the technology andknowledge gaps through innovation and education. Res. Pract. Issues Enterp. Inf. Syst. 2006, 205, 119–131.
6. Blayse, A.M.; Manley, K. Key influences on construction innovation. Constr. Innov. 2004, 4, 143–154.[CrossRef]
7. Suprun, E.V.; Stewart, R.A. Construction innovation diffusion in the Russian Federation. Constr. Innov. 2015,3, 278–312. [CrossRef]
8. Kulatunga, U.; Amaratunga, R.; Haigh, R. Construction Innovation: A Literature Review on CurrentResearch. 2006. Available online: http://usir.salford.ac.uk/9886/1/205_Kulatunga_KJ_et_al_CONSTRUCTION_INNOVATION_A_LITERATURE_REVIEW_ON_CURRENT_RESEARCH_2006.pdf(accessed on 21 December 2015).
9. Hultgren, A.; Tantawi, A. Front-End Idea Screening of Potential Radical Innovation in Large Firms: A HolisticFramework for the Volvo Group; Chalmers University of Technology: Göteborg, Sweden, 2014.
10. Baker, S.M. Vulnerability and resilience in natural disasters: A marketing and public policy perspective.J. Public Policy Mark. 2009, 28, 114–123. [CrossRef]
11. Le Breton-Miller, I.; Miller, D. The paradox of resource vulnerability: Considerations for organizationalcuratorship. Strat. Manag. J. 2015, 36, 397–415. [CrossRef]
12. Dabla-Norris, E.; Gündüz, B.Y. Exogenous shocks and growth crises in low-income countries: A vulnerabilityindex. World Dev. 2014, 59, 360–378. [CrossRef]
13. Dass, M.; Kumar, P.; Peev, P.P. Brand vulnerability to product assortments and prices. J. Mark. Manag. 2013,29, 735–754. [CrossRef]
14. Li, F.; Wan, N.Q.; Shi, B.L.; Liu, X.M.; Guo, Z.J. The vulnerability measure of tourism industry based onthe perspective of “environment-structure” integration a case study of 31 provinces in mainland China.Geogr. Res. 2014, 33, 569–581.
15. Herceg, I.; Nesti, D. A new cluster-based financial vulnerability indicator and its application to householdstress testing in Croatia. Emerg. Markets Finance Trade 2014, 50, 60–77.
16. Holand, I.S.; Lujala, P.; Rød, J.K. Social vulnerability assessment for Norway: A quantitative approach. Nor. J.Geogr. 2011, 65, 1–17. [CrossRef]
17. Rodríguez-Núñez, E.; García-Palomares, J.C. Measuring the vulnerability of public transport networks.J. Transp. Geogr. 2014, 35, 50–63. [CrossRef]
356
Sustainability 2016, 8, 17
18. Rossignol, N.; Delvenne, P.; Turcanu, C. Rethinking vulnerability analysis and governance with emphasis ona participatory approach. Risk Anal. Int. J. 2015, 35, 129–141. [CrossRef] [PubMed]
19. Springer, N.P.; Garbach, K.; Guillozet, K.; Haden, V.R.; Hedao, P.; Hollander, A.D.; Huber, P.R.; Ingersoll, C.;Langner, M.; Lipari, G.; et al. Sustainable sourcing of global agricultural raw materials: Assessing gaps inkey impact and vulnerability issues and indicators. PLoS ONE 2015, 10, 1–22. [CrossRef] [PubMed]
20. Hong, T.; Jian, Z. Regional vulnerability evaluation index system of environmental emergencies inpetrochemical industry. Adv. Mater. Res. 2014, 1073–1076, 400–404.
21. Turner, B.L.; Kasperson, R.E.; Matson, P.A.; McCarthy, J.J.; Corell, R.W.; Christensen, L.; Eckley, N.;Kasperson, J.X.; Luers, A.; Martello, M.L.; et al. A framework for vulnerability analysis in sustainabilityscience. PNAS 2003, 100, 8074–8079. [CrossRef] [PubMed]
22. Dassen-Housen, P. Management of uncertainty—A contradiction in itself? In Enabling Innovation:Innovative Capability—German and International Views; Jeschke, S., Isenhardt, I., Hees, F., Trantow, S., Eds.;Springer-Verlag: Berlin, Germany, 2011; pp. 30–33.
23. Trantow, S.; Hees, F.; Jeschke, S. Innovative capability. In Enabling Innovation: Innovative Capability —Germanand International Views; Jeschke, S., Isenhardt, I., Hees, F., Trantow, S., Eds.; Springer-Verlag: Berlin, Germany,2011; pp. 1–13.
24. Costanza, R.; d’Arge, R.; Groot, R.D.; Farber, S.; Grasso, M.; Hannon, B.; Limburg, K.; Naeem, S.; O’Neill, R.V.;Paruelo, J.; et al. The value of ecosystem services: putting the issues in perspective. Ecol. Econ. 1998, 25,67–72. [CrossRef]
25. Gnangnon, S.K. Does structural economic vulnerability matter for public indebtedness in developingcountries? J. Econ. Stud. 2014, 41, 644–671. [CrossRef]
26. Pérez Agúndez, J.A.; Yimam, E.; Raux, P.; Rey-Valette, H.; Girard, S. Modeling economic vulnerability: Asapplied to microbiological contamination on the Thau Lagoon shellfish farming industry. Mar. Policy 2014,46, 143–151. [CrossRef]
27. Ransbotham, S.; Mitra, S.; Ramsey, J. Are markets for vulnerabilities effective? MIS Q. 2012, 36, 43–64.28. Bell, M.; Pavitt, K. Technological accumulation and industrial growth: Contrasts between developed and
developing countries. Ind. Corp. Change 1993, 2, 157. [CrossRef]29. Pavitt, K. What we know about the strategic management of technology. Calif. Manag. Rev. 1990, 32, 17–26.
[CrossRef]30. Freeman, C. The 'national system of innovation' in historical perspective. Camb. J. Econ. 1995, 19, 5–24.31. OECD. Proposed Guidelines for Collecting and Interpreting Technological Innovation Data: Oslo Manual; OECD
Publication Services: Paris, France, 1997.32. Böhle, F. Management of uncertainty–A blind spot in the promotion of innovations. In Enabling
Innovation–German and International Views, 1st ed.; Al, S.J.E., Ed.; Springer-Verlag: Berlin, Germany, 2011;pp. 17–29.
33. Dominitz, J.; Manski, C.F. Perceptions of Economic Vulnerability: First Evidence from the Survey of EconomicExpectations/Jeff Dominitz and Charles f. Manski; Institute for Research on Poverty, University ofWisconsin-Madison: Madison, WI, USA, 1995.
34. Berry, P.M.; Rounsevell, M.D.A.; Harrison, P.A.; Audsley, E. Assessing the vulnerability of agricultural landuse and species to climate change and the role of policy in facilitating adaptation. Environ. Sci. Policy 2006, 9,189–204. [CrossRef]
35. UNDP. Human Development Report 1999; Oxford University Press: Oxford, UK, 1999.36. Erol, O.; Sauser, B.; Mansouri, M. A framework for investigation into extended enterprise resilience. Enterp.
Inf. Syst. 2010, 4, 111–136. [CrossRef]37. Prewitt, K. The federal statistical system: Its vulnerability matters more than you think—Section four:
Strengthening the statistical system: Future of innovation in the federal statistical system. 2010. Availableonline: https://us.sagepub.com/en-us/nam/the-federal-statistical-system-its-vulnerability-matters-more-than-you-think/book235999 (accessed on 22 December 2015).
38. Han, R.; Tong, L.; Tong, W.; Yu, J. Research on vulnerability assessment of human-land system of Anshancity based on set pair analysis. Progr. Geogr. 2012, 31, 344–351.
39. Reed, M.S.; Podesta, G.; Fazey, I.; Geeson, N.; Hessel, R.; Hubacek, K.; Letson, D.; Nainggolan, D.; Prell, C.;Rickenbach, M.G.; et al. Surveys: Combining analytical frameworks to assess livelihood vulnerability toclimate change and analyse adaptation options. Ecol. Econ. 2013, 94, 66–77. [CrossRef] [PubMed]
357
Sustainability 2016, 8, 17
40. Aldana-Bobadilla, E.; Kuri-Morales, A. A clustering method based on the maximum entropy principle.Entropy 2015, 17, 151–180. [CrossRef]
41. Benedetto, F.; Giunta, G.; Mastroeni, L. A maximum entropy method to assess the predictability of financialand commodity prices. Dig. Signal Process. 2015, 46, 19–31. [CrossRef]
42. Zou, Q.; Zhou, J.Z.; Zhou, C.; Song, L.X.; Guo, J. Comprehensive flood risk assessment based on set pairanalysis-variable fuzzy sets model and fuzzy AHP. Stochast. Environ. Res. Risk Assess. 2013, 27, 525–546.[CrossRef]
43. Xia, C.; Yi, M.; Wei, W.; Yu, Z. Discussion of annual runoff dry-wet classification based on set pair analysis.Yangze River 2015, 46, 21–24.
44. Su, M.R.; Yang, Z.F.; Chen, B. Set pair analysis for urban ecosystem health assessment based onemergy-vitality index. China Environ. Sci. 2009, 29, 892–896.
45. Meng, X.M.; Hu, H.P. Application of set pair analysis model based on entropy weight to comprehensiveevaluation of water quality. J. Hydraul. Eng. 2009, 40, 257–262.
46. Sun, B.; Wang, H. Inventory Evaluation Model and Application of Shipbuilding Enterprise Based on theMethod of Optimal Combination. Int. J. U- E-Serv. Sci. Technol. 2015, 8, 175–184. [CrossRef]
47. Li, B.; Yang, Z.; Su, F. Measurement of vulnerability in human-sea economic system based on set pair analysis:A case study of Dalian city. Geogr. Res. 2015, 34, 967–976.
48. Gobble, M.M. The 2009 European innovation scoreboard: EU lags us & Japan while China closing gap withEU. Res. Technol. Manag. 2010, 53, 2–4.
49. OECD. OECD Science, Technology and Industry Outlook 2014. Available online:http://dx.doi.org.libproxy.lib.ilstu.edu/10.1787/sti_outlook-2014-en (accessed on 21 December 2015).
50. Gupta, P.; Trusko, B.E. The Innovation Radar and enterprise Business System: Innovation in Five Nordic Countriesand Beyond; McGraw-Hill Professional: New York, NY, USA, 2014.
51. UNCTAD. UNCTAD at 50: A short History. 2014. Available online: http://unctad.org/en/PublicationsLibrary/osg2014d1_en.pdf (accessed on 23 December 2015).
52. Bank, W. World Development Indicators 2010; World Bank: Washington, DC, USA, 2010; p. xxiii.53. Azubuike, V.M.U. Technological innovation capability and firm's performance in new product development.
Commun. IIMA 2013, 13, 43–55.54. Carcary, M.; Doherty, E.; Thornley, C. Business innovation and differentiation: Maturing the IT capability. IT
Prof. 2015, 17, 46–53. [CrossRef]55. Daqi, X.U. Research on improving the technological innovation capability of SMEs by university-industry
collaboration. J. Eng. Sci. Technol. Rev. 2013, 6, 100–104.56. Fagerberg, J.; Feldmany, M.P.; Srholec, M. Technological dynamics and social capability: US states and
European Nations. J. Econ. Geogr. 2014, 14, 313–337. [CrossRef]57. Hansen, U.E.; Ockwell, D. Learning and technological capability building in emerging economies: The case
of the biomass power equipment industry in Malaysia. Technovation 2014, 34, 617–630. [CrossRef]58. Tseng, C.-Y. Technological innovation capability, knowledge sourcing and collaborative innovation in Gulf
Cooperation Council countries. Innov. Manag. Policy Pract. 2014, 16, 212–223.59. Raymond, L.; St-Pierre, J.; Uwizeyemungu, S.; Dinh, T. Internationalization capabilities of SMEs: A
comparative study of the manufacturing and industrial service sectors. J. Int. Entrep. 2014, 12, 230–253.[CrossRef]
60. Manseau, A.; Seaden, G. Innovation in Construction: An International Review of Public Policies; Spon Press:London, UK; New York, NY, USA, 2001.
61. Brooker, P.; Wilkinson, S. Mediation in the Construction Industry: An International Review; Routledge: London,UK, 2010.
62. Altenburger, R. Green product innovation: Values and networks in open innovation processes. InProceedings of ISPIM Conferences, Dublin, Ireland, 8–11 June 2014.
63. Bindroo, V.; Mariadoss, B.J.; Pillai, R.G. Customer clusters as sources of innovation-based competitiveadvantage. J. Int. Mark. 2012, 20, 17–33. [CrossRef]
64. Chan, I.; Liu, A.; Fellows, R. Role of leadership in fostering an innovation climate in construction firms.J. Manag. Eng. 2014. [CrossRef]
65. Elmualim, A.; Gilder, J. Bim: Innovation in design management, influence and challenges of implementation.Archit. Eng. Design Manag. 2014, 10, 183–199. [CrossRef]
358
Sustainability 2016, 8, 17
66. Blindenbach-Driessen, F.; van den Ende, J. Innovation in project-based firms: The context dependency ofsuccess factors. Res. Policy 2006, 35, 545–561. [CrossRef]
67. Chen, L.; Marsden, J.R.; Zhang, Z. Theory and analysis of company-sponsored value co-creation. J. Manag.Inf. Syst. 2012, 29, 141–172. [CrossRef]
68. Gann, D.; Salter, A. Innovation in project-based, service-enhanced firms: The construction of complexproducts and systems. Res. Policy 2000, 29, 955–972. [CrossRef]
69. Iammarino, S.; Piva, M.; Vivarelli, M.; von Tunzelmann, N. Technological capabilities and patterns ofinnovative cooperation of firms in the UK regions. Reg. Stud. 2012, 46, 1283–1301. [CrossRef]
70. Leiringer, R.; Schweber, L. Managing multiple markets: Big firms and PFI. Build. Res. Inf. 2010, 38, 131–143.[CrossRef]
71. Sexton, M.; Barrett, P. Appropriate innovation in small construction firms. Constr. Manag. Econ. 2003, 21,623–633. [CrossRef]
72. Kuo, Y. Technology readiness as moderator for construction company performance. Ind. Manag. Data Syst.2013, 113, 558–572. [CrossRef]
73. Ruwanpura, J.; Mohamed, Y.; Lee, S. Construction research congress 2010: Innovation for reshapingconstruction practice. In Proceedings of the 2010 Construction Research Congress, Banff, AL, Canada,8–10 May 2010.
74. Pellicer, E.; Correa, C.L.; Yepes, V.; Alarcón, L.F. Organizational improvement through standardization of theinnovation process in construction firms. Eng. Manag. J. 2012, 24, 40–53. [CrossRef]
75. Pryke, S.; Ebooks Corporation. Construction supply chain management concepts and case studies. InInnovation in the Built Environment; Wiley-Blackwell: Chichester, UK; Malden, MA, USA, 2009.
76. Barrett, P.; Sexton, M.; Lee, A. Innovation in small Construction Firms; Taylor & Francis: London, UK; New York,NY, USA, 2008; p. 107.
77. Patanakul, P.; Pinto, J.K. Examining the roles of government policy on innovation. High Technol. Manag. Res.2014, 25, 97–107. [CrossRef]
78. Chesbrough, H.W.; Appleyard, M.M. Open innovation and strategy. Calif. Manag. Rev. 2007, 50, 57–76.[CrossRef]
79. Wu, I.-L.; Chiu, M.-L. Organizational applications of it innovation and firm's competitive performance:A resource-based view and the innovation diffusion approach. J. Eng. Technol. Manag. 2015, 35, 25–44.[CrossRef]
80. Kamasak, R. Determinants of innovation performance: A resource-based study. Procedia-Soc. Behav. Sci.2015, 195, 1330–1337. [CrossRef]
81. Han, J.-W.; Lim, H.-S. Strategic analysis and success factors of the enterprises through the convergence. Int. J.Appl. Eng. Res. 2014, 9, 15715–15726.
82. Lusch, R.F.; Nambisan, S. Service innovation: A service-dominant logic perspective. MIS Q. 2015, 39, 155–176.83. Palm, K. Understanding innovation as an approach to increasing customer value in the context of the public
sector. 2014. Available online: https://www.diva-portal.org/smash/get/diva2:773180/FULLTEXT01.pdf(accessed on 21 December 2015).
84. Wu, J. Cooperation with competitors and product innovation: Moderating effects of technological capabilityand alliances with universities. Ind. Mark. Manag. 2014, 43, 199–209. [CrossRef]
85. Aalbers, R.; Dolfsma, W. Innovation Networks: Managing the Networked Organization/Rick Aalbers and WilfredDolfsma; Routledge: London, UK, 2015.
86. Cabanelas, P.; Omil, J.C.; Vázquez, X.H. A methodology for the construction of dynamic capabilities inindustrial networks: The role of border agents. Ind. Mark. Manag. 2013, 42, 992–1003. [CrossRef]
87. Macaulay, L.A.; Miles, I.; Wilby, J.; Tan, Y.L.; Zhao, L.; Theodoulidis, B. Case Studies in Service Innovation;Springer: Berlin, Germany, 2012.
88. Anumba, C.J.; Egbu, C.O.; Carrillo, P.M. Knowledge Management in Construction; Blackwell Pub.: Oxford UK;Malden, MA, USA, 2005; xiv; p. 226.
89. Connaughton, J.; Meikle, J. The changing nature of UK construction professional service firms. Build. Res.Inf. 2013, 41, 95–109. [CrossRef]
90. Gabbott, M.; Hogg, G. Consumer involvement in services: A replication and extension. J. Bus. Res. 1999, 46,159–166. [CrossRef]
91. Halpin, D.W.; Senior, B.A. Construction Management, 4th ed.; Wiley: Hoboken, NJ, USA, 2011; p. 448.
359
Sustainability 2016, 8, 17
92. Giang, D.T.H.; Pheng, L.S. Role of construction in economic development: Review of key concepts in thepast 40 years. Habitat Int. 2011, 35, 118–125. [CrossRef]
93. Kazi, A.S. Knowledge Management in the Construction Industry: A Socio-Technical Perspective; Idea Group Pub.:Hershey, PA, USA, 2005; p. 384.
94. Korman, T.M.; Huey-King, L. Industry input for construction engineering and management courses:Development of a building systems coordination exercise for construction engineering and managementstudents. Pract. Period. Struct. Design Constr. 2014, 19, 68–72. [CrossRef]
95. McCarthy, J.F. Construction Project Management; Pareto–Building Improvement: Westchester, IL, USA, 2010;p. 432.
96. Chinese Academy of Science and Technology for Development. China National Innovation Index Report2013. Available online: http://www.most.gov.cn/kjtj/201511/P020151117383919061369.pdf (accessed on 21December 2015).
97. Zhao, K.; Xuan, A. Set pair theory-a new theory method of non-define and its applications. Syst. Eng. 1996,14, 14–26.
98. Xing, W.; Ye, X.; Kui, L. Measuring convergence of China's ICT industry: An input–output analysis.Telecommun. Policy 2011, 35, 301–313. [CrossRef]
99. Berezinski, P.; Jasiul, B.; Szpyrka, M. An entropy-based network anomaly detection method. Entropy 2015,17, 2367–2408. [CrossRef]
100. Faed, A.; Chang, E.; Saberi, M.; Hussain, O.K.; Azadeh, A. Intelligent customer complaint handling utilisingprincipal component and data envelopment analysis (PDA). Appl. Soft Comput. J. 2015. [CrossRef]
101. Dong, X.; Guo, J.; Höök, M.; Pi, G. Sustainability assessment of the natural gas industry in China usingprincipal component analysis. Sustainability 2015, 7, 6102–6118. [CrossRef]
102. Chen, J.; Yang, X.; Wang, Z.; Zhang, L. Vulnerability and influence mechanisms of rural tourismsocio-ecological systems: A household survey in China‘s Qinling mountain area. Tour. Trib. 2015, 30,64–75.
103. Likar, B.; Kopa, J.; Fatur, P. Innovation investment and economic performance in transition economies:Evidence from Slovenia. Innov. Manag. Policy Pract. 2014, 16, 53–66. [CrossRef]
104. Hemphill, T.A. Policy debate: The US advanced manufacturing initiative: Will it be implemented as aninnovation—Or industrial—Policy? Innov. Manag. Policy Pract. 2014, 16, 67–70. [CrossRef]
105. Cabrilo, S.; Grubic-Nesic, L. Ic-Based Innovation Gap Assessment: A Support Tool for the Creation ofEffective Innovation Strategies in the Knowledge Era. In Proceedings of the 4th European Conference onIntellectual Capital, Helsinki, Finland, 23–24 April 2012.
106. Martinez, M.G. Co-creation of value by open innovation: Unlocking new sources of competitive advantage.Agribusiness 2014, 30, 132–147. [CrossRef]
107. Hsieh, M.; Wu, C.; Ting, P.; Lin, T. A study on project partner's alignment process and value innovation.Mark. Rev. 2013, 10, 345–370.
108. Reitzig, M.; Puranam, P. Value appropriation as an organizational capability: The case of IP protectionthrough patents. Strat. Manag. J. 2009, 30, 765–789. [CrossRef]
109. Giannopoulou, E.; YstrÖM, A.; Ollila, S. Turning open innovation into practice: Open innovation researchthrough the lens of managers. Int. J. Innov. Manag. 2011, 15, 505–524. [CrossRef]
110. Roy, M.; Donaldson, C.; Baker, R.; Kerr, S. The potential of social enterprise to enhance health and well-being:A model and systematic review. Soc. Sci. Med. 2014, 123, 182–193. [CrossRef] [PubMed]
111. Bolanos, A.B. External Vulnerabilities and Economic Integration: Is the Union of South American Nations aPromising Project? J. Econ. Dev. 2014, 39, 97–131.
112. Culpepper, P.D.; Reinke, R. Structural power and bank bailouts in the United Kingdom and the United States.Polit. Soc. 2014, 42, 427–454. [CrossRef]
113. Murphy, E.; Scott, M. Household vulnerability in rural areas: Results of an index applied during a housingcrash, economic crisis and under austerity conditions. Geoforum 2014, 51, 75–86. [CrossRef]
114. Ala, M.U. A firm-level analysis of the vulnerability of the Bangladeshi pharmaceutical industry to the tripsagreement: Implications for R&D capability and technology transfer. Proced. Econ. Finance 2013, 5, 30–39.
115. Tomes, A. UK government science policy: The 'enterprise deficit' fallacy. Technovation 2003, 23, 785–792.[CrossRef]
360

Sustainability 2016, 8, 17
116. Al-Sudairi, M.; Bakry, S.H. Knowledge issues in the global innovation index: Assessment of the State ofSaudi Arabia versus countries with distinct development. Innov. Manag. Policy Pract. 2014, 16, 176–183.[CrossRef]
117. Kiskiene, A. Scientific knowledge and technology transfer policy in the EU. Econ. Bus. 2014, 26, 36–43.[CrossRef]
118. Ljungquist, U. Unbalanced dynamic capabilities as obstacles of organizational efficiency: Implementationissues in innovative technology adoption. Innov. Manag. Policy Pract. 2014, 16, 82–95. [CrossRef]
© 2015 by the authors. Licensee MDPI, Basel, Switzerland. This article is an open accessarticle distributed under the terms and conditions of the Creative Commons Attribution(CC BY) license (http://creativecommons.org/licenses/by/4.0/).
361
Article
Research on Consumers’ Use Willingness andOpinions of Electric Vehicle Sharing: An EmpiricalStudy in Shanghai
Ning Wang * and Runlin Yan
School of Automotive Studies, Tongji University, Shanghai 201804, China; [email protected]* Correspondence: [email protected]; Tel.: +86-21-6958-3874
Academic Editor: Adam JabłonskiReceived: 19 October 2015; Accepted: 17 December 2015; Published: 23 December 2015
Abstract: An empirical study in Shanghai was performed to explore consumers’ use willingnessand opinions on electric vehicle sharing (EVS) to help operators effectively operate and expandthe new business model. Through the multinomial logistic regression developed for differentgroups, the results show that the factors of the main trip mode in daily use, monthly transportationexpenditure, driving range of electric vehicles, gender, age, marital status and occupation havesignificant influences on consumers’ use willingness. In short, the population characteristics ofpeople choosing to use EVS are male, aged between 18 and 30 and usually taking the subway andbus as the daily transportation modes. Otherwise, the factors of the acceptable highest price of EVS,occupation and personal monthly income have significant impacts on the use willingness of peoplewho keep a neutral stance. These people pay more attention to convenience and the economy of EVS.These results reveal that a reasonable price, accurate positioning of target groups, convenient sitelayout and usage are required for operators to successfully launch a new transportation mode of EVS.
Keywords: electric vehicle sharing; multinomial logistic regression; survey; use willingness
1. Introduction
Research indicates that electric vehicles are not only able to decrease vehicle emissions [1] andslow global warming [2], but also are able to enhance the sustainability of road traffic in the future [3].With energy, environment and other issues becoming increasingly prominent, many countries beganto realize the importance of environmentally-friendly electric vehicles. Most manufacturers also havestarted to develop and commercialize environmentally-friendly electric vehicles [4]. However, electricvehicles are currently limited by insufficient charging infrastructures and driving mileage (the longestdriving range per battery charge). Considering that car sharing is more suitable for people’s short-termtravel demands, the combination of electric vehicles and car sharing is a good way to avoid theseweaknesses and to provide a cleaner transport mode.
Certain cities in the world, such as Barcelona, Paris, Berlin, Hamburg, Rotterdam and Stockholm,are implementing electric vehicle sharing (EVS) [5]. In China, EVS is still in the initial developmentphase. China Car Club in Hangzhou and Eduoauto in Beijing are the pioneers for developing EVS.China Car Club was invested in by Intunecapital in early 2013, and it is based on the model ofself-purchasing cars. Eduoauto is based on the model of light assets, and the operational vehicles aremainly provided by enterprises qualified for car rental, not bought by the company itself. eHi CarServices launched a pilot EVS program in Jading district of Shanghai in June 2013, but the progressis very slow. At present, there are several EVS services, such as EVCARD hosted by ShanghaiInternational Automobile City, YiKaZuChe in Beijing, Weigongjiao in Hangzhou, etc.
Sustainability 2016, 8, 7; doi:10.3390/su8010007 www.mdpi.com/journal/sustainability362
Sustainability 2016, 8, 7
In recent years, governments have begun to attach more importance to EVS, which contributed tothe rapid development of EVS. In July 2014, the General Office of the State Council in China releasedthe No. 35 document of “Instructions on accelerating the promotion and application of new energyvehicles” [6], which emphasized the needs of “exploring innovative business models, such as thetime-sharing leasing, car sharing, vehicle leasing, mortgage purchase for new energy vehicles, etc.”.The EVS program also has received support from the local governments. The Beijing Municipal Scienceand Technology Commission has listed EVS as a key supported project and set up many operationalindicators. Other cities, such as Shanghai, Hangzhou, Shaoxing, Ningbo, Wuhan, Shenzhen, Yancheng,Chongqing, and so on, have launched or are actively ready to launch an EVS program.
From the analysis above, it can be known that the number of EVS enterprises operating is few,and most of them lack experience. With the support from the government, there will be more andmore domestic companies involved in EVS in the next few foreseeable years. Nevertheless, howconsumers think about EVS, whether they will use the service and their related preference are stillunclear. Therefore, in order to promote all-round development of EVS and to help the enterprisesachieve better operation, a questionnaire was designed to collect information about the acceptance ofconsumers and influencing factors for using EVS. Some suggestions are provided for EVS operators topromote its rapid development in China.
2. Literature Review
In the late 1980s, a preliminary model of car sharing appeared abroad. However, scholars startedto research car sharing in the 1990s. At the beginning of the research, most studies were at thequalitative level, and scholars paid more attention to the feasibility of the car sharing model andconsumer usage. Based on a large number of empirical studies, Meijkamp [7] in The Netherlandspointed out that car sharing as an alternative to private cars, because it had higher economic andecological efficiency. Barth and Shaheen [8] had an opinion that car sharing could improve the trafficefficiency by reducing the number of private cars and improve the efficiency of energy and emissions.They also introduced a variety of car sharing systems and described the development prospect of carsharing in China. Prettenthaler and Steininger [9] researched how driving mileage influenced the carsharing users to make decisions. Results showed that using car sharing was better than using privatecars when user’s travel range was less than 18,000 km per year. However, if insurance and the vehicledepreciation rate are taken into account, the balanced driving distance of users decreased to 15,000 km.Seik [10] studied car sharing in Singapore and found that members still mainly used public transportfor travelling to work after attaining membership, but turned more often to shared cars rather thanpublic transport for marginal uses, such as leisure and social trips. Most of them chose car sharing forits marginal use and cost savings.
Entering the 21st century, foreign scholars gradually began to study the operation system of carsharing, the optimization of staff, site layout, vehicle allocation, etc., from the quantitative perspective.Barth and Todd [11] used a computer to simulate the distribution of available vehicles and energyconsumption in car sharing sites. Results showed that the influencing factors of the car sharing systemwere the proportion of demand, the charging strategy for the electric vehicles and the vehicle allocationalgorithm. The main problems of the car sharing service that should be considered at the beginning ofthe establishment were service pricing, target customer selection, vehicle type selection, site location,etc. [12]. Xu and Lim [13] established a mathematical model for the vehicles sharing site layout inSingapore and used the improved neural network model to predict the car sharing net flows. Kek etal. [14] provided a three-stage decision optimization model for the car sharing operator. They analyzedthe optimal distribution of staff and vehicles and used operational data from the Singapore sharingcompany to verify the model. Correia and Antunes [15] had studied the problem of car sharingsite planning. Under the goal of maximizing the profit for the car sharing operating company, theyestablished a mixed integer programming model to solve the unbalanced number of sharing carsbetween different sites.
363
Sustainability 2016, 8, 7
At present, there are few research works on EVS abroad, and most of them focus on operatingstatus analysis and consumer surveys. Quantitative studies on EVS are rare. Alessandro et al. [16]introduced the EVS project of Green Move and studied the shared service strategies and objectives. Byinvestigating the feasibility of EVS as a private car for elderly, Shaheen et al. [17] found that 30% ofrespondents were interested in participating, but all participants would make a plan before they woulduse the car, indicating that EVS still has the range anxiety problem. This problem is caused by thelimited driving range of electric vehicles. Using data from 533 members of the EVS program in Seoul,Kim et al. [18] found that the participants were rather reluctant to change their car ownership, but hadintensions to continue participating in the program. Social and economic perspectives were the mostimportant factors affecting the participants’ attitudes. In addition, the attitudes varied depending onpersonal characteristics, such as gender, age and income.
Domestic research progress on the car sharing model is relatively late. In 2000, Huang andYang [19] were the first to research car sharing and introduced its development history abroad.They summarized the benefits of this new public transport pattern, the impact on travel behaviorand its possible target market (people who have no private cars or have a high cost of ownership).Market demand, quality of service and advanced public transportation are important factors forsuccessful car sharing. Ye and Yang [20] summarized and introduced the concept, development statusand influence of car sharing. They also explained its characteristics (low-cost, flexible) and target group(replacement selection for people who wanted to buy a second car). Gao [21] explained the concept of“shared car” in detail and presented the concept of “Auto Club”. Its development prospect in Chinawas also studied. Qiu [22] analyzed the key influencing factors for car sharing development in China.Results showed that educational level of respondents, number of owned private cars and convenienceof EVS had impacts on consumers’ use willingness. Xue et al. [23] combed the classification of carsharing and analyzed the impact of this service on car ownership, travel cost, usage cost, energysavings and emission reduction. Through an empirical study, they found that the target group ofcar sharing was people who are 25–40 years old and have an above average educational level. Themodel of Zipcar in the United States was studied by Wu [24]. He investigated the potential market ofcar sharing service in Guangzhou and demonstrated the significance of promoting car sharing. Hepointed out that car sharing is very promising in China and will be an alternative to other means oftransportation. By introducing the development of car sharing in Hanover, He [25] pointed out thata shared car could replace 6–10 private cars and radically reduce automobile usage. Xia et al. [26]had carried out empirical research on an informal car sharing service in Beijing from the perspectiveof economic and ecological efficiency. They suggested that the government should regulate such anindustry and formulate relevant policies to support the development of shared services.
From the analysis above, it is obvious that domestic research on EVS is very small in quantity.More studies are focused on the operating model description, case analysis and the prospect forecastof traditional vehicle sharing. From the perspective of operators, a questionnaire was implementedin Shanghai to find factors affecting consumers’ use willingness of electric vehicle sharing, includingtravel characteristics, expectation of EVS and socio-demographics and then proposed correspondingsuggestions for station location, driving range choice and model selection for EVS. At the same time,the target group and potential market in Shanghai for using EVS were pointed out. This will help theoperations of enterprises effectively.
3. Research Method
3.1. Questionnaire Design
The paper questionnaire was implemented and disseminated offline. Through this, we havelearned comprehensive knowledge about EVS acceptance. Finally, the target population of EVS waspointed out by analysis.
The questionnaire was divided into three parts. The first part has three questions about travelcharacteristics, including main trip mode in daily use, factors considered when choosing the trip mode
364
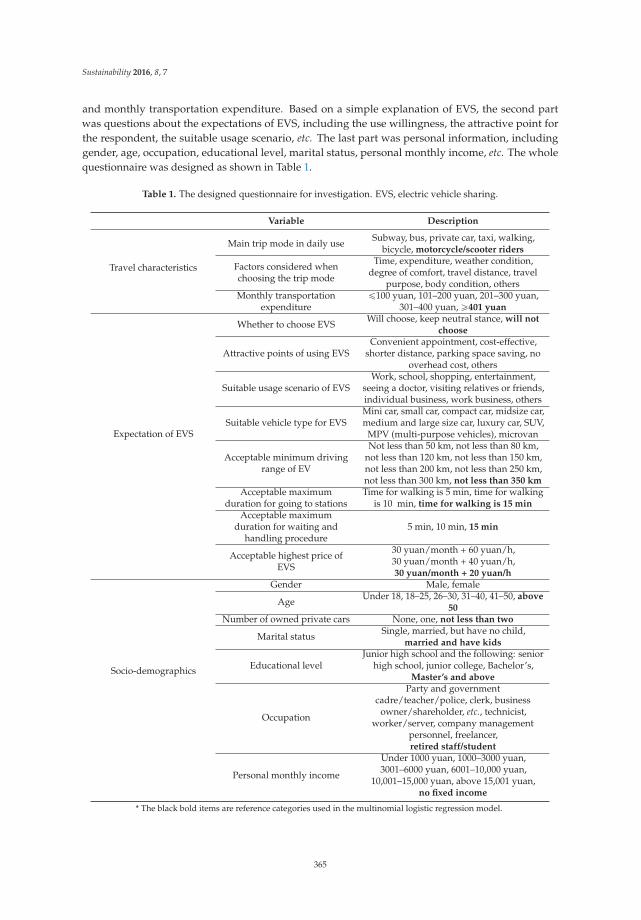
Sustainability 2016, 8, 7
and monthly transportation expenditure. Based on a simple explanation of EVS, the second partwas questions about the expectations of EVS, including the use willingness, the attractive point forthe respondent, the suitable usage scenario, etc. The last part was personal information, includinggender, age, occupation, educational level, marital status, personal monthly income, etc. The wholequestionnaire was designed as shown in Table 1.
Table 1. The designed questionnaire for investigation. EVS, electric vehicle sharing.
Variable Description
Travel characteristics
Main trip mode in daily use Subway, bus, private car, taxi, walking,bicycle, motorcycle/scooter riders
Factors considered whenchoosing the trip mode
Time, expenditure, weather condition,degree of comfort, travel distance, travel
purpose, body condition, othersMonthly transportation
expenditureď100 yuan, 101–200 yuan, 201–300 yuan,
301–400 yuan, ě401 yuan
Expectation of EVS
Whether to choose EVS Will choose, keep neutral stance, will notchoose
Attractive points of using EVSConvenient appointment, cost-effective,
shorter distance, parking space saving, nooverhead cost, others
Suitable usage scenario of EVSWork, school, shopping, entertainment,
seeing a doctor, visiting relatives or friends,individual business, work business, others
Suitable vehicle type for EVSMini car, small car, compact car, midsize car,medium and large size car, luxury car, SUV,
MPV (multi-purpose vehicles), microvan
Acceptable minimum drivingrange of EV
Not less than 50 km, not less than 80 km,not less than 120 km, not less than 150 km,not less than 200 km, not less than 250 km,not less than 300 km, not less than 350 km
Acceptable maximumduration for going to stations
Time for walking is 5 min, time for walkingis 10 min, time for walking is 15 min
Acceptable maximumduration for waiting and
handling procedure5 min, 10 min, 15 min
Acceptable highest price ofEVS
30 yuan/month + 60 yuan/h,30 yuan/month + 40 yuan/h,30 yuan/month + 20 yuan/h
Socio-demographics
Gender Male, female
Age Under 18, 18–25, 26–30, 31–40, 41–50, above50
Number of owned private cars None, one, not less than two
Marital status Single, married, but have no child,married and have kids
Educational levelJunior high school and the following: senior
high school, junior college, Bachelor’s,Master’s and above
Occupation
Party and governmentcadre/teacher/police, clerk, business
owner/shareholder, etc., technicist,worker/server, company management
personnel, freelancer,retired staff/student
Personal monthly income
Under 1000 yuan, 1000–3000 yuan,3001–6000 yuan, 6001–10,000 yuan,
10,001–15,000 yuan, above 15,001 yuan,no fixed income
* The black bold items are reference categories used in the multinomial logistic regression model.
365
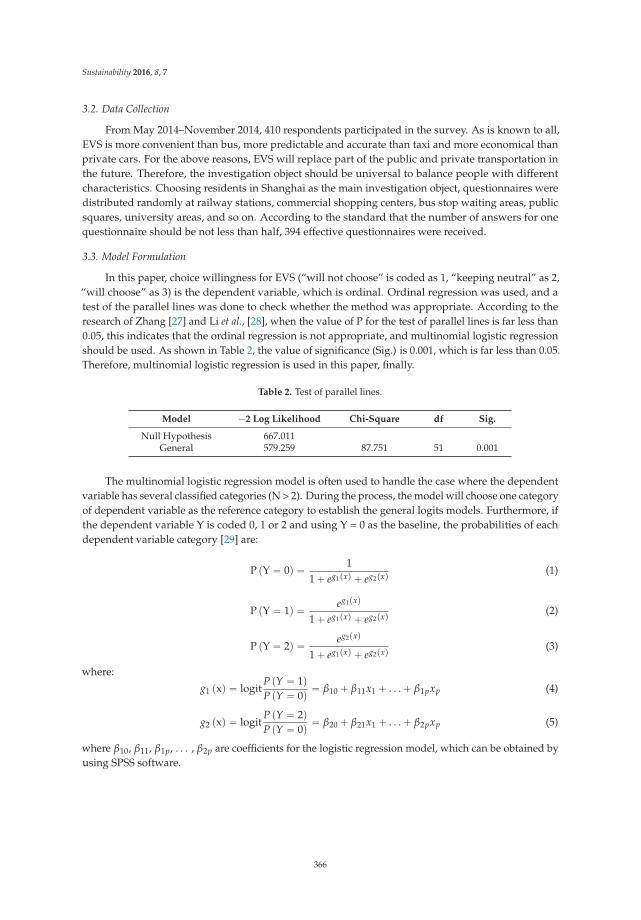
Sustainability 2016, 8, 7
3.2. Data Collection
From May 2014–November 2014, 410 respondents participated in the survey. As is known to all,EVS is more convenient than bus, more predictable and accurate than taxi and more economical thanprivate cars. For the above reasons, EVS will replace part of the public and private transportation inthe future. Therefore, the investigation object should be universal to balance people with differentcharacteristics. Choosing residents in Shanghai as the main investigation object, questionnaires weredistributed randomly at railway stations, commercial shopping centers, bus stop waiting areas, publicsquares, university areas, and so on. According to the standard that the number of answers for onequestionnaire should be not less than half, 394 effective questionnaires were received.
3.3. Model Formulation
In this paper, choice willingness for EVS (“will not choose” is coded as 1, “keeping neutral” as 2,“will choose” as 3) is the dependent variable, which is ordinal. Ordinal regression was used, and atest of the parallel lines was done to check whether the method was appropriate. According to theresearch of Zhang [27] and Li et al., [28], when the value of P for the test of parallel lines is far less than0.05, this indicates that the ordinal regression is not appropriate, and multinomial logistic regressionshould be used. As shown in Table 2, the value of significance (Sig.) is 0.001, which is far less than 0.05.Therefore, multinomial logistic regression is used in this paper, finally.
Table 2. Test of parallel lines.
Model ´2 Log Likelihood Chi-Square df Sig.
Null Hypothesis 667.011General 579.259 87.751 51 0.001
The multinomial logistic regression model is often used to handle the case where the dependentvariable has several classified categories (N > 2). During the process, the model will choose one categoryof dependent variable as the reference category to establish the general logits models. Furthermore, ifthe dependent variable Y is coded 0, 1 or 2 and using Y = 0 as the baseline, the probabilities of eachdependent variable category [29] are:
P pY “ 0q “ 11 ` eg1pxq ` eg2pxq (1)
P pY “ 1q “ eg1pxq1 ` eg1pxq ` eg2pxq (2)
P pY “ 2q “ eg2pxq1 ` eg1pxq ` eg2pxq (3)
where:
g1 pxq “ logitP pY “ 1qP pY “ 0q “ β10 ` β11x1 ` . . . ` β1pxp (4)
g2 pxq “ logitP pY “ 2qP pY “ 0q “ β20 ` β21x1 ` . . . ` β2pxp (5)
where β10, β11, β1p, . . . , β2p are coefficients for the logistic regression model, which can be obtained byusing SPSS software.
366
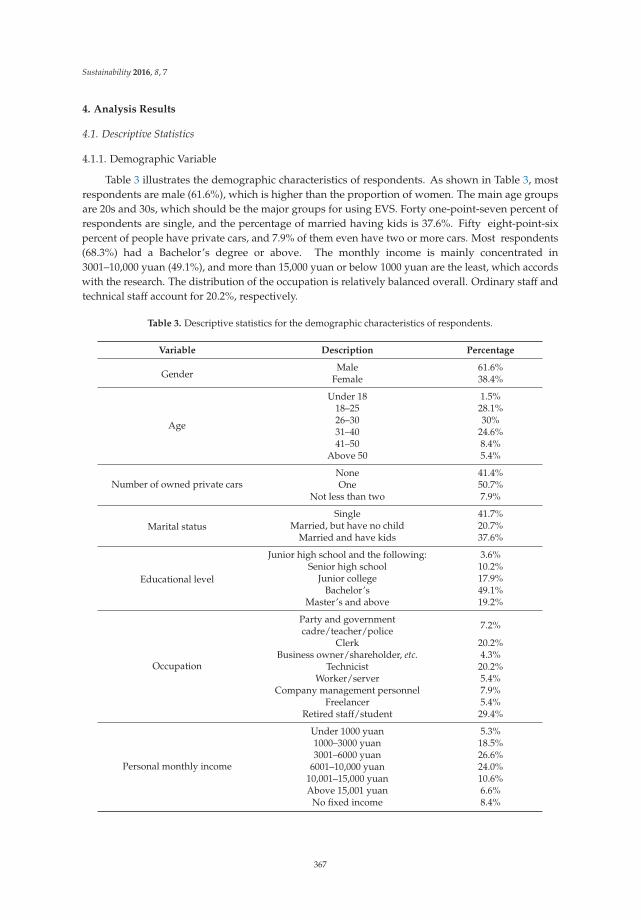
Sustainability 2016, 8, 7
4. Analysis Results
4.1. Descriptive Statistics
4.1.1. Demographic Variable
Table 3 illustrates the demographic characteristics of respondents. As shown in Table 3, mostrespondents are male (61.6%), which is higher than the proportion of women. The main age groupsare 20s and 30s, which should be the major groups for using EVS. Forty one-point-seven percent ofrespondents are single, and the percentage of married having kids is 37.6%. Fifty eight-point-sixpercent of people have private cars, and 7.9% of them even have two or more cars. Most respondents(68.3%) had a Bachelor’s degree or above. The monthly income is mainly concentrated in3001–10,000 yuan (49.1%), and more than 15,000 yuan or below 1000 yuan are the least, which accordswith the research. The distribution of the occupation is relatively balanced overall. Ordinary staff andtechnical staff account for 20.2%, respectively.
Table 3. Descriptive statistics for the demographic characteristics of respondents.
Variable Description Percentage
GenderMale 61.6%
Female 38.4%
Age
Under 18 1.5%18–25 28.1%26–30 30%31–40 24.6%41–50 8.4%
Above 50 5.4%
Number of owned private carsNone 41.4%One 50.7%
Not less than two 7.9%
Marital statusSingle 41.7%
Married, but have no child 20.7%Married and have kids 37.6%
Educational level
Junior high school and the following: 3.6%Senior high school 10.2%
Junior college 17.9%Bachelor’s 49.1%
Master’s and above 19.2%
Occupation
Party and governmentcadre/teacher/police 7.2%
Clerk 20.2%Business owner/shareholder, etc. 4.3%
Technicist 20.2%Worker/server 5.4%
Company management personnel 7.9%Freelancer 5.4%
Retired staff/student 29.4%
Personal monthly income
Under 1000 yuan 5.3%1000–3000 yuan 18.5%3001–6000 yuan 26.6%
6001–10,000 yuan 24.0%10,001–15,000 yuan 10.6%Above 15,001 yuan 6.6%
No fixed income 8.4%
367
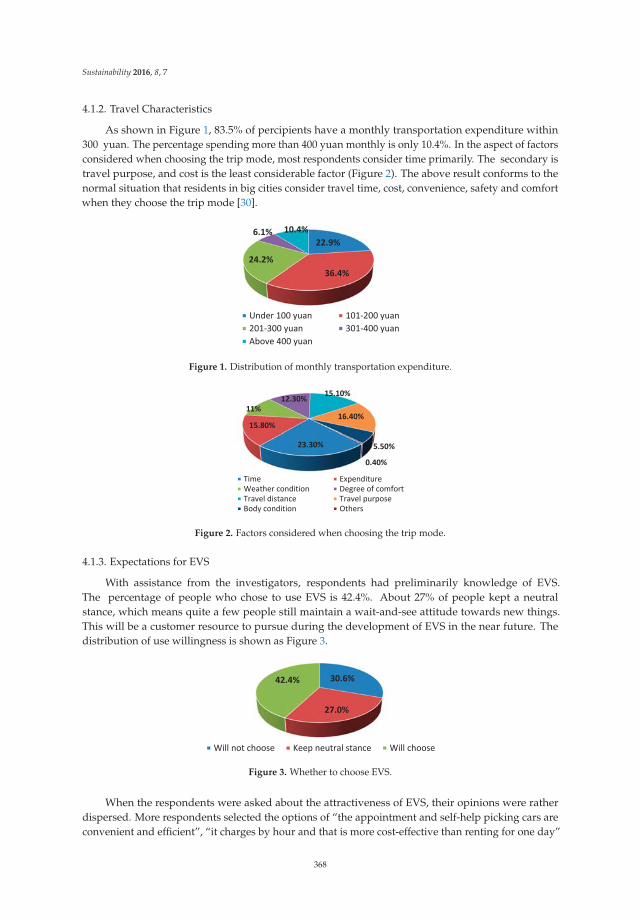
Sustainability 2016, 8, 7
4.1.2. Travel Characteristics
As shown in Figure 1, 83.5% of percipients have a monthly transportation expenditure within300 yuan. The percentage spending more than 400 yuan monthly is only 10.4%. In the aspect of factorsconsidered when choosing the trip mode, most respondents consider time primarily. The secondary istravel purpose, and cost is the least considerable factor (Figure 2). The above result conforms to thenormal situation that residents in big cities consider travel time, cost, convenience, safety and comfortwhen they choose the trip mode [30].
22.9%
36.4%24.2%
6.1% 10.4%
Under 100 yuan 101 200 yuan201 300 yuan 301 400 yuanAbove 400 yuan
Figure 1. Distribution of monthly transportation expenditure.
23.30%
15.80%
11%12.30%
15.10%
16.40%
5.50%
0.40%
Time ExpenditureWeather condition Degree of comfortTravel distance Travel purposeBody condition Others
Figure 2. Factors considered when choosing the trip mode.
4.1.3. Expectations for EVS
With assistance from the investigators, respondents had preliminarily knowledge of EVS.The percentage of people who chose to use EVS is 42.4%. About 27% of people kept a neutralstance, which means quite a few people still maintain a wait-and-see attitude towards new things.This will be a customer resource to pursue during the development of EVS in the near future. Thedistribution of use willingness is shown as Figure 3.
30.6%
27.0%
42.4%
Will not choose Keep neutral stance Will choose
Figure 3. Whether to choose EVS.
When the respondents were asked about the attractiveness of EVS, their opinions were ratherdispersed. More respondents selected the options of “the appointment and self-help picking cars areconvenient and efficient”, “it charges by hour and that is more cost-effective than renting for one day”
368
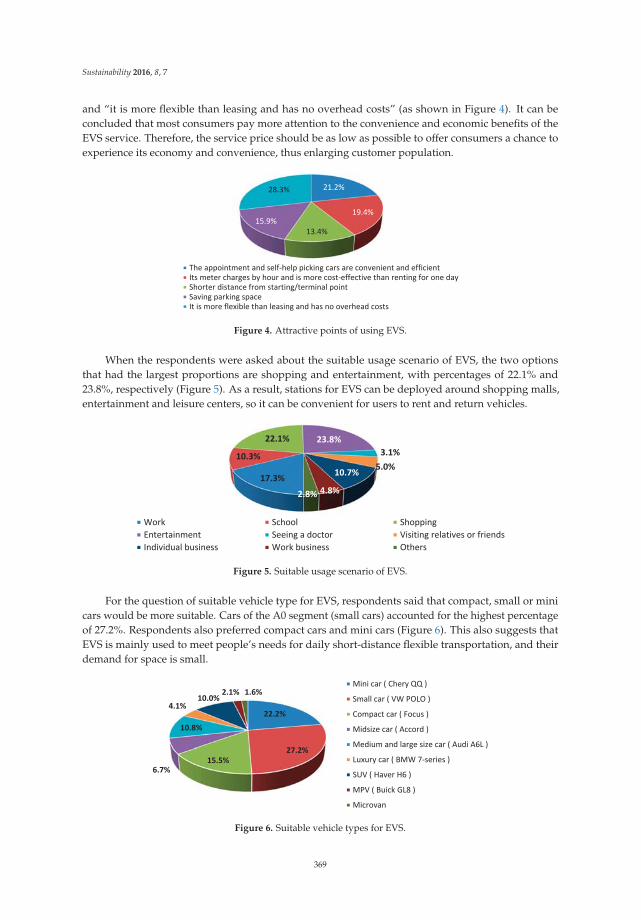
Sustainability 2016, 8, 7
and “it is more flexible than leasing and has no overhead costs” (as shown in Figure 4). It can beconcluded that most consumers pay more attention to the convenience and economic benefits of theEVS service. Therefore, the service price should be as low as possible to offer consumers a chance toexperience its economy and convenience, thus enlarging customer population.
21.2%
19.4%
13.4%15.9%
28.3%
The appointment and self help picking cars are convenient and efficientIts meter charges by hour and is more cost effective than renting for one dayShorter distance from starting/terminal pointSaving parking spaceIt is more flexible than leasing and has no overhead costs
Figure 4. Attractive points of using EVS.
When the respondents were asked about the suitable usage scenario of EVS, the two optionsthat had the largest proportions are shopping and entertainment, with percentages of 22.1% and23.8%, respectively (Figure 5). As a result, stations for EVS can be deployed around shopping malls,entertainment and leisure centers, so it can be convenient for users to rent and return vehicles.
17.3%
10.3%
22.1% 23.8%3.1%5.0%10.7%
4.8%2.8%
Work School ShoppingEntertainment Seeing a doctor Visiting relatives or friendsIndividual business Work business Others
Figure 5. Suitable usage scenario of EVS.
For the question of suitable vehicle type for EVS, respondents said that compact, small or minicars would be more suitable. Cars of the A0 segment (small cars) accounted for the highest percentageof 27.2%. Respondents also preferred compact cars and mini cars (Figure 6). This also suggests thatEVS is mainly used to meet people’s needs for daily short-distance flexible transportation, and theirdemand for space is small.
22.2%
27.2%15.5%
6.7%
10.8%
4.1%10.0%
2.1% 1.6%Mini car ( Chery QQ )
Small car ( VW POLO )
Compact car ( Focus )
Midsize car ( Accord )
Medium and large size car ( Audi A6L )
Luxury car ( BMW 7 series )
SUV ( Haver H6 )
MPV ( Buick GL8 )
Microvan
Figure 6. Suitable vehicle types for EVS.
369
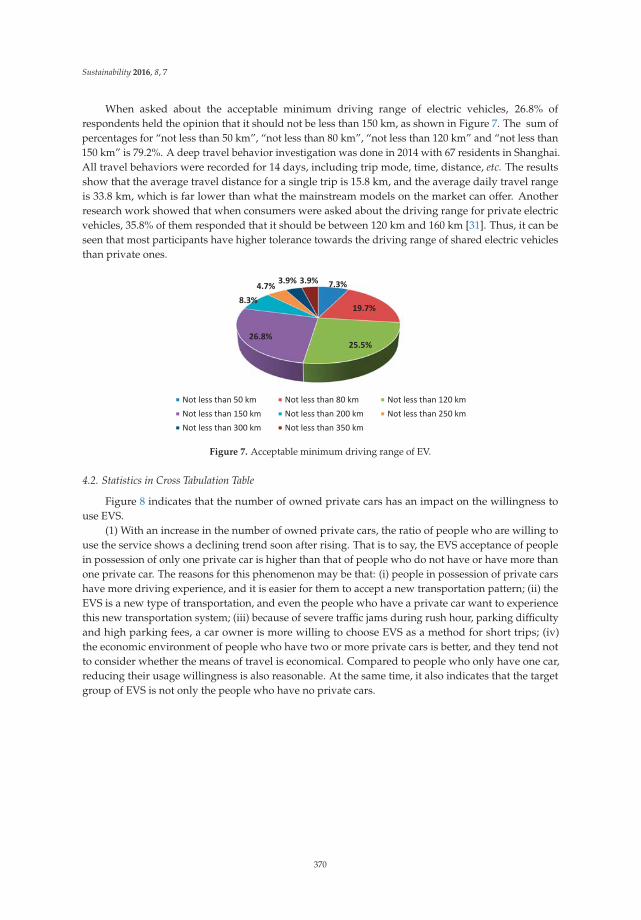
Sustainability 2016, 8, 7
When asked about the acceptable minimum driving range of electric vehicles, 26.8% ofrespondents held the opinion that it should not be less than 150 km, as shown in Figure 7. The sum ofpercentages for “not less than 50 km”, “not less than 80 km”, “not less than 120 km” and “not less than150 km” is 79.2%. A deep travel behavior investigation was done in 2014 with 67 residents in Shanghai.All travel behaviors were recorded for 14 days, including trip mode, time, distance, etc. The resultsshow that the average travel distance for a single trip is 15.8 km, and the average daily travel rangeis 33.8 km, which is far lower than what the mainstream models on the market can offer. Anotherresearch work showed that when consumers were asked about the driving range for private electricvehicles, 35.8% of them responded that it should be between 120 km and 160 km [31]. Thus, it can beseen that most participants have higher tolerance towards the driving range of shared electric vehiclesthan private ones.
7.3%
19.7%
25.5%26.8%
8.3%4.7% 3.9% 3.9%
Not less than 50 km Not less than 80 km Not less than 120 kmNot less than 150 km Not less than 200 km Not less than 250 kmNot less than 300 km Not less than 350 km
Figure 7. Acceptable minimum driving range of EV.
4.2. Statistics in Cross Tabulation Table
Figure 8 indicates that the number of owned private cars has an impact on the willingness touse EVS.
(1) With an increase in the number of owned private cars, the ratio of people who are willing touse the service shows a declining trend soon after rising. That is to say, the EVS acceptance of peoplein possession of only one private car is higher than that of people who do not have or have more thanone private car. The reasons for this phenomenon may be that: (i) people in possession of private carshave more driving experience, and it is easier for them to accept a new transportation pattern; (ii) theEVS is a new type of transportation, and even the people who have a private car want to experiencethis new transportation system; (iii) because of severe traffic jams during rush hour, parking difficultyand high parking fees, a car owner is more willing to choose EVS as a method for short trips; (iv)the economic environment of people who have two or more private cars is better, and they tend notto consider whether the means of travel is economical. Compared to people who only have one car,reducing their usage willingness is also reasonable. At the same time, it also indicates that the targetgroup of EVS is not only the people who have no private cars.
370
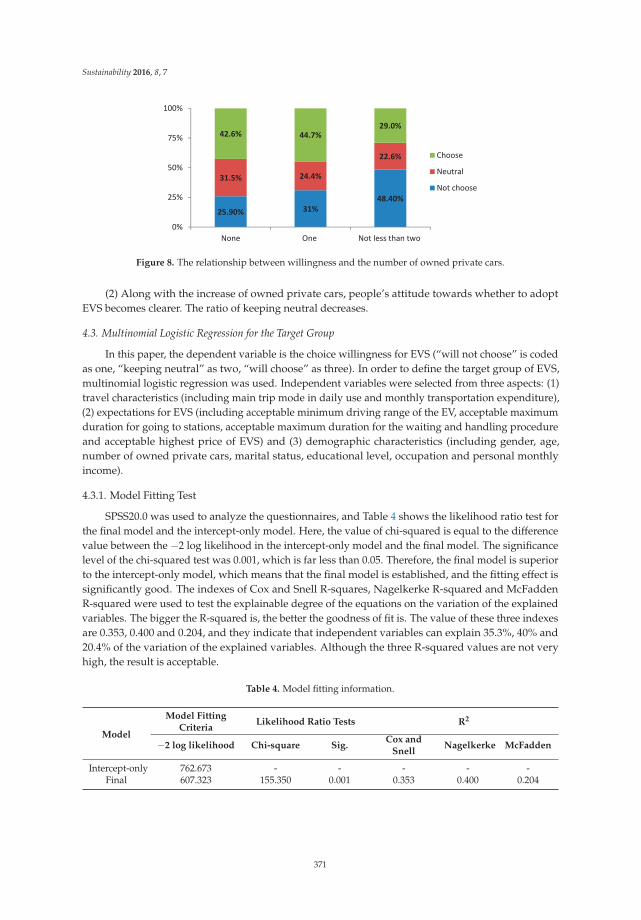
Sustainability 2016, 8, 7
25.90% 31%48.40%
31.5% 24.4%
22.6%
42.6% 44.7%29.0%
0%
25%
50%
75%
100%
None One Not less than two
Choose
Neutral
Not choose
Figure 8. The relationship between willingness and the number of owned private cars.
(2) Along with the increase of owned private cars, people’s attitude towards whether to adoptEVS becomes clearer. The ratio of keeping neutral decreases.
4.3. Multinomial Logistic Regression for the Target Group
In this paper, the dependent variable is the choice willingness for EVS (“will not choose” is codedas one, “keeping neutral” as two, “will choose” as three). In order to define the target group of EVS,multinomial logistic regression was used. Independent variables were selected from three aspects: (1)travel characteristics (including main trip mode in daily use and monthly transportation expenditure),(2) expectations for EVS (including acceptable minimum driving range of the EV, acceptable maximumduration for going to stations, acceptable maximum duration for the waiting and handling procedureand acceptable highest price of EVS) and (3) demographic characteristics (including gender, age,number of owned private cars, marital status, educational level, occupation and personal monthlyincome).
4.3.1. Model Fitting Test
SPSS20.0 was used to analyze the questionnaires, and Table 4 shows the likelihood ratio test forthe final model and the intercept-only model. Here, the value of chi-squared is equal to the differencevalue between the ´2 log likelihood in the intercept-only model and the final model. The significancelevel of the chi-squared test was 0.001, which is far less than 0.05. Therefore, the final model is superiorto the intercept-only model, which means that the final model is established, and the fitting effect issignificantly good. The indexes of Cox and Snell R-squares, Nagelkerke R-squared and McFaddenR-squared were used to test the explainable degree of the equations on the variation of the explainedvariables. The bigger the R-squared is, the better the goodness of fit is. The value of these three indexesare 0.353, 0.400 and 0.204, and they indicate that independent variables can explain 35.3%, 40% and20.4% of the variation of the explained variables. Although the three R-squared values are not veryhigh, the result is acceptable.
Table 4. Model fitting information.
Model
Model FittingCriteria
Likelihood Ratio Tests R2
´2 log likelihood Chi-square Sig.Cox and
SnellNagelkerke McFadden
Intercept-only 762.673 - - - - -Final 607.323 155.350 0.001 0.353 0.400 0.204
371
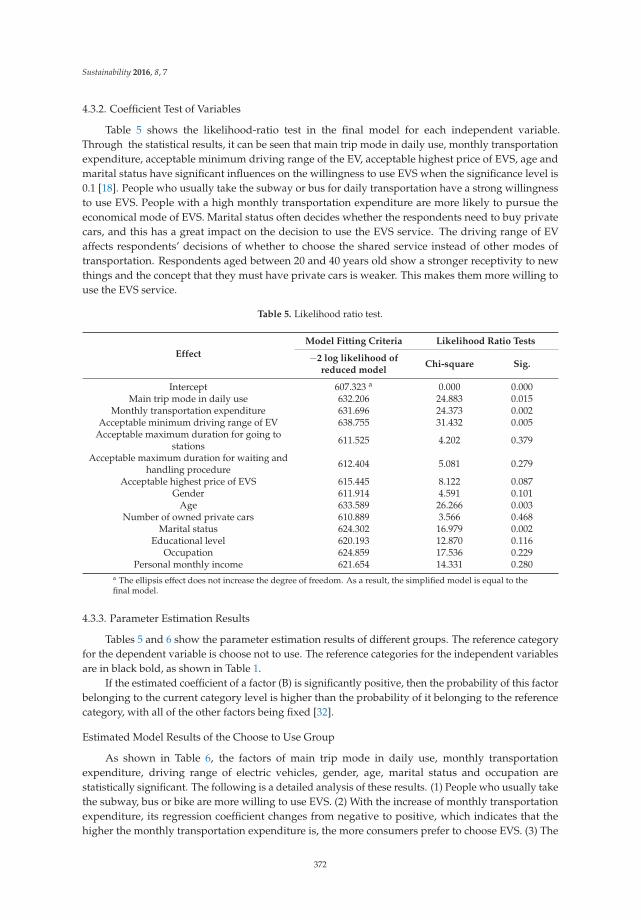
Sustainability 2016, 8, 7
4.3.2. Coefficient Test of Variables
Table 5 shows the likelihood-ratio test in the final model for each independent variable.Through the statistical results, it can be seen that main trip mode in daily use, monthly transportationexpenditure, acceptable minimum driving range of the EV, acceptable highest price of EVS, age andmarital status have significant influences on the willingness to use EVS when the significance level is0.1 [18]. People who usually take the subway or bus for daily transportation have a strong willingnessto use EVS. People with a high monthly transportation expenditure are more likely to pursue theeconomical mode of EVS. Marital status often decides whether the respondents need to buy privatecars, and this has a great impact on the decision to use the EVS service. The driving range of EVaffects respondents’ decisions of whether to choose the shared service instead of other modes oftransportation. Respondents aged between 20 and 40 years old show a stronger receptivity to newthings and the concept that they must have private cars is weaker. This makes them more willing touse the EVS service.
Table 5. Likelihood ratio test.
Effect
Model Fitting Criteria Likelihood Ratio Tests
´2 log likelihood ofreduced model
Chi-square Sig.
Intercept 607.323 a 0.000 0.000Main trip mode in daily use 632.206 24.883 0.015
Monthly transportation expenditure 631.696 24.373 0.002Acceptable minimum driving range of EV 638.755 31.432 0.005
Acceptable maximum duration for going tostations 611.525 4.202 0.379
Acceptable maximum duration for waiting andhandling procedure 612.404 5.081 0.279
Acceptable highest price of EVS 615.445 8.122 0.087Gender 611.914 4.591 0.101
Age 633.589 26.266 0.003Number of owned private cars 610.889 3.566 0.468
Marital status 624.302 16.979 0.002Educational level 620.193 12.870 0.116
Occupation 624.859 17.536 0.229Personal monthly income 621.654 14.331 0.280
a The ellipsis effect does not increase the degree of freedom. As a result, the simplified model is equal to thefinal model.
4.3.3. Parameter Estimation Results
Tables 5 and 6 show the parameter estimation results of different groups. The reference categoryfor the dependent variable is choose not to use. The reference categories for the independent variablesare in black bold, as shown in Table 1.
If the estimated coefficient of a factor (B) is significantly positive, then the probability of this factorbelonging to the current category level is higher than the probability of it belonging to the referencecategory, with all of the other factors being fixed [32].
Estimated Model Results of the Choose to Use Group
As shown in Table 6, the factors of main trip mode in daily use, monthly transportationexpenditure, driving range of electric vehicles, gender, age, marital status and occupation arestatistically significant. The following is a detailed analysis of these results. (1) People who usually takethe subway, bus or bike are more willing to use EVS. (2) With the increase of monthly transportationexpenditure, its regression coefficient changes from negative to positive, which indicates that thehigher the monthly transportation expenditure is, the more consumers prefer to choose EVS. (3) The
372
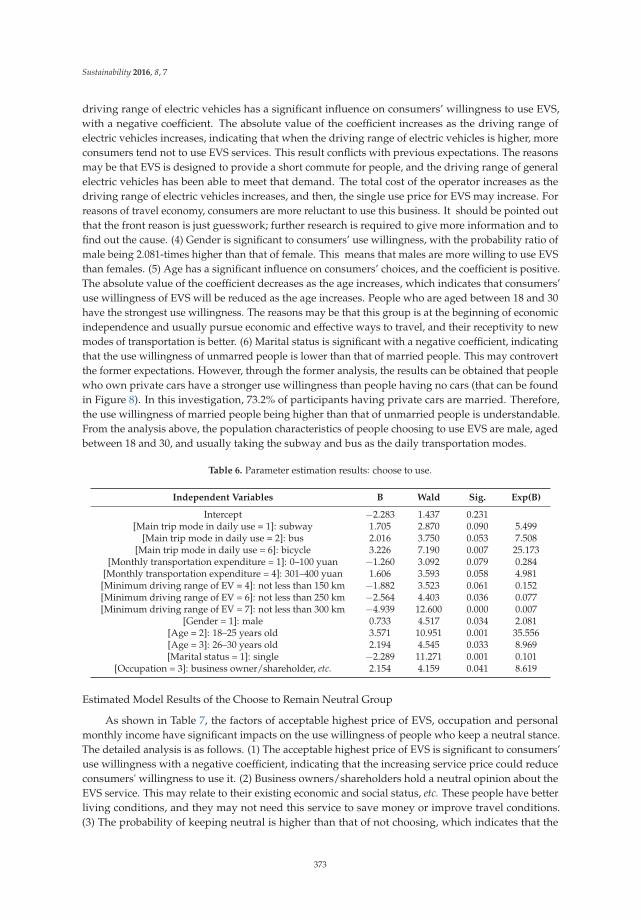
Sustainability 2016, 8, 7
driving range of electric vehicles has a significant influence on consumers’ willingness to use EVS,with a negative coefficient. The absolute value of the coefficient increases as the driving range ofelectric vehicles increases, indicating that when the driving range of electric vehicles is higher, moreconsumers tend not to use EVS services. This result conflicts with previous expectations. The reasonsmay be that EVS is designed to provide a short commute for people, and the driving range of generalelectric vehicles has been able to meet that demand. The total cost of the operator increases as thedriving range of electric vehicles increases, and then, the single use price for EVS may increase. Forreasons of travel economy, consumers are more reluctant to use this business. It should be pointed outthat the front reason is just guesswork; further research is required to give more information and tofind out the cause. (4) Gender is significant to consumers’ use willingness, with the probability ratio ofmale being 2.081-times higher than that of female. This means that males are more willing to use EVSthan females. (5) Age has a significant influence on consumers’ choices, and the coefficient is positive.The absolute value of the coefficient decreases as the age increases, which indicates that consumers’use willingness of EVS will be reduced as the age increases. People who are aged between 18 and 30have the strongest use willingness. The reasons may be that this group is at the beginning of economicindependence and usually pursue economic and effective ways to travel, and their receptivity to newmodes of transportation is better. (6) Marital status is significant with a negative coefficient, indicatingthat the use willingness of unmarred people is lower than that of married people. This may controvertthe former expectations. However, through the former analysis, the results can be obtained that peoplewho own private cars have a stronger use willingness than people having no cars (that can be foundin Figure 8). In this investigation, 73.2% of participants having private cars are married. Therefore,the use willingness of married people being higher than that of unmarried people is understandable.From the analysis above, the population characteristics of people choosing to use EVS are male, agedbetween 18 and 30, and usually taking the subway and bus as the daily transportation modes.
Table 6. Parameter estimation results: choose to use.
Independent Variables B Wald Sig. Exp(B)
Intercept ´2.283 1.437 0.231[Main trip mode in daily use = 1]: subway 1.705 2.870 0.090 5.499
[Main trip mode in daily use = 2]: bus 2.016 3.750 0.053 7.508[Main trip mode in daily use = 6]: bicycle 3.226 7.190 0.007 25.173
[Monthly transportation expenditure = 1]: 0–100 yuan ´1.260 3.092 0.079 0.284[Monthly transportation expenditure = 4]: 301–400 yuan 1.606 3.593 0.058 4.981[Minimum driving range of EV = 4]: not less than 150 km ´1.882 3.523 0.061 0.152[Minimum driving range of EV = 6]: not less than 250 km ´2.564 4.403 0.036 0.077[Minimum driving range of EV = 7]: not less than 300 km ´4.939 12.600 0.000 0.007
[Gender = 1]: male 0.733 4.517 0.034 2.081[Age = 2]: 18–25 years old 3.571 10.951 0.001 35.556[Age = 3]: 26–30 years old 2.194 4.545 0.033 8.969[Marital status = 1]: single ´2.289 11.271 0.001 0.101
[Occupation = 3]: business owner/shareholder, etc. 2.154 4.159 0.041 8.619
Estimated Model Results of the Choose to Remain Neutral Group
As shown in Table 7, the factors of acceptable highest price of EVS, occupation and personalmonthly income have significant impacts on the use willingness of people who keep a neutral stance.The detailed analysis is as follows. (1) The acceptable highest price of EVS is significant to consumers’use willingness with a negative coefficient, indicating that the increasing service price could reduceconsumers' willingness to use it. (2) Business owners/shareholders hold a neutral opinion about theEVS service. This may relate to their existing economic and social status, etc. These people have betterliving conditions, and they may not need this service to save money or improve travel conditions.(3) The probability of keeping neutral is higher than that of not choosing, which indicates that the
373
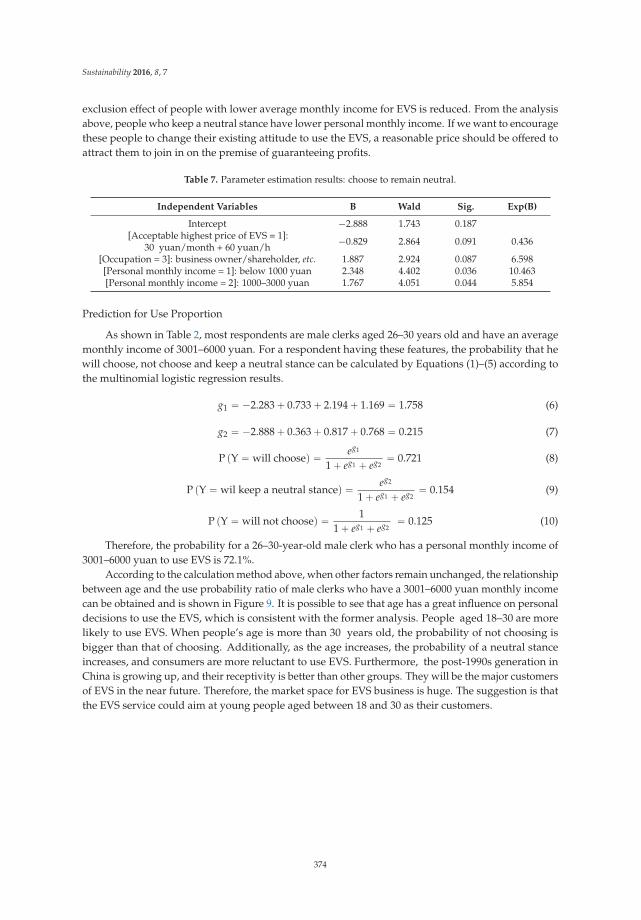
Sustainability 2016, 8, 7
exclusion effect of people with lower average monthly income for EVS is reduced. From the analysisabove, people who keep a neutral stance have lower personal monthly income. If we want to encouragethese people to change their existing attitude to use the EVS, a reasonable price should be offered toattract them to join in on the premise of guaranteeing profits.
Table 7. Parameter estimation results: choose to remain neutral.
Independent Variables B Wald Sig. Exp(B)
Intercept ´2.888 1.743 0.187[Acceptable highest price of EVS = 1]:
30 yuan/month + 60 yuan/h ´0.829 2.864 0.091 0.436
[Occupation = 3]: business owner/shareholder, etc. 1.887 2.924 0.087 6.598[Personal monthly income = 1]: below 1000 yuan 2.348 4.402 0.036 10.463[Personal monthly income = 2]: 1000–3000 yuan 1.767 4.051 0.044 5.854
Prediction for Use Proportion
As shown in Table 2, most respondents are male clerks aged 26–30 years old and have an averagemonthly income of 3001–6000 yuan. For a respondent having these features, the probability that hewill choose, not choose and keep a neutral stance can be calculated by Equations (1)–(5) according tothe multinomial logistic regression results.
g1 “ ´2.283 ` 0.733 ` 2.194 ` 1.169 “ 1.758 (6)
g2 “ ´2.888 ` 0.363 ` 0.817 ` 0.768 “ 0.215 (7)
P pY “ will chooseq “ eg1
1 ` eg1 ` eg2“ 0.721 (8)
P pY “ wil keep a neutral stanceq “ eg2
1 ` eg1 ` eg2“ 0.154 (9)
P pY “ will not chooseq “ 11 ` eg1 ` eg2
“ 0.125 (10)
Therefore, the probability for a 26–30-year-old male clerk who has a personal monthly income of3001–6000 yuan to use EVS is 72.1%.
According to the calculation method above, when other factors remain unchanged, the relationshipbetween age and the use probability ratio of male clerks who have a 3001–6000 yuan monthly incomecan be obtained and is shown in Figure 9. It is possible to see that age has a great influence on personaldecisions to use the EVS, which is consistent with the former analysis. People aged 18–30 are morelikely to use EVS. When people’s age is more than 30 years old, the probability of not choosing isbigger than that of choosing. Additionally, as the age increases, the probability of a neutral stanceincreases, and consumers are more reluctant to use EVS. Furthermore, the post-1990s generation inChina is growing up, and their receptivity is better than other groups. They will be the major customersof EVS in the near future. Therefore, the market space for EVS business is huge. The suggestion is thatthe EVS service could aim at young people aged between 18 and 30 as their customers.
374
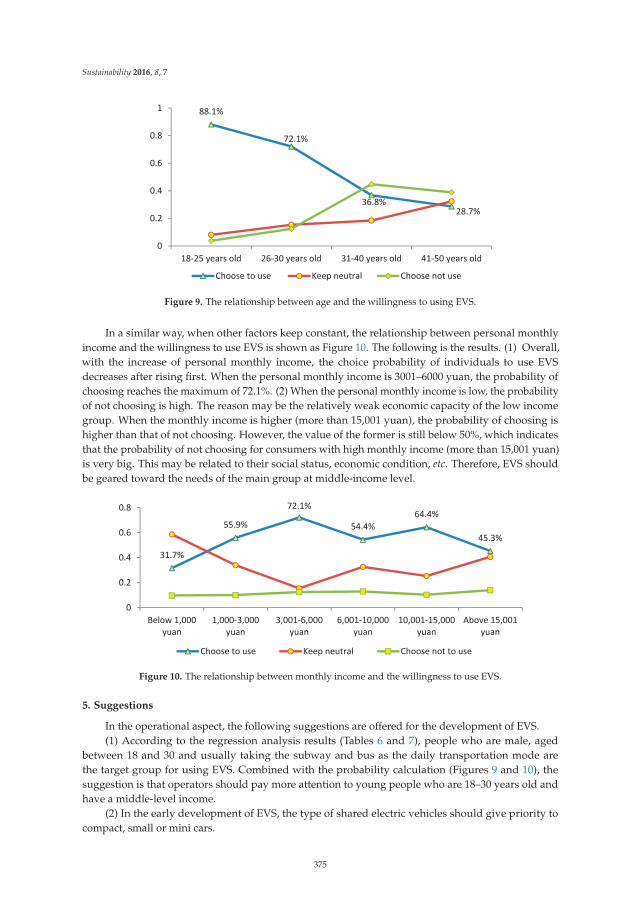
Sustainability 2016, 8, 7
88.1%
72.1%
36.8%28.7%
0
0.2
0.4
0.6
0.8
1
18 25 years old 26 30 years old 31 40 years old 41 50 years old
Choose to use Keep neutral Choose not use
Figure 9. The relationship between age and the willingness to using EVS.
In a similar way, when other factors keep constant, the relationship between personal monthlyincome and the willingness to use EVS is shown as Figure 10. The following is the results. (1) Overall,with the increase of personal monthly income, the choice probability of individuals to use EVSdecreases after rising first. When the personal monthly income is 3001–6000 yuan, the probability ofchoosing reaches the maximum of 72.1%. (2) When the personal monthly income is low, the probabilityof not choosing is high. The reason may be the relatively weak economic capacity of the low incomegroup. When the monthly income is higher (more than 15,001 yuan), the probability of choosing ishigher than that of not choosing. However, the value of the former is still below 50%, which indicatesthat the probability of not choosing for consumers with high monthly income (more than 15,001 yuan)is very big. This may be related to their social status, economic condition, etc. Therefore, EVS shouldbe geared toward the needs of the main group at middle-income level.
31.7%
55.9%
72.1%
54.4%64.4%
45.3%
0
0.2
0.4
0.6
0.8
Below 1,000yuan
1,000 3,000yuan
3,001 6,000yuan
6,001 10,000yuan
10,001 15,000yuan
Above 15,001yuan
Choose to use Keep neutral Choose not to use
Figure 10. The relationship between monthly income and the willingness to use EVS.
5. Suggestions
In the operational aspect, the following suggestions are offered for the development of EVS.(1) According to the regression analysis results (Tables 6 and 7), people who are male, aged
between 18 and 30 and usually taking the subway and bus as the daily transportation mode arethe target group for using EVS. Combined with the probability calculation (Figures 9 and 10), thesuggestion is that operators should pay more attention to young people who are 18–30 years old andhave a middle-level income.
(2) In the early development of EVS, the type of shared electric vehicles should give priority tocompact, small or mini cars.
375
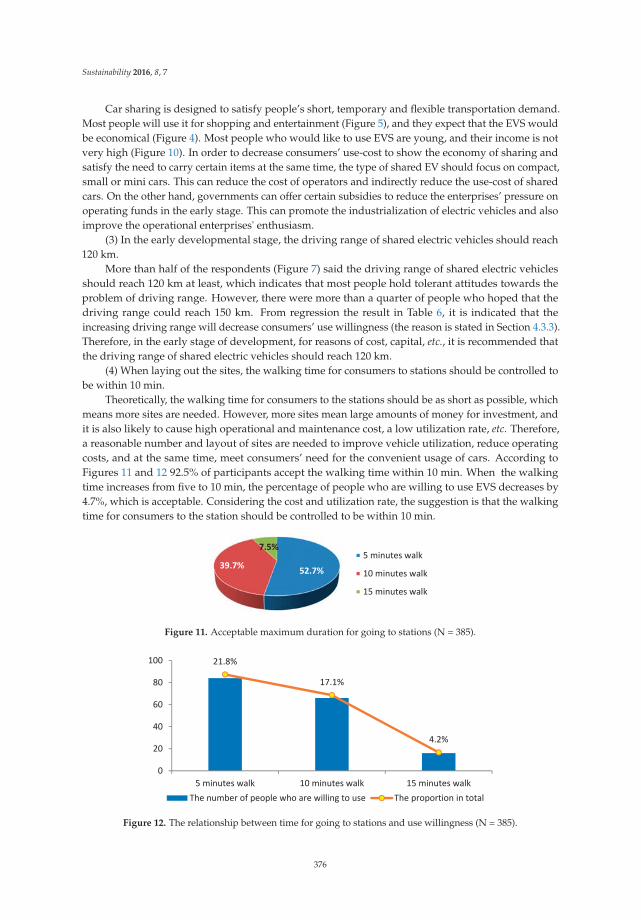
Sustainability 2016, 8, 7
Car sharing is designed to satisfy people’s short, temporary and flexible transportation demand.Most people will use it for shopping and entertainment (Figure 5), and they expect that the EVS wouldbe economical (Figure 4). Most people who would like to use EVS are young, and their income is notvery high (Figure 10). In order to decrease consumers’ use-cost to show the economy of sharing andsatisfy the need to carry certain items at the same time, the type of shared EV should focus on compact,small or mini cars. This can reduce the cost of operators and indirectly reduce the use-cost of sharedcars. On the other hand, governments can offer certain subsidies to reduce the enterprises’ pressure onoperating funds in the early stage. This can promote the industrialization of electric vehicles and alsoimprove the operational enterprises' enthusiasm.
(3) In the early developmental stage, the driving range of shared electric vehicles should reach120 km.
More than half of the respondents (Figure 7) said the driving range of shared electric vehiclesshould reach 120 km at least, which indicates that most people hold tolerant attitudes towards theproblem of driving range. However, there were more than a quarter of people who hoped that thedriving range could reach 150 km. From regression the result in Table 6, it is indicated that theincreasing driving range will decrease consumers’ use willingness (the reason is stated in Section 4.3.3).Therefore, in the early stage of development, for reasons of cost, capital, etc., it is recommended thatthe driving range of shared electric vehicles should reach 120 km.
(4) When laying out the sites, the walking time for consumers to stations should be controlled tobe within 10 min.
Theoretically, the walking time for consumers to the stations should be as short as possible, whichmeans more sites are needed. However, more sites mean large amounts of money for investment, andit is also likely to cause high operational and maintenance cost, a low utilization rate, etc. Therefore,a reasonable number and layout of sites are needed to improve vehicle utilization, reduce operatingcosts, and at the same time, meet consumers’ need for the convenient usage of cars. According toFigures 11 and 12 92.5% of participants accept the walking time within 10 min. When the walkingtime increases from five to 10 min, the percentage of people who are willing to use EVS decreases by4.7%, which is acceptable. Considering the cost and utilization rate, the suggestion is that the walkingtime for consumers to the station should be controlled to be within 10 min.
52.7%39.7%
7.5%5 minutes walk
10 minutes walk
15 minutes walk
Figure 11. Acceptable maximum duration for going to stations (N = 385).
21.8%
17.1%
4.2%
0
20
40
60
80
100
5 minutes walk 10 minutes walk 15 minutes walkThe number of people who are willing to use The proportion in total
Figure 12. The relationship between time for going to stations and use willingness (N = 385).
376
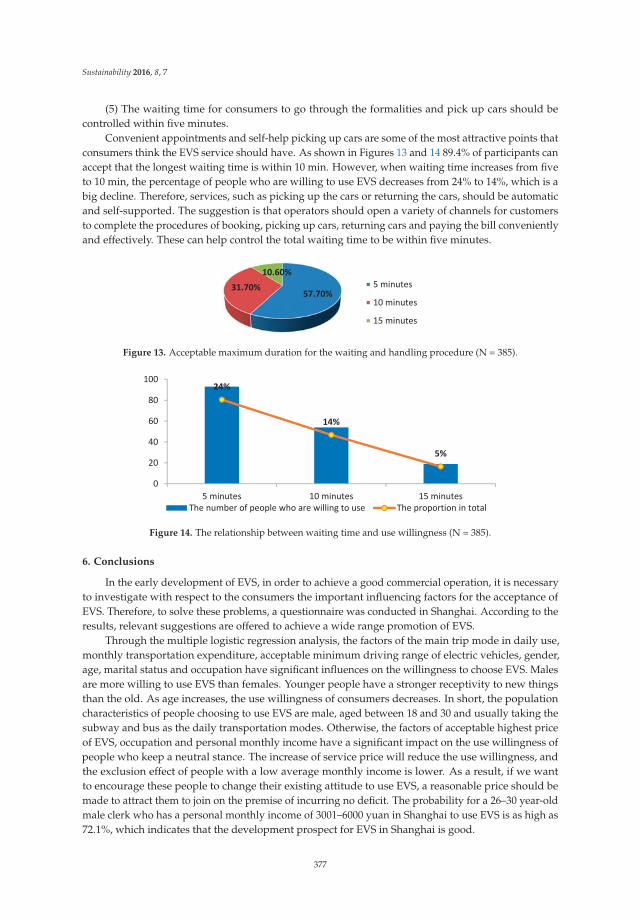
Sustainability 2016, 8, 7
(5) The waiting time for consumers to go through the formalities and pick up cars should becontrolled within five minutes.
Convenient appointments and self-help picking up cars are some of the most attractive points thatconsumers think the EVS service should have. As shown in Figures 13 and 14 89.4% of participants canaccept that the longest waiting time is within 10 min. However, when waiting time increases from fiveto 10 min, the percentage of people who are willing to use EVS decreases from 24% to 14%, which is abig decline. Therefore, services, such as picking up the cars or returning the cars, should be automaticand self-supported. The suggestion is that operators should open a variety of channels for customersto complete the procedures of booking, picking up cars, returning cars and paying the bill convenientlyand effectively. These can help control the total waiting time to be within five minutes.
57.70%31.70%
10.60%5 minutes
10 minutes
15 minutes
Figure 13. Acceptable maximum duration for the waiting and handling procedure (N = 385).
24%
14%
5%
0
20
40
60
80
100
5 minutes 10 minutes 15 minutesThe number of people who are willing to use The proportion in total
Figure 14. The relationship between waiting time and use willingness (N = 385).
6. Conclusions
In the early development of EVS, in order to achieve a good commercial operation, it is necessaryto investigate with respect to the consumers the important influencing factors for the acceptance ofEVS. Therefore, to solve these problems, a questionnaire was conducted in Shanghai. According to theresults, relevant suggestions are offered to achieve a wide range promotion of EVS.
Through the multiple logistic regression analysis, the factors of the main trip mode in daily use,monthly transportation expenditure, acceptable minimum driving range of electric vehicles, gender,age, marital status and occupation have significant influences on the willingness to choose EVS. Malesare more willing to use EVS than females. Younger people have a stronger receptivity to new thingsthan the old. As age increases, the use willingness of consumers decreases. In short, the populationcharacteristics of people choosing to use EVS are male, aged between 18 and 30 and usually taking thesubway and bus as the daily transportation modes. Otherwise, the factors of acceptable highest priceof EVS, occupation and personal monthly income have a significant impact on the use willingness ofpeople who keep a neutral stance. The increase of service price will reduce the use willingness, andthe exclusion effect of people with a low average monthly income is lower. As a result, if we wantto encourage these people to change their existing attitude to use EVS, a reasonable price should bemade to attract them to join on the premise of incurring no deficit. The probability for a 26–30 year-oldmale clerk who has a personal monthly income of 3001–6000 yuan in Shanghai to use EVS is as high as72.1%, which indicates that the development prospect for EVS in Shanghai is good.
377
Sustainability 2016, 8, 7
In the operational aspects, suggestions are provided for operators as follows. (1) The operatorsshould pay more attention to people who are 18–30 years old and have a middle-level income. (2) Inthe early development of EVS, the electric vehicles used for sharing should be concentrated on compact,small or mini cars to achieve the aim of low-cost operation and good sharing economy. (3) The drivingrange of shared electric vehicles should not be less than 120 km to reduce consumers' range anxiety. (4)During the laying out of sites, a reasonable number of sites are necessary to guarantee that the walkingtime to stations is within 10 min for consumers. (5) Operators need to optimize the leasing system andimplement automation and self-support as far as possible. This can help control the total waiting timeto within five minutes.
Acknowledgments: Acknowledgments: The research has been funded under the China MOST project of ElectricCar Sharing Technology Integration and Demonstration Operation (2015BAG11B00).
Author Contributions: Author Contributions: Ning Wang designed and performed this research. Runlin Yananalyzed the data and wrote this paper. All authors have read and approved the final manuscript.
Conflicts of Interest: Conflicts of Interest: The authors declare no conflict of interest.
References
1. Brady, J.; O’Mahony, M. Travel to work in Dublin. The potential impacts of electric vehicles on climatechange and urban air quality. Transp. Res. Part D 2011, 16, 188–193. [CrossRef]
2. Hawkins, T.R.; Singh, B.; Majeau-Bettez, G.; Stromman, A.H. Comparative environmental life cycleassessment of conventional and electric vehicles. J. Ind. Ecol. 2013, 17, 53–64. [CrossRef]
3. Hanschke, C.B.; Uyterlinde, M.A.; Kroon, P.; Jeeninga, H.; Londo, H.M. Duurzame Innovatie in HetWegverkeer. Available online: https://www.ecn.nl/docs/library/report/2008/e08076.pdf (accessed on 2December 2015). (In Dutch)
4. Sierzchula, W.; Bakker, S.; Maat, K.; Van Wee, B. The competitive environment of electric vehicles: Ananalysis of prototype and production models. Environ. Innov. Soc. Transit. 2012, 2, 49–65. [CrossRef]
5. IEA (International Energy Agency). EV City Casebook. 2012. Available online: http://www.iea.org/publications/freepublications/publication/EVCityCasebook.pdf (accessed on 2 December 2015).
6. Instructions of the General Office of the State Council in China on Accelerating the Promotionand Application of New Energy Vehicles. Available online: http://www.gov.cn/zhengce/content/2014–07/21/content_8936.htm (accessed on 21 July 2014).
7. Meijkamp, R. Changing consumer behaviour through eco-efficient services: An empirical study of carsharing in the Netherlands. Bus. Strateg. Environ. 1998, 7, 234–244. [CrossRef]
8. Barth, M.; Shaheen, S.A. The Potential for Shared-Use Vehicle Systems in China. Available online:http://76.12.4.249/artman2/uploads/1/UCD-ITS-RR-03-11.pdf (accessed on 2 December 2015).
9. Prettenthaler, F.E.; Steininger, K.W. From ownership to service use lifestyle: The potential of car sharing. Ecol.Econ. 1999, 28, 443–453. [CrossRef]
10. Seik, T.F. Vehicle ownership restraints and car sharing in Singapore. Habitat Int. 2000, 24, 75–90. [CrossRef]11. Barth, M.; Todd, M. Simulation model performance analysis of a multiple station shared vehicle system.
Transp. Res. Part C 1999, 7, 237–259. [CrossRef]12. Brook, D. Carsharing–Start Up Issues and New Operational Models. In Poceedings of the Transportation
Research Board Annual Meeting, Chicago, IL, USA, 18–20 November 2004.13. Xu, J.X.; Lim, J.S. A new evolutionary neural network for forecasting net flow of a car sharing system. In
Proceedings of the Evolutionary Computation, Singapore, 25–28 September 2007.14. Kek, A.G.; Cheu, R.L.; Meng, Q.; Fung, C.H. A decision support system for vehicle relocation operations in
carsharing systems. Transp. Res. Part E 2009, 45, 149–158. [CrossRef]15. Correia, G.H.; Antunes, A.P. Optimization approach to depot location and trip selection in one-way
carsharing systems. Transp. Res. Part E 2012, 48, 233–247. [CrossRef]16. Luè, A.; Colorni, A.; Nocerino, R.; Paruscio, V. Green move: An innovative electric vehicle-sharing system.
Procedia Soc. Behav. Sci. 2012, 48, 2978–2987. [CrossRef]
378
Sustainability 2016, 8, 7
17. Shaheen, S.; Cano, L.; Camel, M. Exploring Electric Vehicle Carsharing as a Mobility Option for Older Adults:A Case Study of a Senior Adult Community in the San Francisco Bay Area. Int. J. Sustain. Transp. 2015.[CrossRef]
18. Kim, D.; Ko, J.; Park, Y. Factors affecting electric vehicle sharing program participants’ attitudes about carownership and program participation. Transp. Res. Part D 2015, 36, 96–106. [CrossRef]
19. Huang, Z.Y.; Yang, D.Y. The development of car sharing abroad. Urban Plan. Forum 2000, 6, 50–55.20. Ye, L.; Yang, D.Y. The development and applied research on car sharing and mobile management in China.
In Proceedings of the China’s Sustainable Development Forum, Shandong, China, 2010; Available online:http://cpfd.cnki.com.cn/Article/CPFDTOTAL-ZKZC201010001051.htm (accessed on 2 December 2015).
21. Gao, Y.M. Car Sharing—A new model of automobile consumption. Traffic Trans. 2005, 4, 39–40.22. Qiu, L. Market prospects and marketing research on car sharing service in China’s. Master’s Thesis,
Fudan University, Shanghai, China, 2009.23. Xue, Y.; Yang, T.Y.; Wen, S.B. Social Characteristics and Development Models of Car Sharing.
Techno-econ. Manag. Res. 2008, 1, 54–58.24. Wu, W.D. Research on car sharing pattern and analysis on its development in Chinese market. Master’s
Thesis, Zhongshan University, Guangzhou, China, 2010.25. Jing, H. The green traffic of car sharing in Hanover. Traffic Trans. 2005, 6, 13.26. Kaixuan, X.; Mingsheng, H.; Hua, Z. The economic and ecological efficiency of car sharing service and the
feasibility to implement the service in Beijing. China Soft Sc. 2006, 12, 64–70.27. Zhang, W.T. Advanced Courses for SPSS Statistical Analysis; Higher Education Press: Beijing, China, 2004;
pp. 189–203. (In Chinese)28. Li, K.; Guo, Z.; Hu, L.; Xu, Y. Analysis method for ordered categorical data of cumulative score model.
Chin. J. Health Stat. 1993, 4, 35–38.29. Hosmer, D.W.; Lemeshow, S. Applied Logistic Regression, Second ed; Wiley: New York, NY, USA, 2000.30. Wen, X.X.; Tan, G.X.; Yao, S.S.; Huang, Z. Traffic flow characteristics and short-term prediction model of
urban intersection. J. Traffic Transp. Eng. 2006, 1, 103–107.31. Zhou, M.J. An empirical study of factors affecting electric car purchase decision. Shanghai Auto 2013, 4,
39–44.32. Sun, Y.; Shang, J. Factors affecting the health of residents in China: a perspective based on the living
environment. Ecol. Indic. 2015, 51, 228–236. [CrossRef]
© 2015 by the authors. Licensee MDPI, Basel, Switzerland. This article is an open accessarticle distributed under the terms and conditions of the Creative Commons Attribution(CC BY) license (http://creativecommons.org/licenses/by/4.0/).
379
Article
Effects of Employees’ Work Values andOrganizational Management on CorporatePerformance for Chinese and TaiwaneseConstruction Enterprises
Jeng-Wen Lin 1,*, Pu Fun Shen 2 and Yin-Sung Hsu 3
1 Department of Civil Engineering, Feng Chia University, Taichung 407, Taiwan2 Ph.D. Program in Civil and Hydraulic Engineering, Feng Chia University, Taichung 407, Taiwan;
[email protected] Department of Water Resources Engineering and Conservation, Feng Chia University, Taichung 407, Taiwan;
[email protected]* Correspondence: [email protected]; Tel.: +886-4-2451-7250 (ext. 3150); Fax: +886-4-2451-6982
Academic Editors: Adam Jabłonski and Giuseppe IoppoloReceived: 20 July 2015; Accepted: 16 December 2015; Published: 21 December 2015
Abstract: Through questionnaire surveys, this study explored the discrepancies in work values andorganizational management between employees and cadre members of construction enterprises onthe two sides of the Taiwan Strait. Statistical methods including data reliability, regression analysis,and tests of significance were utilized for modelling a case study. The findings of this study included:(1) in terms of work values, employees from China focused on their lives “at present”, while thosefrom Taiwan focused on their lives “in the future”, expecting to improve the quality of their liveslater on through advanced studies and promotion; (2) according to the data obtained from thequestionnaires, the answers regarding income and welfare in terms of work values and satisfactionwere contradictory on the two sides of the Strait, which could be interpreted in terms of influencefrom society; and (3) there was a significant influence of organizational management on employees’intentions to resign. If enterprises could improve current organizational management systems, theiremployees’ work attitudes would be improved and the tendency to resign would be reduced.
Keywords: corporate performance; organizational management; questionnaire survey; test ofsignificance; work value
1. Introduction
Employees’ work values change from generation to generation. Understanding employees’ workvalues has become a key issue for organizations aiming to achieve higher performances. Choi and Kimrecognized the individual human resource (HR) as a core asset of corporate value creation and devotedsignificant effort to developing and managing competency-based HR in order to strengthen corporatecompetitiveness [1]. Jia et al. addressed the concern that generational changes could be reflected invarious management aspects such as organizational structure, HR, and enterprise culture [2]. Chauet al. indicated how to provide construction managers with information about and insight into theexisting data, so they could make decisions more effectively [3]. Park showed that the effect of resourcecoverage on project performance was quantified and the policy implications were determined fordynamic resource management by simulating the model with heuristic and industry data [4]. Scholarsin China have started to study work values of employees on either side of the Taiwan Strait. Chenpointed out that with increasingly frequent economic and trade exchanges across the Taiwan Strait,interdependency between Taiwan and mainland China was increasingly higher [5]. Through studies
Sustainability 2015, 7, 16836–16848; doi:10.3390/su71215852 www.mdpi.com/journal/sustainability380
Sustainability 2015, 7, 16836–16848
on cross-cultural exchange and on differences between the cultures of the two sides, it was revealedthat, although there were some empirical research achievements made on the national culture andconsumer culture of the two sides of the Taiwan Strait, reliable research about corporate culture islacking and needs to be conducted [5]. For example, Phua examined three things regarding whether(1) national cultural differences influence individuals’ preferences for types of remuneration and levelsof job autonomy; (2) actual organizational human resource management (HRM) practices reflect suchpreferences; and (3) gaps between individuals’ preferences and actual organizational HRM practicesaffect job satisfaction [6].
1.1. Organizational Management and Corporate Performance
Many factors may influence an organization’s interests. Among them, two important ones are theorganizational management and performance of HR. Kamath’s empirical analysis found that HR wasthe one factor which had a major impact on the profitability and productivity of the firms studied [7].Though there was growing importance and efficiency in the utilization of intellectual resources inthe Indian pharmaceutical industry, its potential to impact the industry’s financial performance wasmissing in the empirical analysis [7]. Kim et al. claimed that HRM had been identified as very importantfor site management compared with such management at other locations [8]. Cheng et al. appliedbusiness process reengineering and organization planning philosophy to HRM and focused on HRplanning in construction management process reengineering (CMPR) to develop a team-based HRplanning (THRP) method for deploying labor [9]. Druker et al. examined HRM practices in relationto the role of personnel departments, line management responsibility, performance management,and values and beliefs of personnel managers [10]. Fatimah claimed that HR improvement in anorganization played an important role in determining the success of an organization [11].
Corporate organizational management is ultimately important to corporate performance.Rob et al. analyzed whether Japanese firms with many governance provisions had better corporate
performance than firms with few governance provisions and discovered that well-governed firmssignificantly outperformed poorly governed firms by up to 15% per year [12]. Saito performed acomparative study according to two surveys conducted in Japan and the United States to understandhow facility managers recognized and practiced universal design in their workplaces and to identifywhat factors were likely to facilitate or obstruct their practice [13]. Wong et al. claimed that workplaceenvironment affected employees’ well-being and comfort, which in turn influenced their productivityand morale [14]. Teizer et al. indicated that better safety and productivity could be achieved whenconstruction resources, including people and equipment, could be monitored [15]. The work ofLi et al. showed that the abilities of management and technology were two common factors that couldtranscend different institutions and systems [16].
On the other hand, an incentive system is also essential in an organization. Pattarin et al. proposedthat employee perks were positively associated with current and future returns on assets, whichsupported the view that some types of perks might increase firm profitability and/or that perks werepaid as a bonus to reward performance [17]. Findings from stratified samples suggested that perksmight incentivize managers, even after controlling for firm size, growth opportunity, and leverage [17].
Pfeffer claimed that ignoring the influences of working environments on employees’ performancesmight cause organizations to lose their competitiveness [18]. Hence, more emphases have beenplaced on studies of “person–organization fit” or “person–job fit”, For example, Schein indicatedthat environment was an important factor for person–organization fit [19]. Schneider believed thatperson–organization fit might influence one’s performance in an organization [20]. In short, HRM andits performance practice change due to the role of values and identity change and have also becomethe conceptual framework of this study.
381
Sustainability 2015, 7, 16836–16848
1.2. Issues Regarding Work Values
In recent years, many scholars have studied issues related to work values. Ralston et al. assessedthe impact of economic ideology and national culture on the individual work values of managers in theUnited States, Russia, Japan, and China [21]. Reichel et al. presented evidence that work values couldbe a good indicator for the selection and career development of personnel [22]. Lee and Yen exploredthe connection between work values and career orientation for employees in high-tech production [23].
All organizations are unique and, thus, practice different cultural values within the organization.In a university setting, it was discovered that leadership values have a significant impact onuniversity-wide cultural values, employee values, and stakeholder values [24,25]. Cultural valuesconsiderably affect productivity values and employee values. Further, employee values have significantinfluence on productivity and stakeholder values [24,25]. Scholars believed there were many aspectsof work values. For example, Wu and Chiang explored how Chinese values impacted employees’satisfaction (ES). Taiwanese employees viewed “career planning” as the most important, while Chineseemployees thought “organizational management” was most important. For Taiwanese employees,“salary and benefits”, “workload”, and “organizational management” had effects on ES, while ageand education were important to Chinese employees [26]. Leung et al. indicated that the constructionindustry had been recognized as a stressful industry, and a great deal of stress was placed onvarious construction professionals (CPs). However, due to the different “values” among CPs inHong Kong, susceptibility to stressors varied a great range among workers. People who grew up andlived in different cultural environments had different values and this led to different perceptions ofstressors [27]. Ochieng et al. examined challenges faced by senior construction managers in managingcross-cultural complexity and uncertainty [28]. Francis and Lingard claimed that societal attitudes andwork values were changing and that these changes had been reflected in the employment practices ofmany construction companies [29]. Morrison and Thurnell addressed that, in order to attract and retainvaluable employees, the New Zealand construction industry must provide useful work-life benefits,reasonable working hours, and supportive workplace cultures in line with such initiatives [30].
1.3. Prime Novelty Statements
Based on the arguments above regarding the effects of employees’ work values and organizationalmanagement on corporate performance and based on the extension of the work by Lin et al. [31], Linand Shen [32], Shen [33], we proposed three novelty statements.
(1) This paper is a “case study”. It was conducted with a questionnaire survey to offerorganizations some references, in which the reliability of the data was determined based on Cronbach’salpha values. According to the results of this study, all the Cronbach’s alpha values from the reliabilityanalyses were higher than 0.7, implying that all the organizational data were highly trustworthy.
(2) This study examined the results of questionnaires regarding issues of work values andorganizational management, and compared the issues. The results clearly showed the needs andviewpoints of employees from the two sides of the Strait, and therefore the relevant organizationalmanagement skills that could be utilized as references.
(3) Three regression models were used to verify this study regarding the issues of work valuesand organizational management. Interpretations were provided of unpredictable outcomes, so thatmanagement could understand and compare the extent to which the employees from the two sidesof the Strait devoted themselves to their jobs, whether the employees would like to stay or leave theenterprise, and what they thought about the welfare systems of the enterprise.
2. Analysis Methods for Questionnaires
The subjects of this study were Taiwanese and Chinese employees of branches of Taiwanesecompanies in China. The differences in work values and organizational management models werereviewed. The influences of the differences in work values and work satisfaction on organizations
382
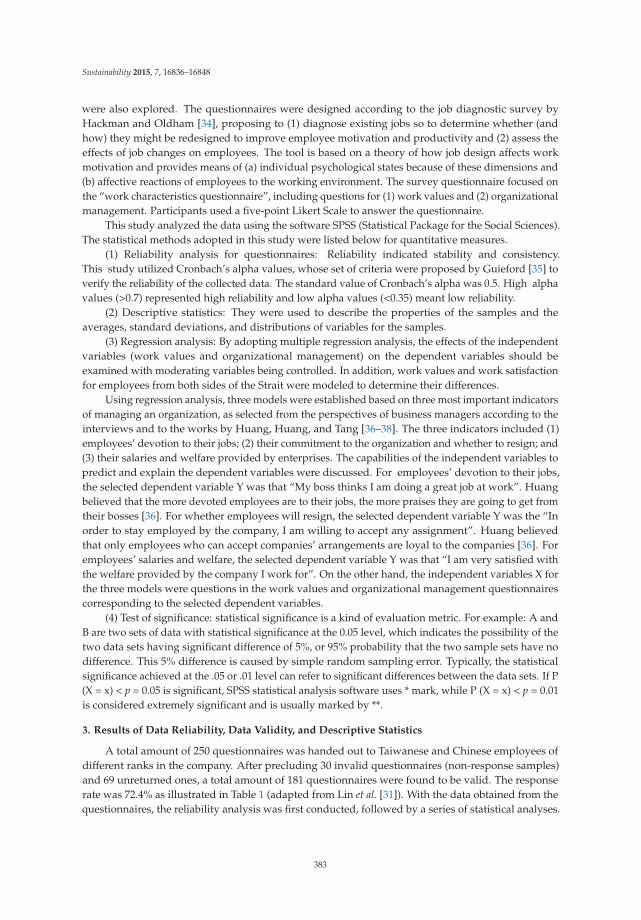
Sustainability 2015, 7, 16836–16848
were also explored. The questionnaires were designed according to the job diagnostic survey byHackman and Oldham [34], proposing to (1) diagnose existing jobs so to determine whether (andhow) they might be redesigned to improve employee motivation and productivity and (2) assess theeffects of job changes on employees. The tool is based on a theory of how job design affects workmotivation and provides means of (a) individual psychological states because of these dimensions and(b) affective reactions of employees to the working environment. The survey questionnaire focused onthe “work characteristics questionnaire”, including questions for (1) work values and (2) organizationalmanagement. Participants used a five-point Likert Scale to answer the questionnaire.
This study analyzed the data using the software SPSS (Statistical Package for the Social Sciences).The statistical methods adopted in this study were listed below for quantitative measures.
(1) Reliability analysis for questionnaires: Reliability indicated stability and consistency.This study utilized Cronbach’s alpha values, whose set of criteria were proposed by Guieford [35] toverify the reliability of the collected data. The standard value of Cronbach’s alpha was 0.5. High alphavalues (>0.7) represented high reliability and low alpha values (<0.35) meant low reliability.
(2) Descriptive statistics: They were used to describe the properties of the samples and theaverages, standard deviations, and distributions of variables for the samples.
(3) Regression analysis: By adopting multiple regression analysis, the effects of the independentvariables (work values and organizational management) on the dependent variables should beexamined with moderating variables being controlled. In addition, work values and work satisfactionfor employees from both sides of the Strait were modeled to determine their differences.
Using regression analysis, three models were established based on three most important indicatorsof managing an organization, as selected from the perspectives of business managers according to theinterviews and to the works by Huang, Huang, and Tang [36–38]. The three indicators included (1)employees’ devotion to their jobs; (2) their commitment to the organization and whether to resign; and(3) their salaries and welfare provided by enterprises. The capabilities of the independent variables topredict and explain the dependent variables were discussed. For employees’ devotion to their jobs,the selected dependent variable Y was that “My boss thinks I am doing a great job at work”. Huangbelieved that the more devoted employees are to their jobs, the more praises they are going to get fromtheir bosses [36]. For whether employees will resign, the selected dependent variable Y was the “Inorder to stay employed by the company, I am willing to accept any assignment”. Huang believedthat only employees who can accept companies’ arrangements are loyal to the companies [36]. Foremployees’ salaries and welfare, the selected dependent variable Y was that “I am very satisfied withthe welfare provided by the company I work for”. On the other hand, the independent variables X forthe three models were questions in the work values and organizational management questionnairescorresponding to the selected dependent variables.
(4) Test of significance: statistical significance is a kind of evaluation metric. For example: A andB are two sets of data with statistical significance at the 0.05 level, which indicates the possibility of thetwo data sets having significant difference of 5%, or 95% probability that the two sample sets have nodifference. This 5% difference is caused by simple random sampling error. Typically, the statisticalsignificance achieved at the .05 or .01 level can refer to significant differences between the data sets. If P(X = x) < p = 0.05 is significant, SPSS statistical analysis software uses * mark, while P (X = x) < p = 0.01is considered extremely significant and is usually marked by **.
3. Results of Data Reliability, Data Validity, and Descriptive Statistics
A total amount of 250 questionnaires was handed out to Taiwanese and Chinese employees ofdifferent ranks in the company. After precluding 30 invalid questionnaires (non-response samples)and 69 unreturned ones, a total amount of 181 questionnaires were found to be valid. The responserate was 72.4% as illustrated in Table 1 (adapted from Lin et al. [31]). With the data obtained from thequestionnaires, the reliability analysis was first conducted, followed by a series of statistical analyses.
383
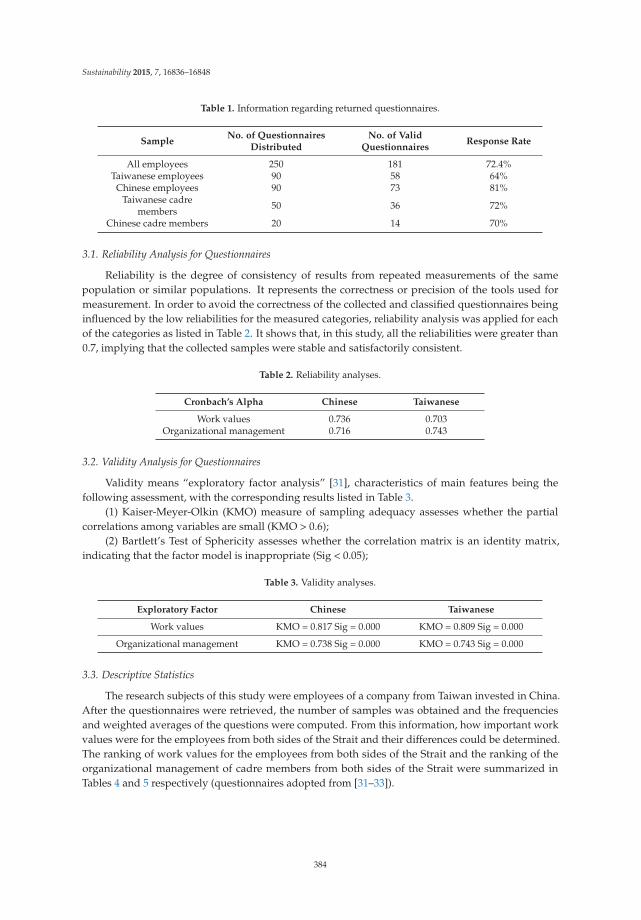
Sustainability 2015, 7, 16836–16848
Table 1. Information regarding returned questionnaires.
SampleNo. of Questionnaires
DistributedNo. of Valid
QuestionnairesResponse Rate
All employees 250 181 72.4%Taiwanese employees 90 58 64%
Chinese employees 90 73 81%Taiwanese cadre
members 50 36 72%
Chinese cadre members 20 14 70%
3.1. Reliability Analysis for Questionnaires
Reliability is the degree of consistency of results from repeated measurements of the samepopulation or similar populations. It represents the correctness or precision of the tools used formeasurement. In order to avoid the correctness of the collected and classified questionnaires beinginfluenced by the low reliabilities for the measured categories, reliability analysis was applied for eachof the categories as listed in Table 2. It shows that, in this study, all the reliabilities were greater than0.7, implying that the collected samples were stable and satisfactorily consistent.
Table 2. Reliability analyses.
Cronbach’s Alpha Chinese Taiwanese
Work values 0.736 0.703Organizational management 0.716 0.743
3.2. Validity Analysis for Questionnaires
Validity means “exploratory factor analysis” [31], characteristics of main features being thefollowing assessment, with the corresponding results listed in Table 3.
(1) Kaiser-Meyer-Olkin (KMO) measure of sampling adequacy assesses whether the partialcorrelations among variables are small (KMO > 0.6);
(2) Bartlett’s Test of Sphericity assesses whether the correlation matrix is an identity matrix,indicating that the factor model is inappropriate (Sig < 0.05);
Table 3. Validity analyses.
Exploratory Factor Chinese Taiwanese
Work values KMO = 0.817 Sig = 0.000 KMO = 0.809 Sig = 0.000
Organizational management KMO = 0.738 Sig = 0.000 KMO = 0.743 Sig = 0.000
3.3. Descriptive Statistics
The research subjects of this study were employees of a company from Taiwan invested in China.After the questionnaires were retrieved, the number of samples was obtained and the frequenciesand weighted averages of the questions were computed. From this information, how important workvalues were for the employees from both sides of the Strait and their differences could be determined.The ranking of work values for the employees from both sides of the Strait and the ranking of theorganizational management of cadre members from both sides of the Strait were summarized inTables 4 and 5 respectively (questionnaires adopted from [31–33]).
384
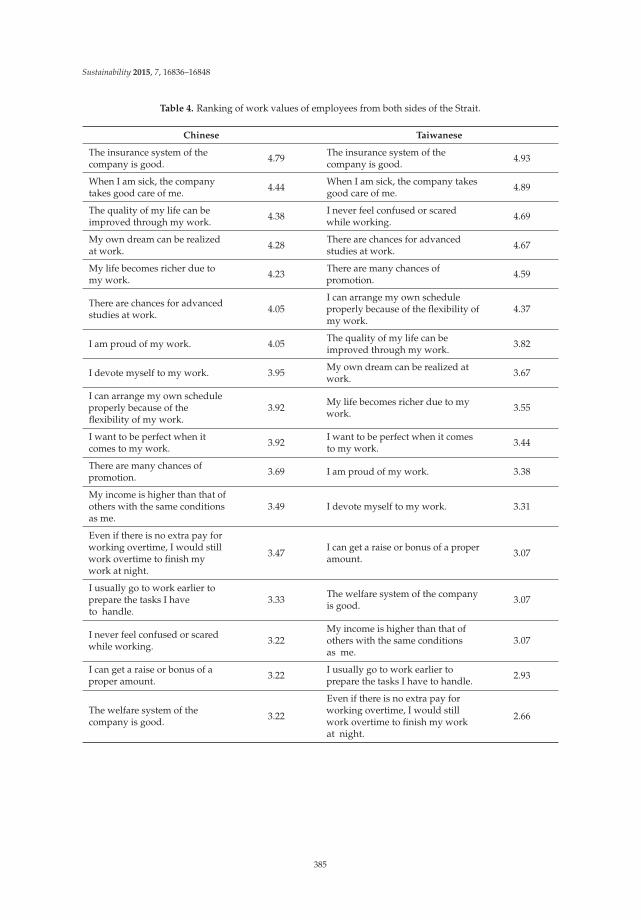
Sustainability 2015, 7, 16836–16848
Table 4. Ranking of work values of employees from both sides of the Strait.
Chinese Taiwanese
The insurance system of thecompany is good. 4.79 The insurance system of the
company is good. 4.93
When I am sick, the companytakes good care of me. 4.44 When I am sick, the company takes
good care of me. 4.89
The quality of my life can beimproved through my work. 4.38 I never feel confused or scared
while working. 4.69
My own dream can be realizedat work. 4.28 There are chances for advanced
studies at work. 4.67
My life becomes richer due tomy work. 4.23 There are many chances of
promotion. 4.59
There are chances for advancedstudies at work. 4.05
I can arrange my own scheduleproperly because of the flexibility ofmy work.
4.37
I am proud of my work. 4.05 The quality of my life can beimproved through my work. 3.82
I devote myself to my work. 3.95 My own dream can be realized atwork. 3.67
I can arrange my own scheduleproperly because of theflexibility of my work.
3.92 My life becomes richer due to mywork. 3.55
I want to be perfect when itcomes to my work. 3.92 I want to be perfect when it comes
to my work. 3.44
There are many chances ofpromotion. 3.69 I am proud of my work. 3.38
My income is higher than that ofothers with the same conditionsas me.
3.49 I devote myself to my work. 3.31
Even if there is no extra pay forworking overtime, I would stillwork overtime to finish mywork at night.
3.47 I can get a raise or bonus of a properamount. 3.07
I usually go to work earlier toprepare the tasks I haveto handle.
3.33 The welfare system of the companyis good. 3.07
I never feel confused or scaredwhile working. 3.22
My income is higher than that ofothers with the same conditionsas me.
3.07
I can get a raise or bonus of aproper amount. 3.22 I usually go to work earlier to
prepare the tasks I have to handle. 2.93
The welfare system of thecompany is good. 3.22
Even if there is no extra pay forworking overtime, I would stillwork overtime to finish my workat night.
2.66
385
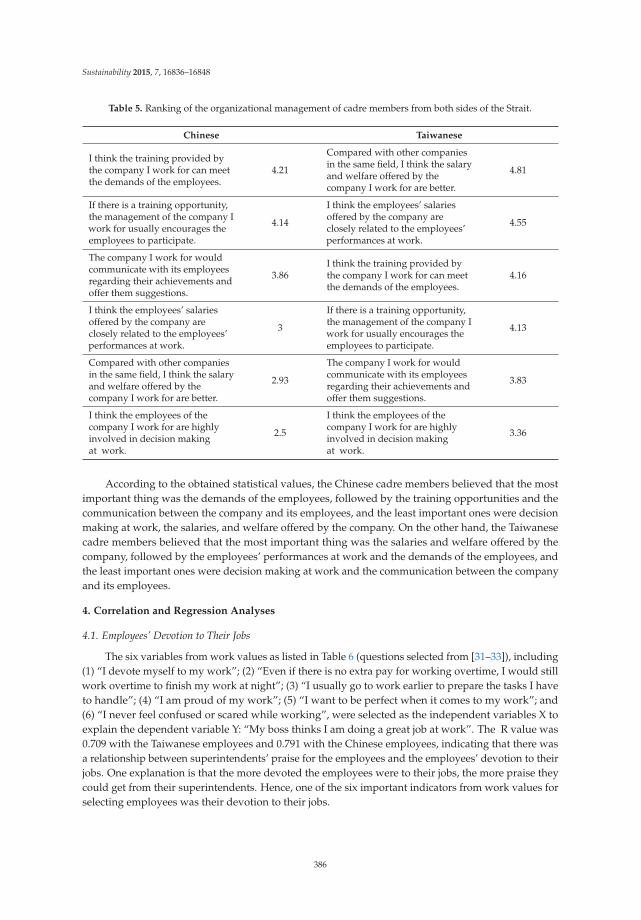
Sustainability 2015, 7, 16836–16848
Table 5. Ranking of the organizational management of cadre members from both sides of the Strait.
Chinese Taiwanese
I think the training provided bythe company I work for can meetthe demands of the employees.
4.21
Compared with other companiesin the same field, I think the salaryand welfare offered by thecompany I work for are better.
4.81
If there is a training opportunity,the management of the company Iwork for usually encourages theemployees to participate.
4.14
I think the employees’ salariesoffered by the company areclosely related to the employees’performances at work.
4.55
The company I work for wouldcommunicate with its employeesregarding their achievements andoffer them suggestions.
3.86I think the training provided bythe company I work for can meetthe demands of the employees.
4.16
I think the employees’ salariesoffered by the company areclosely related to the employees’performances at work.
3
If there is a training opportunity,the management of the company Iwork for usually encourages theemployees to participate.
4.13
Compared with other companiesin the same field, I think the salaryand welfare offered by thecompany I work for are better.
2.93
The company I work for wouldcommunicate with its employeesregarding their achievements andoffer them suggestions.
3.83
I think the employees of thecompany I work for are highlyinvolved in decision makingat work.
2.5
I think the employees of thecompany I work for are highlyinvolved in decision makingat work.
3.36
According to the obtained statistical values, the Chinese cadre members believed that the mostimportant thing was the demands of the employees, followed by the training opportunities and thecommunication between the company and its employees, and the least important ones were decisionmaking at work, the salaries, and welfare offered by the company. On the other hand, the Taiwanesecadre members believed that the most important thing was the salaries and welfare offered by thecompany, followed by the employees’ performances at work and the demands of the employees, andthe least important ones were decision making at work and the communication between the companyand its employees.
4. Correlation and Regression Analyses
4.1. Employees’ Devotion to Their Jobs
The six variables from work values as listed in Table 6 (questions selected from [31–33]), including(1) “I devote myself to my work”; (2) “Even if there is no extra pay for working overtime, I would stillwork overtime to finish my work at night”; (3) “I usually go to work earlier to prepare the tasks I haveto handle”; (4) “I am proud of my work”; (5) “I want to be perfect when it comes to my work”; and(6) “I never feel confused or scared while working”, were selected as the independent variables X toexplain the dependent variable Y: “My boss thinks I am doing a great job at work”. The R value was0.709 with the Taiwanese employees and 0.791 with the Chinese employees, indicating that there wasa relationship between superintendents’ praise for the employees and the employees’ devotion to theirjobs. One explanation is that the more devoted the employees were to their jobs, the more praise theycould get from their superintendents. Hence, one of the six important indicators from work values forselecting employees was their devotion to their jobs.
386
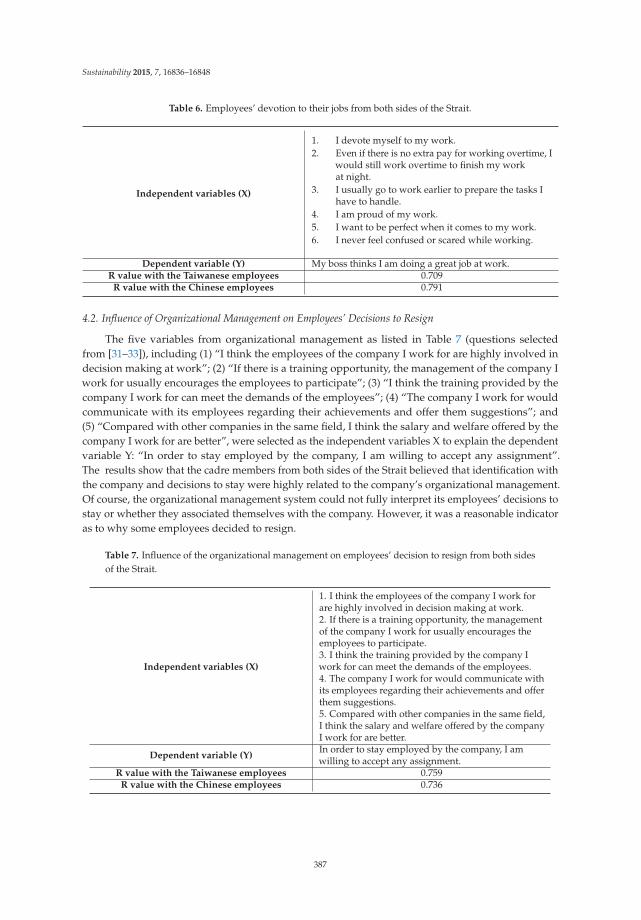
Sustainability 2015, 7, 16836–16848
Table 6. Employees’ devotion to their jobs from both sides of the Strait.
Independent variables (X)
1. I devote myself to my work.2. Even if there is no extra pay for working overtime, I
would still work overtime to finish my workat night.
3. I usually go to work earlier to prepare the tasks Ihave to handle.
4. I am proud of my work.5. I want to be perfect when it comes to my work.6. I never feel confused or scared while working.
Dependent variable (Y) My boss thinks I am doing a great job at work.R value with the Taiwanese employees 0.709
R value with the Chinese employees 0.791
4.2. Influence of Organizational Management on Employees’ Decisions to Resign
The five variables from organizational management as listed in Table 7 (questions selectedfrom [31–33]), including (1) “I think the employees of the company I work for are highly involved indecision making at work”; (2) “If there is a training opportunity, the management of the company Iwork for usually encourages the employees to participate”; (3) “I think the training provided by thecompany I work for can meet the demands of the employees”; (4) “The company I work for wouldcommunicate with its employees regarding their achievements and offer them suggestions”; and(5) “Compared with other companies in the same field, I think the salary and welfare offered by thecompany I work for are better”, were selected as the independent variables X to explain the dependentvariable Y: “In order to stay employed by the company, I am willing to accept any assignment”.The results show that the cadre members from both sides of the Strait believed that identification withthe company and decisions to stay were highly related to the company’s organizational management.Of course, the organizational management system could not fully interpret its employees’ decisions tostay or whether they associated themselves with the company. However, it was a reasonable indicatoras to why some employees decided to resign.
Table 7. Influence of the organizational management on employees’ decision to resign from both sidesof the Strait.
Independent variables (X)
1. I think the employees of the company I work forare highly involved in decision making at work.2. If there is a training opportunity, the managementof the company I work for usually encourages theemployees to participate.3. I think the training provided by the company Iwork for can meet the demands of the employees.4. The company I work for would communicate withits employees regarding their achievements and offerthem suggestions.5. Compared with other companies in the same field,I think the salary and welfare offered by the companyI work for are better.
Dependent variable (Y)In order to stay employed by the company, I amwilling to accept any assignment.
R value with the Taiwanese employees 0.759R value with the Chinese employees 0.736
387
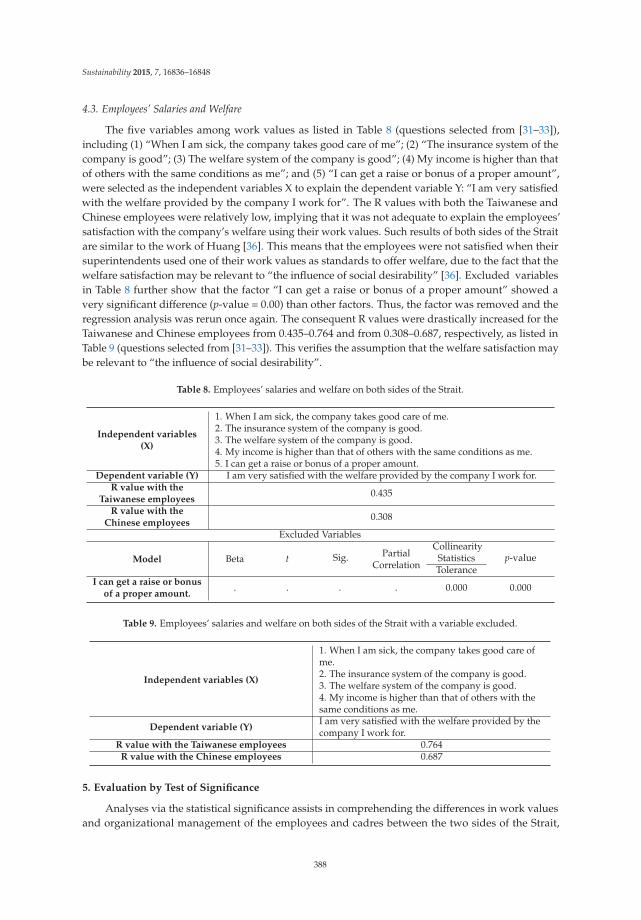
Sustainability 2015, 7, 16836–16848
4.3. Employees’ Salaries and Welfare
The five variables among work values as listed in Table 8 (questions selected from [31–33]),including (1) “When I am sick, the company takes good care of me”; (2) “The insurance system of thecompany is good”; (3) The welfare system of the company is good”; (4) My income is higher than thatof others with the same conditions as me”; and (5) “I can get a raise or bonus of a proper amount”,were selected as the independent variables X to explain the dependent variable Y: “I am very satisfiedwith the welfare provided by the company I work for”. The R values with both the Taiwanese andChinese employees were relatively low, implying that it was not adequate to explain the employees’satisfaction with the company’s welfare using their work values. Such results of both sides of the Straitare similar to the work of Huang [36]. This means that the employees were not satisfied when theirsuperintendents used one of their work values as standards to offer welfare, due to the fact that thewelfare satisfaction may be relevant to “the influence of social desirability” [36]. Excluded variablesin Table 8 further show that the factor “I can get a raise or bonus of a proper amount” showed avery significant difference (p-value = 0.00) than other factors. Thus, the factor was removed and theregression analysis was rerun once again. The consequent R values were drastically increased for theTaiwanese and Chinese employees from 0.435–0.764 and from 0.308–0.687, respectively, as listed inTable 9 (questions selected from [31–33]). This verifies the assumption that the welfare satisfaction maybe relevant to “the influence of social desirability”.
Table 8. Employees’ salaries and welfare on both sides of the Strait.
Independent variables(X)
1. When I am sick, the company takes good care of me.2. The insurance system of the company is good.3. The welfare system of the company is good.4. My income is higher than that of others with the same conditions as me.5. I can get a raise or bonus of a proper amount.
Dependent variable (Y) I am very satisfied with the welfare provided by the company I work for.R value with the
Taiwanese employees0.435
R value with theChinese employees
0.308
Excluded Variables
Model Beta t Sig. PartialCorrelation
CollinearityStatistics p-valueTolerance
I can get a raise or bonusof a proper amount.
. . . . 0.000 0.000
Table 9. Employees’ salaries and welfare on both sides of the Strait with a variable excluded.
Independent variables (X)
1. When I am sick, the company takes good care ofme.2. The insurance system of the company is good.3. The welfare system of the company is good.4. My income is higher than that of others with thesame conditions as me.
Dependent variable (Y)I am very satisfied with the welfare provided by thecompany I work for.
R value with the Taiwanese employees 0.764R value with the Chinese employees 0.687
5. Evaluation by Test of Significance
Analyses via the statistical significance assists in comprehending the differences in work valuesand organizational management of the employees and cadres between the two sides of the Strait,
388
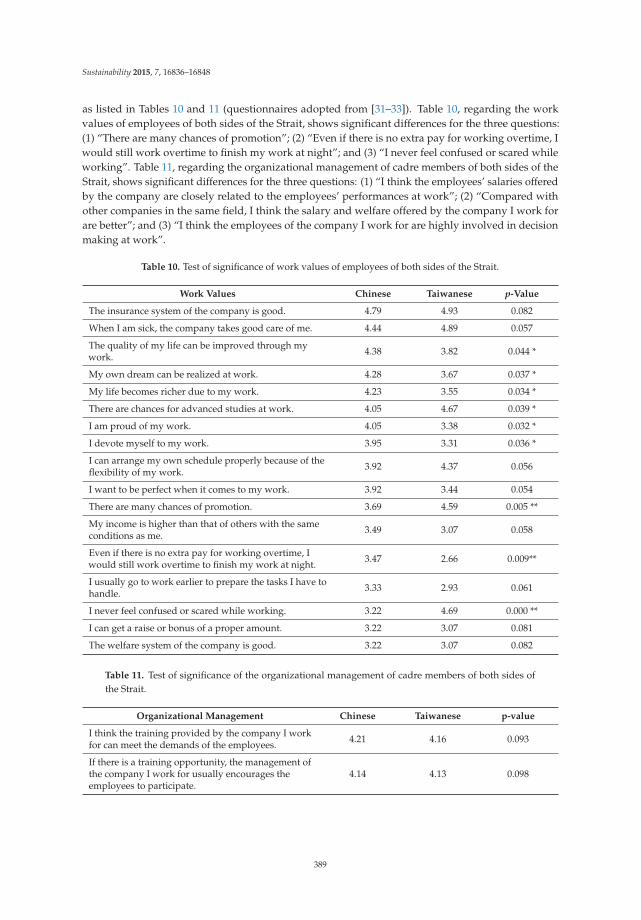
Sustainability 2015, 7, 16836–16848
as listed in Tables 10 and 11 (questionnaires adopted from [31–33]). Table 10, regarding the workvalues of employees of both sides of the Strait, shows significant differences for the three questions:(1) “There are many chances of promotion”; (2) “Even if there is no extra pay for working overtime, Iwould still work overtime to finish my work at night”; and (3) “I never feel confused or scared whileworking”. Table 11, regarding the organizational management of cadre members of both sides of theStrait, shows significant differences for the three questions: (1) “I think the employees’ salaries offeredby the company are closely related to the employees’ performances at work”; (2) “Compared withother companies in the same field, I think the salary and welfare offered by the company I work forare better”; and (3) “I think the employees of the company I work for are highly involved in decisionmaking at work”.
Table 10. Test of significance of work values of employees of both sides of the Strait.
Work Values Chinese Taiwanese p-Value
The insurance system of the company is good. 4.79 4.93 0.082
When I am sick, the company takes good care of me. 4.44 4.89 0.057
The quality of my life can be improved through mywork. 4.38 3.82 0.044 *
My own dream can be realized at work. 4.28 3.67 0.037 *
My life becomes richer due to my work. 4.23 3.55 0.034 *
There are chances for advanced studies at work. 4.05 4.67 0.039 *
I am proud of my work. 4.05 3.38 0.032 *
I devote myself to my work. 3.95 3.31 0.036 *
I can arrange my own schedule properly because of theflexibility of my work. 3.92 4.37 0.056
I want to be perfect when it comes to my work. 3.92 3.44 0.054
There are many chances of promotion. 3.69 4.59 0.005 **
My income is higher than that of others with the sameconditions as me. 3.49 3.07 0.058
Even if there is no extra pay for working overtime, Iwould still work overtime to finish my work at night. 3.47 2.66 0.009**
I usually go to work earlier to prepare the tasks I have tohandle. 3.33 2.93 0.061
I never feel confused or scared while working. 3.22 4.69 0.000 **
I can get a raise or bonus of a proper amount. 3.22 3.07 0.081
The welfare system of the company is good. 3.22 3.07 0.082
Table 11. Test of significance of the organizational management of cadre members of both sides ofthe Strait.
Organizational Management Chinese Taiwanese p-value
I think the training provided by the company I workfor can meet the demands of the employees. 4.21 4.16 0.093
If there is a training opportunity, the management ofthe company I work for usually encourages theemployees to participate.
4.14 4.13 0.098
389
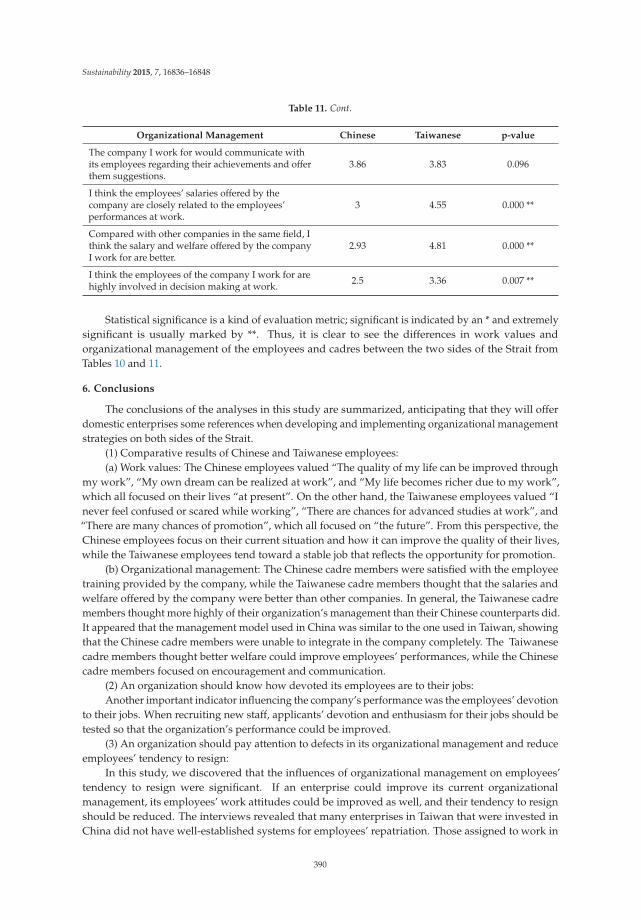
Sustainability 2015, 7, 16836–16848
Table 11. Cont.
Organizational Management Chinese Taiwanese p-value
The company I work for would communicate withits employees regarding their achievements and offerthem suggestions.
3.86 3.83 0.096
I think the employees’ salaries offered by thecompany are closely related to the employees’performances at work.
3 4.55 0.000 **
Compared with other companies in the same field, Ithink the salary and welfare offered by the companyI work for are better.
2.93 4.81 0.000 **
I think the employees of the company I work for arehighly involved in decision making at work. 2.5 3.36 0.007 **
Statistical significance is a kind of evaluation metric; significant is indicated by an * and extremelysignificant is usually marked by **. Thus, it is clear to see the differences in work values andorganizational management of the employees and cadres between the two sides of the Strait fromTables 10 and 11.
6. Conclusions
The conclusions of the analyses in this study are summarized, anticipating that they will offerdomestic enterprises some references when developing and implementing organizational managementstrategies on both sides of the Strait.
(1) Comparative results of Chinese and Taiwanese employees:(a) Work values: The Chinese employees valued “The quality of my life can be improved through
my work”, “My own dream can be realized at work”, and “My life becomes richer due to my work”,which all focused on their lives “at present”. On the other hand, the Taiwanese employees valued “Inever feel confused or scared while working”, “There are chances for advanced studies at work”, and“There are many chances of promotion”, which all focused on “the future”. From this perspective, theChinese employees focus on their current situation and how it can improve the quality of their lives,while the Taiwanese employees tend toward a stable job that reflects the opportunity for promotion.
(b) Organizational management: The Chinese cadre members were satisfied with the employeetraining provided by the company, while the Taiwanese cadre members thought that the salaries andwelfare offered by the company were better than other companies. In general, the Taiwanese cadremembers thought more highly of their organization’s management than their Chinese counterparts did.It appeared that the management model used in China was similar to the one used in Taiwan, showingthat the Chinese cadre members were unable to integrate in the company completely. The Taiwanesecadre members thought better welfare could improve employees’ performances, while the Chinesecadre members focused on encouragement and communication.
(2) An organization should know how devoted its employees are to their jobs:Another important indicator influencing the company’s performance was the employees’ devotion
to their jobs. When recruiting new staff, applicants’ devotion and enthusiasm for their jobs should betested so that the organization’s performance could be improved.
(3) An organization should pay attention to defects in its organizational management and reduceemployees’ tendency to resign:
In this study, we discovered that the influences of organizational management on employees’tendency to resign were significant. If an enterprise could improve its current organizationalmanagement, its employees’ work attitudes could be improved as well, and their tendency to resignshould be reduced. The interviews revealed that many enterprises in Taiwan that were invested inChina did not have well-established systems for employees’ repatriation. Those assigned to work in
390
Sustainability 2015, 7, 16836–16848
China felt uncertain about their future, and this was reflected in their performance. Besides increasingemployees’ salaries, a repatriation system should be established: this ought to entail not only allowingstaff to return to their jobs in Taiwan, but also proper in-service training for Taiwanese employees inChina so that they may remain in China for long-term development. Otherwise, it is very likely thatfurther salary raises would be futile in increasing employees’ commitment to an organization.
Acknowledgments: Acknowledgments: The work described in this paper comprises part of the research projectsponsored by Ministry of Science and Technology, Taiwan (Contract No. MOST 102-2221-E-035-049), whosesupport is greatly appreciated.
Author Contributions: Author Contributions: Jeng-Wen Lin designed the research and wrote the paper; Pu FunShen performed research and analyzed the data; and Yin-Sung Hsu revised the paper.
Conflicts of Interest: Conflicts of Interest: The authors declare no conflict of interest.
References
1. Choi, J.H.; Kim, Y.S. An analysis of core competency of construction field engineer for cost management.J. Constr. Eng. Manag. 2013, 14, 26–34. [CrossRef]
2. Jia, G.; Ni, X.; Chen, Z.; Hong, B.; Chen, Y.; Yang, F.; Lin, C. Measuring the maturity of risk management inlarge-scale construction projects. Autom. Constr. 2013, 34, 56–66. [CrossRef]
3. Chau, K.W.; Cao, Y.; Anson, M.; Zhang, J. Application of data warehouse and decision support system inconstruction management. Autom. Constr. 2003, 12, 213–224. [CrossRef]
4. Park, M. Model-based dynamic resource management for construction projects. Autom. Constr. 2005, 14,585–598. [CrossRef]
5. Chen, C.-C. Comments on relevant study on corporate culture across the Taiwan Straits. Asian Soc. Sci. 2011,7, 59–63. [CrossRef]
6. Phua, F.T. Do national cultural differences affect the nature and characteristics of HRM practices? Evidencefrom Australian and Hong Kong construction firms on remuneration and job autonomy. Constr. Manag. Econ.2012, 30, 545–556. [CrossRef]
7. Kamath, G.B. Intellectual capital and corporate performance in Indian pharmaceutical industry.J. Intellect. Cap. 2008, 9, 684–704. [CrossRef]
8. Kim, J.H.; Cho, H.H.; Lee, U.K.; Kang, K.I. Development of a hybrid device based on infrared andultrasonic sensors for human resource management. In Proceedings of the 24th International Symposium onAutomation & Robotics in Construction, Kochi, India, 19–21 September 2007; pp. 111–115.
9. Cheng, M.Y.; Tsai, M.H.; Xiao, Z.W. Construction management process reengineering: Organizational humanresource planning for multiple projects. Autom. Constr. 2006, 15, 785–799. [CrossRef]
10. Druker, J.; White, G.; Hegewisch, A.; Mayne, L. Between hard and soft HRM: human resource managementin the construction industry. J. Constr. Eng. Manag. 1996, 14, 405–416. [CrossRef]
11. Fatimah, P.R. The development of FFMD pyramid: Fuzzy Family Marriage Deployment as decision supportmethod to improve human resources performance. Qual. Quant. 2014, 48, 659–672. [CrossRef]
12. Rob, B.; Bart, F.; Rogér, O.; Alireza, T.-R. The impact of corporate governance on corporate performance:Evidence from Japan. Pac. Basin Financ. J. 2008, 16, 236–251.
13. Saito, Y. Awareness of universal design among facility managers in Japan and the United States.Autom. Constr. 2006, 15, 462–478. [CrossRef]
14. Wong, J.K.W.; Li, H.; Wang, S.W. Intelligent building research: A review. Autom. Constr. 2005, 14, 143–159.[CrossRef]
15. Teizer, J.; Cheng, T.; Fang, Y. Location tracking and data visualization technology to advance constructionironworkers’ education and training in safety and productivity. Autom. Constr. 2013, 35, 53–68. [CrossRef]
16. Li, J.; Chiang, Y.H.; Choi, T.N.; Man, K.F. Determinants of Efficiency of Contractors in Hong Kong and China:Panel Data Model Analysis. J. Constr. Eng. Manag. 2013, 9, 1211–1223. [CrossRef]
17. Pattarin, A.; Ilan, A.; Tianyu, Z. Executive perks: Compensation and corporate performance in China.Asia Pac. J. Manag. 2009, 28, 401–425.
18. Pfeffer, J. Fighting the War for Talent is Hazardous to Your Organization’s Health. Organ. Dyn. 2001, 29,248–259. [CrossRef]
391
Sustainability 2015, 7, 16836–16848
19. Schein, E. Organization Culture and Leadership; Jossey-Bass: San Francisco, CA, USA, 1985.20. Schneider, B. The People Make The Place. Pers. Psychol. 1987, 40, 437–453. [CrossRef]21. Ralston, D.A.; Holt, D.H.; Terpstra, R.H.; Yu, K.-C. The impact of national culture and economic ideology on
managerial work values: A study of the United States, Russia, Japan, and China. J. Int. Bus. Stud. 1997, 28,177–207. [CrossRef]
22. Reichel, A.; Neumann, Y.; Pizam, A. The Work Values and Motivational Profiles of Vocational, Collegiate,Nonconformist, and Academic Students. Res. High. Educ. 1981, 14, 187–199. [CrossRef]
23. Lee, H.W.; Yen, K.W. A study of the relationship between work values and career orientation of employed inthe high technology industry. Qual. Quant. 2013, 47, 803–810. [CrossRef]
24. Ab Hamid, M.R.; Mustafa, Z.; Idris, F.; Abdullah, M.; Suradi, N.M.; Ismail, W.R. Multi-factor of culturalvalues: a confirmatory factor analytic approach. Qual. Quant. 2013, 47, 499–513. [CrossRef]
25. Ab Hamid, M.R.B. Value-based performance excellence model for higher education institutions. Qual. Quant.2015, 49, 1919–1944. [CrossRef]
26. Wu, C.-C.; Chiang, Y.-C. The impact on the cultural diversity to employees’ job satisfaction between mainlandChina and Taiwan: A comparison of Taiwanese invested companies. Int. J. Hum. Resour. Manag. 2007, 18,623–641. [CrossRef]
27. Leung, M.Y.; Chan, Y.S.; Chong, A.M.L. Chinese values and stressors of construction professionals in HongKong. J. Constr. Eng. Manag. 2010, 136, 1289–1298. [CrossRef]
28. Ochieng, E.G.; Price, A.D.F.; Ruan, X.; Egbu, C.O.; Moore, D. The effect of cross-cultural uncertainty andcomplexity within multicultural construction teams. Eng. Constr. Archit. Manag. 2013, 20, 307–324. [CrossRef]
29. Francis, V.; Lingard, H. The case for family-friendly work practices in the Australian construction industry.Aust. J. Constr. Econ. Build. 2012, 2, 28–36. [CrossRef]
30. Morrison, E.; Thurnell, D. Employee preferences for work-life benefits in a large New Zealand constructioncompany. Aust. J. Constr. Econ. Build. 2012, 12, 12–25. [CrossRef]
31. Lin, J.-W.; Shen, P.F.; Lee, B.-J. Repetitive model refinement for questionnaire design improvement inthe evaluation of working characteristics in construction enterprises. Sustainability 2015, 7, 15179–15193.[CrossRef]
32. Lin, J.-W.; Shen, P.F. Factor-analysis based questionnaire categorization method for reliability improvementof evaluation of working conditions in construction enterprises. Struct. Eng. Mech. 2014, 51, 973–988.[CrossRef]
33. Shen, P.F. Impact of Employees’ Work Values at Two Sides of Taiwan Straits on Corporate Performance.Master’s Thesis, Feng Chia University, Taichung, Taiwan, July 2011.
34. Hackman, J.R.; Oldham, G.R. Development of the Job Diagnostic Survey. J. Appl. Psychol. 1975, 60, 159–170.[CrossRef]
35. Guieford, J.P. Fundamental Statistics in Psychology and Education, 4th ed.; McGraw Hill: New York, NY,USA, 1965.
36. Huang, G.-L. The Differences in Work Values between Enterprise Employees on both Sides of the Strait.Paper Collection for the Differences in Work Values between Enterprise Employees on both Sides ofthe Strait Seminar, Taiwan, 1994. Available online: http://readopac2.ncl.edu.tw/nclserialFront/search/ref_book.jsp?la=ch&id=A00039972 (accessed on 18 December 2015).
37. Huang, T.C. Human Resource Management of Taiwanese Businessmen in Mainland China; Fongheh PublishingCo.: Taipei, Taiwan, 1995.
38. Tang, S.C. Discussions of corporate culture between different business strategies—A case study of Taiwan’shome appliance industry. Master’s Thesis, National Chung Hsing University, Taichung, Taiwan, July 1995.
© 2015 by the authors. Licensee MDPI, Basel, Switzerland. This article is an open accessarticle distributed under the terms and conditions of the Creative Commons Attribution(CC BY) license (http://creativecommons.org/licenses/by/4.0/).
392
Article
How Firms Can Get Ideas from Users for SustainableBusiness Innovation
Chanwoo Cho and Sungjoo Lee *
Department of Industrial Engineering, Ajou University, 206 Worldcup-ro, Yeongtong-gu, Suwon 16499, Korea;[email protected]* Correspondence: [email protected]; Tel.: +82-31-219-2419
Academic Editors: Adam Jabłonski and Marc A. RosenReceived: 3 October 2015; Accepted: 27 November 2015; Published: 3 December 2015
Abstract: The importance of user information and user participation for seeking businessopportunities has been widely acknowledged in a variety of industries. Therefore, this study aimsto suggest a typology for user innovation models as a strategy for sustainable development and toinvestigate the characteristics of different types user innovation to encourage and support improvedutilization of user innovation in firms. For this purpose, we began by collecting 435 relevant papersfrom the most-cited academic journals. Then, we developed a typology of user innovation models,which consist of four types including workshop-based, consortium-based, crowdsourcing-based andplatform-based, and we investigated the characteristics of the suggested types in terms of applicationsand research trends. The analysis results reveal that each type has different characteristics and thatthere exist some research gaps in the user innovation field. Our results are expected to fosterunderstanding of user innovation for guiding sustainable business development and provide usefulinformation for both researchers and innovation mangers.
Keywords: user innovation; typology; sustainable business; business innovation; innovation model;research trends
1. Introduction
The technological environment has changed rapidly in the past decade, and technologicalconvergence has occurred across a diverse range of technologies. These changes have promptedcompanies to seek out and cooperate with external partners, such as government officials, researchorganizations and other firms in order to strengthen their capabilities and have increased the necessityfor firms to engage in strategic planning in order to survive in the market. Paying attention to customers’diverse requirements for new products and services has become one of the essential factors for firms’survival, highlighting the user as a firm’s principal external partner for developing sustainable businessmodels. Corporate sustainability can be defined as meeting the needs of a firm’s stakeholders suchas employees, customers and communities [1], by transposing the idea of sustainable developmentto the firm level [2]. Considering that users are one of the most significant stakeholders, firms needto understand users’ needs accurately and reflect these needs within their innovation processes fordeveloping sustainable business models. Thus, it has been critical for a firm to incorporate users’needs, ideas and feedbacks in innovation for its sustainable growth.
For decades, firms have investigated user behaviors [3,4], and users have been recognized as asource of innovation [5–7], suggesting innovative ideas or creating prototypes of innovative productsthat organizations can utilize in their new product development (NPD) processes and develop newbusiness models [8,9]. A great deal of relevant research has been conducted on diverse cases of userinnovation in practice. Earlier studies focused on the analysis of users’ role in innovation [9–13], acomparison of user innovation with supplier-driven innovation [14], and an exploration of a suitable
Sustainability 2015, 7, 16039–16059; doi:10.3390/su71215802 www.mdpi.com/journal/sustainability393
Sustainability 2015, 7, 16039–16059
form of governance for user innovation [15]. Similarly, recent studies have dealt with topics such as theanalysis of users’ roles as innovators in specific industries [16,17] and interactions between users andmanufacturers [18]. At the same time, changes in user innovation have been significantly discussedin previous studies by analyzing interactions among users [19–21] and providing suggestions for theways in which firms can utilize user communities and crowd sourcing [22–24] for innovation.
Although these studies have examined aspects of user innovation and helped to establish relevanttheories, there is a need for further studies. First, most of the empirical research has focused on one or afew cases of user innovation in specific industries. There exist many different types of user innovationin the various industries. Thus, it is essential to investigate the characteristics of each type in order tofully understand user innovation as an approach to designing sustainable business models.
Second, although much research has suggested types of user innovation, most of them wereuser-initiated cases. As reported by existing studies, there exist a lot of user innovation cases thatwere initiated by firms. Moreover, business model innovation is more closely related to firm-initiatedcases rather than user-initiate cases. In diverse industries, firms have tried to collect user information,knowledge and ideas to seek solutions to problems or to create innovation and business opportunities.Thus, it is time to suggest types of user innovation from the firm perspective to support and fosteruser innovation in firms.
Third, there is a lack of studies on the overall research trends in user innovation. User innovationhas spread widely to industries, and various types of user innovation have been suggested over time.A clear understanding of its evolution is a prerequisite for the better utilization of user innovation inpractice. Although past research can enhance our understanding of user innovation, it is not easy tounderstand the changes in user innovation. To address this issue, it would be meaningful to investigatepast and emerging user innovation models by analyzing patterns in user innovation research.
Therefore, this study aims to suggest a typology of user innovation models and investigatethem to encourage and support the better utilization of user innovation in firms as a method to findsustainable business opportunities. For this purpose, first, we collected publications on user innovationfrom the top 25 most-cited journals in the technology and innovation management area. Second, weidentified the user innovation context by developing an analysis strategy and a typology of userinnovation models. Third, we derived four types of user innovation models according to a typology,and investigated the characteristics of each type in terms of the context of applications, research trendsand sustainable business models. Finally, we tried to find implications and research gaps in the userinnovation field in order to propose future research directions, especially for the purpose of businessmodel innovation for sustainability. The research findings are expected to enhance the understandingof user innovation and help in the utilization of user innovation in firms for their sustainable growth.
The rest of the paper is organized as follows: In Section 2, we review existing studies of userinnovation and sustainable business models. In Section 3, we explain the overall research process andthe detailed processes of this study. We describe the data collection process in Section 4 and discussthe typology of user innovation models in Section 5. In Section 6, we investigate the characteristics ofeach type of user innovation model based on the data. In Section 7, the implications, research gapsand future research directions are explained. Finally, in Section 6, we present the contributions andlimitations of the current study.
2. Background
This study proposes a typology of user innovation models and investigates the characteristicsof the various types. To this end, we must first define the concept of user innovation models and thecriteria of a typology. Therefore, this section reviews the literature on innovation models, which canprovide a basis for defining user innovation models.
394
Sustainability 2015, 7, 16039–16059
2.1. User Innovation Models
An innovation model is a framework for understanding the relationship between technology,science, and economics [25]. Based on the relationship, types of innovation models are defined. Forexample, Rothwell [26] suggested five generations of innovation process models. Chesbrough [27]suggested the concept of an open innovation model. In this model, internal R & D using externalresources that were acquired through cooperation with external partners is crucial. User innovation issimilar to the open innovation model in that the sharing of knowledge and information by interactionsand co-operation between actors plays an important role in innovation. Meanwhile, it is different fromthe open innovation model in that its main actors consist of users, firms, or facilitating organizations(intermediary firms, NGOs, universities, research funding agencies and governmental agencies). Further,interactions and co-operation between users or user and firm are the principal sources of innovativeideas. To better use open innovation, firms should not only adopt information and knowledgefrom external partners, but also freely reveal their own information and knowledge to the public.However, openness generally conflicts with firms’ need to protect their intellectual property [28]. Userinnovation overcomes these limitations of open innovation and, therefore, has received much interestfrom both industry and academia. However, it is not easy to define a “single” general user innovationmodel because the characteristics of user innovation differ in each case of user innovation. Therefore,this research examines cases of user innovation from past studies and suggests a typology of userinnovation models.
Most relevant research in user innovation has been conducted on actual cases, and such researchhas yielded insights into several aspects of user innovation. Among them, how innovation outputsare used and for whom are one of the most significant factors to define types of user innovations,considering that the ultimate goal of innovation is to create value for the company, the users, and thedeliverable itself. In this vein, user innovation types can be grouped into three categories by innovationinitiators—user-initiated innovation, firm-initiated innovation, and intermediary-initiated innovation.
The existing literature tended to focus on user-initiated innovation. A representative case isthat of the user-innovator [29,30]. Though innovation outputs acquired through user innovation areobjects of commercialization, they can be a means to satisfy users’ needs. User-innovators developtheir ideas to fulfill their own needs [31–34], and share and diffuse their resulting innovations freelyto other users [29]. In several industries, such as rodeo kayaks [35,36], kite surfing equipment [30],motorcycles [37], computer games [38] and sports-related consumer products [29], user-innovatorsdeveloped a novel product and launched it to the market. In these cases, user-innovators became usermanufacturers who led the overall innovation processes from idea generation to commercialization.
However, as new types of user innovation tools such as crowdsourcing, open-source software,and a user toolkit have been suggested to assist firms in idea gathering from users, firm-initiated userinnovation has started to prevail in diverse industries. A lot of firms in software industries prefer touse open source software as a platform to grab users’ ideas [39–41]. User toolkits have been used tomake users self-design their own product, and firms adopt users’ ideas to develop new products orservices in computer game [42], ski [43], and watch industries [44].
Recently, cases of user innovation led by facilitating organizations such as intermediary firms,NGOs, universities, research funding agencies, and governmental agencies have been reported. Inthese cases, intermediary firms facilitate the bringing together of users and firms to make innovativeproducts. InnoCentive [45], TopCoder [46], and direct firm solicitation of innovation by Procter andGamble [47] are good examples.
Since the concept of user innovation has come to prominence, diverse types of user innovationinitiated by different actors have been reported. Thus, these types should be considered in the processof developing a typology of user innovation models. Among the three types, we restrict our focusto the second type, which is worth investigating because more firms are required to innovate theirproduct and service offerings in collaboration with potential users in the era of open innovation.
395
Sustainability 2015, 7, 16039–16059
2.2. User Innovation for Designing Sustainable Business Models
With global development and as associated resource use has been accelerated, it seems apparentthat business as usual is not an option for a sustainable future [48]. Firms have to create value byseizing business opportunities, deliver an economic value to customers, and provide ecological and/orsocial value to the public for their continuous growth. Emphasizing the importance of business asa driver of innovation, previous studies suggested that a business model is a useful framework forcorporate innovation [49–51], and business model innovation is a key to success of firms [52,53].However, long-run sustainability needs clear understanding about economic, environmental and socialfactors of sustainability [54] and may require radical, fundamental and difficult changes in corporatebusiness models [55].
The business model is the rationale of how an organization creates, delivers, and captures valueand can be described through nine building blocks: (1) customer segments; (2) value proposition;(3) channels; (4) customer relationships; (5) revenue streams; (6) key resources; (7) key activities;(8) partner network; and (9) cost structure [56]. In particular, a “sustainable” business model is definedas a business model that creates competitive advantage through superior customer value as wellas contributes to sustainable development of the company and society [52]. To build a sustainablebusiness model, firms have to transform their business models towards creating positive impactsor reduce negative impacts for the environment and society. This business model innovation forsustainability is realized by changing the way of firms’ value network creation, value capture anddelivery, and value proposition [48]. Hence, firms have to generate new sources of profit by findingnovel value proposition and value constellation combinations for developing sustainable businessmodels [57].
Users, as major customers, can be valuable sources in developing sustainable business models.Stubbs and Cocklin [50] asserted that sustainable business models must develop internal structuraland cultural capabilities to achieve firm-level sustainability and collaborate with key stakeholdersto achieve sustainability for the system that a firm is part of. Here, one of the major stakeholders isusers. They reveal who the key customers are and what values they want to have. In addition, they arewilling to develop and even offer their own innovation ideas to firms. In a similar vein, Osterwalderand Pigneur [56] also emphasized the significance of users for business model development by arguingthat customer segments, customer relationships and channels should be aligned, considering potentialtrade-offs, to conceptualize an effective business model. By adopting user innovation that consists ofuser-own information and knowledge, therefore, firms can generate a novel value proposition, leadingto sustainable business model innovation. Here, it should be noted that business model innovation isnot just changing the product and service offerings for the customer. It involves changing “the way ofbusiness”, rather than “what firms do” and must go beyond process and products [58].
Accordingly, business model innovation for sustainability should be pursued from the perspectiveof sociotechnical systems, not in terms of the technical system. Quite naturally, the role of usersas sources of innovative ideas for sustainable business models should also be analyzed withinthe framework of sociotechnical systems. For example, in the case of living labs, users shape theinnovation in their own real-life environments, unlike the traditional approaches to users where theinsights of users were captured and interpreted by experts [59]. Innovation occurs in value networkconstellations and users play a significant role. This notion indicates that it is worth investigatingthe role of users in the process of business model innovation, which is expected to help facilitate theadoption of user innovation models by firms for designing sustainable business models.
3. Overall Research Processes
The overall research process of this study is shown in Figure 1. First, we collected relevantpapers on user innovation from online academic journals. Second, we identified a user innovationcontext based on collected papers. Here, we adopted the 5W1H (i.e., who, when, where, what, why,how) method to develop an analysis strategy and a typology of user innovation models. Third,
396
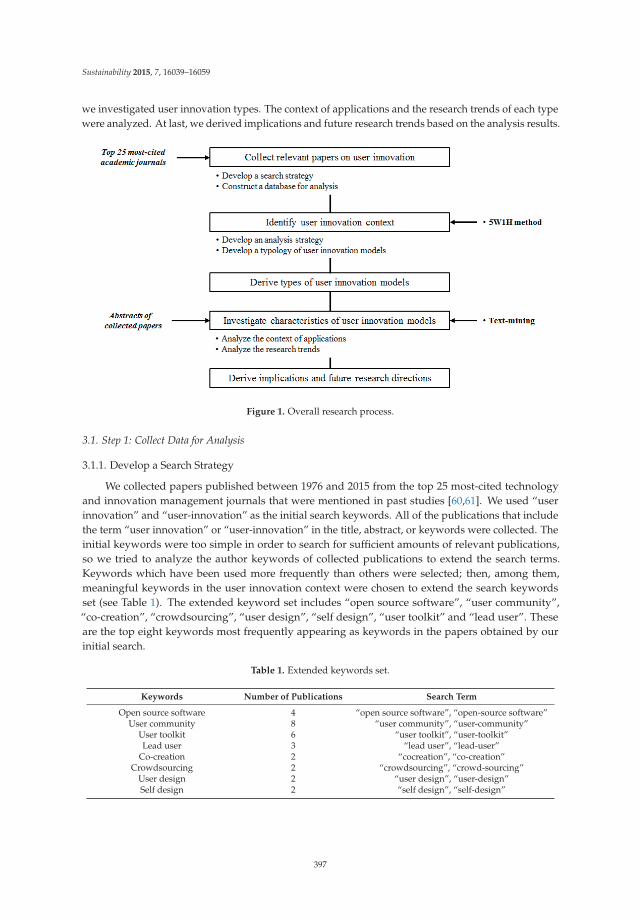
Sustainability 2015, 7, 16039–16059
we investigated user innovation types. The context of applications and the research trends of each typewere analyzed. At last, we derived implications and future research trends based on the analysis results.
Figure 1. Overall research process.
3.1. Step 1: Collect Data for Analysis
3.1.1. Develop a Search Strategy
We collected papers published between 1976 and 2015 from the top 25 most-cited technologyand innovation management journals that were mentioned in past studies [60,61]. We used “userinnovation” and “user-innovation” as the initial search keywords. All of the publications that includethe term “user innovation” or “user-innovation” in the title, abstract, or keywords were collected. Theinitial keywords were too simple in order to search for sufficient amounts of relevant publications,so we tried to analyze the author keywords of collected publications to extend the search terms.Keywords which have been used more frequently than others were selected; then, among them,meaningful keywords in the user innovation context were chosen to extend the search keywordsset (see Table 1). The extended keyword set includes “open source software”, “user community”,“co-creation”, “crowdsourcing”, “user design”, “self design”, “user toolkit” and “lead user”. Theseare the top eight keywords most frequently appearing as keywords in the papers obtained by ourinitial search.
Table 1. Extended keywords set.
Keywords Number of Publications Search Term
Open source software 4 “open source software”, “open-source software”User community 8 “user community”, “user-community”
User toolkit 6 “user toolkit”, “user-toolkit”Lead user 3 “lead user”, “lead-user”
Co-creation 2 “cocreation”, “co-creation”Crowdsourcing 2 “crowdsourcing”, “crowd-sourcing”
User design 2 “user design”, “user-design”Self design 2 “self design”, “self-design”
397
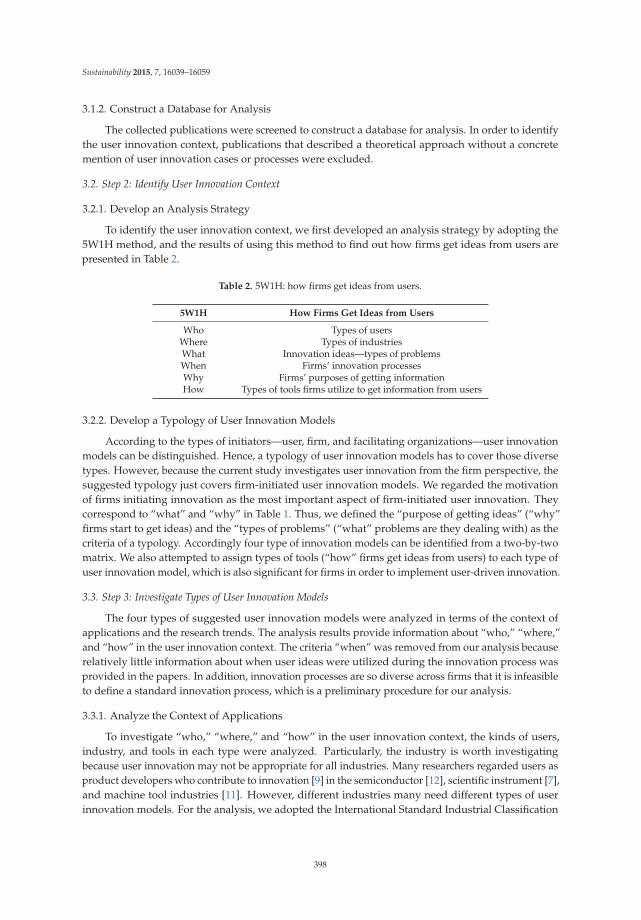
Sustainability 2015, 7, 16039–16059
3.1.2. Construct a Database for Analysis
The collected publications were screened to construct a database for analysis. In order to identifythe user innovation context, publications that described a theoretical approach without a concretemention of user innovation cases or processes were excluded.
3.2. Step 2: Identify User Innovation Context
3.2.1. Develop an Analysis Strategy
To identify the user innovation context, we first developed an analysis strategy by adopting the5W1H method, and the results of using this method to find out how firms get ideas from users arepresented in Table 2.
Table 2. 5W1H: how firms get ideas from users.
5W1H How Firms Get Ideas from Users
Who Types of usersWhere Types of industriesWhat Innovation ideas—types of problemsWhen Firms’ innovation processesWhy Firms’ purposes of getting informationHow Types of tools firms utilize to get information from users
3.2.2. Develop a Typology of User Innovation Models
According to the types of initiators—user, firm, and facilitating organizations—user innovationmodels can be distinguished. Hence, a typology of user innovation models has to cover those diversetypes. However, because the current study investigates user innovation from the firm perspective, thesuggested typology just covers firm-initiated user innovation models. We regarded the motivationof firms initiating innovation as the most important aspect of firm-initiated user innovation. Theycorrespond to “what” and “why” in Table 1. Thus, we defined the “purpose of getting ideas” (“why”firms start to get ideas) and the “types of problems” (“what” problems are they dealing with) as thecriteria of a typology. Accordingly four type of innovation models can be identified from a two-by-twomatrix. We also attempted to assign types of tools (“how” firms get ideas from users) to each type ofuser innovation model, which is also significant for firms in order to implement user-driven innovation.
3.3. Step 3: Investigate Types of User Innovation Models
The four types of suggested user innovation models were analyzed in terms of the context ofapplications and the research trends. The analysis results provide information about “who,” “where,”and “how” in the user innovation context. The criteria “when” was removed from our analysis becauserelatively little information about when user ideas were utilized during the innovation process wasprovided in the papers. In addition, innovation processes are so diverse across firms that it is infeasibleto define a standard innovation process, which is a preliminary procedure for our analysis.
3.3.1. Analyze the Context of Applications
To investigate “who,” “where,” and “how” in the user innovation context, the kinds of users,industry, and tools in each type were analyzed. Particularly, the industry is worth investigatingbecause user innovation may not be appropriate for all industries. Many researchers regarded users asproduct developers who contribute to innovation [9] in the semiconductor [12], scientific instrument [7],and machine tool industries [11]. However, different industries many need different types of userinnovation models. For the analysis, we adopted the International Standard Industrial Classification
398
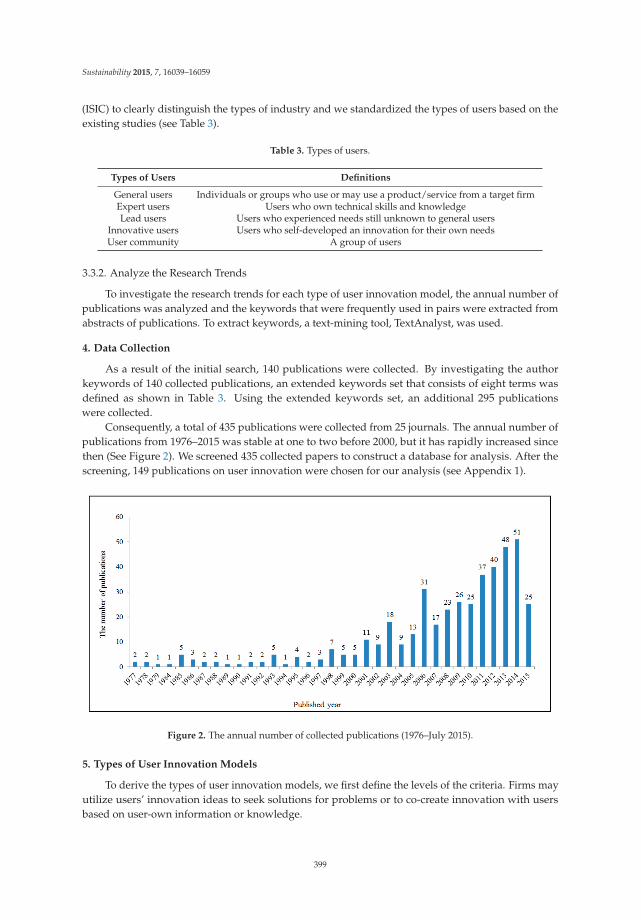
Sustainability 2015, 7, 16039–16059
(ISIC) to clearly distinguish the types of industry and we standardized the types of users based on theexisting studies (see Table 3).
Table 3. Types of users.
Types of Users Definitions
General users Individuals or groups who use or may use a product/service from a target firmExpert users Users who own technical skills and knowledgeLead users Users who experienced needs still unknown to general users
Innovative users Users who self-developed an innovation for their own needsUser community A group of users
3.3.2. Analyze the Research Trends
To investigate the research trends for each type of user innovation model, the annual number ofpublications was analyzed and the keywords that were frequently used in pairs were extracted fromabstracts of publications. To extract keywords, a text-mining tool, TextAnalyst, was used.
4. Data Collection
As a result of the initial search, 140 publications were collected. By investigating the authorkeywords of 140 collected publications, an extended keywords set that consists of eight terms wasdefined as shown in Table 3. Using the extended keywords set, an additional 295 publicationswere collected.
Consequently, a total of 435 publications were collected from 25 journals. The annual number ofpublications from 1976–2015 was stable at one to two before 2000, but it has rapidly increased sincethen (See Figure 2). We screened 435 collected papers to construct a database for analysis. After thescreening, 149 publications on user innovation were chosen for our analysis (see Appendix 1).
Figure 2. The annual number of collected publications (1976–July 2015).
5. Types of User Innovation Models
To derive the types of user innovation models, we first define the levels of the criteria. Firms mayutilize users’ innovation ideas to seek solutions for problems or to co-create innovation with usersbased on user-own information or knowledge.
399
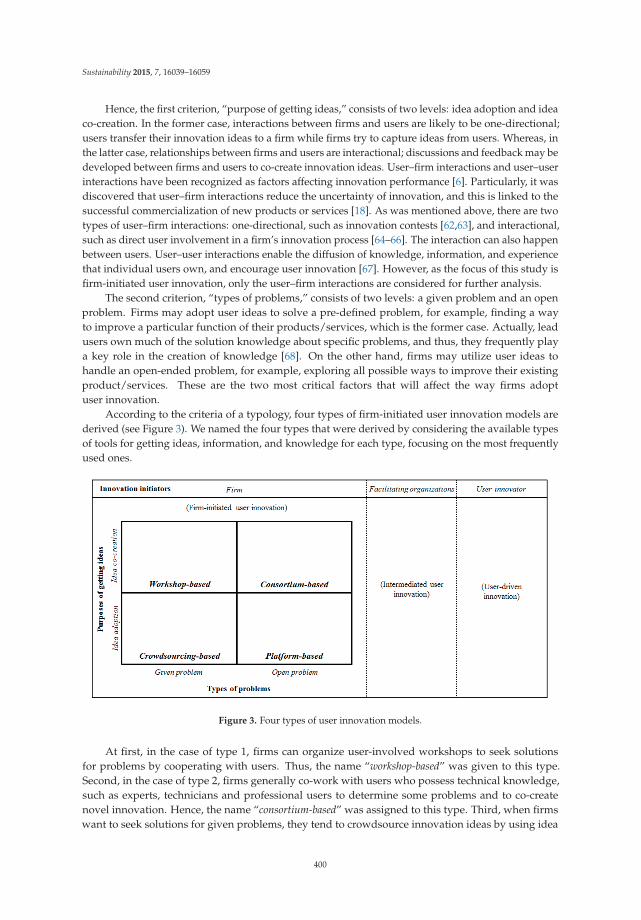
Sustainability 2015, 7, 16039–16059
Hence, the first criterion, “purpose of getting ideas,” consists of two levels: idea adoption and ideaco-creation. In the former case, interactions between firms and users are likely to be one-directional;users transfer their innovation ideas to a firm while firms try to capture ideas from users. Whereas, inthe latter case, relationships between firms and users are interactional; discussions and feedback may bedeveloped between firms and users to co-create innovation ideas. User–firm interactions and user–userinteractions have been recognized as factors affecting innovation performance [6]. Particularly, it wasdiscovered that user–firm interactions reduce the uncertainty of innovation, and this is linked to thesuccessful commercialization of new products or services [18]. As was mentioned above, there are twotypes of user–firm interactions: one-directional, such as innovation contests [62,63], and interactional,such as direct user involvement in a firm’s innovation process [64–66]. The interaction can also happenbetween users. User–user interactions enable the diffusion of knowledge, information, and experiencethat individual users own, and encourage user innovation [67]. However, as the focus of this study isfirm-initiated user innovation, only the user–firm interactions are considered for further analysis.
The second criterion, “types of problems,” consists of two levels: a given problem and an openproblem. Firms may adopt user ideas to solve a pre-defined problem, for example, finding a wayto improve a particular function of their products/services, which is the former case. Actually, leadusers own much of the solution knowledge about specific problems, and thus, they frequently playa key role in the creation of knowledge [68]. On the other hand, firms may utilize user ideas tohandle an open-ended problem, for example, exploring all possible ways to improve their existingproduct/services. These are the two most critical factors that will affect the way firms adoptuser innovation.
According to the criteria of a typology, four types of firm-initiated user innovation models arederived (see Figure 3). We named the four types that were derived by considering the available typesof tools for getting ideas, information, and knowledge for each type, focusing on the most frequentlyused ones.
Figure 3. Four types of user innovation models.
At first, in the case of type 1, firms can organize user-involved workshops to seek solutionsfor problems by cooperating with users. Thus, the name “workshop-based” was given to this type.Second, in the case of type 2, firms generally co-work with users who possess technical knowledge,such as experts, technicians and professional users to determine some problems and to co-createnovel innovation. Hence, the name “consortium-based” was assigned to this type. Third, when firmswant to seek solutions for given problems, they tend to crowdsource innovation ideas by using idea
400
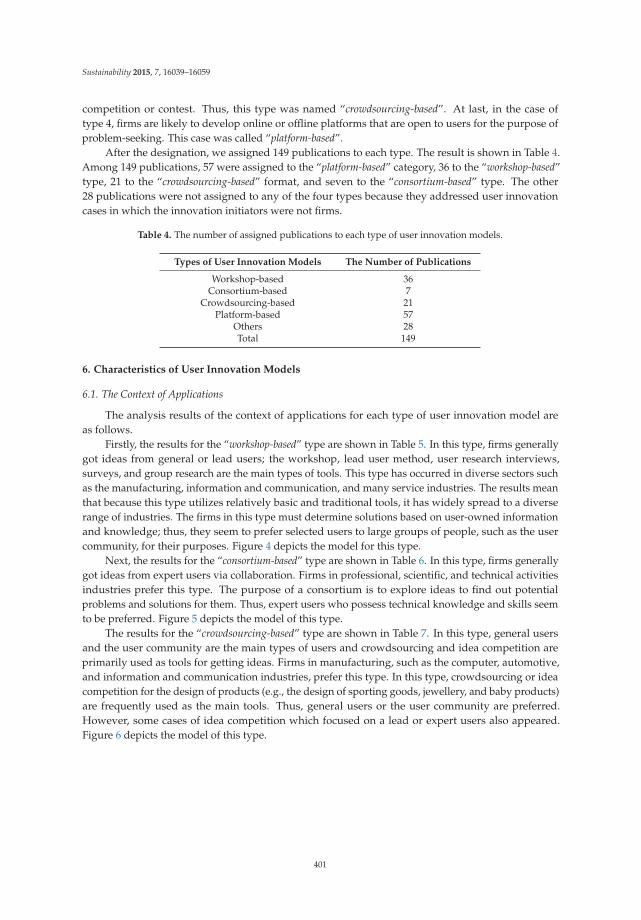
Sustainability 2015, 7, 16039–16059
competition or contest. Thus, this type was named “crowdsourcing-based”. At last, in the case oftype 4, firms are likely to develop online or offline platforms that are open to users for the purpose ofproblem-seeking. This case was called “platform-based”.
After the designation, we assigned 149 publications to each type. The result is shown in Table 4.Among 149 publications, 57 were assigned to the “platform-based” category, 36 to the “workshop-based”type, 21 to the “crowdsourcing-based” format, and seven to the “consortium-based” type. The other28 publications were not assigned to any of the four types because they addressed user innovationcases in which the innovation initiators were not firms.
Table 4. The number of assigned publications to each type of user innovation models.
Types of User Innovation Models The Number of Publications
Workshop-based 36Consortium-based 7
Crowdsourcing-based 21Platform-based 57
Others 28Total 149
6. Characteristics of User Innovation Models
6.1. The Context of Applications
The analysis results of the context of applications for each type of user innovation model areas follows.
Firstly, the results for the “workshop-based” type are shown in Table 5. In this type, firms generallygot ideas from general or lead users; the workshop, lead user method, user research interviews,surveys, and group research are the main types of tools. This type has occurred in diverse sectors suchas the manufacturing, information and communication, and many service industries. The results meanthat because this type utilizes relatively basic and traditional tools, it has widely spread to a diverserange of industries. The firms in this type must determine solutions based on user-owned informationand knowledge; thus, they seem to prefer selected users to large groups of people, such as the usercommunity, for their purposes. Figure 4 depicts the model for this type.
Next, the results for the “consortium-based” type are shown in Table 6. In this type, firms generallygot ideas from expert users via collaboration. Firms in professional, scientific, and technical activitiesindustries prefer this type. The purpose of a consortium is to explore ideas to find out potentialproblems and solutions for them. Thus, expert users who possess technical knowledge and skills seemto be preferred. Figure 5 depicts the model of this type.
The results for the “crowdsourcing-based” type are shown in Table 7. In this type, general usersand the user community are the main types of users and crowdsourcing and idea competition areprimarily used as tools for getting ideas. Firms in manufacturing, such as the computer, automotive,and information and communication industries, prefer this type. In this type, crowdsourcing or ideacompetition for the design of products (e.g., the design of sporting goods, jewellery, and baby products)are frequently used as the main tools. Thus, general users or the user community are preferred.However, some cases of idea competition which focused on a lead or expert users also appeared.Figure 6 depicts the model of this type.
401
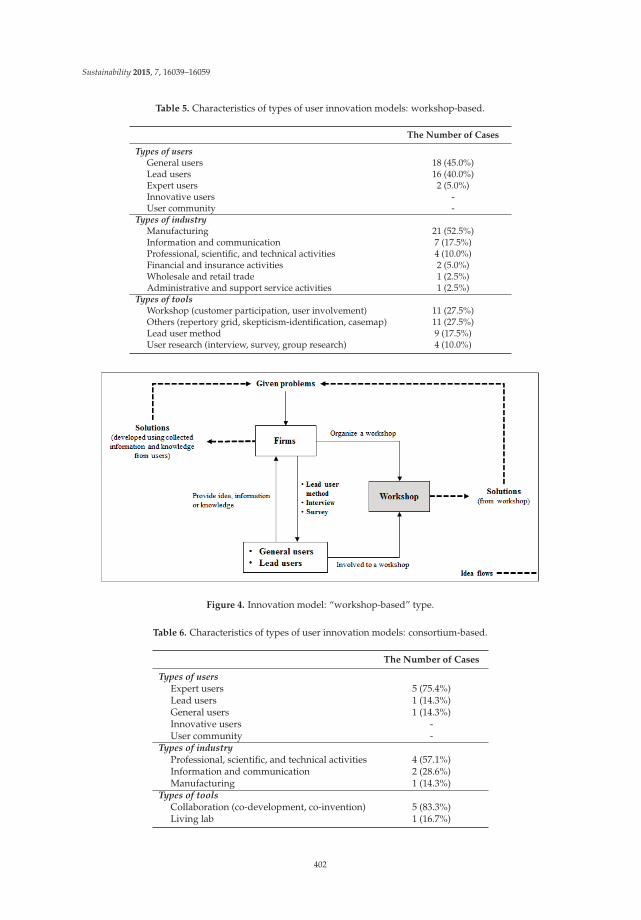
Sustainability 2015, 7, 16039–16059
Table 5. Characteristics of types of user innovation models: workshop-based.
The Number of Cases
Types of usersGeneral users 18 (45.0%)Lead users 16 (40.0%)Expert users 2 (5.0%)Innovative users -User community -
Types of industryManufacturing 21 (52.5%)Information and communication 7 (17.5%)Professional, scientific, and technical activities 4 (10.0%)Financial and insurance activities 2 (5.0%)Wholesale and retail trade 1 (2.5%)Administrative and support service activities 1 (2.5%)
Types of toolsWorkshop (customer participation, user involvement) 11 (27.5%)Others (repertory grid, skepticism-identification, casemap) 11 (27.5%)Lead user method 9 (17.5%)User research (interview, survey, group research) 4 (10.0%)
Figure 4. Innovation model: “workshop-based” type.
Table 6. Characteristics of types of user innovation models: consortium-based.
The Number of Cases
Types of usersExpert users 5 (75.4%)Lead users 1 (14.3%)General users 1 (14.3%)Innovative users -User community -
Types of industryProfessional, scientific, and technical activities 4 (57.1%)Information and communication 2 (28.6%)Manufacturing 1 (14.3%)
Types of toolsCollaboration (co-development, co-invention) 5 (83.3%)Living lab 1 (16.7%)
402
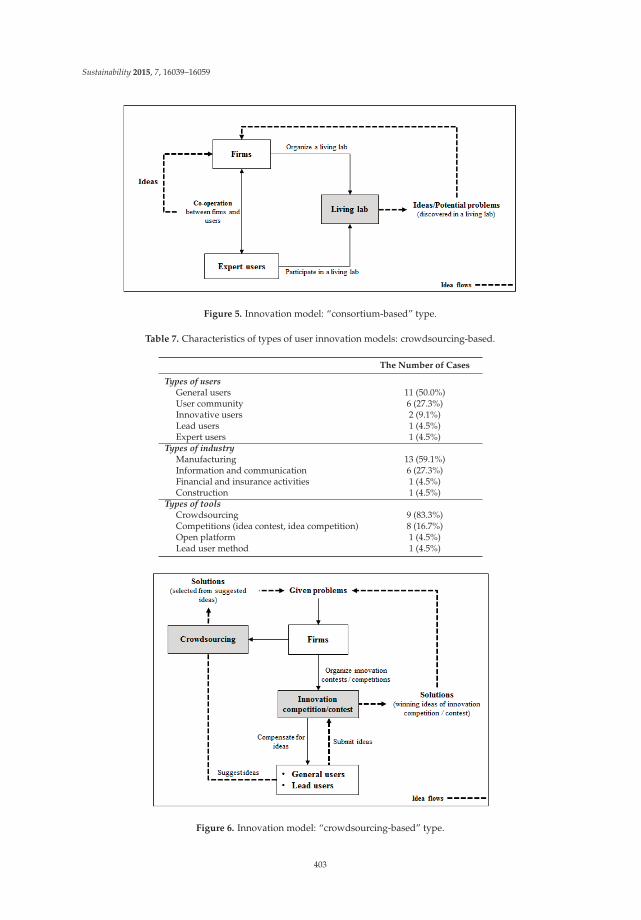
Sustainability 2015, 7, 16039–16059
Figure 5. Innovation model: “consortium-based” type.
Table 7. Characteristics of types of user innovation models: crowdsourcing-based.
The Number of Cases
Types of usersGeneral users 11 (50.0%)User community 6 (27.3%)Innovative users 2 (9.1%)Lead users 1 (4.5%)Expert users 1 (4.5%)
Types of industryManufacturing 13 (59.1%)Information and communication 6 (27.3%)Financial and insurance activities 1 (4.5%)Construction 1 (4.5%)
Types of toolsCrowdsourcing 9 (83.3%)Competitions (idea contest, idea competition) 8 (16.7%)Open platform 1 (4.5%)Lead user method 1 (4.5%)
Figure 6. Innovation model: “crowdsourcing-based” type.
403
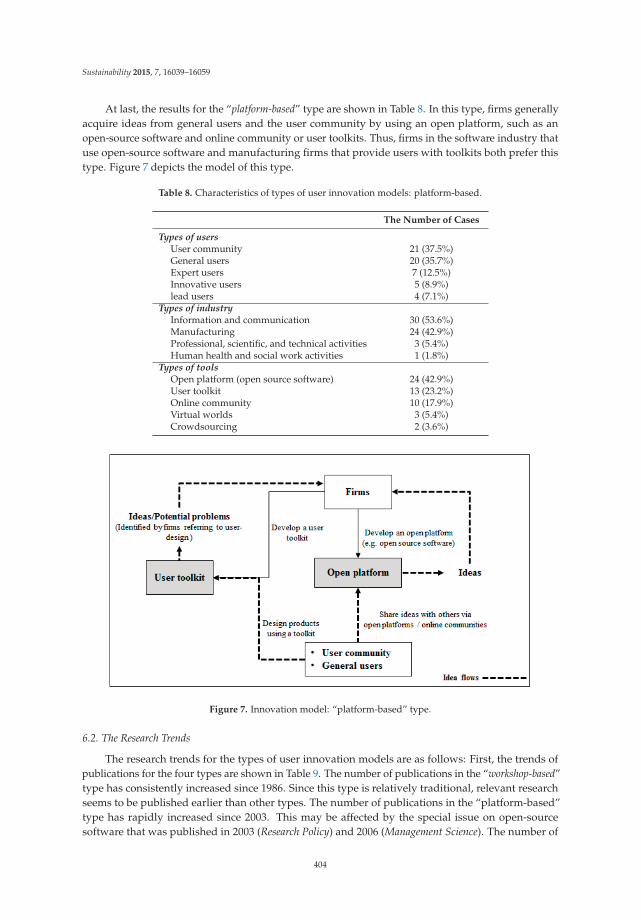
Sustainability 2015, 7, 16039–16059
At last, the results for the “platform-based” type are shown in Table 8. In this type, firms generallyacquire ideas from general users and the user community by using an open platform, such as anopen-source software and online community or user toolkits. Thus, firms in the software industry thatuse open-source software and manufacturing firms that provide users with toolkits both prefer thistype. Figure 7 depicts the model of this type.
Table 8. Characteristics of types of user innovation models: platform-based.
The Number of Cases
Types of usersUser community 21 (37.5%)General users 20 (35.7%)Expert users 7 (12.5%)Innovative users 5 (8.9%)lead users 4 (7.1%)
Types of industryInformation and communication 30 (53.6%)Manufacturing 24 (42.9%)Professional, scientific, and technical activities 3 (5.4%)Human health and social work activities 1 (1.8%)
Types of toolsOpen platform (open source software) 24 (42.9%)User toolkit 13 (23.2%)Online community 10 (17.9%)Virtual worlds 3 (5.4%)Crowdsourcing 2 (3.6%)
Figure 7. Innovation model: “platform-based” type.
6.2. The Research Trends
The research trends for the types of user innovation models are as follows: First, the trends ofpublications for the four types are shown in Table 9. The number of publications in the “workshop-based”type has consistently increased since 1986. Since this type is relatively traditional, relevant researchseems to be published earlier than other types. The number of publications in the “platform-based”type has rapidly increased since 2003. This may be affected by the special issue on open-sourcesoftware that was published in 2003 (Research Policy) and 2006 (Management Science). The number of
404
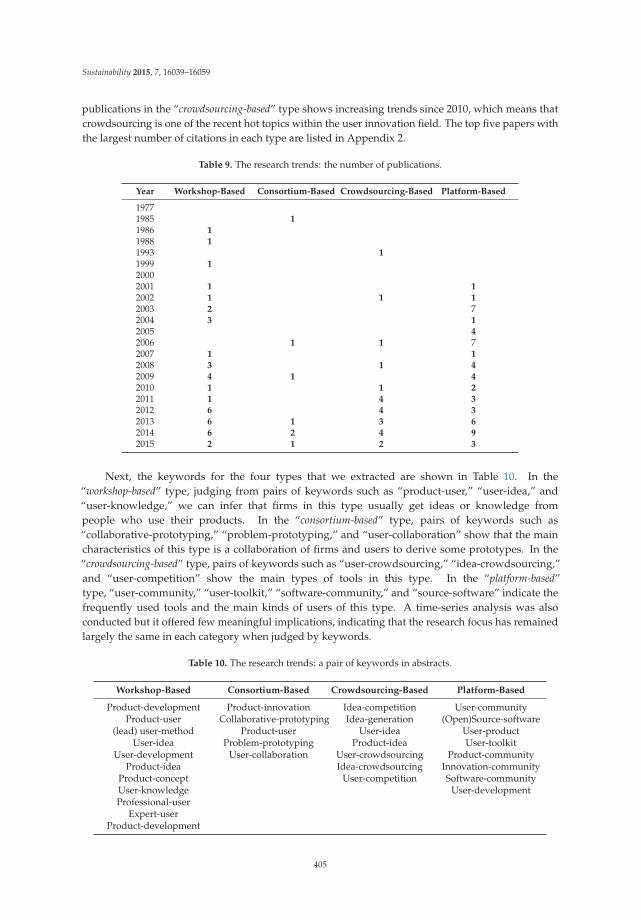
Sustainability 2015, 7, 16039–16059
publications in the “crowdsourcing-based” type shows increasing trends since 2010, which means thatcrowdsourcing is one of the recent hot topics within the user innovation field. The top five papers withthe largest number of citations in each type are listed in Appendix 2.
Table 9. The research trends: the number of publications.
Year Workshop-Based Consortium-Based Crowdsourcing-Based Platform-Based
19771985 11986 11988 11993 11999 120002001 1 12002 1 1 12003 2 72004 3 12005 42006 1 1 72007 1 12008 3 1 42009 4 1 42010 1 1 22011 1 4 32012 6 4 32013 6 1 3 62014 6 2 4 92015 2 1 2 3
Next, the keywords for the four types that we extracted are shown in Table 10. In the“workshop-based” type, judging from pairs of keywords such as “product-user,” “user-idea,” and“user-knowledge,” we can infer that firms in this type usually get ideas or knowledge frompeople who use their products. In the “consortium-based” type, pairs of keywords such as“collaborative-prototyping,” “problem-prototyping,” and “user-collaboration” show that the maincharacteristics of this type is a collaboration of firms and users to derive some prototypes. In the“crowdsourcing-based” type, pairs of keywords such as “user-crowdsourcing,” “idea-crowdsourcing,”and “user-competition” show the main types of tools in this type. In the “platform-based”type, “user-community,” “user-toolkit,” “software-community,” and “source-software” indicate thefrequently used tools and the main kinds of users of this type. A time-series analysis was alsoconducted but it offered few meaningful implications, indicating that the research focus has remainedlargely the same in each category when judged by keywords.
Table 10. The research trends: a pair of keywords in abstracts.
Workshop-Based Consortium-Based Crowdsourcing-Based Platform-Based
Product-development Product-innovation Idea-competition User-communityProduct-user Collaborative-prototyping Idea-generation (Open)Source-software
(lead) user-method Product-user User-idea User-productUser-idea Problem-prototyping Product-idea User-toolkit
User-development User-collaboration User-crowdsourcing Product-communityProduct-idea Idea-crowdsourcing Innovation-community
Product-concept User-competition Software-communityUser-knowledge User-developmentProfessional-user
Expert-userProduct-development
405
Sustainability 2015, 7, 16039–16059
6.3. Consortium-Based User Innovation for Sustainable Business Models
For designing sustainable business models, one of the key challenges is to enable a firm to gaineconomic value for itself through delivering social and environmental benefits [69]. In addition,many researchers argue that considering social practices is of importance for making changesto existing routines and lifestyles to more appropriate ones for sustainability purposes [70–72].A consortium-based innovation can be one of the ways to tackle these challenges by taking asociotechnical approach to developing sustainable business models.
Living labs are an emerging and representative approach to consortium-based user innovation.Being characterized by openness and user involvement, this approach requires firms to considerideas stemming from external sources in the innovation processes, particularly those from users [73].It stresses the central role of the user and users are active participants. Thus, the living labsapproach is regarded as a method of innovation, a collection of open innovation tools and networks,experimentation platforms, and a tool for user involvement from the sociotechnical perspective. Forexample, Liedtke et al. [74] introduce the sustainable living lab research infrastructure as an example ofa setting for socio-technical experiments in product-service-systems. Other researchers have focusedon living labs as a tool for research and governance [75,76], for solving social problems [77], or forsocial innovation [78].
In our analysis, the living lab was used as a tool for user innovation in a “consortium-based”type (see Table 6). However, there are few papers having both keywords “user innovation” and“Living lab(s)” in the top 25 most-cited innovation journals, possibly because the living lab researchis building its own research streams. Actually, we could find more living lab papers published inother journals than our target innovation journals. About 303 publications are retrieved by searchingon GoogleScholar using “living lab” and “user innovation” as searching keywords. These studieswere conducted to suggest a framework to fertilize user innovation by using a living lab [79,80],explore user innovation in living labs [81], seek out affecting factors of user participation in livinglab field trials [82], and explore differences between several test methods for user involvement in aliving lab context [83]. User innovation studies, adopting a living lab approach, have been conductedsporadically. Investigating these studies in detail will provide meaningful implications for developingsustainable business models.
7. Implications and Future Research Directions
Several implications that can be derived from the analysis and future research possibilities arediscussed here. First, the number of studies about the “consortium-based” type is relatively small.Recently, research about living lab, a representative approach for a “consortium-based” type, has beenactively conducted in practice and academia. Seeking new innovation ideas in a consortium enables tochange a firm’s business models from the perspective of industrial eco-systems and not within thefirm. Therefore, it may be valuable to study the “consortium-based” type in the future; for instance, howa living lab approach can be utilized to facilitate user innovation in the context of innovation studies.Among 149 publications on user innovation (see Appendix 1), we could find only one relevant paper,which uses the keyword “living lab” in its abstract. Though most of the living lab research is expectedto be published in other journals, more discussions would be needed in the innovation journals.
Second, the user community has hardly been utilized for idea co-creation; however, it has widelybeen utilized for idea adoption. It is possible that the user community possesses plenty of usefulinformation and knowledge for the development of products, technology and service if it is comprisedof lead or expert users. Thus, if firms establish a workshop or a consortium with a user community,then there exists a possibility that firms can get useful ideas for new business development. Therefore,it is worthwhile to study a potentiality of the user community as a cooperation partner for ideaadoption in firms.
Third, service firms have seldom utilized crowdsourcing or an open platform. In a “workshop-based”type, firms in service industries (e.g., the financial, insurance, and mobile telephone sectors) have
406
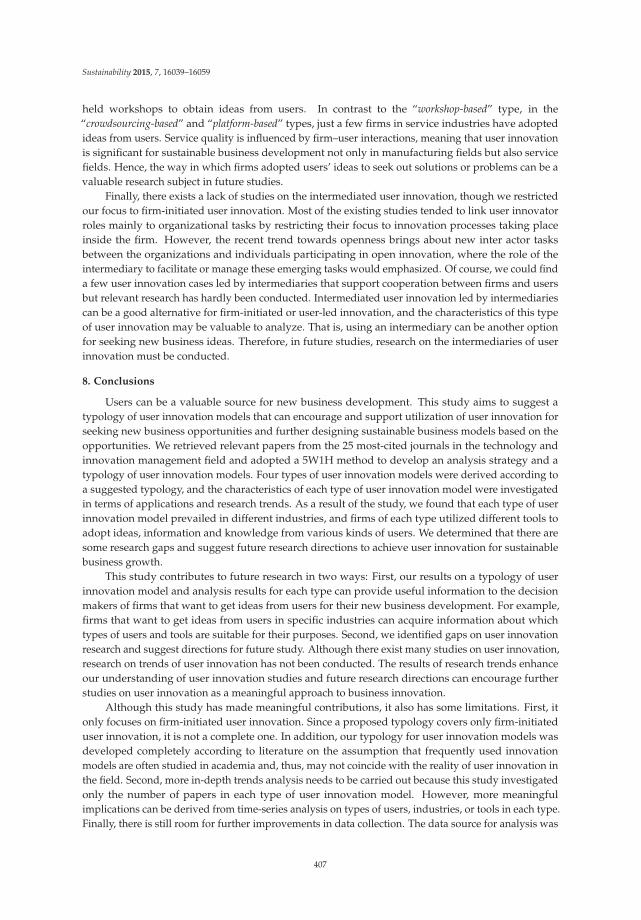
Sustainability 2015, 7, 16039–16059
held workshops to obtain ideas from users. In contrast to the “workshop-based” type, in the“crowdsourcing-based” and “platform-based” types, just a few firms in service industries have adoptedideas from users. Service quality is influenced by firm–user interactions, meaning that user innovationis significant for sustainable business development not only in manufacturing fields but also servicefields. Hence, the way in which firms adopted users’ ideas to seek out solutions or problems can be avaluable research subject in future studies.
Finally, there exists a lack of studies on the intermediated user innovation, though we restrictedour focus to firm-initiated user innovation. Most of the existing studies tended to link user innovatorroles mainly to organizational tasks by restricting their focus to innovation processes taking placeinside the firm. However, the recent trend towards openness brings about new inter actor tasksbetween the organizations and individuals participating in open innovation, where the role of theintermediary to facilitate or manage these emerging tasks would emphasized. Of course, we could finda few user innovation cases led by intermediaries that support cooperation between firms and usersbut relevant research has hardly been conducted. Intermediated user innovation led by intermediariescan be a good alternative for firm-initiated or user-led innovation, and the characteristics of this typeof user innovation may be valuable to analyze. That is, using an intermediary can be another optionfor seeking new business ideas. Therefore, in future studies, research on the intermediaries of userinnovation must be conducted.
8. Conclusions
Users can be a valuable source for new business development. This study aims to suggest atypology of user innovation models that can encourage and support utilization of user innovation forseeking new business opportunities and further designing sustainable business models based on theopportunities. We retrieved relevant papers from the 25 most-cited journals in the technology andinnovation management field and adopted a 5W1H method to develop an analysis strategy and atypology of user innovation models. Four types of user innovation models were derived according toa suggested typology, and the characteristics of each type of user innovation model were investigatedin terms of applications and research trends. As a result of the study, we found that each type of userinnovation model prevailed in different industries, and firms of each type utilized different tools toadopt ideas, information and knowledge from various kinds of users. We determined that there aresome research gaps and suggest future research directions to achieve user innovation for sustainablebusiness growth.
This study contributes to future research in two ways: First, our results on a typology of userinnovation model and analysis results for each type can provide useful information to the decisionmakers of firms that want to get ideas from users for their new business development. For example,firms that want to get ideas from users in specific industries can acquire information about whichtypes of users and tools are suitable for their purposes. Second, we identified gaps on user innovationresearch and suggest directions for future study. Although there exist many studies on user innovation,research on trends of user innovation has not been conducted. The results of research trends enhanceour understanding of user innovation studies and future research directions can encourage furtherstudies on user innovation as a meaningful approach to business innovation.
Although this study has made meaningful contributions, it also has some limitations. First, itonly focuses on firm-initiated user innovation. Since a proposed typology covers only firm-initiateduser innovation, it is not a complete one. In addition, our typology for user innovation models wasdeveloped completely according to literature on the assumption that frequently used innovationmodels are often studied in academia and, thus, may not coincide with the reality of user innovation inthe field. Second, more in-depth trends analysis needs to be carried out because this study investigatedonly the number of papers in each type of user innovation model. However, more meaningfulimplications can be derived from time-series analysis on types of users, industries, or tools in each type.Finally, there is still room for further improvements in data collection. The data source for analysis was
407
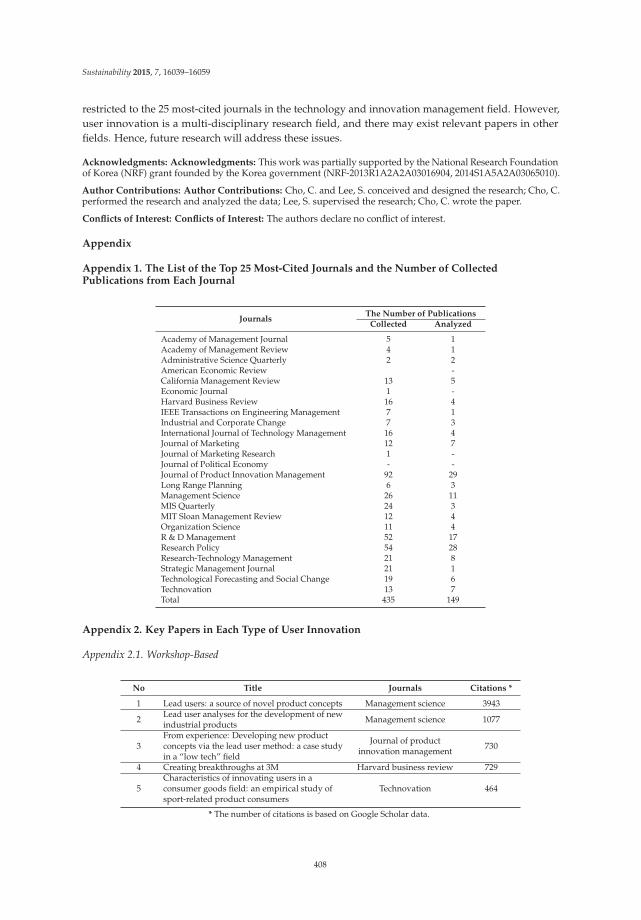
Sustainability 2015, 7, 16039–16059
restricted to the 25 most-cited journals in the technology and innovation management field. However,user innovation is a multi-disciplinary research field, and there may exist relevant papers in otherfields. Hence, future research will address these issues.
Acknowledgments: Acknowledgments: This work was partially supported by the National Research Foundationof Korea (NRF) grant founded by the Korea government (NRF-2013R1A2A2A03016904, 2014S1A5A2A03065010).
Author Contributions: Author Contributions: Cho, C. and Lee, S. conceived and designed the research; Cho, C.performed the research and analyzed the data; Lee, S. supervised the research; Cho, C. wrote the paper.
Conflicts of Interest: Conflicts of Interest: The authors declare no conflict of interest.
Appendix
Appendix 1. The List of the Top 25 Most-Cited Journals and the Number of CollectedPublications from Each Journal
JournalsThe Number of Publications
Collected Analyzed
Academy of Management Journal 5 1Academy of Management Review 4 1Administrative Science Quarterly 2 2American Economic Review -California Management Review 13 5Economic Journal 1 -Harvard Business Review 16 4IEEE Transactions on Engineering Management 7 1Industrial and Corporate Change 7 3International Journal of Technology Management 16 4Journal of Marketing 12 7Journal of Marketing Research 1 -Journal of Political Economy - -Journal of Product Innovation Management 92 29Long Range Planning 6 3Management Science 26 11MIS Quarterly 24 3MIT Sloan Management Review 12 4Organization Science 11 4R & D Management 52 17Research Policy 54 28Research-Technology Management 21 8Strategic Management Journal 21 1Technological Forecasting and Social Change 19 6Technovation 13 7Total 435 149
Appendix 2. Key Papers in Each Type of User Innovation
Appendix 2.1. Workshop-Based
No Title Journals Citations *
1 Lead users: a source of novel product concepts Management science 3943
2 Lead user analyses for the development of newindustrial products Management science 1077
3From experience: Developing new productconcepts via the lead user method: a case studyin a “low tech” field
Journal of productinnovation management 730
4 Creating breakthroughs at 3M Harvard business review 729
5Characteristics of innovating users in aconsumer goods field: an empirical study ofsport-related product consumers
Technovation 464
* The number of citations is based on Google Scholar data.
408
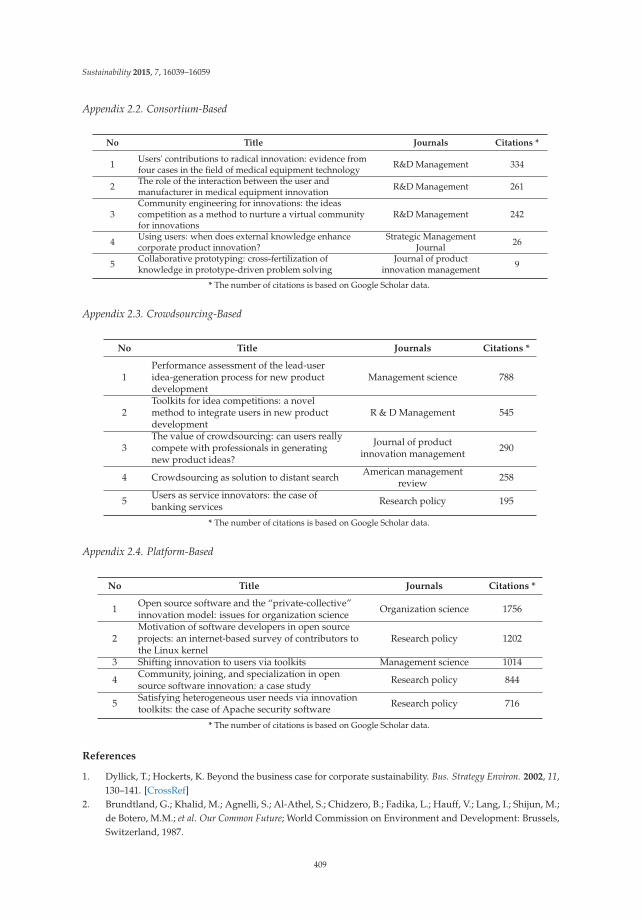
Sustainability 2015, 7, 16039–16059
Appendix 2.2. Consortium-Based
No Title Journals Citations *
1 Users' contributions to radical innovation: evidence fromfour cases in the field of medical equipment technology R&D Management 334
2 The role of the interaction between the user andmanufacturer in medical equipment innovation R&D Management 261
3Community engineering for innovations: the ideascompetition as a method to nurture a virtual communityfor innovations
R&D Management 242
4 Using users: when does external knowledge enhancecorporate product innovation?
Strategic ManagementJournal 26
5 Collaborative prototyping: cross-fertilization ofknowledge in prototype-driven problem solving
Journal of productinnovation management 9
* The number of citations is based on Google Scholar data.
Appendix 2.3. Crowdsourcing-Based
No Title Journals Citations *
1Performance assessment of the lead-useridea-generation process for new productdevelopment
Management science 788
2Toolkits for idea competitions: a novelmethod to integrate users in new productdevelopment
R & D Management 545
3The value of crowdsourcing: can users reallycompete with professionals in generatingnew product ideas?
Journal of productinnovation management 290
4 Crowdsourcing as solution to distant search American managementreview 258
5 Users as service innovators: the case ofbanking services Research policy 195
* The number of citations is based on Google Scholar data.
Appendix 2.4. Platform-Based
No Title Journals Citations *
1 Open source software and the “private-collective”innovation model: issues for organization science Organization science 1756
2Motivation of software developers in open sourceprojects: an internet-based survey of contributors tothe Linux kernel
Research policy 1202
3 Shifting innovation to users via toolkits Management science 1014
4 Community, joining, and specialization in opensource software innovation: a case study Research policy 844
5 Satisfying heterogeneous user needs via innovationtoolkits: the case of Apache security software Research policy 716
* The number of citations is based on Google Scholar data.
References
1. Dyllick, T.; Hockerts, K. Beyond the business case for corporate sustainability. Bus. Strategy Environ. 2002, 11,130–141. [CrossRef]
2. Brundtland, G.; Khalid, M.; Agnelli, S.; Al-Athel, S.; Chidzero, B.; Fadika, L.; Hauff, V.; Lang, I.; Shijun, M.;de Botero, M.M.; et al. Our Common Future; World Commission on Environment and Development: Brussels,Switzerland, 1987.
409
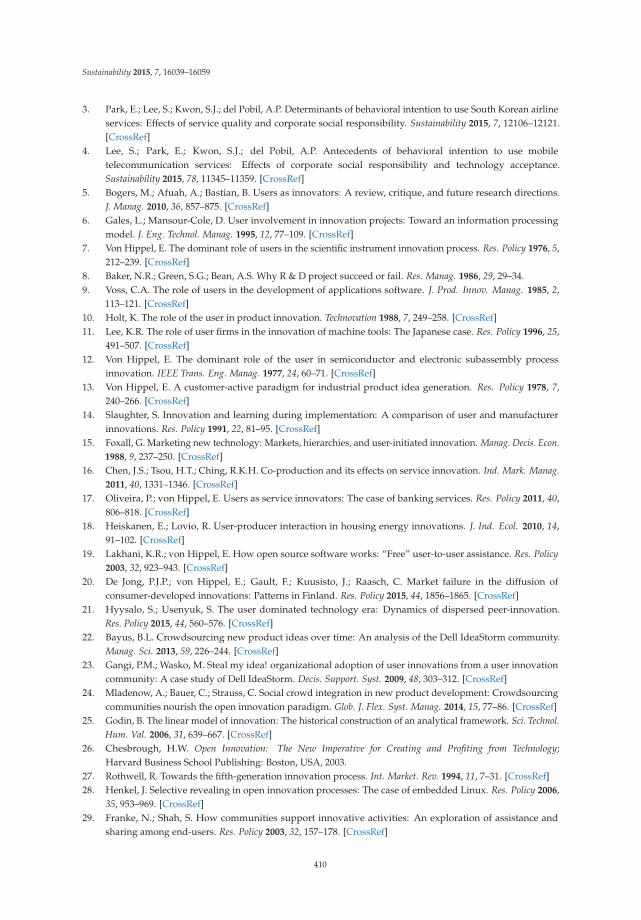
Sustainability 2015, 7, 16039–16059
3. Park, E.; Lee, S.; Kwon, S.J.; del Pobil, A.P. Determinants of behavioral intention to use South Korean airlineservices: Effects of service quality and corporate social responsibility. Sustainability 2015, 7, 12106–12121.[CrossRef]
4. Lee, S.; Park, E.; Kwon, S.J.; del Pobil, A.P. Antecedents of behavioral intention to use mobiletelecommunication services: Effects of corporate social responsibility and technology acceptance.Sustainability 2015, 78, 11345–11359. [CrossRef]
5. Bogers, M.; Afuah, A.; Bastian, B. Users as innovators: A review, critique, and future research directions.J. Manag. 2010, 36, 857–875. [CrossRef]
6. Gales, L.; Mansour-Cole, D. User involvement in innovation projects: Toward an information processingmodel. J. Eng. Technol. Manag. 1995, 12, 77–109. [CrossRef]
7. Von Hippel, E. The dominant role of users in the scientific instrument innovation process. Res. Policy 1976, 5,212–239. [CrossRef]
8. Baker, N.R.; Green, S.G.; Bean, A.S. Why R & D project succeed or fail. Res. Manag. 1986, 29, 29–34.9. Voss, C.A. The role of users in the development of applications software. J. Prod. Innov. Manag. 1985, 2,
113–121. [CrossRef]10. Holt, K. The role of the user in product innovation. Technovation 1988, 7, 249–258. [CrossRef]11. Lee, K.R. The role of user firms in the innovation of machine tools: The Japanese case. Res. Policy 1996, 25,
491–507. [CrossRef]12. Von Hippel, E. The dominant role of the user in semiconductor and electronic subassembly process
innovation. IEEE Trans. Eng. Manag. 1977, 24, 60–71. [CrossRef]13. Von Hippel, E. A customer-active paradigm for industrial product idea generation. Res. Policy 1978, 7,
240–266. [CrossRef]14. Slaughter, S. Innovation and learning during implementation: A comparison of user and manufacturer
innovations. Res. Policy 1991, 22, 81–95. [CrossRef]15. Foxall, G. Marketing new technology: Markets, hierarchies, and user-initiated innovation. Manag. Decis. Econ.
1988, 9, 237–250. [CrossRef]16. Chen, J.S.; Tsou, H.T.; Ching, R.K.H. Co-production and its effects on service innovation. Ind. Mark. Manag.
2011, 40, 1331–1346. [CrossRef]17. Oliveira, P.; von Hippel, E. Users as service innovators: The case of banking services. Res. Policy 2011, 40,
806–818. [CrossRef]18. Heiskanen, E.; Lovio, R. User-producer interaction in housing energy innovations. J. Ind. Ecol. 2010, 14,
91–102. [CrossRef]19. Lakhani, K.R.; von Hippel, E. How open source software works: “Free” user-to-user assistance. Res. Policy
2003, 32, 923–943. [CrossRef]20. De Jong, P.J.P.; von Hippel, E.; Gault, F.; Kuusisto, J.; Raasch, C. Market failure in the diffusion of
consumer-developed innovations: Patterns in Finland. Res. Policy 2015, 44, 1856–1865. [CrossRef]21. Hyysalo, S.; Usenyuk, S. The user dominated technology era: Dynamics of dispersed peer-innovation.
Res. Policy 2015, 44, 560–576. [CrossRef]22. Bayus, B.L. Crowdsourcing new product ideas over time: An analysis of the Dell IdeaStorm community.
Manag. Sci. 2013, 59, 226–244. [CrossRef]23. Gangi, P.M.; Wasko, M. Steal my idea! organizational adoption of user innovations from a user innovation
community: A case study of Dell IdeaStorm. Decis. Support. Syst. 2009, 48, 303–312. [CrossRef]24. Mladenow, A.; Bauer, C.; Strauss, C. Social crowd integration in new product development: Crowdsourcing
communities nourish the open innovation paradigm. Glob. J. Flex. Syst. Manag. 2014, 15, 77–86. [CrossRef]25. Godin, B. The linear model of innovation: The historical construction of an analytical framework. Sci. Technol.
Hum. Val. 2006, 31, 639–667. [CrossRef]26. Chesbrough, H.W. Open Innovation: The New Imperative for Creating and Profiting from Technology;
Harvard Business School Publishing: Boston, USA, 2003.27. Rothwell, R. Towards the fifth-generation innovation process. Int. Market. Rev. 1994, 11, 7–31. [CrossRef]28. Henkel, J. Selective revealing in open innovation processes: The case of embedded Linux. Res. Policy 2006,
35, 953–969. [CrossRef]29. Franke, N.; Shah, S. How communities support innovative activities: An exploration of assistance and
sharing among end-users. Res. Policy 2003, 32, 157–178. [CrossRef]
410
Sustainability 2015, 7, 16039–16059
30. Franke, N.; von Hippel, E.; Schreier, M. Finding commercially attractive user innovations: A test of lead-usertheory. J. Prod. Innov. Manag. 2006, 23, 301–315. [CrossRef]
31. Franke, N.; von Hippel, E. Satisfying heterogeneous user needs via innovation toolkits: The case of apachesecurity software. Res. Policy 2003, 32, 1199–1215. [CrossRef]
32. Lüthje, C.; Herstatt, C. The lead user method: An outline of empirical findings and issues for future research.R D Manag. 2003, 34, 553–568. [CrossRef]
33. Morrison, P.D.; Roberts, J.H.; von Hippel, E. Determinants of user innovation and innovation sharing in alocal market. Manag. Sci. 2000, 46, 1513–1527. [CrossRef]
34. Urban, G.L.; von Hippel, E. Lead user analyses for the development of new industrial products. Manag. Sci.1988, 34, 569–582. [CrossRef]
35. Baldwin, C.; Hienerth, C.; von Hippel, E. How user innovations become commercial products: A theoreticalinvestigation and case study. Res. Policy 2006, 35, 1291–1313. [CrossRef]
36. Hienerth, C. The commercialization of user innovations: The development of the Rodeo Kayak industry.R D Manag. 2006, 36, 273–294. [CrossRef]
37. Marchi, G.; Giachetti, C.; de Gennaro, P. Extending lead-user theory to online brand communities: The caseof the community Ducati. Technovation 2011, 31, 350–361. [CrossRef]
38. Jeppesen, L.B.; Molin, M.J. Consumers as co-developers: Learning and innovation outside the firm.Technol. Anal. Strateg. Manag. 2003, 15, 363–383. [CrossRef]
39. Von Hippel, E.; von Krogh, G. Open source software and the “private-collective” innovation model: Issuesfor organization science. Organ. Sci. 2003, 14, 209–223. [CrossRef]
40. Von Krogh, G.; Spaeth, S.; Lakhani, K.R. Community, joining, and specialization in open source softwareinnovation: A case study. Res. Policy 2003, 32, 1217–1241. [CrossRef]
41. Shah, S.K. Motivation, governance, and the viability of hybrid forms in open source software development.Manag. Sci. 2006, 52, 1000–1014. [CrossRef]
42. Jeppesen, L.B. User toolkits for innovation: Consumers support each other. J. Prod. Innov. Manag. 2005, 22,347–362. [CrossRef]
43. Franke, N.; Keinz, P.; Schreier, M. Complementing mass customization toolkits with user communities: Howpeer input improves customer self-design. J. Prod. Innov. Manag. 2008, 25, 546–559. [CrossRef]
44. Franke, N.; Piller, F. Value creation by toolkits for user innovation and design: The case of the watch market.J. Prod. Innov. Manag. 2004, 21, 401–415. [CrossRef]
45. Jeppesen, L.B.; Lakhani, K.M. Marginality and problem solving effectiveness in broadcast search. Organ. Sci.2010, 21, 1016–1033. [CrossRef]
46. Archak, N. Money, Glory and Cheap Talk: Analyzing Strategic Behavior of Contestants in SimultaneousCrowdsourcing Contests on TopCoder.com. In Proceedings of the 19th International Conference on WorldWide Web, Raleigh, NC, USA, 26–30 April 2010.
47. Orgawa, S.; Piller, F.T. Reducing the risks of new product development. MIT Sloan Manag. Rev. 2006, 47,65–71.
48. Bocken, N.; Short, S.; Rana, P.; Evans, S. A literature and practice review to develop Sustainable BusinessModel Archetypes. J. Clean. Prod. 2014, 65, 42–56. [CrossRef]
49. Boons, F.; Lüdeke-Freund, F. Business models for sustainable innovation: State-of-the-art and steps towardsa research agenda. J. Clean. Prod. 2013, 45, 9–19. [CrossRef]
50. Stubbs, W.; Cocklin, C. Conceptualizing a “Sustainability Business Model”. Organ. Environ. 2008, 21, 103–127.[CrossRef]
51. Teece, D. Business Models, Business Strategy and Innovation. Long Range Plan. 2010, 43, 172–194. [CrossRef]52. Lüdeke-Freund, F. Towards a Conceptual Framework of Business Models for Sustainability; ERSCP-EMU
Conference: Delft, The Netherlands, 2010.53. Zott, C.; Amit, R.; Massa, L. The business model: Recent developments and future research. J. Manag. 2011,
37, 1019–1042.54. Elkington, J. Cannibals with Forks: The Triple Bottom Line of 21st Century Business; Capstone: Oxford, UK, 1997.55. Ehrenfeld, J.R. The Roots of Sustainability. MIT Sloan Manag. Rev. 2005, 46, 23–26.56. Osterwalder, A.; Pigneur, Y. Business Model Generation: A Handbook for Visionaries, Game Changers, and
Challengers; John Wiley & Sons: Hoboken, NJ, USA, 2010.
411
Sustainability 2015, 7, 16039–16059
57. Yunus, M.; Moingeon, B.; Lehmann-Ortega, L. Building social business models: Lessons from the Grameenexperience. Long Range Plann. 2010, 43, 308–325. [CrossRef]
58. Amit, R.; Zott, C. Creating value through business model innovation. MIT Sloan Manag. Rev. 2012, 53, 41–49.59. Almirall, E.; Wareham, J. Innovation: A question of fit – the Living labs approach. In Proceedings of
Symposium on Transversal Topics, Barcelona, Spain, 2–3 April 2009.60. Linton, J.D.; Thongpapanl, N.T. Ranking the technology innovation management journals. J. Prod.
Innov. Manag. 2004, 21, 123–139. [CrossRef]61. West, J.; Bogers, M. Leveraging external sources of innovation: A review of research on open innovation.
J. Prod. Innov. Manag. 2014, 31, 814–831. [CrossRef]62. Boudreau, K.J.; Lakhani, K.R. Using the crowd as an innovation partner. Harv. Bus. Rev. 2013, 91, 60–69.
[PubMed]63. Bullinger, A.C.; Neyer, A.K.; Rass, M.; Moeslein, K.M. Community-based innovation contests: Where
competition meets cooperation. Creativity Innov. Manag. 2010, 19, 290–303. [CrossRef]64. Lehoux, P.; Miller, F.A.; Hivon, M.; Demers-Payette, O.; Urbach, D.R. Clinicians as health technology
designers: Two contrasting tales about user involvement in innovation development. Health Policy Technol.2013, 2, 122–130. [CrossRef]
65. Magnusson, P.R. Exploring the contributions of involving ordinary users in ideation of technology-basedservices. J. Prod. Innov. Manag. 2009, 26, 578–593. [CrossRef]
66. Still, K.; Huhtamäki, J.; Isomursu, M.; Lahti, J.; Koskela-Huotari, K. Analytics of the Impact of UserInvolvement in the Innovation Process and its Outcomes. Case Study: Media-Enhanced Learning (MEL)Service. In Proceedings of the Paper Presented at the 4th World Conference on Educational Sciences,Barcelona, Spain, 2–5 February 2012.
67. Harrison, D.; Waluszewski, A. The development of a user network as a way to re-launch an unwantedproduct. Res. Policy 2008, 37, 115–130. [CrossRef]
68. Jeppesen, L.B.; Laursen, K. The role of lead users in knowledge sharing. Res. Policy 2009, 38, 1582–1589.[CrossRef]
69. Schaltegger, S.; Lüdeke-Freund, F.; Hansen, E.G. Business cases for sustainability: The role of business modelinnovation for corporate sustainability. Int. J. Innov. Sustain. Dev. 2012, 6, 95–119. [CrossRef]
70. Reckwitz, A. Toward a Theory of Social Practices—A Development in Culturalist Theorizing. Eur. J.Soc. Theory 2002, 5, 243–263. [CrossRef]
71. Shove, E. Social theory and climate change questions often, sometimes and not yet asked. Theory Cult. Soc.2010, 27, 277–288. [CrossRef]
72. Spaargaren, G. Theories of practices: Agency, technology, and culture Exploring the relevance ofpractice theories for the governance of sustainable consumption practices in the new world-order.Glob. Environ. Chang. 2011, 21, 813–822. [CrossRef]
73. Bergvall-Kåreborn, B.; Eriksson, C.L.; Ståhlbröst, A.; Svensson, J. A Milieu for Innovation—Defining LivingLabs. In Proceedings of the 2nd ISPIM Innovation Symposium, New York, NY, USA, 6–9 December 2009.
74. Liedtke, C.; Baedeker, C.; Hasselkuβ, M.; Rohn, H. User-integrated innovation in Sustainable LivingLabs:An experimental infrastructure for researching and developing sustainable product service systems. J. Clean.Prod. 2015, 97, 106–116. [CrossRef]
75. McCormick, K.; Kiss, B. Learning through renovations for urban sustainability: The case of the MalmöInnovation Platform. Curr. Opin. Environ. Sustain. 2015, 16, 44–50. [CrossRef]
76. Voytenko, Y.; McCormick, K.; Evans, J.; Schliwa, G. Urban living labs for sustainability and low carbon citiesin Europe: Towards a research agenda. J. Clean. Prod. 2015, in press.
77. Franz, Y. Designing social living labs in urban research. Info 2015, 17, 53–66.78. Liedtke, C.; Welfens, M.J.; Rohn, H.; Nordmann, J. LIVING LAB: User-driven innovation for sustainability.
Int. J. Sustain. High. Educ. 2012, 13, 106–118. [CrossRef]79. Guzmán, G.; del Carpio, A.F.; Colomo-Palacios, R.; de Diego, M.V. Living labs for user-driven innovation—A
process reference model. Res. Technol. Manag. 2013, 56, 29–39. [CrossRef]80. Ståhlbröst, A.; Bertoni, M.; Følstad, A.; Ebbesson, E.; Lund, J. Social media for user innovation in Living Labs:
A framework to support user recruitment and commitment. In Proceedings of the 26th ISPIM Conference,Helsinki, Finland, 16–19 June 2013.
412

Sustainability 2015, 7, 16039–16059
81. Leminen, S.; Nyström, A.G.; Westerlund, M. A typology of creative consumers in living labs. J. Eng.Technol. Manag. 2015, in press. [CrossRef]
82. Georges, A.; Schuurman, D.; Baccarne, B.; Coorevits, L. User engagement in living lab field trials. Info 2015,17, 26–39.
83. Karin, W.; Annika, Å.; Ståhlbröst, A. Exploring differences between central located test and home use test ina living lab context. Int. J. Consum. Stud. 2015, 39, 230–238. [CrossRef]
© 2015 by the authors. Licensee MDPI, Basel, Switzerland. This article is an open accessarticle distributed under the terms and conditions of the Creative Commons Attribution(CC BY) license (http://creativecommons.org/licenses/by/4.0/).
413
Article
Weak and Strong Compensation for the Prioritizationof Public Investments: Multidimensional Analysisfor Pools
Gianluigi De Mare 1,*, Maria Fiorella Granata 2,† and Antonio Nesticò 1,†
1 Department of Civil Engineering, University of Salerno, Via Giovanni Paolo II, 132,Fisciano (SA) 84084, Italy; [email protected]
2 Department of Architecture, University of Palermo, Viale delle Scienze, ed, 14, Palermo 90128, Italy;[email protected]
* Correspondence: [email protected]; Tel.: +39-089-964118† These authors contributed equally to this work.
Academic Editor: Adam JabłonskiReceived: 9 September 2015; Accepted: 24 November 2015; Published: 2 December 2015
Abstract: Despite the economic crisis still heavily affecting most of Europe, a possible resumptioncan be found in the revitalization of public and private investments. These investments should bedirected not only towards the strategic areas of infrastructures and production, but also to thosewhich allow for a higher level of the quality of life (sports facilities, parks, etc.). In such cases, the needto balance the reasons of financial sustainability with environmental and social profiles is even moreevident. Thus, multicriteria techniques, supporting complex assessments, should be implementedtogether with a monetary feasibility study (cost-benefit analysis). Multidimensional methods allowfor the aggregation of different profiles into overall indicators. This study gives an account ofhow the application and comparison of multi-criteria approaches based on tools characterized bya higher or lower level of compensation between criteria can broaden the spectrum of analysis ofthe problems and lead to a more subtle logic of funding for public works and works of public utility,with a more current and mature sharing of profitability between private investors and users ofcommunity infrastructures.
Keywords: multicriteria evaluation; economic assessment; sports facilities; strong and weaksustainability; SMART; PROMETHEE II
1. Introduction
The formation of metropolitan cities, with geographic extensions much greater than the past,and the integration of original cultures from different countries raise the level of complexity ofinfrastructures in urban systems (transport, education, health, sports, etc.). At the same time, the recenteconomic crisis has placed the institutions that have historically been producers of the investmentneeded for such public works in front of the problem of having to find sufficient financial resources.In Europe, the financing channels have been primarily identified as the resources made available bythe European Community, as well as the most advanced forms of public-private partnership. Privatepartners base the decision about their adhesion to projects of public interest on the fundamentalcriterion of the economic and financial convenience, which must be verified by using the appropriatefinancial evaluation techniques. Although the verification of the economic and financial feasibility isa necessary requirement for the realization of the project by private parties, the interest of the localcommunity can be measured through a purely monetary analysis [1–4]. Therefore, the point of view ofthe public authority is broader. Based on the adopted strategic policies, it is interesting to know thelevel of satisfaction on social, cultural and environmental requests [5].
Sustainability 2015, 7, 16022–16038; doi:10.3390/su71215798 www.mdpi.com/journal/sustainability414
Sustainability 2015, 7, 16022–16038
Public authorities should therefore be able to expertly mediate between the monetary feasibilityof investments and its social and political coherence compared to the demands of growth anddevelopment from the population. In this perspective, it is important to be capable of “measuring” thesuitability of either a public project or a project of public interest, in meeting the needs expressed bythe local community. The measure of this capacity can be applied to a dual purpose: (1) identificationof local priority projects to be considered within the definition of tools for territorial government; and(2) preparation of appropriate measures supporting the projects of public interest, which, althoughpossibly characterized by a smaller economic attractiveness for private investors, can make a moresignificant contribution to the welfare of the community.
The assessment of the ability of a project of public interest in meeting the needs of the localcommunity has a multidimensional nature and must be able to integrate the local political preferencesdelegated to land management.
To this end, the definition of composite indices, capable of integrating the quality of the urbanprojects from the point of view of the community into an overall assessment, is useful. These syntheticindexes can be used as evaluation instruments of the quality of urban projects from the perspectiveof the community and can pose parameters of judgment to identify reliefs, for example of a financialor tax nature, that can direct the membership of private partners to projects that are more favorableto the community. They can also be used to identify priority actions in the field of local strategic andfinancial planning.
The main functions of a composite index of sustainability related to a public work or a work ofpublic interest can be identified in the ability to synthetically express the quality of the project in termsof the objectives of sustainability, to encourage communication with all of the involved parties and tolegitimize choices derived from a rational and transparent analysis of the available alternatives [6].
The purpose of this paper is the construction of socio-environmental convenience indexes andintegrated sustainability indexes for the provision of sports facilities. The index must summarize themain needs expressed by the stakeholders. Composite indicators of this type can also be defined fordifferent types of projects.
This objective is pursued using different multi-criteria evaluation techniques, in view of thedistinction between “weak sustainability” and “strong sustainability”, opposing the idea of the almostcomplete against the idea of only the limited substitutability of natural capital with physical capital,respectively [7]. In particular, two different decision-making models, suitable for evaluating thecontribution of public investments and private investments of public interest from the two-fold pointof view of sustainability understood in a weak and strong sense, are proposed.
The model described in this paper is useful for the construction of a multi-dimensional indexof “restricted social convenience” and “overall social convenience” or “overall sustainability” forinvestments targeted at the creation or adaptation of municipal swimming pools in the province ofSalerno (Italy). The paper is organized in some introductory Section 2, Section 3, Section 4, Section 5,Section 6 and Section 7 on multicriteria tools for the construction of convenience indicators, in sectionson the processing of models (8 and 9) and sections summarizing and discussing the results in Section 10and Section 11.
2. The Formulation of a Social Convenience Index for Investments of a Public Nature
Synthetic indexes or composite indicators are evaluation tools widely used in decision-makingon economy, environment, globalization, society, innovation and technology [8], public policies [9],sustainability about single civil engineering works [10] and at a local level [11], as well as in rankingcountries [12].
Several aggregation procedures have been proposed to build a composite indicator integratingmanifold issues [13,14]; however, from an operational point of view, they are the result of anaggregation rule applied to values representing the performance of a given alternative on a setof criteria.
415
Sustainability 2015, 7, 16022–16038
The construction of a social synthetic index includes the following fundamental steps:
1. the carrying out of a detailed analysis of the basic needs of the local community as an instrumentguiding the identification of the relevant points of view in the analysis of alternatives [15];
2. the choice of a suitable aggregation procedure, considering the use of the composite indicator inthe sustainable management of the territory and the necessity of being easily understandable forlocal administrators, even if they do not have specific technical competences in decision analysis;
3. the weighting of considered indicators;4. the implementation of the aggregative model for each alternative, in order to obtain the value of
the indexes.
In general, either weights are directly attributed by experts or special techniques used in order toachieve more objective values. The assignment of weights to single indicators for their aggregation isconsidered a crucial step in social multicriteria evaluation, and a good solution could be the renunciationof their same assignment, considering, therefore, equal weights for all of the indicators. In this case, thenumber of the considered indicators will represent the importance of the criterion that they express [8].
The choice of aggregation procedure is also an important step for the essential implications ofeach procedure. Furthermore, it is known that the application of different decision models can lead todifferent results for the same decision problem [6,16].
The main aggregation approaches belong to Multiple Attribute Utility Theory (MAUT) [17,18],outranking methods, introduced by Bernard Roy [19], and other “non-classical” approaches [20].
Procedures belonging to classical approaches are all suitable for handling the aggregation ofsingle one-dimensional indicators in a comprehensive index, since they can deal with both quantitativeand qualitative information, as well as give as an outcome a measure of the performance of theconsidered alternatives.
The procedures belonging to the outranking approach, like the PROMETHEE (PreferenceRanking Organization METHod for Enrichment Evaluations) [21] and ELECTRE (ELiminationEt ChoixTraduisant la REalité) methods [19], which are based on a pair-wise comparison of thealternatives, use weights representing the coefficient of importance and are not, in general, totallycompensatory methods [22]. This is the reason why they are able to support a strong sustainabilityconcept in which a bad performance on an indicator is not fully compensated by a good performanceon another one [8]. The outranking approach assumes the hypothesis of the preferential independenceof any sub-family of indicators [22].
Approaches based on multi-attribute utility theory require the consideration of an n-dimensionalutility function that assigns a value to each alternative, representing its preferability. In general, then-dimensional utility function is constructed by aggregating one-dimensional utility functions on asingle criterion, to which a weight may be associated [18]. Using this kind of procedure, the preferentialindependence of the family of indicators is also assumed, so that the marginal utilities can be assessed;the different indicators have to be expressed on the same scale; and the weights represent substitutionrates [22].
The additive and multiplicative techniques are the most widely used form of aggregationfunction [23]. Other aggregation techniques, such as the class of Ordered Weighted Averaging (OWA)operators [24] and the Choquet integral [25,26], belong to the MAUT framework and are extensions ofweighted means. OWA operators are able to express vague quantifications, and the Choquet integralcan model interactions among criteria [27].
3. Social Convenience Indexes for Investments in Swimming Pools
In the present paper, a synthetic index of “restricted social convenience” related to projectsfor supplying sports facilities to a local community is defined. The proposed composite indicatorcomprehends both environmental aspects, as well as appropriate social aspects. Furthermore, a
416
Sustainability 2015, 7, 16022–16038
composite index of “overall social convenience”, also called “overall sustainability”, for the sameprojects is defined. It synthesizes the environmental, social and financial aspects.
Various reasons can explain the preference commonly given to the use of procedures based onadditive value functions in the construction of synthetic indexes of sustainability:
- the modeling of preferences is rather intuitive and therefore easily understandable by non-experts;- the value functions assign a comprehensive value to each alternative and not a measure of the
degree of preference of an alternative over another;- unlike the outranking methods, the comparability of alternatives is always possible [22];- the outcomes are robust due to the independent evaluation of each alternative [28].
The above-mentioned reasons also justify the decision to use the MAUT approach, in the weightedlinear form, for the formulation of an index of social convenience relating to investments for the creationor adaptation of sports facilities [29]. Furthermore, MAUT approaches allow for compensation amongthe different points of view integrated in the assessment procedure [22], with the result being agreeableto the assumption of a weak conception of sustainability [8], that is suitable for local contexts withseveral social needs to be satisfied.
With the aim of testing the results obtained with different aggregation techniques, in relationto the conception of sustainability in the strong or weak sense, in the present study, a comparison ismade between the results achieved with the use of a compensatory aggregation procedure and ofone that tends to partly compensate for the poor performance on some criteria with the favorableperformance on other criteria. Therefore, the outcomes of the available alternatives’ evaluation throughthe weighted linear sum aggregation model, in the simplified version SMART (simple multi-attributerating technique), will be compared to those obtained by using a less compensatory aggregationtechnique. In particular, the PROMETHEE II procedure will be used. The choice of the two aggregationprocedures is justified in the following section.
4. Reasons for the Choice of Aggregation Procedures
Using multi-criteria assessments for real decision-making problems in the public sector, theeasiness of understanding the method and the minimum request for preference information fromthe decision-makers have been highlighted as key features of a suitable decision-making model [6].Since in the evaluation process for the formulation of the aggregate index of the investments’ socialconvenience, the role of the decision-maker is held by political institutions, in general not equippedwith specific skills in the field of mathematical techniques for multi-criteria evaluation; the simplicityof the method is considered essential for the contribution of the decision-makers in eliciting theirpreferences, with it being more conscious and less prone to errors of interpretation.
As stated, the use of the MAUT approach is a widespread choice in the elaboration of sustainabilityindexes. In view of the difficulties detected in practice for defining the trade-off between the criteria [28]and due to the lack of information on the marginal utility functions, it was decided to resort to thesimplified formulation of the linear model MAUT, known as SMART. In contrast to the SMART method,which like the other additive models is fully compensatory, an outranking method is used. Proceduresbelonging to this class may have more or less a degree of compensation between the criteria [22].
Endowed with a greater comprehensibility for the decision-makers than ELECTRE methods [30],the PROMETHEE II procedure is implemented here. It provides a single complete preorder, althoughthe non-compensatory level is more limited compared to other ELECTRE methods, in particular in theabsence of thresholds of preference, indifference and veto [31]. Applying the PROMETHEE II, we optfor the functional form of the “usual criterion”, which avoids the definition of indifference and/orpreference thresholds, which is typically a complex [28,31,32] and time-consuming [33] exercise fordecision-makers. Neglecting the use of thresholds implies that any difference between two evaluationsproduces a strict preference for the alternative having a better, even if small, evaluation with respectthe considered criterion.
417
Sustainability 2015, 7, 16022–16038
SMART and PROMETHEE II are relatively simple multi-criteria evaluation procedures andtherefore easily comprehensible by non-expert actors involved in the assessment. In particular,as previously mentioned, among the possible forms adoptable for the preference function of theoutranking procedure, the “usual criterion” is chosen, since it does not require the definition ofadditional parameters and whose understanding is intuitive. The application domains of bothprocedures fit our decision problem [34], since they can treat discrete cardinal and ordinal information;they can also solve choice and ranking decision problems; they use the same type of inter-informationbetween criteria, since weights reflect the relative importance between criteria [21,35]; they can beimplemented using a simple spreadsheet. In addition, weights do not depend on the measurementscale of the criteria, both in the PROMETHEE II procedure [30] and in SMART, since in thelatter, the measurement scales are normalized [35]. These circumstances make their task easier fordecision-makers [33] and allow for the comparison of the results obtained by the two procedures.
5. Insertion of the Present Work in Literature Reviews
SMART and PROMETHEE methods are among the most used aggregation tools and have beenapplied to a wide variety of decision problems.
A literature review up to the year 2010 is given by Behzadian et al. [30], revealing an abundantproduction of the applications of PROMETHEE methods concerning logistic and transportationproblems; energy, water, environment and business management; chemistry, manufacturing and socialtopics. In more recent years, there has been a great deal of interest in applying the various PROMETHEEmethods, and a large number of applications about the management of natural resources is available;see Kuang et al. [36]. Only a recent interest has been shown for the specific field of assessment forthe sustainability of cities and territories. The surveyed applications are on decisions at a buildingscale [37], urban scale [32,38] and on an overall assessment of global cities [39].
The main application of SMART is on environmental management decisions [40–42], but it isalso proposed for a public assessment application for mitigation and adaptation policy [43], as well astransport [44]. On an urban scale, it is used in assessing the sustainability of built heritage [45], localenergy systems [46] and urban ecosystems [47–50].
The main aspects central to the present work are the comparison between different aggregationprocedures in multicriteria assessment and the issue of weak and strong sustainability. Previous workshave made comparisons between different assessment methods, according to the technical characteristicsof algorithms, as in [16,51], in order to make choices coherent with sustainability assessment problems [23]or to compare the results with aided decisions [52]. Compared to previous works, we aim to compare theoutcomes from different assessment methods with regard to the compensatory effect, and confrontingSMART and PROMETHEE II, we exclude the use of thresholds, as in [51], in order to investigatethe differences between the considered methods under maximum similarity conditions. Regardingsustainability assessment, there is a very large amount of literature on every sector and, in particular,urban areas, as in [53], while the issue of weak and strong sustainability has been mainly addressed from amethodological point of view [8,13,54–56]. Although there have been some specific applicatory workson regions [57], countries [58,59], fisheries [60] and urban heritage [61], the need to address the issue ofassessment application on weak and strong sustainability [62] has been recognized. In this work, theSMART and PROMETHEE II methods are used to assess the sustainability of single public projects in anurban context. In particular, they are applied to a swimming pool ranking problem.
6. Aggregation by the SMART Procedure
The weighted linear aggregation is the usual procedure used in the computation of compositeindicators. Using SMART, a simplified form of MAUT [35,63] given a set of alternatives {A1, A2, . . . Am},a set of indicators {c1, c2, . . . cn} and their respective weights {w1, w2, . . . wn}, a synthetic index (V)
418
Sustainability 2015, 7, 16022–16038
related to the alternative j is obtained by applying a weighted additive aggregation model, accordingto the following mathematical rule:
V pAiq “ÿ
ivij¨ wi i “ 1, 2, ..., n (1)
with: ÿi
wi “ 1 and 0 ď wi ď 1 (2)
where vi,j is the normalized performance value on the indicator ci and wi is the normalized weight [8].The assessment vi,j is standardized to a 0–1 scale, where zero and one represent the worst and best
performances, respectively [36]. The weights can be assigned by the direct rating method, according towhich raw weights are assigned to criteria ranked according to their importance, attributing a score of10 to the least important criterion, then assigning increasing scores to the other criteria in relation tothe first score and, finally, normalizing the sum of the assigned weights to one [35].
While in MAUT models, weights reflect both scale and importance, in SMART, weights reflectonly importance, since the scales are transformed to a common basis [64].
7. Aggregation by the PROMETHEE II Procedure
PROMETHEE procedures are based on the outranking relation, according to which an alternativeoutranks another alternative if, given the preferences of the decision-makers, there are sufficientarguments for recognizing that the first alternative is not less preferable than the second one [22]. Theconstruction of the outranking relation in the PROMETHEE II method is characterized by the use ofvariables and parameters that are easily understandable by unexperienced decision-makers [22].
Introduced by Brans and Vincke [21], the PROMETHEE methods have been used inapplications related to multiple fields [32], but their use is not widespread in the construction ofcomposite indicators.
Given a set of alternatives {A1, A2, . . . Am} and a system of indicators {c1, c2, . . . cn} with theirrespective weights {w1, w2, . . . wn} and knowing the performances of alternatives on single criteria,the outranking degree corresponding to an ordered couple of alternatives (Ar, As) is defined by theaggregated preference index, expressing the preference of Ar over As according to all of the criteria [65]:
π pAr, Asq “ÿn
i“1Pi pAr, Asq wi with i “ 1, 2, ..., n (3)
in which Pi (Ar, As) is a preference function related to the criteria i. Preference functions are definedby suitable functional forms and associated parameters, assigning to the differences between theperformance of two alternatives on a criterion, di (Ar, As) = ci (Ar) ´ ci (As), a preference degree rangingfrom 0–1. Among the available forms of the preference function [65], the one able to better expressthe preferences of the decision-makers will be chosen for each criterion. In the proposed assessmentmodel, the usual criterion has been adopted for all of the considered criteria. In case of a criterion i tobe maximized, comparing the alternatives Ar and As, the usual criterion expresses a strict preferenceof Ar in comparison with As only if the difference di (Ar, As) is positive. The choice is founded on theneed to use a very simple assessment model that can be easily understood by decision-makers andon the advisability of not requiring the use of a threshold of indifference and/or of strict preference.Thus, the generalized usual criterion does not require additional information in comparison to thesimple formulation of MAUT considered here. The preference function related to the usual criterion isexpressed as follows [65]:
Pi pAr, Asq “#
0 i f di pAr, Asq ď 0
1 i f di pAr, Asq ą 0(4)
This form of the generalized criterion corresponds to the “true criterion” [66], expressing a strictpreference for any difference between two evaluations [67].
419
Sustainability 2015, 7, 16022–16038
Finally, the PROMETHEE II procedure leads to a unique complete preorder ranking thealternatives according to a decreasing order of values of the net outranking flow ϕ(Ar) for eachalternative that is given by:
ϕ pArq “ ϕ` pArq ´ ϕ´ pArq (5)
where ϕ+(Ar) is the positive flow and ϕ´(Ar) is the negative flow, representing how the alternativeAr outranks the other ones and how Ar is outranked by the other alternatives. Positive and negativeflows are expressed as follows [65]:
ϕ` pArq “ 1m ´ 1
ÿk‰i
π pAr, Asq with r “ 1, 2, ..., m (6)
ϕ´ pArq “ 1m ´ 1
ÿk‰i
π pAs, Arq with r “ 1, 2, ..., m (7)
8. Three Projects for Municipal Pools in the Province of Salerno (Italy)
8.1. The swimming pool in Nocera Inferiore
The project involves the construction of an indoor swimming center to be built in the town ofNocera Inferiore (Salerno). The plant will be able to be approved by the Italian Swimming Federation,based on the safety standards of the Italian Olympic National Committee (CONI) and the Ministry ofInterior, which set the size of the tanks according to the activities that must take place. The plant isdesigned to emit into the atmosphere the least possible amount of pollutants and adopts alternativemethods of energy production, in the present case thermo-photovoltaic hybrid panels.
The project involves the construction of a semi-Olympic indoor pool with a size of 25 per 16.66 mand of two smaller swimming pools of 16.66 per 8 m, one dedicated to children and the other forrehabilitation activities and water aerobics. Some services dedicated to users are also planned. Theyinclude a bar, a solarium, a sauna and a gym. The structure is articulated on a single level consistingof a space for the swimming pools and a service block. The structure of external cladding of theservice block will be made of panels with improved thermal performances, while the coverage of theswimming pool area will be in curved laminated wood.
8.2. The swimming pool in Sapri
This swimming pool will be realized in the city of Sapri, more precisely in the south, in Brizzi,close to the town center. Currently, the area is a sports ground, and with the realization of the structure,it will become a real sports center. This project involves the construction of a concrete structure castin situ to be used as a reception and dressing room for athletes. The construction of the roof of theswimming pool is planned in precast prestressed concrete.
The pool for sports (swimming, water polo) has dimensions of 12.60 m for 25.00 m and a constantdepth of 2.00 m, with an area of 315 m2 and a volume of 630 m3. The flat roof around the pool willhave a width of 2.50 m along the long side and of 4.00 m along the other side, according to the normsof the Italian Olympic National Committee (CONI).
The pool cover, entirely prefabricated, will consist of prestressed elements and pillars, with a totalarea of 747 m2 (40.60 m for 18.40 m) and a practicable deck.
8.3. The swimming pool in Salerno
The plant is located in the center of Salerno. The project will cover the top of the adult pool,the reconstruction of the same pool, the construction of adjacent changing rooms, the renovation ofthe existing building and the installation of parking areas equipped with photovoltaic shelters. Theprojected plant includes an outdoor swimming pool of 28 m ˆ 20 m ˆ 1.60 m, an outdoor swimmingpool for children of 11 m ˆ 6 m ˆ 0.50 m, a solarium around the swimming pools, two changingrooms with toilets and showers, a waiting room with reception, an infirmary, a bar room, an engine
420
Sustainability 2015, 7, 16022–16038
room, a boiler room, an outdoor parking area for about fifty cars and a green area adjacent to theswimming plant.
9. Calculation of the Composite Indicators for the Three Municipal Pools
Relevant indicators have been selected on the basis of an in-depth analysis of the local contextconducted by the provincial public authority [68], as well as data taken from ISTAT (IstitutoNazionale di Statistica—National Institute of Statistics) on the local social, environmental and economiccharacteristics. According to ISTAT, young people are the main users of sports facilities; some studentassociations as the potential user basin of each swimming pool were involved in a discussion aimed atunderstanding their opinions about what features they expected a sustainable swimming pool shouldhave. Table 1 presents the final value tree, including the goal, criteria and indicators, while Table 2describes the single indicators, and Table 3 shows their direction and the measurement scales. Theset of selected criteria represents all of the key sustainability aspects in relation to the specific context,avoiding redundancy [66].
While the environmental and social aspects define the “restricted social convenience” of theinvestments in question, the addition of the pre-taxation internal rate of return allows for the assessmentof the “overall sustainability”, which integrates the financial feasibility.
The aesthetic quality of the projects has not been included in the set of criteria, because thealternatives can be considered as having the same level of architectonic quality.
While indicators I1, I4, I6 and I7 are measured in their natural scales, indicators I2, I3 and I5 expressqualitative judgments. Their levels of performance are measured according to the values shown in Table 4.
Table 1. Value tree.
Goal Criteria Codes-Indicators
Overall sustainability
Environmental issuesI1—Spared emissions from plantsI2—Preservation of natural landI3—Accessibility
Social issuesI4—Level of supply of swimming servicesI5—Synergistic effectI6—Employment effect
Financial issue I7—Pre-taxation internal rate of return
Table 2. Description of indicators.
Codes-Indicators Description
I1—Spared emissions from plantsIt measures the spared emission of CO2 per user due to thereduction of energy consumption from traditional energysources
I2—Preservation of natural land It expresses the quality of a project regarding the shift ofnatural land to artificial areas
I3—Accessibility It regards the presence of dedicated parking for users and thequality of a suitable public transport service
I4—Level of supply of swimmingservices
It concerns the level of the supply of swimming servicesagainst the local level of demand.
I5—Synergistic effectIt is achieved if the swimming plant is localized near othersports facilities, creating an integrated system of sportsfacilities useful also as a center for social gathering
I6—Employment effect It expresses the contribution to the development of newemployment
I7—Pre-taxation internal rate of return It expresses the financial feasibility of the investment
421
Sustainability 2015, 7, 16022–16038
Table 3. Information on indicators.
Codes-Indicators Direction Measurement Scale
I1—Spared emissions from plants To bemaximized kg CO2/year
I2—Preservation of natural land To bemaximized Judgment measured on an ordinal scale
I3—Accessibility To bemaximized Judgment measured on an ordinal scale
I4—Level of supply of swimming services To bemaximized
Supply of swimming services/relativedemand
I5—Synergistic effect To bemaximized Judgment measured on an ordinal scale
I6—Employment effect To bemaximized Number of employees
I7—Pre-taxation internal rate of return To bemaximized Value on 0–1 scale
Table 4. Levels of performance for indicators I2, I3 and I5.
I2 I3 I5
Performance-Score Performance-Score Performance-Score
Reuse of alreadybuilt land 10
Presence of dedicated parkingand of a suitable public
transport service10 Nearness to more than one
sports facility 10
Presence of dedicated parkingand of an insufficient public
transport service5 Nearness to one sports facility 5
Shifting of naturalland to artificial area 0
Absence of dedicated parkingand of a suitable public
transport service0 Nearness to no sports facility 0
Table 5 summarizes the performance of the considered projects for swimming facilities on the setof indicators. The projects cover three geographical areas of the province of Salerno, which are the cityof Salerno, the city of Nocera and the city of Sapri.
Table 5. Performance table.
Indicators Projects
Salerno Nocera Sapri
Environmental issuesI1 (kg CO2/year) 81,620 80,465 106,000
I2 (ordinal judgment) 10 0 0I3 (ordinal judgment) 10 5 5
Social issuesI4 (supply/demand) 0.96 1 1I5 (ordinal judgment) 5 10 5
I6 (number of employees) 25 40 15
Fin. issue I7 (Pre-taxation internal rate of return) 0.129 0.117 0.140
For the purposes of the aggregation of the performances of the alternatives using the SMARTmethod, we consider the standardized marginal utility functions assigning the value one to the bestperformance according to the considered indicator and the value zero to the worst one with the linearform of marginal utilities for indicators.
The aggregation of performances by the PROMETHEE II method does not require thetransformation into a common scale, thanks to a pairwise comparison between the alternatives.
422
Sustainability 2015, 7, 16022–16038
Initially, we calculated the synthetic index of the “restricted” social convenience relative to thealternatives under consideration. Regarding the weights, in the first assessment, we attached the samevalue to all of the indicators (0.166), by giving the same importance to the social and environmentalcriteria. This choice is justified by the consideration that the social and environmental issues are themain topics of sustainability in the considered local context.
Using the “distance from the best and worst performers” technique [6], the normalizedperformance table is obtained (Table 6).
Finally, according to Equations (1) and (5), the composite indicators of the restricted socialconvenience (RSC) related to the considered projects are calculated (Table 7). They express theenvironmental and social quality of each project.
The local administrations involved can choose the system of weights that best suit their policies.The composite indicators shown in Table 7 refer to a situation in which the same importance is attachedto individual indicators and then to the two social and environmental criteria. However, if the socialaspects are considered doubly more important than the environmental ones, the composite indicatorswill become the RSC’ ones of Table 8.
Table 6. Normalized performance table.
CriteriaProjects
Salerno Nocera Sapri
I1 0.05 0 1I2 1 0 0I3 1 0 0I4 0 1 1I5 0 1 0I6 0.40 1 0
Table 7. Composite indicators of social convenience obtained by assuming equal importance of thesocial and environmental aspects. RSC, restricted social convenience; SMART, simple multi-attributerating technique.
ProjectsComposite Indicators
RSC (SMART) RSC (PROM.)
Salerno 0.41 0.083Nocera 0.50 0.082Sapri 0.33 ´0.167
On the contrary, if the environmental issues are twice preferred in comparison to the social issues,the requested synthetic indexes are those in the columns RSC” of Table 8. The different preferencesrelated to the relative importance among the indicators could still be considered to better represent thepreferences of the decision-maker.
Table 8. Composite indicators of social convenience obtained taking a double preference for the socialaspects with respect to the environmental ones (RSC1) and vice versa (RSC”).
Projects RSC1 (SMART) RSC1 (PROM.) RSC” (SMART) RSC” (PROM.)
Salerno 0.316 ´0.111 0.499 0.278Nocera 0.667 0.333 0.333 ´0.167Sapri 0.333 ´0.222 0.333 ´0.111
We then calculated the composite indicators of the overall sustainability (SC) obtainedby integrating in the evaluation the contribution of the financial feasibility to the aspects ofsocial convenience.
423
Sustainability 2015, 7, 16022–16038
Table 9 shows the composite indexes of integrated sustainability obtained with the SMARTand PROMETHEE II procedures assuming equal importance to the three categories (the social,environmental and financial one) of the indicators.
Table 9. Composite indicators of integrated sustainability obtained by assuming equal importance forthe social, environmental and financial aspects.
ProjectsComposite Indicators
SC (SMART) SC (PROM.)
Salerno 0.449 0.055Nocera 0.333 ´0.278Sapri 0.555 0.222
Finally, Table 10 presents the aggregate indices obtained by attributing to the social aspectsa double importance compared to the environmental ones, while the environmental and financialaspects are considered of equal importance (SC1) and the aggregate indices obtained by giving to theenvironmental aspects a double importance in comparison to the social ones, while the financial andsocial aspects are considered of equal importance (SC”).
Table 10. Composite indicators of integrated sustainability obtained by assuming a double preferencefor the social aspects over the environmental and financial ones (SC1) and vice versa (SC”).
Projects SC1 (SMART) SC1 (PROM.) SC” (SMART) SC” (PROM.)
Salerno 0.371 ´0.083 0.509 0.208Nocera 0.501 0.000 0.250 ´0.375Sapri 0.500 0.083 0.500 0.167
10. Summary and Discussion of the Results
In this paper, the simplified linear aggregative model SMART and the PROMETHEE II modelhave been tested with the aim of verifying their utility in the elaboration of synthetic indexes for thechoice or ranking of investments in urban development. Table 11 presents the rankings obtainedthrough the use of the two procedures for the aggregation of the partial evaluation of the alternativeson the criteria.
As expected, the outcomes of the evaluation carried out by the considered methods lead todifferent scenarios. The comparison between the evaluation table (Table 3) and the ranking table(Table 11) induces the following considerations.
Assuming the same importance attributed to the classes of indicators, the exclusion of the financialparameter in the valuation of the synthetic index penalizes the investment in the territory of Sapri,which is the most disadvantaged for two out of three indicators for both the social category and theenvironmental aspects. Using SMART, the best performances of the alternative A2 (Nocera) on thesocial indicators offset the very bad performances on the environmental aspects. On the contrary,PROMETHEE II rewards the more balanced performances of the alternative A1 (Salerno).
If an equal importance is recognized for the various classes of indicators, the inclusion of thefinancial parameter in the evaluation of the synthetic index reverses the ranking of the investmentin Sapri, which is the most disadvantaged for two out of three indicators for both the social andenvironmental categories. The drawback is re-balanced by the best financial performance.
Assuming a greater importance is attributed to the class of indicators on the social aspectscompared to all of the remaining considered classes, the exclusion of the financial parameter in theevaluation of the synthetic index rewards, using both aggregation procedures, the investment in theterritory of Nocera, which has the best performance on the social category. For the successive positionsof the ranking, while PROMETHEE II awards the most balanced performances for the environmental
424
Sustainability 2015, 7, 16022–16038
aspects of the alternative A1-Salerno, SMART gives the highest-ranking to the alternative A3-Sapri, forwhich the best performance on the indicator I1 is able to balance the bad performances on the remainingenvironmental indicators. Analogous considerations can be made about the remaining rankings.
Nevertheless, the analysis of the results outlines some clearly legible trends.
Table 11. The obtained rankings.
RSC (SMART) RSC (PROM.)
Nocera SalernoSalerno Nocera
Sapri Sapri
SC (SMART) SC (PROM.)
Sapri SapriSalerno SalernoNocera Nocera
RSC1 (SMART) RSC1 (PROM.)
Nocera NoceraSapri Salerno
Salerno Sapri
SC1 (SMART) SC1 (PROM.)
Nocera SapriSapri Nocera
Salerno Salerno
RSC” (SMART) RSC” (PROM.)
Salerno SalernoNocera-Sapri SapriNocera-Sapri Nocera
SC” (SMART) SC” (PROM.)
Salerno SalernoSapri Sapri
Nocera Nocera
In the aggregation carried out neglecting the financial criterion, both aggregative models indicatethat the project in Sapri is the poorer. In fact, four times it is the last in the ranking, and two times it ispenultimate. On the contrary, the projects in Nocera and Salerno share the leadership, with three firstpositions and two second places in the rankings.
Moreover, the compensatory effect of the procedure SMART seems to show itself. In fact, theprocedure favors the project in Nocera (two first places and one second place in the rankings), whoseprofile of performances consists of three maximum values and three minimum values (see Table 4).Instead, the PROMETHEE method favors the project with a more balanced profile (Salerno; two timesin the first position in the rankings and one time in the second position).
The outlined framework dismantles itself with the introduction of the financial criterion. First, theproject in Sapri becomes by far the dominant one (three times it is in the first position of the rankingsand three times first in the second one). It is followed by the project in Salerno (two times in the firstposition of the rankings and two times in the second one) and then by the project in Nocera (one timein the first position of the rankings and one time in the second one).
However, what is most striking is the substantial stabilization of the rankings obtained using thetwo methods. In developing the indices SC and SC”, the rankings obtained by the two methods do notchange. Sapri-Salerno-Nocera is the ranking outlined applying both SMART and PROMETHEE inthe calculus of the index SC. Salerno-Sapri-Nocera is the ranking obtained using both SMART andPROMETHEE for the index SC”. In the calculation of SC1, the project in Salerno always occupies the
425
Sustainability 2015, 7, 16022–16038
third position in the rankings, regardless of the used aggregation procedure, while the projects inNocera and Sapri are reversed in the leadership.
This last evidence has strategic implications that deserve attention. The substantial stabilizationof the results achieved using a more compensatory aggregation procedure (SMART) or a lesscompensatory one (PROMETHEE) leads to distrust of easy propaganda proclamations. In fact, itwould be easy for decision-makers to convey the use of a non-compensatory aggregation procedure asa political choice of strong sustainability, when the same results are reached using a compensatorymethod. Therefore, in such cases, the prevalence of a project over another one does not arise from theapplication of stricter selective rules, but from the same nature of the projects that shows a very stablerelative placement (obviously with respect to the introduced criteria).
11. Conclusions
As previously stated, the reconciliation of social, environmental and financial requirementsplaces decision-makers in front of scenarios that are often complex, articulated or even conflicting.Multicriteria analysis techniques can support decision-makers in making aware and rational choices.
In comparison with the analysis carried out by the same authors in a previous work [29] wherethe rankings of the considered investments for supplying swimming pools in the south of Italy werecompletely opposite when a sustainable approach from an exclusively socio-environmental point ofview or a merely financial approach were alternatively considered, the analysis presented in this papercharacterizes the use of a multicriteria technique and a more articulated pattern of evaluation withregards to the considered set of weights.
Unlike the previously mentioned experiences, the new pattern of valuation combines the financialprofile with the socio-environmental one in the versions SC’ and SC”, and this integration destabilizesthe previously obtained rankings.
In fact, if the overall effects are considered, the investment in Sapri, which according to the firstanalysis conducted neglecting the financial criterion ranks four times out of six in the bottom position,rises to a top position three times out of six when the financial criterion is taken into consideration.The investment in Nocera, which was the best one three times out of six, ranks in the bottom positionfour times out of six.
However, the main difference is recorded for the investment in Salerno. If only the criteriabelonging to the social and environmental class are considered when calculating the syntheticindex [29], it ranks in an intermediate position, both attributing a greater importance to the socio-environmental aspects. In the new implementation, it has a better position in the rankings, whetherthe financial criterion is neglected or is taken into consideration.
Figure 1 shows the prevailing projects according to the considered assessment procedures. UsingSMART, the project in Nocera prevails three times over the others, while using PROMETHEE, themore balanced project in Salerno is preferred three times. This result confirms the less compensativeeffect of the used outranking method.
Figure 1. Prevailing projects according to the considered aggregation methods
The present analysis, which deserves further investigation from the point of view of the stabilityof outcomes on the basis of statistical techniques, highlights the huge responsibility of decision-makers
426
Sustainability 2015, 7, 16022–16038
when choices are also based on social and environmental principles and not merely on monetarycriteria, even if a multidimensional assessment is carried out. This consideration is confirmed by thestrictness imposed by the European Commission on the management of public funds, but also poseslimits that must be revised when funds are of a private nature, considering the levels of profitabilitythat can be shared with the community.
Another interesting development of this work could be a comparison of the outcomes of theassessment methods used with those coming from the use of specific aggregation procedures ableto include interaction effects among the criteria, such as the Choquet integral or the ELECTRE IIImethod with interactions between the criteria [69], in order to consider the different levels of strongand weak compensability.
Finally, it should be noted that the results of the implemented calculations seem to indicate thatcertain investment projects have performances on the criteria that make the rankings obtained robustthrough more or less compensatory aggregation procedures. This condition, where convenientlychecked on a larger sample of study, leads to repudiation of the necessity of the adoption of anon-compensatory aggregation procedure in order to obtain a decision of strong sustainability.The adoption could instead simply hide manipulative intentions in the choices on the allocationof public resources.
Acknowledgments: The authors are grateful to the anonymous reviewers for the valuable comments thatcontributed to the improvement of the manuscript.
Author Contributions: The authors contributed equally to this work.
Conflicts of Interest: The authors declare no conflict of interest.
References
1. Fusco Girard, L., Ed.; Le Valutazioni per lo Sviluppo Sostenibile Della Città e del Territorio; FrancoAngeli: Milano,Italy, 1997.
2. Nijkamp, P., (Ed.) Sustainability of Urban System; Aldershot: Avebury, UK, 1990.3. Rizzo, F. Il Capitale Sociale Della Città. Valutazione, Pianificazione e Gestione; Franco Angeli: Milano, Italy, 2003.4. De Mare, G.; Nesticò, A.; Tajani, F. Building Investments for the Revitalization of the Territory: A
Multisectoral Model of Economic Analysis. In Proceedings of the 3th International Conference, ICCSA 2013,Ho Chi Minh City, Vietnam, 24–27 June 2013; Murgante, B., Misra, S., Carlini, M., Torre, C., Nguyen, H.-Q.,Taniar, D., Apduhan, B.O., Gervasi, O., Eds.; Springer Verlag: Berlin, Germany; Heidelberg, Germany, 2013;Volume 7973, pp. 493–508.
5. European Ministers Responsible for Urban Development. Leipzig Charter on Sustainable European Cities.Final Draft; European Ministers Responsible for Urban Development: Leipzig, Germany, 2007.
6. Lahdelma, R.; Salminen, P.; Hokkanen, J. Using Multicriteria Methods in Environmental Planning andManagement. Environ. Manag. 2000, 26, 595–605. [CrossRef] [PubMed]
7. Daly, H.E.; Cobb, J.B., Jr. For the Common Good; Beacon Press: Boston, MA, USA, 1989.8. Munda, G. Multiple Criteria Decision analysis and Sustainable Development. In Multiple Criteria Decision
Analysis: State of the Art Surveys; Figueira, J., Greco, S., Ehrgott, M., Eds.; Springer: New York, NY, USA, 2005;pp. 953–986.
9. Munda, G. Social Multi-Criteria Evaluation; Springer-Verlag: Heidelberg, Germany; New York, NY, USA, 2007.10. Bob, C.; Dencsak, T.; Bob, L. A Sustainability Model for the Assessment of Civil Engineer Works. In
Recent Advances in Energy, Environment, Biology and Ecology, Proceedings of the 10th WSEAS InternationalConference on Energy, Environment, Ecosystems and Sustainable Development (EEESD 114), Tenerife, Spain,10–12 January 2014; WSEAS Press: Sofia, Bulgaria, 2014; pp. 161–168.
11. Lazar, C.; Lazar, M. Proposal of a sustainable development synthetic indicator at local level. In Proceedingsof the 9th WSEAS International Conference on Mathematics & Computers in Business and Economics(MCBE 108), Bucharest, Romania, 24–26 June 2008; WSEAS Press: Sofia, Bulgaria, 2008; pp. 74–78.
12. OECD. JRC European Commission, Handbook on Constructing Composite Indicators. Methodology and User Guide;OECD Publishing: Paris, France, 2008.
427
Sustainability 2015, 7, 16022–16038
13. Munda, G. Choosing aggregation rules for composite indicators. Soc. Indic. Res. 2012, 109, 337–354.[CrossRef]
14. Granata, M.F. The city management: Methodological Considerations on the Multiple Criteria Techniques. InThe Right to the City. Human Rights and the City Crisis; Beguinot, C., Ed.; Giannini Editore: Naples, Italy, 2012;pp. 295–319.
15. Sustainable Cities International—Canadian International Development Agency. Indicators for Sustainability.How Cities Are Monitoring and Evaluating Their Success; Sustainable Cities International—CanadianInternational Development Agency: Vancouver, BC, Canada, 2012.
16. Olson, D.L. Comparison of three multicriteria methods to predict known outcomes. Eur. J. Oper. Res. 2001,130, 576–587. [CrossRef]
17. Von Neumann, J.; Morgenstern, O. Theory of Games and Economic Behaviour, 2nd ed.; Princeton UniversityPress: Princeton, NJ, USA, 1947.
18. Keeney, R.L.; Raiffa, H. Decisions with Multiple Objectives Preferences and Value Tradeoffs; John Wiley&Sons:New York, NY, USA, 1976.
19. Roy, B. Classement et choix en presence de points de vue multiples (la méthode ELECTRE). RAIRO 1968, 8,57–75.
20. Figueira, J.; Greco, S.; Ehrgott, M. Introduction. In Multiple Criteria Decision Analysis: State of the Art Surveys;Figueira, J., Greco, S., Ehrgott, M., Eds.; Springer: New York, NY, USA, 2005; pp. xxi–xxxvi.
21. Vincke, P.; Brans, J.P. A preference ranking organization method. The PROMETHEE method for MCDM.Manag. Sci. 1985, 31, 641–656.
22. Vincke, P. Multicriteria Decision-Aid; John Wiley & Sons: Chichester, UK, 1992.23. De Montis, A.; de Toro, P.; Droste-Franke, B.; Omann, I.; Stagl, S. Assessing the quality of different MCDA
methods. In Alternatives for Environmental Valuation; Getzner, M., Spash, C., Stagl, S., Eds.; Routledge:London, UK, 2005; pp. 99–133.
24. Yager, R.R. On ordered weighted averaging aggregation operators in multi-criteria decision making.IEEE Trans. Syst. Man Cybernet. Part B 1988, 18, 183–190. [CrossRef]
25. Choquet, G. Theory of capacities. Ann. de l’Inst. Fourier 1953, 5, 131–295. [CrossRef]26. Sugeno, M. Theory of Fuzzy Integrals and Its Applications. Ph.D. Thesis, Tokyo Institute of Technology,
Tokyo, Japan, 1974.27. Grabisch, M. The application of fuzzy integrals in multicriteria decision making. Eur. J. Oper. Res. 1996, 89,
445–456. [CrossRef]28. Munda, G. The issue of consistency: Basic discrete multi-criteria “Methods”. In Social Multi-Criteria Evaluation
for a Sustainable Economy; Munda, G., Ed.; Springer-Verlag: Berlin, Germany; Heidelberg, Germany, 2008;pp. 85–109.
29. De Mare, G.; Granata, M.F.; Nesticò, A. Complex efficiency of sports facilities. Multicriteria and financialanalysis for swimming pools. In Advances in Environmental and Geological Science and Engineering, Proceedingsof the 8th International Conference on Environmental and Geological Science and Engineering (EG 115),Salerno, Italy, 27–29 June 2015; WSEAS Press: Sofia, Bulgaria, 2015; pp. 96–103.
30. Behzadian, M.; Kazemzadeh, R.B.; Albadvi, A.; Aghdasi, M. PROMETHEE: A comprehensive literaturereview on methodologies and applications. Eur. J. Oper. Res. 2010, 200, 198–215. [CrossRef]
31. Polatidis, H.; Haralambopoulos, D.A.; Munda, G.; Vreeker, R. Selecting an appropriate multi-criteria decisionanalysis technique for renewable energy planning. Energy Sources Part B 2006, 1, 181–193. [CrossRef]
32. Cilona, T.; Granata, M.F. Multicriteria Prioritization for Multistage Implementation of Complex UrbanRenewal Projects. In Proceedings of the 15th International Conference Computational Science and ItsApplications—ICCSA 2015, Banff, BC, Canada, 22–25 June 2015; Gervasi, O., Murgante, B., Misra, S.,Gavrilova, M.L., Rocha, A.M.A.C., Torre, C., Taniar, D., Apduhan, B.O., Eds.; Part III, LNCS 9157. SpringerVerlag: Berlin, Germany; Heidelberg, Germany, 2015; pp. 3–19.
33. Cinelli, M.; Coles, S.R.; Kirwan, K. Analysis of the potentials of multi criteria decision analysis methods toconduct sustainability assessment. Ecol. Indic. 2014, 46, 138–148. [CrossRef]
34. Guitouni, A.; Martel, J.M. Tentative guidelines to help choosing an appropriate MCDA Method. Eur. J.Oper. Res. 1998, 109, 501–521. [CrossRef]
35. Von Winterfeldt, D.; Edwards, W. Decision Analysis and Behavioral Research; Cambridge University Press:Cambridge, UK, 1986.
428
Sustainability 2015, 7, 16022–16038
36. Kuang, H.; Kilgour, D.M.; Hipel, K.W. Grey-based PROMETHEE II with application to evaluation of sourcewater protection strategies. Inf. Sci. 2015, 294, 376–389. [CrossRef]
37. Le Téno, J.F.; Mareschal, B. An interval version of PROMETHEE for the comparison of building products’design with ill-defined data on environmental quality. Eur. J. Oper. Res. 1998, 109, 522–529. [CrossRef]
38. Juan, Y.-K.; Roper, K.O.; Castro-Lacouture, D.; Kim, J.H. Optimal decision making on urban renewal projects.Manag. Decis. 2010, 48, 207–224. [CrossRef]
39. Kourtit, K.; Macharis, C.; Nijkamp, P. A multi-actor multi-criteria analysis of the performance of global cities.Appl. Geogr. 2014, 49, 24–36. [CrossRef]
40. Ulvila, J.W.; Snider, W.D. Negotiation of international oil tanker standards: An application of multiattributevalue theory. Oper. Res. 1980, 28, 81–96. [CrossRef]
41. Comer, J.L.; Kirkwood, C.W. Decision analysis applications in the operations research literature 1970–1989.Oper. Res. 1991, 39, 206–219.
42. Taylor, J.M., Jr.; Love, B.N. Simple multi-attribute rating technique for renewable energy deploymentdecisions (SMART REDD). J. Def. Model. Simulat. Appl. Methodol. Technol. 2014, 11, 227–232. [CrossRef]
43. Papadopoulos, A.M., Konidari, P., Eds.; Overview and Selection of Multi-Criteria Evaluation Methods forMitigation/Adaptation Policy Instruments; PROMITHEAS—4: Athens, Greece, 2011.
44. Barfod, M.B., Leleur, M., Eds.; Multi-Criteria Decision Analysis for Use in Transport Decision Making, 2nd ed.;Technical University of Denmark: Copenhagen, Denmark, 2014.
45. Dutta, M.; Husain, Z. An application of Multicriteria Decision Making to Built Heritage. The case of Calcutta.J. Cult. Herit. 2009, 10, 237–243. [CrossRef]
46. Kılkıs, S. Composite index for benchmarking local energy systems of Mediterranean port cities. Energy 2015.[CrossRef]
47. Kılkıs, S. Sustainable development of energy, water and environment systems index for Southeast Europeancities. J. Clean. Product. 2015. [CrossRef]
48. Dizdaroglu, D.; Yigitcanlar, T. A parcel-scale assessment tool to measure sustainability through urbanecosystem components: The MUSIX model. Ecol. Indic. 2014, 41, 115–130. [CrossRef]
49. Dizdaroglu, D.; Yigitcanlar, T.; Dawes, L. A micro-level indexing model for assessing urban ecosystemsustainability. Smart Sustain. Built Environ. 2012, 1, 291–315. [CrossRef]
50. Yigitcanlar, T.; Dur, F.; Dizdaroglu, D. Towards prosperous sustainable cities: A multiscalar urbansustainability assessment approach. Habitat Int. 2015, 45, 36–46. [CrossRef]
51. Salminen, P.; Hokkanen, J.; Lahdelma, R. Comparing multicriteria methods in the context of environmentalproblems. Eur. J. Oper. Res. 1998, 104, 485–496. [CrossRef]
52. Hajkowicz, S. A comparison of multiple criteria analysis and unaided approaches to environmental decisionmaking. Environ. Sci. Policy 2007, 10, 177–184. [CrossRef]
53. Kostevšek, A.; Klemeš, J.J.; Varbanov, P.S.; Cucek, L.; Petek, J. Sustainability assessment of the locallyintegrated energy sectors for a Slovenian municipality. J. Clean. Product. 2015, 88, 83–89. [CrossRef]
54. Roy, B. Decision aid and decision making. In Readings in Multiple Criteria Decision Aid; Bana e Costa, C.A., Ed.;Springer-Verlag: Berlin, Germany; Heidelberg, Germany, 1990; pp. 17–35.
55. Munda, G. Intensity of preference and related uncertainty in non-compensatory aggregation rules.Theory Decis. 2012, 73, 649–669. [CrossRef]
56. Pollesch, N.; Dale, V.H. Applications of aggregation theory to sustainability assessment. Ecol. Econ. 2015,114, 117–127. [CrossRef]
57. Floridi, M.; Pagni, S.; Falorni, S.; Luzzati, T. An exercise in composite indicators construction: Assessing thesustainability of Italian regions. Ecol. Econ. 2011, 70, 1440–1447. [CrossRef]
58. Ostasiewicz, K. Ordering EU countries according to indicators of sustainable development. Statistika 2012,49, 30–51.
59. Dietz, S.; Neumayer, E. Weak and strong sustainability in the SEEA: Concepts and measurement. Ecol. Econ.2007, 61, 617–626. [CrossRef]
60. Garmendia, E.; Prellezo, R.; Murillas, A.; Escapa, M.; Gallastegui, M. Weak and strong sustainabilityassessment in fisheries. Ecol. Econ. 2010, 70, 96–106. [CrossRef]
61. Dalmas, L.; Geronimi, V.; Noël, J.-F.; Sang, J.T.K. Economic evaluation of urban heritage: An inclusiveapproach under a sustainability perspective. J. Cult. Herit. 2015, 16, 681–687. [CrossRef]
429
Sustainability 2015, 7, 16022–16038
62. Janeiro, L.; Patel, M.K. Choosing sustainable technologies. Implications of the underlying sustainabilityparadigm in the decision-making process. J. Clean. Product. 2015, 105, 438–446. [CrossRef]
63. Edwards, W. How to use multiattribute utility measurement for social decision making. IEEE Trans. Syst.Man Cybernet. 1977, 7, 326–340. [CrossRef]
64. Edwards, W.; Barron, F.H. Smarts and Smarter: Improved Simple Methods for Multi Attribute UtilityMeasurement. Organ. Behav. Hum. Decis. Process. 1994, 60, 306–325. [CrossRef]
65. Brans, J.P.; Mareschal, B. Promethee methods. In Multiple Criteria Decision Analysis: State of the Art Surveys;Figueira, J., Greco, S., Ehrgott, M., Eds.; Springer: New York, NY, USA, 2005; pp. 163–195.
66. Roy, B. Méthodologie Multicritère d’Aide à la Décison; Economica: Paris, France, 1985.67. Bouyssou, D. Building criteria: A prerequisite for MCDA. In Readings in Multiple Criteria Decision Aid;
Bana e Costa, C.A., Ed.; Springer-Verlag: Berlin, Germany; Heidelberg, Germany, 1990; pp. 58–80.68. Relazione Previsionale e Programmatica 2012–2014. Available online: http://googo.pw/url?sa=t&rct=
j&q=&esrc=s&source=web&cd=1&ved=0ahUKEwiFwNDpxa3JAhXBF5QKHedtB08QFggcMAA&url=http%3A%2F%2Fwww.comune.rozzano.mi.it%2Findex.php%2Fmodulistica%2Fdoc_download%2F697-relazione-previsionale-e-programmatica-2012-2014.html&usg=AFQjCNHewDYQAw5x7gsCoUT-9znqiRisOQ&cad=rja(accessed on 18 November 2015).
69. Figueira, J.R.; Greco, S.; Roy, B. ELECTRE methods with interaction between criteria: An extension of theconcordance index. Eur. J. Oper. Res. 2009, 199, 478–495. [CrossRef]
© 2015 by the authors. Licensee MDPI, Basel, Switzerland. This article is an open accessarticle distributed under the terms and conditions of the Creative Commons Attribution(CC BY) license (http://creativecommons.org/licenses/by/4.0/).
430
Article
The Concept of Sustainable Strategy Implementation
Joanna Radomska
Strategic Management Department, Wrocław University of Economics, ul. Komandorska 118/120,53-345 Wrocław, Poland; [email protected]; Tel.: +48-71-36-80-195
Academic Editor: Adam JabłonskiReceived: 21 October 2015; Accepted: 19 November 2015; Published: 27 November 2015
Abstract: The idea of sustainable development has been present in the field of management formany years, yet the challenges and rules of contemporary business mean that it remains topical.At the same time, the results of much research indicates an unsatisfactory level of execution ofdevelopment concepts. Due to this, the subject of the study encompasses the implementation ofthe idea of sustainability in the strategy execution process, lending it a holistic and balanced nature.The purpose of the paper is an examination of the relationship between strategy implementation andthe effectiveness of the strategy execution process. The relationships between the perspectives definedand results obtained by organizations were investigated. The research demonstrated the existenceof a positive correlation of varied intensity. It is thus possible to identify a positive influence of theintegration of the idea of sustainability with strategy execution, which is reflected in the effectivenessof activities undertaken.
Keywords: strategy execution; sustainability; strategic management process
1. Introduction
An increasing pressure to ensure productivity and effectiveness forces companies to improve theirmanagement systems, making them ever more complex. Confirmation of this trend is visible in theimplementation of holistic management models which emphasize the need to concentrate on the highquality of the functionality of their components [1]. It is thus possible to find recommendations referringto the sustainable design of the strategic management process in the literature. Sustainability is definedas a concept of the holistic perspective of development integrated with organizational goals, internalincentives and evaluation systems, and organizational decision support systems [2]. Sustainablestrategic management is an effect of the natural evolution of strategic thinking towards meetingexpectations placed by the environment [3]. An ever greater number of organizations have thereforebegun to notice that the idea of sustainability is becoming a natural element of their actions and not anissue separated from a strategy being executed [4]. Additionally, as some of the research results prove,it is a factor leading to a reduction in risk accompanying the strategy realization [5]. It results not onlyin a change in perspective and perception of organizing the strategy implementation process, but alsoindicates the need for an integration of its aspect [6]. It is described in Figure 1.
Sustainability 2015, 7, 15847–15856; doi:10.3390/su71215790 www.mdpi.com/journal/sustainability431
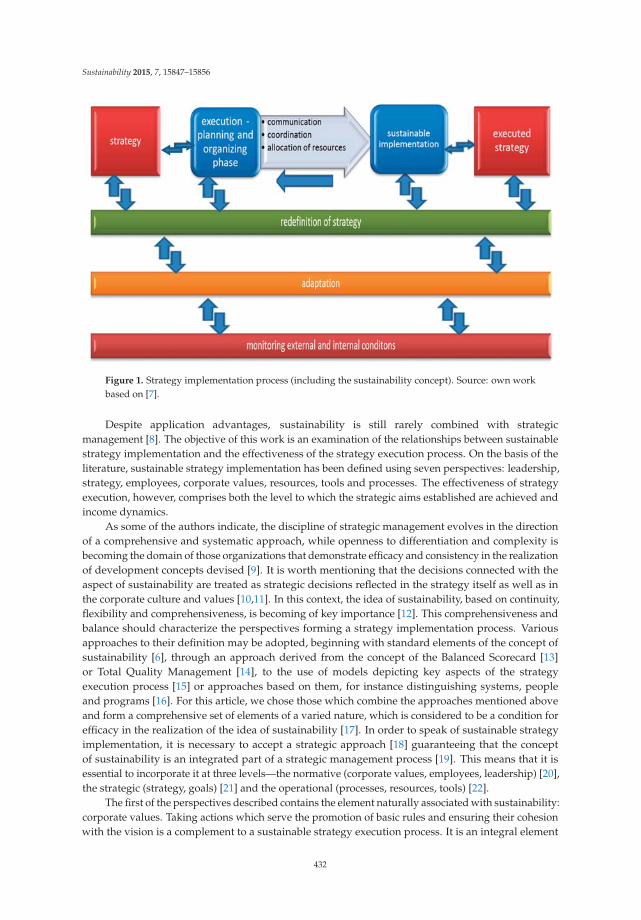
Sustainability 2015, 7, 15847–15856
Figure 1. Strategy implementation process (including the sustainability concept). Source: own workbased on [7].
Despite application advantages, sustainability is still rarely combined with strategicmanagement [8]. The objective of this work is an examination of the relationships between sustainablestrategy implementation and the effectiveness of the strategy execution process. On the basis of theliterature, sustainable strategy implementation has been defined using seven perspectives: leadership,strategy, employees, corporate values, resources, tools and processes. The effectiveness of strategyexecution, however, comprises both the level to which the strategic aims established are achieved andincome dynamics.
As some of the authors indicate, the discipline of strategic management evolves in the directionof a comprehensive and systematic approach, while openness to differentiation and complexity isbecoming the domain of those organizations that demonstrate efficacy and consistency in the realizationof development concepts devised [9]. It is worth mentioning that the decisions connected with theaspect of sustainability are treated as strategic decisions reflected in the strategy itself as well as inthe corporate culture and values [10,11]. In this context, the idea of sustainability, based on continuity,flexibility and comprehensiveness, is becoming of key importance [12]. This comprehensiveness andbalance should characterize the perspectives forming a strategy implementation process. Variousapproaches to their definition may be adopted, beginning with standard elements of the concept ofsustainability [6], through an approach derived from the concept of the Balanced Scorecard [13]or Total Quality Management [14], to the use of models depicting key aspects of the strategyexecution process [15] or approaches based on them, for instance distinguishing systems, peopleand programs [16]. For this article, we chose those which combine the approaches mentioned aboveand form a comprehensive set of elements of a varied nature, which is considered to be a condition forefficacy in the realization of the idea of sustainability [17]. In order to speak of sustainable strategyimplementation, it is necessary to accept a strategic approach [18] guaranteeing that the conceptof sustainability is an integrated part of a strategic management process [19]. This means that it isessential to incorporate it at three levels—the normative (corporate values, employees, leadership) [20],the strategic (strategy, goals) [21] and the operational (processes, resources, tools) [22].
The first of the perspectives described contains the element naturally associated with sustainability:corporate values. Taking actions which serve the promotion of basic rules and ensuring their cohesionwith the vision is a complement to a sustainable strategy execution process. It is an integral element
432
Sustainability 2015, 7, 15847–15856
combining operational activities with expected results [23]. The literature indicates the existence of aphenomenon described as a “value gap” based on the maladjustment of strategy and the process of itsexecution to higher values. It becomes crucial then to introduce changes to the process necessary toensure that activities and expected results remain cohesive [24]. One of the tools assisting with this,and included in this area, is the system of informal communication supporting the comprehension ofthe vision and strategic goals [25], and at the same time, the integration of the entire strategy executionprocess [26].
The second perspective is the area of employees, significant because of the necessity, emphasisedby many researchers, of paying attention to the nature of the objectives being accomplished by acompany and the way in which the results achieved are measured. Aside from financial outcomes,organizational outcomes are mentioned ever more often [27]. These are inseparably linked with theissue of employee engagement in strategies being executed and competitive advantage achieved asa result [28]. Some research indicates that this perspective should be treated as a leading element instrategy implementation as it has a substantial influence on the improvement of company results [29].It is linked not only with involving employees in work on strategy formulation, but also with thesupporting role which they play in achieving long-term goals [30]. Those organizations which obtaingood implementation results are able to focus employee attention effectively on tasks connected withstrategic goal achievement, which involves assigning decision-making powers as well as establishingclear measures for the appraisal of their effects [31].
The third of the perspectives described is emphasized by a great many authors: leadership asan element linking a strategy, on the one hand, with resources and employees, on the other [32].The attitudes of managers toward sustainable strategy execution and the perception of particularperspectives of this process directly affect not only its course [33], but also the attitudes of otheremployees (especially mid-level management) [34]. In order to implement the concept successfully, achange in thinking and attitude is crucial, as these are inseparably linked with leadership [35]. This isalso pointed out by [36], who emphasises that the duties of leaders should encompass such tasks asthe creation of an aligned mental model, the promotion of individual ownership of the whole, and thecultivation of aligned behaviors.
The fourth perspective, associated with the strategic level, encompasses both strategy and strategicgoals. Results of some research indicate that, in many cases, it is not poor execution, but the strategyitself which results in unsatisfactory outcomes [37]. This relates especially to ambiguous definition,a lack of priorities indicated, or a concept of development not adjusted to internal and externaldeterminers [38]. Cocks [39] mentions a vague and blurred strategy among the reasons for failures inimplementation, with this often directly linked to a lack of clarity in basic development rules and theircoherence with the set of objectives specified [40]. It is indicated in the literature on the subject that theperspective of strategy is closely associated with resources and people and should not be separatedfrom them, but treated holistically as an integral part of a larger whole [41].
Moving on to the operational level, it is worth beginning with the perspective of resources, mainlydue to the fact that ensuring sustainability means efficient as well as effective use of available resourceswith a simultaneous orientation toward strategic objective accomplishment [42]. Moreover, the resultsof research conducted indicate that resource constraints are a significant and frequently occurringobstacle to strategy execution [43]. Additionally, the question of problems relating to allocation andeffective use must be considered [44]. Effectiveness, in this case, does not refer only to an economicaspect, but should also encompass the idea of sustainability, and therefore an allocation of resourceswhich ensures the coherence and integrity of all processes, including the process of strategy realization.
In considering the perspective of strategy execution, it is worth mentioning that the mostimportant role is played by the controlling and implementation of progress measurement systems,which are, at the same time, an element supporting the integration process for all of the perspectivesdescribed [45]. It is related to the greatest extent to resources and especially to the issue of changes inorganizational structure allowing the efficient use of resources possessed [46]. On the other hand, it is
433
Sustainability 2015, 7, 15847–15856
necessary to analyze not only the process by which the results of a strategy are measured, since aligningprocesses and systems to reinforce the desired behaviors and outcomes of equal importance [47]. Thistherefore relates also to the motivation system, which should be associated with the strategy executionstage [48]. This makes necessary actions aimed at indicating connections between a strategy introducedand other processes within the organization and their design such that they comply with the ideaof sustainability.
The last of the perspectives described covers implementation tools. Within the set utilized in theprocess of strategy execution, Balanced Scorecard displays the greatest integration with the concept ofsustainability [49], particularly the non-financial measures [50]. The authors also indicate the use ofscheduling and budgeting as well as formal implementation programs, this serving the appropriateallocation of resources and identification of key performance indicators [51]. Measurement may, on theother hand, be supported by strategic controlling [52]. The catalogue of tools is complemented by thestrategy map, which may also be considered an element of sustainability due to the fact that it servesthe presentation of the manner in which the organization creates value [53] and is able to support otherperspectives thanks to its flexibility, operating character, and indication of certain decision-makingpowers [54].
2. Experimental Section
2.1. Sample and Data Collection, Research Tools
The group of respondents included managers of 200 corporate headquarters that have beenoperating for at least five years and are listed among the 500 largest Polish companies in the ranking ofPolityka magazine (101 entities) and in the “Forbes Diamonds 2013” ranking (99 companies). The firstranking takes account of sales revenues, the total revenues of the companies, the gross and net profits,as well as the number of employees. The “Diamonds” list included the companies showing thefastest increase in value. The research sample was selected based on the participation in the rankingsand thereby achieving market success in the implementation of developed strategies. The obtainedresults thus could be perceived as an example of good practices, and proposals formulated on thisbasis could have a universal character. The grounds for undertaking research in the field of strategyimplementation were based on the importance of implementation actions and the necessity to ensureconsistency between the effects of implementation projects or programs and their operating results. Itwas especially crucial to identify barriers that hinder the combination of ongoing actions with theirstrategic implications. The results of the conducted research could be applied, in practice, as a base ofknowledge used by the management staff to increase the flexibility and effectiveness of the strategicmanagement process.
The study was conducted using the PAPI (Paper and Pencil Interview) technique; the quantitativesurvey was carried out with the use of a method based on collecting the data the standardized way. Inorder to ensure the highest possible representativeness, the sample was selected using the stratifiedrandom sampling method. The primary goal of the research was to diagnose the factors that supportand hinder the implementation of the strategy. The research tool focused on:
(1) identification of instruments and tools used during the strategy implementation process(2) defining the procedures and systems supporting strategy execution(3) analyzing the system for monitoring the effects of strategy implementation
The questions in the questionnaire were of nominal value (the respondents declared the existenceof specific issues) and ordinal variable nature (the respondents indicated the strength of their impacton a five-point scale). In order to test the hypotheses, Pearson's correlation coefficient was calculated.
434
Sustainability 2015, 7, 15847–15856
2.2. Hypotheses
As described above, it was assumed that sustainable strategy implementation consists ofseven perspectives:
‚ Leadership (1): the activities of leaders motivating employees effectively; their possessionof sufficient knowledge and skills; a clear division of competences, decision-making powers,and responsibility
‚ Strategy (2): clearly formulated assumptions, internal coherence in development concept (cohesionof vision, objectives, schedule, and budget) and its flexibility (a lack of single-variant solutionsadopted in the strategy)
‚ Employees (3): employee identification with the strategy being executed and acceptance,elimination of internal interest groups hindering strategy execution, employee participationat the strategy formulation phase
‚ Corporate Values (4): organization of the work of multi-tasking teams, establishment of an efficientinformal communication process, provision of coherence between the vision and corporate values
‚ Resources (5): possession of appropriate financial resources, deployment of the knowledgeof employees at various levels, changes in organizational structure allowing effective use ofresources possessed
‚ Tools (6): the use of Balanced Scorecard, strategy maps, strategic controlling and implementationprograms as well as budgeting and task scheduling
‚ Processes (7): a regular measurement of progress in implementation, an incentive system relatingemployee salary level to the degree to which strategic goals are achieved, a system monitoring thecompany environment
Effectiveness of strategy execution has been defined by:
‚ the level of achievement of strategic goals assumed (A): as an indicator of the efficacy ofactivities performed
‚ income dynamics (B): as an indicator of the effects of activities performed
In order to accomplish the research objectives assumed, the following hypothesis was formulated:H: There is a positive interdependency between a sustainable strategy implementation and the effectiveness
of its execution.Auxiliary hypotheses were formulated to verify which of the sustainable strategy implementation
areas has the greatest influence on the effectiveness of strategy execution.H1: Competent leadership affects growth in effectiveness of strategy execution.H2: Smooth functioning of processes affects growth in effectiveness of strategy execution.H3: Proper formulation of a strategy affects growth in effectiveness of its execution.
3. Results and Discussion
The first stage of the research was the calculation of the average responses to the perspectivesof sustainable strategy implementation described above and the degree of effectiveness of strategyexecution for each entity surveyed. Table 1 presents the results of the research.
435
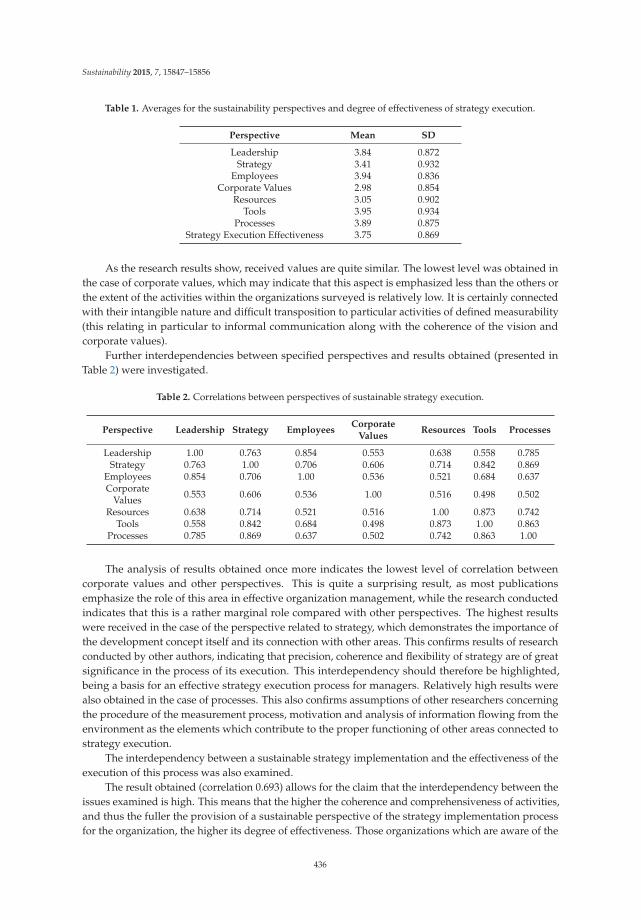
Sustainability 2015, 7, 15847–15856
Table 1. Averages for the sustainability perspectives and degree of effectiveness of strategy execution.
Perspective Mean SD
Leadership 3.84 0.872Strategy 3.41 0.932
Employees 3.94 0.836Corporate Values 2.98 0.854
Resources 3.05 0.902Tools 3.95 0.934
Processes 3.89 0.875Strategy Execution Effectiveness 3.75 0.869
As the research results show, received values are quite similar. The lowest level was obtained inthe case of corporate values, which may indicate that this aspect is emphasized less than the others orthe extent of the activities within the organizations surveyed is relatively low. It is certainly connectedwith their intangible nature and difficult transposition to particular activities of defined measurability(this relating in particular to informal communication along with the coherence of the vision andcorporate values).
Further interdependencies between specified perspectives and results obtained (presented inTable 2) were investigated.
Table 2. Correlations between perspectives of sustainable strategy execution.
Perspective Leadership Strategy EmployeesCorporate
ValuesResources Tools Processes
Leadership 1.00 0.763 0.854 0.553 0.638 0.558 0.785Strategy 0.763 1.00 0.706 0.606 0.714 0.842 0.869
Employees 0.854 0.706 1.00 0.536 0.521 0.684 0.637Corporate
Values 0.553 0.606 0.536 1.00 0.516 0.498 0.502
Resources 0.638 0.714 0.521 0.516 1.00 0.873 0.742Tools 0.558 0.842 0.684 0.498 0.873 1.00 0.863
Processes 0.785 0.869 0.637 0.502 0.742 0.863 1.00
The analysis of results obtained once more indicates the lowest level of correlation betweencorporate values and other perspectives. This is quite a surprising result, as most publicationsemphasize the role of this area in effective organization management, while the research conductedindicates that this is a rather marginal role compared with other perspectives. The highest resultswere received in the case of the perspective related to strategy, which demonstrates the importance ofthe development concept itself and its connection with other areas. This confirms results of researchconducted by other authors, indicating that precision, coherence and flexibility of strategy are of greatsignificance in the process of its execution. This interdependency should therefore be highlighted,being a basis for an effective strategy execution process for managers. Relatively high results werealso obtained in the case of processes. This also confirms assumptions of other researchers concerningthe procedure of the measurement process, motivation and analysis of information flowing from theenvironment as the elements which contribute to the proper functioning of other areas connected tostrategy execution.
The interdependency between a sustainable strategy implementation and the effectiveness of theexecution of this process was also examined.
The result obtained (correlation 0.693) allows for the claim that the interdependency between theissues examined is high. This means that the higher the coherence and comprehensiveness of activities,and thus the fuller the provision of a sustainable perspective of the strategy implementation processfor the organization, the higher its degree of effectiveness. Those organizations which are aware of the
436
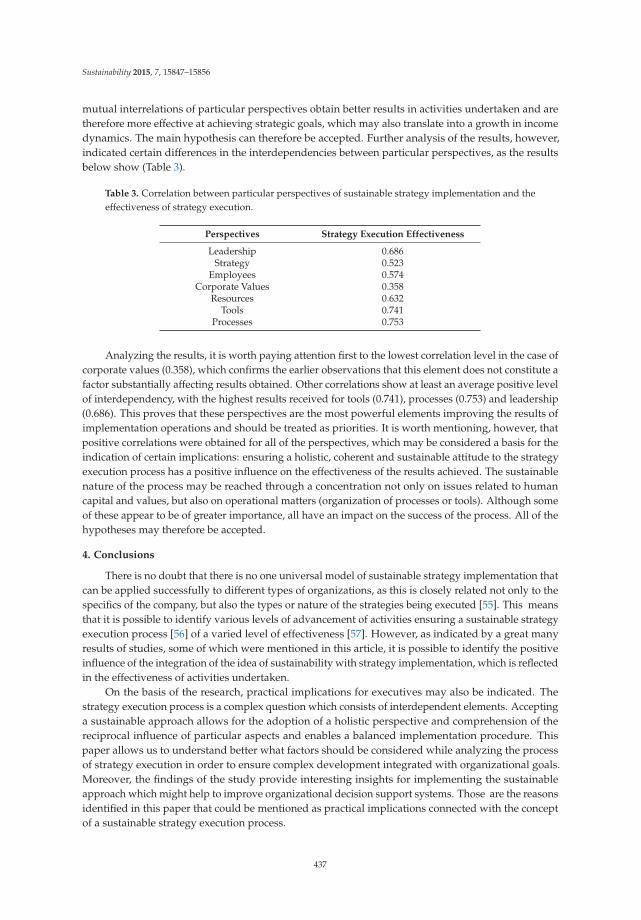
Sustainability 2015, 7, 15847–15856
mutual interrelations of particular perspectives obtain better results in activities undertaken and aretherefore more effective at achieving strategic goals, which may also translate into a growth in incomedynamics. The main hypothesis can therefore be accepted. Further analysis of the results, however,indicated certain differences in the interdependencies between particular perspectives, as the resultsbelow show (Table 3).
Table 3. Correlation between particular perspectives of sustainable strategy implementation and theeffectiveness of strategy execution.
Perspectives Strategy Execution Effectiveness
Leadership 0.686Strategy 0.523
Employees 0.574Corporate Values 0.358
Resources 0.632Tools 0.741
Processes 0.753
Analyzing the results, it is worth paying attention first to the lowest correlation level in the case ofcorporate values (0.358), which confirms the earlier observations that this element does not constitute afactor substantially affecting results obtained. Other correlations show at least an average positive levelof interdependency, with the highest results received for tools (0.741), processes (0.753) and leadership(0.686). This proves that these perspectives are the most powerful elements improving the results ofimplementation operations and should be treated as priorities. It is worth mentioning, however, thatpositive correlations were obtained for all of the perspectives, which may be considered a basis for theindication of certain implications: ensuring a holistic, coherent and sustainable attitude to the strategyexecution process has a positive influence on the effectiveness of the results achieved. The sustainablenature of the process may be reached through a concentration not only on issues related to humancapital and values, but also on operational matters (organization of processes or tools). Although someof these appear to be of greater importance, all have an impact on the success of the process. All of thehypotheses may therefore be accepted.
4. Conclusions
There is no doubt that there is no one universal model of sustainable strategy implementation thatcan be applied successfully to different types of organizations, as this is closely related not only to thespecifics of the company, but also the types or nature of the strategies being executed [55]. This meansthat it is possible to identify various levels of advancement of activities ensuring a sustainable strategyexecution process [56] of a varied level of effectiveness [57]. However, as indicated by a great manyresults of studies, some of which were mentioned in this article, it is possible to identify the positiveinfluence of the integration of the idea of sustainability with strategy implementation, which is reflectedin the effectiveness of activities undertaken.
On the basis of the research, practical implications for executives may also be indicated. Thestrategy execution process is a complex question which consists of interdependent elements. Acceptinga sustainable approach allows for the adoption of a holistic perspective and comprehension of thereciprocal influence of particular aspects and enables a balanced implementation procedure. Thispaper allows us to understand better what factors should be considered while analyzing the processof strategy execution in order to ensure complex development integrated with organizational goals.Moreover, the findings of the study provide interesting insights for implementing the sustainableapproach which might help to improve organizational decision support systems. Those are the reasonsidentified in this paper that could be mentioned as practical implications connected with the conceptof a sustainable strategy execution process.
437
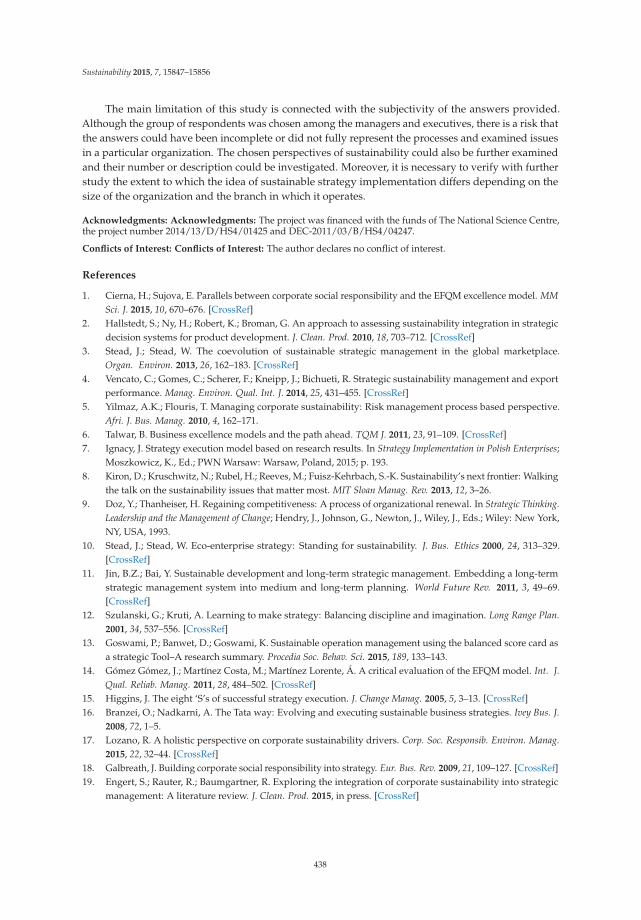
Sustainability 2015, 7, 15847–15856
The main limitation of this study is connected with the subjectivity of the answers provided.Although the group of respondents was chosen among the managers and executives, there is a risk thatthe answers could have been incomplete or did not fully represent the processes and examined issuesin a particular organization. The chosen perspectives of sustainability could also be further examinedand their number or description could be investigated. Moreover, it is necessary to verify with furtherstudy the extent to which the idea of sustainable strategy implementation differs depending on thesize of the organization and the branch in which it operates.
Acknowledgments: Acknowledgments: The project was financed with the funds of The National Science Centre,the project number 2014/13/D/HS4/01425 and DEC-2011/03/B/HS4/04247.
Conflicts of Interest: Conflicts of Interest: The author declares no conflict of interest.
References
1. Cierna, H.; Sujova, E. Parallels between corporate social responsibility and the EFQM excellence model. MMSci. J. 2015, 10, 670–676. [CrossRef]
2. Hallstedt, S.; Ny, H.; Robert, K.; Broman, G. An approach to assessing sustainability integration in strategicdecision systems for product development. J. Clean. Prod. 2010, 18, 703–712. [CrossRef]
3. Stead, J.; Stead, W. The coevolution of sustainable strategic management in the global marketplace.Organ. Environ. 2013, 26, 162–183. [CrossRef]
4. Vencato, C.; Gomes, C.; Scherer, F.; Kneipp, J.; Bichueti, R. Strategic sustainability management and exportperformance. Manag. Environ. Qual. Int. J. 2014, 25, 431–455. [CrossRef]
5. Yilmaz, A.K.; Flouris, T. Managing corporate sustainability: Risk management process based perspective.Afri. J. Bus. Manag. 2010, 4, 162–171.
6. Talwar, B. Business excellence models and the path ahead. TQM J. 2011, 23, 91–109. [CrossRef]7. Ignacy, J. Strategy execution model based on research results. In Strategy Implementation in Polish Enterprises;
Moszkowicz, K., Ed.; PWN Warsaw: Warsaw, Poland, 2015; p. 193.8. Kiron, D.; Kruschwitz, N.; Rubel, H.; Reeves, M.; Fuisz-Kehrbach, S.-K. Sustainability’s next frontier: Walking
the talk on the sustainability issues that matter most. MIT Sloan Manag. Rev. 2013, 12, 3–26.9. Doz, Y.; Thanheiser, H. Regaining competitiveness: A process of organizational renewal. In Strategic Thinking.
Leadership and the Management of Change; Hendry, J., Johnson, G., Newton, J., Wiley, J., Eds.; Wiley: New York,NY, USA, 1993.
10. Stead, J.; Stead, W. Eco-enterprise strategy: Standing for sustainability. J. Bus. Ethics 2000, 24, 313–329.[CrossRef]
11. Jin, B.Z.; Bai, Y. Sustainable development and long-term strategic management. Embedding a long-termstrategic management system into medium and long-term planning. World Future Rev. 2011, 3, 49–69.[CrossRef]
12. Szulanski, G.; Kruti, A. Learning to make strategy: Balancing discipline and imagination. Long Range Plan.2001, 34, 537–556. [CrossRef]
13. Goswami, P.; Banwet, D.; Goswami, K. Sustainable operation management using the balanced score card asa strategic Tool–A research summary. Procedia Soc. Behav. Sci. 2015, 189, 133–143.
14. Gómez Gómez, J.; Martínez Costa, M.; Martínez Lorente, Á. A critical evaluation of the EFQM model. Int. J.Qual. Reliab. Manag. 2011, 28, 484–502. [CrossRef]
15. Higgins, J. The eight ‘S’s of successful strategy execution. J. Change Manag. 2005, 5, 3–13. [CrossRef]16. Branzei, O.; Nadkarni, A. The Tata way: Evolving and executing sustainable business strategies. Ivey Bus. J.
2008, 72, 1–5.17. Lozano, R. A holistic perspective on corporate sustainability drivers. Corp. Soc. Responsib. Environ. Manag.
2015, 22, 32–44. [CrossRef]18. Galbreath, J. Building corporate social responsibility into strategy. Eur. Bus. Rev. 2009, 21, 109–127. [CrossRef]19. Engert, S.; Rauter, R.; Baumgartner, R. Exploring the integration of corporate sustainability into strategic
management: A literature review. J. Clean. Prod. 2015, in press. [CrossRef]
438
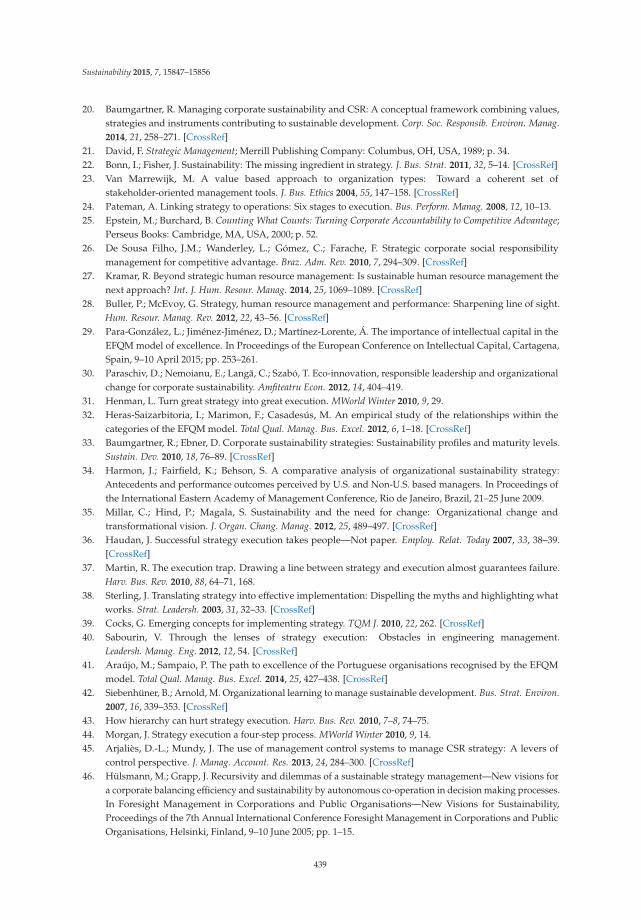
Sustainability 2015, 7, 15847–15856
20. Baumgartner, R. Managing corporate sustainability and CSR: A conceptual framework combining values,strategies and instruments contributing to sustainable development. Corp. Soc. Responsib. Environ. Manag.2014, 21, 258–271. [CrossRef]
21. David, F. Strategic Management; Merrill Publishing Company: Columbus, OH, USA, 1989; p. 34.22. Bonn, I.; Fisher, J. Sustainability: The missing ingredient in strategy. J. Bus. Strat. 2011, 32, 5–14. [CrossRef]23. Van Marrewijk, M. A value based approach to organization types: Toward a coherent set of
stakeholder-oriented management tools. J. Bus. Ethics 2004, 55, 147–158. [CrossRef]24. Pateman, A. Linking strategy to operations: Six stages to execution. Bus. Perform. Manag. 2008, 12, 10–13.25. Epstein, M.; Burchard, B. Counting What Counts: Turning Corporate Accountability to Competitive Advantage;
Perseus Books: Cambridge, MA, USA, 2000; p. 52.26. De Sousa Filho, J.M.; Wanderley, L.; Gómez, C.; Farache, F. Strategic corporate social responsibility
management for competitive advantage. Braz. Adm. Rev. 2010, 7, 294–309. [CrossRef]27. Kramar, R. Beyond strategic human resource management: Is sustainable human resource management the
next approach? Int. J. Hum. Resour. Manag. 2014, 25, 1069–1089. [CrossRef]28. Buller, P.; McEvoy, G. Strategy, human resource management and performance: Sharpening line of sight.
Hum. Resour. Manag. Rev. 2012, 22, 43–56. [CrossRef]29. Para-González, L.; Jiménez-Jiménez, D.; Martínez-Lorente, Á. The importance of intellectual capital in the
EFQM model of excellence. In Proceedings of the European Conference on Intellectual Capital, Cartagena,Spain, 9–10 April 2015; pp. 253–261.
30. Paraschiv, D.; Nemoianu, E.; Langa, C.; Szabó, T. Eco-innovation, responsible leadership and organizationalchange for corporate sustainability. Amfiteatru Econ. 2012, 14, 404–419.
31. Henman, L. Turn great strategy into great execution. MWorld Winter 2010, 9, 29.32. Heras-Saizarbitoria, I.; Marimon, F.; Casadesús, M. An empirical study of the relationships within the
categories of the EFQM model. Total Qual. Manag. Bus. Excel. 2012, 6, 1–18. [CrossRef]33. Baumgartner, R.; Ebner, D. Corporate sustainability strategies: Sustainability profiles and maturity levels.
Sustain. Dev. 2010, 18, 76–89. [CrossRef]34. Harmon, J.; Fairfield, K.; Behson, S. A comparative analysis of organizational sustainability strategy:
Antecedents and performance outcomes perceived by U.S. and Non-U.S. based managers. In Proceedings ofthe International Eastern Academy of Management Conference, Rio de Janeiro, Brazil, 21–25 June 2009.
35. Millar, C.; Hind, P.; Magala, S. Sustainability and the need for change: Organizational change andtransformational vision. J. Organ. Chang. Manag. 2012, 25, 489–497. [CrossRef]
36. Haudan, J. Successful strategy execution takes people—Not paper. Employ. Relat. Today 2007, 33, 38–39.[CrossRef]
37. Martin, R. The execution trap. Drawing a line between strategy and execution almost guarantees failure.Harv. Bus. Rev. 2010, 88, 64–71, 168.
38. Sterling, J. Translating strategy into effective implementation: Dispelling the myths and highlighting whatworks. Strat. Leadersh. 2003, 31, 32–33. [CrossRef]
39. Cocks, G. Emerging concepts for implementing strategy. TQM J. 2010, 22, 262. [CrossRef]40. Sabourin, V. Through the lenses of strategy execution: Obstacles in engineering management.
Leadersh. Manag. Eng. 2012, 12, 54. [CrossRef]41. Araújo, M.; Sampaio, P. The path to excellence of the Portuguese organisations recognised by the EFQM
model. Total Qual. Manag. Bus. Excel. 2014, 25, 427–438. [CrossRef]42. Siebenhüner, B.; Arnold, M. Organizational learning to manage sustainable development. Bus. Strat. Environ.
2007, 16, 339–353. [CrossRef]43. How hierarchy can hurt strategy execution. Harv. Bus. Rev. 2010, 7–8, 74–75.44. Morgan, J. Strategy execution a four-step process. MWorld Winter 2010, 9, 14.45. Arjaliès, D.-L.; Mundy, J. The use of management control systems to manage CSR strategy: A levers of
control perspective. J. Manag. Account. Res. 2013, 24, 284–300. [CrossRef]46. Hülsmann, M.; Grapp, J. Recursivity and dilemmas of a sustainable strategy management—New visions for
a corporate balancing efficiency and sustainability by autonomous co-operation in decision making processes.In Foresight Management in Corporations and Public Organisations—New Visions for Sustainability,Proceedings of the 7th Annual International Conference Foresight Management in Corporations and PublicOrganisations, Helsinki, Finland, 9–10 June 2005; pp. 1–15.
439
Sustainability 2015, 7, 15847–15856
47. Coon, B.; Wolf, S. The alchemy of strategy execution. Employ. Relat. Today 2005, 32, 29–30. [CrossRef]48. Hrebiniak, L. Making Strategy Work: Leading Effective Execution and Change; Pearson Education: Upper Saddle
River, NJ, USA, 2005.49. Figge, F.; Hahn, T.; Schaltegger, S.; Wagner, M. The sustainability balanced scorecard—Linking sustainability
management to business strategy. Bus. Strat. Env. 2002, 11, 268–284. [CrossRef]50. Nathan, M. ‘Lighting tomorrow with today’: Towards a (strategic) sustainability revolution. Int. J. Sustain.
Strat. Manag. 2010, 2, 29–40. [CrossRef]51. Saunders, M.; Mann, R. Implementing strategic initiatives: A framework of leading practices. Int. J. Oper.
Prod. Manag. 2008, 28, 1104–1106. [CrossRef]52. Ramsey, R. Strategic management: Formulation, implementation, and control in a dynamic environment.
Int. J. Commer. Manag. 2010, 20, 188–189. [CrossRef]53. Kaplan, R.; Norton, D. The strategy map: Guide to aligning intangible assets. Strat. Leadersh. 2004, 32, 10–17.
[CrossRef]54. Free, C.; Qu, S. The use of graphics in promoting management ideas: An analysis of the balanced scorecard,
1992–2010. J. Account. Organ. Chang. 2011, 7, 158–189. [CrossRef]55. Lee, M.-D. Configuration of external influences: The combined effects of institutions and stakeholders on
corporate social responsibility strategies. J. Bus. Ethics 2011, 102, 281–298. [CrossRef]56. Van Marrewijk, M.; Werre, M. Multiple levels of corporate sustainability. J. Bus. Ethics 2003, 44, 107–119.
[CrossRef]57. White, P. Building a sustainability strategy into the business. Corp. Gov. Int. J. Bus. Soc. 2009, 9, 386–394.
© 2015 by the author. Licensee MDPI, Basel, Switzerland. This article is an open accessarticle distributed under the terms and conditions of the Creative Commons Attribution(CC BY) license (http://creativecommons.org/licenses/by/4.0/).
440
sustainability
Article
Repetitive Model Refinement for QuestionnaireDesign Improvement in the Evaluation of WorkingCharacteristics in Construction Enterprises
Jeng-Wen Lin 1,*, Pu Fun Shen 2 and Bing-Jean Lee 1
1 Department of Civil Engineering, Feng Chia University, Taichung 407, Taiwan; [email protected] Ph.D. Program in Civil and Hydraulic Engineering, Feng Chia University, Taichung 407, Taiwan;
* Author to whom correspondence should be addressed; [email protected]; Tel: +886-4-2451-7250 (ext. 3150);Fax: +886-4-2451-6982.
Academic Editors: Adam Jabłonski and Marc A. Rosen
Received: 15 July 2015; Accepted: 11 November 2015; Published: 17 November 2015
Abstract: This paper presents an iterative confidence interval based parametric refinement approachfor questionnaire design improvement in the evaluation of working characteristics in constructionenterprises. This refinement approach utilizes the 95% confidence interval of the estimatedparameters of the model to determine their statistical significance in a least-squares regressionsetting. If this confidence interval of particular parameters covers the zero value, it is statisticallyvalid to remove such parameters from the model and their corresponding questions from thedesigned questionnaire. The remaining parameters repetitively undergo this sifting process untiltheir statistical significance cannot be improved. This repetitive model refinement approach isimplemented in efficient questionnaire design by using both linear series and Taylor series modelsto remove non-contributing questions while keeping significant questions that are contributive tothe issues studied, i.e., employees’ work performance being explained by their work values andcadres’ organizational commitment being explained by their organizational management. Reducingthe number of questions alleviates the respondent burden and reduces costs. The results show thatthe statistical significance of the sifted contributing questions is decreased with a total mean relativechange of 49%, while the Taylor series model increases the R-squared value by 17% compared withthe linear series model.
Keywords: confidence interval; construction enterprises; questionnaire design; repetitive modelrefinement; statistical significance; working characteristics evaluation
1. Introduction
The questionnaire approach is widely used for surveying and collecting sample data with regardto an issue, with a list of questions to be answered and the results aggregated for statistical analysis.However, the main factors or questions influencing the findings of the models used need to be validatedand simplified for efficient questionnaire design. In order to acquire accurate evaluations of workingcharacteristics in construction enterprises and to alleviate problems of relatively large-dimensionaland nonlinear models, this study develops a confidence interval based repetitive parametric modelrefinement approach for questionnaire design improvement.
1.1. General Information about the Questionnaires
A total of 250 questionnaires were distributed to Taiwanese and Chinese employees of two ranksin the company being studied. After excluding 30 invalid questionnaires (being incomplete or with
Sustainability 2015, 7, 15179–15193; doi:10.3390/su71115179 www.mdpi.com/journal/sustainability441
Sustainability 2015, 7, 15179–15193
missing values, or regarded as “outliers” through a set a mathematical analysis) and 39 unreturnedones, a total of 181 questionnaires were valid. The response rate was 72.4%.
1.2. Questionnaire Design Improvement
Questionnaire surveys are a widely used method to collect opinions and views. A customizedquestionnaire is developed based on the parameters revealed by context immersion in a given field(Kim [1]). However, many factors such as tedious design formats (Saris [2], Saris and Gallhofer [3]),redundant content, and excessive length (Weimiao and Zheng [4]) may lead to an inconsistentcomparison matrix for the decision problem. Invalid or bad results from a questionnaire surveymay cause decision makers to make faulty inferences (Ergu and Kou [5]). Suzuki et al. [6] introducedprocedures to design reasonable questionnaires using statistical analysis to obtain high accuracy.Reducing the length of a survey by using a more streamlined set of questions can lead to morereasonable data being acquired and to better explanations of the issues in question. Other examples ofthis approach include Edwards et al. [7], who reduced the effective sample size and introduced bias.Finding ways to increase response rates to postal questionnaires would improve the quality of healthresearch. Landsheer and Boeije [8] used qualitative facet analysis, an application of Guttmann’s facettheory, to investigate whether item content sufficiently covered the intended subject area. This formof content analysis constitutes a systematic, effective, and critical tool for improving the content ofquestionnaires. Jacqui et al. [9] improved questionnaire design by enabling iterations of qualitative andquantitative testing, evaluation, and redevelopment. Results from such tests enable evidence-baseddecisions to be made regarding trade-offs between measurement error, processing error, non-responseerror, respondent burden, and costs. By enabling targeted improvements at the questionnaire designlevel according to specific needs, we can create valuable reference resources (Xu et al. [10]).
1.3. Model Refinement and Repetitive Computation
To alleviate problems of respondent burden and costs as well as relatively large-dimensional andnonlinear models, the issue of model refinement has increasingly drawn much attention in many fields.Smith [11] addressed the study of algorithms and system designs. Adrian [12] presented a refinementprocess with respect to data list building using model generators. Kapova and Goldschmidt [13]proposed model-driven application engineering based on the concept of analytical transformations.Liu [14] established two optimization models for a wireless optical communication system based on afour-level pulse amplitude modulation scheme. Ragnhild et al. [15] explored the behavior inheritanceconsistency of both refined and re-factored models with respect to the original model. Steven et al. [16]addressed model refinement as an iterative process. Zhuquan et al. [17] proposed that measurementspermitted the repeated application of a system identification procedure operating on closed-loop data,together with successive refinements of the designed controller.
1.4. Nonlinear Models and Statistical Confidence Intervals
A nonlinear model is often adopted in system applications. Khorshid and Alfares [18] developeda parameter identification technique in creating a mathematical model of vehicle components bysolving an inverse problem using a non-linear optimization method. Lin and Chen [19] proposed astatistical confidence interval based nonlinear parameter refinement approach and applied it to thestandard power series model (Lin [20], Lin and Betti [21]) for the identification of structural systems.Other statistical confidence interval based studies include Tryon [22], who employed a graphicalinference confidence interval approach in analyzing independent and dependent approaches forstatistical difference, equivalence, replication, indeterminacy, and trivial difference. Yang et al. [23]proposed control limits based on the narrowest confidence interval to analyze problems, if thetraditional three-sigma control limits or probability limits were adopted and some points with relativelyhigh probability of occurrence were excluded; yet, some points with relatively small probability ofoccurrence may still be accepted in asymmetrical or multimodal distributions. Bonett and Price [24]
442
Sustainability 2015, 7, 15179–15193
proposed an adjusted Wald interval for paired binomial proportions that was shown to perform aswell as the best available methods. In construction management, it has been shown to be feasibleto use nonlinear models to deal with construction cost overruns (Ahiaga-Dagbui and Smith [25],Anastasopoulos et al. [26]) and schedule forecasting patterns (Kim and Kim [27], Patel and Jha [28]).
1.5. Prime Novelty Statement
In contrast with the conventional tests of reliability and validity, the designed questionnaires inthis study were analyzed to identify the main factors and associated questions influencing the modelstudied using the proposed repetitive model refinement approach so as to streamline the number ofquestions in surveys of working characteristics in construction enterprises. Problems of respondentburden and costs as well as relatively large-dimensional and nonlinear models were thus alleviated.To reduce the number of questions with a more streamlined set, it was feasible to refine the modelby repetitively removing non-contributing questions. Each time non-contributing questions wereremoved, the questionnaire model would be updated and rerun once again in a multiple regressionsetting. This model refinement approach for the content validity of the questionnaire was implementedusing both linear and Taylor series models by conserving significant questions that were contributiveto the issue being studied, i.e., employees’ work performance explained by their work values andcadres’ organizational commitment explained by their organizational management. The results havebeen verified by calculating the statistical significance values of the sifted contributing questions andthe R-squared values of established models.
2. Questionnaires Evaluating Working Characteristics in Construction Enterprises
In this study, the research subjects of the questionnaires were the Taiwanese employees andcadres of Taiwan-based construction enterprises in China. Questionnaire findings of similaritiesand differences in work values, work satisfaction, organizational management, and organizationalcommitment were preliminarily reviewed. The effects of work values and organizational managementon work satisfaction and organizational commitment, respectively, were analyzed using questionnairesbased on the job diagnostic survey by Hackman and Oldham [29]. The “working characteristicsquestionnaires” included questionnaires for (1) work values; (2) work performance and satisfaction;(3) organizational management; and (4) organizational commitment and identification (Lin andShen [30], Shen [31]).
3. Repetitive Model Refinement Approach and Analyses
Questionnaire data were used in multiple regression analyses using four models, comprising thelinear series, the refined linear series, the Taylor series, and the refined Taylor series model, where forthe employees’ part the independent variables are X = work values, which are used to explain thedependent variables Y = work performance and satisfaction; and for the cadres’ part, X = organizationalmanagement, used to explain Y = organizational commitment and identification.
Two linear regression models were generated to identify the causal links between work values andwork performance on the one hand, and organizational management and organizational commitmenton the other. The original linear series model was refined through an iterative approach. Thisrefined model was developed to streamline the questionnaire by removing non-contributing questions.The Taylor series model expanded the original linear series model up to the third moments. As aconsequence, the R-squared value in the regression setting was increased. The refined Taylor seriesmodel was obtained from the original Taylor series model by the repetitive refinement approach in aregression setting. It was thus feasible to obtain the R-squared values of the regression between X andY defined above and the mean relative change of the statistical significance as two indicators of resultverification, so as to prove the accuracy of the refined model and to validate the sifted questions asgenuinely significant contributors to the refined model.
443
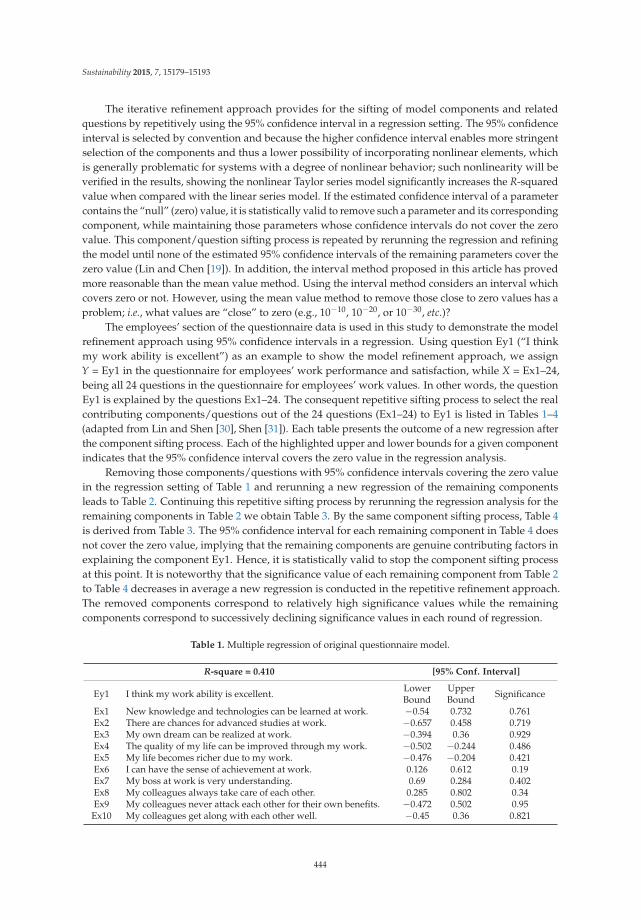
Sustainability 2015, 7, 15179–15193
The iterative refinement approach provides for the sifting of model components and relatedquestions by repetitively using the 95% confidence interval in a regression setting. The 95% confidenceinterval is selected by convention and because the higher confidence interval enables more stringentselection of the components and thus a lower possibility of incorporating nonlinear elements, whichis generally problematic for systems with a degree of nonlinear behavior; such nonlinearity will beverified in the results, showing the nonlinear Taylor series model significantly increases the R-squaredvalue when compared with the linear series model. If the estimated confidence interval of a parametercontains the “null” (zero) value, it is statistically valid to remove such a parameter and its correspondingcomponent, while maintaining those parameters whose confidence intervals do not cover the zerovalue. This component/question sifting process is repeated by rerunning the regression and refiningthe model until none of the estimated 95% confidence intervals of the remaining parameters cover thezero value (Lin and Chen [19]). In addition, the interval method proposed in this article has provedmore reasonable than the mean value method. Using the interval method considers an interval whichcovers zero or not. However, using the mean value method to remove those close to zero values has aproblem; i.e., what values are “close” to zero (e.g., 10−10, 10−20, or 10−30, etc.)?
The employees’ section of the questionnaire data is used in this study to demonstrate the modelrefinement approach using 95% confidence intervals in a regression. Using question Ey1 (“I thinkmy work ability is excellent”) as an example to show the model refinement approach, we assignY = Ey1 in the questionnaire for employees’ work performance and satisfaction, while X = Ex1–24,being all 24 questions in the questionnaire for employees’ work values. In other words, the questionEy1 is explained by the questions Ex1–24. The consequent repetitive sifting process to select the realcontributing components/questions out of the 24 questions (Ex1–24) to Ey1 is listed in Tables 1–4(adapted from Lin and Shen [30], Shen [31]). Each table presents the outcome of a new regression afterthe component sifting process. Each of the highlighted upper and lower bounds for a given componentindicates that the 95% confidence interval covers the zero value in the regression analysis.
Removing those components/questions with 95% confidence intervals covering the zero valuein the regression setting of Table 1 and rerunning a new regression of the remaining componentsleads to Table 2. Continuing this repetitive sifting process by rerunning the regression analysis for theremaining components in Table 2 we obtain Table 3. By the same component sifting process, Table 4is derived from Table 3. The 95% confidence interval for each remaining component in Table 4 doesnot cover the zero value, implying that the remaining components are genuine contributing factors inexplaining the component Ey1. Hence, it is statistically valid to stop the component sifting processat this point. It is noteworthy that the significance value of each remaining component from Table 2to Table 4 decreases in average a new regression is conducted in the repetitive refinement approach.The removed components correspond to relatively high significance values while the remainingcomponents correspond to successively declining significance values in each round of regression.
Table 1. Multiple regression of original questionnaire model.
R-square = 0.410 [95% Conf. Interval]
Ey1 I think my work ability is excellent. LowerBound
UpperBound Significance
Ex1 New knowledge and technologies can be learned at work. −0.54 0.732 0.761Ex2 There are chances for advanced studies at work. −0.657 0.458 0.719Ex3 My own dream can be realized at work. −0.394 0.36 0.929Ex4 The quality of my life can be improved through my work. −0.502 −0.244 0.486Ex5 My life becomes richer due to my work. −0.476 −0.204 0.421Ex6 I can have the sense of achievement at work. 0.126 0.612 0.19Ex7 My boss at work is very understanding. 0.69 0.284 0.402Ex8 My colleagues always take care of each other. 0.285 0.802 0.34Ex9 My colleagues never attack each other for their own benefits. −0.472 0.502 0.95
Ex10 My colleagues get along with each other well. −0.45 0.36 0.821
444
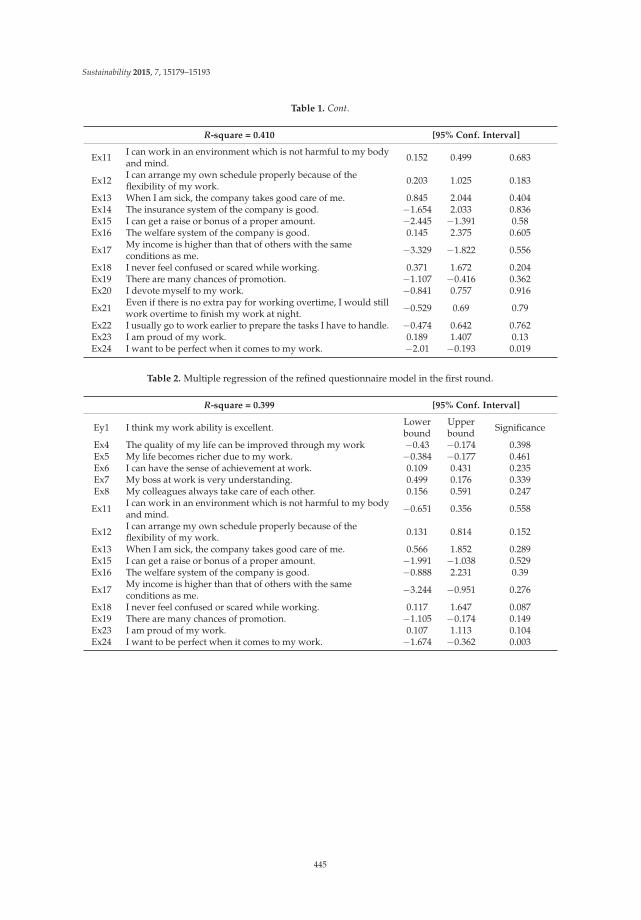
Sustainability 2015, 7, 15179–15193
Table 1. Cont.
R-square = 0.410 [95% Conf. Interval]
Ex11 I can work in an environment which is not harmful to my bodyand mind. 0.152 0.499 0.683
Ex12 I can arrange my own schedule properly because of theflexibility of my work. 0.203 1.025 0.183
Ex13 When I am sick, the company takes good care of me. 0.845 2.044 0.404Ex14 The insurance system of the company is good. −1.654 2.033 0.836Ex15 I can get a raise or bonus of a proper amount. −2.445 −1.391 0.58Ex16 The welfare system of the company is good. 0.145 2.375 0.605
Ex17 My income is higher than that of others with the sameconditions as me. −3.329 −1.822 0.556
Ex18 I never feel confused or scared while working. 0.371 1.672 0.204Ex19 There are many chances of promotion. −1.107 −0.416 0.362Ex20 I devote myself to my work. −0.841 0.757 0.916
Ex21 Even if there is no extra pay for working overtime, I would stillwork overtime to finish my work at night. −0.529 0.69 0.79
Ex22 I usually go to work earlier to prepare the tasks I have to handle. −0.474 0.642 0.762Ex23 I am proud of my work. 0.189 1.407 0.13Ex24 I want to be perfect when it comes to my work. −2.01 −0.193 0.019
Table 2. Multiple regression of the refined questionnaire model in the first round.
R-square = 0.399 [95% Conf. Interval]
Ey1 I think my work ability is excellent. Lowerbound
Upperbound Significance
Ex4 The quality of my life can be improved through my work −0.43 −0.174 0.398Ex5 My life becomes richer due to my work. −0.384 −0.177 0.461Ex6 I can have the sense of achievement at work. 0.109 0.431 0.235Ex7 My boss at work is very understanding. 0.499 0.176 0.339Ex8 My colleagues always take care of each other. 0.156 0.591 0.247
Ex11 I can work in an environment which is not harmful to my bodyand mind. −0.651 0.356 0.558
Ex12 I can arrange my own schedule properly because of theflexibility of my work. 0.131 0.814 0.152
Ex13 When I am sick, the company takes good care of me. 0.566 1.852 0.289Ex15 I can get a raise or bonus of a proper amount. −1.991 −1.038 0.529Ex16 The welfare system of the company is good. −0.888 2.231 0.39
Ex17 My income is higher than that of others with the sameconditions as me. −3.244 −0.951 0.276
Ex18 I never feel confused or scared while working. 0.117 1.647 0.087Ex19 There are many chances of promotion. −1.105 −0.174 0.149Ex23 I am proud of my work. 0.107 1.113 0.104Ex24 I want to be perfect when it comes to my work. −1.674 −0.362 0.003
445
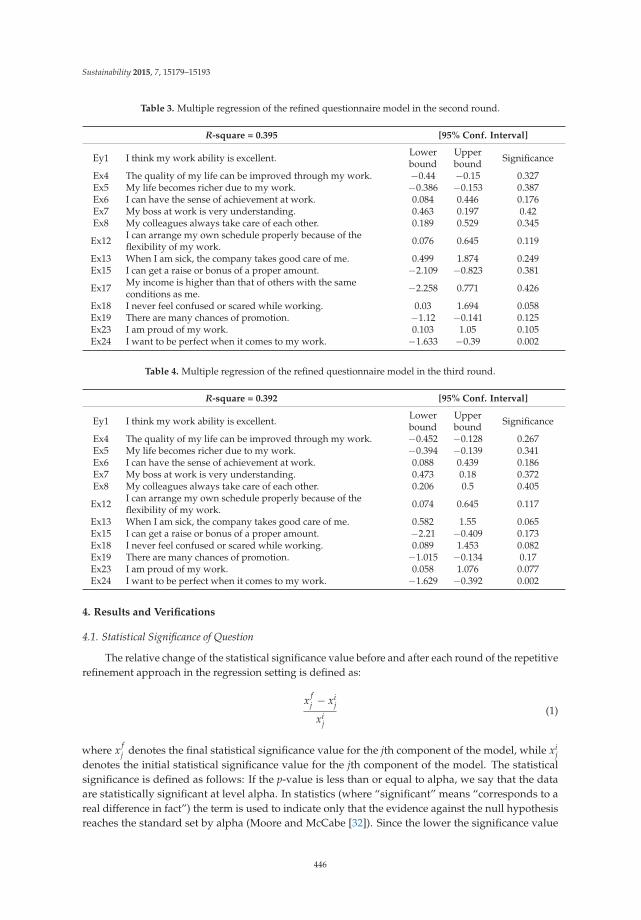
Sustainability 2015, 7, 15179–15193
Table 3. Multiple regression of the refined questionnaire model in the second round.
R-square = 0.395 [95% Conf. Interval]
Ey1 I think my work ability is excellent. Lowerbound
Upperbound Significance
Ex4 The quality of my life can be improved through my work. −0.44 −0.15 0.327Ex5 My life becomes richer due to my work. −0.386 −0.153 0.387Ex6 I can have the sense of achievement at work. 0.084 0.446 0.176Ex7 My boss at work is very understanding. 0.463 0.197 0.42Ex8 My colleagues always take care of each other. 0.189 0.529 0.345
Ex12 I can arrange my own schedule properly because of theflexibility of my work. 0.076 0.645 0.119
Ex13 When I am sick, the company takes good care of me. 0.499 1.874 0.249Ex15 I can get a raise or bonus of a proper amount. −2.109 −0.823 0.381
Ex17 My income is higher than that of others with the sameconditions as me. −2.258 0.771 0.426
Ex18 I never feel confused or scared while working. 0.03 1.694 0.058Ex19 There are many chances of promotion. −1.12 −0.141 0.125Ex23 I am proud of my work. 0.103 1.05 0.105Ex24 I want to be perfect when it comes to my work. −1.633 −0.39 0.002
Table 4. Multiple regression of the refined questionnaire model in the third round.
R-square = 0.392 [95% Conf. Interval]
Ey1 I think my work ability is excellent. Lowerbound
Upperbound Significance
Ex4 The quality of my life can be improved through my work. −0.452 −0.128 0.267Ex5 My life becomes richer due to my work. −0.394 −0.139 0.341Ex6 I can have the sense of achievement at work. 0.088 0.439 0.186Ex7 My boss at work is very understanding. 0.473 0.18 0.372Ex8 My colleagues always take care of each other. 0.206 0.5 0.405
Ex12 I can arrange my own schedule properly because of theflexibility of my work. 0.074 0.645 0.117
Ex13 When I am sick, the company takes good care of me. 0.582 1.55 0.065Ex15 I can get a raise or bonus of a proper amount. −2.21 −0.409 0.173Ex18 I never feel confused or scared while working. 0.089 1.453 0.082Ex19 There are many chances of promotion. −1.015 −0.134 0.17Ex23 I am proud of my work. 0.058 1.076 0.077Ex24 I want to be perfect when it comes to my work. −1.629 −0.392 0.002
4. Results and Verifications
4.1. Statistical Significance of Question
The relative change of the statistical significance value before and after each round of the repetitiverefinement approach in the regression setting is defined as:
x fj − xi
j
xij
(1)
where x fj denotes the final statistical significance value for the jth component of the model, while xi
jdenotes the initial statistical significance value for the jth component of the model. The statisticalsignificance is defined as follows: If the p-value is less than or equal to alpha, we say that the dataare statistically significant at level alpha. In statistics (where “significant” means “corresponds to areal difference in fact”) the term is used to indicate only that the evidence against the null hypothesisreaches the standard set by alpha (Moore and McCabe [32]). Since the lower the significance value
446
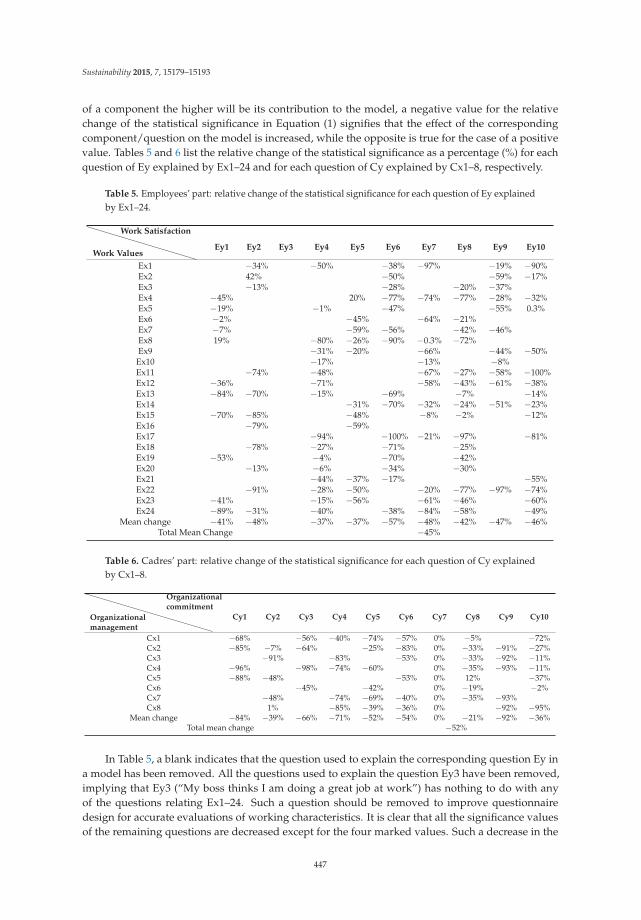
Sustainability 2015, 7, 15179–15193
of a component the higher will be its contribution to the model, a negative value for the relativechange of the statistical significance in Equation (1) signifies that the effect of the correspondingcomponent/question on the model is increased, while the opposite is true for the case of a positivevalue. Tables 5 and 6 list the relative change of the statistical significance as a percentage (%) for eachquestion of Ey explained by Ex1–24 and for each question of Cy explained by Cx1–8, respectively.
Table 5. Employees’ part: relative change of the statistical significance for each question of Ey explainedby Ex1–24.
Work Values
Work Satisfaction
Ey1 Ey2 Ey3 Ey4 Ey5 Ey6 Ey7 Ey8 Ey9 Ey10
Ex1 −34% −50% −38% −97% −19% −90%Ex2 42% −50% −59% −17%Ex3 −13% −28% −20% −37%Ex4 −45% 20% −77% −74% −77% −28% −32%Ex5 −19% −1% −47% −55% 0.3%Ex6 −2% −45% −64% −21%Ex7 −7% −59% −56% −42% −46%Ex8 19% −80% −26% −90% −0.3% −72%Ex9 −31% −20% −66% −44% −50%
Ex10 −17% −13% −8%Ex11 −74% −48% −67% −27% −58% −100%Ex12 −36% −71% −58% −43% −61% −38%Ex13 −84% −70% −15% −69% −7% −14%Ex14 −31% −70% −32% −24% −51% −23%Ex15 −70% −85% −48% −8% −2% −12%Ex16 −79% −59%Ex17 −94% −100% −21% −97% −81%Ex18 −78% −27% −71% −25%Ex19 −53% −4% −70% −42%Ex20 −13% −6% −34% −30%Ex21 −44% −37% −17% −55%Ex22 −91% −28% −50% −20% −77% −97% −74%Ex23 −41% −15% −56% −61% −46% −60%Ex24 −89% −31% −40% −38% −84% −58% −49%
Mean change −41% −48% −37% −37% −57% −48% −42% −47% −46%Total Mean Change −45%
Table 6. Cadres’ part: relative change of the statistical significance for each question of Cy explainedby Cx1–8.
Organizationalmanagement
Organizationalcommitment
Cy1 Cy2 Cy3 Cy4 Cy5 Cy6 Cy7 Cy8 Cy9 Cy10
Cx1 −68% −56% −40% −74% −57% 0% −5% −72%Cx2 −85% −7% −64% −25% −83% 0% −33% −91% −27%Cx3 −91% −83% −53% 0% −33% −92% −11%Cx4 −96% −98% −74% −60% 0% −35% −93% −11%Cx5 −88% −48% −53% 0% 12% −37%Cx6 −45% −42% 0% −19% −2%Cx7 −48% −74% −69% −40% 0% −35% −93%Cx8 1% −85% −39% −36% 0% −92% −95%
Mean change −84% −39% −66% −71% −52% −54% 0% −21% −92% −36%Total mean change −52%
In Table 5, a blank indicates that the question used to explain the corresponding question Ey ina model has been removed. All the questions used to explain the question Ey3 have been removed,implying that Ey3 (“My boss thinks I am doing a great job at work”) has nothing to do with anyof the questions relating Ex1–24. Such a question should be removed to improve questionnairedesign for accurate evaluations of working characteristics. It is clear that all the significance valuesof the remaining questions are decreased except for the four marked values. Such a decrease in the
447
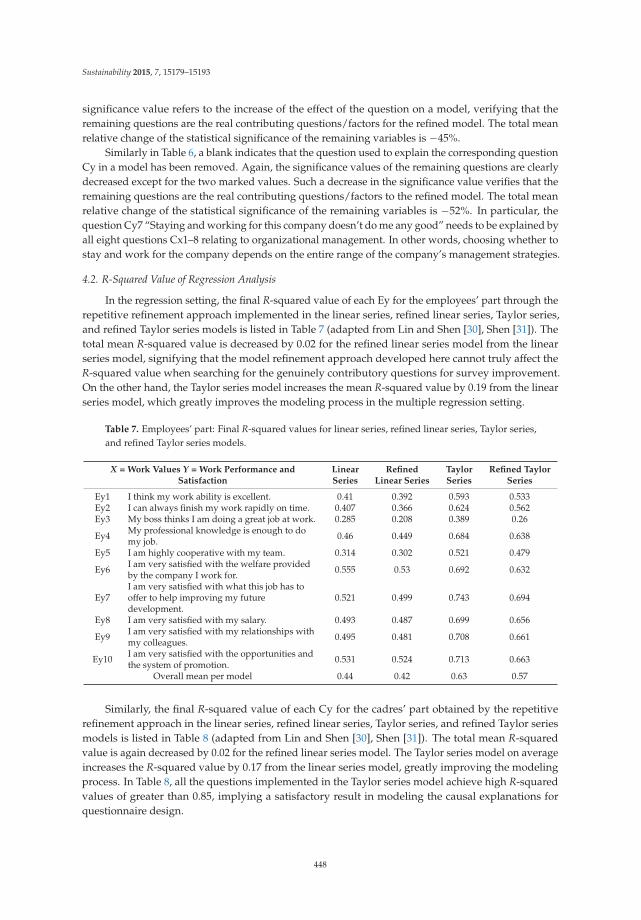
Sustainability 2015, 7, 15179–15193
significance value refers to the increase of the effect of the question on a model, verifying that theremaining questions are the real contributing questions/factors for the refined model. The total meanrelative change of the statistical significance of the remaining variables is −45%.
Similarly in Table 6, a blank indicates that the question used to explain the corresponding questionCy in a model has been removed. Again, the significance values of the remaining questions are clearlydecreased except for the two marked values. Such a decrease in the significance value verifies that theremaining questions are the real contributing questions/factors to the refined model. The total meanrelative change of the statistical significance of the remaining variables is −52%. In particular, thequestion Cy7 “Staying and working for this company doesn’t do me any good” needs to be explained byall eight questions Cx1–8 relating to organizational management. In other words, choosing whether tostay and work for the company depends on the entire range of the company’s management strategies.
4.2. R-Squared Value of Regression Analysis
In the regression setting, the final R-squared value of each Ey for the employees’ part through therepetitive refinement approach implemented in the linear series, refined linear series, Taylor series,and refined Taylor series models is listed in Table 7 (adapted from Lin and Shen [30], Shen [31]). Thetotal mean R-squared value is decreased by 0.02 for the refined linear series model from the linearseries model, signifying that the model refinement approach developed here cannot truly affect theR-squared value when searching for the genuinely contributory questions for survey improvement.On the other hand, the Taylor series model increases the mean R-squared value by 0.19 from the linearseries model, which greatly improves the modeling process in the multiple regression setting.
Table 7. Employees’ part: Final R-squared values for linear series, refined linear series, Taylor series,and refined Taylor series models.
X = Work Values Y = Work Performance andSatisfaction
LinearSeries
RefinedLinear Series
TaylorSeries
Refined TaylorSeries
Ey1 I think my work ability is excellent. 0.41 0.392 0.593 0.533Ey2 I can always finish my work rapidly on time. 0.407 0.366 0.624 0.562Ey3 My boss thinks I am doing a great job at work. 0.285 0.208 0.389 0.26
Ey4 My professional knowledge is enough to domy job. 0.46 0.449 0.684 0.638
Ey5 I am highly cooperative with my team. 0.314 0.302 0.521 0.479
Ey6 I am very satisfied with the welfare providedby the company I work for. 0.555 0.53 0.692 0.632
Ey7I am very satisfied with what this job has tooffer to help improving my futuredevelopment.
0.521 0.499 0.743 0.694
Ey8 I am very satisfied with my salary. 0.493 0.487 0.699 0.656
Ey9 I am very satisfied with my relationships withmy colleagues. 0.495 0.481 0.708 0.661
Ey10 I am very satisfied with the opportunities andthe system of promotion. 0.531 0.524 0.713 0.663
Overall mean per model 0.44 0.42 0.63 0.57
Similarly, the final R-squared value of each Cy for the cadres’ part obtained by the repetitiverefinement approach in the linear series, refined linear series, Taylor series, and refined Taylor seriesmodels is listed in Table 8 (adapted from Lin and Shen [30], Shen [31]). The total mean R-squaredvalue is again decreased by 0.02 for the refined linear series model. The Taylor series model on averageincreases the R-squared value by 0.17 from the linear series model, greatly improving the modelingprocess. In Table 8, all the questions implemented in the Taylor series model achieve high R-squaredvalues of greater than 0.85, implying a satisfactory result in modeling the causal explanations forquestionnaire design.
448
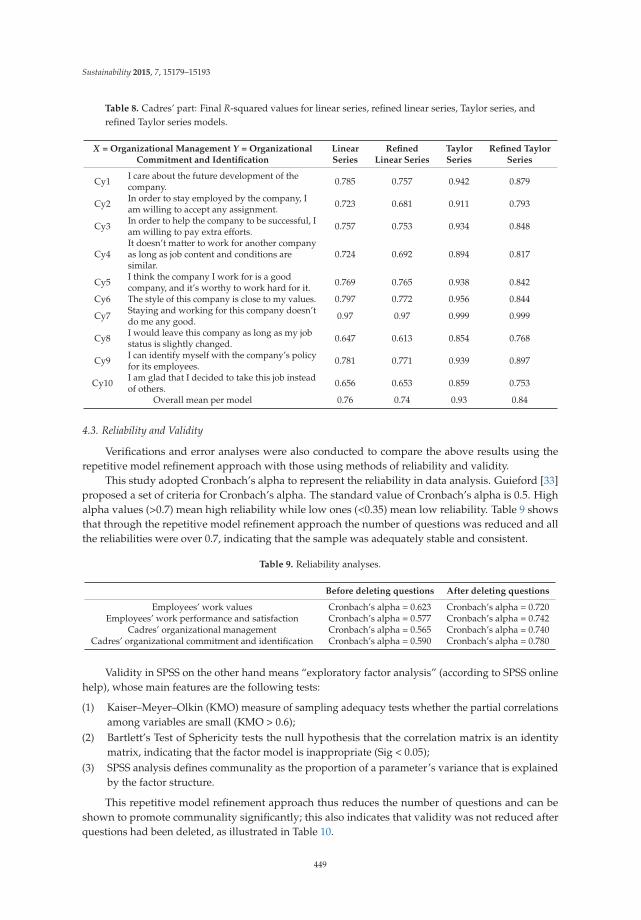
Sustainability 2015, 7, 15179–15193
Table 8. Cadres’ part: Final R-squared values for linear series, refined linear series, Taylor series, andrefined Taylor series models.
X = Organizational Management Y = OrganizationalCommitment and Identification
LinearSeries
RefinedLinear Series
TaylorSeries
Refined TaylorSeries
Cy1 I care about the future development of thecompany. 0.785 0.757 0.942 0.879
Cy2 In order to stay employed by the company, Iam willing to accept any assignment. 0.723 0.681 0.911 0.793
Cy3 In order to help the company to be successful, Iam willing to pay extra efforts. 0.757 0.753 0.934 0.848
Cy4It doesn’t matter to work for another companyas long as job content and conditions aresimilar.
0.724 0.692 0.894 0.817
Cy5 I think the company I work for is a goodcompany, and it’s worthy to work hard for it. 0.769 0.765 0.938 0.842
Cy6 The style of this company is close to my values. 0.797 0.772 0.956 0.844
Cy7 Staying and working for this company doesn’tdo me any good. 0.97 0.97 0.999 0.999
Cy8 I would leave this company as long as my jobstatus is slightly changed. 0.647 0.613 0.854 0.768
Cy9 I can identify myself with the company’s policyfor its employees. 0.781 0.771 0.939 0.897
Cy10 I am glad that I decided to take this job insteadof others. 0.656 0.653 0.859 0.753
Overall mean per model 0.76 0.74 0.93 0.84
4.3. Reliability and Validity
Verifications and error analyses were also conducted to compare the above results using therepetitive model refinement approach with those using methods of reliability and validity.
This study adopted Cronbach’s alpha to represent the reliability in data analysis. Guieford [33]proposed a set of criteria for Cronbach’s alpha. The standard value of Cronbach’s alpha is 0.5. Highalpha values (>0.7) mean high reliability while low ones (<0.35) mean low reliability. Table 9 showsthat through the repetitive model refinement approach the number of questions was reduced and allthe reliabilities were over 0.7, indicating that the sample was adequately stable and consistent.
Table 9. Reliability analyses.
Before deleting questions After deleting questions
Employees’ work values Cronbach’s alpha = 0.623 Cronbach’s alpha = 0.720Employees’ work performance and satisfaction Cronbach’s alpha = 0.577 Cronbach’s alpha = 0.742
Cadres’ organizational management Cronbach’s alpha = 0.565 Cronbach’s alpha = 0.740Cadres’ organizational commitment and identification Cronbach’s alpha = 0.590 Cronbach’s alpha = 0.780
Validity in SPSS on the other hand means “exploratory factor analysis” (according to SPSS onlinehelp), whose main features are the following tests:
(1) Kaiser–Meyer–Olkin (KMO) measure of sampling adequacy tests whether the partial correlationsamong variables are small (KMO > 0.6);
(2) Bartlett’s Test of Sphericity tests the null hypothesis that the correlation matrix is an identitymatrix, indicating that the factor model is inappropriate (Sig < 0.05);
(3) SPSS analysis defines communality as the proportion of a parameter’s variance that is explainedby the factor structure.
This repetitive model refinement approach thus reduces the number of questions and can beshown to promote communality significantly; this also indicates that validity was not reduced afterquestions had been deleted, as illustrated in Table 10.
449
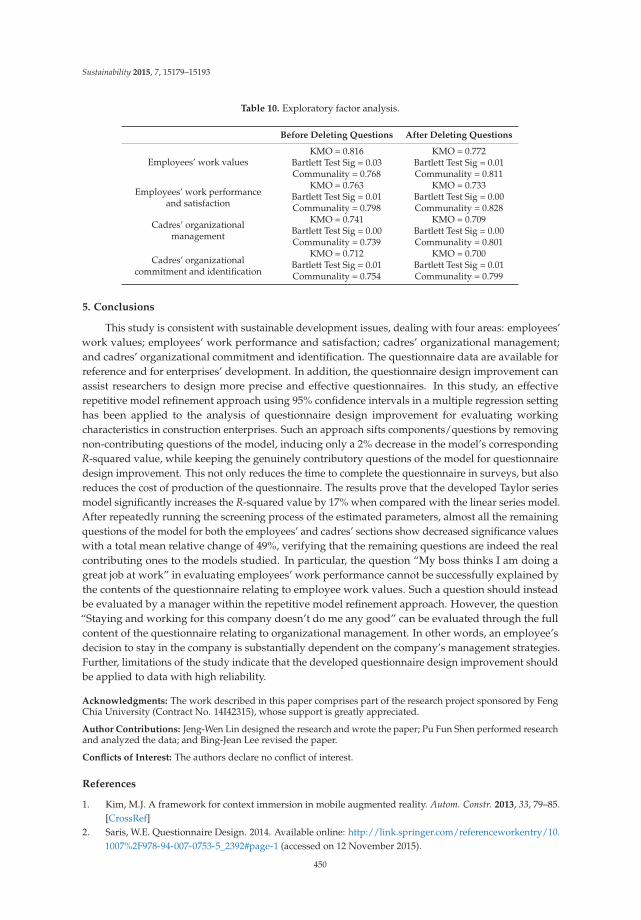
Sustainability 2015, 7, 15179–15193
Table 10. Exploratory factor analysis.
Before Deleting Questions After Deleting Questions
Employees’ work valuesKMO = 0.816 KMO = 0.772
Bartlett Test Sig = 0.03 Bartlett Test Sig = 0.01Communality = 0.768 Communality = 0.811
Employees’ work performanceand satisfaction
KMO = 0.763 KMO = 0.733Bartlett Test Sig = 0.01 Bartlett Test Sig = 0.00Communality = 0.798 Communality = 0.828
Cadres’ organizationalmanagement
KMO = 0.741 KMO = 0.709Bartlett Test Sig = 0.00 Bartlett Test Sig = 0.00Communality = 0.739 Communality = 0.801
Cadres’ organizationalcommitment and identification
KMO = 0.712 KMO = 0.700Bartlett Test Sig = 0.01 Bartlett Test Sig = 0.01Communality = 0.754 Communality = 0.799
5. Conclusions
This study is consistent with sustainable development issues, dealing with four areas: employees’work values; employees’ work performance and satisfaction; cadres’ organizational management;and cadres’ organizational commitment and identification. The questionnaire data are available forreference and for enterprises’ development. In addition, the questionnaire design improvement canassist researchers to design more precise and effective questionnaires. In this study, an effectiverepetitive model refinement approach using 95% confidence intervals in a multiple regression settinghas been applied to the analysis of questionnaire design improvement for evaluating workingcharacteristics in construction enterprises. Such an approach sifts components/questions by removingnon-contributing questions of the model, inducing only a 2% decrease in the model’s correspondingR-squared value, while keeping the genuinely contributory questions of the model for questionnairedesign improvement. This not only reduces the time to complete the questionnaire in surveys, but alsoreduces the cost of production of the questionnaire. The results prove that the developed Taylor seriesmodel significantly increases the R-squared value by 17% when compared with the linear series model.After repeatedly running the screening process of the estimated parameters, almost all the remainingquestions of the model for both the employees’ and cadres’ sections show decreased significance valueswith a total mean relative change of 49%, verifying that the remaining questions are indeed the realcontributing ones to the models studied. In particular, the question “My boss thinks I am doing agreat job at work” in evaluating employees’ work performance cannot be successfully explained bythe contents of the questionnaire relating to employee work values. Such a question should insteadbe evaluated by a manager within the repetitive model refinement approach. However, the question“Staying and working for this company doesn’t do me any good” can be evaluated through the fullcontent of the questionnaire relating to organizational management. In other words, an employee’sdecision to stay in the company is substantially dependent on the company’s management strategies.Further, limitations of the study indicate that the developed questionnaire design improvement shouldbe applied to data with high reliability.
Acknowledgments: The work described in this paper comprises part of the research project sponsored by FengChia University (Contract No. 14I42315), whose support is greatly appreciated.
Author Contributions: Jeng-Wen Lin designed the research and wrote the paper; Pu Fun Shen performed researchand analyzed the data; and Bing-Jean Lee revised the paper.
Conflicts of Interest: The authors declare no conflict of interest.
References
1. Kim, M.J. A framework for context immersion in mobile augmented reality. Autom. Constr. 2013, 33, 79–85.[CrossRef]
2. Saris, W.E. Questionnaire Design. 2014. Available online: http://link.springer.com/referenceworkentry/10.1007%2F978-94-007-0753-5_2392#page-1 (accessed on 12 November 2015).
450
Sustainability 2015, 7, 15179–15193
3. Saris, W.E.; Gallhofer, I.N. Design, Evaluation, and Analysis of Questionnaires for Survey Research. 2014.Available online: https://books.google.com.tw/books?hl=zh-TW&lr=&id=NTKpAgAAQBAJ&oi=fnd&pg=PT12&ots=xHVXLPqMua&sig=Vfoid8qPqQZ2we861FwFBaI3Ccs&redir_esc=y#v=onepage&q&f=false(accessed on 12 November 2015).
4. Weimiao, F.; Zheng, Y. Factors Affecting Response Rates of the Web Survey: A Systematic Review. Comput.Hum. Behav. 2009, 26, 132–139.
5. Ergu, D.; Kou, G. Questionnaire Design Improvement and Missing Item Scores Estimation for Rapid andEfficient Decision Making. Ann. Oper. Res. 2012, 197, 5–23. [CrossRef]
6. Suzuki, S.; Ando, M.; Hashimoto, H.; Asama, H. Design Procedure and Improvement of a MathematicalModeling to Estimate Customer Satisfaction. 2014. Available online: http://link.springer.com/chapter/10.1007/978-4-431-54816-4_2#page-1 (accessed on 12 November 2015).
7. Edwards, P.J.; Roberts, I.; Clarke, M.J.; DiGuiseppi, C.; Wentz, R.; Kwan, I.; Cooper, R.; Felix, L.M.; Pratap, S.Methods to Increase Response to Postal and Electronic Questionnaires. Cochrane Database Syst. Rev. 2009.[CrossRef]
8. Landsheer, J.A.; Boeije, H.R. In Search of Content Validity: Facet Analysis as a Qualitative Method to ImproveQuestionnaire Design An Application in Health Research. Qual. Quant. 2008, 44, 59–69. [CrossRef]
9. Jacqui, J.; Pete, B.; Sarah, W.; Jane, C. Improved Questionnaire Design Yields Better Data: Experiencesfrom the UK’s Annual Survey of Hours and Earnings. In Proceedings of the International Conference onEstablishment Survey (ICES–III), Montréal, QC, Canada, 18–21 June 2007.
10. Xu, S.; Zhou, S.; Cao, Q.; Lei, J.; Li, X.; He, Y. Questionnaire Design and Analysis of Online Teaching andLearning: A Case Study of the Questionnaire of “Education Online” Platform of Beijing University ofTechnology. 2014. Available online: http://link.springer.com/chapter/10.1007/978-94-007-7618-0_419(accessed on 12 November 2015).
11. Smith, D.R. Model Refinement: Calculating Refinements in Algorithm and System Design. 2009. Availableonline: ftp://kestrel.edu/pub/papers/smith/mr.pdf (accessed on 12 November 2015).
12. Adrian, V. Performance Criteria for Software Metrics Model Refinement. J. Appl. Quant. Methods 2007, 2,118–128.
13. Kapova, L.; Goldschmidt, T. Automated Feature Model-Based Generation of Refinement Transformations.In Proceedings of the 2009 SEAA ‘09, 35th Euromicro Conference on Software Engineering and AdvancedApplications, Patras, Greece, 27–29 August 2009; pp. 141–148.
14. Liu, X. Solution Refinement of Wireless Optical System Model with Multi-level Modulation. Electron. Lett.2009, 45, 475–476. [CrossRef]
15. Ragnhild, V.D.S.; Viviane, J.; Tom, M. A Formal Approach to Model Refactoring and Model Refinement.Softw. Syst. Model. 2005, 6, 139–162.
16. Steven, J.L.; Philip, R.B.; Chiu, W. EMAN: Semiautomated Software for High-Resolution Single-ParticleReconstructions. J. Struct. Biol. 1999, 128, 82–97.
17. Zhuquan, Z.; Bitmead, R.R.; Gevers, M. H2 Iterative Model Refinement and Control Robustness Enhancement.In Proceedings of the 30th IEEE Conference on Decision and Control, Brighton, UK, 11–13 December 1991;Volume 1, pp. 279–284.
18. Khorshid, E.; Alfares, M. Model Refinement and Experimental Evaluation for Optimal Design of SpeedHumps. Int. J. Veh. Syst. Model. Test. 2006, 2, 80–99. [CrossRef]
19. Lin, J.W.; Chen, H.J. Repetitive Identification of Structural Systems using a Nonlinear Model ParameterRefinement Approach. Shock Vib. 2009, 16, 229–240. [CrossRef]
20. Lin, J.W. Adaptive Algorithms for the Identification of Nonlinear Structural Systems. Ph.D. Thesis, ColumbiaUniversity, New York, NY, USA, 2001.
21. Lin, J.W.; Betti, R. On-line Identification and Damage Detection in Non-linear Structural Systems using aVariable Forgetting Factor Approach. Earthq. Eng. Struct. Dyn. 2004, 33, 419–444. [CrossRef]
22. Tryon, W.W. Evaluating Independent Proportions for Statistical Difference, Equivalence, Indeterminacy, andTrivial Difference Using Inferential Confidence Intervals. J. Educ. Behav. Stat. 2009, 34, 171–189. [CrossRef]
23. Yang, J.; Xie, M.; Goh, T.N. Control Limits Based on the Narrowest Confidence Interval. Commun. Stat.Theory Methods 2011, 40, 2172–2181. [CrossRef]
24. Bonett, D.G.; Price, R.M. Adjusted Wald Confidence Interval for a Difference of Binomial Proportions Basedon Paired Data. J. Educ. Behav. Stat. 2012, 37, 479–488. [CrossRef]
451
Sustainability 2015, 7, 15179–15193
25. Ahiaga-Dagbui, D.D.; Smith, S.D. Dealing with Construction Cost Overruns Using Data Mining. Constr.Manag. Econ. 2014, 32, 682–694. [CrossRef]
26. Anastasopoulos, P.C.; Haddock, J.E.; Peeta, S. Cost Overrun in Public-Private Partnerships: TowardSustainable Highway Maintenance and Rehabilitation. 2014. Available online: http://ascelibrary.org/doi/abs/10.1061/%28ASCE%29CO.1943-7862.0000854 (accessed on 12 November 2015).
27. Kim, B.C.; Kim, H.J. Sensitivity of Earned Value Schedule Forecasting to S-Curve Patterns. J. Constr. Eng.Manag. 2014, 140, 04014023. Available online: http://ascelibrary.org/doi/10.1061/%28ASCE%29CO.1943-7862.0000856 (accessed on 12 November 2015). [CrossRef]
28. Patel, D.A.; Jha, K.N. Neural Network Model for the Prediction of Safe Work Behavior in ConstructionProjects. 2015. Available online: http://ascelibrary.org/doi/10.1061/%28ASCE%29CO.1943-7862.0000922(accessed on 12 November 2015).
29. Hackman, J.R.; Oldham, G.R. Development of the Job Diagnostic Survey. J. Appl. Psychol. 1975, 60, 159–170.[CrossRef]
30. Lin, J.W.; Shen, P.F. Factor-analysis Based Questionnaire Categorization Method for Reliability Improvementof Evaluation of Working Conditions in Construction Enterprises. Struct. Eng. Mech. 2014, 51, 973–988.[CrossRef]
31. Shen, P.F. Impact of Employees’ Work Values at Two Sides of Taiwan Straits on Corporate Performance.Master’s Thesis, Feng Chia University, Taichung, Taiwan, 2011.
32. Moore, D.S.; McCabe, G.P. Introduction to the Practice of Statistics, 3rd ed.; W.H. Freeman and Company: NewYork, NY, USA, 2000.
33. Guieford, J.P. Fundamental Statistics in Psychology and Education, 4th ed.; McGraw Hill: New York, NY,USA, 1965.
© 2015 by the authors. Licensee MDPI, Basel, Switzerland. This article is an open accessarticle distributed under the terms and conditions of the Creative Commons Attribution(CC BY) license (http://creativecommons.org/licenses/by/4.0/).
452
sustainability
Article
Development of an Innovation Model Based on aService-Oriented Product Service System (PSS)
Seungkyum Kim 1, Changho Son 2, Byungun Yoon 3 and Yongtae Park 1,*
1 Department of Industrial Engineering, Seoul National University, 1 Gwanak-ro, Gwanak-gu, Seoul 151-742,Korea; [email protected]
2 Department of Weapon System Engineering, Korea Army Academy at Yeong-Cheon, 135-1 Changhari,Young-Cheon, Gyeongbuk 770-849, Korea; [email protected]
3 Department of Industrial & Systems Engineering, Dongguk University, Seoul 04620, Korea;[email protected]
* Author to whom correspondence should be addressed; [email protected]; Tel./Fax: +82-2-878-3511
Academic Editor: Adam Jabłonski
Received: 1 August 2015; Accepted: 20 October 2015; Published: 28 October 2015
Abstract: Recently, there have been many attempts to cope with increasingly-diversified andever-changing customer needs by combining products and services that are critical componentsof innovation models. Although not only manufacturers, but also service providers, try to integrateproducts and services, most of the previous studies on Product Service System (PSS) developmentdeal with how to effectively integrate services into products from the product-centric point of view.Services provided by manufacturers’ PSSes, such as delivery services, training services, disposalservices, and so on, offer customers ancillary value, whereas products of service providers’ PSSesenrich core value by enhancing the functionality and quality of the service. Thus, designing aneffective PSS development process from the service-centric point of view is an important researchtopic. Accordingly, the purpose of this paper is to propose a service-oriented PSS developmentprocess, which consists of four stages: (1) strategic planning; (2) idea generation and selection;(3) service design; and (4) product development. In the proposed approach, the PSS developmentproject is initiated and led by a service provider from a service-centric point of view. From theperspective of methodology, customer needs are converted into product functions according toQuality Function Deployment (QFD), while Analytic Hierarchy Process (AHP) is employed toprioritize the functions. Additionally, this paper illustrates a service-oriented PSS development thatdemonstrates the application of the proposed process. The proposed process and illustration areexpected to serve as a foundation for research on service-oriented PSS development and as a usefulguideline for service providers who are considering the development of a service-oriented PSS.
Keywords: Product Service System (PSS); service-oriented PSS development process; Englisheducation; Analytic Hierarchy Process (AHP); Quality Function Deployment (QFD)
1. Introduction
Recently, customer needs have become increasingly diversified and ever-changing. Underthis circumstance, because it is very difficult to fulfill sophisticated customer needs by productinnovation alone, many attempts to overcome this problem have involved combining products andservices. In practice, companies, such as General Electric, Xerox, Canon, and Parkersell, have showna considerable increase in sales and profits from services since the mid-1990s [1]. Although suchcompanies had originally made profits by only selling products, they have maintained growth byintegrating services into their products. These attempts can be regarded as Product Service Systems
Sustainability 2015, 7, 14427–14449; doi:10.3390/su71114427 www.mdpi.com/journal/sustainability453
Sustainability 2015, 7, 14427–14449
(PSS), which are firstly defined as a set of products and services that fulfills customer needs and haslower environmental impact [2]. Most of the early studies on PSS focused on the environmental aspect.However, the scope and concept of PSS have been expanded, as various studies on PSS have beenactively conducted. Nowadays, PSS is regarded as an integrated system of products and services toprovide customers with functions and value that they need [3]. Thus, it is one of the critical componentsof innovation models that can create value on existing and new businesses.
Most of the previous studies on PSS are based on the viewpoint of manufacturers [4–11].Particularly, studies on PSS development deal with how to effectively integrate services into productsfrom the product-centric point of view, and they focus on a specific phase, not the whole developmentprocess. Low et al. [4] suggested an idea generation method using theory of solving inventive problem(TRIZ) methodology, while Uchihira et al. [8] proposed a method that identifies PSS opportunitiesalong with product usage. Aurich et al. [6] and Yang et al. [11] utilized product life-cycle data foridea generation and design of PSSes. In summary, there is a lack of research on PSS developmentcovering the whole development process, and it is rare to find PSS research conducted from theservice-centric point of view. However, service providers are also making attempts to integrateproducts into their services for effective service deliveries and differentiated customer value. Amazon’sKindle is an example of this case. PSSes developed by manufacturers and service providers havedifferent characteristics in terms of customer value. Services of manufacturers’ PSSes, such as deliveryservices, training services, disposal services, and so on, offer customers ancillary value instead of corevalue that customers recognize when consuming the product, whereas products of service providers’PSSes ensure that core value is enriched by enhancing functionality and quality of the service. In thecase of Kindle, e-book contents are instantly delivered with lower cost, easier access, and easierpayment; therefore, Kindle enriches the core value that Amazon has offered customers as an onlinebookstore. Thus, a different approach for developing a service-centric PSS is required. Therefore,designing an effective PSS development process from the service-centric point of view is an importantresearch topic.
Accordingly, this paper proposes a service-oriented PSS development process in which thePSS development project is initiated and led by a service provider from a service-centric viewpointto generate a new innovation model. In contrast to a single product or service development, PSSdevelopment is carried out by multiple actors, including manufacturers and service providers; hence,the role of each actor should be defined clearly. In the proposed process, which consists of fourstages, the actor and its role are specified for each stage. Additionally, this paper introduces a realPSS development case from the education industry sector, which demonstrates the application of theproposed process and discusses the practical issues that can occur during the PSS development project.The fact that the proposed process was applied to real business practices has practical significanceand, furthermore, this research could serve as a useful guideline for service providers to develop aservice-oriented PSS.
The remainder of this paper is organized as follows. In the next section, the previous studies onPSS development are reviewed, which build a foundation for the proposed approach. In Section 3,a service-oriented PSS development process is proposed including the concept, framework, anddetailed processes. Section 4 introduces the case of service-oriented PSS development in detail.Finally, this research ends with conclusions that include contributions, limitations and directions forfuture research.
2. Literature Review
2.1. Definition of PSS
Recently, PSS has received much attention from both industry and academia. Accordingly, activeresearch regarding PSS is underway. Goedkoop et al. [2] initially suggested the PSS concept, whichis defined as “a system of products, services, networks of players, and supporting infrastructure
454
Sustainability 2015, 7, 14427–14449
that continuously strives to be competitive, satisfy customer needs and have a lower environmentalimpact than traditional innovation models” [2]. On the other hand, Wong [12] defined PSS as follows;“Product Service-Systems (PSS) may be defined as a solution offered for sale that involves both aproduct and a service element, to deliver the required functionality”, which was not limited to theenvironmental impact. Although many researchers have since proposed different definitions of PSS,it has generally been considered as “product(s) and service(s) combined in a system to enable newinnovation models aiming to fulfill customer needs” [2,3,13,14].
2.2. Characteristics of PSS
The main characteristics of PSS, in comparison with pure products or services, are threefold. First,firms can improve the level of interaction with their customers through PSS. In terms of customerrelationships, the products, and services offered through PSS play a complementary role in satisfyingthe customers’ requirements. For instance, if a company that sells washing machines also provideslaundry service to its customers, the interaction with customers will be increased because of thecharacteristics of this add-on service. Second, there are a variety of types of payment and ownership ofPSS [15]. This is because PSS is an integrated model of ownable and tangible products and non-ownedand intangible services. Accordingly, most PSS providers have ownership of their PSS and sell theusage rights or results. Tukker [15] suggested three main categories of PSS, including product-orientedservices, use-oriented services, and result-oriented services. In case of use-oriented services andresult-oriented services, the payment reference is not for the product, but a payment per unit time orunit use, and so on. The product stays in ownership with the provider in the above cases, whereasproducts are mainly sold and some extra services are added in product-oriented services. Here, thereis no pre-determined product involved for result-oriented services.
Lastly, stakeholders creating PSS value are very diverse [16,17], including PSS providers andcustomers. A representative example where integrated products and services are provided throughcollaboration among several firms is Apple’s AppStore.
2.3. Types of PSS
The most widely accepted of the proposed PSS types is the work by Tukker [15]. The three maincategories are as follows: product-oriented PSS, use-oriented PSS, and result-oriented PSS. First, theproduct-oriented PSS is the most similar to the concept of the traditional product, since the valueis achieved by selling the product. However, this is accompanied by additional services such asafter-sales services to guarantee the functionality of the product. Second, use-oriented PSS basicallysells the “use” of a product, not the product itself. What is delivered to the customer is a function thatthe customer wants, for example, leasing or sharing services. Finally, result-oriented PSS sells a resultor capability instead of a product. The customer pays only for the provision of agreed results. Sellinglaundered clothes instead of a washing machine is a good example of result-oriented PSS [3,15].
2.4. Research on PSS Development Process
Most studies of the PSS development process have been based on the development processof products or services and consist of three main phases: analysis, idea generation, and selection,and implementation [17]. The first phase, analysis, includes environmental analysis, SWOT analysis,and so on, which has been treated as a small part of PSS development research. Nevertheless, somemethodologies have been developed and employed in the analysis phase. The “Innovation Scan”was developed for analyzing and forecasting the relationship between customer needs and productfunctions [18], while the product-service integrated roadmap was proposed for the strategic planningof product-service integrated offerings [19]. The next phase, idea generation and selection, has beenthe most actively studied. Lee and Kim [20] classified PSS by function and developed PSS ideas usinga combination of products and services. Low et al. [4], Chen and Huang [21], and Chen and Li [22]utilized TRIZ for idea generation. The TRIZ method stands for “Teoriya Resheniya Izobretatelskikh
455
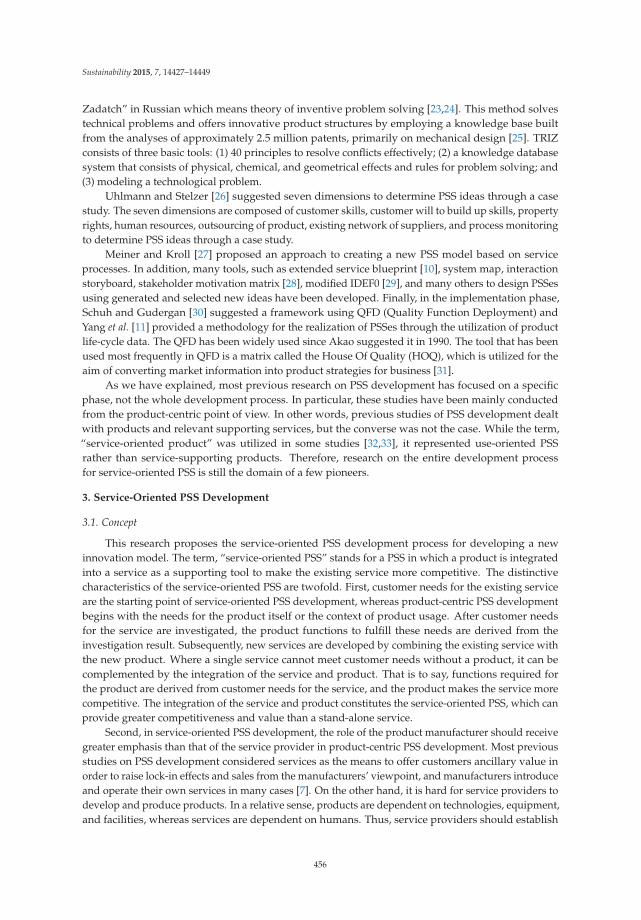
Sustainability 2015, 7, 14427–14449
Zadatch” in Russian which means theory of inventive problem solving [23,24]. This method solvestechnical problems and offers innovative product structures by employing a knowledge base builtfrom the analyses of approximately 2.5 million patents, primarily on mechanical design [25]. TRIZconsists of three basic tools: (1) 40 principles to resolve conflicts effectively; (2) a knowledge databasesystem that consists of physical, chemical, and geometrical effects and rules for problem solving; and(3) modeling a technological problem.
Uhlmann and Stelzer [26] suggested seven dimensions to determine PSS ideas through a casestudy. The seven dimensions are composed of customer skills, customer will to build up skills, propertyrights, human resources, outsourcing of product, existing network of suppliers, and process monitoringto determine PSS ideas through a case study.
Meiner and Kroll [27] proposed an approach to creating a new PSS model based on serviceprocesses. In addition, many tools, such as extended service blueprint [10], system map, interactionstoryboard, stakeholder motivation matrix [28], modified IDEF0 [29], and many others to design PSSesusing generated and selected new ideas have been developed. Finally, in the implementation phase,Schuh and Gudergan [30] suggested a framework using QFD (Quality Function Deployment) andYang et al. [11] provided a methodology for the realization of PSSes through the utilization of productlife-cycle data. The QFD has been widely used since Akao suggested it in 1990. The tool that has beenused most frequently in QFD is a matrix called the House Of Quality (HOQ), which is utilized for theaim of converting market information into product strategies for business [31].
As we have explained, most previous research on PSS development has focused on a specificphase, not the whole development process. In particular, these studies have been mainly conductedfrom the product-centric point of view. In other words, previous studies of PSS development dealtwith products and relevant supporting services, but the converse was not the case. While the term,“service-oriented product” was utilized in some studies [32,33], it represented use-oriented PSSrather than service-supporting products. Therefore, research on the entire development processfor service-oriented PSS is still the domain of a few pioneers.
3. Service-Oriented PSS Development
3.1. Concept
This research proposes the service-oriented PSS development process for developing a newinnovation model. The term, “service-oriented PSS” stands for a PSS in which a product is integratedinto a service as a supporting tool to make the existing service more competitive. The distinctivecharacteristics of the service-oriented PSS are twofold. First, customer needs for the existing serviceare the starting point of service-oriented PSS development, whereas product-centric PSS developmentbegins with the needs for the product itself or the context of product usage. After customer needsfor the service are investigated, the product functions to fulfill these needs are derived from theinvestigation result. Subsequently, new services are developed by combining the existing service withthe new product. Where a single service cannot meet customer needs without a product, it can becomplemented by the integration of the service and product. That is to say, functions required forthe product are derived from customer needs for the service, and the product makes the service morecompetitive. The integration of the service and product constitutes the service-oriented PSS, which canprovide greater competitiveness and value than a stand-alone service.
Second, in service-oriented PSS development, the role of the product manufacturer should receivegreater emphasis than that of the service provider in product-centric PSS development. Most previousstudies on PSS development considered services as the means to offer customers ancillary value inorder to raise lock-in effects and sales from the manufacturers’ viewpoint, and manufacturers introduceand operate their own services in many cases [7]. On the other hand, it is hard for service providers todevelop and produce products. In a relative sense, products are dependent on technologies, equipment,and facilities, whereas services are dependent on humans. Thus, service providers should establish
456
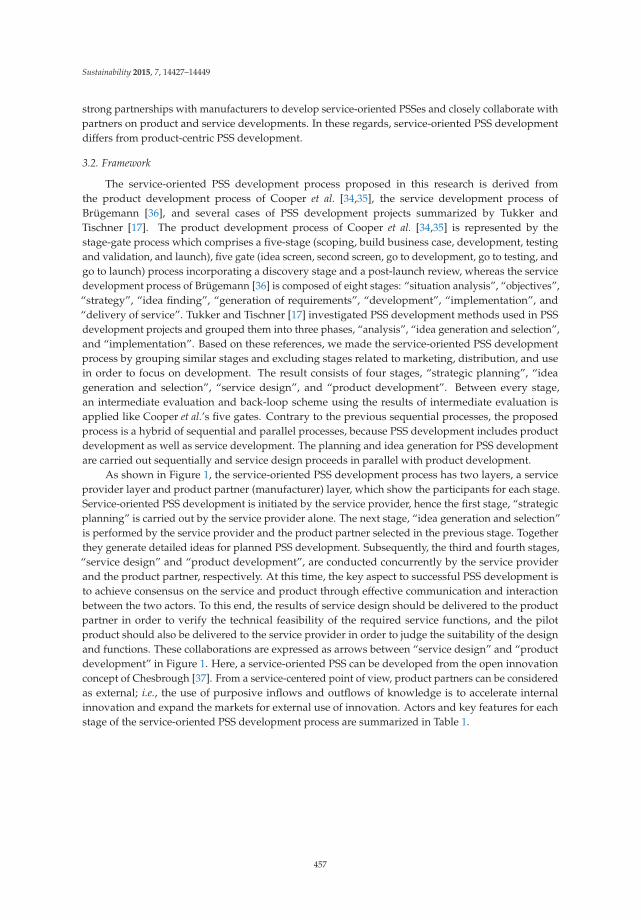
Sustainability 2015, 7, 14427–14449
strong partnerships with manufacturers to develop service-oriented PSSes and closely collaborate withpartners on product and service developments. In these regards, service-oriented PSS developmentdiffers from product-centric PSS development.
3.2. Framework
The service-oriented PSS development process proposed in this research is derived fromthe product development process of Cooper et al. [34,35], the service development process ofBrügemann [36], and several cases of PSS development projects summarized by Tukker andTischner [17]. The product development process of Cooper et al. [34,35] is represented by thestage-gate process which comprises a five-stage (scoping, build business case, development, testingand validation, and launch), five gate (idea screen, second screen, go to development, go to testing, andgo to launch) process incorporating a discovery stage and a post-launch review, whereas the servicedevelopment process of Brügemann [36] is composed of eight stages: “situation analysis”, “objectives”,“strategy”, “idea finding”, “generation of requirements”, “development”, “implementation”, and“delivery of service”. Tukker and Tischner [17] investigated PSS development methods used in PSSdevelopment projects and grouped them into three phases, “analysis”, “idea generation and selection”,and “implementation”. Based on these references, we made the service-oriented PSS developmentprocess by grouping similar stages and excluding stages related to marketing, distribution, and usein order to focus on development. The result consists of four stages, “strategic planning”, “ideageneration and selection”, “service design”, and “product development”. Between every stage,an intermediate evaluation and back-loop scheme using the results of intermediate evaluation isapplied like Cooper et al.’s five gates. Contrary to the previous sequential processes, the proposedprocess is a hybrid of sequential and parallel processes, because PSS development includes productdevelopment as well as service development. The planning and idea generation for PSS developmentare carried out sequentially and service design proceeds in parallel with product development.
As shown in Figure 1, the service-oriented PSS development process has two layers, a serviceprovider layer and product partner (manufacturer) layer, which show the participants for each stage.Service-oriented PSS development is initiated by the service provider, hence the first stage, “strategicplanning” is carried out by the service provider alone. The next stage, “idea generation and selection”is performed by the service provider and the product partner selected in the previous stage. Togetherthey generate detailed ideas for planned PSS development. Subsequently, the third and fourth stages,“service design” and “product development”, are conducted concurrently by the service providerand the product partner, respectively. At this time, the key aspect to successful PSS development isto achieve consensus on the service and product through effective communication and interactionbetween the two actors. To this end, the results of service design should be delivered to the productpartner in order to verify the technical feasibility of the required service functions, and the pilotproduct should also be delivered to the service provider in order to judge the suitability of the designand functions. These collaborations are expressed as arrows between “service design” and “productdevelopment” in Figure 1. Here, a service-oriented PSS can be developed from the open innovationconcept of Chesbrough [37]. From a service-centered point of view, product partners can be consideredas external; i.e., the use of purposive inflows and outflows of knowledge is to accelerate internalinnovation and expand the markets for external use of innovation. Actors and key features for eachstage of the service-oriented PSS development process are summarized in Table 1.
457
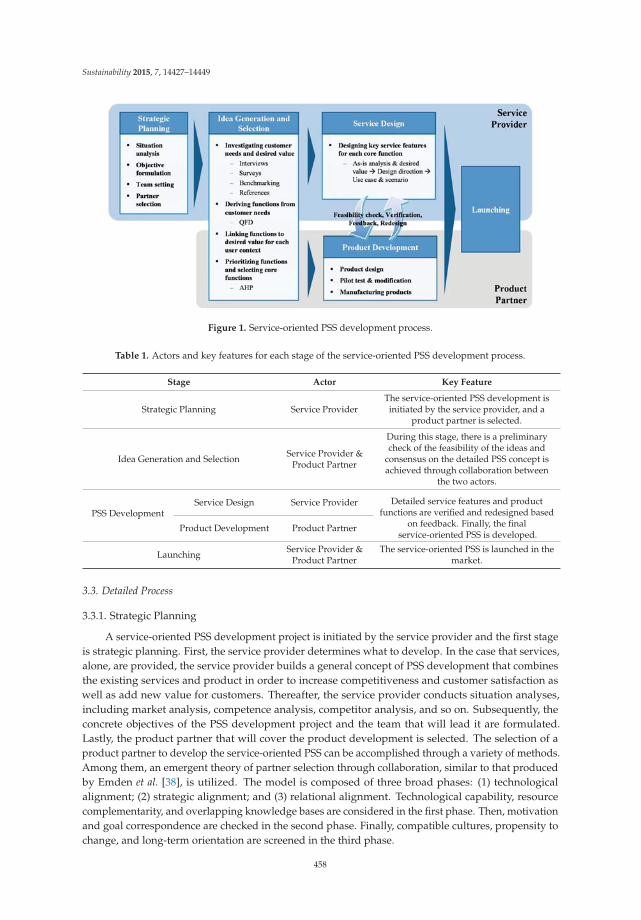
Sustainability 2015, 7, 14427–14449
Figure 1. Service-oriented PSS development process.
Table 1. Actors and key features for each stage of the service-oriented PSS development process.
Stage Actor Key Feature
Strategic Planning Service ProviderThe service-oriented PSS development is
initiated by the service provider, and aproduct partner is selected.
Idea Generation and Selection Service Provider &Product Partner
During this stage, there is a preliminarycheck of the feasibility of the ideas and
consensus on the detailed PSS concept isachieved through collaboration between
the two actors.
PSS DevelopmentService Design Service Provider Detailed service features and product
functions are verified and redesigned basedon feedback. Finally, the final
service-oriented PSS is developed.Product Development Product Partner
Launching Service Provider &Product Partner
The service-oriented PSS is launched in themarket.
3.3. Detailed Process
3.3.1. Strategic Planning
A service-oriented PSS development project is initiated by the service provider and the first stageis strategic planning. First, the service provider determines what to develop. In the case that services,alone, are provided, the service provider builds a general concept of PSS development that combinesthe existing services and product in order to increase competitiveness and customer satisfaction aswell as add new value for customers. Thereafter, the service provider conducts situation analyses,including market analysis, competence analysis, competitor analysis, and so on. Subsequently, theconcrete objectives of the PSS development project and the team that will lead it are formulated.Lastly, the product partner that will cover the product development is selected. The selection of aproduct partner to develop the service-oriented PSS can be accomplished through a variety of methods.Among them, an emergent theory of partner selection through collaboration, similar to that producedby Emden et al. [38], is utilized. The model is composed of three broad phases: (1) technologicalalignment; (2) strategic alignment; and (3) relational alignment. Technological capability, resourcecomplementarity, and overlapping knowledge bases are considered in the first phase. Then, motivationand goal correspondence are checked in the second phase. Finally, compatible cultures, propensity tochange, and long-term orientation are screened in the third phase.
458
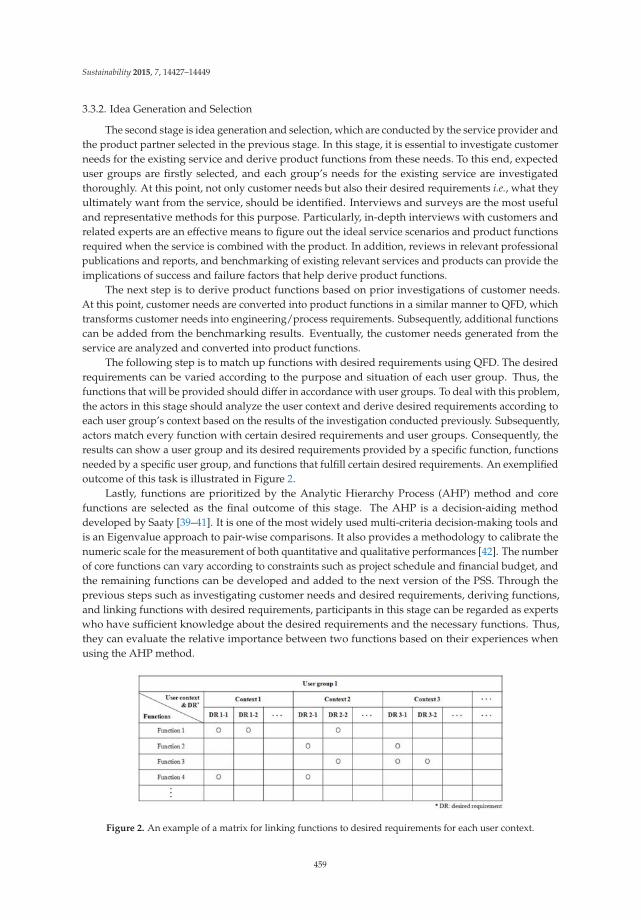
Sustainability 2015, 7, 14427–14449
3.3.2. Idea Generation and Selection
The second stage is idea generation and selection, which are conducted by the service provider andthe product partner selected in the previous stage. In this stage, it is essential to investigate customerneeds for the existing service and derive product functions from these needs. To this end, expecteduser groups are firstly selected, and each group’s needs for the existing service are investigatedthoroughly. At this point, not only customer needs but also their desired requirements i.e., what theyultimately want from the service, should be identified. Interviews and surveys are the most usefuland representative methods for this purpose. Particularly, in-depth interviews with customers andrelated experts are an effective means to figure out the ideal service scenarios and product functionsrequired when the service is combined with the product. In addition, reviews in relevant professionalpublications and reports, and benchmarking of existing relevant services and products can provide theimplications of success and failure factors that help derive product functions.
The next step is to derive product functions based on prior investigations of customer needs.At this point, customer needs are converted into product functions in a similar manner to QFD, whichtransforms customer needs into engineering/process requirements. Subsequently, additional functionscan be added from the benchmarking results. Eventually, the customer needs generated from theservice are analyzed and converted into product functions.
The following step is to match up functions with desired requirements using QFD. The desiredrequirements can be varied according to the purpose and situation of each user group. Thus, thefunctions that will be provided should differ in accordance with user groups. To deal with this problem,the actors in this stage should analyze the user context and derive desired requirements according toeach user group’s context based on the results of the investigation conducted previously. Subsequently,actors match every function with certain desired requirements and user groups. Consequently, theresults can show a user group and its desired requirements provided by a specific function, functionsneeded by a specific user group, and functions that fulfill certain desired requirements. An exemplifiedoutcome of this task is illustrated in Figure 2.
Lastly, functions are prioritized by the Analytic Hierarchy Process (AHP) method and corefunctions are selected as the final outcome of this stage. The AHP is a decision-aiding methoddeveloped by Saaty [39–41]. It is one of the most widely used multi-criteria decision-making tools andis an Eigenvalue approach to pair-wise comparisons. It also provides a methodology to calibrate thenumeric scale for the measurement of both quantitative and qualitative performances [42]. The numberof core functions can vary according to constraints such as project schedule and financial budget, andthe remaining functions can be developed and added to the next version of the PSS. Through theprevious steps such as investigating customer needs and desired requirements, deriving functions,and linking functions with desired requirements, participants in this stage can be regarded as expertswho have sufficient knowledge about the desired requirements and the necessary functions. Thus,they can evaluate the relative importance between two functions based on their experiences whenusing the AHP method.
Figure 2. An example of a matrix for linking functions to desired requirements for each user context.
459
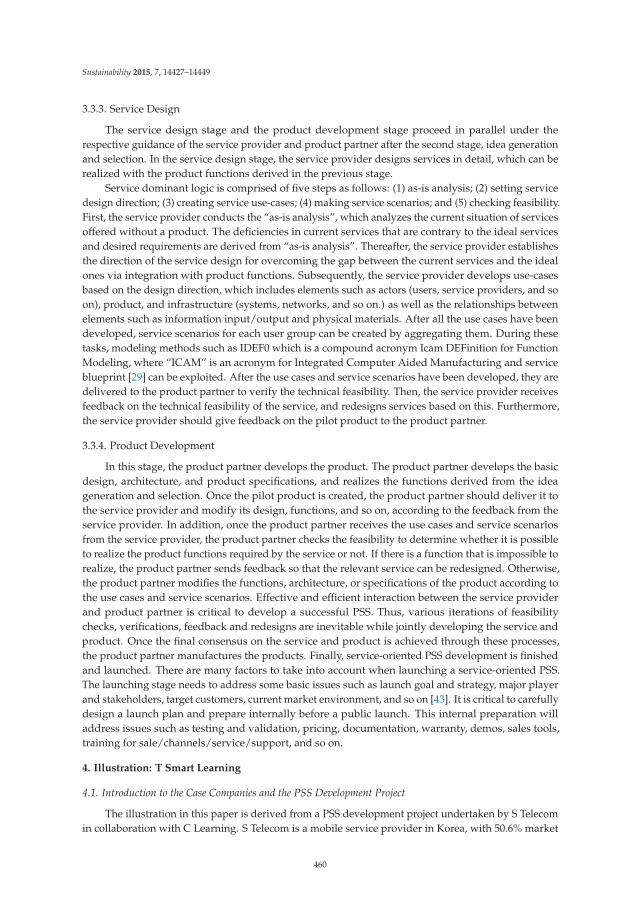
Sustainability 2015, 7, 14427–14449
3.3.3. Service Design
The service design stage and the product development stage proceed in parallel under therespective guidance of the service provider and product partner after the second stage, idea generationand selection. In the service design stage, the service provider designs services in detail, which can berealized with the product functions derived in the previous stage.
Service dominant logic is comprised of five steps as follows: (1) as-is analysis; (2) setting servicedesign direction; (3) creating service use-cases; (4) making service scenarios; and (5) checking feasibility.First, the service provider conducts the “as-is analysis”, which analyzes the current situation of servicesoffered without a product. The deficiencies in current services that are contrary to the ideal servicesand desired requirements are derived from “as-is analysis”. Thereafter, the service provider establishesthe direction of the service design for overcoming the gap between the current services and the idealones via integration with product functions. Subsequently, the service provider develops use-casesbased on the design direction, which includes elements such as actors (users, service providers, and soon), product, and infrastructure (systems, networks, and so on.) as well as the relationships betweenelements such as information input/output and physical materials. After all the use cases have beendeveloped, service scenarios for each user group can be created by aggregating them. During thesetasks, modeling methods such as IDEF0 which is a compound acronym Icam DEFinition for FunctionModeling, where “ICAM” is an acronym for Integrated Computer Aided Manufacturing and serviceblueprint [29] can be exploited. After the use cases and service scenarios have been developed, they aredelivered to the product partner to verify the technical feasibility. Then, the service provider receivesfeedback on the technical feasibility of the service, and redesigns services based on this. Furthermore,the service provider should give feedback on the pilot product to the product partner.
3.3.4. Product Development
In this stage, the product partner develops the product. The product partner develops the basicdesign, architecture, and product specifications, and realizes the functions derived from the ideageneration and selection. Once the pilot product is created, the product partner should deliver it tothe service provider and modify its design, functions, and so on, according to the feedback from theservice provider. In addition, once the product partner receives the use cases and service scenariosfrom the service provider, the product partner checks the feasibility to determine whether it is possibleto realize the product functions required by the service or not. If there is a function that is impossible torealize, the product partner sends feedback so that the relevant service can be redesigned. Otherwise,the product partner modifies the functions, architecture, or specifications of the product according tothe use cases and service scenarios. Effective and efficient interaction between the service providerand product partner is critical to develop a successful PSS. Thus, various iterations of feasibilitychecks, verifications, feedback and redesigns are inevitable while jointly developing the service andproduct. Once the final consensus on the service and product is achieved through these processes,the product partner manufactures the products. Finally, service-oriented PSS development is finishedand launched. There are many factors to take into account when launching a service-oriented PSS.The launching stage needs to address some basic issues such as launch goal and strategy, major playerand stakeholders, target customers, current market environment, and so on [43]. It is critical to carefullydesign a launch plan and prepare internally before a public launch. This internal preparation willaddress issues such as testing and validation, pricing, documentation, warranty, demos, sales tools,training for sale/channels/service/support, and so on.
4. Illustration: T Smart Learning
4.1. Introduction to the Case Companies and the PSS Development Project
The illustration in this paper is derived from a PSS development project undertaken by S Telecomin collaboration with C Learning. S Telecom is a mobile service provider in Korea, with 50.6% market
460
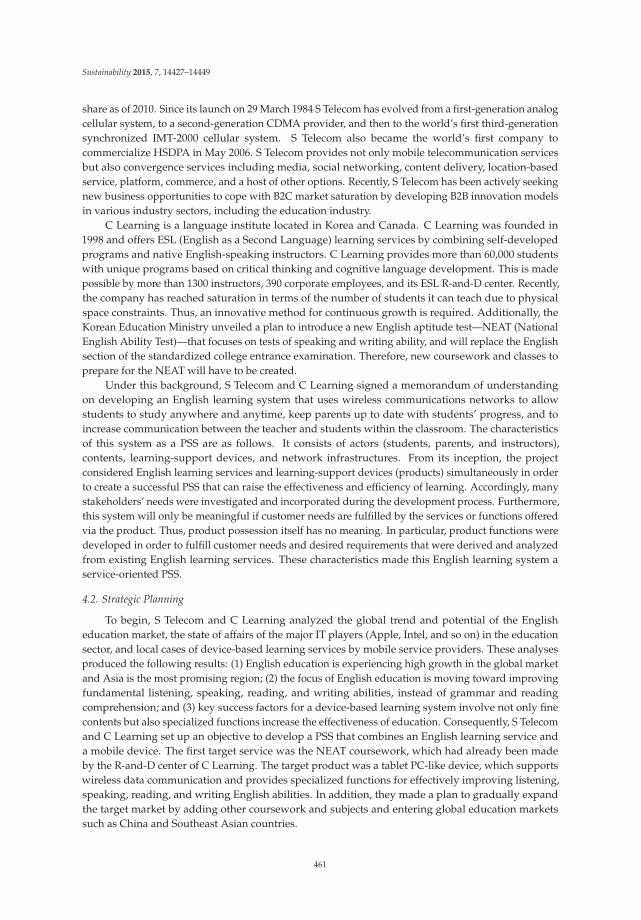
Sustainability 2015, 7, 14427–14449
share as of 2010. Since its launch on 29 March 1984 S Telecom has evolved from a first-generation analogcellular system, to a second-generation CDMA provider, and then to the world’s first third-generationsynchronized IMT-2000 cellular system. S Telecom also became the world’s first company tocommercialize HSDPA in May 2006. S Telecom provides not only mobile telecommunication servicesbut also convergence services including media, social networking, content delivery, location-basedservice, platform, commerce, and a host of other options. Recently, S Telecom has been actively seekingnew business opportunities to cope with B2C market saturation by developing B2B innovation modelsin various industry sectors, including the education industry.
C Learning is a language institute located in Korea and Canada. C Learning was founded in1998 and offers ESL (English as a Second Language) learning services by combining self-developedprograms and native English-speaking instructors. C Learning provides more than 60,000 studentswith unique programs based on critical thinking and cognitive language development. This is madepossible by more than 1300 instructors, 390 corporate employees, and its ESL R-and-D center. Recently,the company has reached saturation in terms of the number of students it can teach due to physicalspace constraints. Thus, an innovative method for continuous growth is required. Additionally, theKorean Education Ministry unveiled a plan to introduce a new English aptitude test—NEAT (NationalEnglish Ability Test)—that focuses on tests of speaking and writing ability, and will replace the Englishsection of the standardized college entrance examination. Therefore, new coursework and classes toprepare for the NEAT will have to be created.
Under this background, S Telecom and C Learning signed a memorandum of understandingon developing an English learning system that uses wireless communications networks to allowstudents to study anywhere and anytime, keep parents up to date with students’ progress, and toincrease communication between the teacher and students within the classroom. The characteristicsof this system as a PSS are as follows. It consists of actors (students, parents, and instructors),contents, learning-support devices, and network infrastructures. From its inception, the projectconsidered English learning services and learning-support devices (products) simultaneously in orderto create a successful PSS that can raise the effectiveness and efficiency of learning. Accordingly, manystakeholders’ needs were investigated and incorporated during the development process. Furthermore,this system will only be meaningful if customer needs are fulfilled by the services or functions offeredvia the product. Thus, product possession itself has no meaning. In particular, product functions weredeveloped in order to fulfill customer needs and desired requirements that were derived and analyzedfrom existing English learning services. These characteristics made this English learning system aservice-oriented PSS.
4.2. Strategic Planning
To begin, S Telecom and C Learning analyzed the global trend and potential of the Englisheducation market, the state of affairs of the major IT players (Apple, Intel, and so on) in the educationsector, and local cases of device-based learning services by mobile service providers. These analysesproduced the following results: (1) English education is experiencing high growth in the global marketand Asia is the most promising region; (2) the focus of English education is moving toward improvingfundamental listening, speaking, reading, and writing abilities, instead of grammar and readingcomprehension; and (3) key success factors for a device-based learning system involve not only finecontents but also specialized functions increase the effectiveness of education. Consequently, S Telecomand C Learning set up an objective to develop a PSS that combines an English learning service anda mobile device. The first target service was the NEAT coursework, which had already been madeby the R-and-D center of C Learning. The target product was a tablet PC-like device, which supportswireless data communication and provides specialized functions for effectively improving listening,speaking, reading, and writing English abilities. In addition, they made a plan to gradually expandthe target market by adding other coursework and subjects and entering global education marketssuch as China and Southeast Asian countries.
461
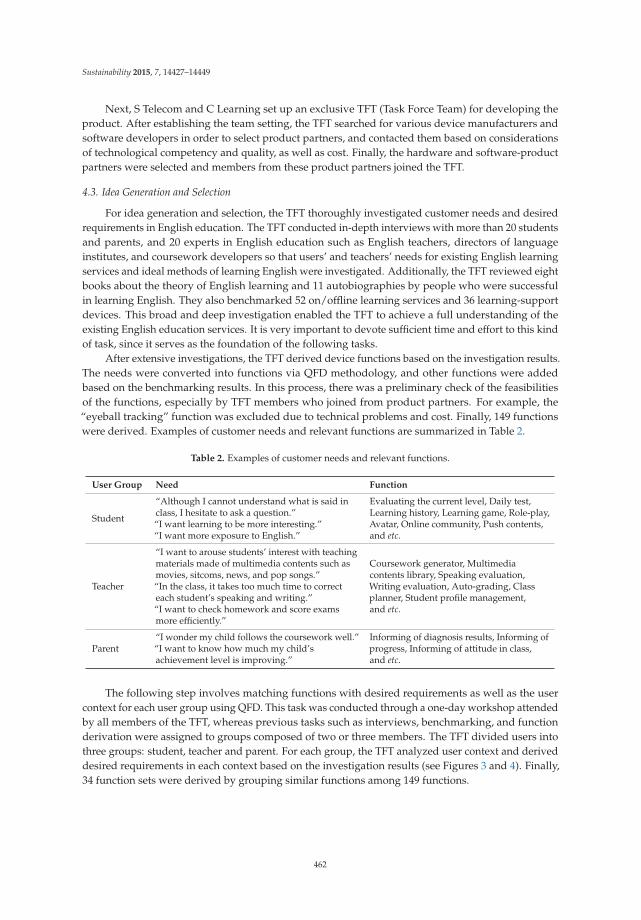
Sustainability 2015, 7, 14427–14449
Next, S Telecom and C Learning set up an exclusive TFT (Task Force Team) for developing theproduct. After establishing the team setting, the TFT searched for various device manufacturers andsoftware developers in order to select product partners, and contacted them based on considerationsof technological competency and quality, as well as cost. Finally, the hardware and software-productpartners were selected and members from these product partners joined the TFT.
4.3. Idea Generation and Selection
For idea generation and selection, the TFT thoroughly investigated customer needs and desiredrequirements in English education. The TFT conducted in-depth interviews with more than 20 studentsand parents, and 20 experts in English education such as English teachers, directors of languageinstitutes, and coursework developers so that users’ and teachers’ needs for existing English learningservices and ideal methods of learning English were investigated. Additionally, the TFT reviewed eightbooks about the theory of English learning and 11 autobiographies by people who were successfulin learning English. They also benchmarked 52 on/offline learning services and 36 learning-supportdevices. This broad and deep investigation enabled the TFT to achieve a full understanding of theexisting English education services. It is very important to devote sufficient time and effort to this kindof task, since it serves as the foundation of the following tasks.
After extensive investigations, the TFT derived device functions based on the investigation results.The needs were converted into functions via QFD methodology, and other functions were addedbased on the benchmarking results. In this process, there was a preliminary check of the feasibilitiesof the functions, especially by TFT members who joined from product partners. For example, the“eyeball tracking” function was excluded due to technical problems and cost. Finally, 149 functionswere derived. Examples of customer needs and relevant functions are summarized in Table 2.
Table 2. Examples of customer needs and relevant functions.
User Group Need Function
Student
“Although I cannot understand what is said inclass, I hesitate to ask a question.”“I want learning to be more interesting.”“I want more exposure to English.”
Evaluating the current level, Daily test,Learning history, Learning game, Role-play,Avatar, Online community, Push contents,and etc.
Teacher
“I want to arouse students’ interest with teachingmaterials made of multimedia contents such asmovies, sitcoms, news, and pop songs.”“In the class, it takes too much time to correcteach student’s speaking and writing.”“I want to check homework and score examsmore efficiently.”
Coursework generator, Multimediacontents library, Speaking evaluation,Writing evaluation, Auto-grading, Classplanner, Student profile management,and etc.
Parent“I wonder my child follows the coursework well.”“I want to know how much my child’sachievement level is improving.”
Informing of diagnosis results, Informing ofprogress, Informing of attitude in class,and etc.
The following step involves matching functions with desired requirements as well as the usercontext for each user group using QFD. This task was conducted through a one-day workshop attendedby all members of the TFT, whereas previous tasks such as interviews, benchmarking, and functionderivation were assigned to groups composed of two or three members. The TFT divided users intothree groups: student, teacher and parent. For each group, the TFT analyzed user context and deriveddesired requirements in each context based on the investigation results (see Figures 3 and 4). Finally,34 function sets were derived by grouping similar functions among 149 functions.
462
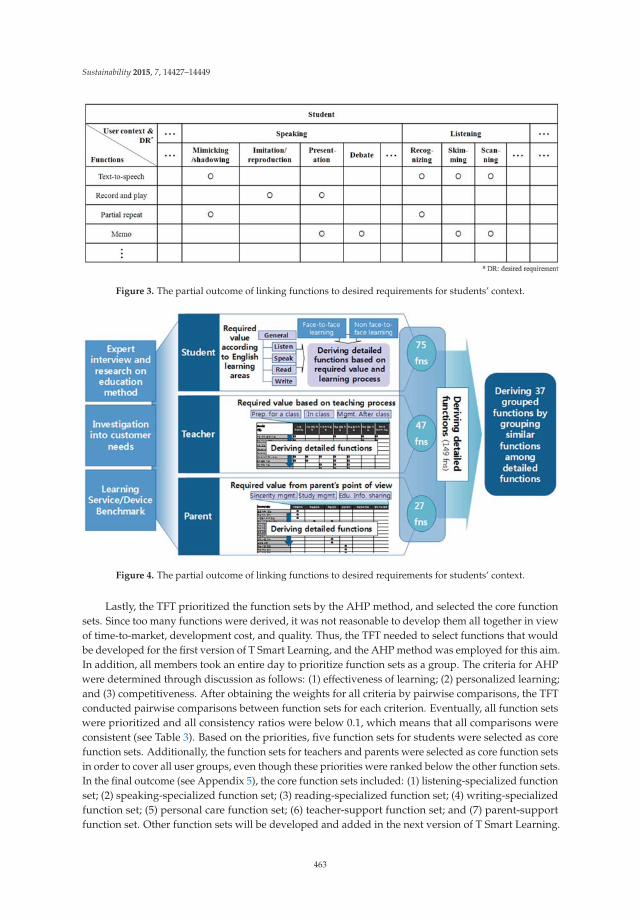
Sustainability 2015, 7, 14427–14449
Figure 3. The partial outcome of linking functions to desired requirements for students’ context.
Figure 4. The partial outcome of linking functions to desired requirements for students’ context.
Lastly, the TFT prioritized the function sets by the AHP method, and selected the core functionsets. Since too many functions were derived, it was not reasonable to develop them all together in viewof time-to-market, development cost, and quality. Thus, the TFT needed to select functions that wouldbe developed for the first version of T Smart Learning, and the AHP method was employed for this aim.In addition, all members took an entire day to prioritize function sets as a group. The criteria for AHPwere determined through discussion as follows: (1) effectiveness of learning; (2) personalized learning;and (3) competitiveness. After obtaining the weights for all criteria by pairwise comparisons, the TFTconducted pairwise comparisons between function sets for each criterion. Eventually, all function setswere prioritized and all consistency ratios were below 0.1, which means that all comparisons wereconsistent (see Table 3). Based on the priorities, five function sets for students were selected as corefunction sets. Additionally, the function sets for teachers and parents were selected as core function setsin order to cover all user groups, even though these priorities were ranked below the other function sets.In the final outcome (see Appendix 5), the core function sets included: (1) listening-specialized functionset; (2) speaking-specialized function set; (3) reading-specialized function set; (4) writing-specializedfunction set; (5) personal care function set; (6) teacher-support function set; and (7) parent-supportfunction set. Other function sets will be developed and added in the next version of T Smart Learning.
463
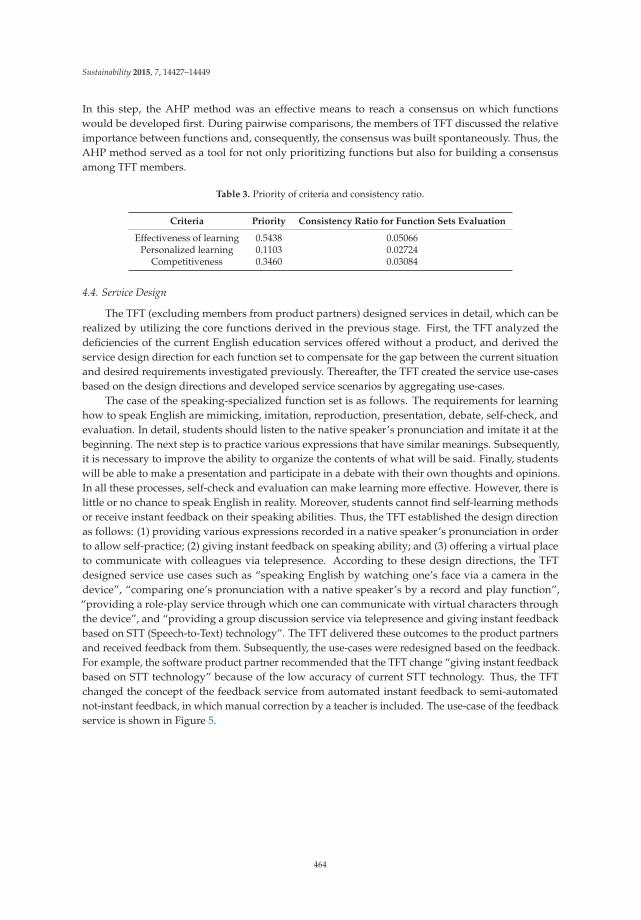
Sustainability 2015, 7, 14427–14449
In this step, the AHP method was an effective means to reach a consensus on which functionswould be developed first. During pairwise comparisons, the members of TFT discussed the relativeimportance between functions and, consequently, the consensus was built spontaneously. Thus, theAHP method served as a tool for not only prioritizing functions but also for building a consensusamong TFT members.
Table 3. Priority of criteria and consistency ratio.
Criteria Priority Consistency Ratio for Function Sets Evaluation
Effectiveness of learning 0.5438 0.05066Personalized learning 0.1103 0.02724
Competitiveness 0.3460 0.03084
4.4. Service Design
The TFT (excluding members from product partners) designed services in detail, which can berealized by utilizing the core functions derived in the previous stage. First, the TFT analyzed thedeficiencies of the current English education services offered without a product, and derived theservice design direction for each function set to compensate for the gap between the current situationand desired requirements investigated previously. Thereafter, the TFT created the service use-casesbased on the design directions and developed service scenarios by aggregating use-cases.
The case of the speaking-specialized function set is as follows. The requirements for learninghow to speak English are mimicking, imitation, reproduction, presentation, debate, self-check, andevaluation. In detail, students should listen to the native speaker’s pronunciation and imitate it at thebeginning. The next step is to practice various expressions that have similar meanings. Subsequently,it is necessary to improve the ability to organize the contents of what will be said. Finally, studentswill be able to make a presentation and participate in a debate with their own thoughts and opinions.In all these processes, self-check and evaluation can make learning more effective. However, there islittle or no chance to speak English in reality. Moreover, students cannot find self-learning methodsor receive instant feedback on their speaking abilities. Thus, the TFT established the design directionas follows: (1) providing various expressions recorded in a native speaker’s pronunciation in orderto allow self-practice; (2) giving instant feedback on speaking ability; and (3) offering a virtual placeto communicate with colleagues via telepresence. According to these design directions, the TFTdesigned service use cases such as “speaking English by watching one’s face via a camera in thedevice”, “comparing one’s pronunciation with a native speaker’s by a record and play function”,“providing a role-play service through which one can communicate with virtual characters throughthe device”, and “providing a group discussion service via telepresence and giving instant feedbackbased on STT (Speech-to-Text) technology”. The TFT delivered these outcomes to the product partnersand received feedback from them. Subsequently, the use-cases were redesigned based on the feedback.For example, the software product partner recommended that the TFT change “giving instant feedbackbased on STT technology” because of the low accuracy of current STT technology. Thus, the TFTchanged the concept of the feedback service from automated instant feedback to semi-automatednot-instant feedback, in which manual correction by a teacher is included. The use-case of the feedbackservice is shown in Figure 5.
464
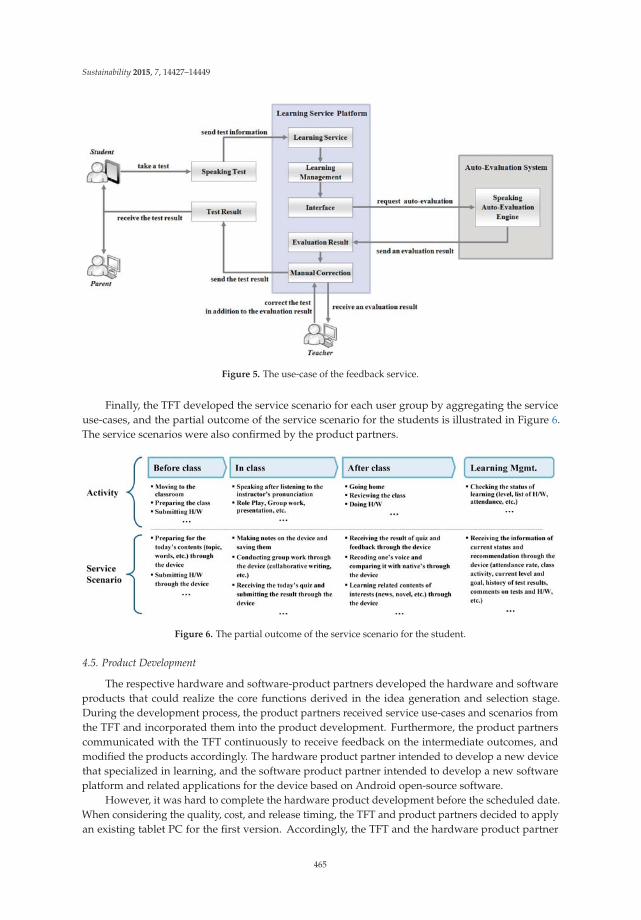
Sustainability 2015, 7, 14427–14449
Figure 5. The use-case of the feedback service.
Finally, the TFT developed the service scenario for each user group by aggregating the serviceuse-cases, and the partial outcome of the service scenario for the students is illustrated in Figure 6.The service scenarios were also confirmed by the product partners.
Figure 6. The partial outcome of the service scenario for the student.
4.5. Product Development
The respective hardware and software-product partners developed the hardware and softwareproducts that could realize the core functions derived in the idea generation and selection stage.During the development process, the product partners received service use-cases and scenarios fromthe TFT and incorporated them into the product development. Furthermore, the product partnerscommunicated with the TFT continuously to receive feedback on the intermediate outcomes, andmodified the products accordingly. The hardware product partner intended to develop a new devicethat specialized in learning, and the software product partner intended to develop a new softwareplatform and related applications for the device based on Android open-source software.
However, it was hard to complete the hardware product development before the scheduled date.When considering the quality, cost, and release timing, the TFT and product partners decided to applyan existing tablet PC for the first version. Accordingly, the TFT and the hardware product partner
465
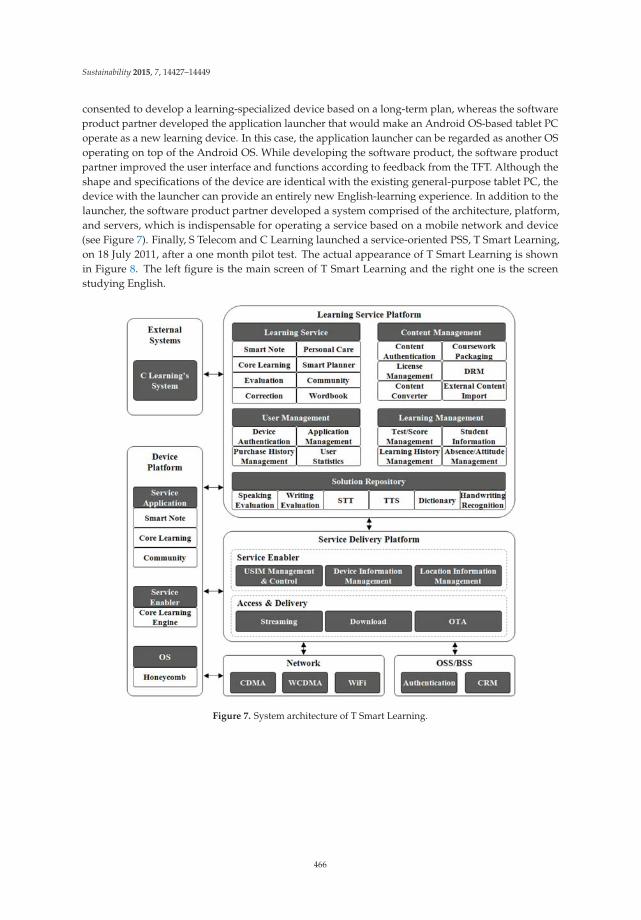
Sustainability 2015, 7, 14427–14449
consented to develop a learning-specialized device based on a long-term plan, whereas the softwareproduct partner developed the application launcher that would make an Android OS-based tablet PCoperate as a new learning device. In this case, the application launcher can be regarded as another OSoperating on top of the Android OS. While developing the software product, the software productpartner improved the user interface and functions according to feedback from the TFT. Although theshape and specifications of the device are identical with the existing general-purpose tablet PC, thedevice with the launcher can provide an entirely new English-learning experience. In addition to thelauncher, the software product partner developed a system comprised of the architecture, platform,and servers, which is indispensable for operating a service based on a mobile network and device(see Figure 7). Finally, S Telecom and C Learning launched a service-oriented PSS, T Smart Learning,on 18 July 2011, after a one month pilot test. The actual appearance of T Smart Learning is shownin Figure 8. The left figure is the main screen of T Smart Learning and the right one is the screenstudying English.
Figure 7. System architecture of T Smart Learning.
466
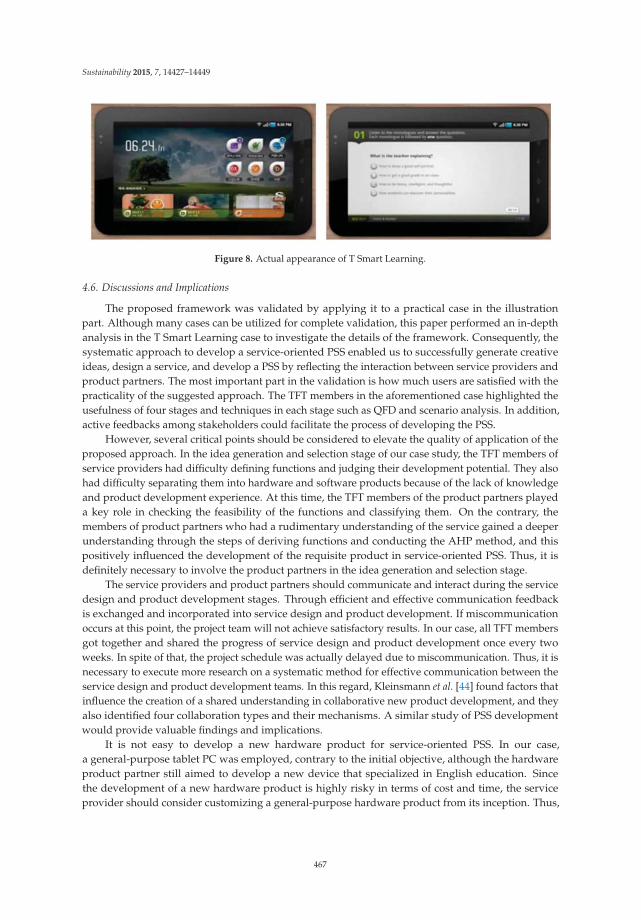
Sustainability 2015, 7, 14427–14449
Figure 8. Actual appearance of T Smart Learning.
4.6. Discussions and Implications
The proposed framework was validated by applying it to a practical case in the illustrationpart. Although many cases can be utilized for complete validation, this paper performed an in-depthanalysis in the T Smart Learning case to investigate the details of the framework. Consequently, thesystematic approach to develop a service-oriented PSS enabled us to successfully generate creativeideas, design a service, and develop a PSS by reflecting the interaction between service providers andproduct partners. The most important part in the validation is how much users are satisfied with thepracticality of the suggested approach. The TFT members in the aforementioned case highlighted theusefulness of four stages and techniques in each stage such as QFD and scenario analysis. In addition,active feedbacks among stakeholders could facilitate the process of developing the PSS.
However, several critical points should be considered to elevate the quality of application of theproposed approach. In the idea generation and selection stage of our case study, the TFT members ofservice providers had difficulty defining functions and judging their development potential. They alsohad difficulty separating them into hardware and software products because of the lack of knowledgeand product development experience. At this time, the TFT members of the product partners playeda key role in checking the feasibility of the functions and classifying them. On the contrary, themembers of product partners who had a rudimentary understanding of the service gained a deeperunderstanding through the steps of deriving functions and conducting the AHP method, and thispositively influenced the development of the requisite product in service-oriented PSS. Thus, it isdefinitely necessary to involve the product partners in the idea generation and selection stage.
The service providers and product partners should communicate and interact during the servicedesign and product development stages. Through efficient and effective communication feedbackis exchanged and incorporated into service design and product development. If miscommunicationoccurs at this point, the project team will not achieve satisfactory results. In our case, all TFT membersgot together and shared the progress of service design and product development once every twoweeks. In spite of that, the project schedule was actually delayed due to miscommunication. Thus, it isnecessary to execute more research on a systematic method for effective communication between theservice design and product development teams. In this regard, Kleinsmann et al. [44] found factors thatinfluence the creation of a shared understanding in collaborative new product development, and theyalso identified four collaboration types and their mechanisms. A similar study of PSS developmentwould provide valuable findings and implications.
It is not easy to develop a new hardware product for service-oriented PSS. In our case,a general-purpose tablet PC was employed, contrary to the initial objective, although the hardwareproduct partner still aimed to develop a new device that specialized in English education. Sincethe development of a new hardware product is highly risky in terms of cost and time, the serviceprovider should consider customizing a general-purpose hardware product from its inception. Thus,
467
Sustainability 2015, 7, 14427–14449
the decision-making step on whether to develop or customize should be included in future researchon the service-oriented PSS development process.
5. Conclusions
This paper proposes a service-oriented PSS development process in which the PSS developmentproject is initiated and led by a service provider from a service-centric point of view. The proposedprocess, which is based on the product development process, service development process, andcases of PSS development projects, consists of four stages: (1) strategic planning; (2) idea generationand selection; (3) service design; and (4) product development. For each stage, actors and detailedprocedures, including key features and useful methods, are suggested. Additionally, the real PSSdevelopment case of an English education service is introduced in detail as a demonstration of theapplication of the proposed process.
The contribution of this paper is that it expands the current scope of PSS research by suggestingthe concept and development process of service-oriented PSS from the service provider’s viewpoint,contrary to the manufacturer’s viewpoint of existing studies. This can establish a foundation forresearch on service-oriented PSS development. Moreover, the proposed process and illustration areexpected to serve as a useful guideline when service providers develop a service-oriented PSS.
However, this paper has some limitations. Firstly, the majority of the proposed process coversqualitative aspects. If more quantitative methods are added to the process, the proposed processcan be made more systematic. Thus, the systematic and quantitative approach to partner selection,idea generation, service design, and collaboration with product partners are future research topics.Secondly, the case presented in this paper covers only specific industry sectors. Numerous casestudies of broad industry sectors can provide us with worthwhile implications for service-orientedPSS development. In particular, cases of proven market success could confirm the validity of theproposed process. Therefore, in-depth case studies of various industries including successful casescould be another line of future research. Thirdly, since this research focuses on the PSS developmentprocess, subsequent processes such as a launching and operating process were not dealt with in thispaper. Unique characteristics of PSS can be reflected to implement the details of the launching andoperating processes. Thus, future research can present a complete framework of service-oriented PSSdevelopment from planning to operation by including the launching and operating process.
Acknowledgments: This work was supported by the National Research Foundation of Korea Grant funded bythe Korean Government (NRF-2014R1A1A2054892).
Author Contributions: Seungkyum Kim designed the study, outlined the methodology, analyzed the data,interpreted the results and wrote the manuscript. Changho Son analyzed the data and wrote the manuscript.Byungun Yoon designed the study and wrote the manuscript. Yongtae Park implemented the research, designedthe study, outlined the methodology, and helped complete the draft of this research. All authors have read andapproved the final manuscript.
Conflicts of Interest: The authors declare no conflict of interest.
468
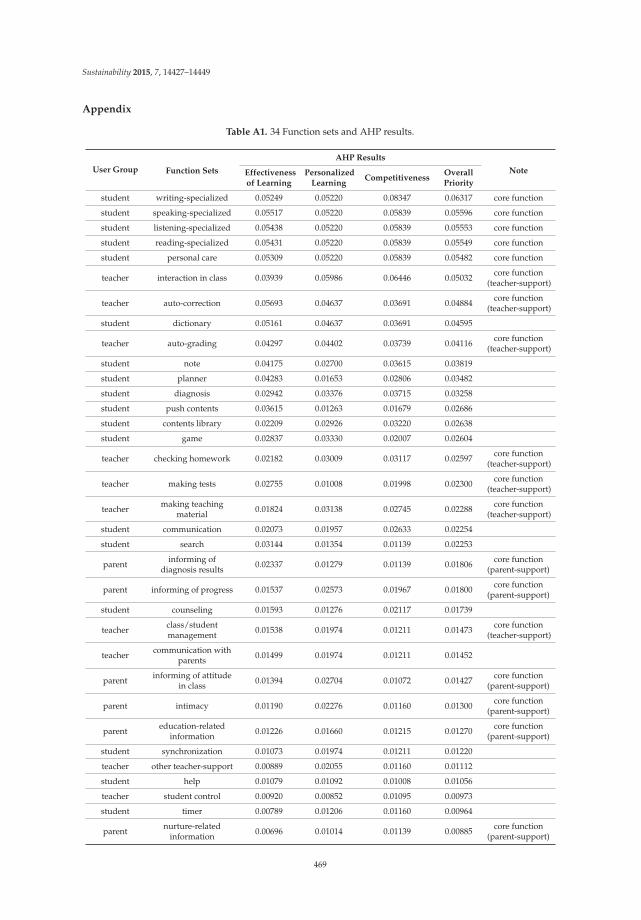
Sustainability 2015, 7, 14427–14449
Appendix
Table A1. 34 Function sets and AHP results.
User Group Function Sets
AHP Results
NoteEffectivenessof Learning
PersonalizedLearning
CompetitivenessOverallPriority
student writing-specialized 0.05249 0.05220 0.08347 0.06317 core function
student speaking-specialized 0.05517 0.05220 0.05839 0.05596 core function
student listening-specialized 0.05438 0.05220 0.05839 0.05553 core function
student reading-specialized 0.05431 0.05220 0.05839 0.05549 core function
student personal care 0.05309 0.05220 0.05839 0.05482 core function
teacher interaction in class 0.03939 0.05986 0.06446 0.05032 core function(teacher-support)
teacher auto-correction 0.05693 0.04637 0.03691 0.04884 core function(teacher-support)
student dictionary 0.05161 0.04637 0.03691 0.04595
teacher auto-grading 0.04297 0.04402 0.03739 0.04116 core function(teacher-support)
student note 0.04175 0.02700 0.03615 0.03819
student planner 0.04283 0.01653 0.02806 0.03482
student diagnosis 0.02942 0.03376 0.03715 0.03258
student push contents 0.03615 0.01263 0.01679 0.02686
student contents library 0.02209 0.02926 0.03220 0.02638
student game 0.02837 0.03330 0.02007 0.02604
teacher checking homework 0.02182 0.03009 0.03117 0.02597 core function(teacher-support)
teacher making tests 0.02755 0.01008 0.01998 0.02300 core function(teacher-support)
teacher making teachingmaterial 0.01824 0.03138 0.02745 0.02288 core function
(teacher-support)
student communication 0.02073 0.01957 0.02633 0.02254
student search 0.03144 0.01354 0.01139 0.02253
parent informing ofdiagnosis results 0.02337 0.01279 0.01139 0.01806 core function
(parent-support)
parent informing of progress 0.01537 0.02573 0.01967 0.01800 core function(parent-support)
student counseling 0.01593 0.01276 0.02117 0.01739
teacher class/studentmanagement 0.01538 0.01974 0.01211 0.01473 core function
(teacher-support)
teacher communication withparents 0.01499 0.01974 0.01211 0.01452
parent informing of attitudein class 0.01394 0.02704 0.01072 0.01427 core function
(parent-support)
parent intimacy 0.01190 0.02276 0.01160 0.01300 core function(parent-support)
parent education-relatedinformation 0.01226 0.01660 0.01215 0.01270 core function
(parent-support)
student synchronization 0.01073 0.01974 0.01211 0.01220
teacher other teacher-support 0.00889 0.02055 0.01160 0.01112
student help 0.01079 0.01092 0.01008 0.01056
teacher student control 0.00920 0.00852 0.01095 0.00973
student timer 0.00789 0.01206 0.01160 0.00964
parent nurture-relatedinformation 0.00696 0.01014 0.01139 0.00885 core function
(parent-support)
469
Sustainability 2015, 7, 14427–14449
References
1. Martinez, V.; Bastl, M.; Kingston, J.; Evans, S. Challenges in transforming manufacturing organizations intoproduct-service providers. J. Manuf. Technol. Manag. 2010, 21, 449–469.
2. Goedkoop, M.J.; van Halen, C.J.G.; te Riele, H.R.M.; Rommens, P.J.M. Product Service Systems, Ecological andEconomic Basis; Technical Report; Pre Consultants: Amersfoort, The Netherlands, 1999.
3. Baines, T.S.; Lightfoot, H.W.; Evans, S.; Neely, A.; Greenough, R.; Peppard, J.; Roy, R.; Shehab, E.; Braganza, A.;Tiwari, A.; et al. State-of-the-art in product-service systems. Proc. Inst. Mech. Eng. Part B 2007, 221, 1543–1552.[CrossRef]
4. Low, M.K.; Lamvik, T.; Walsh, K.; Myklebust, O. Manufacturing a green service: Engaging the TRIZ modelof innovation. IEEE Trans. Electron. Packag. Manuf. 2001, 24, 10–17.
5. Alonso-Rasgado, T.; Thompson, G. A rapid design process for Total Care Product creation. J. Eng. Des. 2006,17, 509–531. [CrossRef]
6. Aurich, J.C.; Fuchs, C.; Wagenknecht, C. Life cycle oriented design of technical Product-Service Systems.J. Clean. Prod. 2006, 14, 1480–1494. [CrossRef]
7. Tan, A.R.; McAloone, T.C.; Gall, C. Product/service-system development—An explorative case study in amanufacturing company. In Proceedings of the International Conference on Engineering Design 2007, Paris,France, 28–31 August 2007.
8. Uchihira, N.; Kyoya, Y.; Kim, S.; Maeda, K.; Ozawa, M.; Ishii, K. Analysis and Design Methodology forRecognizing Opportunities and Difficulties for Product-based Services. In Proceedings of the PICMET 2007,Portland, OR, USA, 5–9 August 2007.
9. Sakao, T.; Sandström, G.Ö.; Matzen, D. Framing research for service orientation of manufacturers throughPSS approaches. J. Manuf. Technol. Manag. 2009, 20, 754–778.
10. Shimomura, Y.; Hara, T.; Arai, T. A unified representation scheme for effective PSS development.CIRP Ann.-Manuf. Technol. 2009, 58, 379–382. [CrossRef]
11. Yang, X.; Moore, P.; Pu, J.; Wong, C. A practical methodology for realizing product service systems forconsumer products. Comput. Ind. Eng. 2009, 56, 224–235. [CrossRef]
12. Wong, M. Implementation of innovative product service-systems in the consumer goods industry.Ph.D. Thesis, University of Cambridge, Department of Engineering, Cambridge, UK, 2004.
13. Mont, O. Clarifying the concept of product-service system. J. Clean. Prod. 2002, 10, 237–245. [CrossRef]14. Manzini, E.; Vezzoli, C. A strategic design approach to develop sustainable product service systems:
Examples taken from the “environmentally friendly innovation” Italian prize. J. Clean. Prod. 2003, 11,851–857. [CrossRef]
15. Tukker, A. Eight types of product service system: Eight ways to sustainability experiences from SusProNet.Bus. Strateg. Environ. 2004, 13, 246–260. [CrossRef]
16. Krucken, L.; Meroni, A. Building stakeholder networks to develop and deliver product-service-systems:Practical experiences on elaborating pro-active materials for communication. J. Clean. Prod. 2006, 14,1502–1508. [CrossRef]
17. Tukker, A.; Tischner, U. New Business for Old Europe: Product-Service Development, Competitiveness andSustainability; Greenleaf Publishing: Sheffield, UK, 2006.
18. Tukker, A.; van Halen, C. Innovation Scan for Product Service Systems: Manual; TNO: Delft, The Netherlands;PricewaterhouseCoopers: Utrecht, The Netherlands, 2003.
19. Suh, J.; Park, S. Service-oriented Technology Roadmap (SoTRM) using patent map for R&D strategy ofservice industry. Expert Syst. Appl. 2009, 36, 6754–6772.
20. Lee, S.; Kim, Y. A product-service system design method integrating service function and service activityand case studies. In Proceedings of the 2nd CIRP IPS2 Conference, Linköping, Sweden, 14–15 April 2010.
21. Chen, J.; Huang, C. A TRIZ based eco-innovation method for PSS. In Proceedings of the 16th CIRPInternational Conference on Life Cycle Engineering, LCE 2009, Cairo, Egypt, 4–6 May 2009.
22. Chen, J.; Li, H. Innovative design method of product service system by using case study and TRIZ model.In Proceedings of the 2nd CIRP IPS2 Conference, Linköping, Sweden, 14–15 April 2010.
23. Genrich, A.; Shulyak, L. And Suddenly the Inventor Appeared: TRIZ, the Theory of Inventive Problem Solving;Technical Innovation Center, Inc.: Worcester, UK, 1996.
470
Sustainability 2015, 7, 14427–14449
24. Domb, E. QFD and TIPS/TRIZ. Available online: http://www.trizjournal.com/archives/1998/06/c/index.htm (accessed on 23 October 2015).
25. Yamashina, H.; Ito, T.; Kawada, H. Innovative product development process by integrating QFD and TRIZ.Int. J. Prod. Res. 2002, 40, 1031–1050. [CrossRef]
26. Uhlmann, E.; Stelzer, C. Identifiaction of the IPS2 business model in the early stage of creation. In Proceedingsof the 2nd CIRP IPS2 Conference, Linköping, Sweden, 14–15 April 2010.
27. Meier, H.; Kroll, M. From products to solutions-IPS2 as a means for creating customer value. In Proceedingsof the 16th CIRP International Conference on Life Cycle Engineering, LCE 2009, Cairo, Egypt, 4–6 May 2009.
28. Manzini, E.; Collina, L.; Evans, S. Solution Oriented Partnership: How to Design Industrialised SustainableSolutions; Cranfield University: Cranfield, UK, 2004.
29. Morelli, N. Developing new product service systems (PSS): Methodologies and operational tools. J. Clean.Prod. 2006, 14, 145–1501. [CrossRef]
30. Schuh, G.; Gudergan, G. Service engineering as an approach to designing industrial product servicesystems. In Proceedings of the 1st CIRP Industrial Product-Service Systems (IPS2) Conference, Cranfield,UK, 1–2 April 2009.
31. Hauser, J.R.; Clausing, D. The house of quality. Harvard Business Review, May 1988; 63–73.32. Umeda, Y.; Tsutsumida, M.; Tomiyama, T.; Tamura, T.; Fujimoto, J. Study on feasibility of service-oriented
products using life cycle simulation. J. Jpn. Soc. Des. Eng. 2001, 36, 517–526.33. Fujimoto, J.; Umeda, Y.; Tamura, T.; Tomiyama, T.; Kimura, F. Development of service-oriented products
based on the inverse manufacturing concept. Environ. Sci. Technol. 2003, 37, 5398–5406. [CrossRef] [PubMed]34. Cooper, R.G.; Edgett, S.J.; Kleinschmidt, E.J. Optimizing the stage-gate process: What best-practice companies
do—I. Res. Technol. Manag. 2002, 45, 21–27.35. Cooper, R.G.; Edgett, S.J.; Kleinschmidt, E.J. Optimizing the stage-gate process: What best-practice companies
do—II. Res. Technol. Manag. 2002, 45, 43–49.36. Brügemann, L.M. Innovation of an Eco-efficient Product-Service Combination. Master’s thesis, Delft
University of Technology, Delft, The Netherlands, 2000.37. Chesbrough, H. Open innovation: Where we’ve been and where we’re going. Res. Technol. Manag. 2012, 55,
20–27. [CrossRef]38. Emden, Z.; Calantone, R.J.; Droge, C. Collaborating for new product development: Selecting the partner
with maximum potential to create value. J. Prod. Innov. Manag. 2006, 23, 330–341. [CrossRef]39. Saaty, T.L. The Analytic (Hierarchy) Process; McGraw-Hill: New York, NY, USA, 1980.40. Saaty, T.L. Decision making for leaders. IEEE Trans. Syst. Man Cybern. 1985, 15, 450–452. [CrossRef]41. Saaty, T.L. How to make a decision: The analytic hierarchy process. Eur. J. Oper. Res. 1990, 48, 9–26.
[CrossRef]42. Vaidya, O.S.; Kumar, S. Analytic hierarchy process: An overview of applications. Eur. J. Oper. Res. 2006, 169,
1–29. [CrossRef]43. Soni, A.; Cohen, H. Successfully launching your product: Getting it right. Handb. Bus. Strateg. 2004, 5,
263–268. [CrossRef]44. Kleinsmann, M.; Buijs, J.; Valkenburg, R. Understanding the complexity of knowledge integration in
collaborative new product development teams: A case study. J. Eng. Technol. Manag. 2010, 27, 20–32.[CrossRef]
© 2015 by the authors. Licensee MDPI, Basel, Switzerland. This article is an open accessarticle distributed under the terms and conditions of the Creative Commons Attribution(CC BY) license (http://creativecommons.org/licenses/by/4.0/).
471
sustainability
Review
Designing the Business Models for CircularEconomy—Towards the Conceptual Framework
Mateusz Lewandowski
Institute of Public Affairs, Faculty of Management and Social Communication, Jagiellonian University,Lojasiewicza 4, Krakow 31-348, Poland; [email protected]; Tel.: +48-12-664-5642;Fax: +48-12-664-5859
Academic Editor: Adam JabłonskiReceived: 12 November 2015; Accepted: 30 December 2015; Published: 18 January 2016
Abstract: Switching from the current linear model of economy to a circular one has recently attractedincreased attention from major global companies e.g., Google, Unilever, Renault, and policymakersattending the World Economic Forum. The reasons for this are the huge financial, social andenvironmental benefits. However, the global shift from one model of economy to another alsoconcerns smaller companies on a micro-level. Thus, comprehensive knowledge on designing circularbusiness models is needed to stimulate and foster implementation of the circular economy. Existingbusiness models for the circular economy have limited transferability and there is no comprehensiveframework supporting every kind of company in designing a circular business model. This studyemploys a literature review to identify and classify the circular economy characteristics accordingto a business model structure. The investigation in the eight sub-domains of research on circularbusiness models was used to redefine the components of the business model canvas in the contextof the circular economy. Two new components—the take-back system and adoption factors—havebeen identified, thereby leading to the conceptualization of an extended framework for the circularbusiness model canvas. Additionally, the triple fit challenge has been recognized as an enabler of thetransition towards a circular business model. Some directions for further research have been outlined,as well.
Keywords: business models; circular economy; circular business model; sustainable business model;business model design
1. Introduction
Switching from the current linear model of economy to a circular one would not only bring savingsof hundreds of billions US dollars to the EU alone, but also significantly reduce the negative impact onthe natural environment [1,2]. This is why the circular economy (CE) has attracted increased attentionas one of the most powerful and most recent moves towards sustainability [3,4]. The transitionto the circular economy entails four fundamental building blocks—materials and product design,new business models, global reverse networks, and enabling conditions [5]. Switching an economyto a circular one depends, on the one hand, on policymakers and their decisions [6]; on the otherhand, it depends on introducing circularity into their business models by business entities [7]. Thescope of interest of this study is limited to the latter, micro-level perspective of designing circularbusiness models.
Comprehensive knowledge on designing circular business models is needed to stimulate andfoster implementation of the circular economy on a micro-level. Existing knowledge provides severalwell-elaborated and verified frameworks of business models, design patterns and tools to build abusiness model [8,9]. Although many case studies revealed several types of circular business actionsor models [4,7], these models have limited transferability. There are very few studies covering, in
Sustainability 2016, 8, 43; doi:10.3390/su8010043 www.mdpi.com/journal/sustainability472
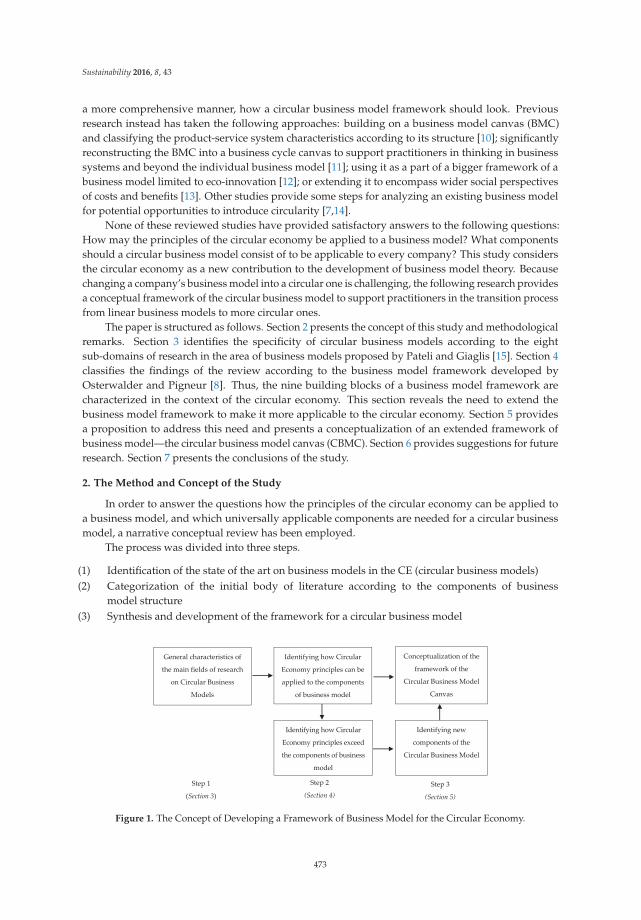
Sustainability 2016, 8, 43
a more comprehensive manner, how a circular business model framework should look. Previousresearch instead has taken the following approaches: building on a business model canvas (BMC)and classifying the product-service system characteristics according to its structure [10]; significantlyreconstructing the BMC into a business cycle canvas to support practitioners in thinking in businesssystems and beyond the individual business model [11]; using it as a part of a bigger framework of abusiness model limited to eco-innovation [12]; or extending it to encompass wider social perspectivesof costs and benefits [13]. Other studies provide some steps for analyzing an existing business modelfor potential opportunities to introduce circularity [7,14].
None of these reviewed studies have provided satisfactory answers to the following questions:How may the principles of the circular economy be applied to a business model? What componentsshould a circular business model consist of to be applicable to every company? This study considersthe circular economy as a new contribution to the development of business model theory. Becausechanging a company’s business model into a circular one is challenging, the following research providesa conceptual framework of the circular business model to support practitioners in the transition processfrom linear business models to more circular ones.
The paper is structured as follows. Section 2 presents the concept of this study and methodologicalremarks. Section 3 identifies the specificity of circular business models according to the eightsub-domains of research in the area of business models proposed by Pateli and Giaglis [15]. Section 4classifies the findings of the review according to the business model framework developed byOsterwalder and Pigneur [8]. Thus, the nine building blocks of a business model framework arecharacterized in the context of the circular economy. This section reveals the need to extend thebusiness model framework to make it more applicable to the circular economy. Section 5 providesa proposition to address this need and presents a conceptualization of an extended framework ofbusiness model—the circular business model canvas (CBMC). Section 6 provides suggestions for futureresearch. Section 7 presents the conclusions of the study.
2. The Method and Concept of the Study
In order to answer the questions how the principles of the circular economy can be applied toa business model, and which universally applicable components are needed for a circular businessmodel, a narrative conceptual review has been employed.
The process was divided into three steps.
(1) Identification of the state of the art on business models in the CE (circular business models)(2) Categorization of the initial body of literature according to the components of business
model structure(3) Synthesis and development of the framework for a circular business model
General characteristics of
the main fields of research
on Circular Business
Models
Conceptualization of the
framework of the
Circular Business Model
Canvas
Step 1
(Section 3) Step 2
(Section 4) Step 3
(Section 5)
Identifying how Circular
Economy principles can be
applied to the components
of business model
Identifying how Circular
Economy principles exceed
the components of business
model
Identifying new
components of the
Circular Business Model
Figure 1. The Concept of Developing a Framework of Business Model for the Circular Economy.
473
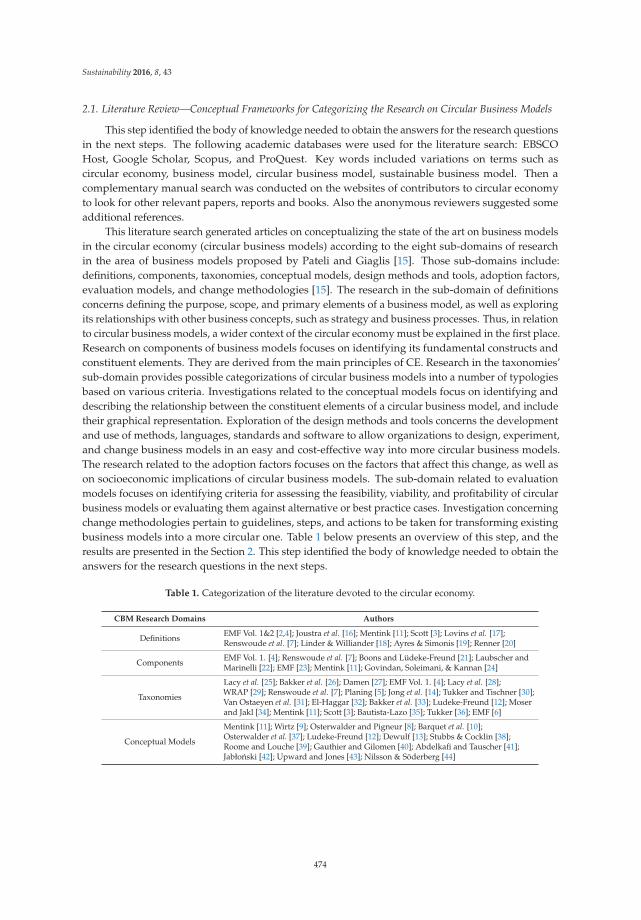
Sustainability 2016, 8, 43
2.1. Literature Review—Conceptual Frameworks for Categorizing the Research on Circular Business Models
This step identified the body of knowledge needed to obtain the answers for the research questionsin the next steps. The following academic databases were used for the literature search: EBSCOHost, Google Scholar, Scopus, and ProQuest. Key words included variations on terms such ascircular economy, business model, circular business model, sustainable business model. Then acomplementary manual search was conducted on the websites of contributors to circular economyto look for other relevant papers, reports and books. Also the anonymous reviewers suggested someadditional references.
This literature search generated articles on conceptualizing the state of the art on business modelsin the circular economy (circular business models) according to the eight sub-domains of researchin the area of business models proposed by Pateli and Giaglis [15]. Those sub-domains include:definitions, components, taxonomies, conceptual models, design methods and tools, adoption factors,evaluation models, and change methodologies [15]. The research in the sub-domain of definitionsconcerns defining the purpose, scope, and primary elements of a business model, as well as exploringits relationships with other business concepts, such as strategy and business processes. Thus, in relationto circular business models, a wider context of the circular economy must be explained in the first place.Research on components of business models focuses on identifying its fundamental constructs andconstituent elements. They are derived from the main principles of CE. Research in the taxonomies’sub-domain provides possible categorizations of circular business models into a number of typologiesbased on various criteria. Investigations related to the conceptual models focus on identifying anddescribing the relationship between the constituent elements of a circular business model, and includetheir graphical representation. Exploration of the design methods and tools concerns the developmentand use of methods, languages, standards and software to allow organizations to design, experiment,and change business models in an easy and cost-effective way into more circular business models.The research related to the adoption factors focuses on the factors that affect this change, as well ason socioeconomic implications of circular business models. The sub-domain related to evaluationmodels focuses on identifying criteria for assessing the feasibility, viability, and profitability of circularbusiness models or evaluating them against alternative or best practice cases. Investigation concerningchange methodologies pertain to guidelines, steps, and actions to be taken for transforming existingbusiness models into a more circular one. Table 1 below presents an overview of this step, and theresults are presented in the Section 2. This step identified the body of knowledge needed to obtain theanswers for the research questions in the next steps.
Table 1. Categorization of the literature devoted to the circular economy.
CBM Research Domains Authors
Definitions EMF Vol. 1&2 [2,4]; Joustra et al. [16]; Mentink [11]; Scott [3]; Lovins et al. [17];Renswoude et al. [7]; Linder & Williander [18]; Ayres & Simonis [19]; Renner [20]
Components EMF Vol. 1. [4]; Renswoude et al. [7]; Boons and Lüdeke-Freund [21]; Laubscher andMarinelli [22]; EMF [23]; Mentink [11]; Govindan, Soleimani, & Kannan [24]
Taxonomies
Lacy et al. [25]; Bakker et al. [26]; Damen [27]; EMF Vol. 1. [4]; Lacy et al. [28];WRAP [29]; Renswoude et al. [7]; Planing [5]; Jong et al. [14]; Tukker and Tischner [30];Van Ostaeyen et al. [31]; El-Haggar [32]; Bakker et al. [33]; Ludeke-Freund [12]; Moserand Jakl [34]; Mentink [11]; Scott [3]; Bautista-Lazo [35]; Tukker [36]; EMF [6]
Conceptual Models
Mentink [11]; Wirtz [9]; Osterwalder and Pigneur [8]; Barquet et al. [10];Osterwalder et al. [37]; Ludeke-Freund [12]; Dewulf [13]; Stubbs & Cocklin [38];Roome and Louche [39]; Gauthier and Gilomen [40]; Abdelkafi and Tauscher [41];Jabłonski [42]; Upward and Jones [43]; Nilsson & Söderberg [44]
474
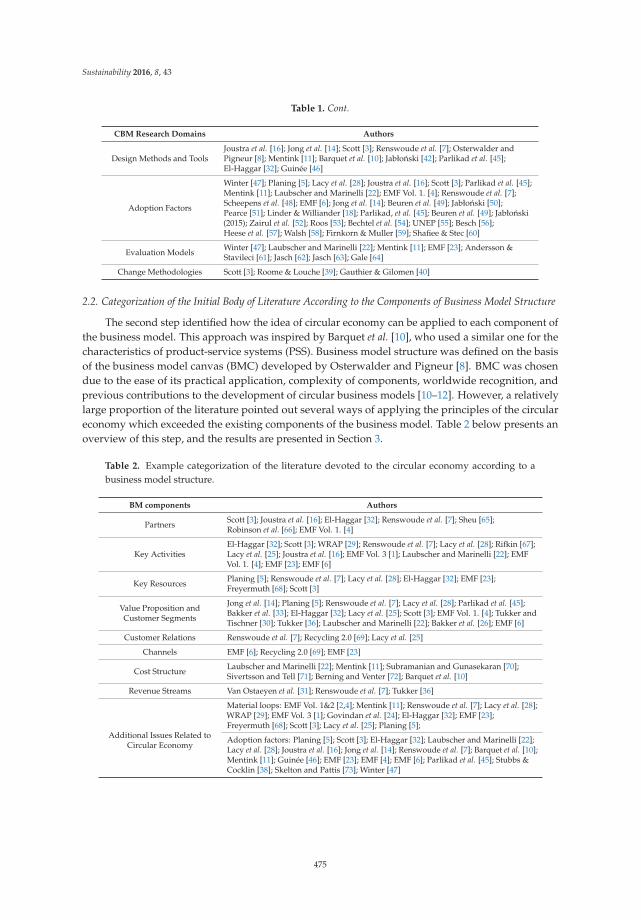
Sustainability 2016, 8, 43
Table 1. Cont.
CBM Research Domains Authors
Design Methods and ToolsJoustra et al. [16]; Jong et al. [14]; Scott [3]; Renswoude et al. [7]; Osterwalder andPigneur [8]; Mentink [11]; Barquet et al. [10]; Jabłonski [42]; Parlikad et al. [45];El-Haggar [32]; Guinée [46]
Adoption Factors
Winter [47]; Planing [5]; Lacy et al. [28]; Joustra et al. [16]; Scott [3]; Parlikad et al. [45];Mentink [11]; Laubscher and Marinelli [22]; EMF Vol. 1. [4]; Renswoude et al. [7];Scheepens et al. [48]; EMF [6]; Jong et al. [14]; Beuren et al. [49]; Jabłonski [50];Pearce [51]; Linder & Williander [18]; Parlikad, et al. [45]; Beuren et al. [49]; Jabłonski(2015); Zairul et al. [52]; Roos [53]; Bechtel et al. [54]; UNEP [55]; Besch [56];Heese et al. [57]; Walsh [58]; Firnkorn & Muller [59]; Shafiee & Stec [60]
Evaluation Models Winter [47]; Laubscher and Marinelli [22]; Mentink [11]; EMF [23]; Andersson &Stavileci [61]; Jasch [62]; Jasch [63]; Gale [64]
Change Methodologies Scott [3]; Roome & Louche [39]; Gauthier & Gilomen [40]
2.2. Categorization of the Initial Body of Literature According to the Components of Business Model Structure
The second step identified how the idea of circular economy can be applied to each component ofthe business model. This approach was inspired by Barquet et al. [10], who used a similar one for thecharacteristics of product-service systems (PSS). Business model structure was defined on the basisof the business model canvas (BMC) developed by Osterwalder and Pigneur [8]. BMC was chosendue to the ease of its practical application, complexity of components, worldwide recognition, andprevious contributions to the development of circular business models [10–12]. However, a relativelylarge proportion of the literature pointed out several ways of applying the principles of the circulareconomy which exceeded the existing components of the business model. Table 2 below presents anoverview of this step, and the results are presented in Section 3.
Table 2. Example categorization of the literature devoted to the circular economy according to abusiness model structure.
BM components Authors
Partners Scott [3]; Joustra et al. [16]; El-Haggar [32]; Renswoude et al. [7]; Sheu [65];Robinson et al. [66]; EMF Vol. 1. [4]
Key ActivitiesEl-Haggar [32]; Scott [3]; WRAP [29]; Renswoude et al. [7]; Lacy et al. [28]; Rifkin [67];Lacy et al. [25]; Joustra et al. [16]; EMF Vol. 3 [1]; Laubscher and Marinelli [22]; EMFVol. 1. [4]; EMF [23]; EMF [6]
Key Resources Planing [5]; Renswoude et al. [7]; Lacy et al. [28]; El-Haggar [32]; EMF [23];Freyermuth [68]; Scott [3]
Value Proposition andCustomer Segments
Jong et al. [14]; Planing [5]; Renswoude et al. [7]; Lacy et al. [28]; Parlikad et al. [45];Bakker et al. [33]; El-Haggar [32]; Lacy et al. [25]; Scott [3]; EMF Vol. 1. [4]; Tukker andTischner [30]; Tukker [36]; Laubscher and Marinelli [22]; Bakker et al. [26]; EMF [6]
Customer Relations Renswoude et al. [7]; Recycling 2.0 [69]; Lacy et al. [25]
Channels EMF [6]; Recycling 2.0 [69]; EMF [23]
Cost Structure Laubscher and Marinelli [22]; Mentink [11]; Subramanian and Gunasekaran [70];Sivertsson and Tell [71]; Berning and Venter [72]; Barquet et al. [10]
Revenue Streams Van Ostaeyen et al. [31]; Renswoude et al. [7]; Tukker [36]
Additional Issues Related toCircular Economy
Material loops: EMF Vol. 1&2 [2,4]; Mentink [11]; Renswoude et al. [7]; Lacy et al. [28];WRAP [29]; EMF Vol. 3 [1]; Govindan et al. [24]; El-Haggar [32]; EMF [23];Freyermuth [68]; Scott [3]; Lacy et al. [25]; Planing [5];
Adoption factors: Planing [5]; Scott [3]; El-Haggar [32]; Laubscher and Marinelli [22];Lacy et al. [28]; Joustra et al. [16]; Jong et al. [14]; Renswoude et al. [7]; Barquet et al. [10];Mentink [11]; Guinée [46]; EMF [23]; EMF [4]; EMF [6]; Parlikad et al. [45]; Stubbs &Cocklin [38]; Skelton and Pattis [73]; Winter [47]
475
Sustainability 2016, 8, 43
2.3. Synthesis and Development of the Framework of Circular Business Model
Pursuing better answers to the research questions resulted in undertaking step 3. This stepsynthesizes how the circular economy principles apply to each component of the business model, andproposes the new components of the circular business model. These components pertain to the waysin which the CE principles exceeded the popular business model framework. Additionally, advantagesand disadvantages of the new framework were outlined. These results are presented in the Section 4.
3. Research on Circular Business Models—The Review
3.1. Definitions
Although it is a contemporary movement, the circular economy is based on old ideas [74]; it isthus reasonable to outline its specificity. This includes the definitions, the origins of the movement,and its main principles. CE was probably first defined and conceptualized in the Ellen MacArthurFoundations report, as “an industrial system that is restorative or regenerative by intention anddesign” [4]. This means pursuing and creating the opportunities for a shift from an “end-of-life”concept to Cradle-to-Cradle™, from using unrenewable energy towards using renewable, from usingtoxic chemicals to their elimination, from much waste to eliminating waste through the superior designof materials, products, systems, and also business models [4]. The circular economy becomes a newvision of the treatment of resources, energy, value creation and entrepreneurship [16].
Linder and Williander [18] define a circular business model as “a business model in which theconceptual logic for value creation is based on utilizing the economic value retained in products after use in theproduction of new offerings” (p. 2). Mentink [11] defines CE as “an economic system with closed materialloops,” and a circular business model as “the rationale of how an organization creates, delivers and capturesvalue with and within closed material loops” (p. 35). He argues that circular business models do notnecessarily aim to balance ecological, social and ecological needs, in contrast to business models,although at the same time they can serve sustainability goals [11]. However, another approach isalso supported in the literature. Most recently, Scott [3] provided a useful conceptualization of CEin relation to sustainability. He argues for understanding the circular economy as “a concept used todescribe a zero-waste industrial economy that profits from two types of material inputs: (1) biological materialsare those that can be reintroduced back into the biosphere in a restorative manner without harm or waste (i.e:they breakdown naturally); and, (2) technical materials, which can be continuously re-used without harm orwaste” (p. 6). In turn, he defines sustainability as the capacity to continue into the long term and, at thesame time, as a mechanism that enables the circular economy to work [3].
The general concept underlying the circular economy has been developed by many schools ofthought, such as Regenerative Design, Performance Economy, Cradle to Cradle, Industrial Ecology,Biomimicry, Blue Economy, Permaculture, Natural Capitalism, Industrial Metabolism and IndustrialSymbiosis [2,4,17,19,20]. Those schools of thought are complementary to each other and provided thefoundation for the main principles of this new approach to economy [2,4,7,16]:
(1) Design out waste/Design for reuse(2) Build resilience through diversity(3) Rely on energy from renewable sources(4) Think in systems(5) Waste is food/Think in cascades/Share values (symbiosis)
This variety of concepts supports Scott’s [3] approach to the relation between sustainability andcircular economy.
3.2. Components
The fundamental constructs and constituent elements of circular business models can be derivedfrom the main principles of the circular economy. In the literature, such components are understood and
476
Sustainability 2016, 8, 43
defined variously, for instance: the ReSOLVE (regenerate, share, optimize, loop, virtualize, exchange)framework [4,23], ways of circular value creation [7], normative requirements for business models [21],and areas for integration [22].
There are six business actions to implement the principles of the circular economy andwhich represent major circular business opportunities depicted by the ReSOLVE framework [23].Regenerate signifies the shift to renewable energy and materials. It is related to returning recoveredbiological resources to the biosphere. Thus it aims to reclaim, retain, and regenerate the health ofecosystems. Share actions aim at maximizing utilization of products by sharing them among users.It may be realized through peer-to-peer sharing of private products or public sharing of a pool ofproducts. Sharing means also reusing products as long as they are technically acceptable to use(e.g., second-hand), and prolonging their life through maintenance, repair, and design-enhancingdurability. Optimise actions are focused on increasing the performance/efficiency of a product andremoving waste in the production process and in the supply chain. They may also be related toleveraging big data, automation, remote sensing, and steering. What is important is that optimizationdoes not require changing the product or the technology. Loop actions aim at keeping componentsand materials in closed loops. The higher priority is given to inner loops. Virtualize actions assume todeliver particular utility virtually instead of materially. Exchange actions are focused on replacing oldmaterials with advanced non-renewable materials and/or with applying new technologies (e.g., 3Dprinting). It may also be related to choosing new products and services [23].
Renswoude et al. [7] identify similar ways of circular value creation, pertaining to the short cycle,where products and services are maintained, repaired and adjusted, to the long cycle which extendsthe lifetime of existing products and processes, to cascades based on creating new combinationsof resources and material components and purchasing upcycled waste streams, to pure circles inwhich resources and materials are 100% reused, to dematerialized services offered instead of physicalproducts and to production on demand.
Other studies identified four normative requirements for business models for sustainableinnovation, grounded in wider concepts such as sustainable development [21]. The first is a valueproposition reflecting the balance of economic, ecological and social needs. The second is a supplychain engaging suppliers into sustainable supply chain management (materials cycles). The third is acustomer interface, motivating customers to take responsibility for their consumption. The fourth is afinancial model, mainly reflecting an appropriate distribution of economic costs and benefits amongactors involved in the business model [21]. Boons and Lüdeke-Freund [21] (p. 13) also noticed thatcomparable conceptual notions of sustainable business models did not exist.
Mentink [11] (p. 34) used a similar approach to the business model as Frankenberger et al. [75],and outlined the changes of business model components needed for developing a more circular servicemodel, such as:
‚ value propositions (what?)—products should become fully reused or recycled, which requiresreverse logistics systems, or firms should turn towards product-service system (PSS) and sellperformance related to serviced products
‚ activities, processes, resources and capabilities (how?)—products have to be made in specificprocesses, with recycled materials and specific resources, which may require not only specificcapabilities but also creating reverse logistics systems and maintaining relationships with othercompanies and customers to assure closing of material loops
‚ revenue models (why?)—selling product-based services charged according to their use‚ customers or customer interfaces (who?)—selling “circular” products or services may require prior
changes of customer habits or, if this is not possible, even changes of customers
Laubscher and Marinelli [22] identified six key areas for integration of the circular economyprinciples with the business model:
477
Sustainability 2016, 8, 43
(1) Sales model—a shift from selling volumes of products towards selling services and retrievingproducts after first life from customers
(2) Product design/material composition—the change concerns the way products are designed andengineered to maximize high quality reuse of product, its components and materials
(3) IT/data management—in order to enable resource optimization a key competence is required,which is the ability to keep track of products, components and material data
(4) Supply loops—turning towards the maximization of the recovery of own assets where profitableand to maximization of the use of recycled materials/used components in order to gain additionalvalue from product, component and material flows
(5) Strategic sourcing for own operations—building trusted partnerships and long-term relationshipswith suppliers and customers, including co-creation
(6) HR/incentives—a shift needs adequate culture adaptation and development of capabilities,enhanced by training programs and rewards
One of the most important components of circular business models is the reversed supply-chainlogistics. A comprehensive review on this subject has been done by Govindan, Soleimani, andKannan [24].
3.3. Taxonomies
In the literature, there are several propositions of how to categorize business models. Most ofthem are very similar and use the criterion of the source of value creation (e.g., [4,7,25]). Few authorsproposed other criteria, such as sources of value in a product-service systems [5,14,30], before-the-eventtechniques of cleaner production [32], design strategies for product life extension [33], cycle ofproduct/component/material circulation in material loops [5], or mixed criteria [12]. However, thetypologies are somewhat overlapping, and the distinction criteria are sometimes blurred. An overviewof the circular business models, systematized according to the ReSOLVE framework, is presented inTable 3.
478
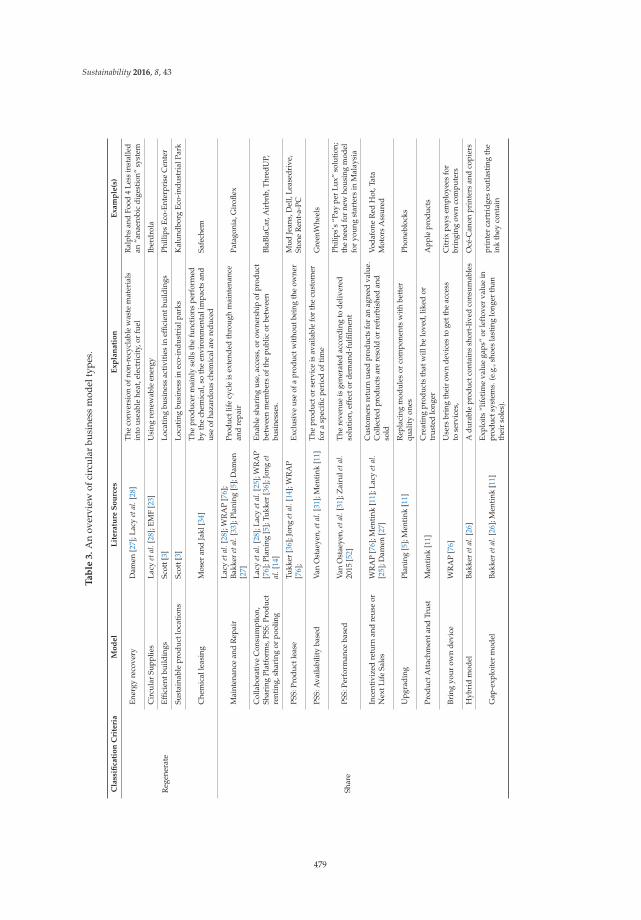
Sustainability 2016, 8, 43
Ta
ble
3.
An
over
view
ofci
rcul
arbu
sine
ssm
odel
type
s.
Cla
ssifi
cati
on
Cri
teri
aM
od
el
Lit
era
ture
So
urc
es
Exp
lan
ati
on
Exam
ple
(s)
Reg
ener
ate
Ener
gyre
cove
ryD
amen
[27]
;Lac
yet
al.[
28]
The
conv
ersi
onof
non-
recy
clab
lew
aste
mat
eria
lsin
tous
eabl
ehe
at,e
lect
rici
ty,o
rfu
elR
alph
san
dFo
od4
Less
inst
alle
dan
“ana
erob
icdi
gest
ion”
syst
em
Cir
cula
rSu
pplie
sLa
cyet
al.[
28];
EMF
[23]
Usi
ngre
new
able
ener
gyIb
erdr
ola
Effic
ient
build
ings
Scot
t[3]
Loca
ting
busi
ness
acti
viti
esin
effic
ient
build
ings
Phill
ips
Eco-
Ente
rpri
seC
ente
r
Sust
aina
ble
prod
uctl
ocat
ions
Scot
t[3]
Loca
ting
busi
ness
inec
o-in
dust
rial
park
sK
alun
dbor
gEc
o-in
dust
rial
Park
Che
mic
alle
asin
gM
oser
and
Jakl
[34]
The
prod
ucer
mai
nly
sells
the
func
tion
spe
rfor
med
byth
ech
emic
al,s
oth
een
viro
nmen
tali
mpa
cts
and
use
ofha
zard
ous
chem
ical
are
redu
ced
Safe
chem
Shar
e
Mai
nten
ance
and
Rep
air
Lacy
etal
.[28
];W
RA
P[7
6];
Bakk
eret
al.[
33];
Plan
ing
[5];
Dam
en[2
7]
Prod
uctl
ife
cycl
eis
exte
nded
thro
ugh
mai
nten
ance
and
repa
irPa
tago
nia,
Gir
oflex
Col
labo
rati
veC
onsu
mpt
ion,
Shar
ing
Plat
form
s,PS
S:Pr
oduc
tre
ntin
g,sh
arin
gor
pool
ing
Lacy
etal
.[28
];La
cyet
al.[
25];
WR
AP
[76]
;Pla
ning
[5];
Tukk
er[3
6];J
ong
etal
.[14
]
Enab
lesh
arin
gus
e,ac
cess
,or
owne
rshi
pof
prod
uct
betw
een
mem
bers
ofth
epu
blic
orbe
twee
nbu
sine
sses
.Bl
aBla
Car
,Air
bnb,
Thr
edU
P,
PSS:
Prod
uctl
ease
Tukk
er[3
6];J
ong
etal
.[14
];W
RA
P[7
6];
Excl
usiv
eus
eof
apr
oduc
twit
hout
bein
gth
eow
ner
Mud
Jean
s,D
ell,
Leas
edri
ve,
Ston
eR
ent-
a-PC
PSS:
Ava
ilabi
lity
base
dV
anO
stae
yen,
etal
.[31
];M
entin
k[1
1]Th
epr
oduc
tor
serv
ice
isav
aila
ble
for
the
cust
omer
for
asp
ecifi
cpe
riod
ofti
me
Gre
enW
heel
s
PSS:
Perf
orm
ance
base
dV
anO
stae
yen,
etal
.[31
];Z
airu
leta
l.20
15[5
2]Th
ere
venu
eis
gene
rate
dac
cord
ing
tode
liver
edso
luti
on,e
ffec
tor
dem
and-
fulfi
lmen
t
Phili
ps’s
“Pay
per
Lux”
solu
tion;
the
need
for
new
hous
ing
mod
elfo
ryo
ung
star
ters
inM
alay
sia
Ince
ntiv
ized
retu
rnan
dre
use
orN
extL
ife
Sale
sW
RA
P[7
6];M
enti
nk[1
1];L
acy
etal
.[2
5];D
amen
[27]
Cus
tom
ers
retu
rnus
edpr
oduc
tsfo
ran
agre
edva
lue.
Col
lect
edpr
oduc
tsar
ere
sold
orre
furb
ishe
dan
dso
ld
Voda
fone
Red
Hot
,Tat
aM
otor
sA
ssur
ed
Upg
radi
ngPl
anin
g[5
];M
enti
nk[1
1]R
epla
cing
mod
ules
orco
mpo
nent
sw
ith
bett
erqu
alit
yon
esPh
oneb
lock
s
Prod
uctA
ttac
hmen
tand
Trus
tM
enti
nk[1
1]C
reat
ing
prod
ucts
that
will
belo
ved,
liked
ortr
uste
dlo
nger
App
lepr
oduc
ts
Brin
gyo
urow
nde
vice
WR
AP
[76]
Use
rsbr
ing
thei
row
nde
vice
sto
gett
heac
cess
tose
rvic
es,
Cit
rix
pays
empl
oyee
sfo
rbr
ingi
ngow
nco
mpu
ters
Hyb
rid
mod
elBa
kker
etal
.[26
]A
dura
ble
prod
uctc
onta
ins
shor
t-liv
edco
nsum
able
sO
cé-C
anon
prin
ters
and
copi
ers
Gap
-exp
loit
erm
odel
Bakk
eret
al.[
26];
Men
tink
[11]
Expl
oits
“lif
etim
eva
lue
gaps
”or
left
over
valu
ein
prod
ucts
yste
ms.
(e.g
.,sh
oes
last
ing
long
erth
anth
eir
sole
s).
prin
ter
cart
ridg
esou
tlas
ting
the
ink
they
cont
ain
479

Sustainability 2016, 8, 43
Ta
ble
3.
Con
t.
Cla
ssifi
cati
on
Cri
teri
aM
od
el
Lit
era
ture
So
urc
es
Exp
lan
ati
on
Exam
ple
(s)
Opt
imis
e
Ass
etm
anag
emen
tW
RA
P[7
6]In
tern
alco
llect
ion,
reus
e,re
furb
ishi
ngan
dre
sale
ofus
edpr
oduc
tsFL
OO
W2,
P2PL
ocal
Prod
uce
onde
man
dR
ensw
oude
etal
.[7]
;WR
AP
[76]
,Sc
ott[
3]Pr
oduc
ing
whe
nde
man
dis
pres
enta
ndpr
oduc
tsw
ere
orde
red
Alt
-Ber
gBo
otm
aker
s,M
ade,
Del
lCom
pute
rC
ompa
ny
Was
tere
duct
ion,
Goo
dho
usek
eepi
ng,L
ean
thin
king
,Fit
thin
king
Ren
swou
deet
al.[
7];S
cott
[3];
El-H
agga
r[3
2];B
auti
sta-
Lazo
[35]
Was
tere
duct
ion
inth
epr
oduc
tion
proc
ess
and
befo
reN
itec
hre
char
geab
leba
tter
ies
PSS:
Act
ivit
ym
anag
emen
t/ou
tsou
rcin
gTu
kker
[36]
Mor
eef
ficie
ntus
eof
capi
talg
oods
,mat
eria
ls,h
uman
reso
urce
sth
roug
hou
tsou
rcin
gO
utso
urci
ng
Loop
Rem
anuf
actu
re,P
rodu
ctTr
ansf
orm
atio
nD
amen
[27]
;Pla
ning
[5];
Lacy
etal
.[2
5]R
esto
ring
apr
oduc
tor
its
com
pone
nts
to“a
sne
w”
qual
ity
Bosc
hre
man
ufac
ture
dca
rpa
rts
Rec
yclin
g,R
ecyc
ling
2.0,
Res
ourc
eR
ecov
ery
Lacy
etal
.[25
]Dam
en[2
7]Pl
anin
g[5
];La
cyet
al.[
28]
Rec
over
ing
reso
urce
sou
tofd
ispo
sed
prod
ucts
orby
-pro
duct
sPE
Tbo
ttle
s,D
esso
Upc
yclin
gLa
cyet
al.[
28]M
enti
nk[1
1];P
lani
ng[5
]M
ater
ials
are
reus
edan
dth
eir
valu
eis
upgr
aded
De
Stei
gera
ar(d
esig
nan
dbu
ildof
furn
itur
efr
omsc
rap
woo
d)
Cir
cula
rSu
pplie
sR
ensw
oude
etal
.[7]
;Lac
yet
al.[
28]
Usi
ngsu
pplie
sfr
omm
ater
iall
oops
,bio
base
d-or
fully
recy
clab
leR
oyal
DSM
Vir
tual
ize
Dem
ater
ializ
edse
rvic
esW
RA
P[7
6];R
ensw
oude
etal
.[7]
Shif
ting
phys
ical
prod
ucts
,ser
vice
sor
proc
esse
sto
virt
ual
Spot
ify
(mus
icon
line)
Exch
ange
New
tech
nolo
gyEM
F[6
]N
ewte
chno
logy
ofpr
oduc
tion
Win
Sun
3Dpr
inti
ngho
uses
480
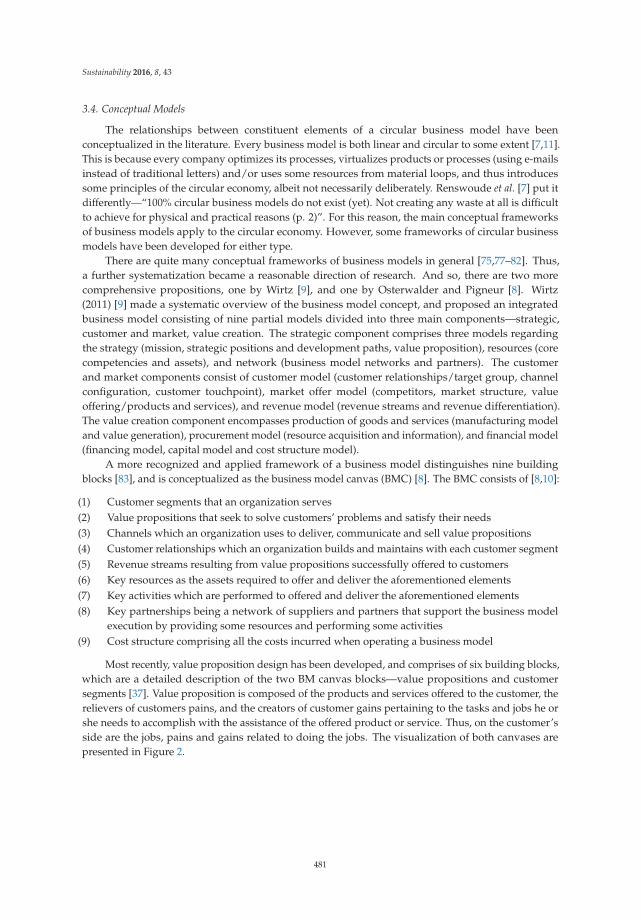
Sustainability 2016, 8, 43
3.4. Conceptual Models
The relationships between constituent elements of a circular business model have beenconceptualized in the literature. Every business model is both linear and circular to some extent [7,11].This is because every company optimizes its processes, virtualizes products or processes (using e-mailsinstead of traditional letters) and/or uses some resources from material loops, and thus introducessome principles of the circular economy, albeit not necessarily deliberately. Renswoude et al. [7] put itdifferently—“100% circular business models do not exist (yet). Not creating any waste at all is difficultto achieve for physical and practical reasons (p. 2)”. For this reason, the main conceptual frameworksof business models apply to the circular economy. However, some frameworks of circular businessmodels have been developed for either type.
There are quite many conceptual frameworks of business models in general [75,77–82]. Thus,a further systematization became a reasonable direction of research. And so, there are two morecomprehensive propositions, one by Wirtz [9], and one by Osterwalder and Pigneur [8]. Wirtz(2011) [9] made a systematic overview of the business model concept, and proposed an integratedbusiness model consisting of nine partial models divided into three main components—strategic,customer and market, value creation. The strategic component comprises three models regardingthe strategy (mission, strategic positions and development paths, value proposition), resources (corecompetencies and assets), and network (business model networks and partners). The customerand market components consist of customer model (customer relationships/target group, channelconfiguration, customer touchpoint), market offer model (competitors, market structure, valueoffering/products and services), and revenue model (revenue streams and revenue differentiation).The value creation component encompasses production of goods and services (manufacturing modeland value generation), procurement model (resource acquisition and information), and financial model(financing model, capital model and cost structure model).
A more recognized and applied framework of a business model distinguishes nine buildingblocks [83], and is conceptualized as the business model canvas (BMC) [8]. The BMC consists of [8,10]:
(1) Customer segments that an organization serves(2) Value propositions that seek to solve customers’ problems and satisfy their needs(3) Channels which an organization uses to deliver, communicate and sell value propositions(4) Customer relationships which an organization builds and maintains with each customer segment(5) Revenue streams resulting from value propositions successfully offered to customers(6) Key resources as the assets required to offer and deliver the aforementioned elements(7) Key activities which are performed to offered and deliver the aforementioned elements(8) Key partnerships being a network of suppliers and partners that support the business model
execution by providing some resources and performing some activities(9) Cost structure comprising all the costs incurred when operating a business model
Most recently, value proposition design has been developed, and comprises of six building blocks,which are a detailed description of the two BM canvas blocks—value propositions and customersegments [37]. Value proposition is composed of the products and services offered to the customer, therelievers of customers pains, and the creators of customer gains pertaining to the tasks and jobs he orshe needs to accomplish with the assistance of the offered product or service. Thus, on the customer’sside are the jobs, pains and gains related to doing the jobs. The visualization of both canvases arepresented in Figure 2.
481
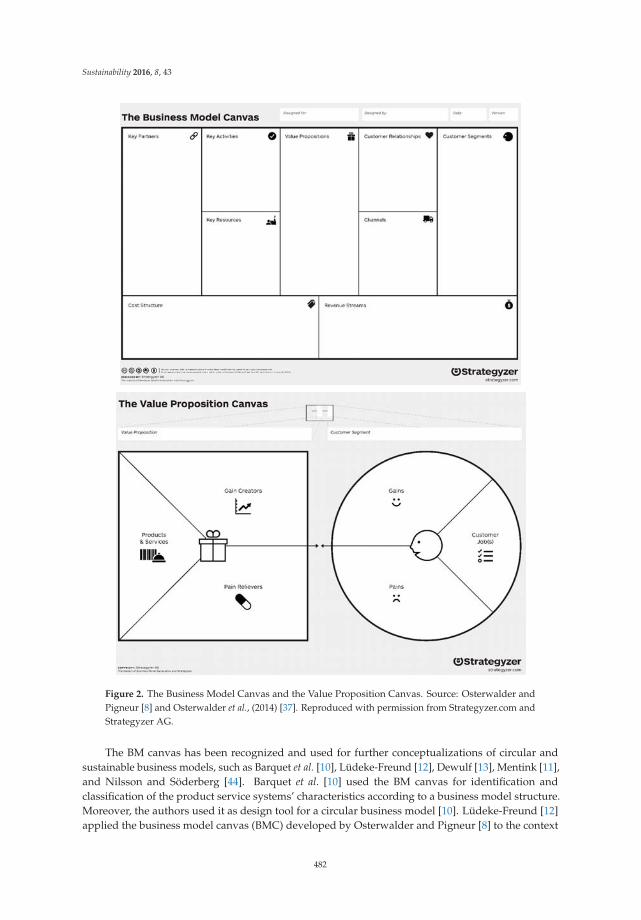
Sustainability 2016, 8, 43
Figure 2. The Business Model Canvas and the Value Proposition Canvas. Source: Osterwalder andPigneur [8] and Osterwalder et al., (2014) [37]. Reproduced with permission from Strategyzer.com andStrategyzer AG.
The BM canvas has been recognized and used for further conceptualizations of circular andsustainable business models, such as Barquet et al. [10], Lüdeke-Freund [12], Dewulf [13], Mentink [11],and Nilsson and Söderberg [44]. Barquet et al. [10] used the BM canvas for identification andclassification of the product service systems’ characteristics according to a business model structure.Moreover, the authors used it as design tool for a circular business model [10]. Lüdeke-Freund [12]applied the business model canvas (BMC) developed by Osterwalder and Pigneur [8] to the context
482
Sustainability 2016, 8, 43
of eco-innovation. In Lüdeke-Freund’s framework, the canvas is a central component, but linkedwith others, both preceding and subsequent. The infrastructure management (partners, resources,activities) is highly impacted by the development of marketable eco-innovations, barriers of sustainabledevelopment, and marketing eco-innovations. Thus, contextual factors are important enablers for abusiness model to operate in practice. On the other hand, eco-innovations create an extended customervalue (a mix of customer public value, customer equity and customer value). Dewulf [13] developedan extended business model canvas with two additional components—societal costs and societalbenefits. Mentink [11] developed a business cycle canvas, which applies the concept of business cycleto the business model framework. This proposition is focused on the circulation of materials in aclosed loops, and thus is more useful to analyze if the company’s network will support material loops.Nilsson and Söderberg [44] developed a business model canvas adjusted for the urban mining segmentand evaluated the business model element differences between the traditional C and D and urbanmining industry.
Some other conceptual frameworks exist in the literature related to sustainability. For instance,Stubbs and Cocklin [38] developed a case study-based conceptualization of a sustainability businessmodel, consisting of two types of attributes—structural and cultural ones. Each type has its economic,environmental, social, and holistic characteristics. Structural attributes are depicted by:
‚ Economic characteristics, such as external bodies expecting triple bottom line performance,lobbying for changes to taxation system and legislation to support sustainability, keepingcapital local
‚ Environmental characteristics, such as a threefold strategy (offsets, sustainable, restorative),closed-loop systems, implementation of services model, operating in industrial ecosystems andstakeholder networks
‚ Social characteristics, such as understanding stakeholder’s needs and expectations, educating andconsulting stakeholders
Holistic characteristics, such as cooperation and collaboration; triple bottom line approach toperformance; implementing demand-driven model; adapting organization to sustainability.
Cultural attributes are depicted by:
‚ Economic characteristics, such as considering profit as a means to do something more(“higher purpose”), not as an end, which is also a reason for shareholders to invest
‚ Environmental characteristics, such as treating nature as a stakeholder‚ Social characteristics, such as balancing stakeholders’ expectations, sharing resources among
stakeholders, and building relationships‚ Holistic characteristics, such as focusing on medium to long-term effects, and on
reducing consumption
Most recent contributions to conceptual models concern the dynamics between components ofthe business model. For instance, Roome and Louche [39] developed process model of business modelchange for sustainability, which explains how new business models for sustainability are fashionedthrough the interactions between individuals and groups inside and outside companies. Gauthier andGilomen [40] analyzed transformations of the elements of sustainable business model and identified atypology of such changes (see Subsection 3.8 in this paper). Abdelkafi and Täuscher [41] developed asystem dynamics-based representation of business models for sustainability. Not only has the dynamicof internal business model components been researched, but also the dynamics in relation to thebusiness model environment. One of the key issues in this regard pertains to networks. Jabłonski [42]outlined the process of transition from an idea to the operationalization of the business model bysearching for business model components from the network. However, the static approach is alsobeing investigated. For example, Upward and Jones [43] developed the strongly sustainable businessmodel ontology. Another approach proposed by Bautista-Lazo and Short [84] conceptualized an All
483
Sustainability 2016, 8, 43
Seeing Eye of Business model, which addresses the types of waste and their potential as a profit orloss generator.
3.5. Design Methods and Tools
There are several design methods and tools for the business model in the literature. Some of themfocus on enhancing the design process [3,7,8,10], and others are used in particular situations and forparticular business models [32,42,46].
Joustra et al. [16] and Jong et al. [14] identified five steps to support for small and mediumenterprises (SMEs) to enter the circular economy. The first two steps comprise reading about theCE, and learning about the readiness of the company, partners and stakeholders in the supply chainfor CE. The next two steps suggest evaluating redesign opportunities that might bring the productsinto a more circular business model, and to understand the service that a company could potentiallydeliver and how the model needs to be redesigned to enable this. The last step tests whether the valuedelivered is the value that customers expect and will pay for.
Scott [3] proposed the 7-P model as a starting point toward understanding and applying themechanism of the circular economy in a business. This model takes the practitioner’s approach anddescribes seven main components, which can be divided into three steps. The first is to learn andunderstand the fundamentals of the circular economy, and what the change will concern, and decideon establishing sustainability as an objective (prepare). The next step is to organize and implement themechanisms of the circular economy related to the process, preservation, people, place, product, andproduction. The last step is to enable and support implementation of CE, mainly through buildingteams and managing change (People).
Renswoude et al. [7] developed the business model scan, a methodology to enhance a transitionof the company into a more circular form. It consists of six process stages about which manyquestions are asked. Those questions are related to value proposition, design, supply, manufacturing,use, and next life. Osterwalder and Pigneur [8] proposed five stages of business model designprocess, encompassing mobilize, understand, design, implement, and manage. This methodologyis supported by the business model canvas (described in Section 3.4). BMC has been applied toresearch and design circular business models [10,11]. Jablonski [42] distinguished eleven stagesof the design and operationalization of the company’s technological business model embedded inthe network. Parlikad et al. [45] identified the information requirements for end-of-life decisionmaking and established a possible set of characteristics of a lifecycle information system to supportmanagement. They also reviewed existing product lifecycle information systems and divided them intotwo categories. Design/disassembly data-sharing systems encompass: Inverse Manufacturing ProductRecycling Information System (IMPRIS), Recycling Passport, Products Lifecycle Management System(PLMS), Integrated Recycling Data Management System (ReDaMa). Lifecycle information monitoringsystems comprises of: Information System for Product Recovery (ISPR), Life Cycle Data AcquisitionSystem (LCDA), Green Port [45]. Cleaner production audits are undertaken to identify opportunitiesfor cleaner production. The methodology for the cleaner production opportunity assessment hasbeen outlined by El-Haggar [32] (p. 29), and consists of many activities related to and focused onthe following: team, pre-audit, surrounding environment, operations and processes, inputs andoutputs, wasteful processes, material and energy balance, opportunities, priorities, implementation,assessment, process sustainability, sustainable development. Another important method is life cycleassessment [85] which is explained as “a tool for the analysis of the environmental burden of products at allstages in their life cycle—from the extraction of resources, through the production of materials, product parts andthe product itself, and the use of the product to the management after it is discarded, either by reuse, recycling orfinal disposal (in effect, therefore, ‘from the cradle to the grave’)” [46] (pp. 5–6). Scott [3] (p. 81) also suggeststhat environmental audits, such as compliance audit, waste audit, waste disposal audit, water audit,can be used. Mentink [11] discussed a few other methods and tools, such as: New Framework on
484
Sustainability 2016, 8, 43
Circular Design, Practical Guide for PSS Development, Circular Economy Toolkit, Play it Forward, 4-IFramework, and Sustainable Business Model Canvas.
3.6. Adoption Factors
Factors affecting CBM adoption are mostly related to general factors [5,47], humanresources [3,16,28], political system and legislation [3,6], IT and data management [3,45], and businessrisks [11]. There are also crucial socioeconomic implications, justifying the efforts towards CE [4,7,22],and other enablers such as leadership, collaboration, motivation through the concept itself, andcustomer behavior [53].
General factors encompass conditions which need to be fulfilled to secure profitability of closedcircles. Winter [47] (p. 16) points out five of them: sufficiently valuable materials/products, controlof product or material chain, ease of reuse, remanufacture or recycle materials/products, predictabledemand for future products, keeping materials/products concentrated and uncontaminated.Planing [5], however, argued that customer irrationality, conflict of interest within companies,misaligned profit-share along the supply chain, and geographic dispersion could be the reasonsfor rejecting circular business models. Scheepens et al. [48] argue that transition to CE is impacted bydifferent factors on several levels: societal, regulatory, services and infrastructure, and product andtechnology. Sivertsson and Tell [71] identified barriers to business model innovation in the agriculturalcontext for each of the nine building blocks of the business model canvas (by Osterwalder andPigneur [8]). Pearce identified six kinds of customers whose needs may be satisfied by the companiesoffering remanufactured products. These types comprise the customers who (1) need to retain a specificproduct because it has a technically defined role in their current processes; (2) want to avoid the needto re-specify, re-approve or re-certify a product; (3) make low utilization of new equipment; (4) wishto continue using a product which has been discontinued by the original manufacturer; (5) wantto extend the service lives of used products, whether discontinued or not; and (6) are interested inenvironmentally friendly products [51]. Linder and Williander [18] outlined challenges regardingremanufacturing, such as: considerable expertise and knowledge of the product; efficient productretrieval; suitable types of products; risk of cannibalization if the new, longer-lasting products reducesales of the previous products; fashion changes; a financial risk for the producer if the offer is to berented; increased operational risk; lack of supporting law, policy and regulations; and compatibilitywith the business models of partners.
Regarding the role of human resources in a company shift towards the circular economy, varioussuggestions have been made. On the basis of successful waste elimination schemes, Scott [3] formulatedgeneral recommendations for creating teams related to team members and team size, volunteers, goals,motivation, maintaining links with organization, organizing team meetings, positive thinking, andleadership. Lacy et al. [28] (p. 18) identified five capabilities of successful circular leaders (businessplanning and strategy, innovation and product development, in sourcing and manufacturing, salesand marketing, reverse logistics and return chains). Other researchers also emphasized the role ofleadership, mostly pertaining to the appreciation of the new strategic direction, understanding itsbenefits and risks, and the ability to establish a common understanding in the business [53,54].
Joustra et al. [16] (p. 11) identified eight elementary skills for any circular economy projectteam, such as: entrepreneurial and developing, craftsmanship aimed at product/services, systemsthinking and capability of identifying causal loops, future oriented and out-of-the-box, celebratingdiversity, addressing insecurities, designing circular systems, products and services, and beingcreative, innovative and connected. Laubscher and Marinelli [22] give some insights from the practiceand emphasized the role of adequate culture adaptation and development of capabilities in a BMtransformation towards CE. This can be obtained through dedicated training programs, performanceand rewards schemes, personal targets and bonuses for sales managers.
Others argue that policymakers at all government levels (municipal, regional, national, andsupranational) play an important role in the circular economy [3,6]. There are two broad and
485
Sustainability 2016, 8, 43
complementary policymaking strategies to accelerate the circular economy: fixing market andregulatory failures, and stimulating market activity by, for example, setting targets, changing publicprocurement policy, creating collaboration platforms and providing financial or technical support tobusinesses [6].
Parlikad, et al. [45] and Scott [3] (p. 79) argue that IT and data management systems are essentialfor the circular economy, because they allow to keep track of products, components and material data.This strongly supports effective reverse logistics systems, material loops (also cross-industry) andreuse of components.
Some business risks of service models (or PSS) have also been identified in the literature. Theyare related to the fact that (a) owning a product is preferred if the user is emotionally attached to theproduct or the product has an important intangible value, impacting, for instance, the owner’s socialstatus; (b) result or function-oriented services need a good explanation and description, which mayincrease transaction costs; (c) the service provider must predict and control the risks, uncertainties andresponsibilities related to selling a result-oriented service [11,14,16]. Moreover, validating a circularbusiness model always has a higher business risk than validating a corresponding traditional, linearbusiness model [18].
Regarding the impact of the circular economy, there are three main winners: economies, companiesand user/consumers [3,4,7,55]. CE advantages for economies are related to e.g., the impact oneconomic growth, material cost savings, mitigation of price volatility and supply risks, significantjob growth in services, employment market resilience [4,49]. Laubscher and Marinelli [22] point thatcompanies can gain financial and reputational value. Others argue that CE will give the companiesnew profit possibilities, increase competitive advantage and build resilience against several strategicchallenges [4,56,57]. Detailed advantages could concern: innovation and competitive advantage,additional revenue streams, long-term contracts, customer loyalty and feedback, multiple benefitsof internal resource management, and beneficial partnerships throughout the value chain [7,58–60].Customer and user benefits mainly comprise of increased choice at lower cost; however, there are alsosome social benefits, like a contribution against climate change [4,52].
Importantly, adaptation factors change in time and those changes also impact the evolution ofbusiness models [50].
3.7. Evaluation Models
The criteria for assessing the feasibility, viability, and profitability of circular business modelsmust be adjusted to the micro, meso and macro-level of implementation [47]. On the micro-levelLaubscher and Marinelli [22] argue for measuring the reduced ecological footprint, direct financialvalue through recovery of materials and assets, and top line growth through new business models.A more extended set of key performance indicators could encompass a percentage of: revenues fromrepairs, reused parts, refurbished products, recycled material used product value after period X,revenue from second-hand products, times of reuse of resource, technical lifetime value of by-products,by-products used, separability of resources, toxic materials used, and products leased [11]. Andersonand Stavileci [61] proposed several criteria for evaluation of the business model’s validity for thecircular economy, such as: turnover possibility, margins, capital intensiveness, implementation time,dependence on supplier, possible usage of recycled materials, usage of unsustainable materials, benefitsfrom additive manufacturing, percentage of lifecycle, product oriented, and service oriented. Thereare also some guidelines for accounting the costs of material flow (MFCA) [62–64].
On the macro-level, there are several measurements for three CE principles [23]. Measurementsconcerning the principles of preservation and enhancing natural capital by controlling finite stocksand balancing renewable resource flow, comprise degradation-adjusted net value add (NVA) as aprimary metric, and annual monetary benefit of ecosystem services, annual degradation, and overallremaining stock as secondary metrics. Measurements for the principle of optimization of resourceyields by circulating products, components and materials in use at the highest utility at all times in
486
Sustainability 2016, 8, 43
both technical and biological cycles, encompass as a primary metric GDP-generated per unit of netvirgin finite material input, and product utilization, product depreciation/lifetime, and material valueretention or value of virgin materials as secondary metrics. Measurements for the principle of fosteringsystem effectiveness by revealing and designing out negative externalities, consist of cost of land, air,water, and noise pollution, as a primary metric, and toxic substances in food systems, climate change,congestion, and health impacts as secondary metrics [23].
3.8. Change Methodologies
Scott [3] (pp. 103–109) argues that basic change management theories, like the Force Field Theory,Three-Stage Approach to Change Behavior, sources of staff resistance to change, can be successfullyapplied to manage the transition from a linear business model towards a circular one. However,other studies provide theories more specific to CE. For example, the model of the process of changingbusiness model for sustainability explains how new business models for sustainability are fashionedthrough the interactions between individuals and groups inside and outside companies [39]. Gauthierand Gilomen [40] identified a typology of business model transformations toward sustainability:
(1) Business model as usual—if there are no transformations to business model elements(2) Business model adjustment—if marginal modifications to one element of BMs occur(3) Business model innovation—if major BM transformations were implemented(4) Business model redesign—if a complete rethinking of organizations’ BM elements results in
radically new value propositions
4. Circular Economy and the Components of Business Model
4.1. Value Propositions Fitting Customer Segments (Value Proposition Design)
The core component of the circular business model is the value proposition. Circular valueproposition offers a product, product-related service or a pure service [14]. This offer must allowthe user/consumer to do what is needed, reduce inconveniences which the consumer/user wouldexperience, and provide additional benefits [37].
Circular products, although ownership-based [5], have several specific features related to the CEprinciples. Circular products enable product-life extension through maintenance, repair, refurbishment,redistribution, upgrading and reselling [5,7,28,33,45]. They are designed to enhance reusing, recycling,and cascading. This requires a modular design and choosing materials that allow cascading, reusing,remanufacturing, recycling, or safe disposal. Thus, such products are 100% ready to circulate in theclosed material loops. Moreover, product design should allow using less raw material or energy or tominimize emissions [3,25,32]. Circular products can be also dematerialized and offered not as physicalbut as virtual products [4,7].
In a product-service system a company offers access to the product but retains its ownership.It is an alternative to the traditional model of “buy and own”. This is a way of reducing customerpains, creating gains, and getting the jobs done through offering product-oriented services or advice,use-oriented services including product leasing, renting, pooling, and pay-per-service unit, orresult-oriented services, comprising outsourcing and functional result [14,25,28,30,36]. Some examplescomprise: Philips pay-per light [22] or GreenWheels’ shared car use, hours of thrust in a Rolls-Royce,or “Power-by-the-Hour” jet engines [26].
Circular value propositions related to services may concern shifting their traditional form to avirtual one (e.g., virtual travel) [4,6,7].
Collaborative consumption related to product sharing/renting or product pooling can bring costsavings, services tailored for customer needs, and additional benefits. For instance, BlaBlaCar offersnot only cheap transportation possibilities and route connections unavailable by public transport, butalso social gains (see blablacar.com). Some other sharing-based value propositions concern sharing
487
Sustainability 2016, 8, 43
residence, parking, appliances/tools sharing, office, and flexible seating, which may require somespecially developed platforms [4,7,28].
Usually there are some incentives offered to the users/consumers [76]: for example, buy-backprograms like Vodafone—New Every Year/Red Hot [1]. In this case, incentives are a source of valuefor the customer (part of value proposition), and products, components or materials collected backcontain a value retrieved by the company.
The value proposition must be appropriate for particular customer segments, for specific types ofcustomers [51].
4.2. Channels
One of the strongest shifts towards a circular business model regarding channels is virtualization.This means that an organization can sell a virtualized value proposition and deliver it virtually (sellingdigital products, like music in mp3 format) and/or sell value propositions via virtual channels (onlineshops selling material products) [6]. Another possibility is to communicate virtually with the customer(e.g., using web advertisements, e-mails, websites, social media, video conferences) [23,69].
4.3. Customer Relationships
Building and maintaining relationships with customers can underlie the main principle of thecircular economy—eliminating waste—twofold. Those two options encompass producing on order,and engaging customers to vote for which product to make [7]. Additionally, a switch to recycling 2.0may enhance social-marketing strategies and leverage relationships with community partners [25,69].
4.4. Revenue Streams
Revenue streams are essentially the ways in which a company makes money. There are severalcircular propositions, mainly associated with the product-service systems [7,31]. The first is aninput-based PSS, like pay per product or pay per service. The second is availability-based PSS,encompassing a subscription-based rental where, against a low, periodic fee, consumers can usea product or service; or a progressive purchase, where customers periodically pay small amountsbefore the purchase. The third is usage-based PSS like pay per use, which is a one-time payment touse a product or service. The fourth one is performance-based, like performance-based contracting.However, several performance-based PSSes are possible, like solution-oriented (e.g., selling a promisedlevel of heat transfer efficiency instead of selling radiators), effect-oriented (e.g., selling a promisedtemperature level in a building instead of selling radiators), and demand-fulfilment oriented (e.g.,selling a promised level of thermal comfort for building occupants instead of selling radiators) [31].Two traditional options of revenue streams concern selling pure products or pure services [36]. Revenuestreams depend on the value proposition.
Moreover, revenue streams may be related to retrieved value, generated from products,components and/or raw materials collected back. For example product components, when collectedback, are resold after they were restored to “as-new” quality, or remanufactured, or used to create anew product if they carry a high value [5,25]. Despite how low or high the value, it must be sufficientto make the material loops economically reasonable. Retrieved value may also be related to energycaptured from waste disposal [4].
4.5. Key Resources
The assets required to create, offer and deliver value propositions via chosen channels, to buildand maintain relationships and to receive revenue flows, correspond with the principles guiding thecircular economy in two major ways. One is focused on input choices and the second on regeneratingand restoring the natural capital.
The input choices are related to changing input materials and products. This can be done throughso-called circular sourcing, which applies the principle of using only products or materials obtained
488
Sustainability 2016, 8, 43
from closed material loops along four circular flows [5,7,28]. Another way to achieve this is directsubstitution of resources with better-performing materials, which are “less harmful to the environment,more feasible to use and have the same or better technical requirements” [32] (p. 27). Next option isdirect virtualization of materials, as for instance through digitalization [23,68].
Natural capital regeneration and restoring concerns using energy from renewable sources, landrestoration or reclamation, saving water, operating in more efficient buildings, and choosing sustainableproduction locations like eco-parks [3].
4.6. Key Activities
The key activities which directly or indirectly lead to creating, offering and delivering thevalue propositions, may apply the CE principles in several ways. Some are oriented on increasingperformance, product design, technology exchange, and the other on remanufacturing, recycling oreven lobbying.
Increasing performance can be obtained through good housekeeping, better process control,equipment modification and technology changes, sharing and virtualization. Good housekeepingand process control involve not only optimization of the process by elimination of any fault thatwould result in unnecessary losses, like spills, leakage, overheating etc., but also effective and efficientplanning and regulating of the process to ensure optimal conditions such as temperature, pH, pressure,water level, time, etc. [32]. This requires, for instance, continuous monitoring and management,a regular preventive maintenance program, raising staff environmental awareness, and incentivemechanisms, and is supported by lean thinking and lean management [3,32]. Recently, another way ofincreasing performance has been introduced—the “bring your own device” model [76]. It assumesthat users bring their own devices in order to get the access to services, and thus the quantity ofproducts required to meet market need is being reduced. An example is Citrix where employees arepaid for bringing their own computers into the company to use on the company’s network for workand home [76]. Equipment modification and technology changes improve the production processor replace one with another, and in turn increase efficient utilization of raw materials, water, energy,reduce emissions and eliminatestoxic materials from production [32]. A good example is using 3Dprinting to produce what is needed [7]. Increasing performance may be related also with sharing andvirtualizing office space through flexible seating, desk-sharing, office hoteling, tele-working, audioand video conferences, the “internet of things”, big data and machine learning [23,28,67].
Appropriate product design enables using less raw material or energy, to reduce emissionsand toxic materials, prolonging product life, eliminating waste before resource-life extension, andto circulate the product, components and materials in a 100% closed material loop, according to theCradle-to-Cradle concept [1,3,16,25,32].
Moreover, sometimes lobbying for the changes of legislation and political incentives to acceleratethe circular economy is necessary [3,4,6,7,22]. When a company is directly engaged in lobbying, then itbecomes the key activity. Otherwise lobbying depends on third-party entities and is considered as anadaptation factor.
4.7. Key Partnerships
Cooperative networks allow businesses to receive advantages from supplies, and support acompany in research, product design, marketing, office support, supply routes, financial functions,production processes, and management [3,16]. Thus, collaboration enhances obtaining key resourcesand performing key activities. For instance, off-site recycling is done by other parties that recyclethe industrial wastes at the post-consumer stage or recycle the specific wastes, which then are soldto other industries [32]. Collaborative production, based on the cooperation in the production valuechain, allows the materials to circulate in a so-called closed material loop [7]. Sheu [65] argues thatcollaborative relationships play an important role in the green supply chains. Robinson et al. [66]showed that business models for solar-powered charging stations to develop infrastructure for electric
489
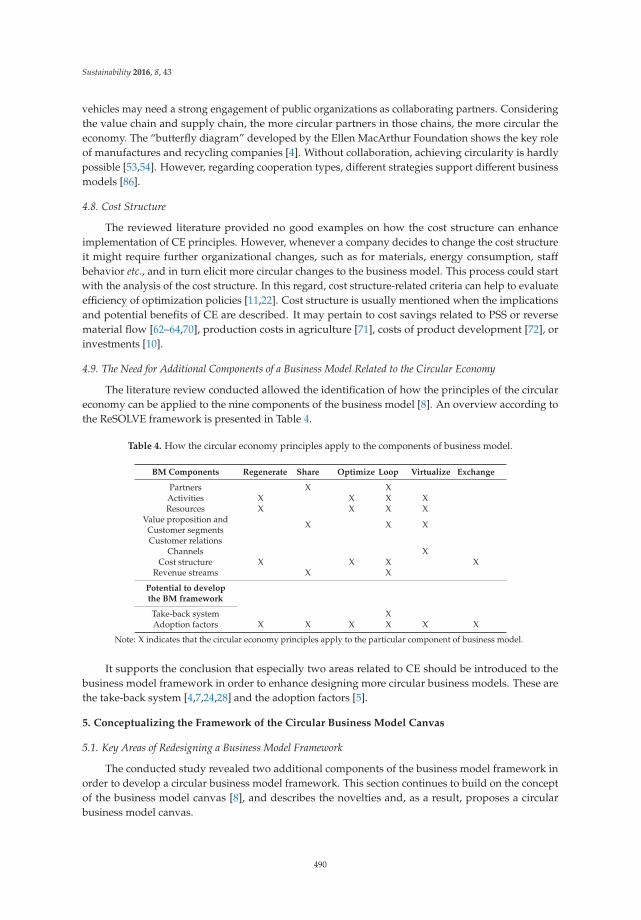
Sustainability 2016, 8, 43
vehicles may need a strong engagement of public organizations as collaborating partners. Consideringthe value chain and supply chain, the more circular partners in those chains, the more circular theeconomy. The “butterfly diagram” developed by the Ellen MacArthur Foundation shows the key roleof manufactures and recycling companies [4]. Without collaboration, achieving circularity is hardlypossible [53,54]. However, regarding cooperation types, different strategies support different businessmodels [86].
4.8. Cost Structure
The reviewed literature provided no good examples on how the cost structure can enhanceimplementation of CE principles. However, whenever a company decides to change the cost structureit might require further organizational changes, such as for materials, energy consumption, staffbehavior etc., and in turn elicit more circular changes to the business model. This process could startwith the analysis of the cost structure. In this regard, cost structure-related criteria can help to evaluateefficiency of optimization policies [11,22]. Cost structure is usually mentioned when the implicationsand potential benefits of CE are described. It may pertain to cost savings related to PSS or reversematerial flow [62–64,70], production costs in agriculture [71], costs of product development [72], orinvestments [10].
4.9. The Need for Additional Components of a Business Model Related to the Circular Economy
The literature review conducted allowed the identification of how the principles of the circulareconomy can be applied to the nine components of the business model [8]. An overview according tothe ReSOLVE framework is presented in Table 4.
Table 4. How the circular economy principles apply to the components of business model.
BM Components Regenerate Share Optimize Loop Virtualize Exchange
Partners X XActivities X X X XResources X X X X
Value proposition andCustomer segments X X X
Customer relationsChannels X
Cost structure X X X XRevenue streams X X
Potential to developthe BM framework
Take-back system XAdoption factors X X X X X X
Note: X indicates that the circular economy principles apply to the particular component of business model.
It supports the conclusion that especially two areas related to CE should be introduced to thebusiness model framework in order to enhance designing more circular business models. These arethe take-back system [4,7,24,28] and the adoption factors [5].
5. Conceptualizing the Framework of the Circular Business Model Canvas
5.1. Key Areas of Redesigning a Business Model Framework
The conducted study revealed two additional components of the business model framework inorder to develop a circular business model framework. This section continues to build on the conceptof the business model canvas [8], and describes the novelties and, as a result, proposes a circularbusiness model canvas.
490
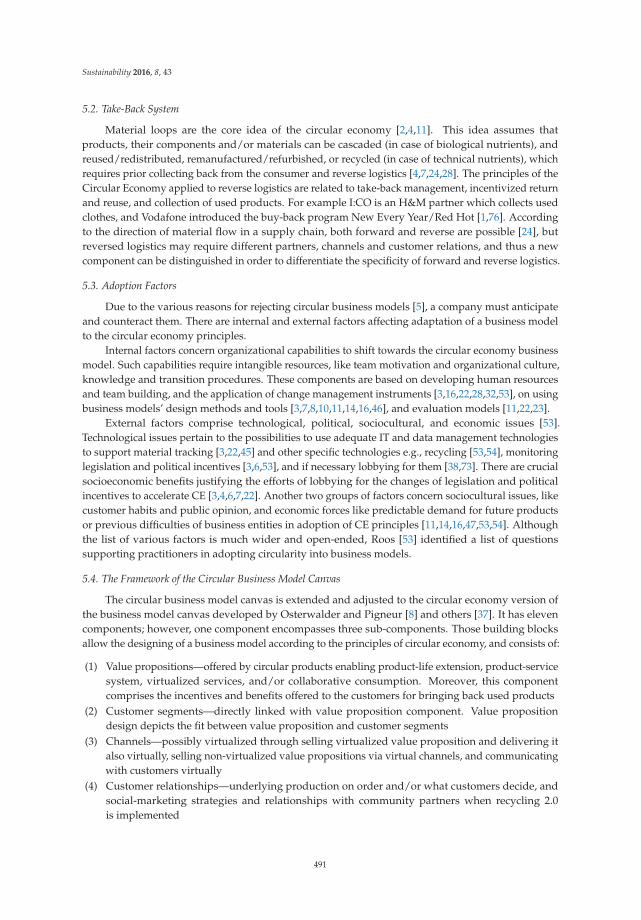
Sustainability 2016, 8, 43
5.2. Take-Back System
Material loops are the core idea of the circular economy [2,4,11]. This idea assumes thatproducts, their components and/or materials can be cascaded (in case of biological nutrients), andreused/redistributed, remanufactured/refurbished, or recycled (in case of technical nutrients), whichrequires prior collecting back from the consumer and reverse logistics [4,7,24,28]. The principles of theCircular Economy applied to reverse logistics are related to take-back management, incentivized returnand reuse, and collection of used products. For example I:CO is an H&M partner which collects usedclothes, and Vodafone introduced the buy-back program New Every Year/Red Hot [1,76]. Accordingto the direction of material flow in a supply chain, both forward and reverse are possible [24], butreversed logistics may require different partners, channels and customer relations, and thus a newcomponent can be distinguished in order to differentiate the specificity of forward and reverse logistics.
5.3. Adoption Factors
Due to the various reasons for rejecting circular business models [5], a company must anticipateand counteract them. There are internal and external factors affecting adaptation of a business modelto the circular economy principles.
Internal factors concern organizational capabilities to shift towards the circular economy businessmodel. Such capabilities require intangible resources, like team motivation and organizational culture,knowledge and transition procedures. These components are based on developing human resourcesand team building, and the application of change management instruments [3,16,22,28,32,53], on usingbusiness models’ design methods and tools [3,7,8,10,11,14,16,46], and evaluation models [11,22,23].
External factors comprise technological, political, sociocultural, and economic issues [53].Technological issues pertain to the possibilities to use adequate IT and data management technologiesto support material tracking [3,22,45] and other specific technologies e.g., recycling [53,54], monitoringlegislation and political incentives [3,6,53], and if necessary lobbying for them [38,73]. There are crucialsocioeconomic benefits justifying the efforts of lobbying for the changes of legislation and politicalincentives to accelerate CE [3,4,6,7,22]. Another two groups of factors concern sociocultural issues, likecustomer habits and public opinion, and economic forces like predictable demand for future productsor previous difficulties of business entities in adoption of CE principles [11,14,16,47,53,54]. Althoughthe list of various factors is much wider and open-ended, Roos [53] identified a list of questionssupporting practitioners in adopting circularity into business models.
5.4. The Framework of the Circular Business Model Canvas
The circular business model canvas is extended and adjusted to the circular economy version ofthe business model canvas developed by Osterwalder and Pigneur [8] and others [37]. It has elevencomponents; however, one component encompasses three sub-components. Those building blocksallow the designing of a business model according to the principles of circular economy, and consists of:
(1) Value propositions—offered by circular products enabling product-life extension, product-servicesystem, virtualized services, and/or collaborative consumption. Moreover, this componentcomprises the incentives and benefits offered to the customers for bringing back used products
(2) Customer segments—directly linked with value proposition component. Value propositiondesign depicts the fit between value proposition and customer segments
(3) Channels—possibly virtualized through selling virtualized value proposition and delivering italso virtually, selling non-virtualized value propositions via virtual channels, and communicatingwith customers virtually
(4) Customer relationships—underlying production on order and/or what customers decide, andsocial-marketing strategies and relationships with community partners when recycling 2.0is implemented
491
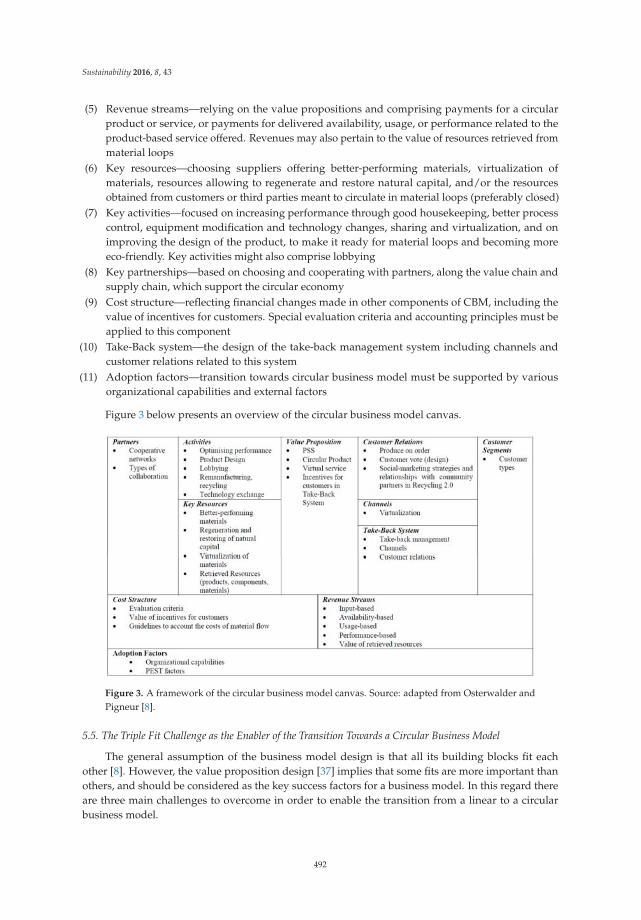
Sustainability 2016, 8, 43
(5) Revenue streams—relying on the value propositions and comprising payments for a circularproduct or service, or payments for delivered availability, usage, or performance related to theproduct-based service offered. Revenues may also pertain to the value of resources retrieved frommaterial loops
(6) Key resources—choosing suppliers offering better-performing materials, virtualization ofmaterials, resources allowing to regenerate and restore natural capital, and/or the resourcesobtained from customers or third parties meant to circulate in material loops (preferably closed)
(7) Key activities—focused on increasing performance through good housekeeping, better processcontrol, equipment modification and technology changes, sharing and virtualization, and onimproving the design of the product, to make it ready for material loops and becoming moreeco-friendly. Key activities might also comprise lobbying
(8) Key partnerships—based on choosing and cooperating with partners, along the value chain andsupply chain, which support the circular economy
(9) Cost structure—reflecting financial changes made in other components of CBM, including thevalue of incentives for customers. Special evaluation criteria and accounting principles must beapplied to this component
(10) Take-Back system—the design of the take-back management system including channels andcustomer relations related to this system
(11) Adoption factors—transition towards circular business model must be supported by variousorganizational capabilities and external factors
Figure 3 below presents an overview of the circular business model canvas.
Figure 3. A framework of the circular business model canvas. Source: adapted from Osterwalder andPigneur [8].
5.5. The Triple Fit Challenge as the Enabler of the Transition Towards a Circular Business Model
The general assumption of the business model design is that all its building blocks fit eachother [8]. However, the value proposition design [37] implies that some fits are more important thanothers, and should be considered as the key success factors for a business model. In this regard thereare three main challenges to overcome in order to enable the transition from a linear to a circularbusiness model.
492
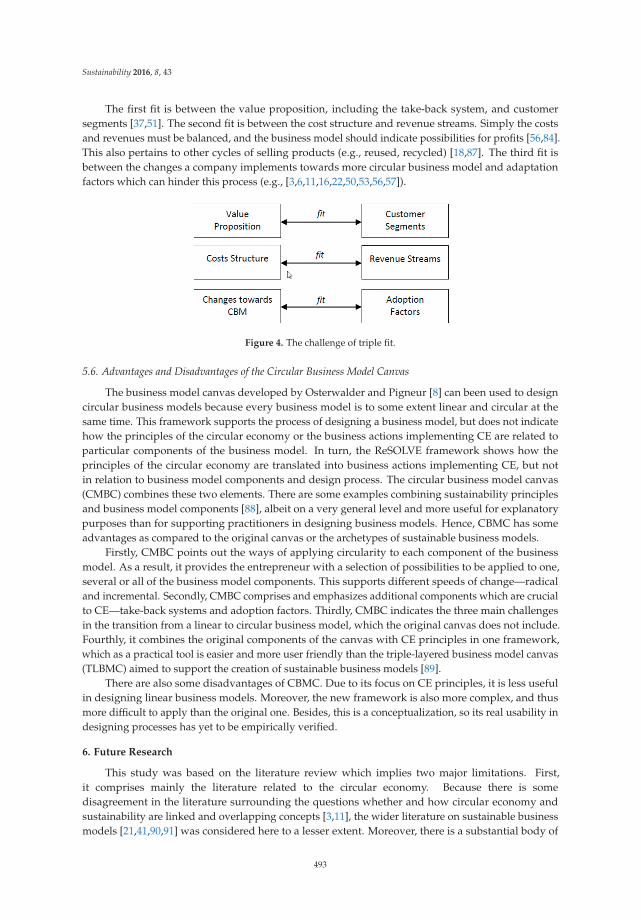
Sustainability 2016, 8, 43
The first fit is between the value proposition, including the take-back system, and customersegments [37,51]. The second fit is between the cost structure and revenue streams. Simply the costsand revenues must be balanced, and the business model should indicate possibilities for profits [56,84].This also pertains to other cycles of selling products (e.g., reused, recycled) [18,87]. The third fit isbetween the changes a company implements towards more circular business model and adaptationfactors which can hinder this process (e.g., [3,6,11,16,22,50,53,56,57]).
Figure 4. The challenge of triple fit.
5.6. Advantages and Disadvantages of the Circular Business Model Canvas
The business model canvas developed by Osterwalder and Pigneur [8] can been used to designcircular business models because every business model is to some extent linear and circular at thesame time. This framework supports the process of designing a business model, but does not indicatehow the principles of the circular economy or the business actions implementing CE are related toparticular components of the business model. In turn, the ReSOLVE framework shows how theprinciples of the circular economy are translated into business actions implementing CE, but notin relation to business model components and design process. The circular business model canvas(CMBC) combines these two elements. There are some examples combining sustainability principlesand business model components [88], albeit on a very general level and more useful for explanatorypurposes than for supporting practitioners in designing business models. Hence, CBMC has someadvantages as compared to the original canvas or the archetypes of sustainable business models.
Firstly, CMBC points out the ways of applying circularity to each component of the businessmodel. As a result, it provides the entrepreneur with a selection of possibilities to be applied to one,several or all of the business model components. This supports different speeds of change—radicaland incremental. Secondly, CMBC comprises and emphasizes additional components which are crucialto CE—take-back systems and adoption factors. Thirdly, CMBC indicates the three main challengesin the transition from a linear to circular business model, which the original canvas does not include.Fourthly, it combines the original components of the canvas with CE principles in one framework,which as a practical tool is easier and more user friendly than the triple-layered business model canvas(TLBMC) aimed to support the creation of sustainable business models [89].
There are also some disadvantages of CBMC. Due to its focus on CE principles, it is less usefulin designing linear business models. Moreover, the new framework is also more complex, and thusmore difficult to apply than the original one. Besides, this is a conceptualization, so its real usability indesigning processes has yet to be empirically verified.
6. Future Research
This study was based on the literature review which implies two major limitations. First,it comprises mainly the literature related to the circular economy. Because there is somedisagreement in the literature surrounding the questions whether and how circular economy andsustainability are linked and overlapping concepts [3,11], the wider literature on sustainable businessmodels [21,41,90,91] was considered here to a lesser extent. Moreover, there is a substantial body of
493
Sustainability 2016, 8, 43
literature related to each school of thought underlying the circular economy, especially industrialecology, industrial symbiosis, industrial metabolism, and cleaner production. Each and within each ofthem there is enough research to conduct comprehensive review studies. Govindan, Soleimani, andKannan’s [24] study is a good example of such a review. This literature was also considered here toa lesser extent, due to intentional focus on circular economy, and inclusion of those concepts in theliterature on circular economy. The second limitation of this study pertains to the lack of empiricalevidence; further research could therefore focus on empirical verification of the applicability of theproposed framework of the circular business model, in various business settings, especially of thenew components like retrieved value proposition which requires empirical verification and furthercognition. A detailed empirical investigation of the value proposition design in the context of thecircular economy would be very interesting and promising. Does value proposition design need tobe adjusted to the circular economy? What are the customer’s pains and gains related to the circulareconomy and how could a fit with value proposition be achieved? In this regard, the newest book byOsterwalder et al. [37] provides a good starting point to consider. Another direction could explorehow the three fits (in the triple fit challenge) are interrelated. Some critical success factors for circularbusiness models could be derived from such research. A heavily underexplored area is related toapplying circularity to business models of public sector organizations and also non-governmentalorganizations. One of many possible routes of investigation is how the public sector and NGOs maybenefit from partnerships with business [66,92].
7. Conclusions
There are two very vital areas of managerial practice which have recently garnered a great deal ofresearch interest: business models and the circular economy. This study focuses on both of them, andinvestigates circular business models. Not many studies have been conducted on this specific topic.Most of the studies focused on a particular type of circular business model, its specificity and context.Those models are related to various schools of thought underlying the concept of the circular economy,and they appear in the literature pertaining to sustainability, industrial ecology, cleaner production,and a closed-loop economy with different names. However, most of them can be reflected by theReSOLVE framework developed by the Ellen MacArthur Foundation. The literature also indicatednumerous adoption factors, design and managerial tools, and evaluation models needed for circularbusiness models to operate.
Regarding the design of circular business models, existing literature identified various circularbusiness models, few business activities pertaining to the circular economy and some guidelines howto adapt existing business model to the circular economy. Yet, those studies were mostly case-based,and provided specific business models, but with limitations in their transferability. Although existingframeworks of business models can be used to apply the principles of the circular economy, hardlyany study identified how the CE principles can be applied to each component of the business modelframework. Hence, there is a need for a comprehensive conceptual framework for the circular businessmodel to support practitioners in the transition of their businesses towards circular economy.
This paper addresses the issue of designing a circular business model from the perspective ofevery company. It identifies how the principles of the circular economy apply to a popular businessmodel framework, and supplements this framework with additional components relevant to thecircular economy. In turn, the circular business model canvas has been developed on the basis ofthe business model canvas. The CBMC consists of eleven building blocks, encompassing not onlytraditional components with minor modifications, but also material loops and adaptation factors.The triple fit challenge to implement a circular business model has been identified as a success factor.The provided framework should assist practitioners in designing circular business models; however,it requires further examination due to limitations of this study.
494
Sustainability 2016, 8, 43
The conceptual framework of the circular business model proposed in this paper contributes tothe discussion on implementation of the circular economy, and supports practitioners with a tool toaccelerate the transition from linearity to circularity on a micro-level.
Conflicts of Interest: Conflicts of Interest: The author declares no conflict of interest.
References
1. Ellen MacArthur Foundation. Towards the Circular Economy: Accelerating the Scale-upAcross Global Supply Chains. Available online: http://www3.weforum.org/docs/ WEF_ENV_TowardsCircularEconomy_Report_2014.pdf (accessed on 31 December 2015).
2. Ellen MacArthur Foundation. Towards the Circular Economy. Opportunities for the Consumer GoodsSector. Available online: http://www.ellenmacarthurfoundation.org/assets/downloads/ publications/TCE_Report-2013.pdf (accessed on 31 December 2015).
3. Scott, J.T. The Sustainable Business a Practitioner’s Guide to Achieving Long-Term Profitability and Competitiveness,2nd ed.; Greenleaf Publishing: Sheffield, UK, 2015.
4. Ellen MacArthur Foundation. Towards the Circular Economy: Economic and Business Rationalefor an Accelerated Transition. Available online: http://mvonederland.nl/system/files/media/towards-the-circular-economy.pdf (accessed on 31 December 2015).
5. Planing, P. Business Model Innovation in a Circular Economy Reasons for Non-Acceptance of CircularBusiness Models. Open J. Bus. Model Innov. 2015. in press.
6. Ellen MacArthur Foundation. Delivering the Circular Economy a Toolkit for Policymakers; Ellen MacArthurFoundation: Cowes, UK, 2015.
7. Van Renswoude, K.; Wolde, A.T.; Joustra, D.J. Circular Business Models. Part 1: An introduction toIMSA’s Circular Business Model Scan. Available online: https://groenomstilling.erhvervsstyrelsen.dk/sites/default/files/media/imsa_circular_business_models_-_april_2015_-_part_1.pdf (accessed on 31December 2015).
8. Osterwalder, A.; Pigneur, Y. Business Model Generation: A Handbook for Visionaries, Game Changers, andChallengers; John Wiley and Sons: Hoboken, NJ, USA, 2010.
9. Wirtz, B.W. Business Model Management: Design—Instruments—Success Factors, 1st ed.; SpringerScience+Business Media B.V.: Dordrecht, The Netherlands, 2011.
10. Barquet, A.P.B.; de Oliveira, M.G.; Amigo, C.R.; Cunha, V.P.; Rozenfeld, H. Employing the business modelconcept to support the adoption of product-service systems (PSS). Ind. Mark. Manag. 2013, 42, 693–704.[CrossRef]
11. Mentink, B. Circular Business Model Innovation: A Process Framework and a Tool for Business ModelInnovation in a Circular Economy. Master’s Thesis, Delft University of Technology & Leiden University,Leiden, The Netherlands, 2014.
12. Lüdeke-Freund, F. Towards a Conceptual Framework of Business Models for Sustainability. In KnowledgeCollaboration & Learning for Sustainable Innovation, Proceedings of the ERSCP-EMSU Conference, Delft,The Netherlands, 25–29 October 2010.
13. Dewulf, K.R. Play it forward: A Game-based tool for Sustainable Product and Business Model Innovationin the Fuzzy Front End. In Knowledge Collaboration & Learning for Sustainable Innovation, Proceedings of theERSCP-EMSU Conference, Delft, The Netherlands, 25–29 October 2010.
14. De Jong, E.; Engelaer, F.; Mendoza, M. Realizing Opportunities of a Circular Business Model. Available online:http://circulatenews.org/2015/04/de-lage-landen-realising-the-opportunities-of-a-circular-business-model(accessed on 31 December 2015).
15. Pateli, A.G.; Giaglis, G.M. A research framework for analysing eBusiness models. Eur. J. Inf. Syst. 2004, 13,302–314. [CrossRef]
16. Joustra, D.J.; de Jong, E.; Engelaer, F. Guided Choices towards a Circular Business Model; North-West EuropeInterreg IVB: Lille, France, 2013.
17. Lovins, A.B.; Lovins, L.H.; Hawken, P.; June, M.A.Y. A Road Map for Natural Capitalism. Harv. Bus. Rev.1999, 77, 145–158. [PubMed]
495
Sustainability 2016, 8, 43
18. Linder, M.; Williander, M. Circular Business Model Innovation: Inherent Uncertainties. Bus. Strateg. Environ.2015. [CrossRef]
19. Ayres, R.U.; Simonis, U.E. Industrial Metabolism: Restructuring for Sustainable Development; United NationsUniversity Press: New York, NY, USA, 1994.
20. Renner, G.T. Geography of Industrial Localization. Econ. Geogr. 1947, 23, 167–189. [CrossRef]21. Boons, F.; Lüdeke-Freund, F. Business models for sustainable innovation: state-of-the-art and steps towards
a research agenda. J. Clean. Prod. 2013, 45, 9–19. [CrossRef]22. Laubscher, M.; Marinelli, T. Integration of Circular Economy in Business. In Proceedings of the Conference:
Going Green—CARE INNOVATION 2014, Vienna, Austria, 17–20 November 2014.23. Ellen MacArthur Foundation. Growth Within: A Circular Economy Vision for a Competitive Europe; Ellen
MacArthur Foundation: Cowes, UK, 2015.24. Govindan, K.; Soleimani, H.; Kannan, D. Reverse logistics and closed-loop supply chain: A comprehensive
review to explore the future. Eur. J. Oper. Res. 2014, 240, 603–626. [CrossRef]25. Lacy, P.; Rosenberg, D.; Drewell, Q.; Rutqvist, J. 5 Business Models that are Driving the Circular
Economy. Available online: http://www.fastcoexist.com/1681904/5-Business-Models-That-Are-Driving-the-Circular-Economy (accessed on 31 December 2015).
26. Bakker, C.A.; den Hollander, M.C.; van Hinte, E.; Zijlstra, Y. Products That Last—Product Design for CircularBusiness Models, 1st ed.; TU Delft Library/Marcel den Hollander IDRC: Delft, The Netherlands, 2014.
27. Damen, M.A. A Resources Passport for a Circular Economy. Master’s Thesis, Utrecht University, Utrecht,The Netherlands, 2012.
28. Lacy, P.; Keeble, J.; McNamara, R.; Rutqvist, J.; Haglund, T.; Cui, M.; Cooper, A.; Pettersson, C.; Kevin, E.;Buddemeier, P.; et al. Circular Advantage: Innovative Business Models and Technologies to Create Value in a Worldwithout Limits to Growth; Accenture: Chicago, IL, USA, 2014.
29. WRAP. Innovative Business Model Map. Available online: http://www.wrap.org.uk/content/innovative-business-model-map (accessed on 4 October 2015).
30. Tukker, A.; Tischner, U. Product-services as a research field: Past, present and future. Reflections from adecade of research. J. Clean. Prod. 2006, 14, 1552–1556. [CrossRef]
31. Van Ostaeyen, J.; van Horenbeek, A.; Pintelon, L.; Duflou, J.R. A refined typology of product–service systemsbased on functional hierarchy modeling. J. Clean. Prod. 2013, 51, 261–276. [CrossRef]
32. El-Haggar, S. Cleaner Production. In Sustainable Industrial Design and Waste Management: Cradle-to-Cradle forSustainable Development; Academic Press: Amsterdam, The Netherlands, 2007.
33. Bakker, C.; Wang, F.; Huisman, J.; den Hollander, M. Products that go round: Exploring product life extensionthrough design. J. Clean. Prod. 2014, 69, 10–16. [CrossRef]
34. Moser, F.; Jakl, T. Chemical leasing—A review of implementation in the past decade. Environ. Sci. Pollut. Res.2014, 22, 6325–6348. [CrossRef] [PubMed]
35. Bautista-Lazo, S. Sustainable Manufacturing: Turning Waste Into Profitable Co-Products; University of Liverpool:Liverpool, UK, 2013.
36. Tukker, A. Eight Types of Product Service Systems: Eight Ways To Sustainability? Bus. Strateg. Environ. 2004,13, 246–260. [CrossRef]
37. Osterwalder, A.; Pigneur, Y.; Bernarda, G.; Smith, A. Value Proposition Design: How to Create Products andServices Customers Want; John Wiley and Sons: Hoboken, NJ, USA, 2014.
38. Stubbs, W.; Cocklin, C. Conceptualizing a “Sustainability Business Model”. Organ. Environ. 2008, 21, 103–127.[CrossRef]
39. Roome, N.; Louche, C. Journeying Toward Business Models for Sustainability: A Conceptual Model FoundInside the Black Box of Organisational Transformation. Organ. Environ. 2015. [CrossRef]
40. Gauthier, C.; Gilomen, B. Business Models for Sustainability: Energy Efficiency in Urban Districts.Organ. Environ. 2015. [CrossRef]
41. Abdelkafi, N.; Täuscher, K. Business Models for Sustainability From a System Dynamics Perspective.Organ. Environ. 2015. [CrossRef]
42. Jabłonski, A. Design and Operationalization of Technological Business Models. Acta Univ. Agric. Silvic.Mendelianae Brun. 2015, 63, 927–935. [CrossRef]
43. Upward, A.; Jones, P. An Ontology for Strongly Sustainable Business Models: Defining an EnterpriseFramework Compatible With Natural and Social Science. Organ. Environ. 2015. [CrossRef]
496
Sustainability 2016, 8, 43
44. Nilsson, N.; Söderberg, V. How to Future Proof a Business Model: Capture and Capitalize Value in the Fieldof Urban Mining. Master’s Thesis, Blekinge Institute of Technology, Karlskrona, Sweden, 2015.
45. Parlikad, A.K.; Mcfarlane, D.; Fleisch, E.; Gross, S. The Role of Product Identity in End-of-Life DecisionMaking. Available online: www.alexandria.unisg.ch/export/DL/Sandra_Gross/21460.pdf (accessed on 31December 2015).
46. Guinée, J.B. Handbook on Life Cycle Assessment: Operational Guide to the ISO Standards. In Book Review:The Second Dutch LCA-Guide; Springer Science+Business Media B.V.: Dordrecht, The Netherlands, 2002;pp. 311–313.
47. De Winter, J. Circular Business Models: An Opportunity to Generate New Value, Recover Value and MitigateRisk Associated with Pressure on Raw Material Availability and Price Volatility. Master’s Thesis, Universityof Utrecht, Utrecht, The Netherlands, 2014.
48. Scheepens, A.E.; Vogtländer, J.G.; Brezet, J.C. Two life cycle assessment (LCA) based methods to analyseand design complex (regional) circular economy systems. Case: Making water tourism more sustainable.J. Clean. Prod. 2015. in press. [CrossRef]
49. Beuren, F.H.; Gomes Ferreira, M.G.; Cauchick Miguel, P.A. Product-service systems: A literature review onintegrated products and services. J. Clean. Prod. 2013, 47, 222–231. [CrossRef]
50. Jabłonski, A. Network Dynamics and Business Model Dynamics in Improving a Company’s Performance.Int. J. Econ. Commer. Manag. 2015, 3, 1–10.
51. Pearce, J.A. The Profit-Making Allure of Product Reconstruction. MIT Sloan Manag. Rev. 2009, 50, 59–65.52. Zairul, M.; Wamelink, J.W.; Gruis, V.; John, L. New industrialised housing model for young starters in
Malaysia: Identifying problems for the formulation of a new business model for the housing industry.In Proceedings of the APNHR 2015: The Asia Pacific Network for Housing Research, Gwangju, Korea, 9–11April 2015.
53. Roos, G. Business Model Innovation to Create and Capture Resource Value in Future Circular MaterialChains. Resources 2014, 3, 248–274. [CrossRef]
54. Bechtel, N.; Bojko, R.; Völkel, R. Be in the Loop: Circular Economy & Strategic Sustainable Development.Master’s Thesis, Blekinge Institute of Technology, Karlskrona, Sweden, 2013.
55. United Nation Environment Programme (UNEP). Product-Service Systems and Sustainability; UNEP:Washington, DC, USA, 2002; pp. 1–31.
56. Besch, K. Product-service systems for office furniture: Barriers and opportunities on the European market.J. Clean. Prod. 2005, 13, 1083–1094. [CrossRef]
57. Heese, H.S.; Cattani, K.; Ferrer, G.; Gilland, W.; Roth, A.V. Competitive advantage through take-back of usedproducts. Eur. J. Oper. Res. 2005, 164, 143–157. [CrossRef]
58. Walsh, B. PSS for Product Life Extension through Remanufacturing. In Proceedings of the 2nd CIRP IPS2
Conference, Linköping, Sweden, 14–15 April 2010; pp. 261–266.59. Firnkorn, J.; Müller, M. Selling Mobility instead of Cars: New Business Strategies of Automakers and the
Impact on Private Vehicle Holding. Bus. Strateg. Environ. 2012, 21, 264–280. [CrossRef]60. Shafiee, A.; Stec, T. Gaining a Competitive Advantage with Sustainable Business—Implementing Inductive
Charging using Systems Thinking, A Benchmarking of EVs and PHEVs. Master’s Thesis, ChalmersUniversity of Technology, Göteborg, Sweden, 2014.
61. Andersson, D.; Stavileci, S. An Assessment of How Circular Economy can Be Implemented in the AerospaceIndustry. Master’s Thesis, Blekinge Institute of Technology, Karlskrona, Sweden, 2015.
62. Jasch, C. How to perform an environmental management cost assessment in one day. J. Clean. Prod. 2006, 14,1194–1213. [CrossRef]
63. Jasch, C. Environmental management accounting (EMA) as the next step in the evolution of managementaccounting. J. Clean. Prod. 2006, 14, 1190–1193. [CrossRef]
64. Gale, R. Environmental management accounting as a reflexive modernization strategy in cleaner production.J. Clean. Prod. 2006, 14, 1228–1236. [CrossRef]
65. Sheu, J.-B. Green Supply Chain Collaboration for Fashionable Consumer Electronics Products underThird-Party Power Intervention—A Resource Dependence Perspective. Sustainability 2014, 6, 2832–2875.[CrossRef]
66. Robinson, J.; Brase, G.; Griswold, W.; Jackson, C.; Erickson, L. Business Models for Solar Powered ChargingStations to Develop Infrastructure for Electric Vehicles. Sustainability 2014, 6, 7358–7387. [CrossRef]
497
Sustainability 2016, 8, 43
67. Rifkin, J. The Zero Marginal Cost Society: The Internet of Things, the Collaborative Commons, and the Eclipse ofCapitalism; St. Martin’s Press: New York, NY, USA, 2014.
68. Freyermuth, G.S. Edges & Nodes/Cities & Nets: The History and Theories of Networks and WhatThey Tell Us about Urbanity in the Digital Age. Available online: http://periodicals.narr.de/index.php/real/article/view/1576/1555 (accessed on 31 December 2015).
69. Waste Management. Recycling 2.0: Recycling Engagement and Education. Available online:http://www.cafr.org/summit/speakers/ppt/2015-06-08_11:10:00__Robinson_Susan.pdf (accessed on 31December 2015).
70. Subramanian, N.; Gunasekaran, A. Cleaner supply-chain management practices for twenty-first-centuryorganizational competitiveness: Practice-performance framework and research propositions.Int. J. Prod. Econ. 2015, 164, 216–233. [CrossRef]
71. Sivertsson, O.; Tell, J. Barriers to Business Model Innovation in Swedish Agriculture. Sustainability 2015, 7,1957–1969. [CrossRef]
72. Berning, A.; Venter, C. Sustainable Supply Chain Engagement in a Retail Environment. Sustainability 2015, 7,6246–6263. [CrossRef]
73. Skelton, K.; Pattis, A. Life Cycle Management In Product Development: A Comparative Analysis of IndustryPractices Kristen. In Proceedings of the 6th International Conference on Life Cycle Management, Gothenburg,Sweden, 25–28 August 2013.
74. Pearce, D.W.; Turner, R.K. Economics of Natural Resources and the Environment; Johns Hopkins UniversityPress: Baltiomre, MD, USA, 1990.
75. Frankenberger, K.; Weiblen, T.; Csik, M.; Gassmann, O. The 4I-framework of business model innovation:A structured view on process phases and challenges. Int. J. Prod. Dev. 2013, 18, 249–273. [CrossRef]
76. WRAP. Innovative Business Models. Available online: http://www.wrap.org.uk/content/innovative-business-models-1 (accessed on 31 December 2015).
77. Mahadevan, B. Business Models for Internet-Based E-Commerce: An Anatomy. Calif. Manag. Rev. 2000, 42,55–69. [CrossRef]
78. Afuah, A.; Tucci, C.L. Internet Business Models and Strategies: Text and Cases, 1st ed.; Mcgraw-Hill College:Columbus, OH, USA, 2000.
79. Papakiriakopoulos, D.A.; Poylumenakou, A.K.; Doukidis, G.J. Building E-Business Models: An AnalyticalFramework and Development Guidlines. In Proceedings of the 14th Bled Electronic Commerce Conference,Bled, Slovenia, 25–26 June 2001.
80. Chesbrough, H.; Rosenbloom, R.S. The role of the business model in capturing value from innovation:evidence from Xerox Corporation’s technology spin-off companies. Ind. Corp. Chang. 2002, 11, 529–555.[CrossRef]
81. Linder, J.; Cantrell, S. Changing Business Models: Surveying the Landscape; Accenture Institute for StrategicChange: Cambridge, MA, USA, 2000.
82. Al-debei, M.M.; El-Haddadeh, R.; Avison, D. Defining the Business Model in the New World of DigitalBusiness. In Proceedings of the 14th Americas Conference on Information Systems, Toronto, ON, Canada,14–17 August 2008.
83. Osterwalder, A.; Pigneur, Y.; Tucci, C.L. Clarifying Business Models: Origins, Present, and Future of theConcept. Commun. Assoc. Inf. Syst. 2005, 16, 1–25.
84. Bautista-Lazo, S.; Short, T. Introducing the All Seeing Eye of Business: A model for understanding the nature,impact and potential uses of waste. J. Clean. Prod. 2013, 40, 141–150. [CrossRef]
85. Buxel, H.; Esenduran, G.; Griffin, S. Strategic sustainability: Creating business value with life cycle analysis.Bus. Horiz. 2015, 58, 109–122. [CrossRef]
86. Saebi, T.; Foss, N.J. Business models for open innovation: Matching heterogenous open innovation strategieswith business model dimensions. Eur. Manag. J. 2014, 33, 201–213. [CrossRef]
87. Kocabasoglu, C.; Prahinski, C.; Klassen, R.D. Linking forward and reverse supply chain investments: The roleof business uncertainty. J. Oper. Manag. 2007, 25, 1141–1160. [CrossRef]
88. Bocken, N.M.P.; Short, S.W.; Rana, P.; Evans, S. A literature and practice review to develop sustainablebusiness model archetypes. J. Clean. Prod. 2014, 65, 42–56. [CrossRef]
498

Sustainability 2016, 8, 43
89. Joyce, A.; Paquin, R.; Pigneur, Y. The triple layered business model canvas: A tool to design more sustainablebusiness models. In Proceedings of the ARTEM Organizational Creativity International Conference, Nancy,France, 26–27 March 2015.
90. Talonen, T.; Hakkarainen, K. Elements of sustainable business models. Int. J. Innov. Sci. 2014, 6, 43–54.[CrossRef]
91. Seay, S.S. How incorporating a sustainable business model creates value. Bus. Stud. J. 2015, 7, 46–61.92. Lewandowski, M. Introduction to Academic Entrepreneurship. In Academic Entrepreneurship and Technological
Innovation; Szopa, A., Karwowski, W., Ordóñez de Pablos, P., Eds.; IGI Global: Hershey, PA, USA, 2013.
© 2016 by the author. Licensee MDPI, Basel, Switzerland. This article is an open accessarticle distributed under the terms and conditions of the Creative Commons Attribution(CC BY) license (http://creativecommons.org/licenses/by/4.0/).
499


MDPISt. Alban-Anlage 66
4052 BaselSwitzerland
Tel. +41 61 683 77 34Fax +41 61 302 89 18
www.mdpi.com
Sustainability Editorial OfficeE-mail: [email protected]
www.mdpi.com/journal/sustainability


MDPI St. Alban-Anlage 66 4052 Basel Switzerland
Tel: +41 61 683 77 34 Fax: +41 61 302 89 18
www.mdpi.com ISBN 978-3-03897-561-8
Related Documents


