How to Make an Energy Bar Chart 1. Determine what is in the system

How to Make an Energy Bar Chart 1. Determine what is in the system.
Dec 13, 2015
Welcome message from author
This document is posted to help you gain knowledge. Please leave a comment to let me know what you think about it! Share it to your friends and learn new things together.
Transcript

How to Make an Energy Bar Chart
1. Determine what is in the system

2. Choose a height for each bar. Draw a bar for each kind of energy in the system.
• there is no kinetic and elastic potential energy in the initial state• there is no gravitational and elastic potential energy in the final
state• there is no work done by external forces• the sum of the heights on the right (5 units) equals the sum of the
heights on the left (5 units)

3. If energy leaves or enters the system, make a bar for work done by the system (example: heat lost because of friction)

Or work done on the system (skier’s poles moving a skier faster)

1 The energy in the system changes. This change is equal to the force that Stephen exerts on David multiplied by the distance David moves.
2 The energy in the system changes. This change is equal to the force that Stephen exerts on David multiplied by the distance David moves multiplied by the cos 40o.
3 David is moving at a constant speed, thus the net force exerted on David is zero. Zero net force means zero work. Thus, the energy of the system does not change.
Stephen is pulling David up at a constant speed on a frictionless water slide.
Which of the following statements best describes the situation?
Construct a statement involving energy and work that best describes the situation.
40o
Earth
System

A situation is described with a bar chart and in words. Which verbal description matches this bar chart?
Kinitial + Ug initial + Us initial + W = Kfinal + Ug final + Us final +Eint
1 An object fell off a cliff and energy in the system was transferred from gravitational potential energy to kinetic energy.
2 A spring on a table shot an object. You measured the kinetic energy of the object when it landed at the same elevation.
3 A spring shot an object vertically from a height above the ground. You then measure the kinetic energy at ground level just before the ball hits the ground.
A situation is described with a bar chart. Construct a verbal description that matches this bar chart.

A situation is represented pictorially below. Which bar chart best matches the picture?
Earth
ti, yi = 0v = constant
t, y = hy
system
Ko + Ugo W K + Ug + Us
1
2
3
A situation is represented pictorially below. Construct a bar chart that best matches the picture.

Tim is carrying a basket of laundry to be washed. This motion is represented by a free body diagram and a motion diagram.
Which verbal description best matches the diagrams? (The earth and basket are the system)
1 Since the basket is moving, work is done on the basket and that is all we are able to tell.
2 Tim does work, but the systems energy does not change.
3 The velocity is constant, the height is constant and Tim is doing work. The internal energy of the system must be increasing.
4 No work is being done on the system which implies the system’s energy does not change.
= constant
y
x
Earth
basketon handF
basketon earthF
v
Construct a verbal description that best matches the diagrams. (The earth and basket are the system)

Alan is on a frictionless kiddie coaster.
Which energy bar chart best matches this situation as the car goes to the bottom? hi=h
vi=0h>hf >0
vf >0
Ki + Ugi W = Kf + Ugf
Ki + Ugi W = Kf + Ugf Ki + Ugi W = Kf + Ugf
1
2 3
Construct an energy bar chart that best matches this situation as the car goes to the bottom.
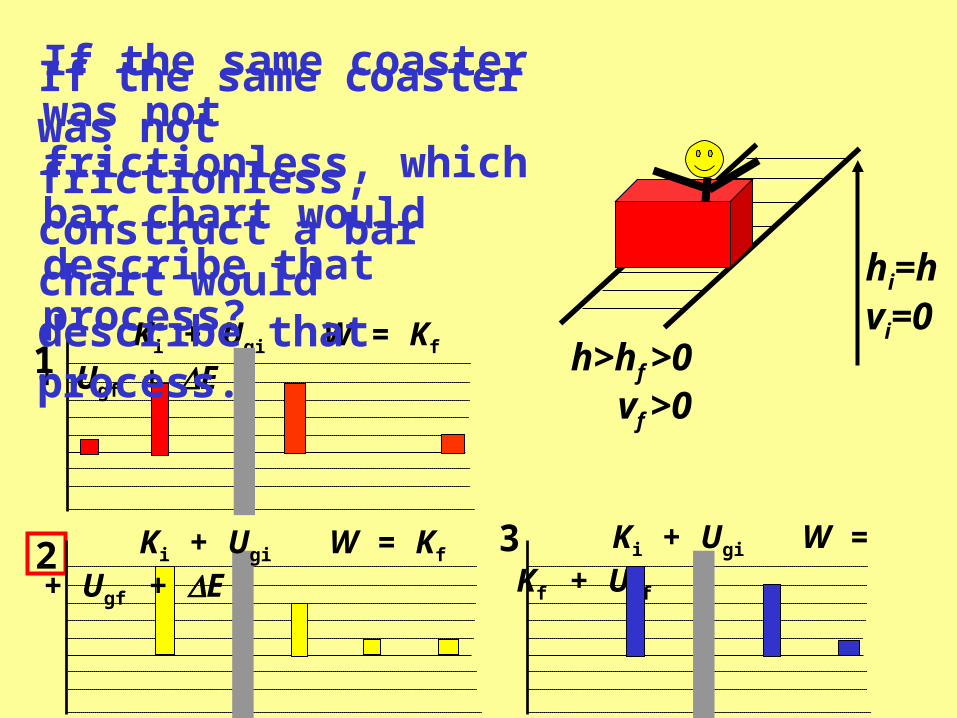
If the same coaster was not frictionless, which bar chart would describe that process?
hi=hvi=0
vf >0
Ki + Ugi W = Kf + Ugf + E
Ki + Ugi W = Kf + Ugf
1
2 3 Ki + Ugi W = Kf + Ugf + E
h>hf >0
If the same coaster was not frictionless, construct a bar chart would describe that process.

Ki + Ugi W = Kf + Ugf
A roller coaster car’s trip is described by the energy bar chart shown below.
Which final point in the picture below matches the bar chart?
Initial
1 Final
2 Final
3 Final
4 Final
5 Final
y
0
Construct a picture showing the final and initial points below that matches the bar chart.

Ki + Ugi W = Kf + E
The energy bar chart below represents a car’s motion.
Which motion diagram matches this situation?
initialv
finalv
finalv
initialv
finalv
initialv
0final v
1
4
2
3
initialv
Construct a motion diagram that matches this situation.

A car is moving horizontally as described by the motion diagram below.
Which energy bar chart best matches this?finalv
Ki + Ugi W = Kf + Ugf1
3
initialv
Ki + Ugi W = Kf + Ugf
Ki + Ugi W = Kf + Ugf4 Ki + Ugi W = Kf + Ugf
2Construct an energy bar chart that best matches the above motion diagram.
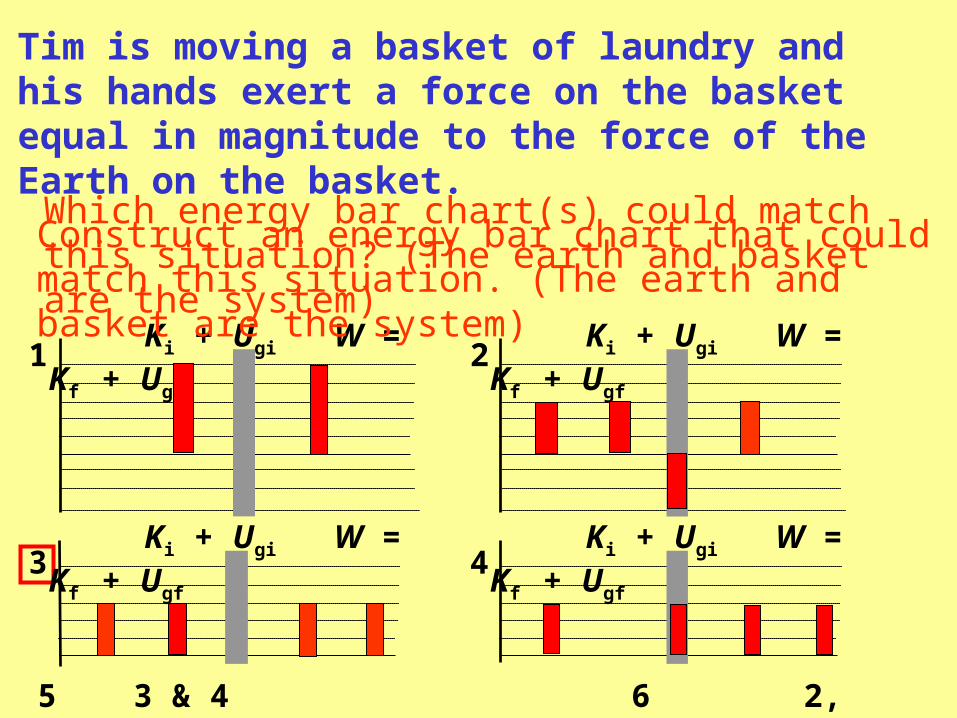
Tim is moving a basket of laundry and his hands exert a force on the basket equal in magnitude to the force of the Earth on the basket.
Which energy bar chart(s) could match this situation? (The earth and basket are the system)
Ki + Ugi W = Kf + Ugf
Ki + Ugi W = Kf + Ugf
1
3
Ki + Ugi W = Kf + Ugf
Ki + Ugi W = Kf + Ugf
2
4
5 3 & 4 6 2, 3 & 4
Construct an energy bar chart that could match this situation. (The earth and basket are the system)
Related Documents