April 16, 2010 HOW LESS BECAME MORE… Wind, Power and Unintended Consequences in the Colorado Energy Market © BENTEK Energy, LLC www.bentekenergy.com Wind energy promises a clean, renewable resource that uses no fossil fuel and generates zero emissions. Careful examination of the data suggests that the numbers do not add up as expected. The “must take” provisions of Colorado’s Renewable Portfolio Standard require that other sources of generation, such as coal plants, must be “cycled” to accommodate wind power. This cycling makes coal generating units operate much less efficiently… so inefficiently, that these units produce significantly greater emissions. This study reviews the data that supports this conclusion, outlines mitigation measures which can be used to realize the full potential of wind generation, and provides recommendations for policy makers.

Welcome message from author
This document is posted to help you gain knowledge. Please leave a comment to let me know what you think about it! Share it to your friends and learn new things together.
Transcript

April 16, 2010
HOW LESS BECAME MORE…Wind, Power and Unintended Consequences
in the Colorado Energy Market
© BENTEK Energy, LLC www.bentekenergy.com
Wind energy promises a clean, renewable resource that uses no fossil fuel and generates zero emissions. Careful examination of the data suggests that the numbers do not add up as expected.
The “must take” provisions of Colorado’s Renewable Portfolio Standard require that other sources of generation, such as coal plants, must be “cycled” to accommodate wind power. This cycling makes coal generating units operate much less efficiently…so inefficiently, that these units produce significantly greater emissions.
This study reviews the data that supports this conclusion, outlines mitigation measures which can be used to realize the full potential of wind generation, and provides recommendations for policy makers.
Page 2 of 77
How Less Became More: Wind, Power and Unintended Consequences in the
Colorado Energy Market
Prepared for
Independent Petroleum Association of Mountain States
April 16, 2010

Page 3 of 77
About BENTEK Energy, LLC BENTEK Energy, LLC, is the leading energy markets information company. Based in Evergreen, Colorado, BENTEK brings customers the analytical tools and competitive intelligence needed to make time-critical, bottom-line decisions in today's natural gas and power markets. Additional information about BENTEK Energy is available on the Web at www.bentekenergy.com. Questions? Contact BENTEK Energy at 303-988-1320. DISCLAIMER. THIS REPORT IS FURNISHED ON AN “AS IS” BASIS. BENTEK DOES NOT WARRANT THE ACCURACY OR CORRECTNESS OF THE REPORT OR THE INFORMATION CONTAINED THEREIN. BENTEK MAKES NO WARRANTY, EXPRESS OR IMPLIED, AS TO THE USE OF ANY INFORMATION CONTAINED IN THIS REPORT IN CONNECTION WITH TRADING OF COMMODITIES, EQUITIES, FUTURES, OPTIONS OR ANY OTHER USE. BENTEK MAKES NO EXPRESS OR IMPLIED WARRANTIES AND EXPRESSLY DISCLAIMS ALL WARRANTIES OF MERCHANTABILITY OR FITNESS FOR A PARTICULAR PURPOSE. RELEASE AND LIMITATION OF LIABILITY: IN NO EVENT SHALL BENTEK BE LIABLE FOR ANY DIRECT, INDIRECT, SPECIAL, INCIDENTAL, OR CONSEQUENTIAL DAMAGES (INCLUDING LOST PROFIT) ARISING OUT OF OR RELATED TO THE ACCURACY OR CORRECTNESS OF THIS REPORT OR THE INFORMATION CONTAINED THEREIN, WHETHER BASED ON WARRANTY, CONTRACT, TORT OR ANY OTHER LEGAL THEORY.
Page 4 of 77
Table of Contents I. Introduction ........................................................................................................................... 8
Report Organization ............................................................................................................ 11Data Sources ...................................................................................................................... 11
II. Wind Energy and PSCO .................................................................................................... 13PSCO’s Generation Mix ...................................................................................................... 13PSCO Demand ................................................................................................................... 16
III. Wind, Gas and Coal Integration ........................................................................................ 22Impact of Cycling ................................................................................................................ 25
IV. Estimating the Emissions Impact of Wind Energy in PSCO’s Territory ............................. 34Data and Methodology ........................................................................................................ 34The July 2, 2008, Wind Event ............................................................................................. 35Conclusions ........................................................................................................................ 42Sept. 28-29, 2008 .............................................................................................................. 43Conclusions ........................................................................................................................ 47
V. Coal Cycling Impacts on PSCO Territory Emissions ......................................................... 48Coal-fired Generation Cycling ............................................................................................. 48Cycling Caused Emissions ................................................................................................. 51Specific-Event Approach .................................................................................................... 51Full-Year Approach ............................................................................................................. 53Conclusions ........................................................................................................................ 55
VI. Wind, Coal and Natural Gas Interaction in ERCOT .......................................................... 56Electric Reliability Council of Texas .................................................................................... 56Data and Methodological Considerations ........................................................................... 60Frequency of Coal and Gas Cycling ................................................................................... 61Emission Impacts - The Deely Plant Case Study ................................................................ 63ERCOT General Analysis ................................................................................................... 66Specific-Event Approach .................................................................................................... 66Full-Year Approach ............................................................................................................. 67Conclusions ........................................................................................................................ 69
VII. Toward a Solution: Substituting Gas-fired Generation for Coal ....................................... 70Methodology ....................................................................................................................... 70Results ................................................................................................................................ 71

Page 5 of 77
Table of Contents Continued Conclusions ........................................................................................................................ 72
VIII. Conclusions and Mitigation Suggestions ........................................................................ 73Conclusions ........................................................................................................................ 73Mitigation Recommendations ............................................................................................. 76
Page 6 of 77
Table of Figures
Figure I-1 Denver Non-attainment Area Plants Have Experienced Higher Emissions Since 2006 ............................................................................ 10Figure II-1 PSCO Capacity Mix: Owned and Leased Resources ........................................... 13Figure II-2 PSCO’s Coal-Fired Generation Resources: Location, Size and Age .................... 14Figure II-3 PSCO’s Wind Facilities: Location, Size and Age .................................................. 15Figure II-4 Natural Gas Generated Resources ....................................................................... 15Figure II-5 Average Daily Demand Is Falling At A 3% Average Annual Rate ......................... 17Figure II-6 Percent Annual Change in Sales (2004-08) .......................................................... 18Figure II-7 Average Day Load Curve and Generation Mix ...................................................... 19Figure III-1 Wind Blows Strongest Between 9:00 pm & 5:00 am When Demand Is Weakest 22Figure III-2 Impact of Wind on Generation Stack ................................................................... 23Figure III-3 Distribution of ERCOT Coal Cycling Instances by Magnitude of Hour-over-Hour Change .............................................................................. 25Figure III-4 Impact of Generation Decline on Heat Rate ......................................................... 26Figure III-5 Comparison of Heat Rate Vs Generation Across All PSCO Coal Plants (2006 vs 2008) .................................................................................... 27Figure III-6 Change in Heat Rate 2006-08 at the Cherokee Plant, Unit 4 ............................... 28Figure IV-1 Wind Event on PSCO System (July2, 2008) ........................................................ 35Figure IV-2 Hour-to-Hour Change in Generation (MW) .......................................................... 36Figure IV-3 Actual and Projected Generation at Cherokee Plant ........................................... 38Figure IV-4 Actual and Projected Generation July 2, 2008 ..................................................... 38Figure IV-5 Incremental Emissions Resulting From Cycling Cherokee on July 2, 2008 ......... 41Figure IV-6 Incremental Emissions Impact of Coal Plant Cycling All Plants - July 2, 2008 .... 42Figure IV-7 Incremental Emissions July 2, 2008 by Plant ...................................................... 42Figure IV-8 Sept. 28–29, 2008, Wind Event .......................................................................... 43Figure IV-9 Generation from Coal Plants Sept. 28–29, 2008, Compared to Sept. 22-23, 2008 ............................................................................................. 44Figure IV-10 Hour-to-Hour Change in Generation Sept. 28–29, 2008 .................................... 44Figure IV-11 Estimated Avoided Generation Due to Wind Event Sept. 28–29, 2008 ............. 45Figure IV-12 Distribution of Extra Emissions by Plant Sept. 28-29, 2008 ............................... 46Figure V-1 Distribution of Coal-Fired Plant Cycling Events: All Plants Combined .................. 49Figure V-2 Distribution of Coal-Fired Plant Cycling Events: All Plants Calculated Individually ............................................................................................ 50Figure V-3 Distribution of Gas Plant Cycling Events: All Plants Combined ............................ 50Figure V-4 Incremental Emissions Resulting Coal Cycling (Specific-Event Approach) .......... 52Figure V-5 Incremental Emissions Resulting Coal Cycling (Full-Year Approach) .................. 54Figure V-6 Incremental Emissions by Plant in 2009 (Quarterly Analysis) ............................... 55Figure VI-1 ERCOT Encompases 91% of Texas Consumers ................................................ 57Figure VI-2 2009 ERCOT Capacity Mix (MW) ........................................................................ 57Figure VI-4 2009 ERCOT Generation by Fuel Type (Ths of GWh) ........................................ 58Figure VI-3 Total Wind Generation Capacity in ERCOT ........................................................ 58Figure VI-5 ERCOT 2009 Average Hourly Generation by Fuel Type & Season (MW) ........... 60Figure VI-6 Coal Plants Are Cycled as Wind Generation Increases (Nov. 5-12, 2008) .......... 61Figure VI-7 ERCOT Coal Cycling Events ............................................................................... 62
Page 7 of 77
Table of Figures Continued Figure VI-8 ERCOT, Wind Induced Coal Cycling & Wind Generation .................................... 63Figure VI-9 ERCOT Generation Mix: 11/8/2008 – 11/9/2008 ................................................. 63Figure VI-10 J.T. Deeley Generation & Emissions: Nov. 8-9, 2008 ........................................ 64Figure VI-11 J.T. Deeley Generation & Emission Rates: Nov. 8-9, 2008 .............................. 65Figure VI-12 J.T. Deeley Generation: Nov. 9, 2008 ............................................................... 65Figure VI-13 Incremental Emissions Resulting from Coal Cycling (Specific-Event Approach) ................................................................................. 67Figure VI-14 Incremental Emissions Resulting from Coal Cycling (Full-Year Approach) ....... 68Figure VII-1 Estimated Emissions Savings from Replacement of Cherokee and Valmont with Gas-fired Generation ................................................................. 72 Table II-1 Utilization Rates by Plant ....................................................................................... 20Table IV-1 Ramp Rate for Selected PSCO Plants ................................................................. 37Table IV-2 Estimated Emission Savings Due to Wind on July 2, 2008 (Method A) ................ 39Table IV-3 Emission Savings Due to Wind on July 2, 2008 (Method B) ................................ 39Table IV-4 Estimated Emission Savings Due to Wind on July 2, 2008 (Method C) ................ 40Table IV-5 Excess Emissions Resulting from Sept. 28-29 Wind Event .................................. 46Table V-1 Comparison of Average Emission Rates Monthly vs. Quarterly ............................. 52Table VI-1 RPS Capacity Standards for TX ........................................................................... 58Table VII-1 Estimated Available Gas-fired Capacity after Replacing Cherokee and Valmont (Annual Calculation) ......................................................... 71Table VII-2 Number of Hours Installed Gas Capacity Cannot Meet Incremental Demand ..... 71Table VIII-1 ............................................................................................................................. 74 Example III-A .......................................................................................................................... 29Example III-B .......................................................................................................................... 30Example III-C ......................................................................................................................... 30Example III-D ......................................................................................................................... 31Example III-E .......................................................................................................................... 31
Page 8 of 77
I. Introduction
Sometimes things are not what they seem. Nowhere is this more evident than in the realm of state and federal energy policies. In 2004, Colorado became the 17th state to adopt renewable energy standards when voters passed Amendment 37. Colorado reaffirmed its commitment to wind and solar energy in 2007 when the state legislature passed HB 1281, increasing the requirement for utilities to purchase renewable energy by 100%, and by adopting the Climate Action Plan in which renewable energy plays a central role in the state’s strategy of reducing “greenhouse gas emissions by 20% below 2005 levels by 2020."1
The expected environmental benefit of these measures is perhaps best summarized in this quote from Environment Colorado:
“Smog and air pollution continue to plague much of Colorado and part of the problem is caused by coal-fired power plants. Requiring a modest 10 percent of our electricity to come from renewable energy sources is equivalent to eliminating the pollution from 600,000 cars per year, thereby reducing smog and easing costly health problems.”2
According to advocates, renewable energy will not only be a major tool to reduce our carbon output, but also, by displacing coal and natural gas, renewable energy will reduce smog and other air pollution, presumably by reducing sulfur dioxide (SO2) and nitrous oxides (NOX
), principal components of ozone and smog.
This report, sponsored by the Independent Producers Association of Mountain States, concludes that the emissions benefits of renewable energy are not being realized as planned based on examination of four years of Public Service Company of Colorado (PSCO) operational history. Integrating erratic and unpredictable wind resources with established coal and natural gas generation resources requires PSCO to cycle its coal and natural gas-fired plants.3 Cycling coal plants to accommodate wind generation makes the plants operate inefficiently, which drives up emissions. Moreover, when they are not operated consistently at their designed temperatures, the variability causes problems with the way they interact with their associated emission control technologies, frequently causing erratic emission behavior that can last for several hours before control is regained. Ironically, using wind to a degree that forces utilities to temporarily reduce their coal generation results in greater SO2, NOX and CO2
than would have occurred if less wind energy were generated and coal generation were not impacted.
1 Colorado Climate Action Plan http://www.coloradoclimate.org/ 2 Environment Colorado website, http://environmentcolorado.org/envcoenergy.asp?id2=22373 3 As used in this report, the term cycling refers to sudden increases or decreases in power generation output. Cycling occurs for a variety of reasons including making way for alternative generation, maintenance and/or equipment failure or sudden changes in load size.
Page 9 of 77
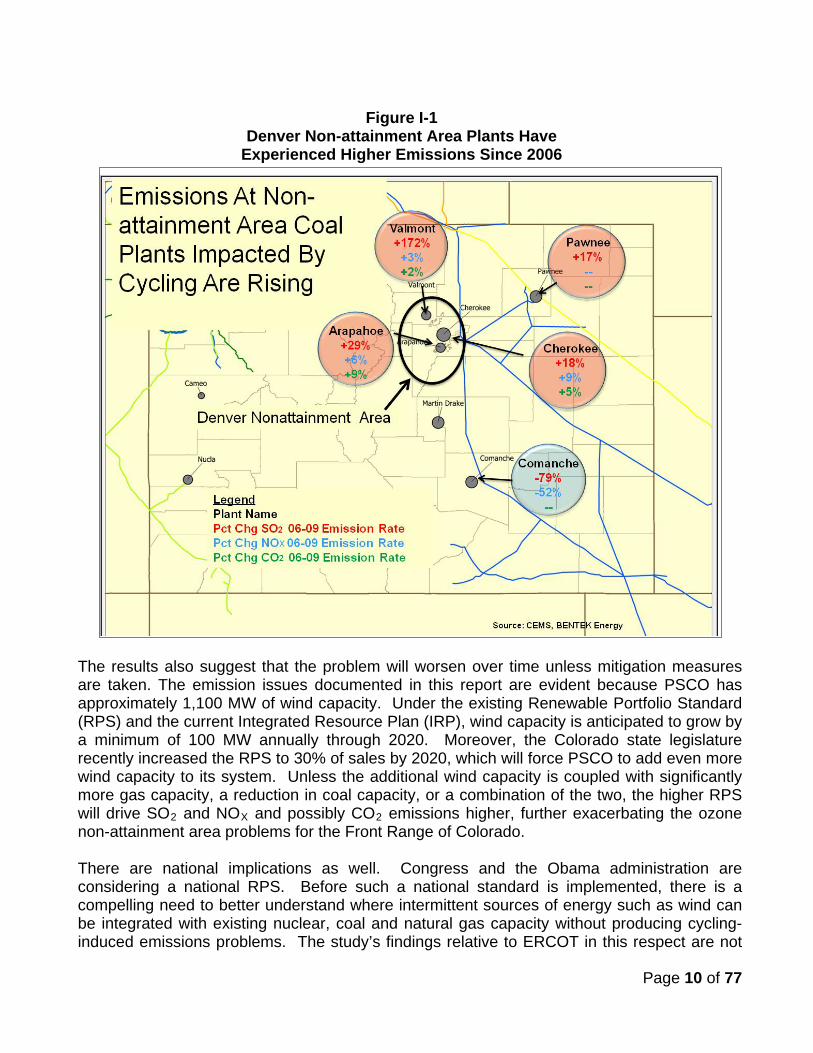
An analysis of the Electric Reliability Council of Texas (ERCOT), which also operates under a mandate to use renewable energy, validates the emissions findings for PSCO. The underlying problem is the same for both PSCO and ERCOT: the generation capacity of wind resources has become too large relative to the capacity that is available from coal and natural gas facilities. Natural gas-fired combustion turbines and combined-cycle facilities are designed to accommodate cycling. Because gas resources are insufficient to offset all of the wind energy produced in PSCO and ERCOT, coal units must be cycled to counterbalance the amount of wind that cannot be offset by natural gas. As a result, when the wind energy is generated at a high enough rate, PSCO is forced to scale-back generation from its coal-fired resources. But, coal equipment is not built for cycling. Coal boilers are designed to be operated as a base load resource – in other words, to operate at a consistent output level all the time. Cycling causes coal units to operate less efficiently and reduces the effectiveness of the environmental control equipment, substantially increasing emissions. The results of this study help explain why PSCO’s coal-fired plants located in the Denver non-attainment area have experienced an increase in SO2, NOX and CO2Figure I-1
over the past few years. below shows the change in emissions generated at the plants in proximity to the
Denver non-attainment area – Valmont, Arapahoe, Cherokee and Pawnee, and the Comanche plant located outside of Pueblo. Between 2006 and 2009 despite the introduction of over 700 MW of wind energy, all of the Denver area plants except Cherokee show higher levels of SO2, all show higher levels of NOX and all but Pawnee show higher levels of CO2. The Cherokee plant switched to a lower sulfur coal in 2008, thus, even the lower SO2 readings at that plant cannot be attributed to the benefits of wind energy. Furthermore, during the 2006-to-2009 period, generation from the non-attainment area plants fell by over 37%, which makes the increase in emissions even more significant particularly in light of the EPA’s announced intent to mandate tighter restrictions on SO2 and NOX
emission levels by 2011.
Page 10 of 77
The results also suggest that the problem will worsen over time unless mitigation measures are taken. The emission issues documented in this report are evident because PSCO has approximately 1,100 MW of wind capacity. Under the existing Renewable Portfolio Standard (RPS) and the current Integrated Resource Plan (IRP), wind capacity is anticipated to grow by a minimum of 100 MW annually through 2020. Moreover, the Colorado state legislature recently increased the RPS to 30% of sales by 2020, which will force PSCO to add even more wind capacity to its system. Unless the additional wind capacity is coupled with significantly more gas capacity, a reduction in coal capacity, or a combination of the two, the higher RPS will drive SO2 and NOX and possibly CO2
emissions higher, further exacerbating the ozone non-attainment area problems for the Front Range of Colorado.
There are national implications as well. Congress and the Obama administration are considering a national RPS. Before such a national standard is implemented, there is a compelling need to better understand where intermittent sources of energy such as wind can be integrated with existing nuclear, coal and natural gas capacity without producing cycling-induced emissions problems. The study’s findings relative to ERCOT in this respect are not
Figure I-1 Denver Non-attainment Area Plants Have
Experienced Higher Emissions Since 2006
Page 11 of 77
encouraging. ERCOT, which has one of the nation’s largest natural gas-fired generation bases, acquires only about 23% of its energy from natural gas between the hours of 12:00 am and 8:00 am. Consequently, when wind comes online in ERCOT during the early morning hours, coal plants are forced to cycle. As cycling of coal plants is problematic in ERCOT, it is very likely that emissions will increase virtually everywhere else unless natural gas-fired generation is added simultaneously with wind.
Report Organization This report is organized as follows:
o Chapter II provides an overview of PSCO’s generation capacity and utilization, basic data and analysis describing the various utilities and fuel sources that generate power in the state.
o Chapter III describes why coal plants are cycled, and what happens as a result.
o Chapter IV examines two specific “wind events,” quantifying the emissions and
the implications of each, as well as how PSCO handled these events.
o Chapter V estimates the total incremental emissions that occurred as a result of using wind energy in the PSCO territory for 2008 and 2009.
o Chapter VI describes the interaction between wind, coal and natural gas in
ERCOT, showing how the same dynamics evident in PSCO’s territory have emerged as the magnitude of wind generation has grown.
o Chapter VII examines the emissions implications of one possible mitigation
measure: retiring Cherokee and Valmont coal fired plants and replace their generation with power produced from either the existing or new gas-fired facilities.
o Chapter VIII draws conclusions and suggests several recommendations
regarding mitigation measures that might be implemented to improve the impact of wind on the PSCO system.
Data Sources This report is built on a variety of publicly available primary and secondary data sources. The general descriptive information generally comes from basic Energy Information Administration databases including Forms 860, 861 and 423; the Federal Energy Regulatory Commission Form 1; PSCO documents, including their annual 10K financial report, and other reports available on the PSCO public website. The core of the analysis is based on detailed primary information reported to the Federal Energy Regulatory Commission (FERC) and the U.S. Environmental Protection Agency (EPA)

Page 12 of 77
by PSCO. FERC Form 714 data provides hourly load generation for operational control areas such as that of PSCO. Additionally, the Continuous Emissions Monitoring System (CEMS) of the EPA is the source of boiler-specific hourly generation and emissions data. This information is relied on heavily for the analysis of the July 2, 2008, and Sept. 28-29, 2008, wind events discussed in Chapter IV. Finally, ERCOT requires generators to publish on a 15-minute basis their generation by fuel and type of facility, enabling analysis of the interaction between wind, coal and natural gas combustion turbines and combined-cycle facilities in the ERCOT region. These data provide the analytical basis for the analysis of ERCOT operations in Chapter VI.
Page 13 of 77
II. Wind Energy and PSCO
PSCO is the dominant electric utility in Colorado. Owned by Xcel, the fourth largest electric utility holding company in the U.S., PSCO provides electricity service to approximately 1.4 million customers solely in the state of Colorado. Based on total sales, PSCO ranks 33rd in the U.S., and 25th in customer count.4
While PSCO is less than 30% the size of some of the nation’s largest utilities, it is one of the largest sellers of wind power. Its parent company, Xcel, is the largest provider of wind energy in the nation according to the American Wind Energy Association, and PSCO accounts for nearly one-third of Xcel’s wind energy resource. This chapter describes PSCO’s generation mix, load and key aspects of the regulatory context in which it operates in order to introduce many of the terms and factors that will become important to the discussion of the interaction between wind, coal and natural gas generation in subsequent chapters.
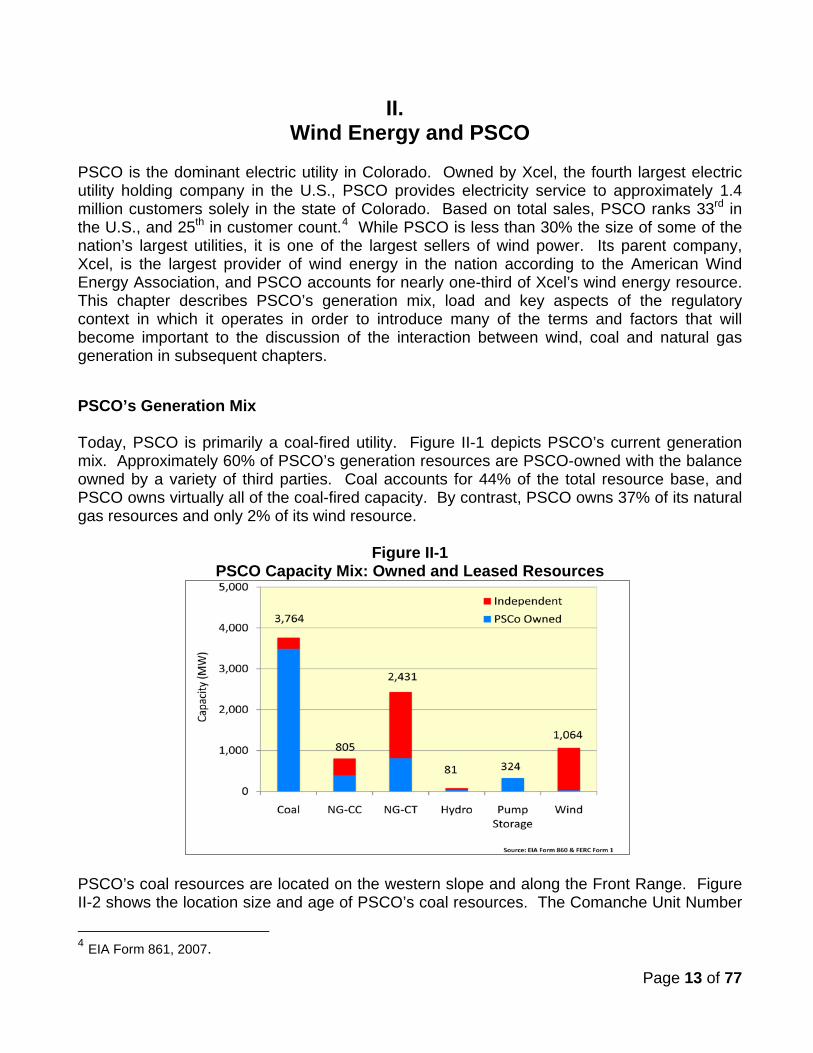
PSCO’s Generation Mix Today, PSCO is primarily a coal-fired utility. Figure II-1 depicts PSCO’s current generation mix. Approximately 60% of PSCO’s generation resources are PSCO-owned with the balance owned by a variety of third parties. Coal accounts for 44% of the total resource base, and PSCO owns virtually all of the coal-fired capacity. By contrast, PSCO owns 37% of its natural gas resources and only 2% of its wind resource.
Figure II-1 PSCO Capacity Mix: Owned and Leased Resources
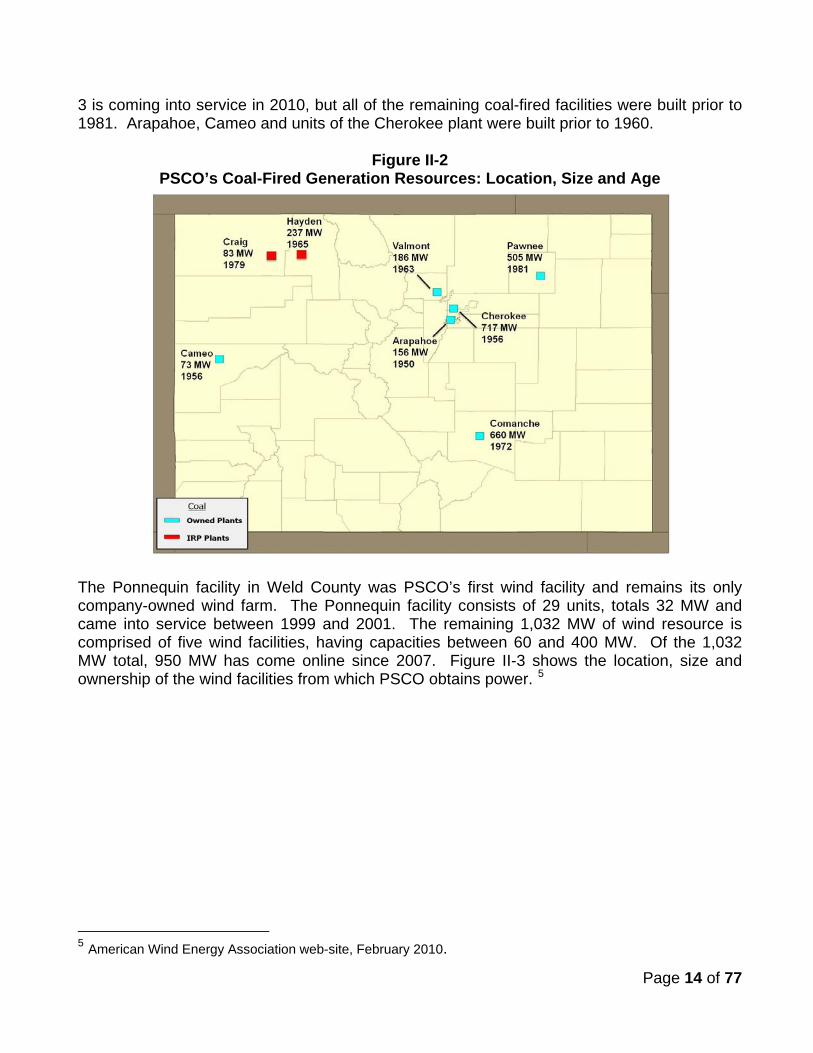
PSCO’s coal resources are located on the western slope and along the Front Range. Figure II-2 shows the location size and age of PSCO’s coal resources. The Comanche Unit Number
4 EIA Form 861, 2007.
Page 14 of 77
3 is coming into service in 2010, but all of the remaining coal-fired facilities were built prior to 1981. Arapahoe, Cameo and units of the Cherokee plant were built prior to 1960.
Figure II-2 PSCO’s Coal-Fired Generation Resources: Location, Size and Age
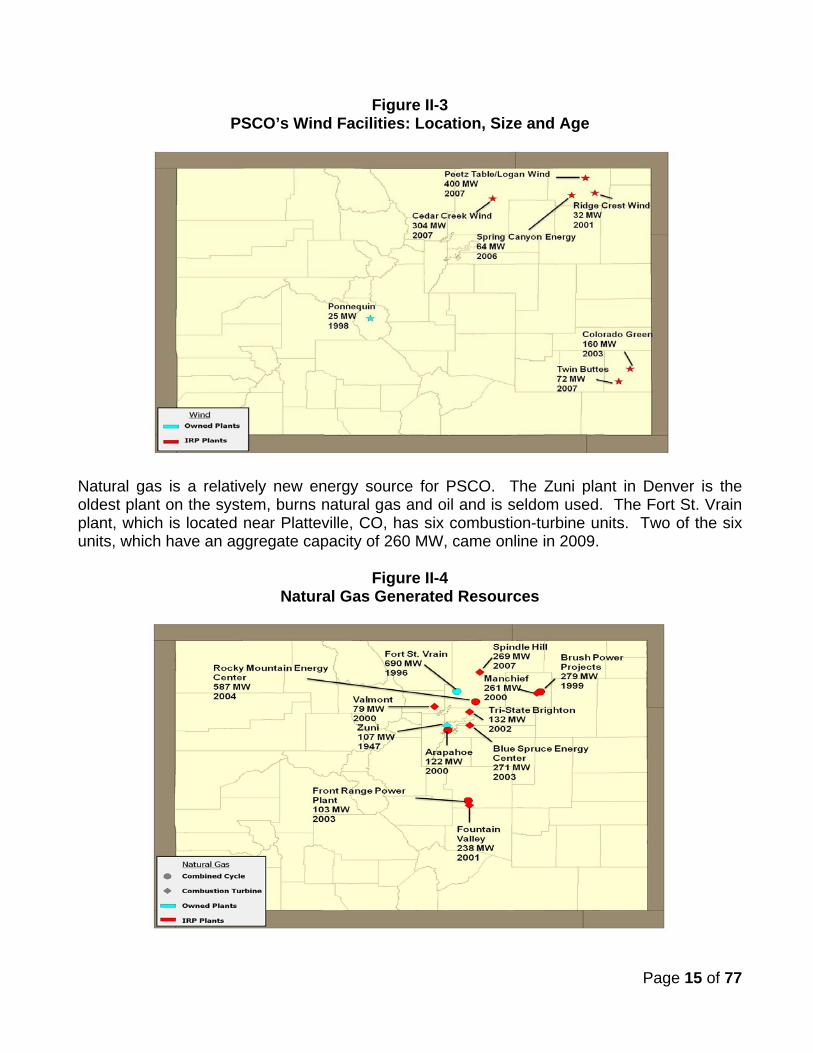
The Ponnequin facility in Weld County was PSCO’s first wind facility and remains its only company-owned wind farm. The Ponnequin facility consists of 29 units, totals 32 MW and came into service between 1999 and 2001. The remaining 1,032 MW of wind resource is comprised of five wind facilities, having capacities between 60 and 400 MW. Of the 1,032 MW total, 950 MW has come online since 2007. Figure II-3 shows the location, size and ownership of the wind facilities from which PSCO obtains power. 5
5 American Wind Energy Association web-site, February 2010.
Page 15 of 77
Figure II-3 PSCO’s Wind Facilities: Location, Size and Age
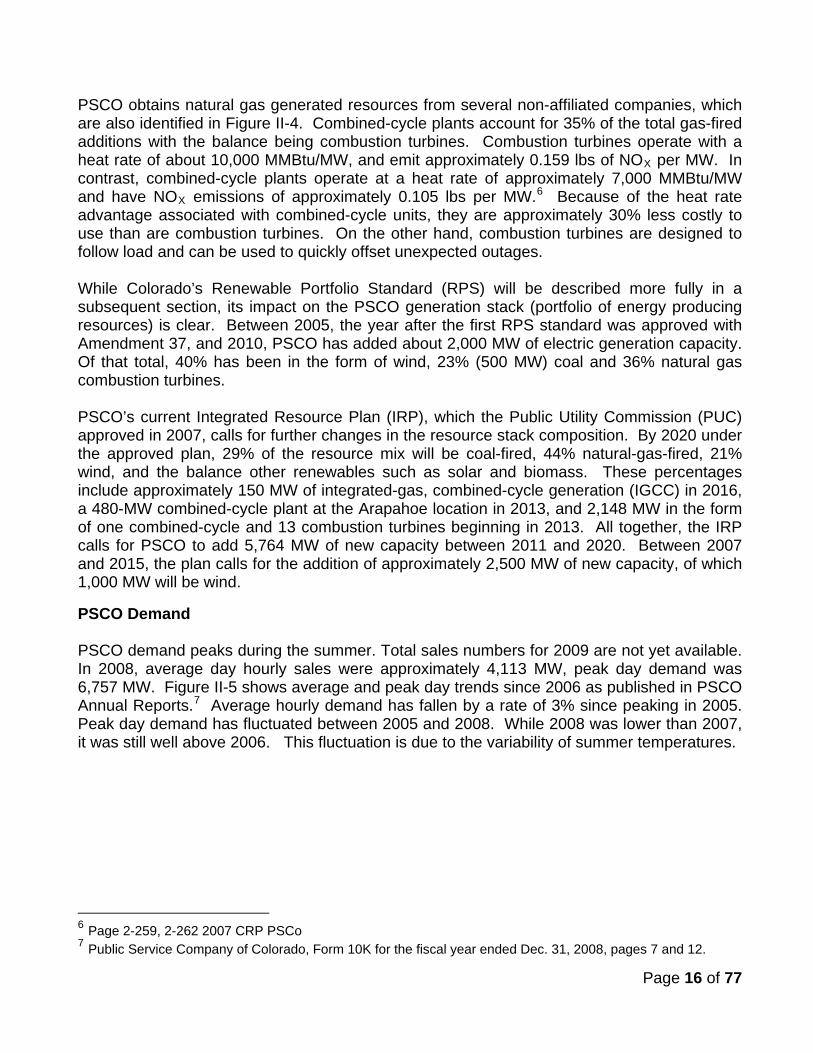
Natural gas is a relatively new energy source for PSCO. The Zuni plant in Denver is the oldest plant on the system, burns natural gas and oil and is seldom used. The Fort St. Vrain plant, which is located near Platteville, CO, has six combustion-turbine units. Two of the six units, which have an aggregate capacity of 260 MW, came online in 2009.
Figure II-4 Natural Gas Generated Resources
Page 16 of 77
PSCO obtains natural gas generated resources from several non-affiliated companies, which are also identified in Figure II-4. Combined-cycle plants account for 35% of the total gas-fired additions with the balance being combustion turbines. Combustion turbines operate with a heat rate of about 10,000 MMBtu/MW, and emit approximately 0.159 lbs of NOX per MW. In contrast, combined-cycle plants operate at a heat rate of approximately 7,000 MMBtu/MW and have NOX emissions of approximately 0.105 lbs per MW.6
Because of the heat rate advantage associated with combined-cycle units, they are approximately 30% less costly to use than are combustion turbines. On the other hand, combustion turbines are designed to follow load and can be used to quickly offset unexpected outages.
While Colorado’s Renewable Portfolio Standard (RPS) will be described more fully in a subsequent section, its impact on the PSCO generation stack (portfolio of energy producing resources) is clear. Between 2005, the year after the first RPS standard was approved with Amendment 37, and 2010, PSCO has added about 2,000 MW of electric generation capacity. Of that total, 40% has been in the form of wind, 23% (500 MW) coal and 36% natural gas combustion turbines. PSCO’s current Integrated Resource Plan (IRP), which the Public Utility Commission (PUC) approved in 2007, calls for further changes in the resource stack composition. By 2020 under the approved plan, 29% of the resource mix will be coal-fired, 44% natural-gas-fired, 21% wind, and the balance other renewables such as solar and biomass. These percentages include approximately 150 MW of integrated-gas, combined-cycle generation (IGCC) in 2016, a 480-MW combined-cycle plant at the Arapahoe location in 2013, and 2,148 MW in the form of one combined-cycle and 13 combustion turbines beginning in 2013. All together, the IRP calls for PSCO to add 5,764 MW of new capacity between 2011 and 2020. Between 2007 and 2015, the plan calls for the addition of approximately 2,500 MW of new capacity, of which 1,000 MW will be wind.
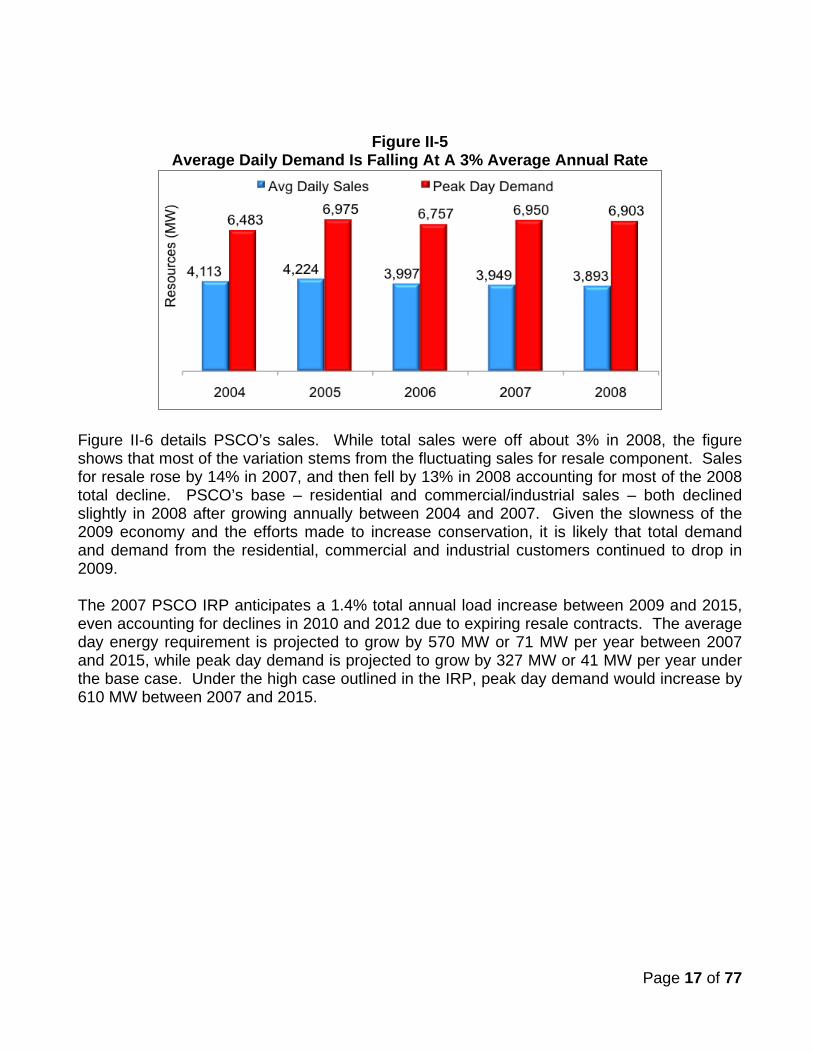
PSCO Demand PSCO demand peaks during the summer. Total sales numbers for 2009 are not yet available. In 2008, average day hourly sales were approximately 4,113 MW, peak day demand was 6,757 MW. Figure II-5 shows average and peak day trends since 2006 as published in PSCO Annual Reports.7
Average hourly demand has fallen by a rate of 3% since peaking in 2005. Peak day demand has fluctuated between 2005 and 2008. While 2008 was lower than 2007, it was still well above 2006. This fluctuation is due to the variability of summer temperatures.
6 Page 2-259, 2-262 2007 CRP PSCo 7 Public Service Company of Colorado, Form 10K for the fiscal year ended Dec. 31, 2008, pages 7 and 12.
Page 17 of 77
Figure II-5 Average Daily Demand Is Falling At A 3% Average Annual Rate
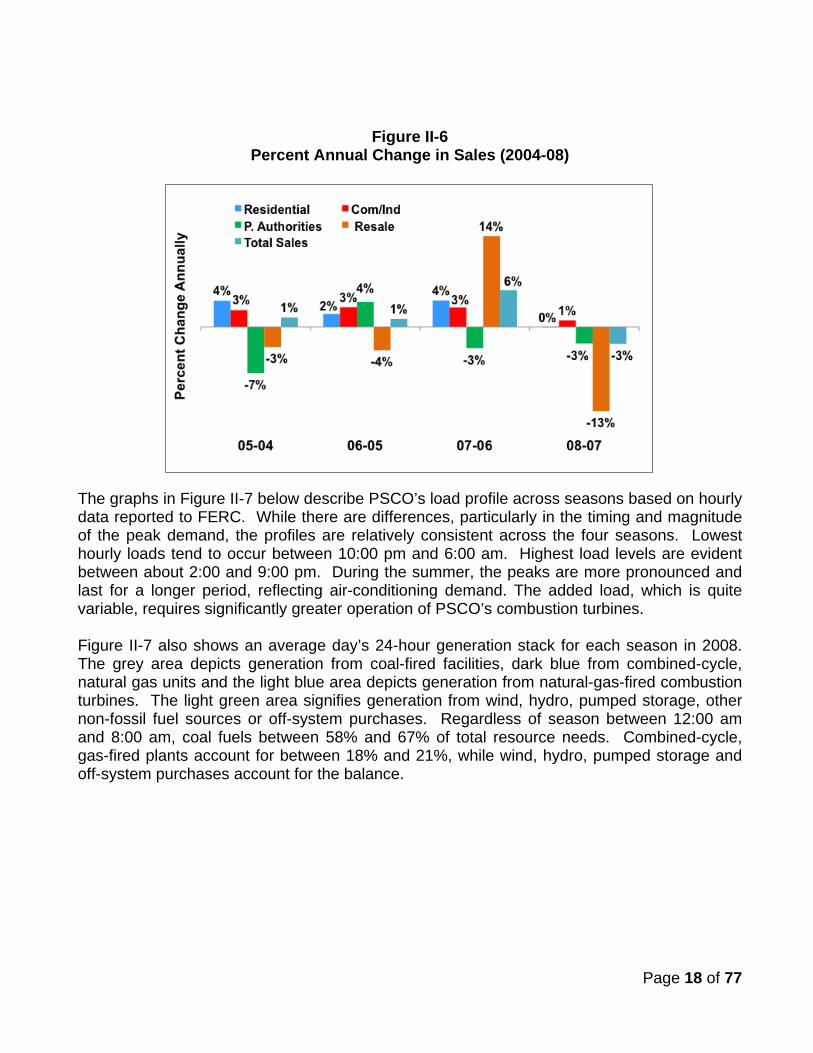
Figure II-6 details PSCO’s sales. While total sales were off about 3% in 2008, the figure shows that most of the variation stems from the fluctuating sales for resale component. Sales for resale rose by 14% in 2007, and then fell by 13% in 2008 accounting for most of the 2008 total decline. PSCO’s base – residential and commercial/industrial sales – both declined slightly in 2008 after growing annually between 2004 and 2007. Given the slowness of the 2009 economy and the efforts made to increase conservation, it is likely that total demand and demand from the residential, commercial and industrial customers continued to drop in 2009. The 2007 PSCO IRP anticipates a 1.4% total annual load increase between 2009 and 2015, even accounting for declines in 2010 and 2012 due to expiring resale contracts. The average day energy requirement is projected to grow by 570 MW or 71 MW per year between 2007 and 2015, while peak day demand is projected to grow by 327 MW or 41 MW per year under the base case. Under the high case outlined in the IRP, peak day demand would increase by 610 MW between 2007 and 2015.
Page 18 of 77
Figure II-6 Percent Annual Change in Sales (2004-08)
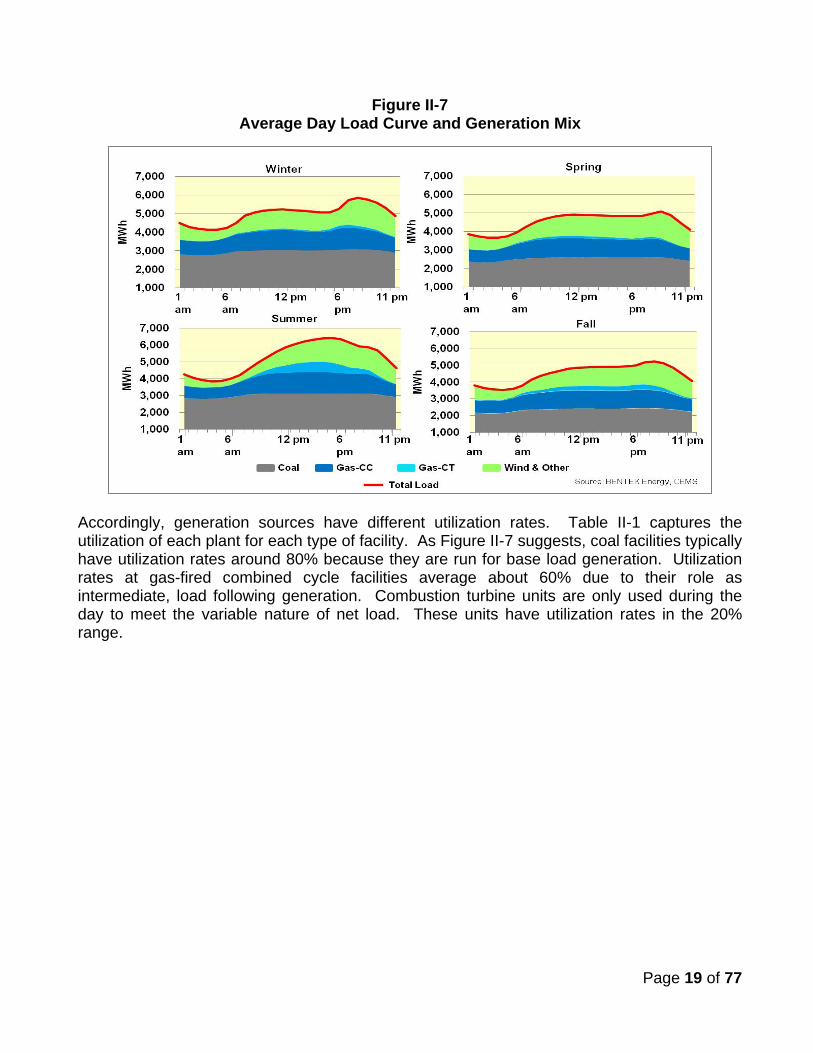
The graphs in Figure II-7 below describe PSCO’s load profile across seasons based on hourly data reported to FERC. While there are differences, particularly in the timing and magnitude of the peak demand, the profiles are relatively consistent across the four seasons. Lowest hourly loads tend to occur between 10:00 pm and 6:00 am. Highest load levels are evident between about 2:00 and 9:00 pm. During the summer, the peaks are more pronounced and last for a longer period, reflecting air-conditioning demand. The added load, which is quite variable, requires significantly greater operation of PSCO’s combustion turbines. Figure II-7 also shows an average day’s 24-hour generation stack for each season in 2008. The grey area depicts generation from coal-fired facilities, dark blue from combined-cycle, natural gas units and the light blue area depicts generation from natural-gas-fired combustion turbines. The light green area signifies generation from wind, hydro, pumped storage, other non-fossil fuel sources or off-system purchases. Regardless of season between 12:00 am and 8:00 am, coal fuels between 58% and 67% of total resource needs. Combined-cycle, gas-fired plants account for between 18% and 21%, while wind, hydro, pumped storage and off-system purchases account for the balance.
Page 19 of 77
Figure II-7 Average Day Load Curve and Generation Mix
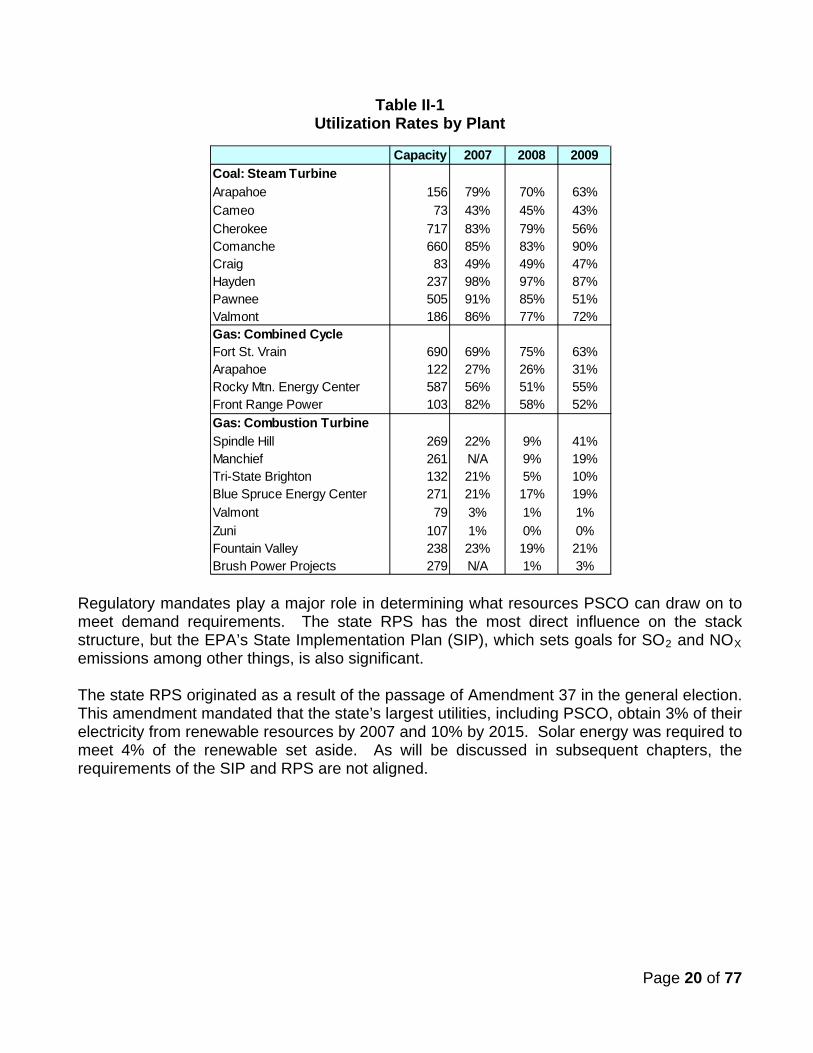
Accordingly, generation sources have different utilization rates. Table II-1 captures the utilization of each plant for each type of facility. As Figure II-7 suggests, coal facilities typically have utilization rates around 80% because they are run for base load generation. Utilization rates at gas-fired combined cycle facilities average about 60% due to their role as intermediate, load following generation. Combustion turbine units are only used during the day to meet the variable nature of net load. These units have utilization rates in the 20% range.
Page 20 of 77
Table II-1 Utilization Rates by Plant
Regulatory mandates play a major role in determining what resources PSCO can draw on to meet demand requirements. The state RPS has the most direct influence on the stack structure, but the EPA’s State Implementation Plan (SIP), which sets goals for SO2 and NOX
emissions among other things, is also significant.
The state RPS originated as a result of the passage of Amendment 37 in the general election. This amendment mandated that the state’s largest utilities, including PSCO, obtain 3% of their electricity from renewable resources by 2007 and 10% by 2015. Solar energy was required to meet 4% of the renewable set aside. As will be discussed in subsequent chapters, the requirements of the SIP and RPS are not aligned.
Capacity 2007 2008 2009Coal: Steam TurbineArapahoe 156 79% 70% 63%Cameo 73 43% 45% 43%Cherokee 717 83% 79% 56%Comanche 660 85% 83% 90%Craig 83 49% 49% 47%Hayden 237 98% 97% 87%Pawnee 505 91% 85% 51%Valmont 186 86% 77% 72%Gas: Combined CycleFort St. Vrain 690 69% 75% 63%Arapahoe 122 27% 26% 31%Rocky Mtn. Energy Center 587 56% 51% 55%Front Range Power 103 82% 58% 52%Gas: Combustion TurbineSpindle Hill 269 22% 9% 41%Manchief 261 N/A 9% 19%Tri-State Brighton 132 21% 5% 10%Blue Spruce Energy Center 271 21% 17% 19%Valmont 79 3% 1% 1%Zuni 107 1% 0% 0%Fountain Valley 238 23% 19% 21%Brush Power Projects 279 N/A 1% 3%
Page 21 of 77
The requirements of Amendment 37 were changed in 2007. HB07-1281, which passed the Colorado legislature in 2007, increased the RPS mandate. Under HB07-1281, Colorado utilities must employ renewable technology to meet various portions of their energy sales as outlined below:
2007 3% of total retail electric sales 2008-10 5% of total retail electric sales 2011-14 10% of total retail electric sales 2015-19 15% of total retail electric sales Beyond 2020 20% of total retail electric sales
While PSCO is charged with meeting this requirement, the bill also mandates that the “maximum retail rate impact” be 2% of the total electric bill annually for each customer.” In March 2010, the legislation passed and the Governor signed into law a new RPS. Under the new RPS, the Colorado legislature increased the above mandate to 30% of sales. At the time of this report, passage of the new compliance schedule will be:
2007 3% of total retail electric sales 2008-10 5% of total retail electric sales 2011-14 12% of total retail electric sales 2015-19 20% of total retail electric sales Beyond 2020 30% of total retail electric sales
Page 22 of 77
III. Wind, Gas and Coal Integration
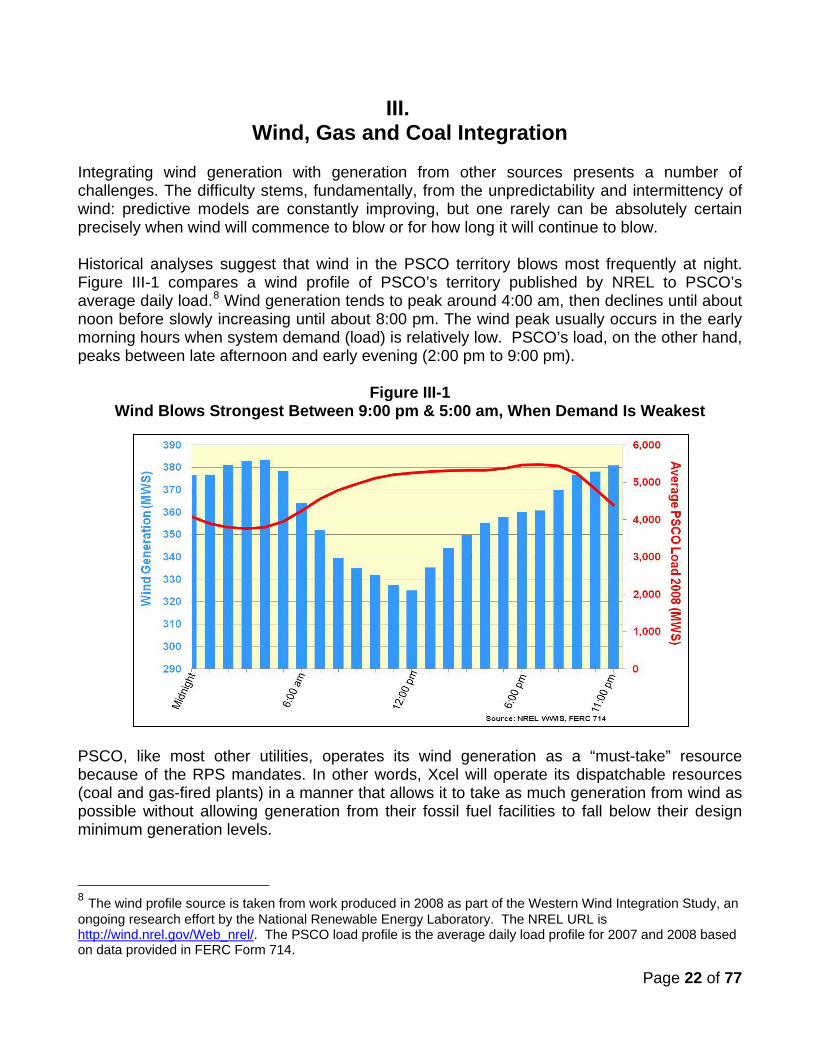
Integrating wind generation with generation from other sources presents a number of challenges. The difficulty stems, fundamentally, from the unpredictability and intermittency of wind: predictive models are constantly improving, but one rarely can be absolutely certain precisely when wind will commence to blow or for how long it will continue to blow. Historical analyses suggest that wind in the PSCO territory blows most frequently at night. Figure III-1 compares a wind profile of PSCO’s territory published by NREL to PSCO’s average daily load.8
Wind generation tends to peak around 4:00 am, then declines until about noon before slowly increasing until about 8:00 pm. The wind peak usually occurs in the early morning hours when system demand (load) is relatively low. PSCO’s load, on the other hand, peaks between late afternoon and early evening (2:00 pm to 9:00 pm).
Figure III-1 Wind Blows Strongest Between 9:00 pm & 5:00 am, When Demand Is Weakest
PSCO, like most other utilities, operates its wind generation as a “must-take” resource because of the RPS mandates. In other words, Xcel will operate its dispatchable resources (coal and gas-fired plants) in a manner that allows it to take as much generation from wind as possible without allowing generation from their fossil fuel facilities to fall below their design minimum generation levels.
8 The wind profile source is taken from work produced in 2008 as part of the Western Wind Integration Study, an ongoing research effort by the National Renewable Energy Laboratory. The NREL URL is http://wind.nrel.gov/Web_nrel/. The PSCO load profile is the average daily load profile for 2007 and 2008 based on data provided in FERC Form 714.
Page 23 of 77
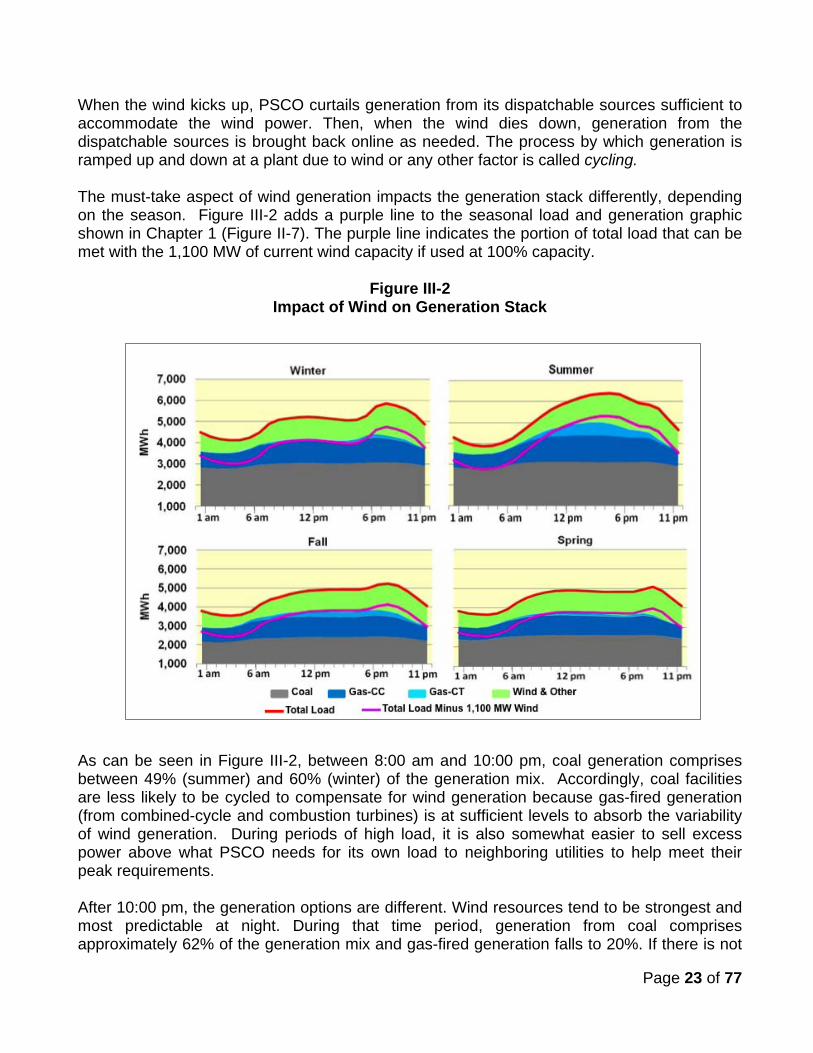
When the wind kicks up, PSCO curtails generation from its dispatchable sources sufficient to accommodate the wind power. Then, when the wind dies down, generation from the dispatchable sources is brought back online as needed. The process by which generation is ramped up and down at a plant due to wind or any other factor is called cycling. The must-take aspect of wind generation impacts the generation stack differently, depending on the season. Figure III-2 adds a purple line to the seasonal load and generation graphic shown in Chapter 1 (Figure II-7). The purple line indicates the portion of total load that can be met with the 1,100 MW of current wind capacity if used at 100% capacity.
Figure III-2 Impact of Wind on Generation Stack
As can be seen in Figure III-2, between 8:00 am and 10:00 pm, coal generation comprises between 49% (summer) and 60% (winter) of the generation mix. Accordingly, coal facilities are less likely to be cycled to compensate for wind generation because gas-fired generation (from combined-cycle and combustion turbines) is at sufficient levels to absorb the variability of wind generation. During periods of high load, it is also somewhat easier to sell excess power above what PSCO needs for its own load to neighboring utilities to help meet their peak requirements. After 10:00 pm, the generation options are different. Wind resources tend to be strongest and most predictable at night. During that time period, generation from coal comprises approximately 62% of the generation mix and gas-fired generation falls to 20%. If there is not
Page 24 of 77
enough gas-fired generation to safely cycle gas plants, coal plants must be cycled instead. Later in the night, coal-fired generation is the only resource available to absorb wind power and thus PSCO cycles its coal facilities. As wind energy begins to taper off around 6:00 am, the cycled power plants must be ramped up because load starts building for the day. PSCO has another, somewhat restricted, option for offsetting wind generation. The company uses its 350 MW of pumped storage hydroelectric power to accommodate wind as much as possible. But when that facility is running at maximum capacity, it can only operate for four consecutive hours. How frequently wind affects coal or natural gas-fired generation is difficult to determine because PSCO does not publish hourly wind generation data. Nevertheless, PSCO acknowledges that wind impacts coal as well as gas in its 2008 Addendum to the 2006 study “Wind Integration Study for Public Service of Colorado.” In Appendix B of the 2008 Addendum Report, Xcel notes that:
“There is a discrepancy between the Cougar modeling and the current experience when comparing the impacts on coal units. The modeling predicts almost no impact, but the company [PSCO] is already seeing some cycling that seems related to wind output.”9
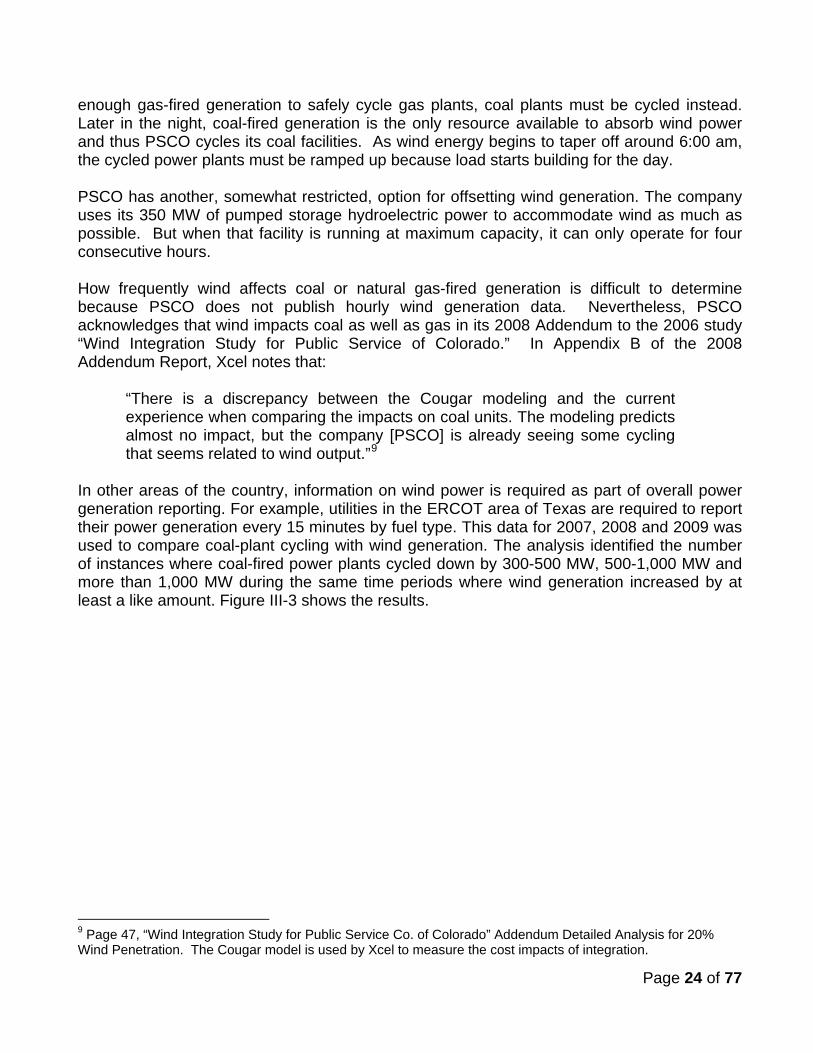
In other areas of the country, information on wind power is required as part of overall power generation reporting. For example, utilities in the ERCOT area of Texas are required to report their power generation every 15 minutes by fuel type. This data for 2007, 2008 and 2009 was used to compare coal-plant cycling with wind generation. The analysis identified the number of instances where coal-fired power plants cycled down by 300-500 MW, 500-1,000 MW and more than 1,000 MW during the same time periods where wind generation increased by at least a like amount. Figure III-3 shows the results.
9 Page 47, “Wind Integration Study for Public Service Co. of Colorado” Addendum Detailed Analysis for 20% Wind Penetration. The Cougar model is used by Xcel to measure the cost impacts of integration.

Page 25 of 77
Figure III-3 Distribution of ERCOT Coal Cycling Instances by Magnitude of Hour-over-Hour Change
In 2009, there were 1,307 instances where coal plants were cycled at least 300 MW and 284 examples where plants were cycled more than 1,000 MW from one 15-minute period to the next. The table also indicates that the number of instances in all categories has increased annually since 2007. While Texas has more coal plants and wind farms than Colorado and the wind undoubtedly exhibits somewhat different behavior in Texas, this analysis concludes that the two systems are similar enough for a valid comparison. Even in Texas, which has one of the nation’s largest gas-fired generation bases, coal plants are frequently cycled. It clearly stands to reason that the same happens in Colorado.
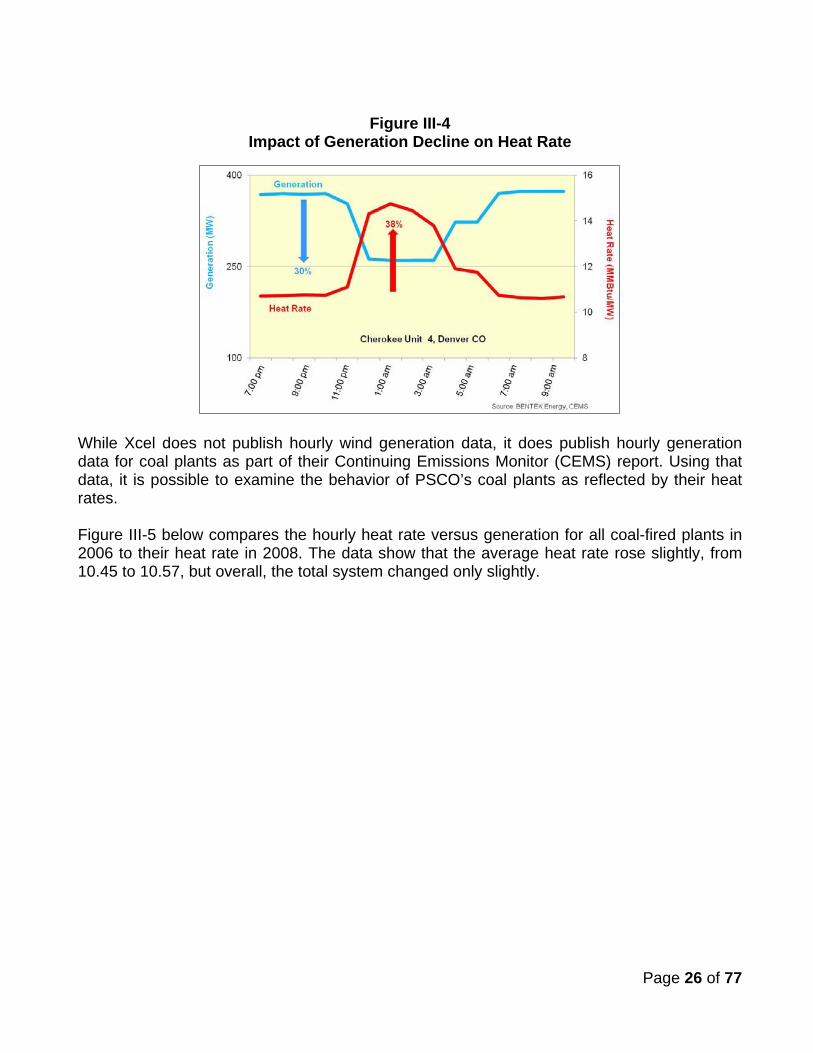
Impact of Cycling Power plant cycling results in more fuel being used for every MWh generated. In fact in the first case study in the following chapter, coal consumption at the plant was actually 22 tons greater than if the plant had not been cycled and generation had remained stable. Figure III-4 depicts operations at PSCO’s Cherokee Unit 4, located in Denver, between 7:00 pm and 9:00 am on March 17 and 18, 2008. Total generation from the plant is shown in blue; the heat rate – defined as the MMBtu of fuel per unit of generation – is shown in red. Between 9:00 pm and 1:00 am, generation from the Cherokee 4 fell from 370 to 260 MW. It then increased to 373 MW by 4:00 am. During the period in which generation fell by 30%, heat rate rose by 38%. Heat rates are directly linked to cycling: as the generation from coal plants falls, the heat rate begins to climb. Initially, the heat rate climbs because generation of the plant is choked back and fewer MW are produced by the same amount of coal. Later in the cycle, the heat rate climbs further because more coal is burned in order to bring the combustion temperature back up to the designed, steady-state rate. Additionally, for many hours after cycling, the heat rate is slightly higher than it was at the same generation level before cycling the plant.
Page 26 of 77
Figure III-4
Impact of Generation Decline on Heat Rate
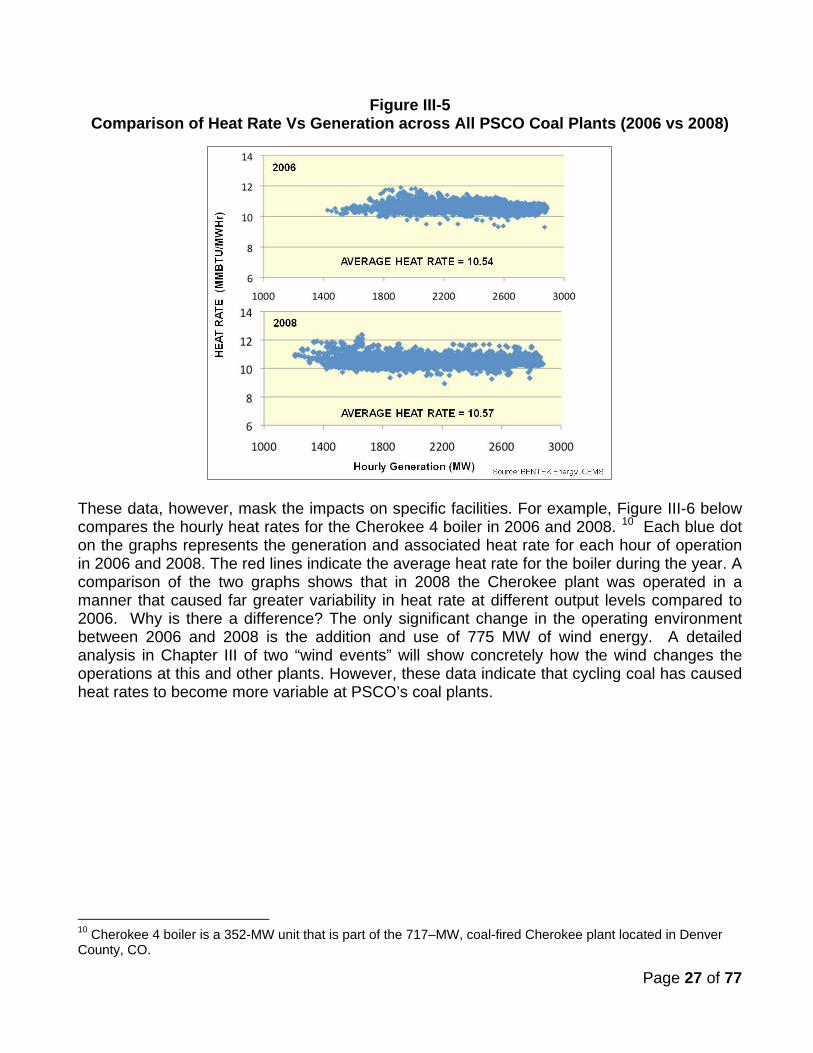
While Xcel does not publish hourly wind generation data, it does publish hourly generation data for coal plants as part of their Continuing Emissions Monitor (CEMS) report. Using that data, it is possible to examine the behavior of PSCO’s coal plants as reflected by their heat rates. Figure III-5 below compares the hourly heat rate versus generation for all coal-fired plants in 2006 to their heat rate in 2008. The data show that the average heat rate rose slightly, from 10.45 to 10.57, but overall, the total system changed only slightly.
Page 27 of 77
Figure III-5 Comparison of Heat Rate Vs Generation across All PSCO Coal Plants (2006 vs 2008)
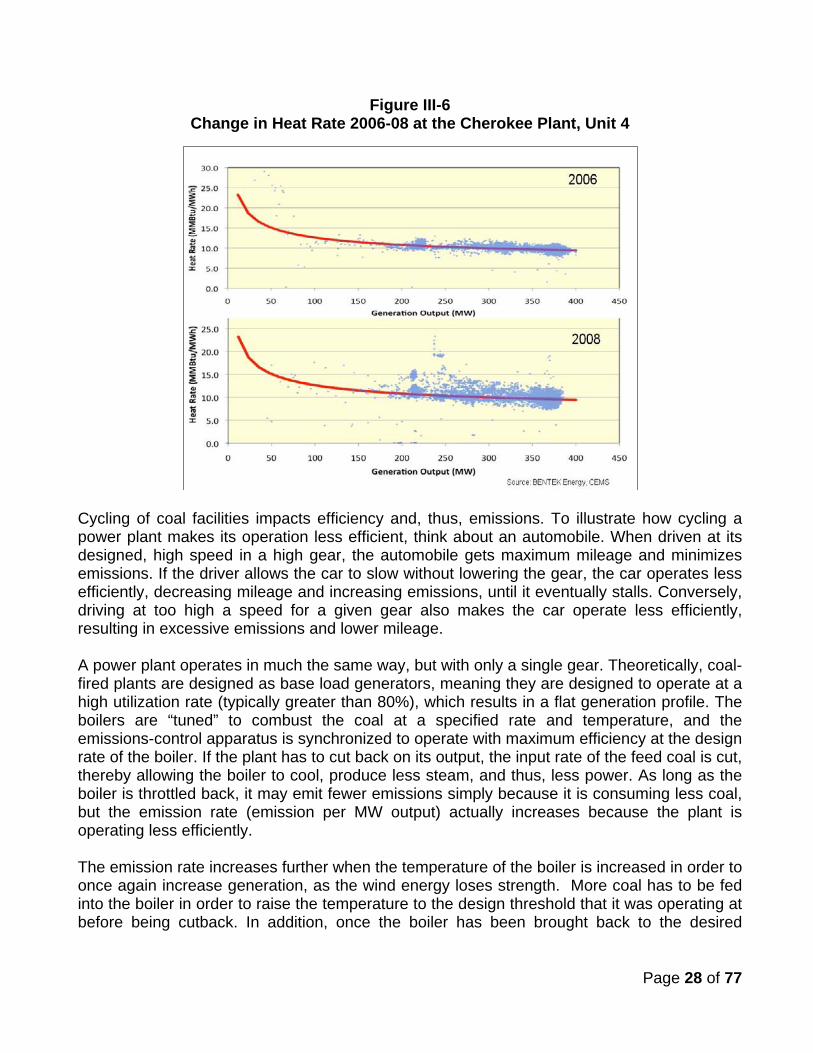
These data, however, mask the impacts on specific facilities. For example, Figure III-6 below compares the hourly heat rates for the Cherokee 4 boiler in 2006 and 2008. 10
Each blue dot on the graphs represents the generation and associated heat rate for each hour of operation in 2006 and 2008. The red lines indicate the average heat rate for the boiler during the year. A comparison of the two graphs shows that in 2008 the Cherokee plant was operated in a manner that caused far greater variability in heat rate at different output levels compared to 2006. Why is there a difference? The only significant change in the operating environment between 2006 and 2008 is the addition and use of 775 MW of wind energy. A detailed analysis in Chapter III of two “wind events” will show concretely how the wind changes the operations at this and other plants. However, these data indicate that cycling coal has caused heat rates to become more variable at PSCO’s coal plants.
10 Cherokee 4 boiler is a 352-MW unit that is part of the 717–MW, coal-fired Cherokee plant located in Denver County, CO.
Page 28 of 77
Figure III-6 Change in Heat Rate 2006-08 at the Cherokee Plant, Unit 4
Cycling of coal facilities impacts efficiency and, thus, emissions. To illustrate how cycling a power plant makes its operation less efficient, think about an automobile. When driven at its designed, high speed in a high gear, the automobile gets maximum mileage and minimizes emissions. If the driver allows the car to slow without lowering the gear, the car operates less efficiently, decreasing mileage and increasing emissions, until it eventually stalls. Conversely, driving at too high a speed for a given gear also makes the car operate less efficiently, resulting in excessive emissions and lower mileage. A power plant operates in much the same way, but with only a single gear. Theoretically, coal-fired plants are designed as base load generators, meaning they are designed to operate at a high utilization rate (typically greater than 80%), which results in a flat generation profile. The boilers are “tuned” to combust the coal at a specified rate and temperature, and the emissions-control apparatus is synchronized to operate with maximum efficiency at the design rate of the boiler. If the plant has to cut back on its output, the input rate of the feed coal is cut, thereby allowing the boiler to cool, produce less steam, and thus, less power. As long as the boiler is throttled back, it may emit fewer emissions simply because it is consuming less coal, but the emission rate (emission per MW output) actually increases because the plant is operating less efficiently. The emission rate increases further when the temperature of the boiler is increased in order to once again increase generation, as the wind energy loses strength. More coal has to be fed into the boiler in order to raise the temperature to the design threshold that it was operating at before being cutback. In addition, once the boiler has been brought back to the desired
Page 29 of 77
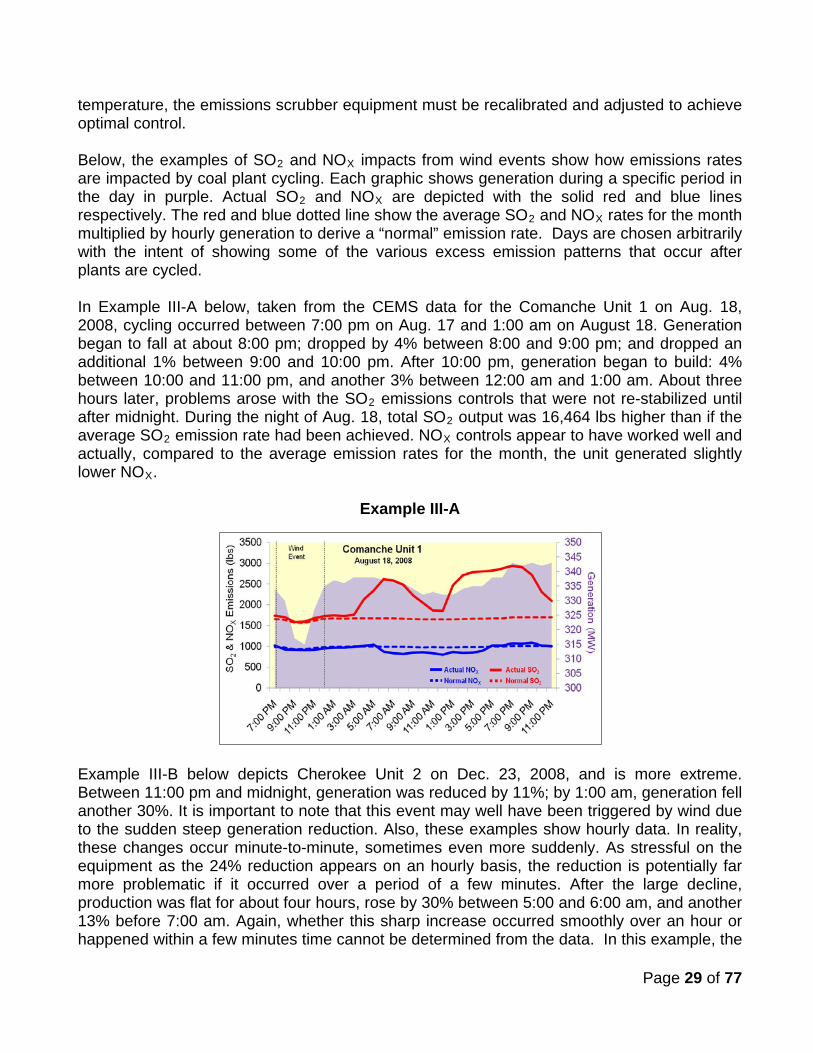
temperature, the emissions scrubber equipment must be recalibrated and adjusted to achieve optimal control. Below, the examples of SO2 and NOX impacts from wind events show how emissions rates are impacted by coal plant cycling. Each graphic shows generation during a specific period in the day in purple. Actual SO2 and NOX are depicted with the solid red and blue lines respectively. The red and blue dotted line show the average SO2 and NOX
rates for the month multiplied by hourly generation to derive a “normal” emission rate. Days are chosen arbitrarily with the intent of showing some of the various excess emission patterns that occur after plants are cycled.
In Example III-A below, taken from the CEMS data for the Comanche Unit 1 on Aug. 18, 2008, cycling occurred between 7:00 pm on Aug. 17 and 1:00 am on August 18. Generation began to fall at about 8:00 pm; dropped by 4% between 8:00 and 9:00 pm; and dropped an additional 1% between 9:00 and 10:00 pm. After 10:00 pm, generation began to build: 4% between 10:00 and 11:00 pm, and another 3% between 12:00 am and 1:00 am. About three hours later, problems arose with the SO2 emissions controls that were not re-stabilized until after midnight. During the night of Aug. 18, total SO2 output was 16,464 lbs higher than if the average SO2 emission rate had been achieved. NOX controls appear to have worked well and actually, compared to the average emission rates for the month, the unit generated slightly lower NOX
.
Example III-A
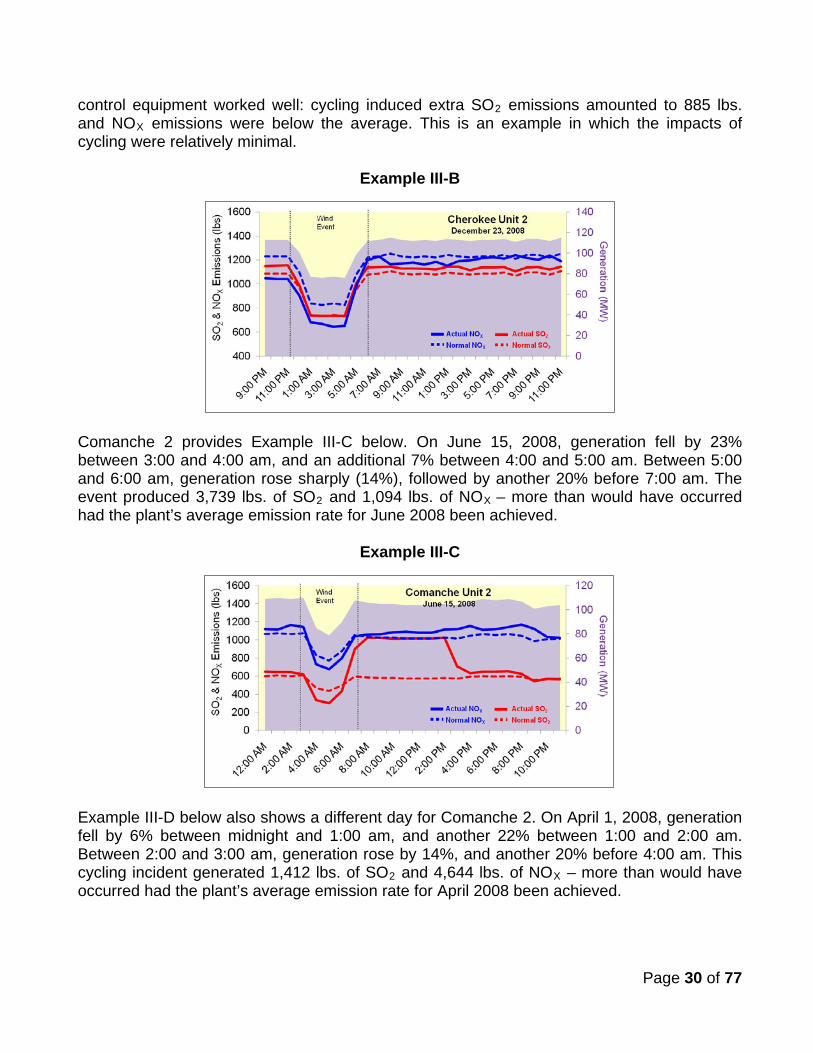
Example III-B below depicts Cherokee Unit 2 on Dec. 23, 2008, and is more extreme. Between 11:00 pm and midnight, generation was reduced by 11%; by 1:00 am, generation fell another 30%. It is important to note that this event may well have been triggered by wind due to the sudden steep generation reduction. Also, these examples show hourly data. In reality, these changes occur minute-to-minute, sometimes even more suddenly. As stressful on the equipment as the 24% reduction appears on an hourly basis, the reduction is potentially far more problematic if it occurred over a period of a few minutes. After the large decline, production was flat for about four hours, rose by 30% between 5:00 and 6:00 am, and another 13% before 7:00 am. Again, whether this sharp increase occurred smoothly over an hour or happened within a few minutes time cannot be determined from the data. In this example, the
Page 30 of 77
control equipment worked well: cycling induced extra SO2 emissions amounted to 885 lbs. and NOX
emissions were below the average. This is an example in which the impacts of cycling were relatively minimal.
Example III-B
Comanche 2 provides Example III-C below. On June 15, 2008, generation fell by 23% between 3:00 and 4:00 am, and an additional 7% between 4:00 and 5:00 am. Between 5:00 and 6:00 am, generation rose sharply (14%), followed by another 20% before 7:00 am. The event produced 3,739 lbs. of SO2 and 1,094 lbs. of NOX
– more than would have occurred had the plant’s average emission rate for June 2008 been achieved.
Example III-C
Example III-D below also shows a different day for Comanche 2. On April 1, 2008, generation fell by 6% between midnight and 1:00 am, and another 22% between 1:00 and 2:00 am. Between 2:00 and 3:00 am, generation rose by 14%, and another 20% before 4:00 am. This cycling incident generated 1,412 lbs. of SO2 and 4,644 lbs. of NOX
– more than would have occurred had the plant’s average emission rate for April 2008 been achieved.

Page 31 of 77
Example III-D
Finally, Example III-E below depicts generation and emissions for May 2, 2008. On that day generation fell between 5:00 and 6:00 am by 17%, then fell another 7% before 7:00 am. Between 7:00 and 8:00 am, generation rose by 4%, and then shot up 21% by 9:00 am. This event produced 5,877 lbs. of SO2 and 1,896 lbs. of NOX
– more than would have occurred had the plant’s average emission rate for May 2008 been achieved.
Example III-E
From these examples it is clear that cycling causes difficulties for emission control equipment, and that higher than normal emission rates last several hours after the cycling event. It also appears that occasionally, the emission controls will immediately perform such that emissions are relatively normally, yet an hour or two after the event has ceased, problems occur. Cause and effect cannot be determined from this data, but the frequency of these occurrences in the data suggests more than a random relationship. Finally, it is also important to recognize that it is not possible to determine whether it is the magnitude of the increase or decrease, or the suddenness of the event that causes the problems. A 30% decrease over two or more hours may not have the impact of a 10% decrease that happens instantaneously. The emissions instability associated with cycling is a function of the age and design of individual plants and reflects the inherent operational difficulties associated with coal-fired
Page 32 of 77
plants. If a coal-fired plant has to cut back on its generation output, the input rate of the feed coal must be cut to produce a lower rate of steam generation, while keeping the right temperature to maintain low NOX
generation. This is not as simple as it sounds. The boiler was designed to run at certain heat output. At lower heat output, the boiler design may be too large to maintain the lower output at the desired temperature.
Think of the automobile example again: imagine a car engine is specifically designed to run on flat highways (just like a utility boiler). The engine and its cooling system were designed to operate at an optimal temperature to achieve the lowest energy consumption and lowest emissions level for the amount of power being produced. If you were to drive the same car downhill, the engine would generate too much power for the driving conditions. Therefore, it must be throttled back. With lower power output, the engine would tend to run at a lower temperature because the cooling system was designed to take away much higher amounts of heat than are being generated. Likewise, when the automobile must run uphill and much more power is required, the cooling system may not be capable of evenly cooling the engine. There will be uneven temperatures within the engine, again resulting in suboptimal operating conditions. Hot spots in the engine may cause premature ignition, resulting in lower mileage and higher emissions. The engine will now require more fuel to generate the same amount of power. and emissions levels will increase. With any complex combustion system in which a precise and steady flame temperature coupled with just the right amount of fuel and air is required to maintain efficient and clean combustion, varying the operating conditions poses a great challenge, because boilers are designed to run most efficiently within a narrow, steady-state range of operating rates. The process of controlling efficiency and proper emissions is a complex mix of computer-based technology and manual intervention. There are often over 50 required adjustments, involving everything from fuel-to-air mixes to the lime-slurry mixtures for proper SO2 absorption that must be made in response to changing generation output11. Even though computerized controls are employed, finding the exact adjustments is not always a straight-forward process12
. With changing conditions, the combustion processes are frequently suboptimal and the calculated adjustments do not have the expected impact on the boiler operation. These irregularities cause unstable operation of the plant and require further manual adjustments. It is when manual adjustments must be made that the plant is subjected to the greatest risk of instability. Significant emission excess could result from suboptimal flame, leading to lower efficiencies, sometimes to partial loss of flame and, in an extreme case, to a total plant shut down.
The other consequence of cycling coal plants is the damage to the plant itself. The financial cost of this damage would be seen in an immediate increase in plant maintenance and 11 “Model Predictive Control and Optimization Improves Plant Efficiency and Lowers Emissions,” M. Antoine, T. Matsko, P. Immonen, ABB Power Systems, “Retrofitting Lime Spray Dryers at Public Service Company of Colorado,” R. Telesz, The Babcock & Wilcox Company, POWER-GEN International 2000, Nov. 14-16, 2000. 12 “Balancing Low NO2 Burner Air Flows Through the use of Individual Burner Airflow Monitors,” S. Vierstra, AEP, D. Early, AMC Power, POWER-GEN International 1998, Dec. 9-11, 1998.

Page 33 of 77
reduction of useful plant life – a cost that can be very high13. This is especially true for base load power plants that were not designed to cycle. While it is hard to quantify exactly the costs of cycling damage, it should be pointed out that the cost should be explicitly included in calculating wind integration costs. To date, however, most of the wind integration studies (including those of PSCO), have ignored this cost14
.
For power plants that were designed to operate at steady base load, cycling due to the wind is like driving the car calibrated for the plains of Nebraska in the mountains of Colorado. Not only will these plants burn more fuel, and cause higher emissions, their operation will also cost more money in the long run when maintenance and shorter life are fully accounted for.
13 While most of the plant is designed to be able to cycle, the change in generation has direct impact on the plant water systems, pulverizers, boilers, scrubbers, heat exchangers, and generators. Catastrophic failures as a result of many unit cycles are most commonly in the form of fatigue, corrosion, and cycling-related creep. These failures may eventually cause plant shutdowns, and high capital cost due to necessary replacement of the damaged equipment. 14 “Wind Integration Study for Public Service Company of Colorado.” R. Zavadil, EnerNex Corporation, 2006.
Page 34 of 77
IV. Estimating the Emissions Impact of Wind Energy in PSCO’s
Territory Increasing CO2, SO2 and NOX
emissions as a result of aggressively developing a wind energy program is a classic example of the Law of Unintended Consequences. The RPS was implemented without fully understanding the degree to which the intermittent nature of wind would stress existing generation facilities. Accommodating wind energy forces coal plants to operate less efficiently, unintentionally resulting in increased emissions. The previous chapter explained in theory how cycling coal-fired generation plants causes them to operate inefficiently, raising the heat rate and creating a host of other deleterious impacts. This chapter takes the analysis a step farther, examining two wind events that are described in detail by PSCO in training materials.
Data and Methodology The data employed in these analyses is critical to their validity. The emission data for CO2, SO2 and NOX derives from the CEMS database, which is maintained by the EPA. Electric utilities are required to report on an hourly basis their total generation, CO2, SO2 and NOX
emissions by boiler by plant for all boilers over 25-MW nameplate capacity. Total load is based on data reported by PSCO to the Federal Energy Regulatory Commission (FERC) on Form 714. This data is required of all control area utilities and is also reported on an hourly basis.
For any given utility territory, total load data, as reported in the FERC Form 714, equals the sum of generation from all plants reported in the CEMS data, plus generation from nuclear, wind, hydro and other renewable energy such as solar, plus other non-coal, gas or oil-generated purchases from other utilities (spot and contract). Separating wind and hydro generation on an hourly basis is not possible for PSCO’s territory because PSCO does not to report wind generation on anything other than a monthly and annual level15. Nevertheless, PSCO has published as part of other studies and training manuals hourly wind data for select days: July 2, 2008, and Sept. 29, 2008.16
Using the hourly data provided for those two days, it is possible to examine in detail how coal, gas and wind interact and the resulting emissions implications.
15 BENTEK and IPAMS have repeatedly tried to obtain hourly wind generation for 2008 from PSCO. All requests have been denied since PSCO feels the data portrays confidential trading information. 16 Reference source of the two days data: http://www.xcelenergy.com/SiteCollectionDocuments/docs/CRPExhibit2PSCoIntegratedReliabilityTraining.pdf.
Page 35 of 77
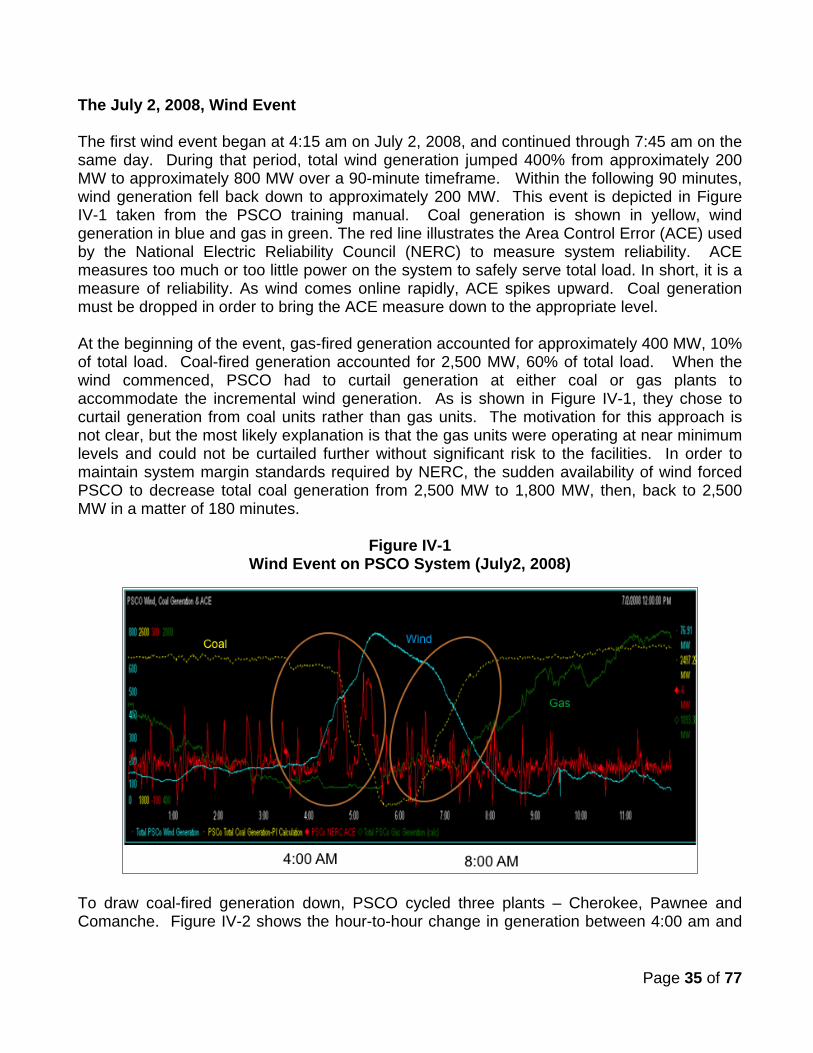
The July 2, 2008, Wind Event The first wind event began at 4:15 am on July 2, 2008, and continued through 7:45 am on the same day. During that period, total wind generation jumped 400% from approximately 200 MW to approximately 800 MW over a 90-minute timeframe. Within the following 90 minutes, wind generation fell back down to approximately 200 MW. This event is depicted in Figure IV-1 taken from the PSCO training manual. Coal generation is shown in yellow, wind generation in blue and gas in green. The red line illustrates the Area Control Error (ACE) used by the National Electric Reliability Council (NERC) to measure system reliability. ACE measures too much or too little power on the system to safely serve total load. In short, it is a measure of reliability. As wind comes online rapidly, ACE spikes upward. Coal generation must be dropped in order to bring the ACE measure down to the appropriate level. At the beginning of the event, gas-fired generation accounted for approximately 400 MW, 10% of total load. Coal-fired generation accounted for 2,500 MW, 60% of total load. When the wind commenced, PSCO had to curtail generation at either coal or gas plants to accommodate the incremental wind generation. As is shown in Figure IV-1, they chose to curtail generation from coal units rather than gas units. The motivation for this approach is not clear, but the most likely explanation is that the gas units were operating at near minimum levels and could not be curtailed further without significant risk to the facilities. In order to maintain system margin standards required by NERC, the sudden availability of wind forced PSCO to decrease total coal generation from 2,500 MW to 1,800 MW, then, back to 2,500 MW in a matter of 180 minutes.
Figure IV-1 Wind Event on PSCO System (July2, 2008)
To draw coal-fired generation down, PSCO cycled three plants – Cherokee, Pawnee and Comanche. Figure IV-2 shows the hour-to-hour change in generation between 4:00 am and
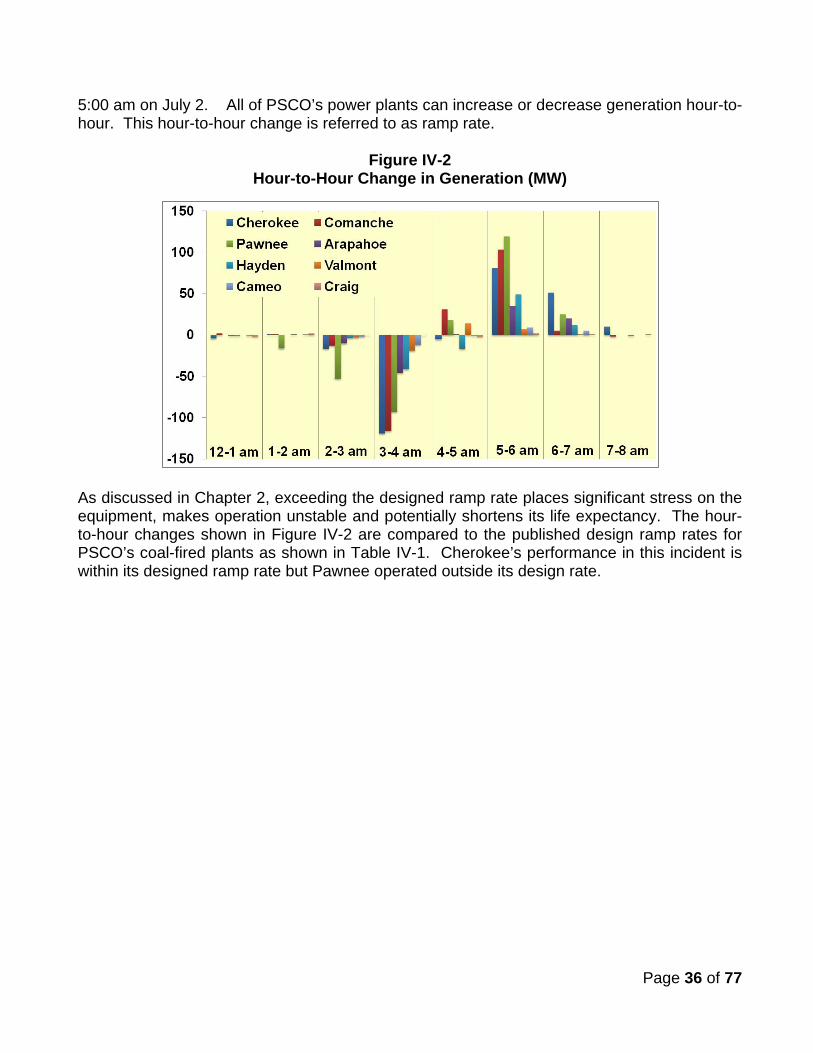
Page 36 of 77
5:00 am on July 2. All of PSCO’s power plants can increase or decrease generation hour-to-hour. This hour-to-hour change is referred to as ramp rate.
Figure IV-2 Hour-to-Hour Change in Generation (MW)
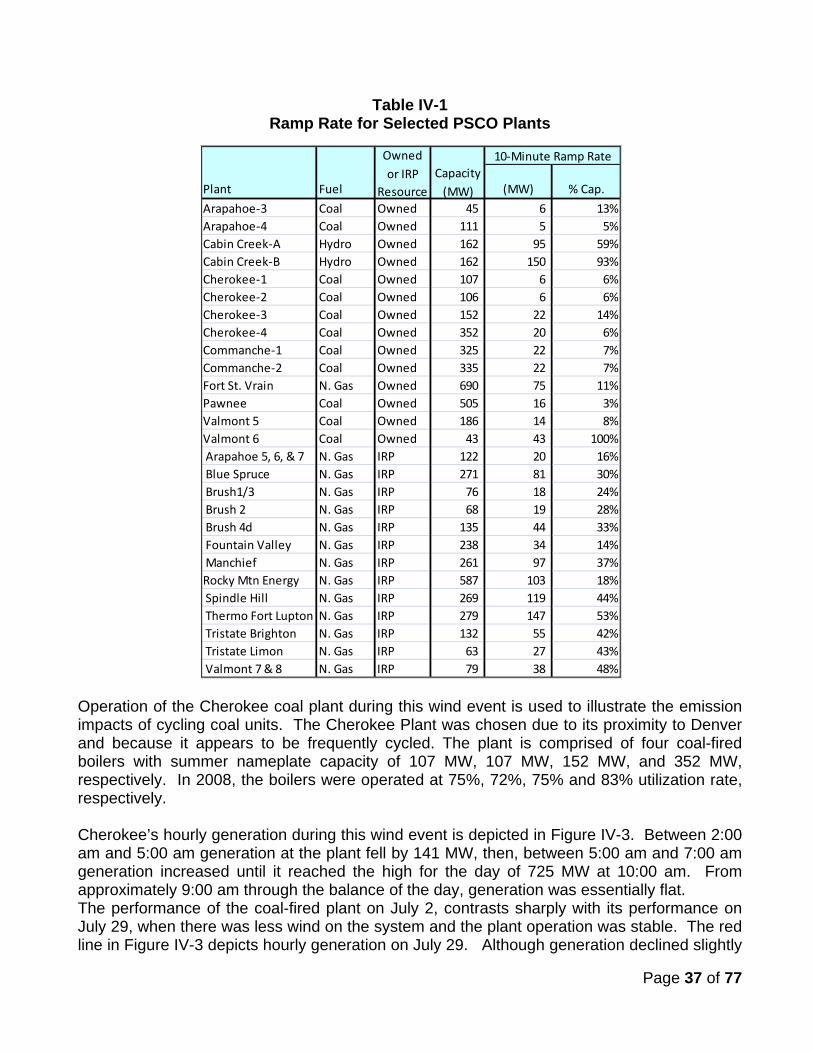
As discussed in Chapter 2, exceeding the designed ramp rate places significant stress on the equipment, makes operation unstable and potentially shortens its life expectancy. The hour-to-hour changes shown in Figure IV-2 are compared to the published design ramp rates for PSCO’s coal-fired plants as shown in Table IV-1. Cherokee’s performance in this incident is within its designed ramp rate but Pawnee operated outside its design rate.
Page 37 of 77
Table IV-1 Ramp Rate for Selected PSCO Plants
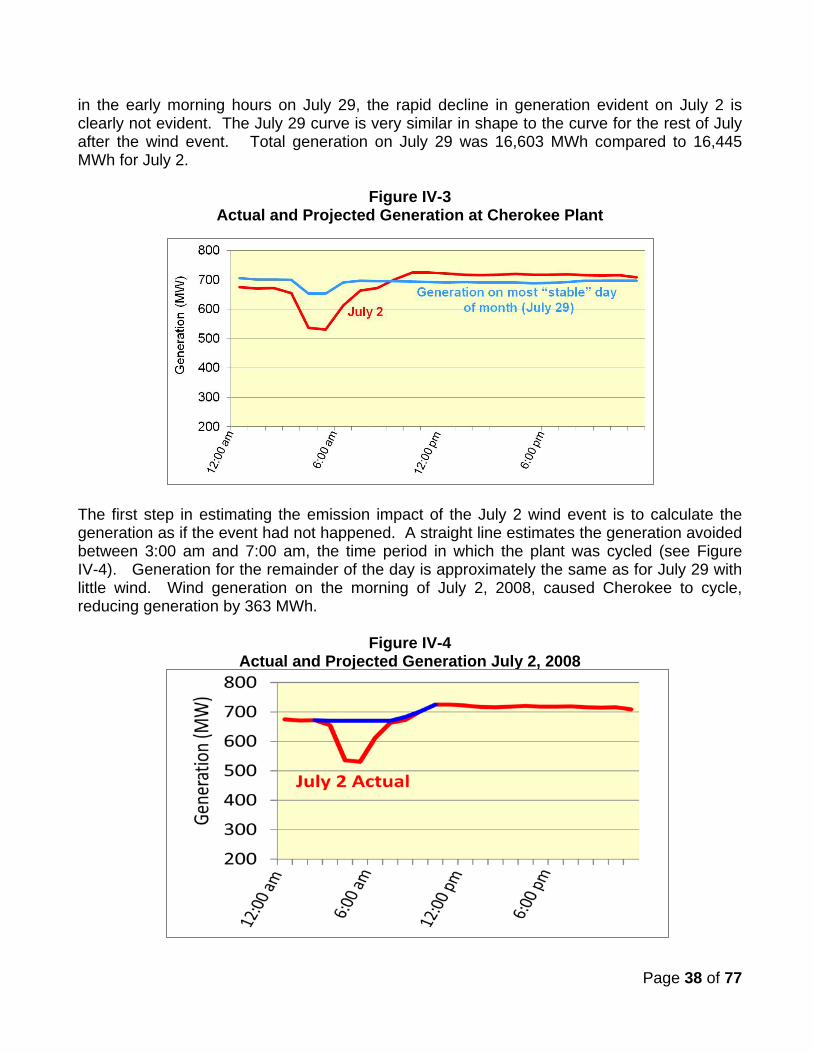
Operation of the Cherokee coal plant during this wind event is used to illustrate the emission impacts of cycling coal units. The Cherokee Plant was chosen due to its proximity to Denver and because it appears to be frequently cycled. The plant is comprised of four coal-fired boilers with summer nameplate capacity of 107 MW, 107 MW, 152 MW, and 352 MW, respectively. In 2008, the boilers were operated at 75%, 72%, 75% and 83% utilization rate, respectively. Cherokee’s hourly generation during this wind event is depicted in Figure IV-3. Between 2:00 am and 5:00 am generation at the plant fell by 141 MW, then, between 5:00 am and 7:00 am generation increased until it reached the high for the day of 725 MW at 10:00 am. From approximately 9:00 am through the balance of the day, generation was essentially flat. The performance of the coal-fired plant on July 2, contrasts sharply with its performance on July 29, when there was less wind on the system and the plant operation was stable. The red line in Figure IV-3 depicts hourly generation on July 29. Although generation declined slightly
Plant Fuel (MW) % Cap.
Arapahoe-3 Coal Owned 45 6 13%Arapahoe-4 Coal Owned 111 5 5%Cabin Creek-A Hydro Owned 162 95 59%Cabin Creek-B Hydro Owned 162 150 93%Cherokee-1 Coal Owned 107 6 6%Cherokee-2 Coal Owned 106 6 6%Cherokee-3 Coal Owned 152 22 14%Cherokee-4 Coal Owned 352 20 6%Commanche-1 Coal Owned 325 22 7%Commanche-2 Coal Owned 335 22 7%Fort St. Vrain N. Gas Owned 690 75 11%Pawnee Coal Owned 505 16 3%Valmont 5 Coal Owned 186 14 8%Valmont 6 Coal Owned 43 43 100% Arapahoe 5, 6, & 7 N. Gas IRP 122 20 16% Blue Spruce N. Gas IRP 271 81 30% Brush1/3 N. Gas IRP 76 18 24% Brush 2 N. Gas IRP 68 19 28% Brush 4d N. Gas IRP 135 44 33% Fountain Valley N. Gas IRP 238 34 14% Manchief N. Gas IRP 261 97 37%Rocky Mtn Energy N. Gas IRP 587 103 18% Spindle Hill N. Gas IRP 269 119 44% Thermo Fort Lupton N. Gas IRP 279 147 53% Tristate Brighton N. Gas IRP 132 55 42% Tristate Limon N. Gas IRP 63 27 43% Valmont 7 & 8 N. Gas IRP 79 38 48%
10-Minute Ramp RateOwned or IRP
ResourceCapacity
(MW)
Page 38 of 77
in the early morning hours on July 29, the rapid decline in generation evident on July 2 is clearly not evident. The July 29 curve is very similar in shape to the curve for the rest of July after the wind event. Total generation on July 29 was 16,603 MWh compared to 16,445 MWh for July 2.
Figure IV-3 Actual and Projected Generation at Cherokee Plant
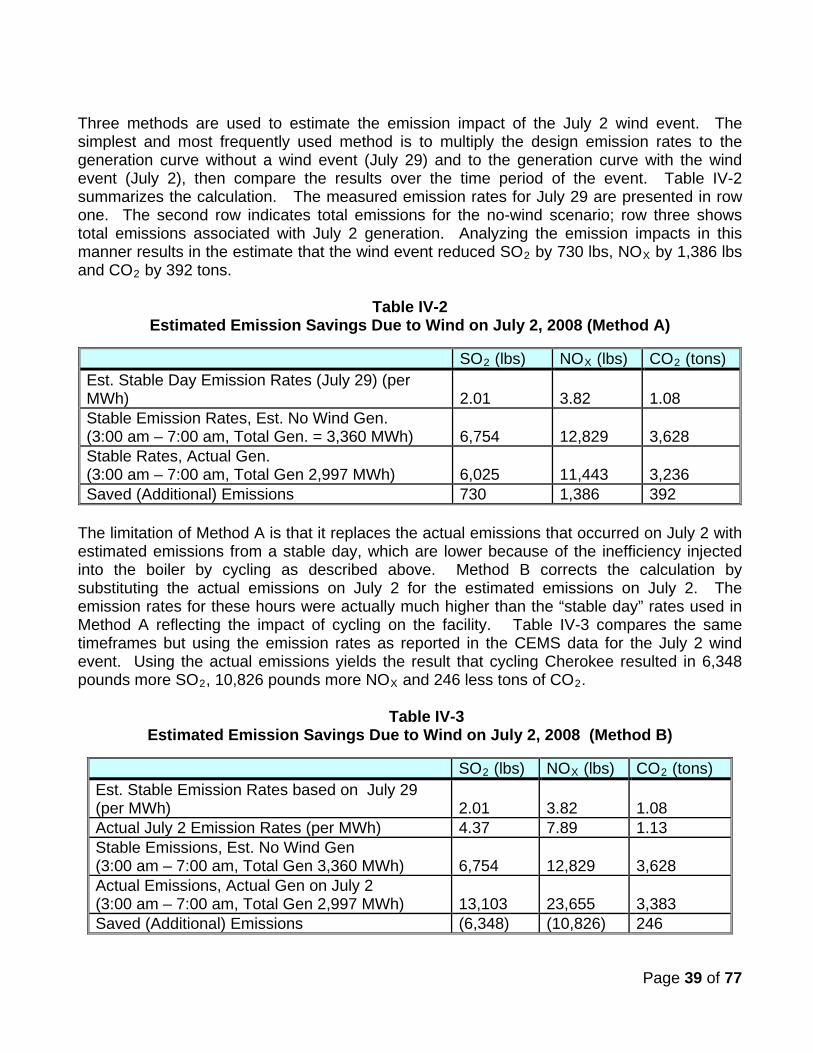
The first step in estimating the emission impact of the July 2 wind event is to calculate the generation as if the event had not happened. A straight line estimates the generation avoided between 3:00 am and 7:00 am, the time period in which the plant was cycled (see Figure IV-4). Generation for the remainder of the day is approximately the same as for July 29 with little wind. Wind generation on the morning of July 2, 2008, caused Cherokee to cycle, reducing generation by 363 MWh.
Figure IV-4 Actual and Projected Generation July 2, 2008
Page 39 of 77
Three methods are used to estimate the emission impact of the July 2 wind event. The simplest and most frequently used method is to multiply the design emission rates to the generation curve without a wind event (July 29) and to the generation curve with the wind event (July 2), then compare the results over the time period of the event. Table IV-2 summarizes the calculation. The measured emission rates for July 29 are presented in row one. The second row indicates total emissions for the no-wind scenario; row three shows total emissions associated with July 2 generation. Analyzing the emission impacts in this manner results in the estimate that the wind event reduced SO2 by 730 lbs, NOX by 1,386 lbs and CO2
by 392 tons.
Table IV-2 Estimated Emission Savings Due to Wind on July 2, 2008 (Method A)
SO2 NO (lbs) X CO (lbs) 2
Est. Stable Day Emission Rates (July 29) (per MWh)
(tons)
2.01 3.82 1.08 Stable Emission Rates, Est. No Wind Gen. (3:00 am – 7:00 am, Total Gen. = 3,360 MWh) 6,754 12,829 3,628 Stable Rates, Actual Gen. (3:00 am – 7:00 am, Total Gen 2,997 MWh) 6,025 11,443 3,236 Saved (Additional) Emissions 730 1,386 392
The limitation of Method A is that it replaces the actual emissions that occurred on July 2 with estimated emissions from a stable day, which are lower because of the inefficiency injected into the boiler by cycling as described above. Method B corrects the calculation by substituting the actual emissions on July 2 for the estimated emissions on July 2. The emission rates for these hours were actually much higher than the “stable day” rates used in Method A reflecting the impact of cycling on the facility. Table IV-3 compares the same timeframes but using the emission rates as reported in the CEMS data for the July 2 wind event. Using the actual emissions yields the result that cycling Cherokee resulted in 6,348 pounds more SO2, 10,826 pounds more NOX and 246 less tons of CO2
.
Table IV-3 Estimated Emission Savings Due to Wind on July 2, 2008 (Method B)
SO2 NO (lbs) X CO (lbs) 2
Est. Stable Emission Rates based on July 29 (per MWh)
(tons)
2.01 3.82 1.08 Actual July 2 Emission Rates (per MWh) 4.37 7.89 1.13 Stable Emissions, Est. No Wind Gen (3:00 am – 7:00 am, Total Gen 3,360 MWh) 6,754 12,829 3,628 Actual Emissions, Actual Gen on July 2 (3:00 am – 7:00 am, Total Gen 2,997 MWh) 13,103 23,655 3,383 Saved (Additional) Emissions (6,348) (10,826) 246
Page 40 of 77
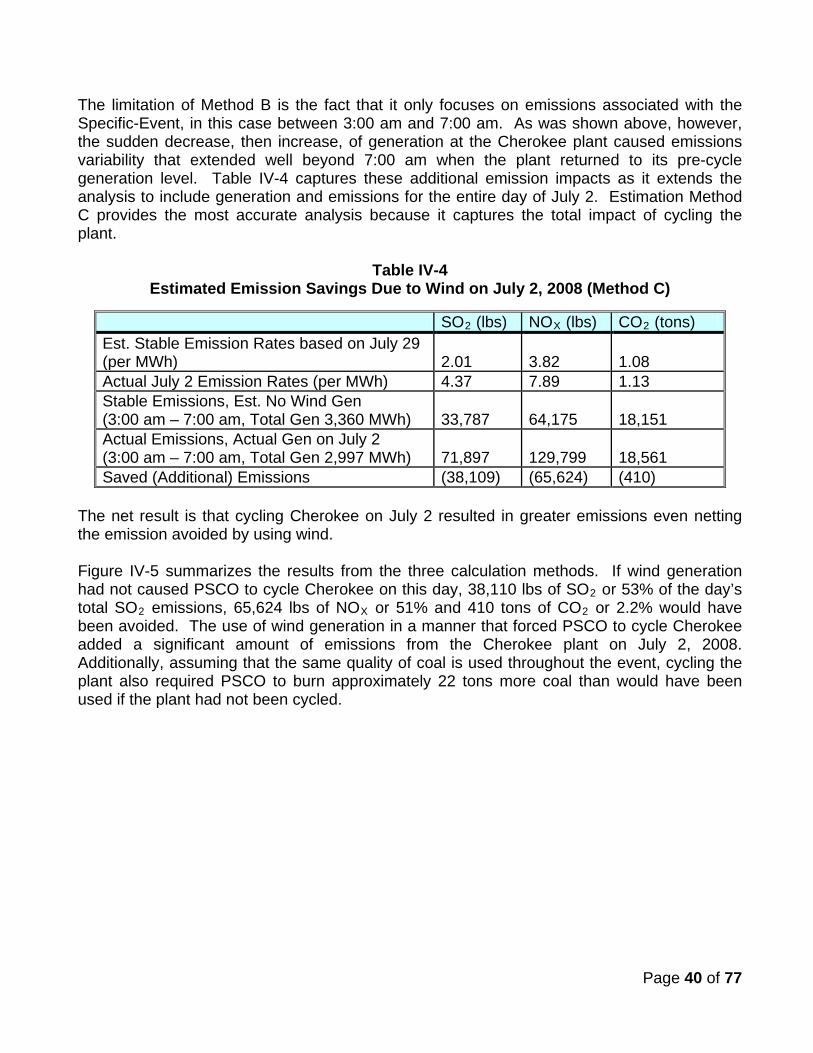
The limitation of Method B is the fact that it only focuses on emissions associated with the Specific-Event, in this case between 3:00 am and 7:00 am. As was shown above, however, the sudden decrease, then increase, of generation at the Cherokee plant caused emissions variability that extended well beyond 7:00 am when the plant returned to its pre-cycle generation level. Table IV-4 captures these additional emission impacts as it extends the analysis to include generation and emissions for the entire day of July 2. Estimation Method C provides the most accurate analysis because it captures the total impact of cycling the plant.
Table IV-4 Estimated Emission Savings Due to Wind on July 2, 2008 (Method C)
SO2 NO (lbs) X CO (lbs) 2
Est. Stable Emission Rates based on July 29 (per MWh)
(tons)
2.01 3.82 1.08 Actual July 2 Emission Rates (per MWh) 4.37 7.89 1.13 Stable Emissions, Est. No Wind Gen (3:00 am – 7:00 am, Total Gen 3,360 MWh) 33,787 64,175 18,151 Actual Emissions, Actual Gen on July 2 (3:00 am – 7:00 am, Total Gen 2,997 MWh) 71,897 129,799 18,561 Saved (Additional) Emissions (38,109) (65,624) (410)
The net result is that cycling Cherokee on July 2 resulted in greater emissions even netting the emission avoided by using wind. Figure IV-5 summarizes the results from the three calculation methods. If wind generation had not caused PSCO to cycle Cherokee on this day, 38,110 lbs of SO2 or 53% of the day’s total SO2 emissions, 65,624 lbs of NOX or 51% and 410 tons of CO2
or 2.2% would have been avoided. The use of wind generation in a manner that forced PSCO to cycle Cherokee added a significant amount of emissions from the Cherokee plant on July 2, 2008. Additionally, assuming that the same quality of coal is used throughout the event, cycling the plant also required PSCO to burn approximately 22 tons more coal than would have been used if the plant had not been cycled.

Page 41 of 77
Figure IV-5 Incremental Emissions Resulting From Cycling Cherokee on July 2, 2008
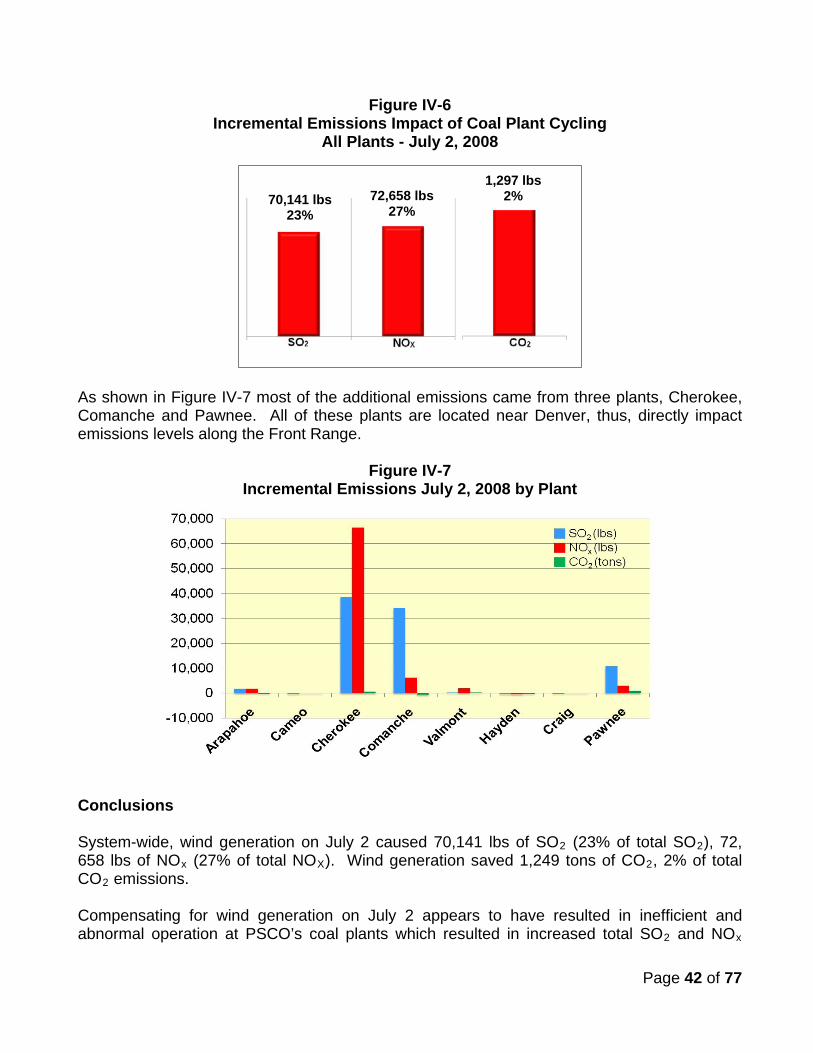
Figure IV-5 also shows how important the definition of event duration is to the estimated impact. If the narrow 3:00 am to 7:00 am definition is used, the impact of cycling is considerably less. However, this definition does not take into consideration the longer term difficulties of recalibrating the emission controls after a significant cycling event, which, as we have seen, can result in increased emissions over several hours. Clearly the longer term perspective is the most appropriate means to measure these impacts. The same analysis was used to estimate the emissions implications of the July 2 wind event on all of the coal-fired plants in PSCO’s resource base. The results are summarized in Figure IV-6. Using the 24-hour event definition (Method C) across the system, the July 2 wind event caused 70,141 pounds of SO2 (23% of the total PSCO coal emissions), 72,658 pounds of NOX (27%) and 1,297 more tons of CO2
(2%) to be emitted than if the event had not caused the plants to be cycled.
Page 42 of 77
Figure IV-6 Incremental Emissions Impact of Coal Plant Cycling
All Plants - July 2, 2008
As shown in Figure IV-7 most of the additional emissions came from three plants, Cherokee, Comanche and Pawnee. All of these plants are located near Denver, thus, directly impact emissions levels along the Front Range.
Figure IV-7 Incremental Emissions July 2, 2008 by Plant
Conclusions System-wide, wind generation on July 2 caused 70,141 lbs of SO2 (23% of total SO2), 72, 658 lbs of NOx (27% of total NOX). Wind generation saved 1,249 tons of CO2, 2% of total CO2
emissions.
Compensating for wind generation on July 2 appears to have resulted in inefficient and abnormal operation at PSCO’s coal plants which resulted in increased total SO2 and NOx
70,141 lbs 23%
72,658 lbs 27%
1,297 lbs 2%
Page 43 of 77
emissions. By netting out the emissions associated with the coal-fired generation that were avoided by using wind, the result is that due to wind generation, SO2 and NOX
Sept. 28-29, 2008
emissions were significantly higher (23% and 27%, respectively) than they would have been if the coal plants had not been cycled to compensate for wind generation.
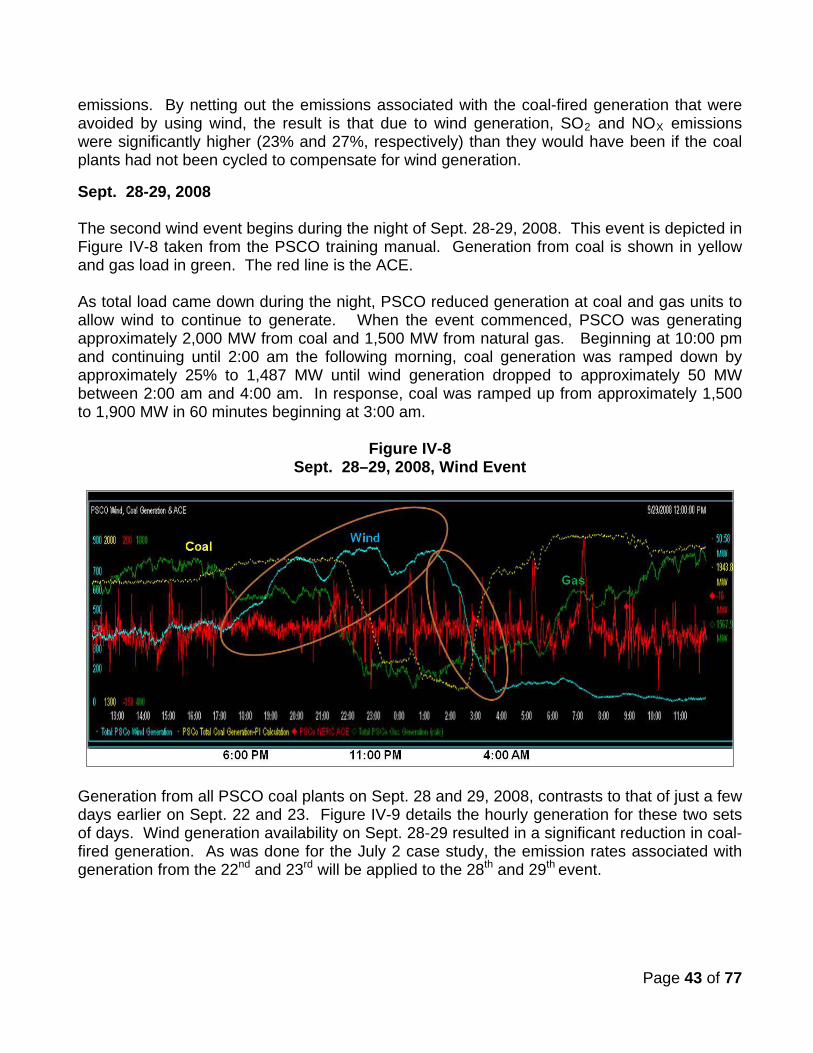
The second wind event begins during the night of Sept. 28-29, 2008. This event is depicted in Figure IV-8 taken from the PSCO training manual. Generation from coal is shown in yellow and gas load in green. The red line is the ACE. As total load came down during the night, PSCO reduced generation at coal and gas units to allow wind to continue to generate. When the event commenced, PSCO was generating approximately 2,000 MW from coal and 1,500 MW from natural gas. Beginning at 10:00 pm and continuing until 2:00 am the following morning, coal generation was ramped down by approximately 25% to 1,487 MW until wind generation dropped to approximately 50 MW between 2:00 am and 4:00 am. In response, coal was ramped up from approximately 1,500 to 1,900 MW in 60 minutes beginning at 3:00 am.
Figure IV-8 Sept. 28–29, 2008, Wind Event
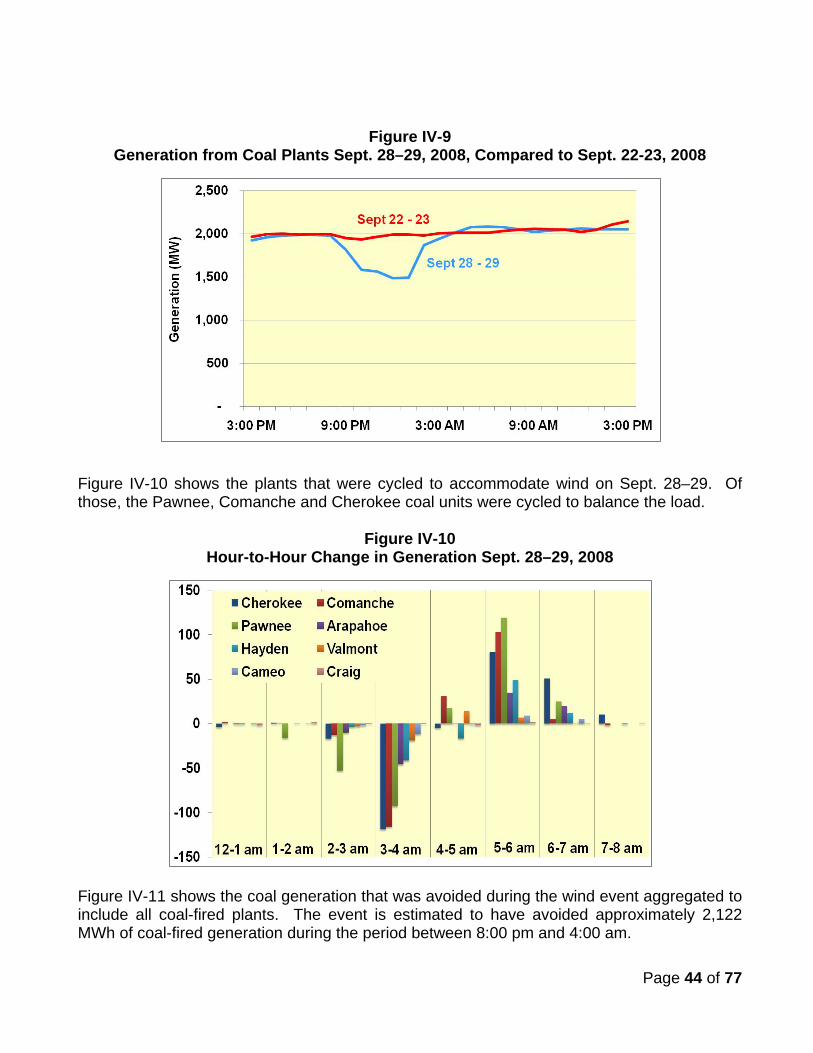
Generation from all PSCO coal plants on Sept. 28 and 29, 2008, contrasts to that of just a few days earlier on Sept. 22 and 23. Figure IV-9 details the hourly generation for these two sets of days. Wind generation availability on Sept. 28-29 resulted in a significant reduction in coal-fired generation. As was done for the July 2 case study, the emission rates associated with generation from the 22nd and 23rd will be applied to the 28th and 29th
event.
Page 44 of 77
Figure IV-9 Generation from Coal Plants Sept. 28–29, 2008, Compared to Sept. 22-23, 2008
Figure IV-10 shows the plants that were cycled to accommodate wind on Sept. 28–29. Of those, the Pawnee, Comanche and Cherokee coal units were cycled to balance the load.
Figure IV-10 Hour-to-Hour Change in Generation Sept. 28–29, 2008
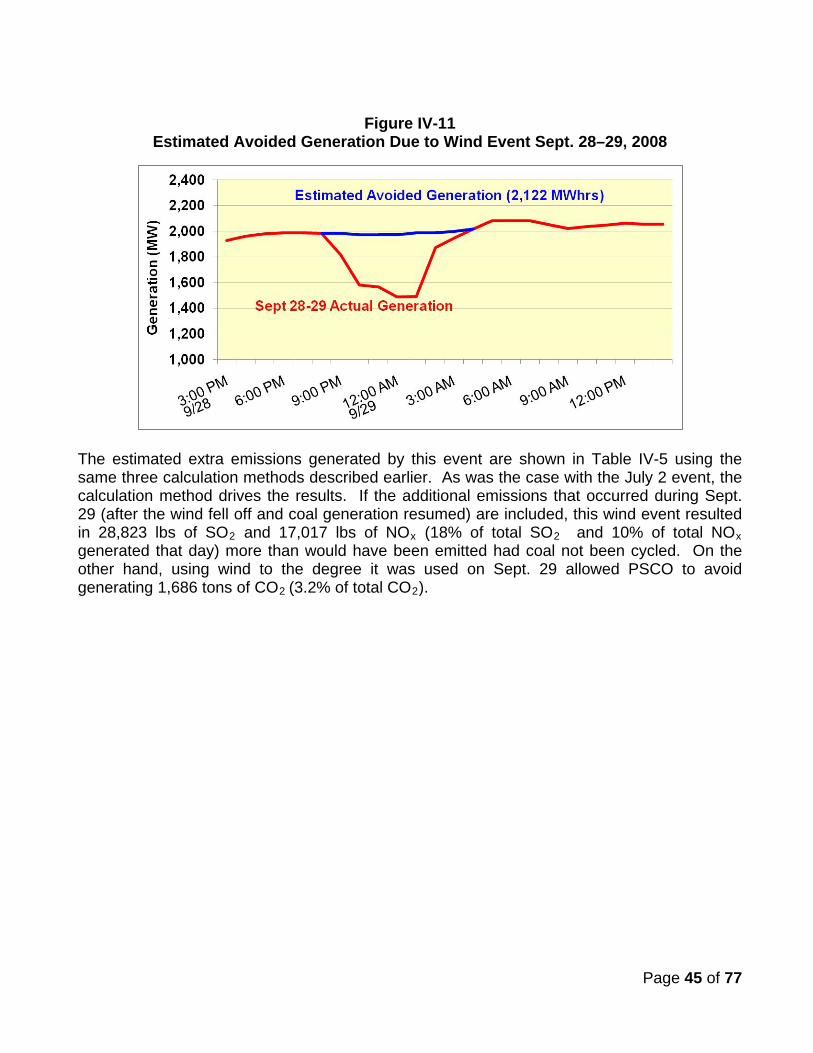
Figure IV-11 shows the coal generation that was avoided during the wind event aggregated to include all coal-fired plants. The event is estimated to have avoided approximately 2,122 MWh of coal-fired generation during the period between 8:00 pm and 4:00 am.
Page 45 of 77
Figure IV-11
Estimated Avoided Generation Due to Wind Event Sept. 28–29, 2008
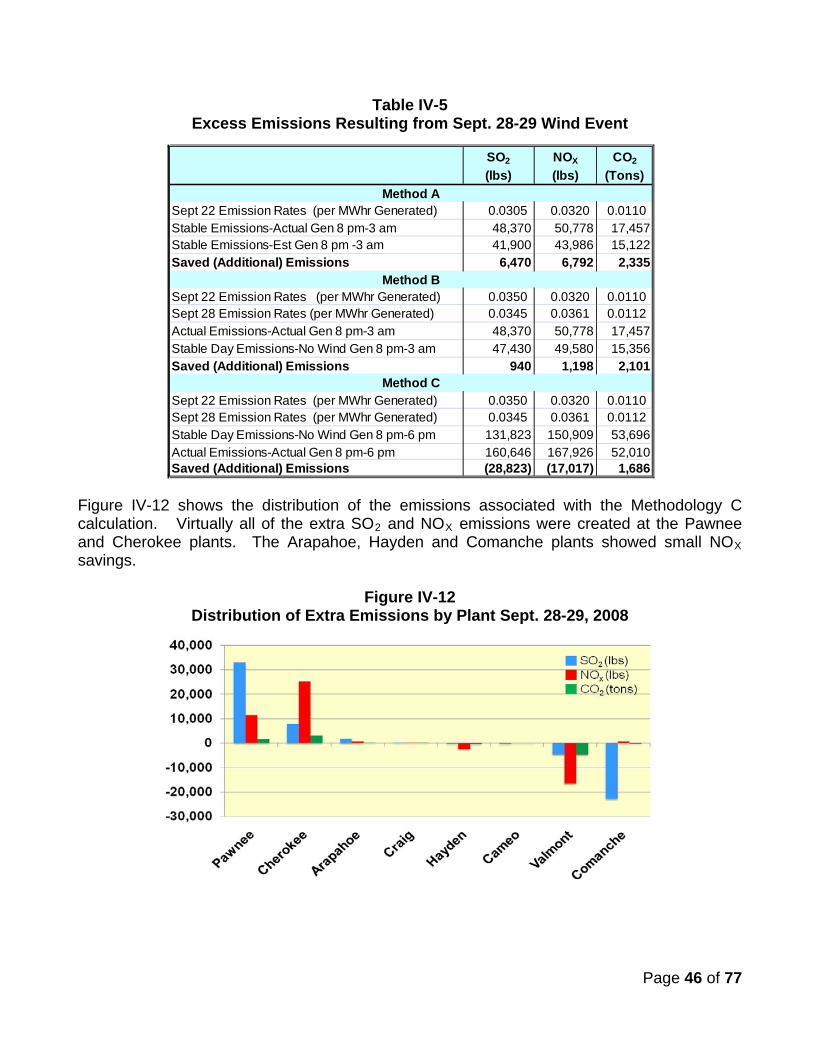
The estimated extra emissions generated by this event are shown in Table IV-5 using the same three calculation methods described earlier. As was the case with the July 2 event, the calculation method drives the results. If the additional emissions that occurred during Sept. 29 (after the wind fell off and coal generation resumed) are included, this wind event resulted in 28,823 lbs of SO2 and 17,017 lbs of NOx (18% of total SO2 and 10% of total NOx generated that day) more than would have been emitted had coal not been cycled. On the other hand, using wind to the degree it was used on Sept. 29 allowed PSCO to avoid generating 1,686 tons of CO2 (3.2% of total CO2
).
Page 46 of 77
Table IV-5 Excess Emissions Resulting from Sept. 28-29 Wind Event
Figure IV-12 shows the distribution of the emissions associated with the Methodology C calculation. Virtually all of the extra SO2 and NOX emissions were created at the Pawnee and Cherokee plants. The Arapahoe, Hayden and Comanche plants showed small NOX
savings.
Figure IV-12 Distribution of Extra Emissions by Plant Sept. 28-29, 2008
SO2
(lbs)NOX
(lbs)CO2
(Tons)
Sept 22 Emission Rates (per MWhr Generated) 0.0305 0.0320 0.0110 Stable Emissions-Actual Gen 8 pm-3 am 48,370 50,778 17,457Stable Emissions-Est Gen 8 pm -3 am 41,900 43,986 15,122Saved (Additional) Emissions 6,470 6,792 2,335
Sept 22 Emission Rates (per MWhr Generated) 0.0350 0.0320 0.0110 Sept 28 Emission Rates (per MWhr Generated) 0.0345 0.0361 0.0112 Actual Emissions-Actual Gen 8 pm-3 am 48,370 50,778 17,457Stable Day Emissions-No Wind Gen 8 pm-3 am 47,430 49,580 15,356Saved (Additional) Emissions 940 1,198 2,101
Sept 22 Emission Rates (per MWhr Generated) 0.0350 0.0320 0.0110 Sept 28 Emission Rates (per MWhr Generated) 0.0345 0.0361 0.0112 Stable Day Emissions-No Wind Gen 8 pm-6 pm 131,823 150,909 53,696Actual Emissions-Actual Gen 8 pm-6 pm 160,646 167,926 52,010Saved (Additional) Emissions (28,823) (17,017) 1,686
Method A
Method B
Method C
Page 47 of 77
Conclusions The two case studies reviewed in this chapter lead to two conclusions:
• When PSCO utilized more wind energy than it could absorb without cycling coal, net emission may occur. In these two examples, the additional emission levels amounted to significant percentages, greater than 10% of total SO2 and between 2% and 10% of total NOX
on the days reviewed.
• The amount of extra emissions due to cycling depends on how narrowly a “wind event” is defined. When the definition is limited to the very narrow definition, i.e., the time between when the wind build-up begins and when it falls off, then using wind energy appears to create a net emissions savings. However, when the definition is broadened to include the balance of the day after the wind dies down, the emission impacts become much more significant. The difference between the two approaches is the fact that cycling coal often results in destabilizing the emission equipment effectiveness and produces extra emissions for a longer period of time than just the actual wind event. The entire day must be analyzed to fully understand the impact of coal plant cycling on emissions.
Page 48 of 77
V. Coal Cycling Impacts on PSCO Territory Emissions
The preceding chapter documented the SO2, NOX and CO2 implications of two “wind events” defined as such by PSCO in their training manual. The important policy concern hinges on whether these types of events are common or whether the July 2 and Sept. 29, 2008, events are exceptional and rarely happen. To the degree that the events are exceptional, then the RPS standard appears to have little impact on levels of SO2 and NOX emissions. On the other hand, a troubling public policy question is raised if wind-induced coal cycling is common and generates higher levels of SO2 and NOX emissions. In that case, the mandates of the RPS standard are in direct conflict with the need to reduce SO2 and NOX
in order to meet EPA ozone attainment requirements.
This chapter concludes that, although circumstantial, the evidence strongly suggests that the latter is in fact true: incidence of coal cycling is common and has risen sharply since introduction of wind generation, and in 2008 and 2009 the result has been significantly greater emissions of SO2, NOX and CO2
than would have occurred if the coal units had not been cycled.
It has been stated before but is important to say it again here; it is not possible to understand precisely the interaction between wind generation and coal plant cycling in PSCO’s territory because PSCO will not release its hourly wind generation data. In contrast to the methodology that is employed when wind-coal interaction is analyzed in Chapter VI for ERCOT where wind data is available, we can only identify coal-cycling events. We cannot conclusively associate the events with wind activity (as we can in ERCOT), thus, we cannot differentiate between the impacts of wind events and other non-wind-induced cycling events such as regular maintenance and other “unplanned” generation downturns. As a consequence, the results described in this chapter will be discussed as caused by coal cycling rather than wind. As will be shown, however, it is a fair inference to conclude that much of the cycling is wind-induced as the occurrence of cycling has risen sharply since the growth of wind energy availability in 2007.
Coal-fired Generation Cycling The incidence of coal-fired-generation cycling has risen sharply since 2007 when approximately 1,000 MW of wind energy was introduced into the PSCO generation mix. Figure V-1 shows the number of cycling events distributed by the magnitude of the cycle, which is defined as percent change in hour-to-hour generation for all PSCO plants taken in aggregate. Purple depicts 2006 information, green 2007, red 2008 and blue 2009. Looked at from this “system perspective,” all magnitude categories increased substantially in 2008 after wind generation expanded. Cycling events that were between 5% and 10% of nameplate capacity increased by 36%, events between 10% and 15% more than doubled, and events between 15% and 20% tripled. There were nine events in 2008 over 20% where there were none in 2006.

Page 49 of 77
Figure V-1 Distribution of Coal-Fired Plant Cycling Events: All Plants Combined
The increase in cycling is even more evident when the behavior of individual plants is analyzed. Figure V-2 uses the same approach as was used above, but counts cycling events at individual plants, again, based on the hour-to-hour change in generation level relative to each plant’s nameplate capacity. The number of events at the individual plant level is significantly larger than when system-wide generation is considered, yet the number of events in each category has risen appreciably. The magnitude of change between 2006 and 2008-09 is even more impressive when the total generation from the plants is considered. According to the CEMS data series, the plants represented in these graphics generated 19,604 GWh in 2006 compared to 18,392 GWh in 2008 and 15,440 GWh in 2009. Between 2006 and 2009 generation from these plants fell by over 20%, yet the incidence of cycling events greater than 10% increased by between 47% and 23%. Even between 2008 and 2009 there were 24% more cycling events despite the fact that power production was down 16%.
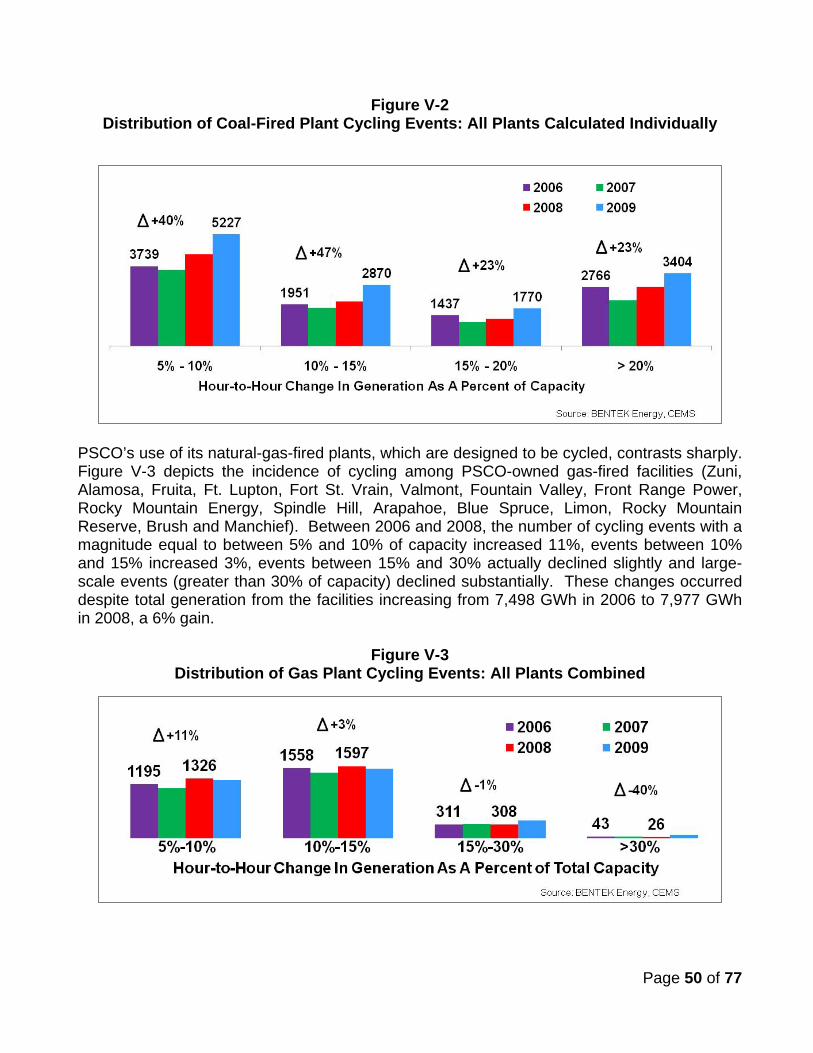
Page 50 of 77
Figure V-2 Distribution of Coal-Fired Plant Cycling Events: All Plants Calculated Individually
PSCO’s use of its natural-gas-fired plants, which are designed to be cycled, contrasts sharply. Figure V-3 depicts the incidence of cycling among PSCO-owned gas-fired facilities (Zuni, Alamosa, Fruita, Ft. Lupton, Fort St. Vrain, Valmont, Fountain Valley, Front Range Power, Rocky Mountain Energy, Spindle Hill, Arapahoe, Blue Spruce, Limon, Rocky Mountain Reserve, Brush and Manchief). Between 2006 and 2008, the number of cycling events with a magnitude equal to between 5% and 10% of capacity increased 11%, events between 10% and 15% increased 3%, events between 15% and 30% actually declined slightly and large-scale events (greater than 30% of capacity) declined substantially. These changes occurred despite total generation from the facilities increasing from 7,498 GWh in 2006 to 7,977 GWh in 2008, a 6% gain.
Figure V-3 Distribution of Gas Plant Cycling Events: All Plants Combined
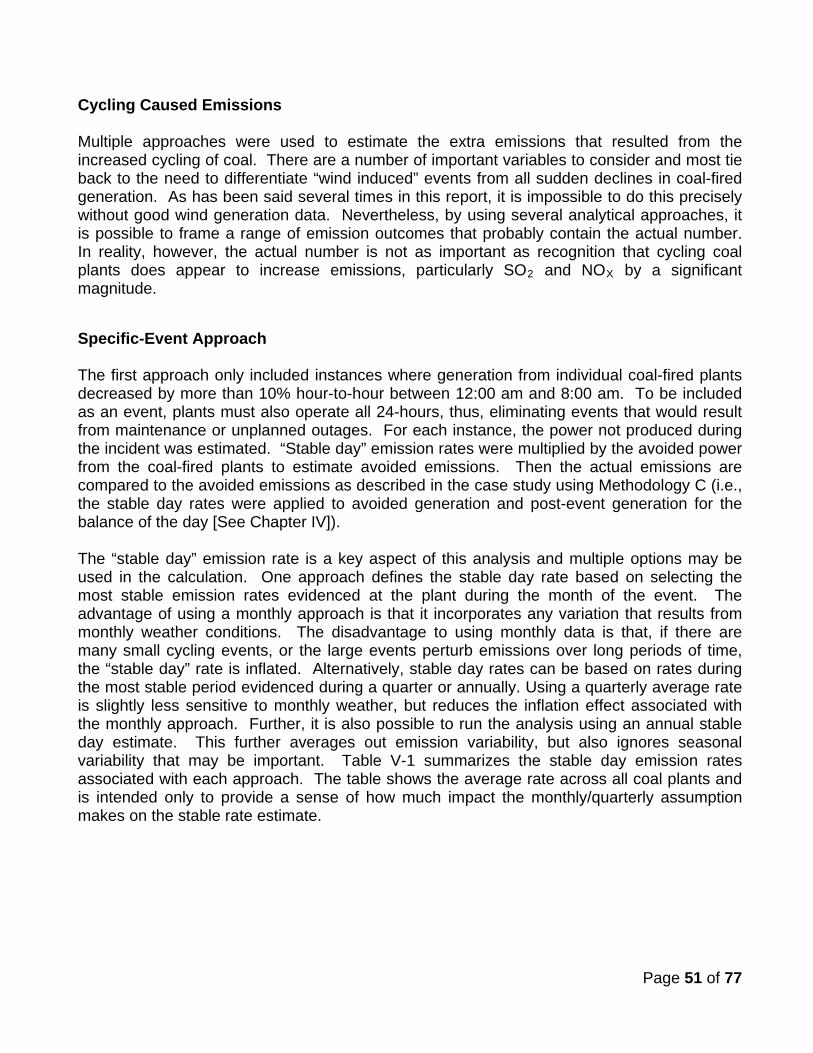
Page 51 of 77
Cycling Caused Emissions Multiple approaches were used to estimate the extra emissions that resulted from the increased cycling of coal. There are a number of important variables to consider and most tie back to the need to differentiate “wind induced” events from all sudden declines in coal-fired generation. As has been said several times in this report, it is impossible to do this precisely without good wind generation data. Nevertheless, by using several analytical approaches, it is possible to frame a range of emission outcomes that probably contain the actual number. In reality, however, the actual number is not as important as recognition that cycling coal plants does appear to increase emissions, particularly SO2 and NOX
by a significant magnitude.
Specific-Event Approach The first approach only included instances where generation from individual coal-fired plants decreased by more than 10% hour-to-hour between 12:00 am and 8:00 am. To be included as an event, plants must also operate all 24-hours, thus, eliminating events that would result from maintenance or unplanned outages. For each instance, the power not produced during the incident was estimated. “Stable day” emission rates were multiplied by the avoided power from the coal-fired plants to estimate avoided emissions. Then the actual emissions are compared to the avoided emissions as described in the case study using Methodology C (i.e., the stable day rates were applied to avoided generation and post-event generation for the balance of the day [See Chapter IV]). The “stable day” emission rate is a key aspect of this analysis and multiple options may be used in the calculation. One approach defines the stable day rate based on selecting the most stable emission rates evidenced at the plant during the month of the event. The advantage of using a monthly approach is that it incorporates any variation that results from monthly weather conditions. The disadvantage to using monthly data is that, if there are many small cycling events, or the large events perturb emissions over long periods of time, the “stable day” rate is inflated. Alternatively, stable day rates can be based on rates during the most stable period evidenced during a quarter or annually. Using a quarterly average rate is slightly less sensitive to monthly weather, but reduces the inflation effect associated with the monthly approach. Further, it is also possible to run the analysis using an annual stable day estimate. This further averages out emission variability, but also ignores seasonal variability that may be important. Table V-1 summarizes the stable day emission rates associated with each approach. The table shows the average rate across all coal plants and is intended only to provide a sense of how much impact the monthly/quarterly assumption makes on the stable rate estimate.
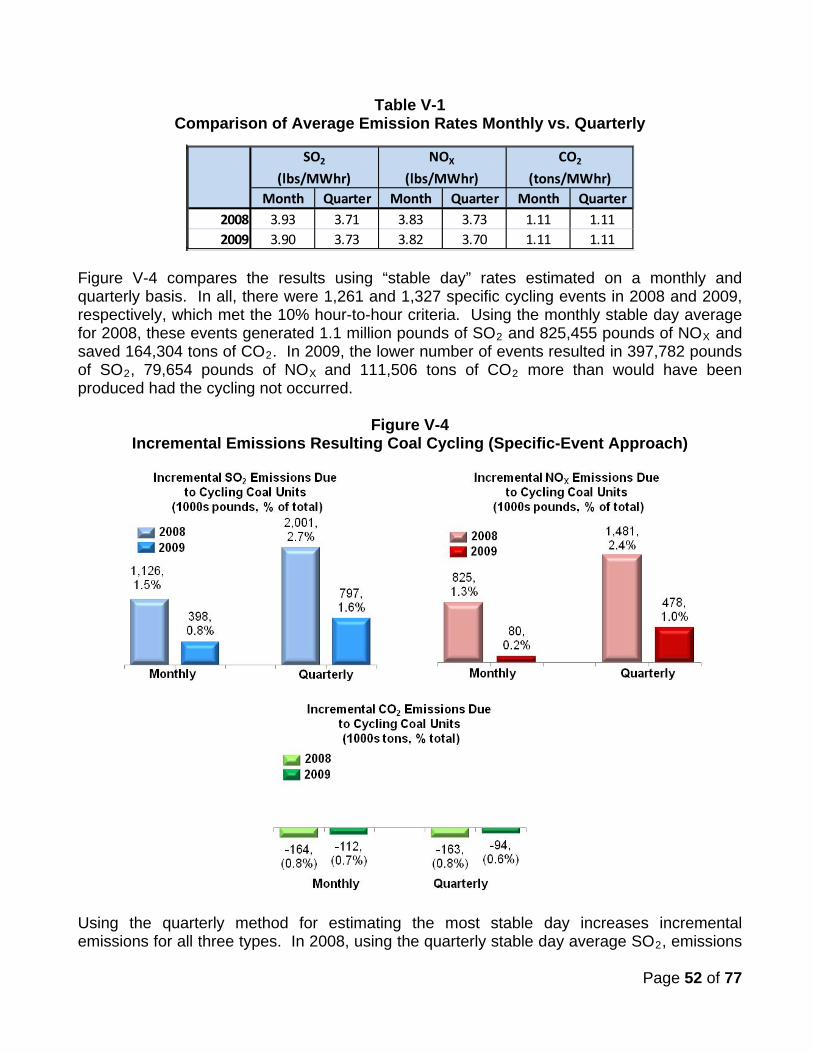
Page 52 of 77
Table V-1 Comparison of Average Emission Rates Monthly vs. Quarterly
Figure V-4 compares the results using “stable day” rates estimated on a monthly and quarterly basis. In all, there were 1,261 and 1,327 specific cycling events in 2008 and 2009, respectively, which met the 10% hour-to-hour criteria. Using the monthly stable day average for 2008, these events generated 1.1 million pounds of SO2 and 825,455 pounds of NOX and saved 164,304 tons of CO2. In 2009, the lower number of events resulted in 397,782 pounds of SO2, 79,654 pounds of NOX and 111,506 tons of CO2
more than would have been produced had the cycling not occurred.
Figure V-4 Incremental Emissions Resulting Coal Cycling (Specific-Event Approach)
Using the quarterly method for estimating the most stable day increases incremental emissions for all three types. In 2008, using the quarterly stable day average SO2
Month Quarter Month Quarter Month Quarter2008 3.93 3.71 3.83 3.73 1.11 1.112009 3.90 3.73 3.82 3.70 1.11 1.11
SO2
(lbs/MWhr)
NOX
(lbs/MWhr)
CO2
(tons/MWhr)
, emissions
Page 53 of 77
were 2.0 million pounds higher than would have been produced without coal cycling. NOX emissions were similarly elevated by 1.5 million pounds, but 163,146 tons of CO2 were not emitted. In 2009, coal cycling resulted in 797,423 pounds SO2, 477,762 pounds of NOX and 94,428 tons of CO2
being produced more than would have been produced without coal cycling.
Using the Specific-Event method to calculate emission suggests that coal cycling is causing PSCO to emit more SO2 and NOX
than it would have if the coal plants are not cycled to this degree. This approach, however, underestimates the magnitude of the problem because it ignores all of the little short-term cycling events and does not account for situations where cycling causes the emissions control to enter into a prolonged period of erratic behavior. Due to these limitations, the Specific-Event Approach can be viewed as defining a minimal level of probable impact.
Full-Year Approach The Full-Year Approach compensates for the limitations of the Specific-Event Approach. Instead of focusing simply on the days where there were 10% hour-to-hour declines as was done in the Specific-Event Approach, the Full-Year Approach applies the monthly and quarterly “stable day” emission rates to generation from every day of the year . Again, days when the plant is not running or days with planned outages are eliminated as a means of accounting for maintenance. Stable Day emission rates are the same as were calculated for the Specific-Event Approach. The implicit assumption in this approach is that cycling is the root cause of all emission rates that exceed those of the “stable day.” Another way of describing the underlying assumption for the Full-Year Approach is that it assumes the plants are run at their most stable emission rate consistently throughout the year. Due to these underlying assumptions, this estimation method may be viewed as calculating the upper end of incremental emissions associated with coal cycling. Figure V-5 shows the results from the Full-Year Approach. Using the monthly stable day rates in 2008, coal cycling caused PSCO to emit between 6.7 and 10.5 million pounds of SO2, between 4.5 and 6.3 million tons of NOX and 152,000 tons of CO2 more than would have been emitted had the plants been run stably throughout the year, depending on whether the monthly or quarterly stable day rate calculation is used. In 2009, cycling resulted in smaller levels of excess emissions for SO2, NOX and CO2
. The difference is most likely a result of the lower generation levels achieved by PSCO from these facilities in 2009, which were documented earlier.
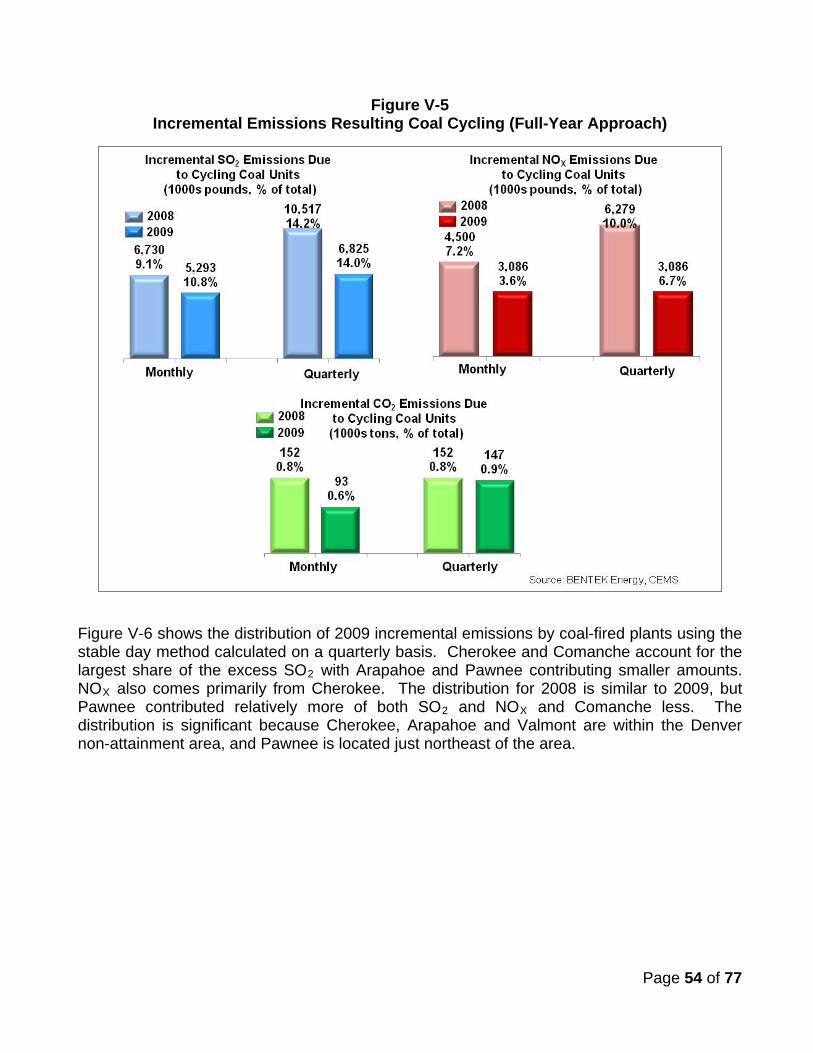
Page 54 of 77
Figure V-5 Incremental Emissions Resulting Coal Cycling (Full-Year Approach)
Figure V-6 shows the distribution of 2009 incremental emissions by coal-fired plants using the stable day method calculated on a quarterly basis. Cherokee and Comanche account for the largest share of the excess SO2 with Arapahoe and Pawnee contributing smaller amounts. NOX also comes primarily from Cherokee. The distribution for 2008 is similar to 2009, but Pawnee contributed relatively more of both SO2 and NOX
and Comanche less. The distribution is significant because Cherokee, Arapahoe and Valmont are within the Denver non-attainment area, and Pawnee is located just northeast of the area.
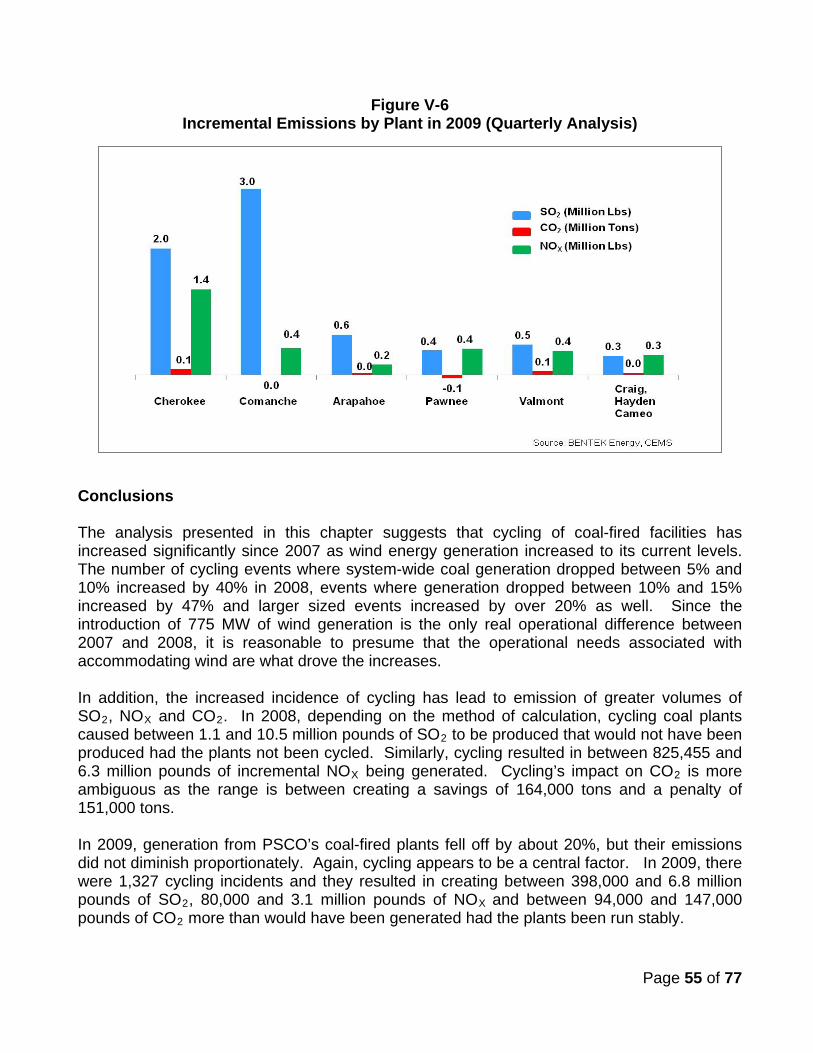
Page 55 of 77
Figure V-6 Incremental Emissions by Plant in 2009 (Quarterly Analysis)
Conclusions The analysis presented in this chapter suggests that cycling of coal-fired facilities has increased significantly since 2007 as wind energy generation increased to its current levels. The number of cycling events where system-wide coal generation dropped between 5% and 10% increased by 40% in 2008, events where generation dropped between 10% and 15% increased by 47% and larger sized events increased by over 20% as well. Since the introduction of 775 MW of wind generation is the only real operational difference between 2007 and 2008, it is reasonable to presume that the operational needs associated with accommodating wind are what drove the increases. In addition, the increased incidence of cycling has lead to emission of greater volumes of SO2, NOX and CO2. In 2008, depending on the method of calculation, cycling coal plants caused between 1.1 and 10.5 million pounds of SO2 to be produced that would not have been produced had the plants not been cycled. Similarly, cycling resulted in between 825,455 and 6.3 million pounds of incremental NOX being generated. Cycling’s impact on CO2
is more ambiguous as the range is between creating a savings of 164,000 tons and a penalty of 151,000 tons.
In 2009, generation from PSCO’s coal-fired plants fell off by about 20%, but their emissions did not diminish proportionately. Again, cycling appears to be a central factor. In 2009, there were 1,327 cycling incidents and they resulted in creating between 398,000 and 6.8 million pounds of SO2, 80,000 and 3.1 million pounds of NOX and between 94,000 and 147,000 pounds of CO2
more than would have been generated had the plants been run stably.
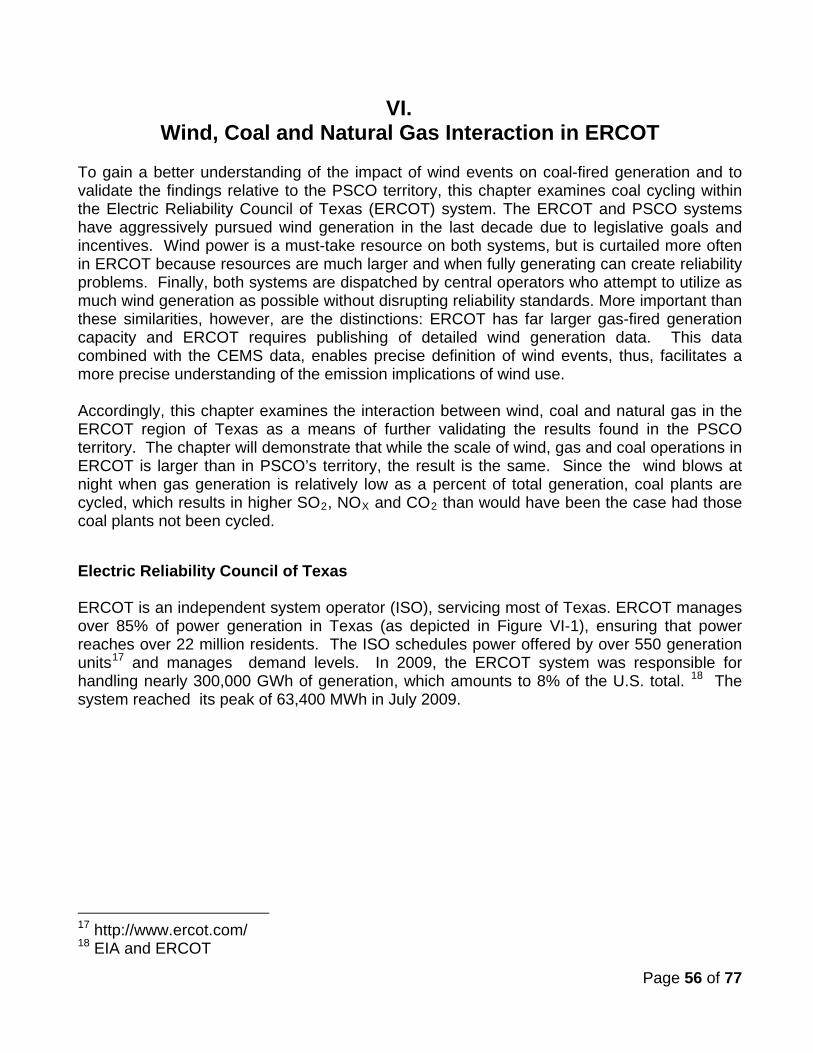
Page 56 of 77
VI. Wind, Coal and Natural Gas Interaction in ERCOT
To gain a better understanding of the impact of wind events on coal-fired generation and to validate the findings relative to the PSCO territory, this chapter examines coal cycling within the Electric Reliability Council of Texas (ERCOT) system. The ERCOT and PSCO systems have aggressively pursued wind generation in the last decade due to legislative goals and incentives. Wind power is a must-take resource on both systems, but is curtailed more often in ERCOT because resources are much larger and when fully generating can create reliability problems. Finally, both systems are dispatched by central operators who attempt to utilize as much wind generation as possible without disrupting reliability standards. More important than these similarities, however, are the distinctions: ERCOT has far larger gas-fired generation capacity and ERCOT requires publishing of detailed wind generation data. This data combined with the CEMS data, enables precise definition of wind events, thus, facilitates a more precise understanding of the emission implications of wind use. Accordingly, this chapter examines the interaction between wind, coal and natural gas in the ERCOT region of Texas as a means of further validating the results found in the PSCO territory. The chapter will demonstrate that while the scale of wind, gas and coal operations in ERCOT is larger than in PSCO’s territory, the result is the same. Since the wind blows at night when gas generation is relatively low as a percent of total generation, coal plants are cycled, which results in higher SO2, NOX and CO2
than would have been the case had those coal plants not been cycled.
Electric Reliability Council of Texas ERCOT is an independent system operator (ISO), servicing most of Texas. ERCOT manages over 85% of power generation in Texas (as depicted in Figure VI-1), ensuring that power reaches over 22 million residents. The ISO schedules power offered by over 550 generation units17 and manages demand levels. In 2009, the ERCOT system was responsible for handling nearly 300,000 GWh of generation, which amounts to 8% of the U.S. total. 18
The system reached its peak of 63,400 MWh in July 2009.
17 http://www.ercot.com/ 18 EIA and ERCOT
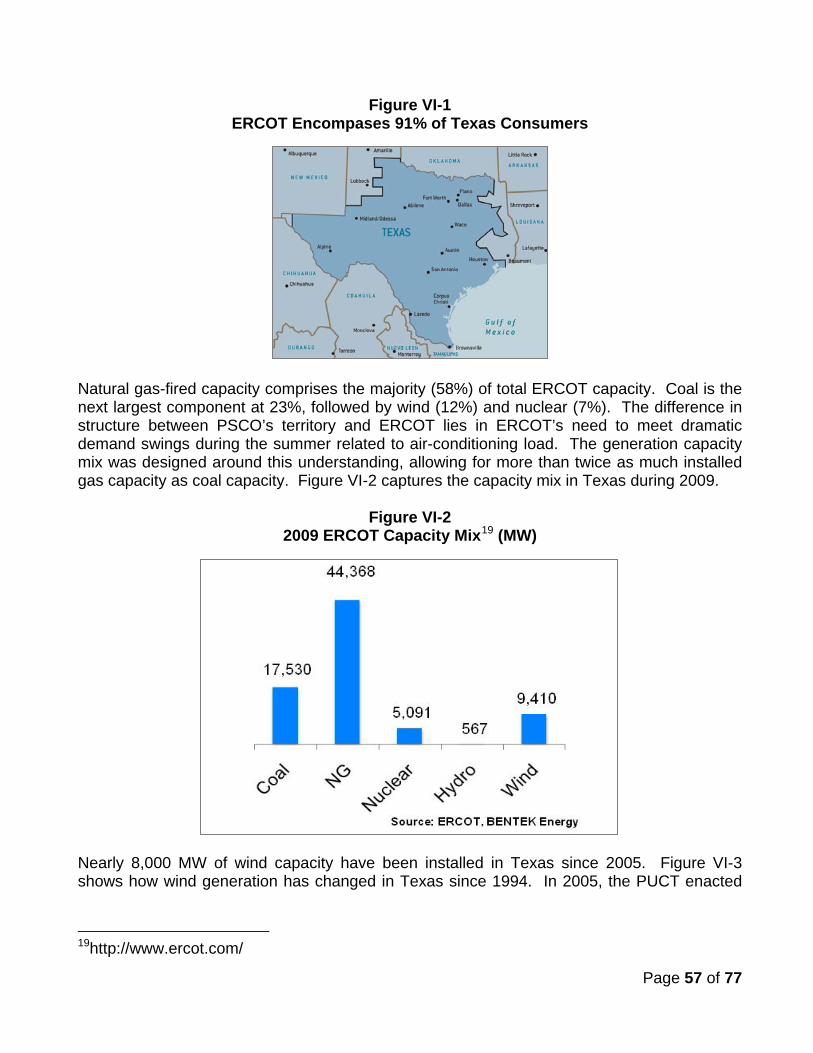
Page 57 of 77
Figure VI-1 ERCOT Encompases 91% of Texas Consumers
Natural gas-fired capacity comprises the majority (58%) of total ERCOT capacity. Coal is the next largest component at 23%, followed by wind (12%) and nuclear (7%). The difference in structure between PSCO’s territory and ERCOT lies in ERCOT’s need to meet dramatic demand swings during the summer related to air-conditioning load. The generation capacity mix was designed around this understanding, allowing for more than twice as much installed gas capacity as coal capacity. Figure VI-2 captures the capacity mix in Texas during 2009.
Figure VI-2 2009 ERCOT Capacity Mix19
(MW)
Nearly 8,000 MW of wind capacity have been installed in Texas since 2005. Figure VI-3 shows how wind generation has changed in Texas since 1994. In 2005, the PUCT enacted
19http://www.ercot.com/
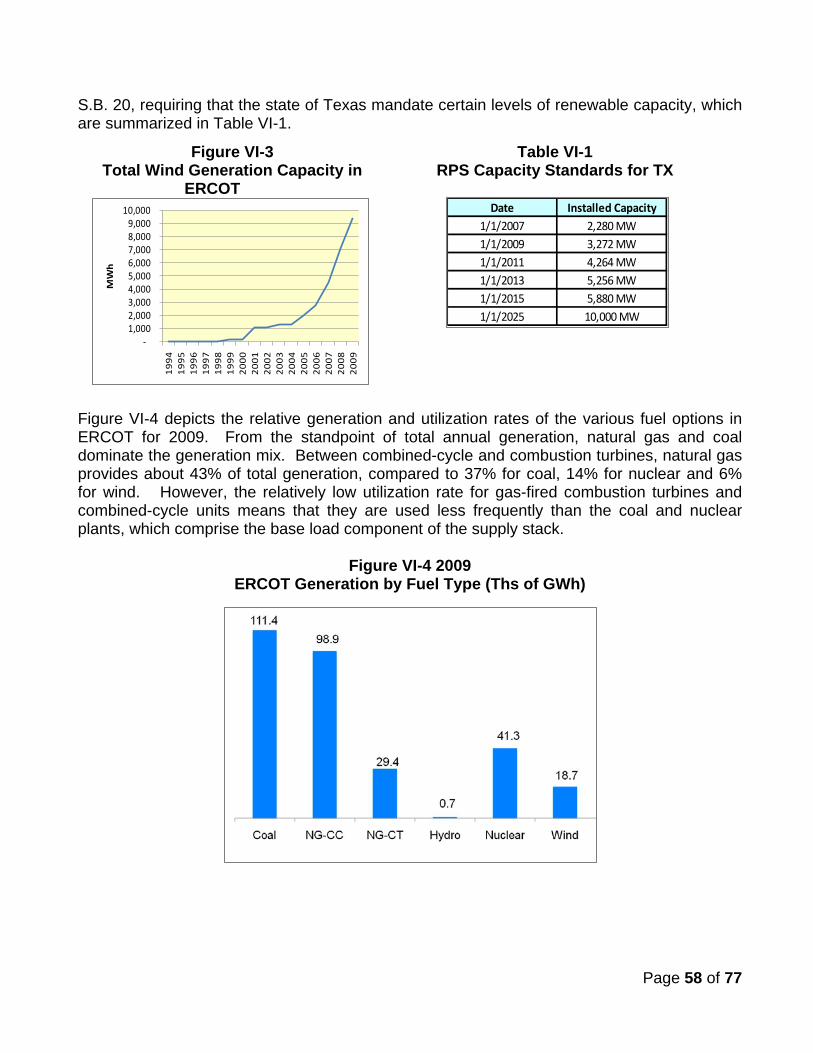
Page 58 of 77
S.B. 20, requiring that the state of Texas mandate certain levels of renewable capacity, which are summarized in Table VI-1.
Figure VI-4 depicts the relative generation and utilization rates of the various fuel options in ERCOT for 2009. From the standpoint of total annual generation, natural gas and coal dominate the generation mix. Between combined-cycle and combustion turbines, natural gas provides about 43% of total generation, compared to 37% for coal, 14% for nuclear and 6% for wind. However, the relatively low utilization rate for gas-fired combustion turbines and combined-cycle units means that they are used less frequently than the coal and nuclear plants, which comprise the base load component of the supply stack.
Figure VI-4 2009 ERCOT Generation by Fuel Type (Ths of GWh)
Date Installed Capacity1/1/2007 2,280 MW1/1/2009 3,272 MW1/1/2011 4,264 MW1/1/2013 5,256 MW1/1/2015 5,880 MW1/1/2025 10,000 MW
Table VI-1 RPS Capacity Standards for TX
Figure VI-3 Total Wind Generation Capacity in
ERCOT
-1,000 2,000 3,000 4,000 5,000 6,000 7,000 8,000 9,000
10,000
19
94
19
95
19
96
19
97
19
98
19
99
20
00
20
01
20
02
20
03
20
04
20
05
20
06
20
07
20
08
20
09
MW
h
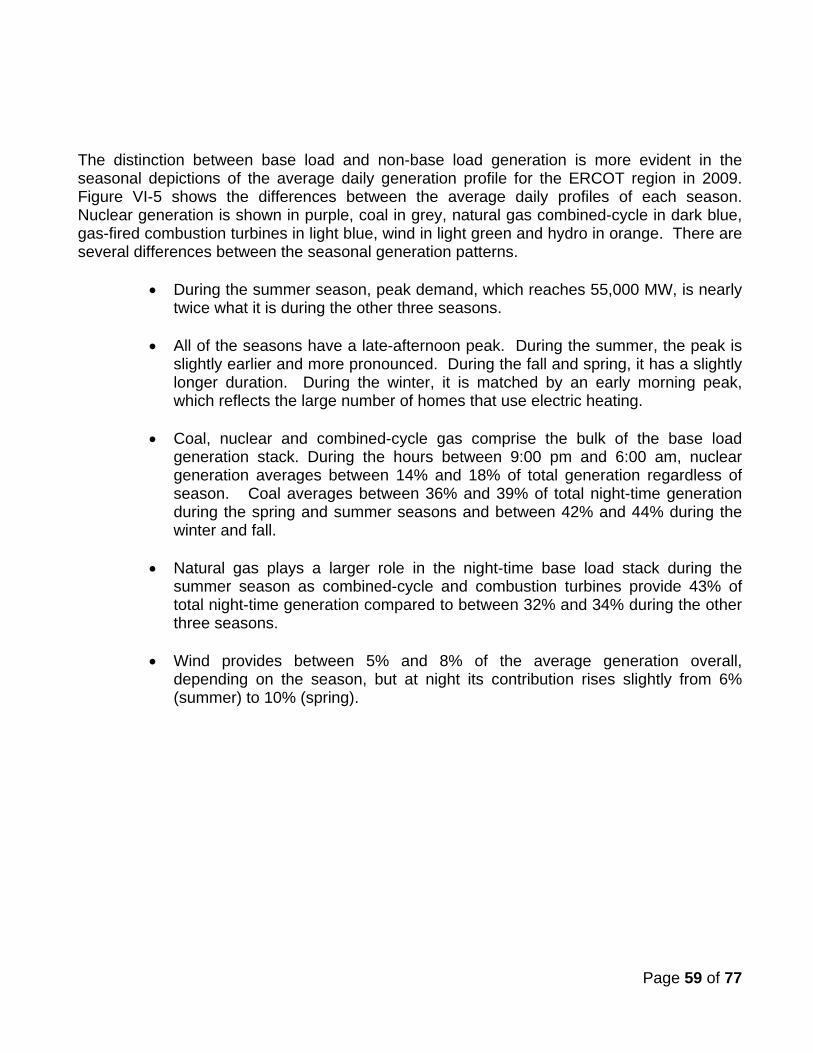
Page 59 of 77
The distinction between base load and non-base load generation is more evident in the seasonal depictions of the average daily generation profile for the ERCOT region in 2009. Figure VI-5 shows the differences between the average daily profiles of each season. Nuclear generation is shown in purple, coal in grey, natural gas combined-cycle in dark blue, gas-fired combustion turbines in light blue, wind in light green and hydro in orange. There are several differences between the seasonal generation patterns.
• During the summer season, peak demand, which reaches 55,000 MW, is nearly twice what it is during the other three seasons.
• All of the seasons have a late-afternoon peak. During the summer, the peak is slightly earlier and more pronounced. During the fall and spring, it has a slightly longer duration. During the winter, it is matched by an early morning peak, which reflects the large number of homes that use electric heating.
• Coal, nuclear and combined-cycle gas comprise the bulk of the base load
generation stack. During the hours between 9:00 pm and 6:00 am, nuclear generation averages between 14% and 18% of total generation regardless of season. Coal averages between 36% and 39% of total night-time generation during the spring and summer seasons and between 42% and 44% during the winter and fall.
• Natural gas plays a larger role in the night-time base load stack during the
summer season as combined-cycle and combustion turbines provide 43% of total night-time generation compared to between 32% and 34% during the other three seasons.
• Wind provides between 5% and 8% of the average generation overall,
depending on the season, but at night its contribution rises slightly from 6% (summer) to 10% (spring).
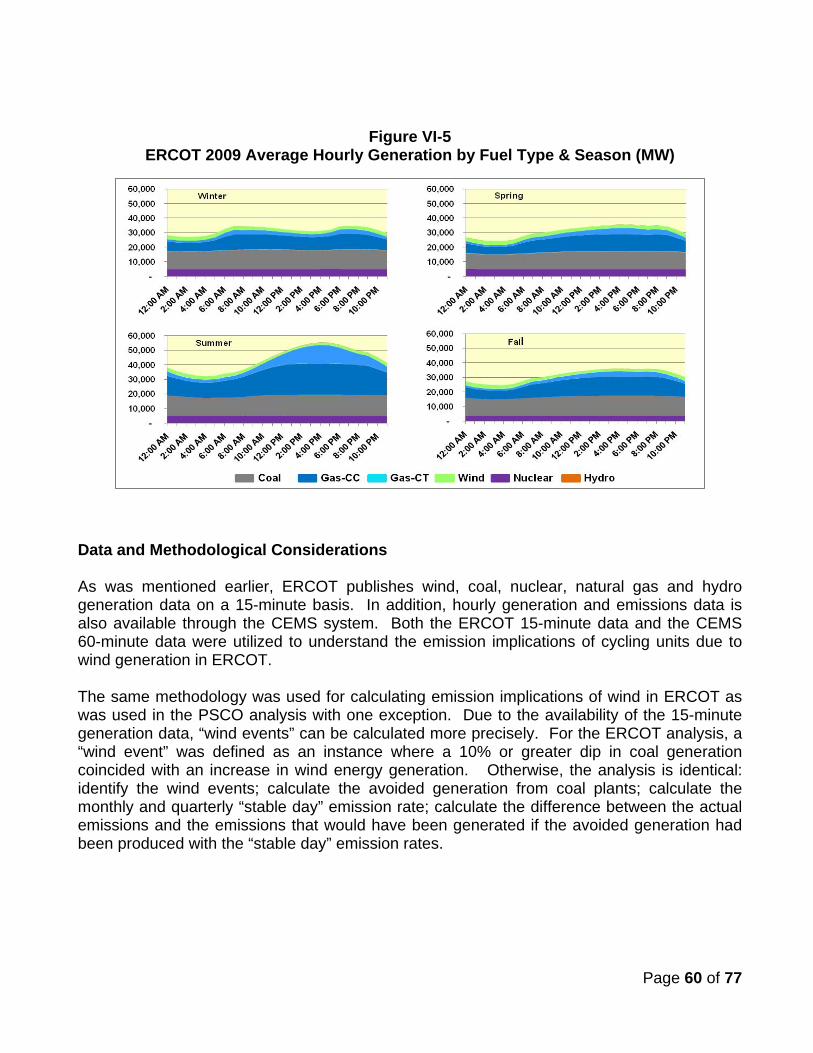
Page 60 of 77
Figure VI-5 ERCOT 2009 Average Hourly Generation by Fuel Type & Season (MW)
Data and Methodological Considerations As was mentioned earlier, ERCOT publishes wind, coal, nuclear, natural gas and hydro generation data on a 15-minute basis. In addition, hourly generation and emissions data is also available through the CEMS system. Both the ERCOT 15-minute data and the CEMS 60-minute data were utilized to understand the emission implications of cycling units due to wind generation in ERCOT. The same methodology was used for calculating emission implications of wind in ERCOT as was used in the PSCO analysis with one exception. Due to the availability of the 15-minute generation data, “wind events” can be calculated more precisely. For the ERCOT analysis, a “wind event” was defined as an instance where a 10% or greater dip in coal generation coincided with an increase in wind energy generation. Otherwise, the analysis is identical: identify the wind events; calculate the avoided generation from coal plants; calculate the monthly and quarterly “stable day” emission rate; calculate the difference between the actual emissions and the emissions that would have been generated if the avoided generation had been produced with the “stable day” emission rates.

Page 61 of 77
Frequency of Coal and Gas Cycling Coal plants are being cycled due to wind generation on the ERCOT system. The eight-day example shown in Figure VI-6 illustrates the mechanism. Coal generation is represented by the grey area, wind by the light green; the black ovals highlight cycling events. On each day as wind increases between 9:00 pm and 5:00 am, coal generation dips. On some days, such as Nov. 9 and 10, coal generation drops significantly. But even on days such as Nov. 8 when limited wind comes on the system, it appears to push a small amount of coal generation offline.
Figure VI-6 Coal Plants Are Cycled as Wind Generation Increases (Nov. 5-12, 2008)
Figure VI-7 shows the impact of wind on coal cycling in ERCOT. The solid bars indicate the amount of wind induced cycle events. The shaded portion indicates the cycling events not related to wind. The categories capture the size of the cycling event. For example, the first category labeled 300-500 MW indicates that the number of instances in which the total coal-fired generation changed from 300 to 500 MW hour-to-hour.
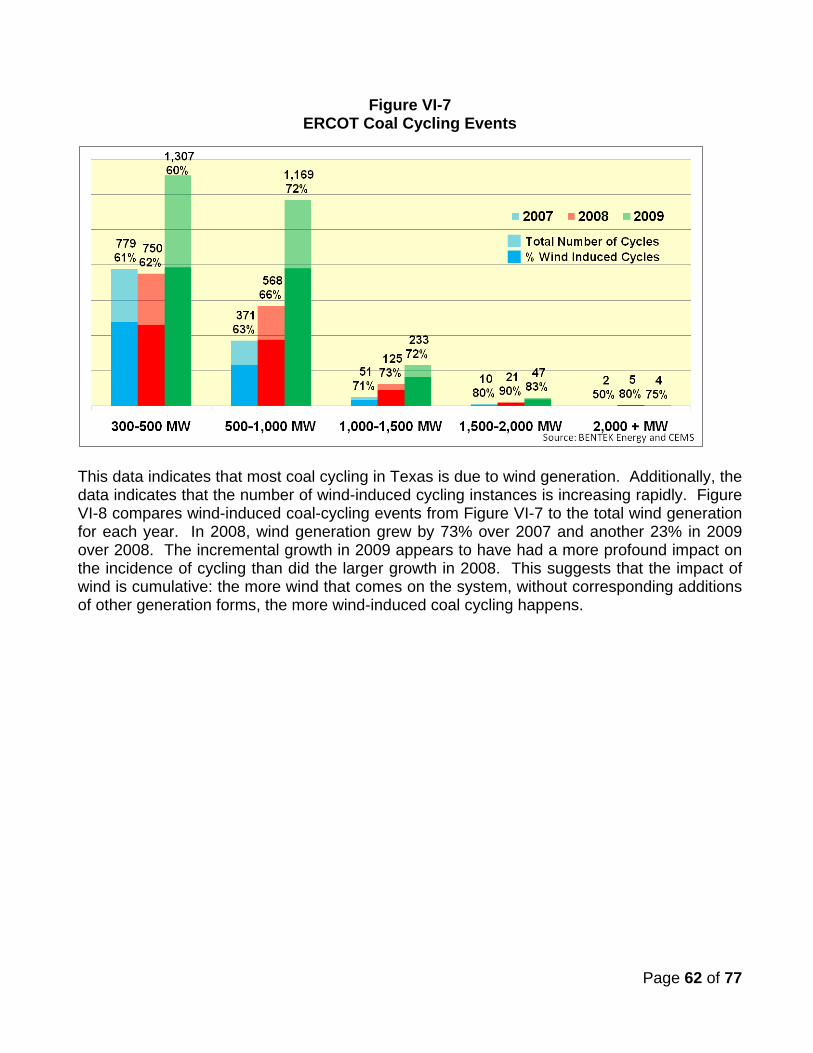
Page 62 of 77
Figure VI-7 ERCOT Coal Cycling Events
This data indicates that most coal cycling in Texas is due to wind generation. Additionally, the data indicates that the number of wind-induced cycling instances is increasing rapidly. Figure VI-8 compares wind-induced coal-cycling events from Figure VI-7 to the total wind generation for each year. In 2008, wind generation grew by 73% over 2007 and another 23% in 2009 over 2008. The incremental growth in 2009 appears to have had a more profound impact on the incidence of cycling than did the larger growth in 2008. This suggests that the impact of wind is cumulative: the more wind that comes on the system, without corresponding additions of other generation forms, the more wind-induced coal cycling happens.
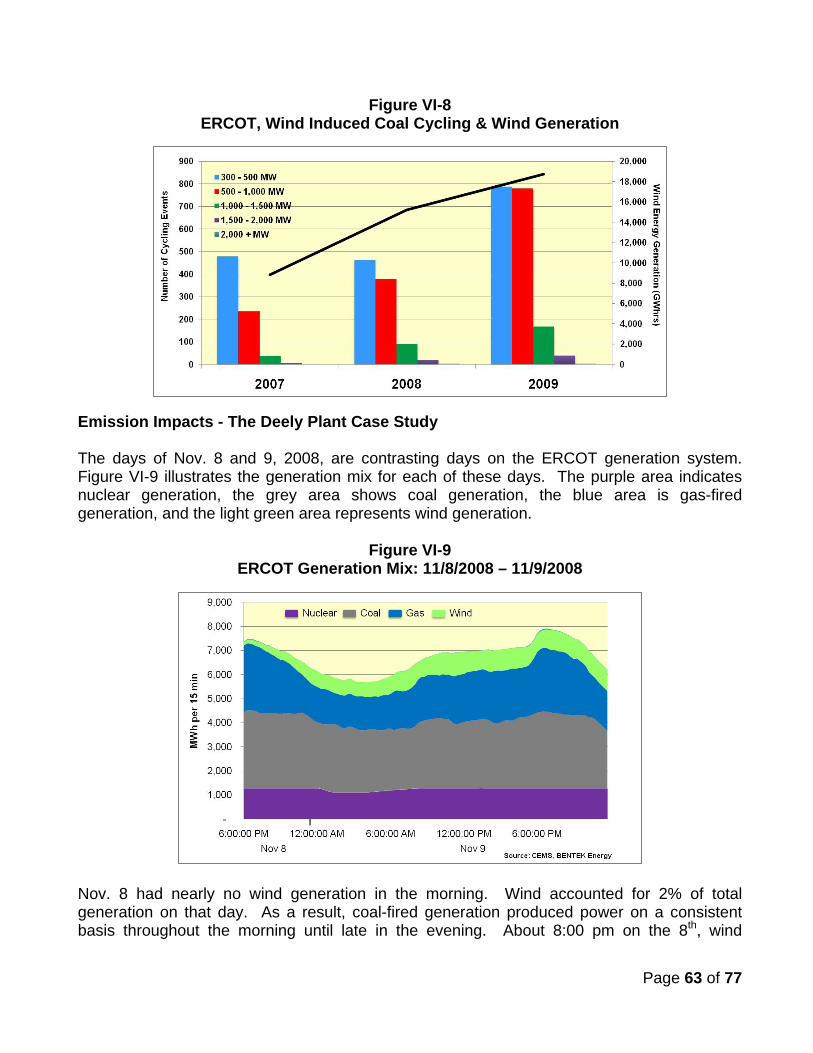
Page 63 of 77
Figure VI-8 ERCOT, Wind Induced Coal Cycling & Wind Generation
Emission Impacts - The Deely Plant Case Study The days of Nov. 8 and 9, 2008, are contrasting days on the ERCOT generation system. Figure VI-9 illustrates the generation mix for each of these days. The purple area indicates nuclear generation, the grey area shows coal generation, the blue area is gas-fired generation, and the light green area represents wind generation.
Figure VI-9 ERCOT Generation Mix: 11/8/2008 – 11/9/2008
Nov. 8 had nearly no wind generation in the morning. Wind accounted for 2% of total generation on that day. As a result, coal-fired generation produced power on a consistent basis throughout the morning until late in the evening. About 8:00 pm on the 8th, wind
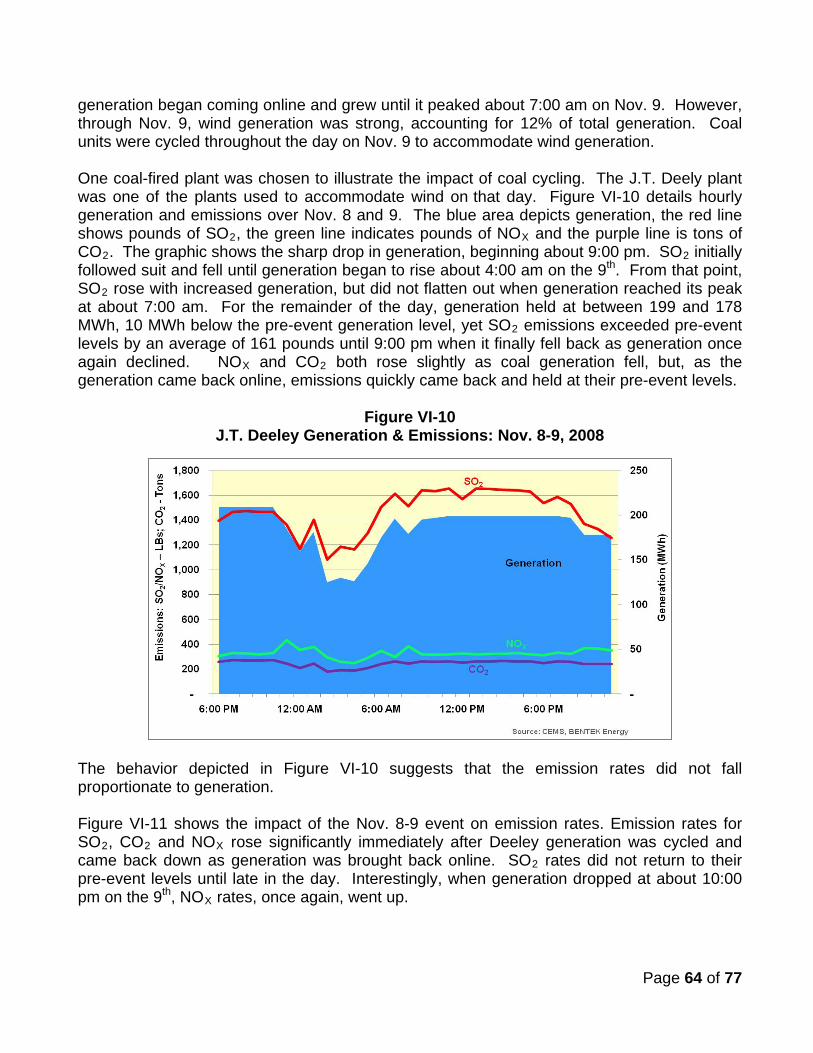
Page 64 of 77
generation began coming online and grew until it peaked about 7:00 am on Nov. 9. However, through Nov. 9, wind generation was strong, accounting for 12% of total generation. Coal units were cycled throughout the day on Nov. 9 to accommodate wind generation. One coal-fired plant was chosen to illustrate the impact of coal cycling. The J.T. Deely plant was one of the plants used to accommodate wind on Figure VI-10that day. details hourly generation and emissions over Nov. 8 and 9. The blue area depicts generation, the red line shows pounds of SO2, the green line indicates pounds of NOX and the purple line is tons of CO2. The graphic shows the sharp drop in generation, beginning about 9:00 pm. SO2 initially followed suit and fell until generation began to rise about 4:00 am on the 9th. From that point, SO2 rose with increased generation, but did not flatten out when generation reached its peak at about 7:00 am. For the remainder of the day, generation held at between 199 and 178 MWh, 10 MWh below the pre-event generation level, yet SO2 emissions exceeded pre-event levels by an average of 161 pounds until 9:00 pm when it finally fell back as generation once again declined. NOX and CO2
both rose slightly as coal generation fell, but, as the generation came back online, emissions quickly came back and held at their pre-event levels.
Figure VI-10 J.T. Deeley Generation & Emissions: Nov. 8-9, 2008
The behavior depicted in Figure VI-10 suggests that the emission rates did not fall proportionate to generation. Figure VI-11 shows the impact of the Nov. 8-9 event on emission rates. Emission rates for SO2, CO2 and NOX rose significantly immediately after Deeley generation was cycled and came back down as generation was brought back online. SO2 rates did not return to their pre-event levels until late in the day. Interestingly, when generation dropped at about 10:00 pm on the 9th, NOX
rates, once again, went up.
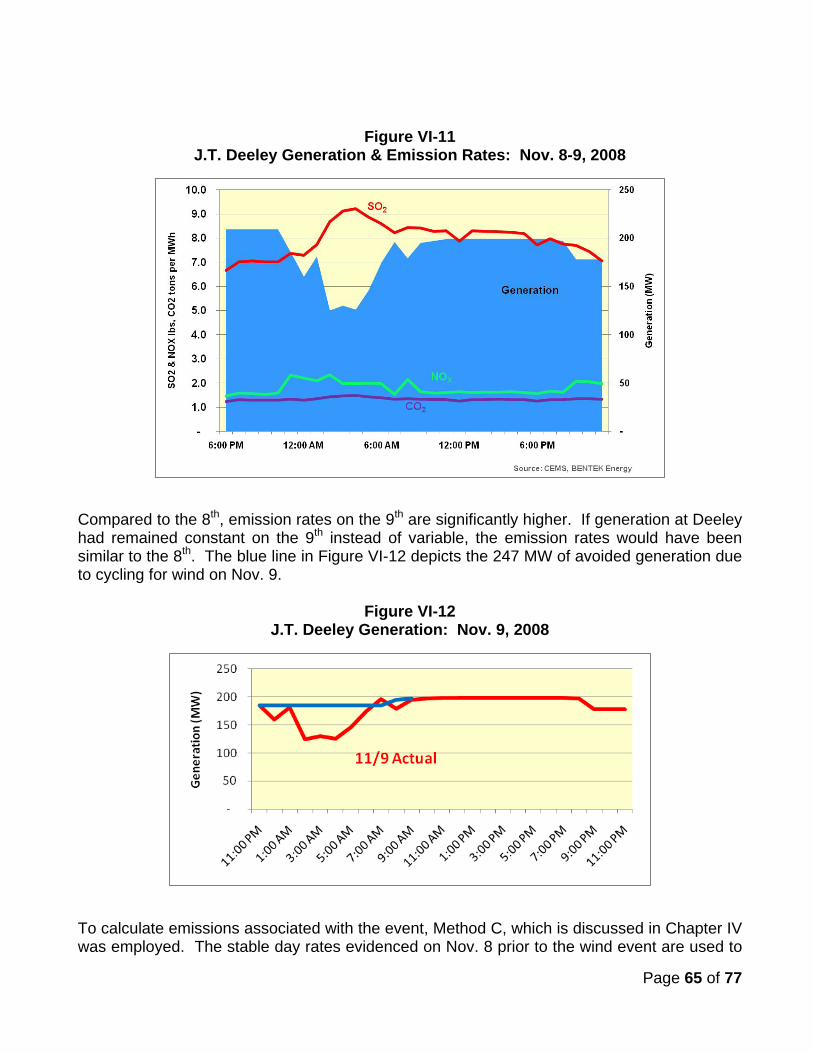
Page 65 of 77
Figure VI-11 J.T. Deeley Generation & Emission Rates: Nov. 8-9, 2008
Compared to the 8th, emission rates on the 9th are significantly higher. If generation at Deeley had remained constant on the 9th instead of variable, the emission rates would have been similar to the 8th Figure VI-12. The blue line in depicts the 247 MW of avoided generation due to cycling for wind on Nov. 9.
Figure VI-12 J.T. Deeley Generation: Nov. 9, 2008
To calculate emissions associated with the event, Method C, which is discussed in Chapter IV was employed. The stable day rates evidenced on Nov. 8 prior to the wind event are used to

Page 66 of 77
calculate avoided emissions and then compared to the actual emissions from Nov. 9. The event resulted in 2,506 pounds of incremental SO2, 717 pounds of incremental NOX and saved 120 tons of CO2
.
Cycling J.T. Deeley to compensate for wind generation caused more SO2 and NOX emissions than if J.T. Deeley had generated the same amount at a flat level. Due to cycling, J.T. Deeley emitted 8% more SO2 and 10% NOX, while saving 2% of CO2
emissions.
This case study of the Deeley plant indicates that much like the PSCO examples, coal plants in Texas operate at the highest efficiency during steady-state operation at the levels for which they are designed. Operating these facilities irregularly or at non-design levels leads to inefficient operation and higher emission levels.
ERCOT General Analysis The same methodology from the PSCO analysis is employed to understand the emission impact that wind generation had on the ERCOT system for an entire year. Stable days of generation are identified for each facility on monthly and quarterly bases. Wind events are defined as instances where coal generation dropped by at least 10% hour-to-hour with a corresponding increase in wind generation. As was the case with the Colorado analysis, two techniques are used to estimate the emission impacts. The first is the Specific-Event Approach, the second, the Full-Year Approach. Both are described more fully in Chapter IV.
Specific-Event Approach This approach identified all days where coal generation decreased or increased more than 10% hour-to-hour when total wind generation moved in an opposite direction over the same timeframe. The offset generation from coal plants during these instances is added into the stable day calculation. Stable days are identified on monthly and quarterly bases for a broad understanding of how emission rates can change. The key to this approach is that only emissions associated with the Specific-Events is included in the analysis. Figure VI-13 summarizes the results for the Specific-Event Approach. Wind-induced cycling resulted in incremental production of SO2 and NOX, but resulted in less CO2 being produced. Depending on whether quarterly or monthly averages are used for the stable day cycling, SO2 emissions ranged between 13.7 and 14.0 million pounds (2%-3% of total SO2), which is more than would have happened without the wind. Incremental NOX emissions were between 0.2 and 2.2 million pounds (1% of total NOX). CO2 emissions were between 600 and 1,000 tons lower (less than 1% of total CO2
).
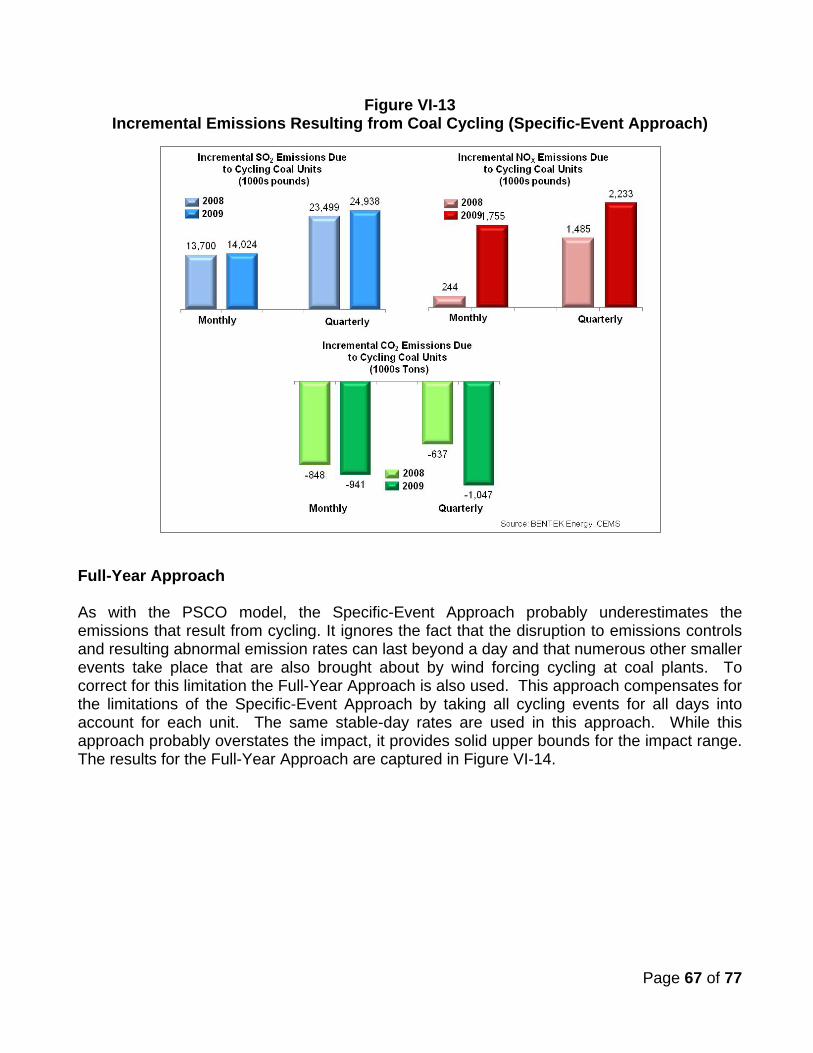
Page 67 of 77
Figure VI-13 Incremental Emissions Resulting from Coal Cycling (Specific-Event Approach)
Full-Year Approach As with the PSCO model, the Specific-Event Approach probably underestimates the emissions that result from cycling. It ignores the fact that the disruption to emissions controls and resulting abnormal emission rates can last beyond a day and that numerous other smaller events take place that are also brought about by wind forcing cycling at coal plants. To correct for this limitation the Full-Year Approach is also used. This approach compensates for the limitations of the Specific-Event Approach by taking all cycling events for all days into account for each unit. The same stable-day rates are used in this approach. While this approach probably overstates the impact, it provides solid upper bounds for the impact range. The results for the Full-Year Approach are captured in Figure VI-14.
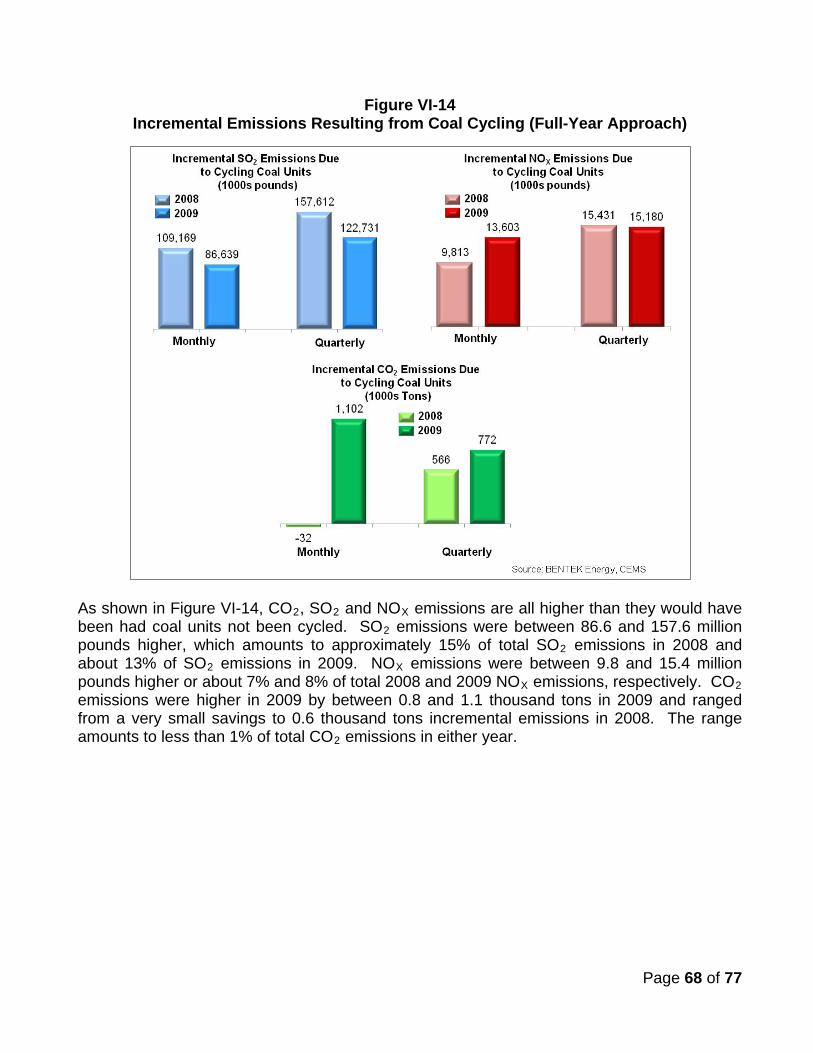
Page 68 of 77
Figure VI-14 Incremental Emissions Resulting from Coal Cycling (Full-Year Approach)
As shown in Figure VI-14, CO2, SO2 and NOX emissions are all higher than they would have been had coal units not been cycled. SO2 emissions were between 86.6 and 157.6 million pounds higher, which amounts to approximately 15% of total SO2 emissions in 2008 and about 13% of SO2 emissions in 2009. NOX emissions were between 9.8 and 15.4 million pounds higher or about 7% and 8% of total 2008 and 2009 NOX emissions, respectively. CO2 emissions were higher in 2009 by between 0.8 and 1.1 thousand tons in 2009 and ranged from a very small savings to 0.6 thousand tons incremental emissions in 2008. The range amounts to less than 1% of total CO2
emissions in either year.
Page 69 of 77
Conclusions The ERCOT system was studied due to the availability of wind data to correlate with coal cycling events and because of the larger gas-fired generation capacity resident on the system. Identifying days where wind generation resulted in the cycling of coal units allowed for a precise understanding of the emission impacts. The gravity and frequency of these events increased as more wind generation was introduced to the system. This mirrors the results found on the PSCO system, supporting the theory that the increased rate of cycling is due to the incremental integration of wind generation. Furthermore, these wind-driven, coal-cycling events resulted in significantly more SO2 and NOX emissions than if wind generation had not been utilized. The same results were found on the PSCO system. Not only does wind generation not allow ERCOT utilities to save SO2, NOX and CO2 emissions, it is directly responsible for creating more SO2 and NOX emissions and CO2
emission savings are minimal at best.
Page 70 of 77
VII. Toward a Solution: Substituting Gas-fired Generation for Coal
One major conclusion from the preceding chapters is that cycling coal-fired facilities – whether caused by accommodating wind or other factors – makes the units less efficient and increases emissions, particularly SO2 and NOX. Given the documented increase in coal cycling events over the past few years on the PSCO system, this dynamic is problematic because several of the plants that are cycled most – Cherokee, Arapahoe, Pawnee and Valmont are located within or in close proximity to the Denver Non-attainment Zone for Ozone. The Denver Non-attainment Zone for Ozone is the area around Denver in which the US Environmental Protection Administration (EPA) monitors ozone levels as part of their obligations under the Federal Clean Air Act (42 U.S.C Sec. 7401). As detailed in Chapters IV and V, all of these plants have experienced an increase in SO2, while the Cherokee, Arapahoe and Valmont plants experienced increased NOX and CO2
emission rates between 2006 and 2009. Since the EPA has announced that it will tighten allowable ozone emission levels beginning in February 2011, continued cycling of these plants will make it more difficult to meet the new emission restrictions.
This chapter explores one approach to reducing the NOX and SO2
emissions within the Denver Non-attainment Zone, namely retire or cease to use the Cherokee and Valmont plants and replace the lost generation with natural gas-fired generation. These two plants are among the oldest of the Front Range coal units. Arapahoe is also relatively old, but it is already scheduled for retirement in 2012 according to the 2007 PSCO IRP. The Pawnee facility is also located in proximity to the Denver Non-attainment Zone, but because it is relatively new (1981) and equipped with more flexible generation capabilities, it is not as dramatically impacted by cycling as the other units and replacement would be more costly for the consumer.
Methodology The capacity lost by retiring the Cherokee (710 MW) and the Valmont (166 MW) plants can theoretically be offset by increased utilization of existing gas-fired resources, whether PSCO or third-party owned. Alternatively, if those resources are insufficient, PSCO might replace the plants with gas-fired capacity, increased third-party purchases or a combination of the two options. Accordingly, a model was developed that calculated the total hourly generation from the Cherokee and Valmont plants over the three year period from 2007 through 2009. Next, the hourly coal generation from the retired plants is compared to the hourly available generation capacity from the combined cycle plants that are part of the 2007 IRP resource plan. If the combined cycle generation is insufficient, the available combustion turbine capacity is utilized. When the available combined cycle and combustion turbine capacity are inadequate to meet the demand, then a shortfall is identified. Both combined cycle and combustion turbines were assumed to run up to 90% of their nameplate capacity, thus, accounting for NERC reliability standards. The objective of the analysis is to determine whether or not the existing gas-fired facilities of PSCO are adequate to provide the power
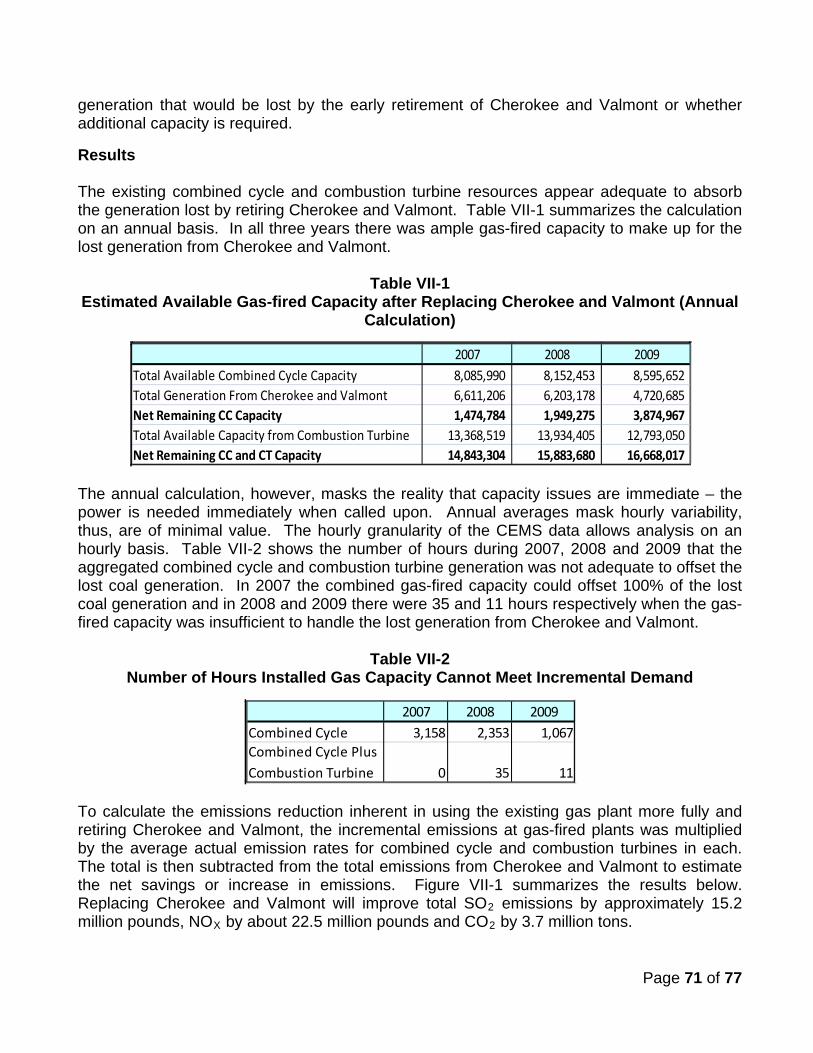
Page 71 of 77
generation that would be lost by the early retirement of Cherokee and Valmont or whether additional capacity is required.
Results The existing combined cycle and combustion turbine resources appear adequate to absorb the generation lost by retiring Cherokee and Valmont. Table VII-1 summarizes the calculation on an annual basis. In all three years there was ample gas-fired capacity to make up for the lost generation from Cherokee and Valmont.
Table VII-1 Estimated Available Gas-fired Capacity after Replacing Cherokee and Valmont (Annual
Calculation)
The annual calculation, however, masks the reality that capacity issues are immediate – the power is needed immediately when called upon. Annual averages mask hourly variability, thus, are of minimal value. The hourly granularity of the CEMS data allows analysis on an hourly basis. Table VII-2 shows the number of hours during 2007, 2008 and 2009 that the aggregated combined cycle and combustion turbine generation was not adequate to offset the lost coal generation. In 2007 the combined gas-fired capacity could offset 100% of the lost coal generation and in 2008 and 2009 there were 35 and 11 hours respectively when the gas-fired capacity was insufficient to handle the lost generation from Cherokee and Valmont.
Table VII-2 Number of Hours Installed Gas Capacity Cannot Meet Incremental Demand
To calculate the emissions reduction inherent in using the existing gas plant more fully and retiring Cherokee and Valmont, the incremental emissions at gas-fired plants was multiplied by the average actual emission rates for combined cycle and combustion turbines in each. The total is then subtracted from the total emissions from Cherokee and Valmont to estimate the net savings or increase in emissions. Figure VII-1 summarizes the results below. Replacing Cherokee and Valmont will improve total SO2 emissions by approximately 15.2 million pounds, NOX by about 22.5 million pounds and CO2
by 3.7 million tons.
2007 2008 2009Total Available Combined Cycle Capacity 8,085,990 8,152,453 8,595,652 Total Generation From Cherokee and Valmont 6,611,206 6,203,178 4,720,685 Net Remaining CC Capacity 1,474,784 1,949,275 3,874,967 Total Available Capacity from Combustion Turbine 13,368,519 13,934,405 12,793,050 Net Remaining CC and CT Capacity 14,843,304 15,883,680 16,668,017
2007 2008 2009Combined Cycle 3,158 2,353 1,067Combined Cycle Plus Combustion Turbine 0 35 11
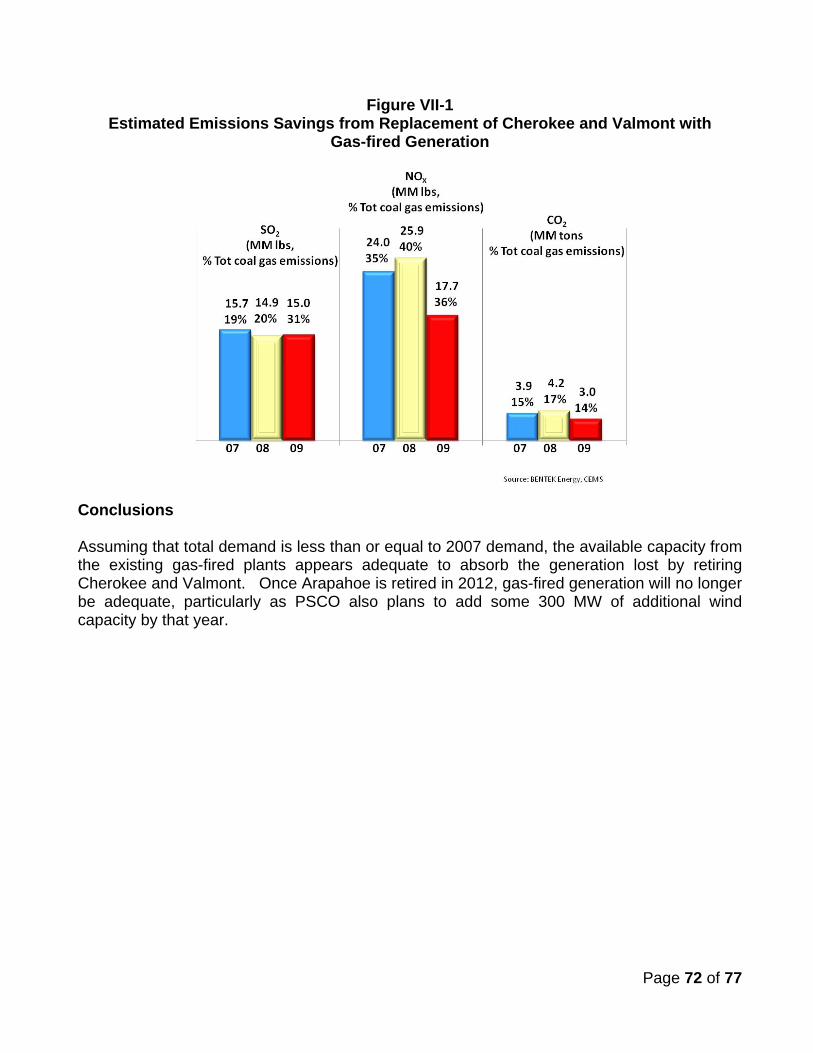
Page 72 of 77
Figure VII-1 Estimated Emissions Savings from Replacement of Cherokee and Valmont with
Gas-fired Generation
Conclusions Assuming that total demand is less than or equal to 2007 demand, the available capacity from the existing gas-fired plants appears adequate to absorb the generation lost by retiring Cherokee and Valmont. Once Arapahoe is retired in 2012, gas-fired generation will no longer be adequate, particularly as PSCO also plans to add some 300 MW of additional wind capacity by that year.
Page 73 of 77
VIII. Conclusions and Mitigation Suggestions
The overarching conclusion of this analysis is that, like many other public policies, there are unintended consequences to implementation of Colorado’s RPS. Wind and renewable energy programs have been implemented in Colorado and around the country for the best of intentions: reducing air pollution (primarily CO2 and other greenhouse gases). The research in this report, however, suggests that wind energy, as it has so far been developed by PSCO in Colorado and by numerous utilities in ERCOT, has had minimal, if any, impact on CO2, yet has lead to a significant increase in SO2 and NOX
. This chapter presents the study conclusions and makes a number of recommendations to improve the effectiveness of wind resources.
Conclusions The study details the surprising conclusion that the use of wind energy in the PSCO and ERCOT context results in increased SO2 and NOX and, in the case of PSCO, CO2. The mechanism driving increased emissions is the need to cycle coal facilities in order to accommodate wind, which is considered a “must-take” resource due to the respective states’ RPS mandates. When wind generation comes online, generation from coal (and natural gas-fired) plants is curtailed until the wind subsides, then their generation is once again ramped up to meet demand. Cycling coal units in this manner drives their heat rate up and their operating efficiency down, resulting in higher emissions of SO2, NOX and CO2
than would have been the case if the units had not been cycled.
For the PSCO territory, two methods are used to calculate the incremental emissions that result from coal cycling. The first method includes only specific instances where coal generation fell by 10% hour-to-hour between 12:00 am and 8:00 am. Results generated from this method represent the lower end of the estimate of incremental emissions due to wind because this methodology masks small, but sharp, generation changes that happen within an hour. The data suggests that these minimal events also result in significantly abnormal emission rates. The second method assumes that all variation in emission rates above stable day norms result from coal cycling events, and ignores maintenance. Maintenance events typically are controlled events where emission rates do not increase. Therefore, maintenane events are assumed not to contibute to significantly to the emission increases captured in this method. Nevertheless, the second method captures emission increases due to a much broader array of causes, only one of which is wind. Accordingly, this method over-estimates the potential impact of wind because many of the events are not wind induced. In the ERCOT territory, wind events are defined precisely: a 10% or more decrease in coal generation simultaneous to a similarly sized increase in wind generation. For all scenarios, actual emissions associated with the events are compared to estimated emissions defined as avoided generation from coal multiplied by an estimated “stable day” emission rate based on stable coal-fired generation periods observed over the month and quarter.
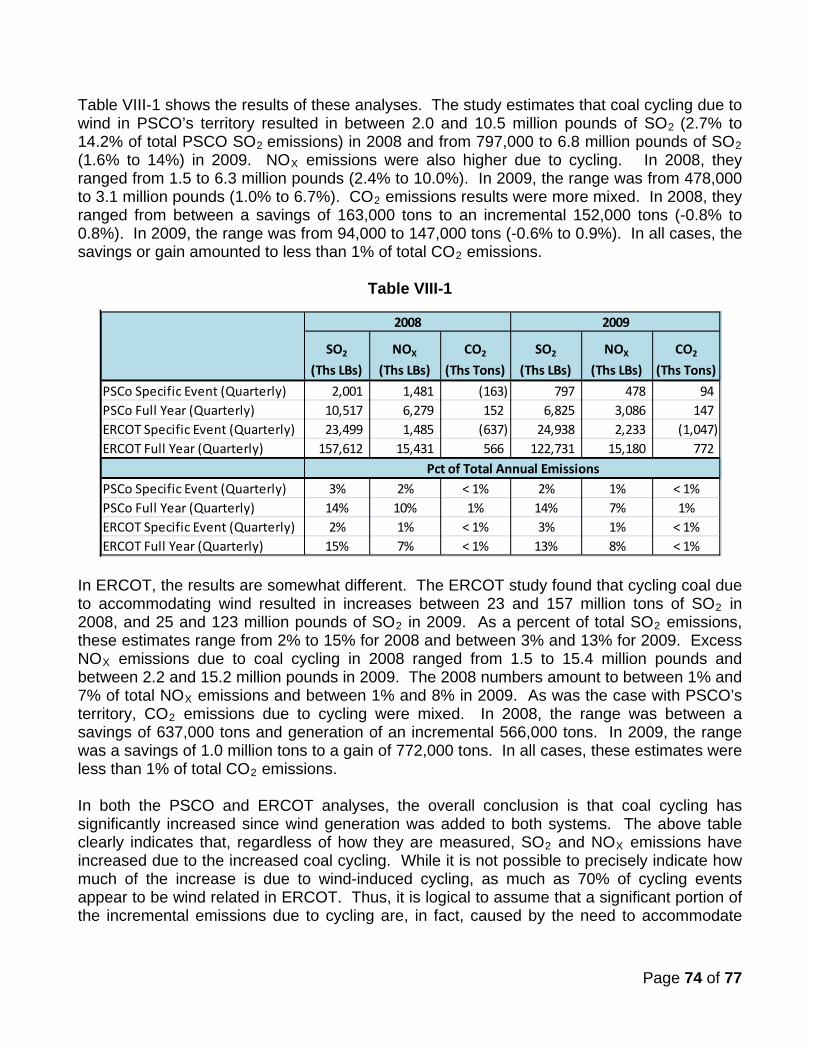
Page 74 of 77
Table VIII-1 shows the results of these analyses. The study estimates that coal cycling due to wind in PSCO’s territory resulted in between 2.0 and 10.5 million pounds of SO2 (2.7% to 14.2% of total PSCO SO2 emissions) in 2008 and from 797,000 to 6.8 million pounds of SO2 (1.6% to 14%) in 2009. NOX emissions were also higher due to cycling. In 2008, they ranged from 1.5 to 6.3 million pounds (2.4% to 10.0%). In 2009, the range was from 478,000 to 3.1 million pounds (1.0% to 6.7%). CO2 emissions results were more mixed. In 2008, they ranged from between a savings of 163,000 tons to an incremental 152,000 tons (-0.8% to 0.8%). In 2009, the range was from 94,000 to 147,000 tons (-0.6% to 0.9%). In all cases, the savings or gain amounted to less than 1% of total CO2
emissions.
Table VIII-1
In ERCOT, the results are somewhat different. The ERCOT study found that cycling coal due to accommodating wind resulted in increases between 23 and 157 million tons of SO2 in 2008, and 25 and 123 million pounds of SO2 in 2009. As a percent of total SO2 emissions, these estimates range from 2% to 15% for 2008 and between 3% and 13% for 2009. Excess NOX emissions due to coal cycling in 2008 ranged from 1.5 to 15.4 million pounds and between 2.2 and 15.2 million pounds in 2009. The 2008 numbers amount to between 1% and 7% of total NOX emissions and between 1% and 8% in 2009. As was the case with PSCO’s territory, CO2 emissions due to cycling were mixed. In 2008, the range was between a savings of 637,000 tons and generation of an incremental 566,000 tons. In 2009, the range was a savings of 1.0 million tons to a gain of 772,000 tons. In all cases, these estimates were less than 1% of total CO2
emissions.
In both the PSCO and ERCOT analyses, the overall conclusion is that coal cycling has significantly increased since wind generation was added to both systems. The above table clearly indicates that, regardless of how they are measured, SO2 and NOX
SO2
(Ths LBs)
NOX
(Ths LBs)
CO2
(Ths Tons)
SO2
(Ths LBs)
NOX
(Ths LBs)
CO2
(Ths Tons)
PSCo Specific Event (Quarterly) 2,001 1,481 (163) 797 478 94 PSCo Full Year (Quarterly) 10,517 6,279 152 6,825 3,086 147 ERCOT Specific Event (Quarterly) 23,499 1,485 (637) 24,938 2,233 (1,047) ERCOT Full Year (Quarterly) 157,612 15,431 566 122,731 15,180 772
PSCo Specific Event (Quarterly) 3% 2% < 1% 2% 1% < 1%PSCo Full Year (Quarterly) 14% 10% 1% 14% 7% 1%ERCOT Specific Event (Quarterly) 2% 1% < 1% 3% 1% < 1%ERCOT Full Year (Quarterly) 15% 7% < 1% 13% 8% < 1%
2008 2009
Pct of Total Annual Emissions
emissions have increased due to the increased coal cycling. While it is not possible to precisely indicate how much of the increase is due to wind-induced cycling, as much as 70% of cycling events appear to be wind related in ERCOT. Thus, it is logical to assume that a significant portion of the incremental emissions due to cycling are, in fact, caused by the need to accommodate
Page 75 of 77
wind. While meeting RPS-mandated wind generation requirements appears to have a minimal impact on CO2, it appears to appreciably increase SO2 and NOX
.
There are two caveats that must be understood when interpreting the results of this study. First, the study found no instances where PSCO violated any of its air permits as a result of cycling coal. Neither PSCO case study revealed instances where PSCO’s emissions exceeded its permits. Furthermore, the study authors are not suggesting that PSCO violated permits in extrapolating the case study results to estimate annual emissions. The second caveat pertains to the data. For the ERCOT analysis, hourly generation data is available by plant and fuel type including wind. Thus, it is possible to precisely identify wind events based on a sudden decline in coal generation coupled with a simultaneous increase in wind generation. In the case of PSCO’s territory, it is not possible to define wind events with the same precision since PSCO does not release its hourly generation data for its wind resources. There are several other subsidiary conclusions from the analysis:
1. Duration. Cycling coal-fired power plants has short term and long term impacts. Studies that describe interaction between coal and wind often mention the cycling issue, but they generally discuss the impacts in a very narrow context: the period of time in which the coal plant reduces generation. This study concludes that the impacts frequently have much longer duration. Many instances were found where cycling causes bag-houses or other pollution controls to lose their calibration and take as long as 12 to 15 hours, sometimes as long as 24 hours, to settle back to the pre-event emission rates. During these periods, emission rates normally exceed what would be experienced if the plant were run at a “stable” generation level.
2. Timing. Wind-induced coal-plant cycling appears to be a nighttime phenomenon. Nearly 70% of the cycling instances identified for PSCO in 2008 occurred between 12:00 am and 8:00 am. Similarly, 82% of coal cycling events in ERCOT occurred during the same time of day.
3. Non-wind renewable implications. Coal-cycling issues do not appear to impact solar and other non-wind renewable energy forms. Solar energy is generated during daylight hours, thus, coincides with natural gas-fired generation. When solar energy peaks, there is a much greater likelihood that natural gas-fired generation can be cycled to accommodate the energy.
4. Generation mix. Composition of the generation stack is a critical factor. Since most
wind driven cycling events appear to occur between 12:00 am and 8:00 am, they also occur during periods of lowest load. As a result, PSCO and the utilities in ERCOT are only operating their “base load” facilities. In the PSCO context, this means the coal plants supplemented with some combined-cycle natural gas and hydro are in operation. In the ERCOT context, base load includes nuclear, coal and combined-cycle plants. The extra emissions result because the RPS-mandated “must-take” wind resource exceeds the quantity of power being generated from combined-cycle gas.
Page 76 of 77
PSCO’s generation mix between 12:00 am and 8:00 am averages 62% Coal, 20% Combined Cycle, and 18% Hydro, Wind and Purchases. In ERCOT, the corresponding mix is 17% Nuclear, 40% Coal, 28% Combined Cycle, 6% Combustion Turbine, 9% Wind and 0% Hydro. Increasing the proportion of base load that is generated by more flexible generation equipment – such as natural-gas-fired combined-cycle plants – will enable systems to absorb wind without having to cycle their coal plants.
5. Regulatory conflict. The study results suggest that the RPS mandate is in conflict with the Colorado State Implementation Plan for air emissions. The RPS standard requires that more wind resources be utilized than can be offset with lower-emission, natural-gas generation equipment. That is the case today when wind resources account for about 9% of PSCO’s total sales. Wind generation will increase in the coming years due to mandates to move toward the new 30% of total sales standard. Without substantially more natural gas generation being added to the PSCO system, the emission increases documented in this study will rise, further enlarging the degree to which Denver and the Front Range violates its SIP limitations.
6. National implications. Congress considering legislation that would mandate a federal
RPS. While this study only paid cursory attention to areas other than the ERCOT and PSCO territories, it is doubtful that a national RPS can be imposed without creating the same emissions outcome found in ERCOT, the PSCO territory and in many other states. Unless other states have a sufficient natural gas cushion – remember Texas has the largest share of its generating capacity fueled by natural gas – imposition of an RPS standard greater than 5% will probably increase emissions of CO2, NOX and SO2
.
Mitigation Recommendations This study suggests several mitigation measures that should be considered:
1. Result validation. It is recommended that IPAMS request a joint research effort with PSCO to validate the results of the study. Significant additional emphasis should be placed on analysis of hourly wind data similar to that provided in ERCOT to enable more precise identification of “wind events.” In addition, PSCO’s insight should enhance understanding of why significant impacts occur hours after what appears to be a wind event.
2. Data publication. It is in the state’s best interest to understand the air emission implications of PSCO’s generation behavior, particularly if state mandates are counter-productive to emission reduction goals. Without timely publication of the hourly generation from wind, it is not possible for third parties or the state to understand the regulatory interactions without making significant assumptions. The PUC should consider requiring the publication of hourly generation data by fuel source including wind as part of PSCO’s ongoing reporting mandates. The posting does not need to be immediate; a time lag of 90 days would be reasonable and enable PSCO to maintain limited confidentiality to enhance its trading positions. True transparency around these issues is not possible without publication of this data.
Page 77 of 77
3. Short term. In the short term (one to two years) there appear to be two options:
a. Immediately reduce generation at Cherokee and Valmont to levels that eliminate
the need to cycle by replacing the generation with power produced by the numerous under-utilized gas-fired combine cycle and combustion turbines that are part of the current IRP resource mix.
b. Limit the utilization of wind generation to levels that may be offset by cycling non-coal facilities. This means that until new generation equipment can be brought online, PSCO may not be able to meet the RPS mandate to provide 12% of “sales
” by 2014, but it could meet a mandate to have 12% of capacity in the form of renewable energy technologies by 2014. After 2014 provisions of the current RPS mandate can be met, provided that adequate gas-fired generation is added.
4. Long term. Beyond 2012, PSCO should consider adding significantly to its combined-cycle natural gas plant capacity and utilization. Combined-cycle plants are designed to operate as base load generation and emit significantly lower NOX and CO2
than combustion turbines. Adding more combined-cycle plants to the generation stack will provide a cushion that will obviate PSCO’s need to cycle its coal facilities in all but the most extreme situations.
5. Improved modeling. PSCO, like most utilities, dispatches its plants based on forecast generation needs, anticipated emissions, and fuel and emission costs. The models used to accomplish this are driven by assumptions about emissions outputs that do not appear to take account of the actual variability evidenced by coal cycling. PSCO and the PUC should consider improving these models so that they incorporate the variability that is evident in the historic data. This would provide more accurate accounting of emissions and the associated costs of cycling coal-fired power plants. In addition, future wind integration studies should more dynamically account for the emission impacts of coal cycling. Modeling efforts should be calibrated to actual historical data, not hypothetical averages and recognize that emissions rates are adversely impacted over longer periods than the specific cycling timeframe. The impacts of cycling coal plants are not limited to boiler efficiency; the interactions of emission control technologies should also be considered.
6. Reconcile RPS and SIP mandates. This study documents the degree to which RPS
and SIP mandates are counter-productive. The RPS promotes reduced CO2, but if implemented inappropriately can result in greater SO2, NOX, and CO2 emissions. It is this potential to increase SO2 and NOX which conflict with the mandates of the SIP. RPS mandates need to be structured so that they do not create this conflict.
Related Documents


![paigetaylorleary.files.wordpress.com · Web viewAs a result, Toyota’s relationships with suppliers became less collaborative […] (Cole, 2011). A suggested action objective based](https://static.cupdf.com/doc/110x72/60a220cc4817c9069c0820c0/web-view-as-a-result-toyotaas-relationships-with-suppliers-became-less-collaborative.jpg)