Energy Efficiency in Ireland 2016 Report

Welcome message from author
This document is posted to help you gain knowledge. Please leave a comment to let me know what you think about it! Share it to your friends and learn new things together.
Transcript
Energy E�ciency in Ireland2016 Report
1
Energy Efficiency in Ireland2016 Report
Report prepared byDr Denis Dineen, and Martin Howley Energy Policy Statistical Support Unit
March 2016
2 ENERGY POLICY STATISTICAL SUPPORT UNIT
Sustainable Energy Authority of Ireland
The Sustainable Energy Authority of Ireland has a mission to play a leading role in transforming Ireland into a society based on sustainable energy structures, technologies and practices. To fulfil this mission SEAI aims to provide well-timed and informed advice to Government, and deliver a range of programmes efficiently and effectively, while engaging and motivating a wide range of stakeholders and showing continuing flexibility and innovation in all activities. SEAI’s actions will help advance Ireland to the vanguard of the global green technology movement, so that Ireland is recognised as a pioneer in the move to decarbonised energy systems.
Energy Policy Statistical Support Unit (EPSSU)
SEAI has a lead role in developing and maintaining comprehensive national and sectoral statistics for energy production, transformation and end use. This data is a vital input in meeting international reporting obligations, for advising policy makers and informing investment decisions. Based in Cork, EPSSU is SEAI’s specialist statistics team. Its core functions are to:
• Collect, process and publish energy statistics to support policy analysis and development in line with national needs and international obligations;
• Conduct statistical and economic analyses of energy services sectors and sustainable energy options;
• Contribute to the development and promulgation of appropriate sustainability indicators.
Acknowledgements
SEAI gratefully acknowledges the co-operation of the all the organisations, agencies, energy suppliers and distributors that provided data and responded to questionnaires throughout the year.
© Sustainable Energy Authority of Ireland
RepRoduction of the contents is peRmissible pRovided the souRce is acknowledged.
3ENERGY IN EFFICIENCY IRELAND – 2016 REPORT
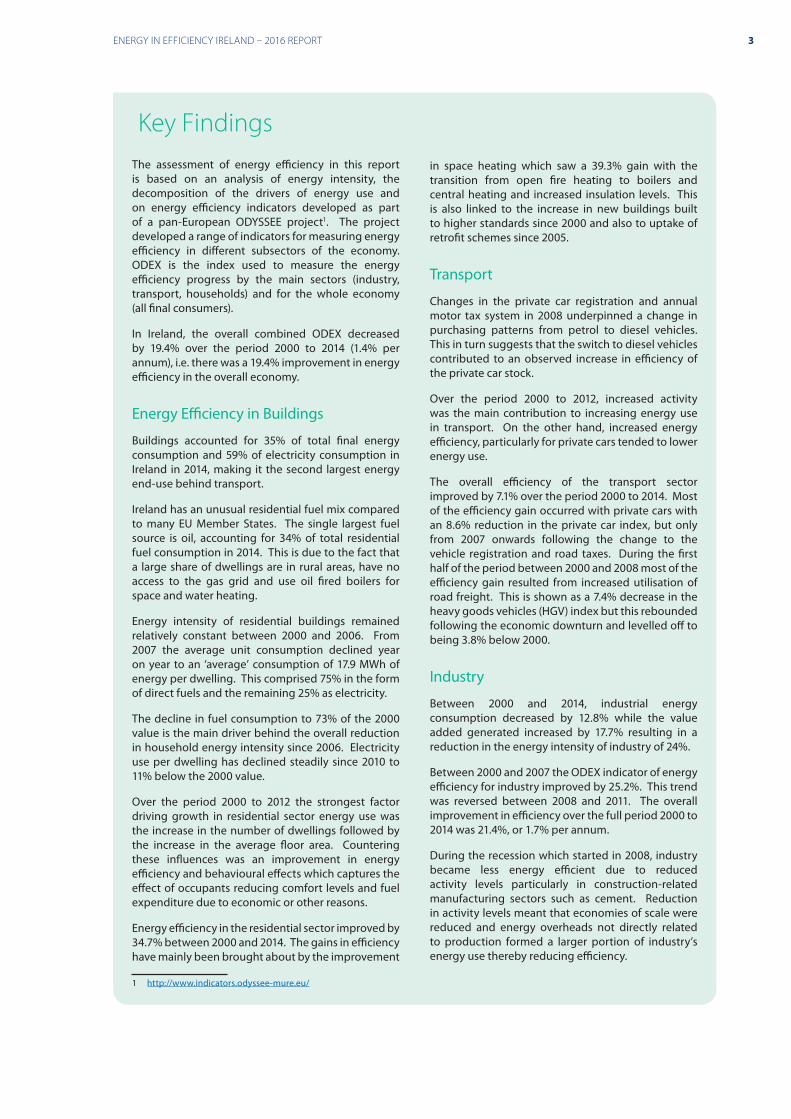
Key FindingsThe assessment of energy efficiency in this report is based on an analysis of energy intensity, the decomposition of the drivers of energy use and on energy efficiency indicators developed as part of a pan-European ODYSSEE project1. The project developed a range of indicators for measuring energy efficiency in different subsectors of the economy. ODEX is the index used to measure the energy efficiency progress by the main sectors (industry, transport, households) and for the whole economy (all final consumers).
In Ireland, the overall combined ODEX decreased by 19.4% over the period 2000 to 2014 (1.4% per annum), i.e. there was a 19.4% improvement in energy efficiency in the overall economy.
Energy Efficiency in Buildings
Buildings accounted for 35% of total final energy consumption and 59% of electricity consumption in Ireland in 2014, making it the second largest energy end-use behind transport.
Ireland has an unusual residential fuel mix compared to many EU Member States. The single largest fuel source is oil, accounting for 34% of total residential fuel consumption in 2014. This is due to the fact that a large share of dwellings are in rural areas, have no access to the gas grid and use oil fired boilers for space and water heating.
Energy intensity of residential buildings remained relatively constant between 2000 and 2006. From 2007 the average unit consumption declined year on year to an ‘average’ consumption of 17.9 MWh of energy per dwelling. This comprised 75% in the form of direct fuels and the remaining 25% as electricity.
The decline in fuel consumption to 73% of the 2000 value is the main driver behind the overall reduction in household energy intensity since 2006. Electricity use per dwelling has declined steadily since 2010 to 11% below the 2000 value.
Over the period 2000 to 2012 the strongest factor driving growth in residential sector energy use was the increase in the number of dwellings followed by the increase in the average floor area. Countering these influences was an improvement in energy efficiency and behavioural effects which captures the effect of occupants reducing comfort levels and fuel expenditure due to economic or other reasons.
Energy efficiency in the residential sector improved by 34.7% between 2000 and 2014. The gains in efficiency have mainly been brought about by the improvement
1 http://www.indicators.odyssee-mure.eu/
in space heating which saw a 39.3% gain with the transition from open fire heating to boilers and central heating and increased insulation levels. This is also linked to the increase in new buildings built to higher standards since 2000 and also to uptake of retrofit schemes since 2005.
Transport
Changes in the private car registration and annual motor tax system in 2008 underpinned a change in purchasing patterns from petrol to diesel vehicles. This in turn suggests that the switch to diesel vehicles contributed to an observed increase in efficiency of the private car stock.
Over the period 2000 to 2012, increased activity was the main contribution to increasing energy use in transport. On the other hand, increased energy efficiency, particularly for private cars tended to lower energy use.
The overall efficiency of the transport sector improved by 7.1% over the period 2000 to 2014. Most of the efficiency gain occurred with private cars with an 8.6% reduction in the private car index, but only from 2007 onwards following the change to the vehicle registration and road taxes. During the first half of the period between 2000 and 2008 most of the efficiency gain resulted from increased utilisation of road freight. This is shown as a 7.4% decrease in the heavy goods vehicles (HGV) index but this rebounded following the economic downturn and levelled off to being 3.8% below 2000.
Industry
Between 2000 and 2014, industrial energy consumption decreased by 12.8% while the value added generated increased by 17.7% resulting in a reduction in the energy intensity of industry of 24%.
Between 2000 and 2007 the ODEX indicator of energy efficiency for industry improved by 25.2%. This trend was reversed between 2008 and 2011. The overall improvement in efficiency over the full period 2000 to 2014 was 21.4%, or 1.7% per annum.
During the recession which started in 2008, industry became less energy efficient due to reduced activity levels particularly in construction-related manufacturing sectors such as cement. Reduction in activity levels meant that economies of scale were reduced and energy overheads not directly related to production formed a larger portion of industry’s energy use thereby reducing efficiency.
4 ENERGY POLICY STATISTICAL SUPPORT UNIT
Table of ContentsKey Findings 31 Introduction 62 Economic and Energy Efficiency Context 8
2.1 Economic Context 8
2.2 Total Final Energy Consumption and Efficiency 9
2.3 Energy Efficiency Policy Background 11
2.4 Energy Efficiency Targets 12
2.4.1 Overall NEEAP Targets and Targets by Sectior 12
2.4.2 Cross-Sectoral Energy Efficiency Measures 12
3 Energy Efficiency in Buildings 143.1 Residential Energy Efficiency 14
3.1.1 Residential Final Energy Demand and Underlying Drivers 14
3.1.2 Residential Energy Intensity 17
3.1.3 Decomposition of Residential Energy Trends 17
3.1.4 Residential ODEX 18
3.2 Services Sector Energy Efficiency 19
3.2.1 Services Sector Final Energy Demand and Underlying Drivers 19
3.2.2 Services Energy Intensity 20
3.2.3 Services ODEX 21
4 Energy Efficiency in Transport 224.1 Energy Efficiency Trends 22
4.1.1 Transport Sector Final Energy Demand 22
4.1.1.1 Private Car Final Energy Demand and Underlying Drivers 23
4.1.1.2 Heavy Goods Vehicles Final Energy Demand And Underlying Drivers 25
4.1.2 Transport Energy Intensity 26
4.1.2.1 Private Cars 26
4.1.2.2 Freight 27
4.1.3 Decomposition Of Transport Energy Trends 28
4.1.4 Transport ODEX 28
5 Energy Efficiency in Industry 305.1 Energy Efficiency Trends 30
5.1.1 Industry Sector Final Energy Demand 30
5.1.2 Industry Energy Intensity 30
5.1.3 Decomposition Of Industry Energy Trends 31
5.1.4 Industry ODEX 32
Glossary of Terms 33Energy Conversion Factors 34Energy Units 34Decimal Prefixes 34Calorific Values 35Emission Factors 35References 36
5ENERGY IN EFFICIENCY IRELAND – 2016 REPORT
Table of TablesTable 1 Growth Rates of Macroeconomic Indications 8
Table 2 Growth Rate and Shares of Total Final Energy Consumption by Fuel 9
Table 3 Growth rate and Shares of Total Final Consumption by Sector 10
Table 4 Sectoral Energy Saving Targets and Estimates Contained in Ireland’s Third NEEAP 12
Table 5 Cross-Sectional Measures included in Ireland’s Third NEEAP 12
Table 6 Percentage Increase in Floor Area 16
Table 7 Transport Final Energy Demand by Mode 23
Table 8 Industry Final Energy Demand By Fuel Type 30
Table of FiguresFigure 1 Explaining Energy Efficiency 6
Figure 2 Macroeconomic indicators and Primary Energy Requirement 8
Figure 3 Total Final Energy Consumption by Fuel 9
Figure 4 Total Final Energy Consumption by Sector 10
Figure 5 ODEX Indices for Manufacturing, Transport, Residential and Overall Economy 11
Figure 6 Residential Final Energy Demand with Climate Correction 14
Figure 7 Residential Final Energy Demand in 2014 by Fuel Type 15
Figure 8 Unit Energy Consumption and Percentage Share of Central Heating for EU Member States 15
Figure 9 Increase in Average Floor Area 16
Figure 10 Number of Dwellings, Floor Area and Residential Final Energy Demand, Indexed to 2000 16
Figure 11 Final Energy Demand per Dwelling 17
Figure 12 Index of Energy per Dwelling Climate Corrected, Total, Fossil and Electric 17
Figure 13 ODYSSEE Decomposition of Ireland’s Residential Final Energy Demand 18
Figure 14 ODYSSEE Energy Efficiency Indicators for the Irish Residential Sector 19
Figure 15 Services Sector Final Energy Demand 19
Figure 16 Services Final Energy Demand, Electricity, Gross Value Added and Number of Employees - Indexed to 2000 20
Figure 17 Services Final Energy Demand per euro Gross Value Added 20
Figure 18 Services Final Energy Demand per Employee 21
Figure 19 Transport Final Energy Demand and GDP Growth Indexed to 2000 22
Figure 20 Transport Final Energy Demand by Mode 23
Figure 21 Private Car Final Energy and Underlying Drivers – Indexed to 2000 24
Figure 22 Private Car Stock Total Annual Mileage 24
Figure 23 Share Of New Vehicles Registered In Ireland Annually By Fuel Type 25
Figure 24 HGV Tonne km, GDP and Estimated Final HGV Energy Demand – Indexed to 2000 25
Figure 25 Private Cars Specific Fuel Consumption 26
Figure 26 Private Cars Specific Energy Consumption 27
Figure 27 HGV Technical Energy Intensity And Economic Energy Intensity – Indexed To 2000. 27
Figure 28 Odyssee Decomposition of Ireland’s Transport Final Energy Demand 28
Figure 29 ODYSSEE Energy Efficiency Indicators For Irish Transport Sector 29
Figure 30 Industry Final Energy Demand By Fuel Type 30
Figure 31 Industry Final Energy Demand, GVA and Energy Intensity – Indexed to 2000 31
Figure 32 ODYSSEE Decomposition of Ireland’s Industry Final Energy Demand 32
Figure 33 Industry ODEX 32
6 ENERGY POLICY STATISTICAL SUPPORT UNIT
1 I
ntro
duct
ion
1 Introduction
Energy efficiency is defined as a ratio between an output of performance, service, goods or energy and an input of energy. Essentially improvements in energy efficiency enable achievement of the same result with less energy or achieving an improved performance with the same energy.
Energy efficiency can contribute to meeting all three goals of energy policy, namely security of supply, competitiveness and protection of the environment through reduced green house gas (GHG) emissions. The economic benefits include direct savings, lower fuel costs and a reduction in the need for investment in supply. Energy efficiency can be achieved through technological, behavioural or economic changes. The International Energy Agency (IEA) cite multiple benefits1 of energy efficiency and refers to it as the “first fuel” with large untapped potential as a major energy resource in the context of national and international efforts to achieve sustainability targets.
The IEA report “Capturing the multiple benefits of energy efficiency”, seeks to “expand the perspective of energy efficiency beyond the traditional measures of reduced energy demand and lower greenhouse gas emissions by identifying and measuring its impacts across many different spheres.” In it, the IEA promotes the concept of energy efficiency as being the “first fuel”. Firstly in terms of the size of its contribution to meeting energy service demands as the IEA estimate that it contributed more than any individual fuel source amongst IEA member states in the period 1974-2010. Secondly, in that it is more cost effective, economically viable and secure than competing fuel sources.
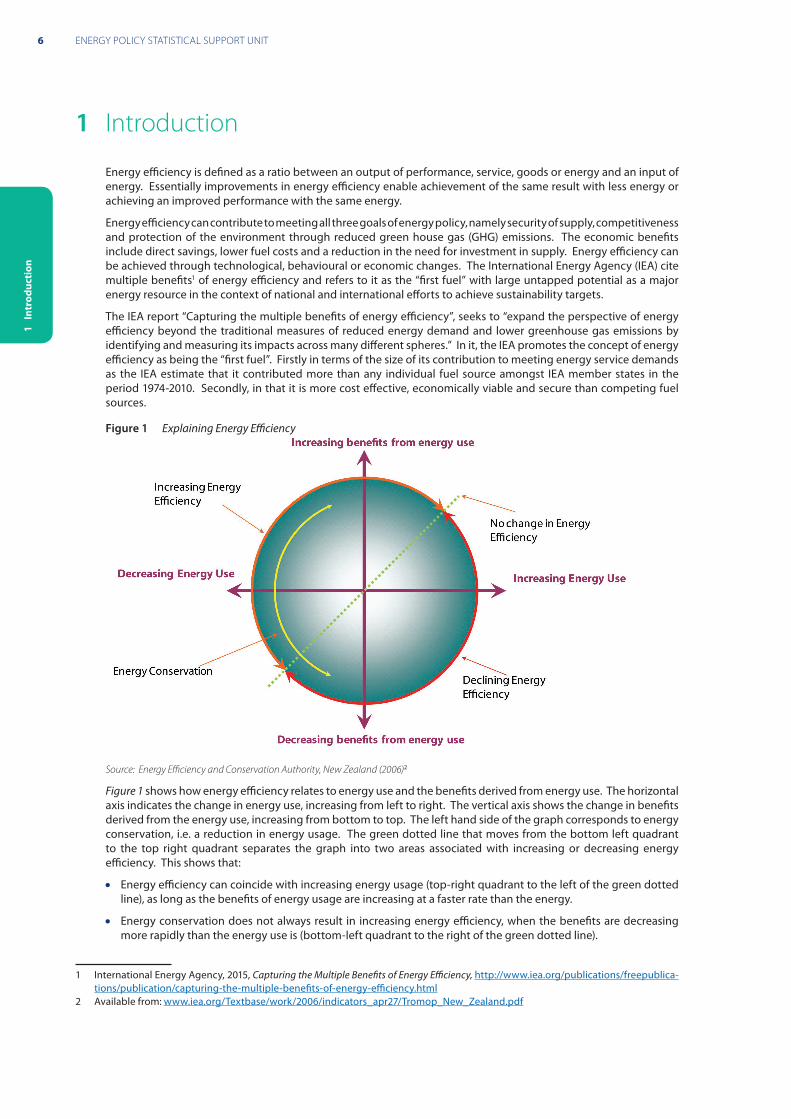
Figure 1 Explaining Energy Efficiency
Source: Energy Efficiency and Conservation Authority, New Zealand (2006)2
Figure 1 shows how energy efficiency relates to energy use and the benefits derived from energy use. The horizontal axis indicates the change in energy use, increasing from left to right. The vertical axis shows the change in benefits derived from the energy use, increasing from bottom to top. The left hand side of the graph corresponds to energy conservation, i.e. a reduction in energy usage. The green dotted line that moves from the bottom left quadrant to the top right quadrant separates the graph into two areas associated with increasing or decreasing energy efficiency. This shows that:
• Energy efficiency can coincide with increasing energy usage (top-right quadrant to the left of the green dotted line), as long as the benefits of energy usage are increasing at a faster rate than the energy.
• Energy conservation does not always result in increasing energy efficiency, when the benefits are decreasing more rapidly than the energy use is (bottom-left quadrant to the right of the green dotted line).
1 International Energy Agency, 2015, Capturing the Multiple Benefits of Energy Efficiency, http://www.iea.org/publications/freepublica-tions/publication/capturing-the-multiple-benefits-of-energy-efficiency.html
2 Available from: www.iea.org/Textbase/work/2006/indicators_apr27/Tromop_New_Zealand.pdf
7ENERGY IN EFFICIENCY IRELAND – 2016 REPORT
1 I
ntro
duct
ion
• A decline in energy use with increasing benefits (top-left quadrant) always corresponds to increasing energy efficiency.
Energy efficiency is the sum of a myriad of actions. Potential measures to improve the efficiency with which we use energy exist across all sectors of the economy. They can be considered in terms of supply side efficiencies (e.g. in the generation, transmission and distribution of energy sources) and demand side efficiencies (e.g. at the point of end-use of energy sources).
Arising from obligations in the EU Energy Efficiency Directive (2012), Ireland has a target of a 20% improvement in energy efficiency by 2020 and additionally, to demonstrate an exemplar role, has committed to a 33% energy savings target by 2020 for the public sector. Commitment to these targets is laid out in Ireland’s third National Energy Efficiency Action Plan (NEEAP) which sets out a pathway to achieve the targets.
In its report3, the IEA identified that there’s a growing body of evidence that shows that energy efficiency can deliver substantial value through a broad range of economic and social impacts beyond the traditional focus on energy demand reduction and reduced emissions. The impacts range from improved energy trade balances, increased productivity and employment to improved energy affordability, reduced air pollution and greater energy security.
The assessment of energy efficiency in this report is based on the pan-European ODYSSEE project4. The project was set up in 1993 through a joint collaboration between ADEME, the SAVE programme of the General Directorate of the European Commission in charge of energy and all energy-efficiency agencies in the EU-15 and Norway. The primary objective of the project was to develop indicators of energy efficiency. The collection and improvement of data relating to energy usage drivers, energy efficiency and CO2-related indicators were later added to the objectives. The ODYSSEE project is co-ordinated by ADEME, with the technical support of ENERDATA5 and the Fraunhofer Institute for Systems and Innovation Research 6.
A key development in the ODYSSEE project has been the formulation of a new set of energy-efficiency indicators, known as ODEX. ODEX indicators provide an alternative to the usual energy intensities used to assess energy-efficiency changes at the sectoral or economy level, as they include factors only related to energy-efficiency and exclude changes in energy use due to other effects such as climate fluctuations, changes in economic and industry structures, lifestyle changes, etc.
This is the third SEAI report that focuses exclusively on energy efficiency in Ireland. The purpose of the report is to provide timely and comprehensive data on energy efficiency and intensity, in order to provide context and background to discussions on future policy options. It may also in time provide the basis for reporting progress on energy efficiency towards meeting Irish and European targets.
The structure of this report is as follows:
• The economic and energy efficiency context is examined in section 2.
• Section 3 examines energy efficiency in buildings.
• Section 4 examines energy efficiency in transport.
• Sections 5 examines energy efficiency in industry.
The national energy balance data presented in this report are the most up-to-date at the time of writing. Balance data are updated whenever more accurate information is known. To obtain the most up-to-date balance figures, visit the statistics publications section of the SEAI website (www.seai.ie/Energy-Data-Portal/Energy%20Data%20Publications/).
An energy data service is also available at http://www.seai.ie/statistics; follow the links for the Energy Statistics Databank. This service is hosted by the Central Statistics Office with data provided by SEAI.
Feedback and comment on this report are welcome and should be addressed by post to the address on the back cover or by email to [email protected].
3 International Energy Agency, 2015, Capturing the Multiple Benefits of Energy Efficiency, http://www.iea.org/publications/freepublications/publication/capturing-the-multiple-benefits-of-energy-efficiency.html
4 www.ODYSSEE-indicators.org/5 http://www.enerdata.net/enerdatauk/ 6 www.fraunhofer.de
8 ENERGY POLICY STATISTICAL SUPPORT UNIT
1 I
ntro
duct
ion
2 Economic and Energy Efficiency Context
2.1 Economic ContextThis section gives a brief overview of economic growth and energy trends in Ireland over the period 2000 to 2014. This section draws upon the SEAI publication: Energy in Ireland 1990 – 20147.
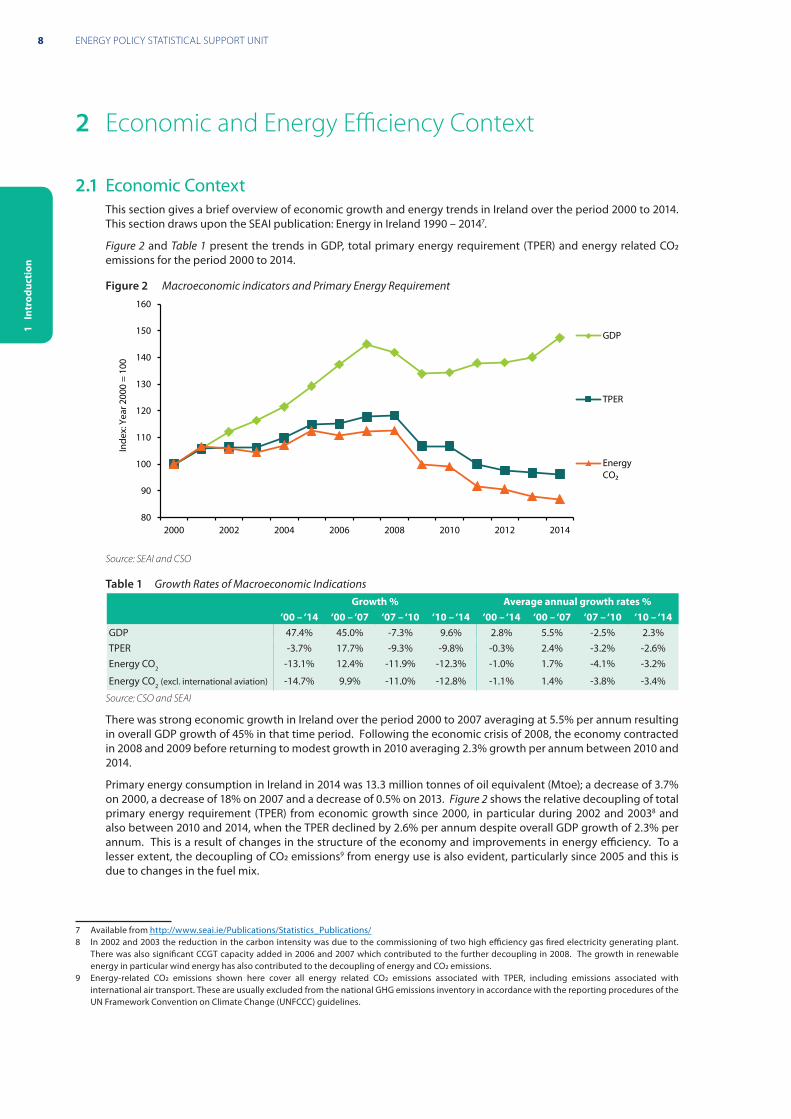
Figure 2 and Table 1 present the trends in GDP, total primary energy requirement (TPER) and energy related CO2 emissions for the period 2000 to 2014.
Figure 2 Macroeconomic indicators and Primary Energy Requirement
80
90
100
110
120
130
140
150
160
2000 2002 2004 2006 2008 2010 2012 2014
Inde
x: Y
ear 2
000
= 10
0
GDP
TPER
Energy CO₂
Source: SEAI and CSO
Table 1 Growth Rates of Macroeconomic IndicationsGrowth % Average annual growth rates %
‘00 – ‘14 ‘00 – ‘07 ‘07 – ‘10 ‘10 – ‘14 ‘00 – ‘14 ‘00 – ‘07 ‘07 – ‘10 ‘10 – ‘14GDP 47.4% 45.0% -7.3% 9.6% 2.8% 5.5% -2.5% 2.3%TPER -3.7% 17.7% -9.3% -9.8% -0.3% 2.4% -3.2% -2.6%Energy CO2 -13.1% 12.4% -11.9% -12.3% -1.0% 1.7% -4.1% -3.2%
Energy CO2 (excl. international aviation) -14.7% 9.9% -11.0% -12.8% -1.1% 1.4% -3.8% -3.4%
Source: CSO and SEAI
There was strong economic growth in Ireland over the period 2000 to 2007 averaging at 5.5% per annum resulting in overall GDP growth of 45% in that time period. Following the economic crisis of 2008, the economy contracted in 2008 and 2009 before returning to modest growth in 2010 averaging 2.3% growth per annum between 2010 and 2014.
Primary energy consumption in Ireland in 2014 was 13.3 million tonnes of oil equivalent (Mtoe); a decrease of 3.7% on 2000, a decrease of 18% on 2007 and a decrease of 0.5% on 2013. Figure 2 shows the relative decoupling of total primary energy requirement (TPER) from economic growth since 2000, in particular during 2002 and 20038 and also between 2010 and 2014, when the TPER declined by 2.6% per annum despite overall GDP growth of 2.3% per annum. This is a result of changes in the structure of the economy and improvements in energy efficiency. To a lesser extent, the decoupling of CO2 emissions9 from energy use is also evident, particularly since 2005 and this is due to changes in the fuel mix.
7 Available from http://www.seai.ie/Publications/Statistics_Publications/8 In 2002 and 2003 the reduction in the carbon intensity was due to the commissioning of two high efficiency gas fired electricity generating plant.
There was also significant CCGT capacity added in 2006 and 2007 which contributed to the further decoupling in 2008. The growth in renewable energy in particular wind energy has also contributed to the decoupling of energy and CO2 emissions.
9 Energy-related CO2 emissions shown here cover all energy related CO2 emissions associated with TPER, including emissions associated with international air transport. These are usually excluded from the national GHG emissions inventory in accordance with the reporting procedures of the UN Framework Convention on Climate Change (UNFCCC) guidelines.
9ENERGY IN EFFICIENCY IRELAND – 2016 REPORT
2 E
cono
my
& E
nerg
y Effi
cien
cy
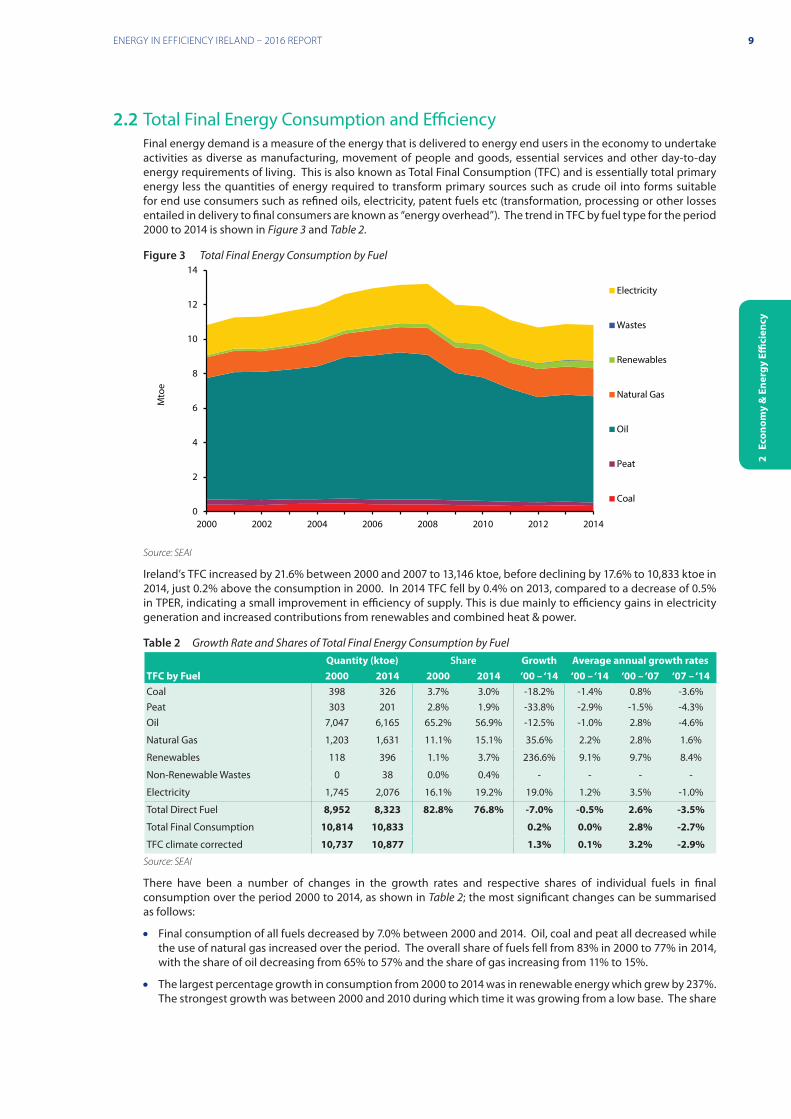
2.2 Total Final Energy Consumption and EfficiencyFinal energy demand is a measure of the energy that is delivered to energy end users in the economy to undertake activities as diverse as manufacturing, movement of people and goods, essential services and other day-to-day energy requirements of living. This is also known as Total Final Consumption (TFC) and is essentially total primary energy less the quantities of energy required to transform primary sources such as crude oil into forms suitable for end use consumers such as refined oils, electricity, patent fuels etc (transformation, processing or other losses entailed in delivery to final consumers are known as “energy overhead”). The trend in TFC by fuel type for the period 2000 to 2014 is shown in Figure 3 and Table 2.
Figure 3 Total Final Energy Consumption by Fuel
0
2
4
6
8
10
12
14
2000 2002 2004 2006 2008 2010 2012 2014
Mto
e
Electricity
Wastes
Renewables
Natural Gas
Oil
Peat
Coal
Source: SEAI
Ireland’s TFC increased by 21.6% between 2000 and 2007 to 13,146 ktoe, before declining by 17.6% to 10,833 ktoe in 2014, just 0.2% above the consumption in 2000. In 2014 TFC fell by 0.4% on 2013, compared to a decrease of 0.5% in TPER, indicating a small improvement in efficiency of supply. This is due mainly to efficiency gains in electricity generation and increased contributions from renewables and combined heat & power.
Table 2 Growth Rate and Shares of Total Final Energy Consumption by FuelQuantity (ktoe) Share Growth Average annual growth rates
TFC by Fuel 2000 2014 2000 2014 ‘00 – ‘14 ‘00 – ‘14 ‘00 – ‘07 ‘07 – ‘14Coal 398 326 3.7% 3.0% -18.2% -1.4% 0.8% -3.6%Peat 303 201 2.8% 1.9% -33.8% -2.9% -1.5% -4.3%Oil 7,047 6,165 65.2% 56.9% -12.5% -1.0% 2.8% -4.6%
Natural Gas 1,203 1,631 11.1% 15.1% 35.6% 2.2% 2.8% 1.6%
Renewables 118 396 1.1% 3.7% 236.6% 9.1% 9.7% 8.4%
Non-Renewable Wastes 0 38 0.0% 0.4% - - - -
Electricity 1,745 2,076 16.1% 19.2% 19.0% 1.2% 3.5% -1.0%
Total Direct Fuel 8,952 8,323 82.8% 76.8% -7.0% -0.5% 2.6% -3.5%
Total Final Consumption 10,814 10,833 0.2% 0.0% 2.8% -2.7%
TFC climate corrected 10,737 10,877 1.3% 0.1% 3.2% -2.9%
Source: SEAI
There have been a number of changes in the growth rates and respective shares of individual fuels in final consumption over the period 2000 to 2014, as shown in Table 2; the most significant changes can be summarised as follows:
• Final consumption of all fuels decreased by 7.0% between 2000 and 2014. Oil, coal and peat all decreased while the use of natural gas increased over the period. The overall share of fuels fell from 83% in 2000 to 77% in 2014, with the share of oil decreasing from 65% to 57% and the share of gas increasing from 11% to 15%.
• The largest percentage growth in consumption from 2000 to 2014 was in renewable energy which grew by 237%. The strongest growth was between 2000 and 2010 during which time it was growing from a low base. The share
10 ENERGY POLICY STATISTICAL SUPPORT UNIT
2 E
cono
my
& E
nerg
y Effi
cien
cy
of renewables increased from 1.1% to 3.7%.
• Final consumption of electricity grew by 19% between 2000 and 2014 and its share of TFC increased from 16% to 19%.
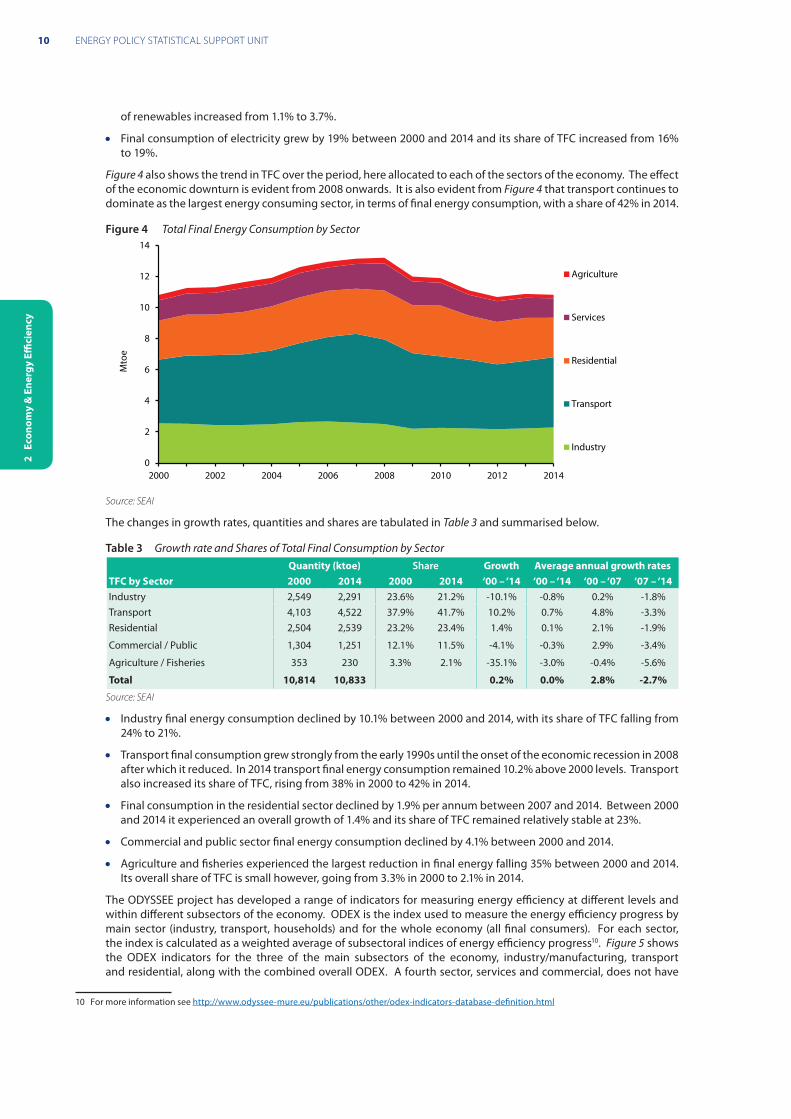
Figure 4 also shows the trend in TFC over the period, here allocated to each of the sectors of the economy. The effect of the economic downturn is evident from 2008 onwards. It is also evident from Figure 4 that transport continues to dominate as the largest energy consuming sector, in terms of final energy consumption, with a share of 42% in 2014.
Figure 4 Total Final Energy Consumption by Sector
0
2
4
6
8
10
12
14
2000 2002 2004 2006 2008 2010 2012 2014
Mto
e
Agriculture
Services
Residential
Transport
Industry
Source: SEAI
The changes in growth rates, quantities and shares are tabulated in Table 3 and summarised below.
Table 3 Growth rate and Shares of Total Final Consumption by SectorQuantity (ktoe) Share Growth Average annual growth rates
TFC by Sector 2000 2014 2000 2014 ‘00 – ‘14 ‘00 – ‘14 ‘00 – ‘07 ‘07 – ‘14Industry 2,549 2,291 23.6% 21.2% -10.1% -0.8% 0.2% -1.8%Transport 4,103 4,522 37.9% 41.7% 10.2% 0.7% 4.8% -3.3%Residential 2,504 2,539 23.2% 23.4% 1.4% 0.1% 2.1% -1.9%
Commercial / Public 1,304 1,251 12.1% 11.5% -4.1% -0.3% 2.9% -3.4%
Agriculture / Fisheries 353 230 3.3% 2.1% -35.1% -3.0% -0.4% -5.6%
Total 10,814 10,833 0.2% 0.0% 2.8% -2.7%
Source: SEAI
• Industry final energy consumption declined by 10.1% between 2000 and 2014, with its share of TFC falling from 24% to 21%.
• Transport final consumption grew strongly from the early 1990s until the onset of the economic recession in 2008 after which it reduced. In 2014 transport final energy consumption remained 10.2% above 2000 levels. Transport also increased its share of TFC, rising from 38% in 2000 to 42% in 2014.
• Final consumption in the residential sector declined by 1.9% per annum between 2007 and 2014. Between 2000 and 2014 it experienced an overall growth of 1.4% and its share of TFC remained relatively stable at 23%.
• Commercial and public sector final energy consumption declined by 4.1% between 2000 and 2014.
• Agriculture and fisheries experienced the largest reduction in final energy falling 35% between 2000 and 2014. Its overall share of TFC is small however, going from 3.3% in 2000 to 2.1% in 2014.
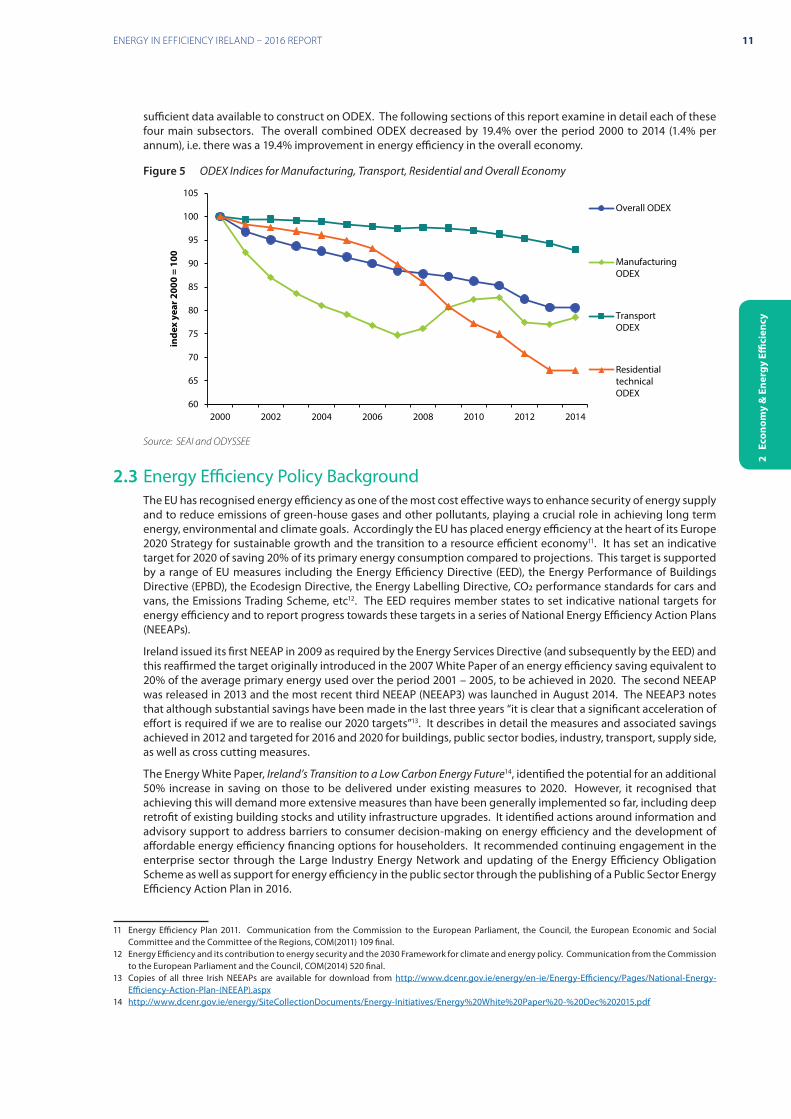
The ODYSSEE project has developed a range of indicators for measuring energy efficiency at different levels and within different subsectors of the economy. ODEX is the index used to measure the energy efficiency progress by main sector (industry, transport, households) and for the whole economy (all final consumers). For each sector, the index is calculated as a weighted average of subsectoral indices of energy efficiency progress10. Figure 5 shows the ODEX indicators for the three of the main subsectors of the economy, industry/manufacturing, transport and residential, along with the combined overall ODEX. A fourth sector, services and commercial, does not have
10 For more information see http://www.odyssee-mure.eu/publications/other/odex-indicators-database-definition.html
11ENERGY IN EFFICIENCY IRELAND – 2016 REPORT
2 E
cono
my
& E
nerg
y Effi
cien
cy
sufficient data available to construct on ODEX. The following sections of this report examine in detail each of these four main subsectors. The overall combined ODEX decreased by 19.4% over the period 2000 to 2014 (1.4% per annum), i.e. there was a 19.4% improvement in energy efficiency in the overall economy.
Figure 5 ODEX Indices for Manufacturing, Transport, Residential and Overall Economy
60
65
70
75
80
85
90
95
100
105
2000 2002 2004 2006 2008 2010 2012 2014
inde
x ye
ar 2
000
= 10
0
Overall ODEX
ManufacturingODEX
TransportODEX
ResidentialtechnicalODEX
Source: SEAI and ODYSSEE
2.3 Energy Efficiency Policy BackgroundThe EU has recognised energy efficiency as one of the most cost effective ways to enhance security of energy supply and to reduce emissions of green-house gases and other pollutants, playing a crucial role in achieving long term energy, environmental and climate goals. Accordingly the EU has placed energy efficiency at the heart of its Europe 2020 Strategy for sustainable growth and the transition to a resource efficient economy11. It has set an indicative target for 2020 of saving 20% of its primary energy consumption compared to projections. This target is supported by a range of EU measures including the Energy Efficiency Directive (EED), the Energy Performance of Buildings Directive (EPBD), the Ecodesign Directive, the Energy Labelling Directive, CO2 performance standards for cars and vans, the Emissions Trading Scheme, etc12. The EED requires member states to set indicative national targets for energy efficiency and to report progress towards these targets in a series of National Energy Efficiency Action Plans (NEEAPs).
Ireland issued its first NEEAP in 2009 as required by the Energy Services Directive (and subsequently by the EED) and this reaffirmed the target originally introduced in the 2007 White Paper of an energy efficiency saving equivalent to 20% of the average primary energy used over the period 2001 – 2005, to be achieved in 2020. The second NEEAP was released in 2013 and the most recent third NEEAP (NEEAP3) was launched in August 2014. The NEEAP3 notes that although substantial savings have been made in the last three years “it is clear that a significant acceleration of effort is required if we are to realise our 2020 targets”13. It describes in detail the measures and associated savings achieved in 2012 and targeted for 2016 and 2020 for buildings, public sector bodies, industry, transport, supply side, as well as cross cutting measures.
The Energy White Paper, Ireland’s Transition to a Low Carbon Energy Future14, identified the potential for an additional 50% increase in saving on those to be delivered under existing measures to 2020. However, it recognised that achieving this will demand more extensive measures than have been generally implemented so far, including deep retrofit of existing building stocks and utility infrastructure upgrades. It identified actions around information and advisory support to address barriers to consumer decision-making on energy efficiency and the development of affordable energy efficiency financing options for householders. It recommended continuing engagement in the enterprise sector through the Large Industry Energy Network and updating of the Energy Efficiency Obligation Scheme as well as support for energy efficiency in the public sector through the publishing of a Public Sector Energy Efficiency Action Plan in 2016.
11 Energy Efficiency Plan 2011. Communication from the Commission to the European Parliament, the Council, the European Economic and Social Committee and the Committee of the Regions, COM(2011) 109 final.
12 Energy Efficiency and its contribution to energy security and the 2030 Framework for climate and energy policy. Communication from the Commission to the European Parliament and the Council, COM(2014) 520 final.
13 Copies of all three Irish NEEAPs are available for download from http://www.dcenr.gov.ie/energy/en-ie/Energy-Efficiency/Pages/National-Energy-Efficiency-Action-Plan-(NEEAP).aspx
14 http://www.dcenr.gov.ie/energy/SiteCollectionDocuments/Energy-Initiatives/Energy%20White%20Paper%20-%20Dec%202015.pdf
12 ENERGY POLICY STATISTICAL SUPPORT UNIT
2 E
cono
my
& E
nerg
y Effi
cien
cy
2.4 Energy Efficiency Targets
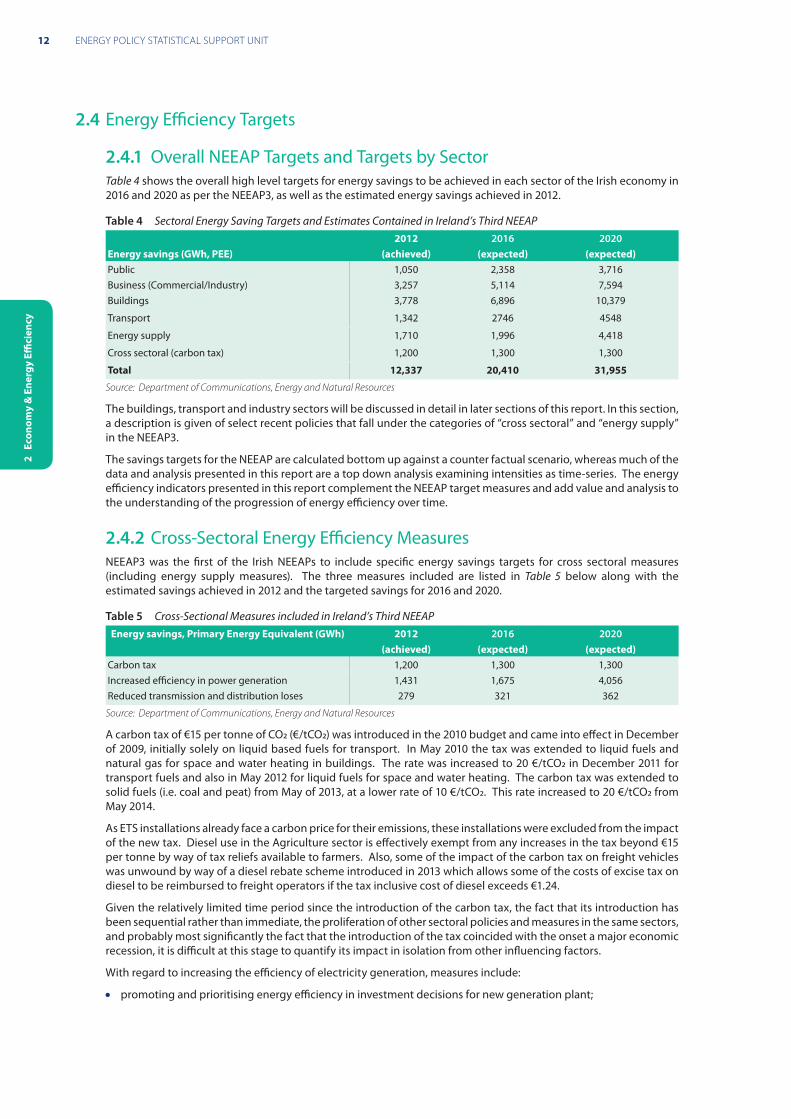
2.4.1 Overall NEEAP Targets and Targets by SectorTable 4 shows the overall high level targets for energy savings to be achieved in each sector of the Irish economy in 2016 and 2020 as per the NEEAP3, as well as the estimated energy savings achieved in 2012.
Table 4 Sectoral Energy Saving Targets and Estimates Contained in Ireland’s Third NEEAP2012 2016 2020
Energy savings (GWh, PEE) (achieved) (expected) (expected)Public 1,050 2,358 3,716Business (Commercial/Industry) 3,257 5,114 7,594Buildings 3,778 6,896 10,379
Transport 1,342 2746 4548
Energy supply 1,710 1,996 4,418
Cross sectoral (carbon tax) 1,200 1,300 1,300
Total 12,337 20,410 31,955
Source: Department of Communications, Energy and Natural Resources
The buildings, transport and industry sectors will be discussed in detail in later sections of this report. In this section, a description is given of select recent policies that fall under the categories of “cross sectoral” and “energy supply” in the NEEAP3.
The savings targets for the NEEAP are calculated bottom up against a counter factual scenario, whereas much of the data and analysis presented in this report are a top down analysis examining intensities as time-series. The energy efficiency indicators presented in this report complement the NEEAP target measures and add value and analysis to the understanding of the progression of energy efficiency over time.
2.4.2 Cross-Sectoral Energy Efficiency MeasuresNEEAP3 was the first of the Irish NEEAPs to include specific energy savings targets for cross sectoral measures (including energy supply measures). The three measures included are listed in Table 5 below along with the estimated savings achieved in 2012 and the targeted savings for 2016 and 2020.
Table 5 Cross-Sectional Measures included in Ireland’s Third NEEAPEnergy savings, Primary Energy Equivalent (GWh) 2012 2016 2020
(achieved) (expected) (expected)Carbon tax 1,200 1,300 1,300Increased efficiency in power generation 1,431 1,675 4,056Reduced transmission and distribution loses 279 321 362
Source: Department of Communications, Energy and Natural Resources
A carbon tax of €15 per tonne of CO2 (€/tCO2) was introduced in the 2010 budget and came into effect in December of 2009, initially solely on liquid based fuels for transport. In May 2010 the tax was extended to liquid fuels and natural gas for space and water heating in buildings. The rate was increased to 20 €/tCO2 in December 2011 for transport fuels and also in May 2012 for liquid fuels for space and water heating. The carbon tax was extended to solid fuels (i.e. coal and peat) from May of 2013, at a lower rate of 10 €/tCO2. This rate increased to 20 €/tCO2 from May 2014.
As ETS installations already face a carbon price for their emissions, these installations were excluded from the impact of the new tax. Diesel use in the Agriculture sector is effectively exempt from any increases in the tax beyond €15 per tonne by way of tax reliefs available to farmers. Also, some of the impact of the carbon tax on freight vehicles was unwound by way of a diesel rebate scheme introduced in 2013 which allows some of the costs of excise tax on diesel to be reimbursed to freight operators if the tax inclusive cost of diesel exceeds €1.24.
Given the relatively limited time period since the introduction of the carbon tax, the fact that its introduction has been sequential rather than immediate, the proliferation of other sectoral policies and measures in the same sectors, and probably most significantly the fact that the introduction of the tax coincided with the onset a major economic recession, it is difficult at this stage to quantify its impact in isolation from other influencing factors.
With regard to increasing the efficiency of electricity generation, measures include:
• promoting and prioritising energy efficiency in investment decisions for new generation plant;

13ENERGY IN EFFICIENCY IRELAND – 2016 REPORT
2 E
cono
my
& E
nerg
y Effi
cien
cy
• promoting competition in the All-Island Single Electricity Market;
• providing incentives to encourage large energy users to reduce peak energy use.
Measures to reduce transmission and distribution losses on the electricity grid are the responsibility the Transmission System Operator which is the state company Eirgrid. Eirgrid’s role is to manage the power system as efficiently as possible and continue to investigate the scope for upgrades to the transmission and distribution networks to reduce energy transmission and operational losses.
14 ENERGY POLICY STATISTICAL SUPPORT UNIT
3 B
uild
ings
3 Energy Efficiency in Buildings
Buildings accounted for 35% of total final energy consumption and around 59% of electricity consumption in Ireland in 2014, making it the second largest energy end-use sector behind transport. Furthermore the buildings sector has been consistently identified as a major potential source of cost effective energy efficiency improvements at international level by bodies such as the IEA15,16, and at national level17.
The following sections discuss the trends in energy consumption, drivers of energy use, energy intensity and energy efficiency of the Irish building stock, using data and analysis from SEAI and from the ODYSSEE18 database.
Energy in buildings generally encompasses two sectors, households and commercial. For Ireland, only limited data is currently available for energy consumption in the commercial sector building stock, although the situation will be improved in 2016/2017 with the publication of extensive new survey data from the Central Statistics Office. This report focuses on presenting data on the residential building stock but also presents available indicators from the services sector relating energy use and the activities driving it.
3.1 Residential Energy Efficiency
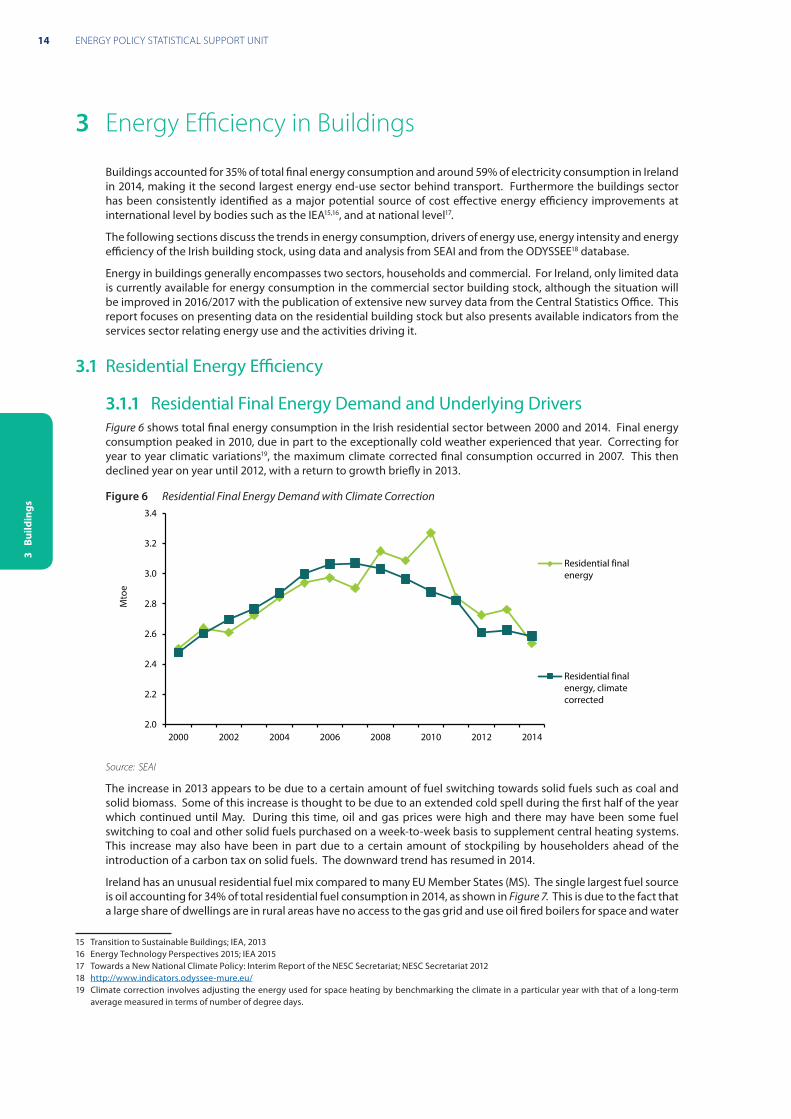
3.1.1 Residential Final Energy Demand and Underlying DriversFigure 6 shows total final energy consumption in the Irish residential sector between 2000 and 2014. Final energy consumption peaked in 2010, due in part to the exceptionally cold weather experienced that year. Correcting for year to year climatic variations19, the maximum climate corrected final consumption occurred in 2007. This then declined year on year until 2012, with a return to growth briefly in 2013.
Figure 6 Residential Final Energy Demand with Climate Correction
2.0
2.2
2.4
2.6
2.8
3.0
3.2
3.4
2000 2002 2004 2006 2008 2010 2012 2014
Mto
e
Residential finalenergy
Residential finalenergy, climatecorrected
Source: SEAI
The increase in 2013 appears to be due to a certain amount of fuel switching towards solid fuels such as coal and solid biomass. Some of this increase is thought to be due to an extended cold spell during the first half of the year which continued until May. During this time, oil and gas prices were high and there may have been some fuel switching to coal and other solid fuels purchased on a week-to-week basis to supplement central heating systems. This increase may also have been in part due to a certain amount of stockpiling by householders ahead of the introduction of a carbon tax on solid fuels. The downward trend has resumed in 2014.
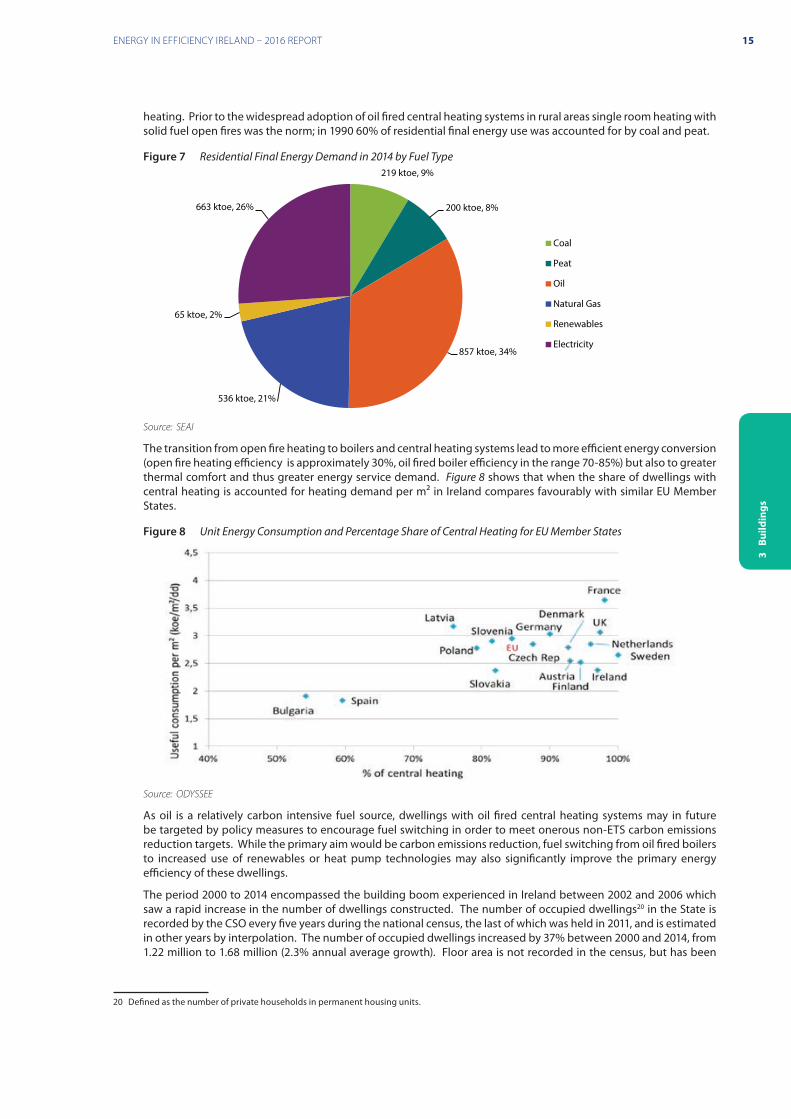
Ireland has an unusual residential fuel mix compared to many EU Member States (MS). The single largest fuel source is oil accounting for 34% of total residential fuel consumption in 2014, as shown in Figure 7. This is due to the fact that a large share of dwellings are in rural areas have no access to the gas grid and use oil fired boilers for space and water
15 Transition to Sustainable Buildings; IEA, 201316 Energy Technology Perspectives 2015; IEA 201517 Towards a New National Climate Policy: Interim Report of the NESC Secretariat; NESC Secretariat 201218 http://www.indicators.odyssee-mure.eu/19 Climate correction involves adjusting the energy used for space heating by benchmarking the climate in a particular year with that of a long-term
average measured in terms of number of degree days.
15ENERGY IN EFFICIENCY IRELAND – 2016 REPORT
3 B
uild
ings
heating. Prior to the widespread adoption of oil fired central heating systems in rural areas single room heating with solid fuel open fires was the norm; in 1990 60% of residential final energy use was accounted for by coal and peat.
Figure 7 Residential Final Energy Demand in 2014 by Fuel Type219 ktoe, 9%
200 ktoe, 8%
857 ktoe, 34%
536 ktoe, 21%
65 ktoe, 2%
663 ktoe, 26%
Coal
Peat
Oil
Natural Gas
Renewables
Electricity
Source: SEAI
The transition from open fire heating to boilers and central heating systems lead to more efficient energy conversion (open fire heating efficiency is approximately 30%, oil fired boiler efficiency in the range 70-85%) but also to greater thermal comfort and thus greater energy service demand. Figure 8 shows that when the share of dwellings with central heating is accounted for heating demand per m2 in Ireland compares favourably with similar EU Member States.
Figure 8 Unit Energy Consumption and Percentage Share of Central Heating for EU Member States
Source: ODYSSEE
As oil is a relatively carbon intensive fuel source, dwellings with oil fired central heating systems may in future be targeted by policy measures to encourage fuel switching in order to meet onerous non-ETS carbon emissions reduction targets. While the primary aim would be carbon emissions reduction, fuel switching from oil fired boilers to increased use of renewables or heat pump technologies may also significantly improve the primary energy efficiency of these dwellings.
The period 2000 to 2014 encompassed the building boom experienced in Ireland between 2002 and 2006 which saw a rapid increase in the number of dwellings constructed. The number of occupied dwellings20 in the State is recorded by the CSO every five years during the national census, the last of which was held in 2011, and is estimated in other years by interpolation. The number of occupied dwellings increased by 37% between 2000 and 2014, from 1.22 million to 1.68 million (2.3% annual average growth). Floor area is not recorded in the census, but has been
20 Defined as the number of private households in permanent housing units.
16 ENERGY POLICY STATISTICAL SUPPORT UNIT
3 B
uild
ings
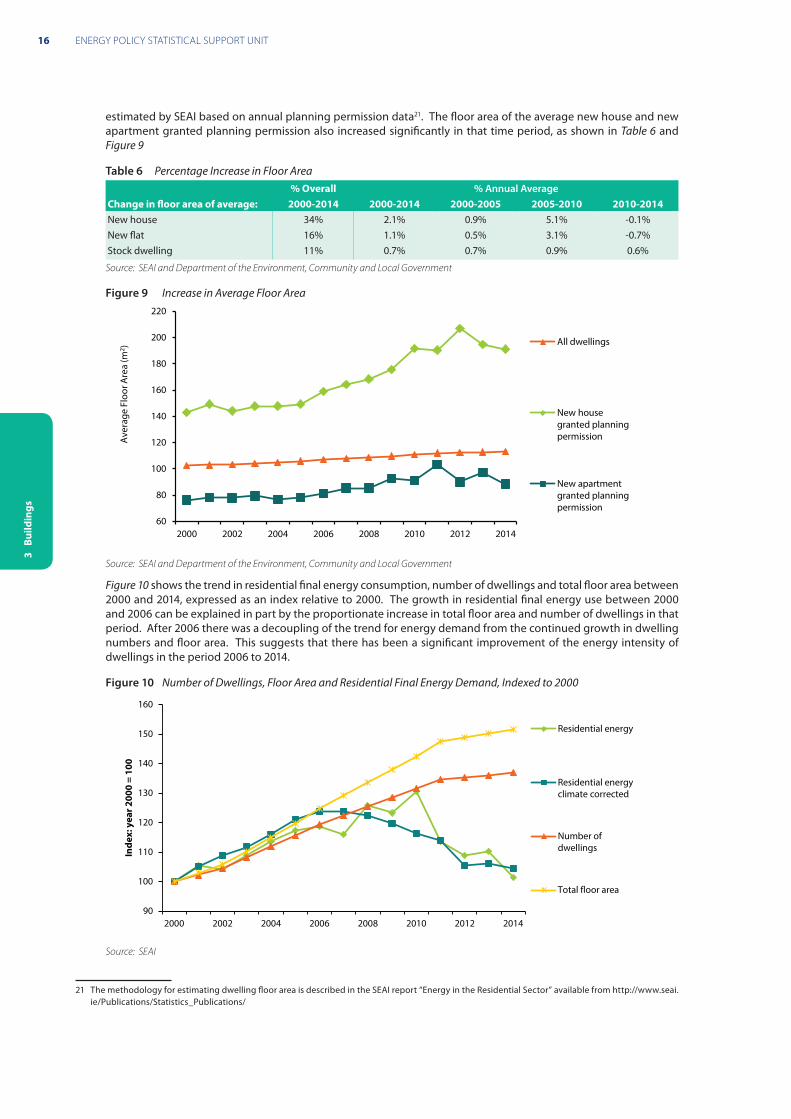
estimated by SEAI based on annual planning permission data21. The floor area of the average new house and new apartment granted planning permission also increased significantly in that time period, as shown in Table 6 and Figure 9
Table 6 Percentage Increase in Floor Area% Overall % Annual Average
Change in floor area of average: 2000-2014 2000-2014 2000-2005 2005-2010 2010-2014New house 34% 2.1% 0.9% 5.1% -0.1%New flat 16% 1.1% 0.5% 3.1% -0.7%Stock dwelling 11% 0.7% 0.7% 0.9% 0.6%
Source: SEAI and Department of the Environment, Community and Local Government
Figure 9 Increase in Average Floor Area
60
80
100
120
140
160
180
200
220
2000 2002 2004 2006 2008 2010 2012 2014
Ave
rage
Flo
or A
rea
(m2 )
All dwellings
New housegranted planningpermission
New apartmentgranted planningpermission
Source: SEAI and Department of the Environment, Community and Local Government
Figure 10 shows the trend in residential final energy consumption, number of dwellings and total floor area between 2000 and 2014, expressed as an index relative to 2000. The growth in residential final energy use between 2000 and 2006 can be explained in part by the proportionate increase in total floor area and number of dwellings in that period. After 2006 there was a decoupling of the trend for energy demand from the continued growth in dwelling numbers and floor area. This suggests that there has been a significant improvement of the energy intensity of dwellings in the period 2006 to 2014.
Figure 10 Number of Dwellings, Floor Area and Residential Final Energy Demand, Indexed to 2000
90
100
110
120
130
140
150
160
2000 2002 2004 2006 2008 2010 2012 2014
Inde
x: y
ear 2
000
= 10
0
Residential energy
Residential energyclimate corrected
Number ofdwellings
Total floor area
Source: SEAI
21 The methodology for estimating dwelling floor area is described in the SEAI report “Energy in the Residential Sector” available from http://www.seai.ie/Publications/Statistics_Publications/
17ENERGY IN EFFICIENCY IRELAND – 2016 REPORT
3 B
uild
ings
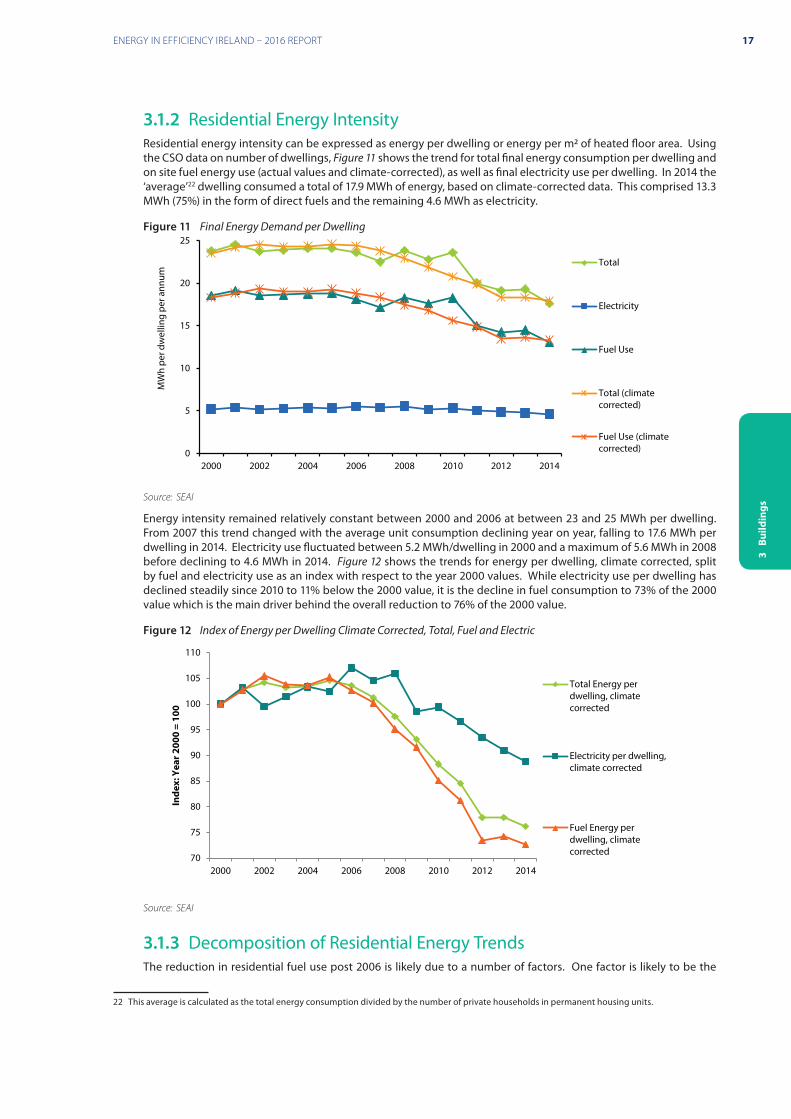
3.1.2 Residential Energy IntensityResidential energy intensity can be expressed as energy per dwelling or energy per m2 of heated floor area. Using the CSO data on number of dwellings, Figure 11 shows the trend for total final energy consumption per dwelling and on site fuel energy use (actual values and climate-corrected), as well as final electricity use per dwelling. In 2014 the ‘average’22 dwelling consumed a total of 17.9 MWh of energy, based on climate-corrected data. This comprised 13.3 MWh (75%) in the form of direct fuels and the remaining 4.6 MWh as electricity.
Figure 11 Final Energy Demand per Dwelling
0
5
10
15
20
25
2000 2002 2004 2006 2008 2010 2012 2014
MW
h pe
r dw
ellin
g pe
r ann
um
Total
Electricity
Fuel Use
Total (climatecorrected)
Fuel Use (climatecorrected)
Source: SEAI
Energy intensity remained relatively constant between 2000 and 2006 at between 23 and 25 MWh per dwelling. From 2007 this trend changed with the average unit consumption declining year on year, falling to 17.6 MWh per dwelling in 2014. Electricity use fluctuated between 5.2 MWh/dwelling in 2000 and a maximum of 5.6 MWh in 2008 before declining to 4.6 MWh in 2014. Figure 12 shows the trends for energy per dwelling, climate corrected, split by fuel and electricity use as an index with respect to the year 2000 values. While electricity use per dwelling has declined steadily since 2010 to 11% below the 2000 value, it is the decline in fuel consumption to 73% of the 2000 value which is the main driver behind the overall reduction to 76% of the 2000 value.
Figure 12 Index of Energy per Dwelling Climate Corrected, Total, Fuel and Electric
70
75
80
85
90
95
100
105
110
2000 2002 2004 2006 2008 2010 2012 2014
Inde
x: Y
ear 2
000
= 10
0
Total Energy perdwelling, climatecorrected
Electricity per dwelling,climate corrected
Fuel Energy perdwelling, climatecorrected
Source: SEAI
3.1.3 Decomposition of Residential Energy TrendsThe reduction in residential fuel use post 2006 is likely due to a number of factors. One factor is likely to be the
22 This average is calculated as the total energy consumption divided by the number of private households in permanent housing units.
18 ENERGY POLICY STATISTICAL SUPPORT UNIT
3 B
uild
ings
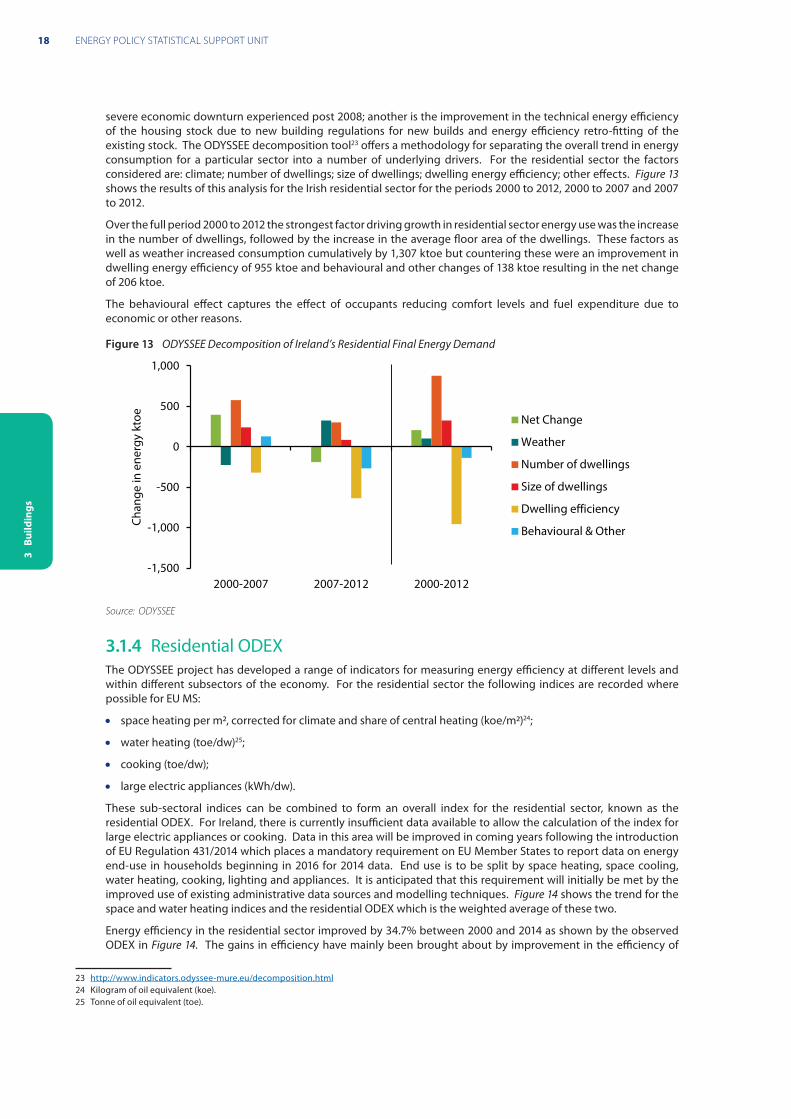
severe economic downturn experienced post 2008; another is the improvement in the technical energy efficiency of the housing stock due to new building regulations for new builds and energy efficiency retro-fitting of the existing stock. The ODYSSEE decomposition tool23 offers a methodology for separating the overall trend in energy consumption for a particular sector into a number of underlying drivers. For the residential sector the factors considered are: climate; number of dwellings; size of dwellings; dwelling energy efficiency; other effects. Figure 13 shows the results of this analysis for the Irish residential sector for the periods 2000 to 2012, 2000 to 2007 and 2007 to 2012.
Over the full period 2000 to 2012 the strongest factor driving growth in residential sector energy use was the increase in the number of dwellings, followed by the increase in the average floor area of the dwellings. These factors as well as weather increased consumption cumulatively by 1,307 ktoe but countering these were an improvement in dwelling energy efficiency of 955 ktoe and behavioural and other changes of 138 ktoe resulting in the net change of 206 ktoe.
The behavioural effect captures the effect of occupants reducing comfort levels and fuel expenditure due to economic or other reasons.
Figure 13 ODYSSEE Decomposition of Ireland’s Residential Final Energy Demand
-1,500
-1,000
-500
0
500
1,000
2000-2007 2007-2012 2000-2012
Chan
ge in
ene
rgy
ktoe Net Change
Weather
Number of dwellings
Size of dwellings
Dwelling efficiency
Behavioural & Other
Source: ODYSSEE
3.1.4 Residential ODEXThe ODYSSEE project has developed a range of indicators for measuring energy efficiency at different levels and within different subsectors of the economy. For the residential sector the following indices are recorded where possible for EU MS:
• space heating per m2, corrected for climate and share of central heating (koe/m2)24;
• water heating (toe/dw)25;
• cooking (toe/dw);
• large electric appliances (kWh/dw).
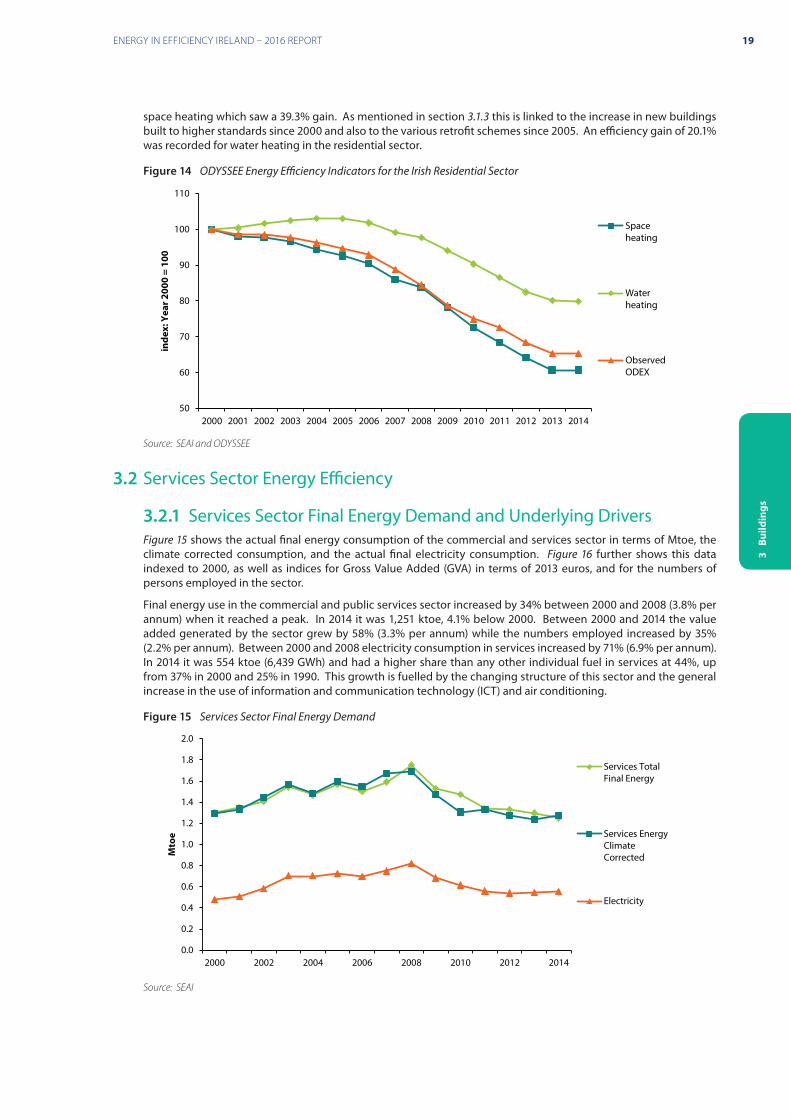
These sub-sectoral indices can be combined to form an overall index for the residential sector, known as the residential ODEX. For Ireland, there is currently insufficient data available to allow the calculation of the index for large electric appliances or cooking. Data in this area will be improved in coming years following the introduction of EU Regulation 431/2014 which places a mandatory requirement on EU Member States to report data on energy end-use in households beginning in 2016 for 2014 data. End use is to be split by space heating, space cooling, water heating, cooking, lighting and appliances. It is anticipated that this requirement will initially be met by the improved use of existing administrative data sources and modelling techniques. Figure 14 shows the trend for the space and water heating indices and the residential ODEX which is the weighted average of these two.
Energy efficiency in the residential sector improved by 34.7% between 2000 and 2014 as shown by the observed ODEX in Figure 14. The gains in efficiency have mainly been brought about by improvement in the efficiency of
23 http://www.indicators.odyssee-mure.eu/decomposition.html24 Kilogram of oil equivalent (koe).25 Tonne of oil equivalent (toe).
19ENERGY IN EFFICIENCY IRELAND – 2016 REPORT
3 B
uild
ings
space heating which saw a 39.3% gain. As mentioned in section 3.1.3 this is linked to the increase in new buildings built to higher standards since 2000 and also to the various retrofit schemes since 2005. An efficiency gain of 20.1% was recorded for water heating in the residential sector.
Figure 14 ODYSSEE Energy Efficiency Indicators for the Irish Residential Sector
50
60
70
80
90
100
110
2000 2001 2002 2003 2004 2005 2006 2007 2008 2009 2010 2011 2012 2013 2014
inde
x: Y
ear 2
000
= 10
0
Spaceheating
Waterheating
ObservedODEX
Source: SEAI and ODYSSEE
3.2 Services Sector Energy Efficiency
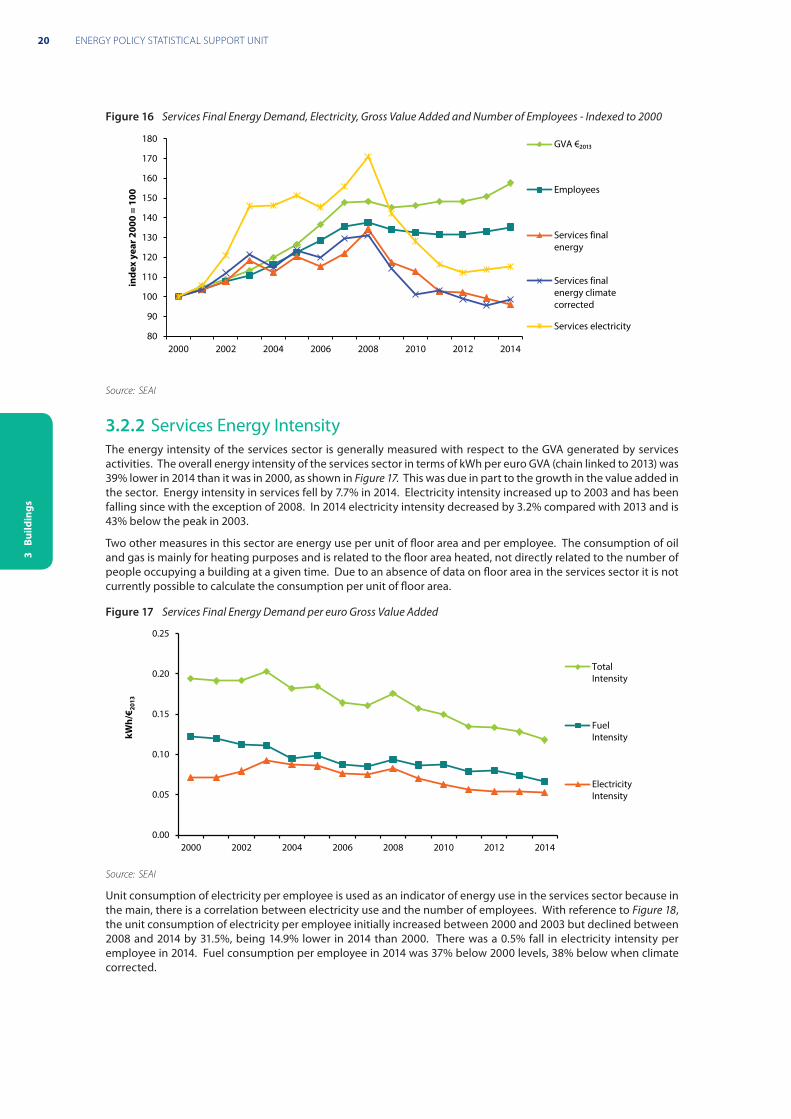
3.2.1 Services Sector Final Energy Demand and Underlying DriversFigure 15 shows the actual final energy consumption of the commercial and services sector in terms of Mtoe, the climate corrected consumption, and the actual final electricity consumption. Figure 16 further shows this data indexed to 2000, as well as indices for Gross Value Added (GVA) in terms of 2013 euros, and for the numbers of persons employed in the sector.
Final energy use in the commercial and public services sector increased by 34% between 2000 and 2008 (3.8% per annum) when it reached a peak. In 2014 it was 1,251 ktoe, 4.1% below 2000. Between 2000 and 2014 the value added generated by the sector grew by 58% (3.3% per annum) while the numbers employed increased by 35% (2.2% per annum). Between 2000 and 2008 electricity consumption in services increased by 71% (6.9% per annum). In 2014 it was 554 ktoe (6,439 GWh) and had a higher share than any other individual fuel in services at 44%, up from 37% in 2000 and 25% in 1990. This growth is fuelled by the changing structure of this sector and the general increase in the use of information and communication technology (ICT) and air conditioning.
Figure 15 Services Sector Final Energy Demand
0.0
0.2
0.4
0.6
0.8
1.0
1.2
1.4
1.6
1.8
2.0
2000 2002 2004 2006 2008 2010 2012 2014
Mto
e
Services TotalFinal Energy
Services EnergyClimateCorrected
Electricity
Source: SEAI
20 ENERGY POLICY STATISTICAL SUPPORT UNIT
3 B
uild
ings
Figure 16 Services Final Energy Demand, Electricity, Gross Value Added and Number of Employees - Indexed to 2000
80
90
100
110
120
130
140
150
160
170
180
2000 2002 2004 2006 2008 2010 2012 2014
inde
x ye
ar 2
000
= 10
0GVA €₂₀₁₃
Employees
Services finalenergy
Services finalenergy climatecorrected
Services electricity
Source: SEAI
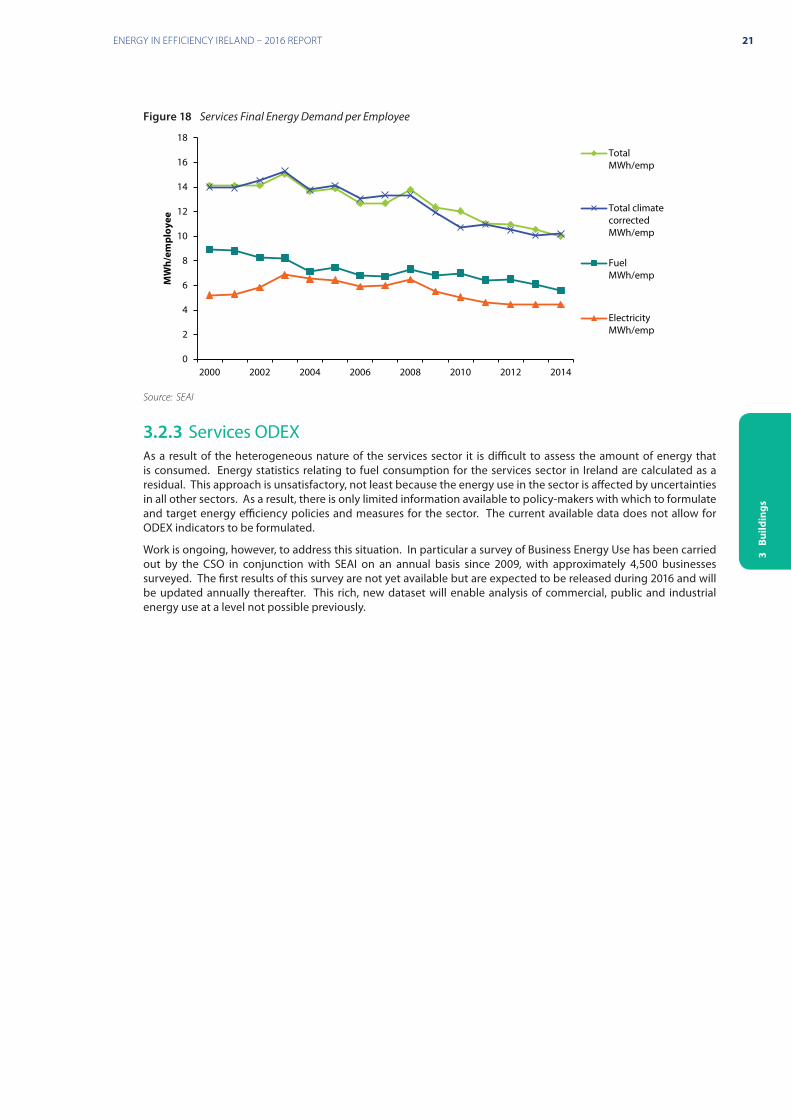
3.2.2 Services Energy IntensityThe energy intensity of the services sector is generally measured with respect to the GVA generated by services activities. The overall energy intensity of the services sector in terms of kWh per euro GVA (chain linked to 2013) was 39% lower in 2014 than it was in 2000, as shown in Figure 17. This was due in part to the growth in the value added in the sector. Energy intensity in services fell by 7.7% in 2014. Electricity intensity increased up to 2003 and has been falling since with the exception of 2008. In 2014 electricity intensity decreased by 3.2% compared with 2013 and is 43% below the peak in 2003.
Two other measures in this sector are energy use per unit of floor area and per employee. The consumption of oil and gas is mainly for heating purposes and is related to the floor area heated, not directly related to the number of people occupying a building at a given time. Due to an absence of data on floor area in the services sector it is not currently possible to calculate the consumption per unit of floor area.
Figure 17 Services Final Energy Demand per euro Gross Value Added
0.00
0.05
0.10
0.15
0.20
0.25
2000 2002 2004 2006 2008 2010 2012 2014
kWh/
€ 2013
TotalIntensity
FuelIntensity
ElectricityIntensity
Source: SEAI
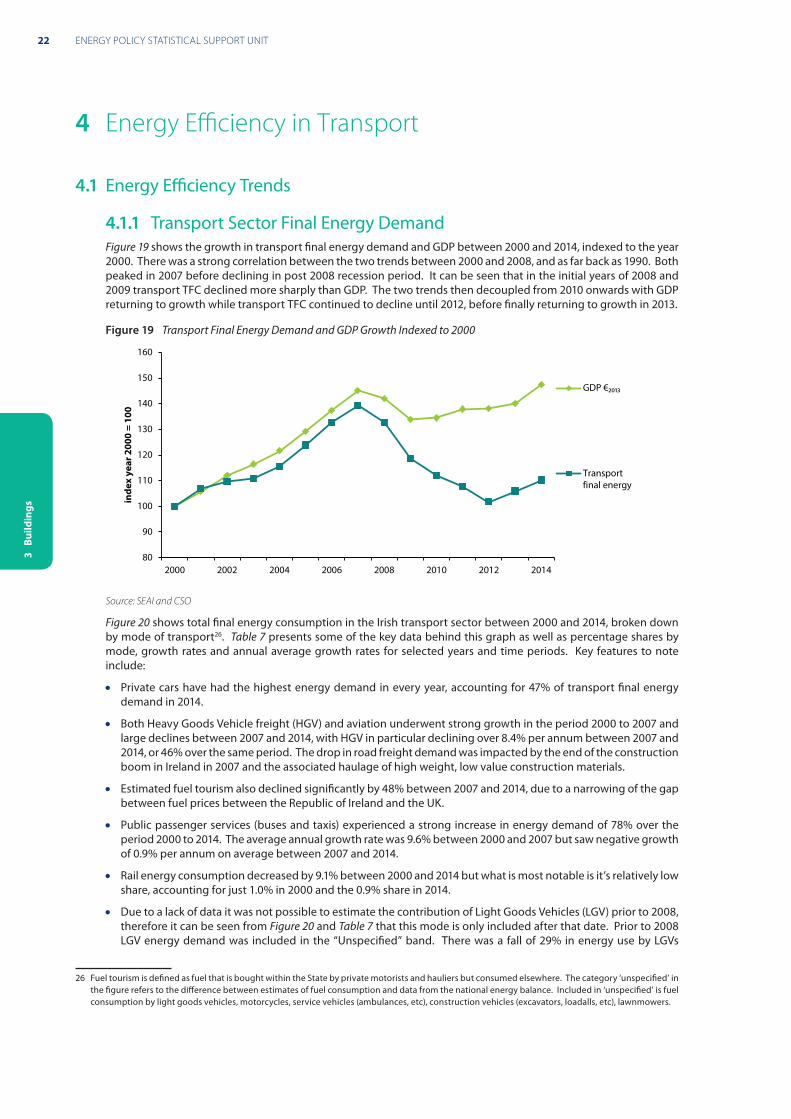
Unit consumption of electricity per employee is used as an indicator of energy use in the services sector because in the main, there is a correlation between electricity use and the number of employees. With reference to Figure 18, the unit consumption of electricity per employee initially increased between 2000 and 2003 but declined between 2008 and 2014 by 31.5%, being 14.9% lower in 2014 than 2000. There was a 0.5% fall in electricity intensity per employee in 2014. Fuel consumption per employee in 2014 was 37% below 2000 levels, 38% below when climate corrected.
21ENERGY IN EFFICIENCY IRELAND – 2016 REPORT
3 B
uild
ings
Figure 18 Services Final Energy Demand per Employee
0
2
4
6
8
10
12
14
16
18
2000 2002 2004 2006 2008 2010 2012 2014
MW
h/em
ploy
eeTotalMWh/emp
Total climatecorrectedMWh/emp
FuelMWh/emp
ElectricityMWh/emp
Source: SEAI
3.2.3 Services ODEXAs a result of the heterogeneous nature of the services sector it is difficult to assess the amount of energy that is consumed. Energy statistics relating to fuel consumption for the services sector in Ireland are calculated as a residual. This approach is unsatisfactory, not least because the energy use in the sector is affected by uncertainties in all other sectors. As a result, there is only limited information available to policy-makers with which to formulate and target energy efficiency policies and measures for the sector. The current available data does not allow for ODEX indicators to be formulated.
Work is ongoing, however, to address this situation. In particular a survey of Business Energy Use has been carried out by the CSO in conjunction with SEAI on an annual basis since 2009, with approximately 4,500 businesses surveyed. The first results of this survey are not yet available but are expected to be released during 2016 and will be updated annually thereafter. This rich, new dataset will enable analysis of commercial, public and industrial energy use at a level not possible previously.
22 ENERGY POLICY STATISTICAL SUPPORT UNIT
3 B
uild
ings
4 Energy Efficiency in Transport
4.1 Energy Efficiency Trends
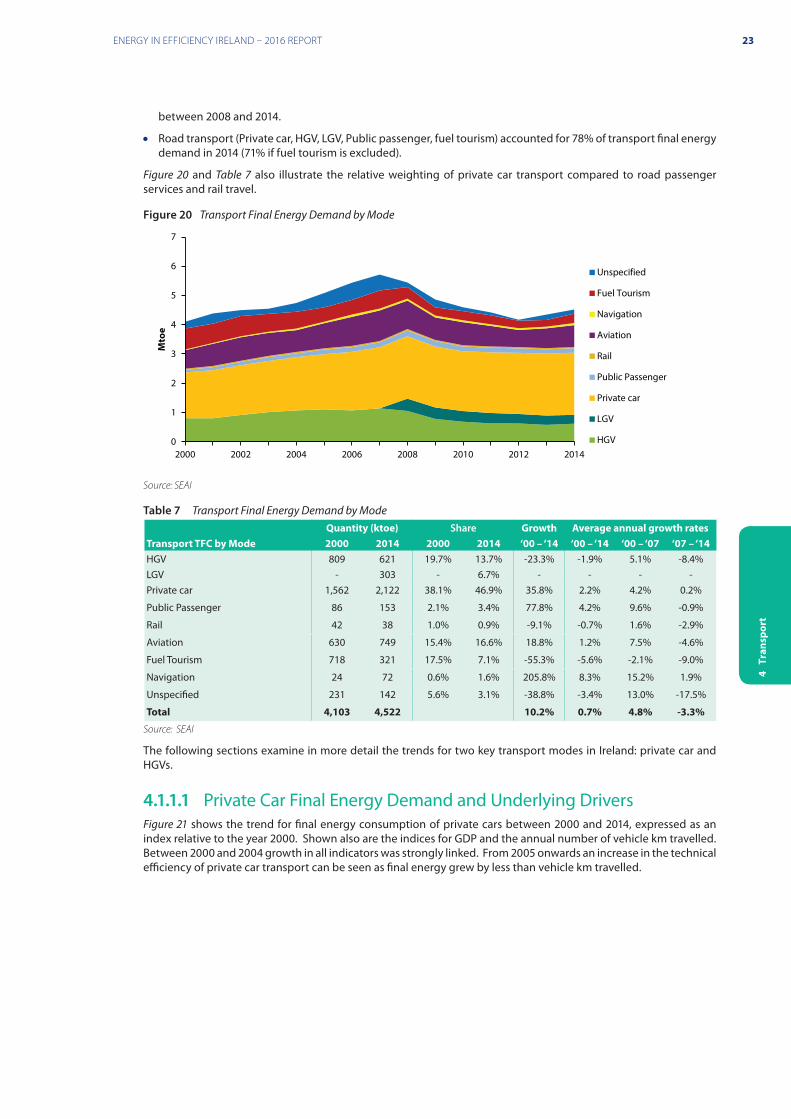
4.1.1 Transport Sector Final Energy DemandFigure 19 shows the growth in transport final energy demand and GDP between 2000 and 2014, indexed to the year 2000. There was a strong correlation between the two trends between 2000 and 2008, and as far back as 1990. Both peaked in 2007 before declining in post 2008 recession period. It can be seen that in the initial years of 2008 and 2009 transport TFC declined more sharply than GDP. The two trends then decoupled from 2010 onwards with GDP returning to growth while transport TFC continued to decline until 2012, before finally returning to growth in 2013.
Figure 19 Transport Final Energy Demand and GDP Growth Indexed to 2000
80
90
100
110
120
130
140
150
160
2000 2002 2004 2006 2008 2010 2012 2014
inde
x ye
ar 2
000
= 10
0
GDP €₂₀₁₃
Transportfinal energy
Source: SEAI and CSO
Figure 20 shows total final energy consumption in the Irish transport sector between 2000 and 2014, broken down by mode of transport26. Table 7 presents some of the key data behind this graph as well as percentage shares by mode, growth rates and annual average growth rates for selected years and time periods. Key features to note include:
• Private cars have had the highest energy demand in every year, accounting for 47% of transport final energy demand in 2014.
• Both Heavy Goods Vehicle freight (HGV) and aviation underwent strong growth in the period 2000 to 2007 and large declines between 2007 and 2014, with HGV in particular declining over 8.4% per annum between 2007 and 2014, or 46% over the same period. The drop in road freight demand was impacted by the end of the construction boom in Ireland in 2007 and the associated haulage of high weight, low value construction materials.
• Estimated fuel tourism also declined significantly by 48% between 2007 and 2014, due to a narrowing of the gap between fuel prices between the Republic of Ireland and the UK.
• Public passenger services (buses and taxis) experienced a strong increase in energy demand of 78% over the period 2000 to 2014. The average annual growth rate was 9.6% between 2000 and 2007 but saw negative growth of 0.9% per annum on average between 2007 and 2014.
• Rail energy consumption decreased by 9.1% between 2000 and 2014 but what is most notable is it’s relatively low share, accounting for just 1.0% in 2000 and the 0.9% share in 2014.
• Due to a lack of data it was not possible to estimate the contribution of Light Goods Vehicles (LGV) prior to 2008, therefore it can be seen from Figure 20 and Table 7 that this mode is only included after that date. Prior to 2008 LGV energy demand was included in the “Unspecified” band. There was a fall of 29% in energy use by LGVs
26 Fuel tourism is defined as fuel that is bought within the State by private motorists and hauliers but consumed elsewhere. The category ‘unspecified’ in the figure refers to the difference between estimates of fuel consumption and data from the national energy balance. Included in ‘unspecified’ is fuel consumption by light goods vehicles, motorcycles, service vehicles (ambulances, etc), construction vehicles (excavators, loadalls, etc), lawnmowers.
23ENERGY IN EFFICIENCY IRELAND – 2016 REPORT
4 T
rans
port
between 2008 and 2014.
• Road transport (Private car, HGV, LGV, Public passenger, fuel tourism) accounted for 78% of transport final energy demand in 2014 (71% if fuel tourism is excluded).
Figure 20 and Table 7 also illustrate the relative weighting of private car transport compared to road passenger services and rail travel.
Figure 20 Transport Final Energy Demand by Mode
0
1
2
3
4
5
6
7
2000 2002 2004 2006 2008 2010 2012 2014
Mto
e
Unspecified
Fuel Tourism
Navigation
Aviation
Rail
Public Passenger
Private car
LGV
HGV
Source: SEAI
Table 7 Transport Final Energy Demand by ModeQuantity (ktoe) Share Growth Average annual growth rates
Transport TFC by Mode 2000 2014 2000 2014 ‘00 – ‘14 ‘00 – ‘14 ‘00 – ‘07 ‘07 – ‘14HGV 809 621 19.7% 13.7% -23.3% -1.9% 5.1% -8.4%LGV - 303 - 6.7% - - - -Private car 1,562 2,122 38.1% 46.9% 35.8% 2.2% 4.2% 0.2%
Public Passenger 86 153 2.1% 3.4% 77.8% 4.2% 9.6% -0.9%
Rail 42 38 1.0% 0.9% -9.1% -0.7% 1.6% -2.9%
Aviation 630 749 15.4% 16.6% 18.8% 1.2% 7.5% -4.6%
Fuel Tourism 718 321 17.5% 7.1% -55.3% -5.6% -2.1% -9.0%
Navigation 24 72 0.6% 1.6% 205.8% 8.3% 15.2% 1.9%
Unspecified 231 142 5.6% 3.1% -38.8% -3.4% 13.0% -17.5%
Total 4,103 4,522 10.2% 0.7% 4.8% -3.3%
Source: SEAI
The following sections examine in more detail the trends for two key transport modes in Ireland: private car and HGVs.
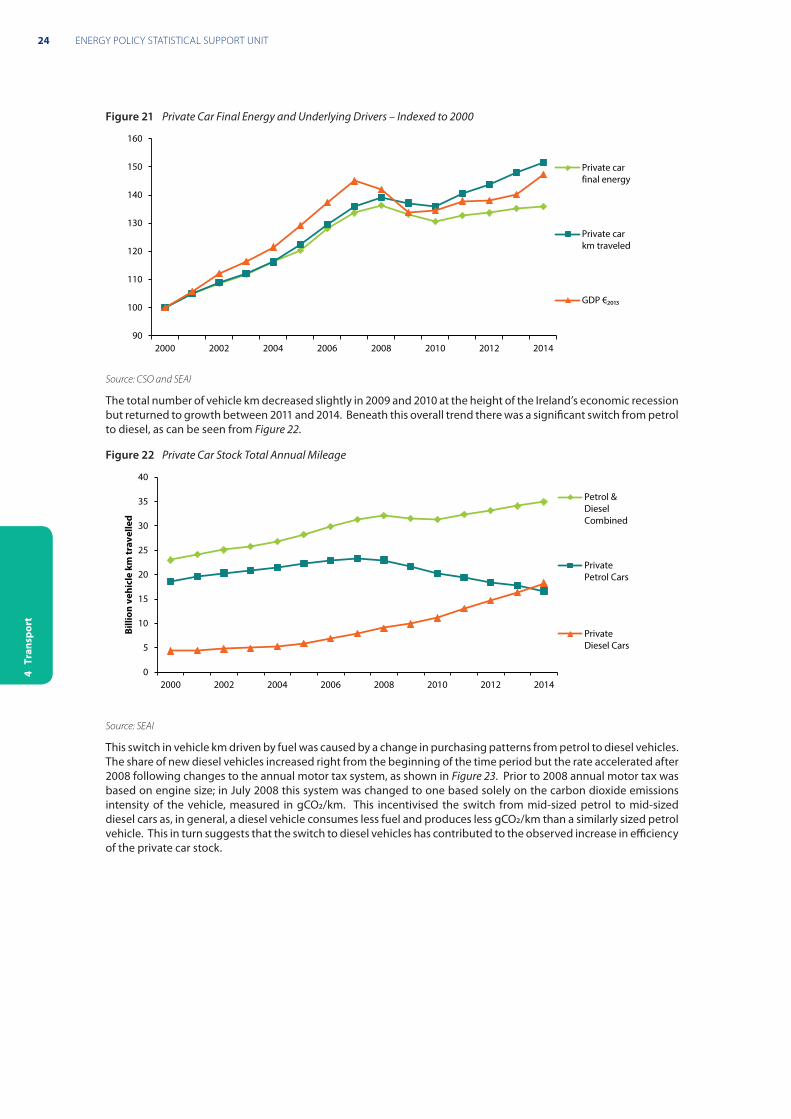
4.1.1.1 Private Car Final Energy Demand and Underlying DriversFigure 21 shows the trend for final energy consumption of private cars between 2000 and 2014, expressed as an index relative to the year 2000. Shown also are the indices for GDP and the annual number of vehicle km travelled. Between 2000 and 2004 growth in all indicators was strongly linked. From 2005 onwards an increase in the technical efficiency of private car transport can be seen as final energy grew by less than vehicle km travelled.
24 ENERGY POLICY STATISTICAL SUPPORT UNIT
4 T
rans
port
Figure 21 Private Car Final Energy and Underlying Drivers – Indexed to 2000
90
100
110
120
130
140
150
160
2000 2002 2004 2006 2008 2010 2012 2014
Private carfinal energy
Private carkm traveled
GDP €₂₀₁₃
Source: CSO and SEAI
The total number of vehicle km decreased slightly in 2009 and 2010 at the height of the Ireland’s economic recession but returned to growth between 2011 and 2014. Beneath this overall trend there was a significant switch from petrol to diesel, as can be seen from Figure 22.
Figure 22 Private Car Stock Total Annual Mileage
0
5
10
15
20
25
30
35
40
2000 2002 2004 2006 2008 2010 2012 2014
Billi
on v
ehic
le k
m tr
avel
led
Petrol &DieselCombined
PrivatePetrol Cars
PrivateDiesel Cars
Source: SEAI
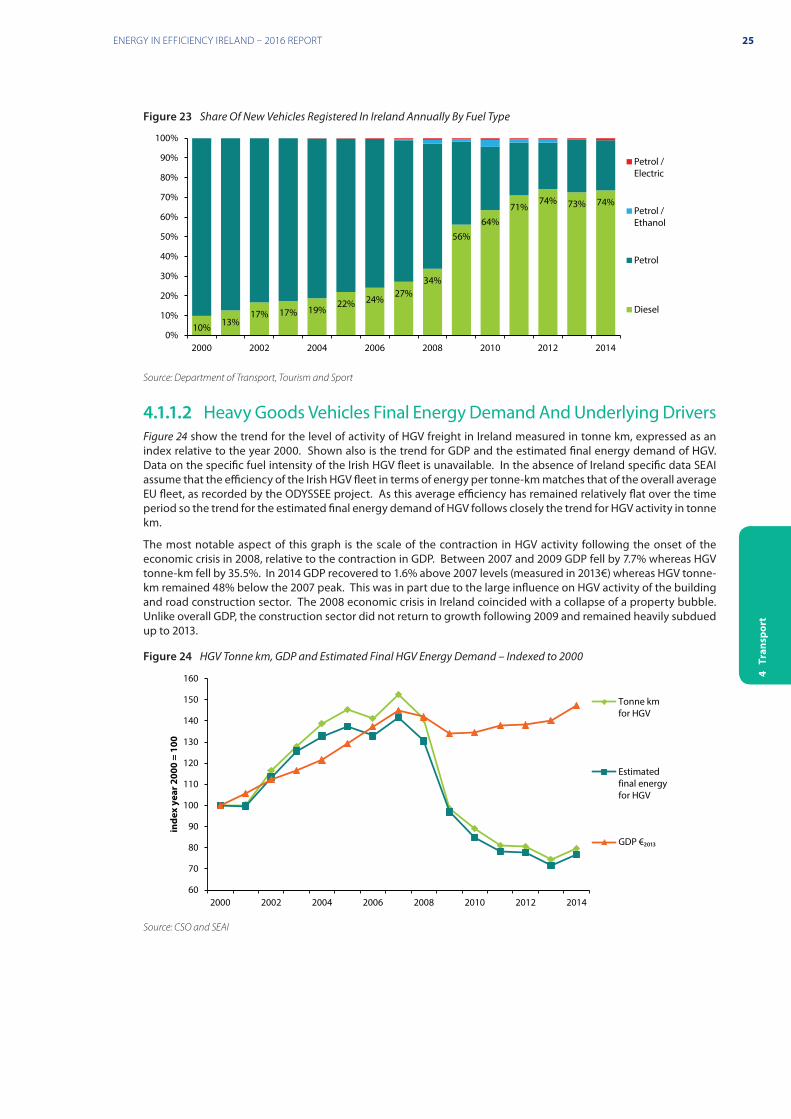
This switch in vehicle km driven by fuel was caused by a change in purchasing patterns from petrol to diesel vehicles. The share of new diesel vehicles increased right from the beginning of the time period but the rate accelerated after 2008 following changes to the annual motor tax system, as shown in Figure 23. Prior to 2008 annual motor tax was based on engine size; in July 2008 this system was changed to one based solely on the carbon dioxide emissions intensity of the vehicle, measured in gCO2/km. This incentivised the switch from mid-sized petrol to mid-sized diesel cars as, in general, a diesel vehicle consumes less fuel and produces less gCO2/km than a similarly sized petrol vehicle. This in turn suggests that the switch to diesel vehicles has contributed to the observed increase in efficiency of the private car stock.
25ENERGY IN EFFICIENCY IRELAND – 2016 REPORT
4 T
rans
port
Figure 23 Share Of New Vehicles Registered In Ireland Annually By Fuel Type
10% 13%17% 17% 19%
22% 24%27%
34%
56%64%
71%74% 73% 74%
0%
10%
20%
30%
40%
50%
60%
70%
80%
90%
100%
2000 2002 2004 2006 2008 2010 2012 2014
Petrol /Electric
Petrol /Ethanol
Petrol
Diesel
Source: Department of Transport, Tourism and Sport
4.1.1.2 Heavy Goods Vehicles Final Energy Demand And Underlying DriversFigure 24 show the trend for the level of activity of HGV freight in Ireland measured in tonne km, expressed as an index relative to the year 2000. Shown also is the trend for GDP and the estimated final energy demand of HGV. Data on the specific fuel intensity of the Irish HGV fleet is unavailable. In the absence of Ireland specific data SEAI assume that the efficiency of the Irish HGV fleet in terms of energy per tonne-km matches that of the overall average EU fleet, as recorded by the ODYSSEE project. As this average efficiency has remained relatively flat over the time period so the trend for the estimated final energy demand of HGV follows closely the trend for HGV activity in tonne km.
The most notable aspect of this graph is the scale of the contraction in HGV activity following the onset of the economic crisis in 2008, relative to the contraction in GDP. Between 2007 and 2009 GDP fell by 7.7% whereas HGV tonne-km fell by 35.5%. In 2014 GDP recovered to 1.6% above 2007 levels (measured in 2013€) whereas HGV tonne-km remained 48% below the 2007 peak. This was in part due to the large influence on HGV activity of the building and road construction sector. The 2008 economic crisis in Ireland coincided with a collapse of a property bubble. Unlike overall GDP, the construction sector did not return to growth following 2009 and remained heavily subdued up to 2013.
Figure 24 HGV Tonne km, GDP and Estimated Final HGV Energy Demand – Indexed to 2000
60
70
80
90
100
110
120
130
140
150
160
2000 2002 2004 2006 2008 2010 2012 2014
inde
x ye
ar 2
000
= 10
0
Tonne kmfor HGV
Estimatedfinal energyfor HGV
GDP €₂₀₁₃
Source: CSO and SEAI
26 ENERGY POLICY STATISTICAL SUPPORT UNIT
4 T
rans
port
4.1.2 Transport Energy Intensity
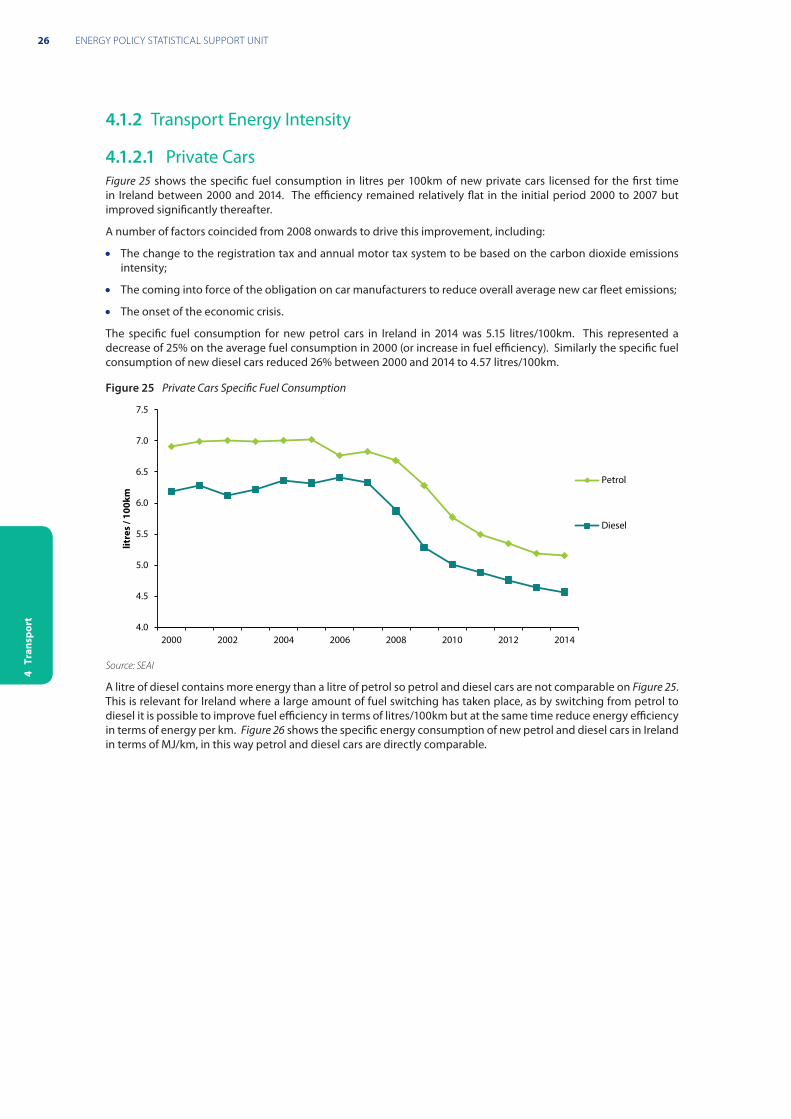
4.1.2.1 Private CarsFigure 25 shows the specific fuel consumption in litres per 100km of new private cars licensed for the first time in Ireland between 2000 and 2014. The efficiency remained relatively flat in the initial period 2000 to 2007 but improved significantly thereafter.
A number of factors coincided from 2008 onwards to drive this improvement, including:
• The change to the registration tax and annual motor tax system to be based on the carbon dioxide emissions intensity;
• The coming into force of the obligation on car manufacturers to reduce overall average new car fleet emissions;
• The onset of the economic crisis.
The specific fuel consumption for new petrol cars in Ireland in 2014 was 5.15 litres/100km. This represented a decrease of 25% on the average fuel consumption in 2000 (or increase in fuel efficiency). Similarly the specific fuel consumption of new diesel cars reduced 26% between 2000 and 2014 to 4.57 litres/100km.
Figure 25 Private Cars Specific Fuel Consumption
4.0
4.5
5.0
5.5
6.0
6.5
7.0
7.5
2000 2002 2004 2006 2008 2010 2012 2014
litre
s / 1
00km
Petrol
Diesel
Source: SEAI
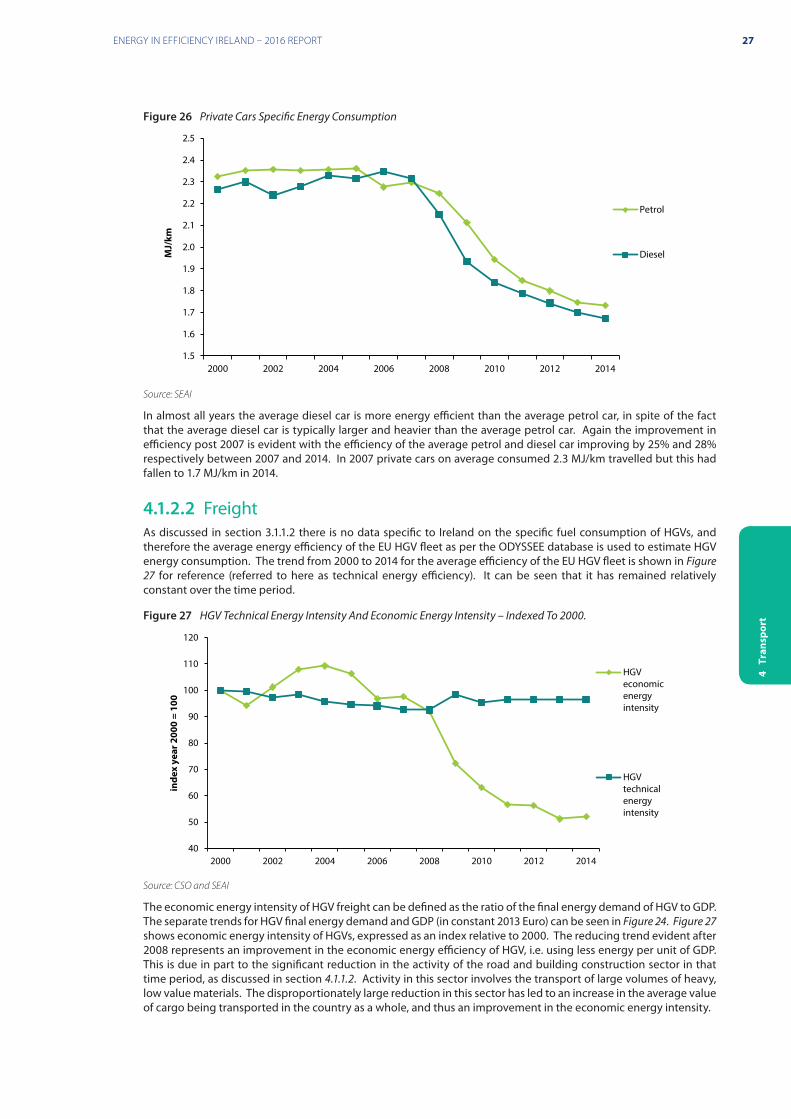
A litre of diesel contains more energy than a litre of petrol so petrol and diesel cars are not comparable on Figure 25. This is relevant for Ireland where a large amount of fuel switching has taken place, as by switching from petrol to diesel it is possible to improve fuel efficiency in terms of litres/100km but at the same time reduce energy efficiency in terms of energy per km. Figure 26 shows the specific energy consumption of new petrol and diesel cars in Ireland in terms of MJ/km, in this way petrol and diesel cars are directly comparable.
27ENERGY IN EFFICIENCY IRELAND – 2016 REPORT
4 T
rans
port
Figure 26 Private Cars Specific Energy Consumption
1.5
1.6
1.7
1.8
1.9
2.0
2.1
2.2
2.3
2.4
2.5
2000 2002 2004 2006 2008 2010 2012 2014
MJ/
km
Petrol
Diesel
Source: SEAI
In almost all years the average diesel car is more energy efficient than the average petrol car, in spite of the fact that the average diesel car is typically larger and heavier than the average petrol car. Again the improvement in efficiency post 2007 is evident with the efficiency of the average petrol and diesel car improving by 25% and 28% respectively between 2007 and 2014. In 2007 private cars on average consumed 2.3 MJ/km travelled but this had fallen to 1.7 MJ/km in 2014.
4.1.2.2 FreightAs discussed in section 3.1.1.2 there is no data specific to Ireland on the specific fuel consumption of HGVs, and therefore the average energy efficiency of the EU HGV fleet as per the ODYSSEE database is used to estimate HGV energy consumption. The trend from 2000 to 2014 for the average efficiency of the EU HGV fleet is shown in Figure 27 for reference (referred to here as technical energy efficiency). It can be seen that it has remained relatively constant over the time period.
Figure 27 HGV Technical Energy Intensity And Economic Energy Intensity – Indexed To 2000.
40
50
60
70
80
90
100
110
120
2000 2002 2004 2006 2008 2010 2012 2014
inde
x ye
ar 2
000
= 10
0
HGVeconomicenergyintensity
HGVtechnicalenergyintensity
Source: CSO and SEAI
The economic energy intensity of HGV freight can be defined as the ratio of the final energy demand of HGV to GDP. The separate trends for HGV final energy demand and GDP (in constant 2013 Euro) can be seen in Figure 24. Figure 27 shows economic energy intensity of HGVs, expressed as an index relative to 2000. The reducing trend evident after 2008 represents an improvement in the economic energy efficiency of HGV, i.e. using less energy per unit of GDP. This is due in part to the significant reduction in the activity of the road and building construction sector in that time period, as discussed in section 4.1.1.2. Activity in this sector involves the transport of large volumes of heavy, low value materials. The disproportionately large reduction in this sector has led to an increase in the average value of cargo being transported in the country as a whole, and thus an improvement in the economic energy intensity.
28 ENERGY POLICY STATISTICAL SUPPORT UNIT
4 T
rans
port
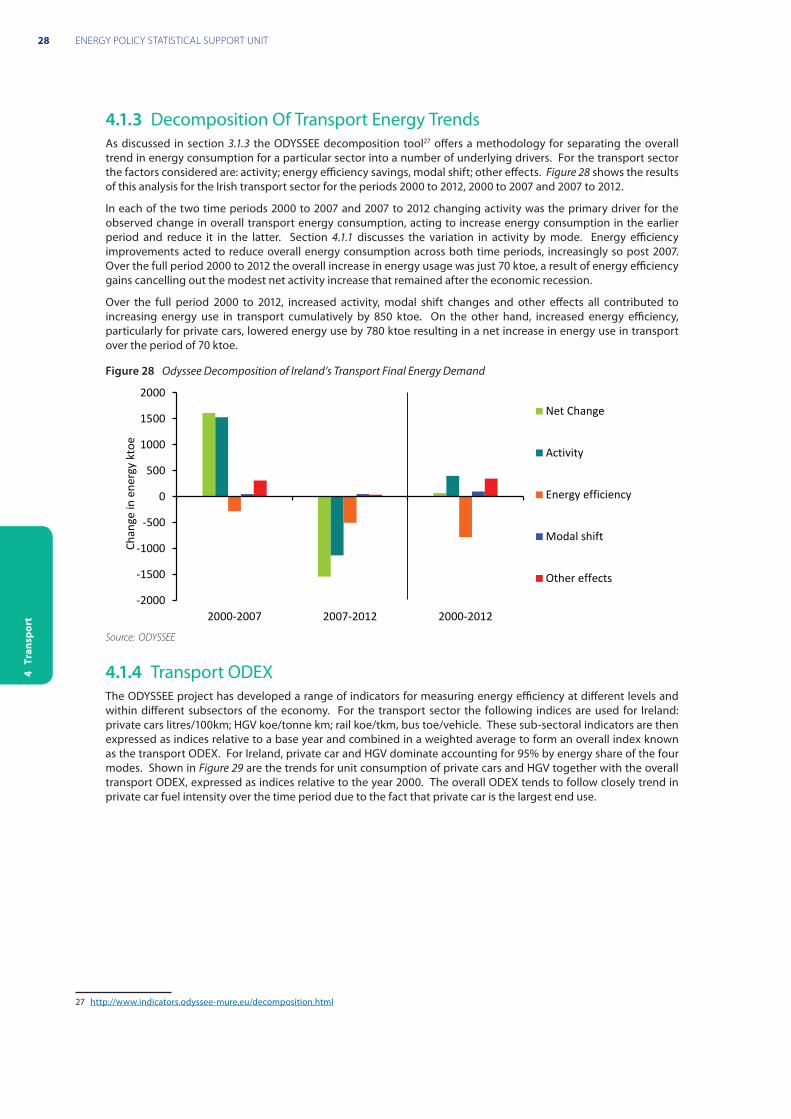
4.1.3 Decomposition Of Transport Energy TrendsAs discussed in section 3.1.3 the ODYSSEE decomposition tool27 offers a methodology for separating the overall trend in energy consumption for a particular sector into a number of underlying drivers. For the transport sector the factors considered are: activity; energy efficiency savings, modal shift; other effects. Figure 28 shows the results of this analysis for the Irish transport sector for the periods 2000 to 2012, 2000 to 2007 and 2007 to 2012.
In each of the two time periods 2000 to 2007 and 2007 to 2012 changing activity was the primary driver for the observed change in overall transport energy consumption, acting to increase energy consumption in the earlier period and reduce it in the latter. Section 4.1.1 discusses the variation in activity by mode. Energy efficiency improvements acted to reduce overall energy consumption across both time periods, increasingly so post 2007. Over the full period 2000 to 2012 the overall increase in energy usage was just 70 ktoe, a result of energy efficiency gains cancelling out the modest net activity increase that remained after the economic recession.
Over the full period 2000 to 2012, increased activity, modal shift changes and other effects all contributed to increasing energy use in transport cumulatively by 850 ktoe. On the other hand, increased energy efficiency, particularly for private cars, lowered energy use by 780 ktoe resulting in a net increase in energy use in transport over the period of 70 ktoe.
Figure 28 Odyssee Decomposition of Ireland’s Transport Final Energy Demand
-2000
-1500
-1000
-500
0
500
1000
1500
2000
2000-2007 2007-2012 2000-2012
Chan
ge in
ene
rgy
ktoe
Net Change
Activity
Energy efficiency
Modal shift
Other effects
Source: ODYSSEE
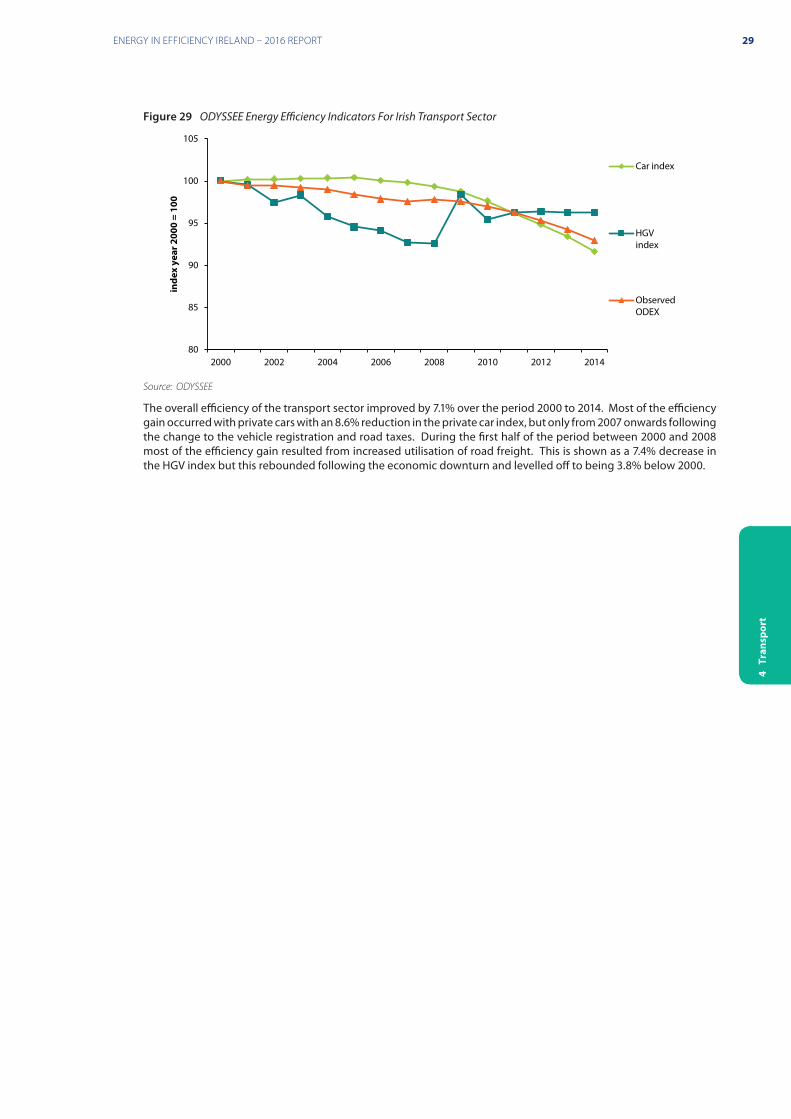
4.1.4 Transport ODEXThe ODYSSEE project has developed a range of indicators for measuring energy efficiency at different levels and within different subsectors of the economy. For the transport sector the following indices are used for Ireland: private cars litres/100km; HGV koe/tonne km; rail koe/tkm, bus toe/vehicle. These sub-sectoral indicators are then expressed as indices relative to a base year and combined in a weighted average to form an overall index known as the transport ODEX. For Ireland, private car and HGV dominate accounting for 95% by energy share of the four modes. Shown in Figure 29 are the trends for unit consumption of private cars and HGV together with the overall transport ODEX, expressed as indices relative to the year 2000. The overall ODEX tends to follow closely trend in private car fuel intensity over the time period due to the fact that private car is the largest end use.
27 http://www.indicators.odyssee-mure.eu/decomposition.html
29ENERGY IN EFFICIENCY IRELAND – 2016 REPORT
4 T
rans
port
Figure 29 ODYSSEE Energy Efficiency Indicators For Irish Transport Sector
80
85
90
95
100
105
2000 2002 2004 2006 2008 2010 2012 2014
inde
x ye
ar 2
000
= 10
0Car index
HGVindex
ObservedODEX
Source: ODYSSEE
The overall efficiency of the transport sector improved by 7.1% over the period 2000 to 2014. Most of the efficiency gain occurred with private cars with an 8.6% reduction in the private car index, but only from 2007 onwards following the change to the vehicle registration and road taxes. During the first half of the period between 2000 and 2008 most of the efficiency gain resulted from increased utilisation of road freight. This is shown as a 7.4% decrease in the HGV index but this rebounded following the economic downturn and levelled off to being 3.8% below 2000.
30 ENERGY POLICY STATISTICAL SUPPORT UNIT
4 T
rans
port
5 Energy Efficiency in Industry
5.1 Energy Efficiency Trends
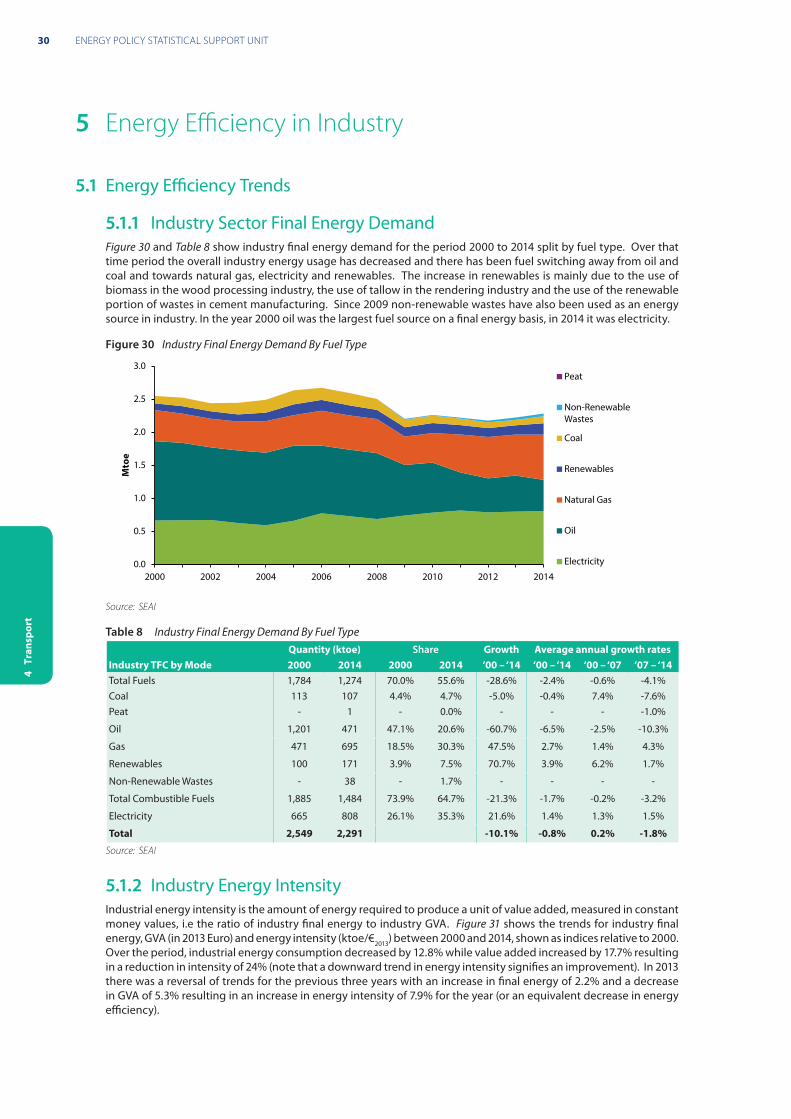
5.1.1 Industry Sector Final Energy DemandFigure 30 and Table 8 show industry final energy demand for the period 2000 to 2014 split by fuel type. Over that time period the overall industry energy usage has decreased and there has been fuel switching away from oil and coal and towards natural gas, electricity and renewables. The increase in renewables is mainly due to the use of biomass in the wood processing industry, the use of tallow in the rendering industry and the use of the renewable portion of wastes in cement manufacturing. Since 2009 non-renewable wastes have also been used as an energy source in industry. In the year 2000 oil was the largest fuel source on a final energy basis, in 2014 it was electricity.
Figure 30 Industry Final Energy Demand By Fuel Type
0.0
0.5
1.0
1.5
2.0
2.5
3.0
2000 2002 2004 2006 2008 2010 2012 2014
Mto
e
Peat
Non-RenewableWastes
Coal
Renewables
Natural Gas
Oil
Electricity
Source: SEAI
Table 8 Industry Final Energy Demand By Fuel TypeQuantity (ktoe) Share Growth Average annual growth rates
Industry TFC by Mode 2000 2014 2000 2014 ‘00 – ‘14 ‘00 – ‘14 ‘00 – ‘07 ‘07 – ‘14Total Fuels 1,784 1,274 70.0% 55.6% -28.6% -2.4% -0.6% -4.1%Coal 113 107 4.4% 4.7% -5.0% -0.4% 7.4% -7.6%Peat - 1 - 0.0% - - - -1.0%
Oil 1,201 471 47.1% 20.6% -60.7% -6.5% -2.5% -10.3%
Gas 471 695 18.5% 30.3% 47.5% 2.7% 1.4% 4.3%
Renewables 100 171 3.9% 7.5% 70.7% 3.9% 6.2% 1.7%
Non-Renewable Wastes - 38 - 1.7% - - - -
Total Combustible Fuels 1,885 1,484 73.9% 64.7% -21.3% -1.7% -0.2% -3.2%
Electricity 665 808 26.1% 35.3% 21.6% 1.4% 1.3% 1.5%
Total 2,549 2,291 -10.1% -0.8% 0.2% -1.8%
Source: SEAI
5.1.2 Industry Energy IntensityIndustrial energy intensity is the amount of energy required to produce a unit of value added, measured in constant money values, i.e the ratio of industry final energy to industry GVA. Figure 31 shows the trends for industry final energy, GVA (in 2013 Euro) and energy intensity (ktoe/€2013) between 2000 and 2014, shown as indices relative to 2000. Over the period, industrial energy consumption decreased by 12.8% while value added increased by 17.7% resulting in a reduction in intensity of 24% (note that a downward trend in energy intensity signifies an improvement). In 2013 there was a reversal of trends for the previous three years with an increase in final energy of 2.2% and a decrease in GVA of 5.3% resulting in an increase in energy intensity of 7.9% for the year (or an equivalent decrease in energy efficiency).
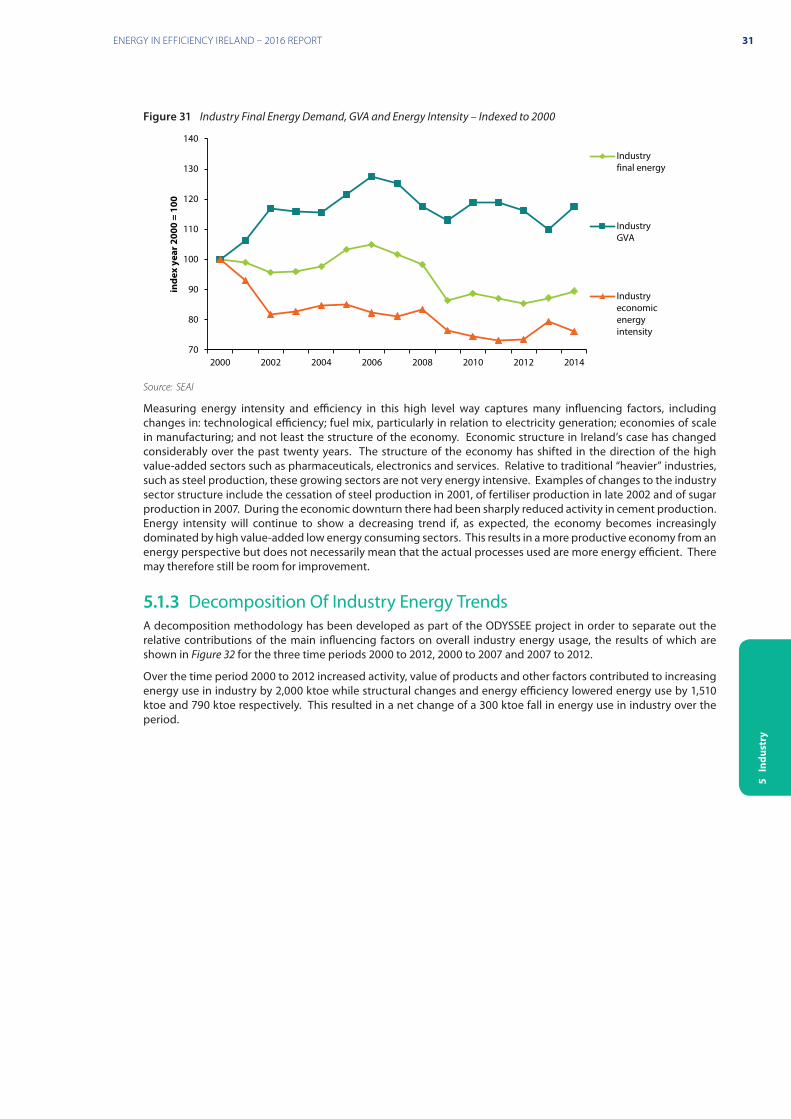
31ENERGY IN EFFICIENCY IRELAND – 2016 REPORT
5 I
ndus
try
Figure 31 Industry Final Energy Demand, GVA and Energy Intensity – Indexed to 2000
70
80
90
100
110
120
130
140
2000 2002 2004 2006 2008 2010 2012 2014
inde
x ye
ar 2
000
= 10
0
Industryfinal energy
IndustryGVA
Industryeconomicenergyintensity
Source: SEAI
Measuring energy intensity and efficiency in this high level way captures many influencing factors, including changes in: technological efficiency; fuel mix, particularly in relation to electricity generation; economies of scale in manufacturing; and not least the structure of the economy. Economic structure in Ireland’s case has changed considerably over the past twenty years. The structure of the economy has shifted in the direction of the high value-added sectors such as pharmaceuticals, electronics and services. Relative to traditional “heavier” industries, such as steel production, these growing sectors are not very energy intensive. Examples of changes to the industry sector structure include the cessation of steel production in 2001, of fertiliser production in late 2002 and of sugar production in 2007. During the economic downturn there had been sharply reduced activity in cement production. Energy intensity will continue to show a decreasing trend if, as expected, the economy becomes increasingly dominated by high value-added low energy consuming sectors. This results in a more productive economy from an energy perspective but does not necessarily mean that the actual processes used are more energy efficient. There may therefore still be room for improvement.
5.1.3 Decomposition Of Industry Energy TrendsA decomposition methodology has been developed as part of the ODYSSEE project in order to separate out the relative contributions of the main influencing factors on overall industry energy usage, the results of which are shown in Figure 32 for the three time periods 2000 to 2012, 2000 to 2007 and 2007 to 2012.
Over the time period 2000 to 2012 increased activity, value of products and other factors contributed to increasing energy use in industry by 2,000 ktoe while structural changes and energy efficiency lowered energy use by 1,510 ktoe and 790 ktoe respectively. This resulted in a net change of a 300 ktoe fall in energy use in industry over the period.
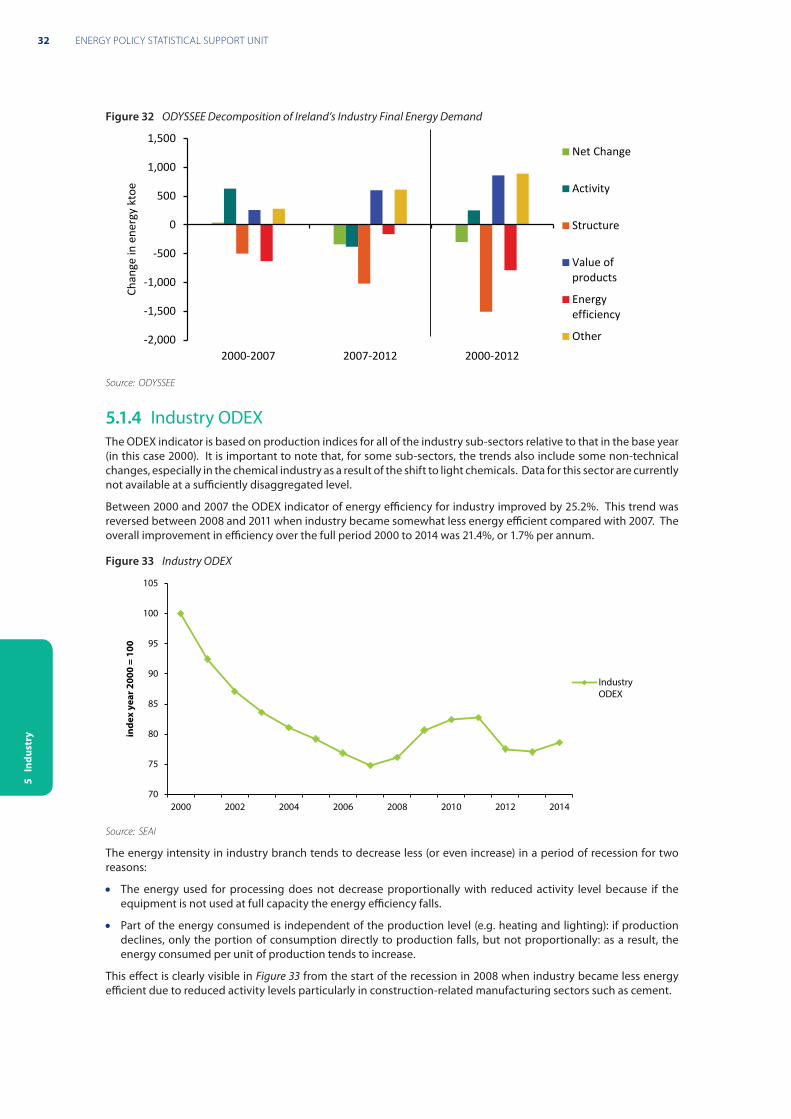
32 ENERGY POLICY STATISTICAL SUPPORT UNIT
5 I
ndus
try
Figure 32 ODYSSEE Decomposition of Ireland’s Industry Final Energy Demand
-2,000
-1,500
-1,000
-500
0
500
1,000
1,500
2000-2007 2007-2012 2000-2012
Chan
ge in
ene
rgy
ktoe
Net Change
Activity
Structure
Value ofproducts
Energyefficiency
Other
Source: ODYSSEE
5.1.4 Industry ODEXThe ODEX indicator is based on production indices for all of the industry sub-sectors relative to that in the base year (in this case 2000). It is important to note that, for some sub-sectors, the trends also include some non-technical changes, especially in the chemical industry as a result of the shift to light chemicals. Data for this sector are currently not available at a sufficiently disaggregated level.
Between 2000 and 2007 the ODEX indicator of energy efficiency for industry improved by 25.2%. This trend was reversed between 2008 and 2011 when industry became somewhat less energy efficient compared with 2007. The overall improvement in efficiency over the full period 2000 to 2014 was 21.4%, or 1.7% per annum.
Figure 33 Industry ODEX
70
75
80
85
90
95
100
105
2000 2002 2004 2006 2008 2010 2012 2014
inde
x ye
ar 2
000
= 10
0
IndustryODEX
Source: SEAI
The energy intensity in industry branch tends to decrease less (or even increase) in a period of recession for two reasons:
• The energy used for processing does not decrease proportionally with reduced activity level because if the equipment is not used at full capacity the energy efficiency falls.
• Part of the energy consumed is independent of the production level (e.g. heating and lighting): if production declines, only the portion of consumption directly to production falls, but not proportionally: as a result, the energy consumed per unit of production tends to increase.
This effect is clearly visible in Figure 33 from the start of the recession in 2008 when industry became less energy efficient due to reduced activity levels particularly in construction-related manufacturing sectors such as cement.
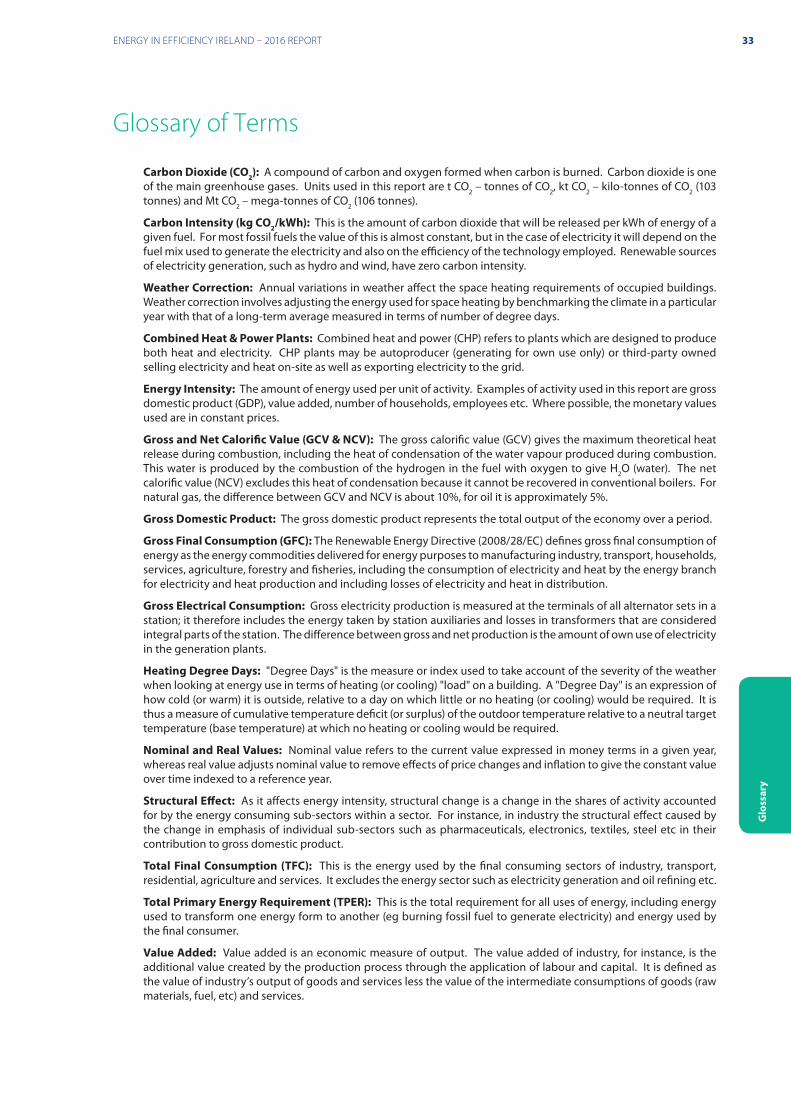
33ENERGY IN EFFICIENCY IRELAND – 2016 REPORT
Glo
ssar
y
Glossary of Terms
Carbon Dioxide (CO2): A compound of carbon and oxygen formed when carbon is burned. Carbon dioxide is one of the main greenhouse gases. Units used in this report are t CO2 – tonnes of CO2, kt CO2 – kilo-tonnes of CO2 (103 tonnes) and Mt CO2 – mega-tonnes of CO2 (106 tonnes).
Carbon Intensity (kg CO 2/kWh): This is the amount of carbon dioxide that will be released per kWh of energy of a given fuel. For most fossil fuels the value of this is almost constant, but in the case of electricity it will depend on the fuel mix used to generate the electricity and also on the efficiency of the technology employed. Renewable sources of electricity generation, such as hydro and wind, have zero carbon intensity.
Weather Correction: Annual variations in weather affect the space heating requirements of occupied buildings. Weather correction involves adjusting the energy used for space heating by benchmarking the climate in a particular year with that of a long-term average measured in terms of number of degree days.
Combined Heat & Power Plants: Combined heat and power (CHP) refers to plants which are designed to produce both heat and electricity. CHP plants may be autoproducer (generating for own use only) or third-party owned selling electricity and heat on-site as well as exporting electricity to the grid.
Energy Intensity: The amount of energy used per unit of activity. Examples of activity used in this report are gross domestic product (GDP), value added, number of households, employees etc. Where possible, the monetary values used are in constant prices.
Gross and Net Calorific Value (GCV & NCV): The gross calorific value (GCV) gives the maximum theoretical heat release during combustion, including the heat of condensation of the water vapour produced during combustion. This water is produced by the combustion of the hydrogen in the fuel with oxygen to give H2O (water). The net calorific value (NCV) excludes this heat of condensation because it cannot be recovered in conventional boilers. For natural gas, the difference between GCV and NCV is about 10%, for oil it is approximately 5%.
Gross Domestic Product: The gross domestic product represents the total output of the economy over a period.
Gross Final Consumption (GFC): The Renewable Energy Directive (2008/28/EC) defines gross final consumption of energy as the energy commodities delivered for energy purposes to manufacturing industry, transport, households, services, agriculture, forestry and fisheries, including the consumption of electricity and heat by the energy branch for electricity and heat production and including losses of electricity and heat in distribution.
Gross Electrical Consumption: Gross electricity production is measured at the terminals of all alternator sets in a station; it therefore includes the energy taken by station auxiliaries and losses in transformers that are considered integral parts of the station. The difference between gross and net production is the amount of own use of electricity in the generation plants.
Heating Degree Days: "Degree Days" is the measure or index used to take account of the severity of the weather when looking at energy use in terms of heating (or cooling) "load" on a building. A "Degree Day" is an expression of how cold (or warm) it is outside, relative to a day on which little or no heating (or cooling) would be required. It is thus a measure of cumulative temperature deficit (or surplus) of the outdoor temperature relative to a neutral target temperature (base temperature) at which no heating or cooling would be required.
Nominal and Real Values: Nominal value refers to the current value expressed in money terms in a given year, whereas real value adjusts nominal value to remove effects of price changes and inflation to give the constant value over time indexed to a reference year.
Structural Effect: As it affects energy intensity, structural change is a change in the shares of activity accounted for by the energy consuming sub-sectors within a sector. For instance, in industry the structural effect caused by the change in emphasis of individual sub-sectors such as pharmaceuticals, electronics, textiles, steel etc in their contribution to gross domestic product.
Total Final Consumption (TFC): This is the energy used by the final consuming sectors of industry, transport, residential, agriculture and services. It excludes the energy sector such as electricity generation and oil refining etc.
Total Primary Energy Requirement (TPER): This is the total requirement for all uses of energy, including energy used to transform one energy form to another (eg burning fossil fuel to generate electricity) and energy used by the final consumer.
Value Added: Value added is an economic measure of output. The value added of industry, for instance, is the additional value created by the production process through the application of labour and capital. It is defined as the value of industry’s output of goods and services less the value of the intermediate consumptions of goods (raw materials, fuel, etc) and services.
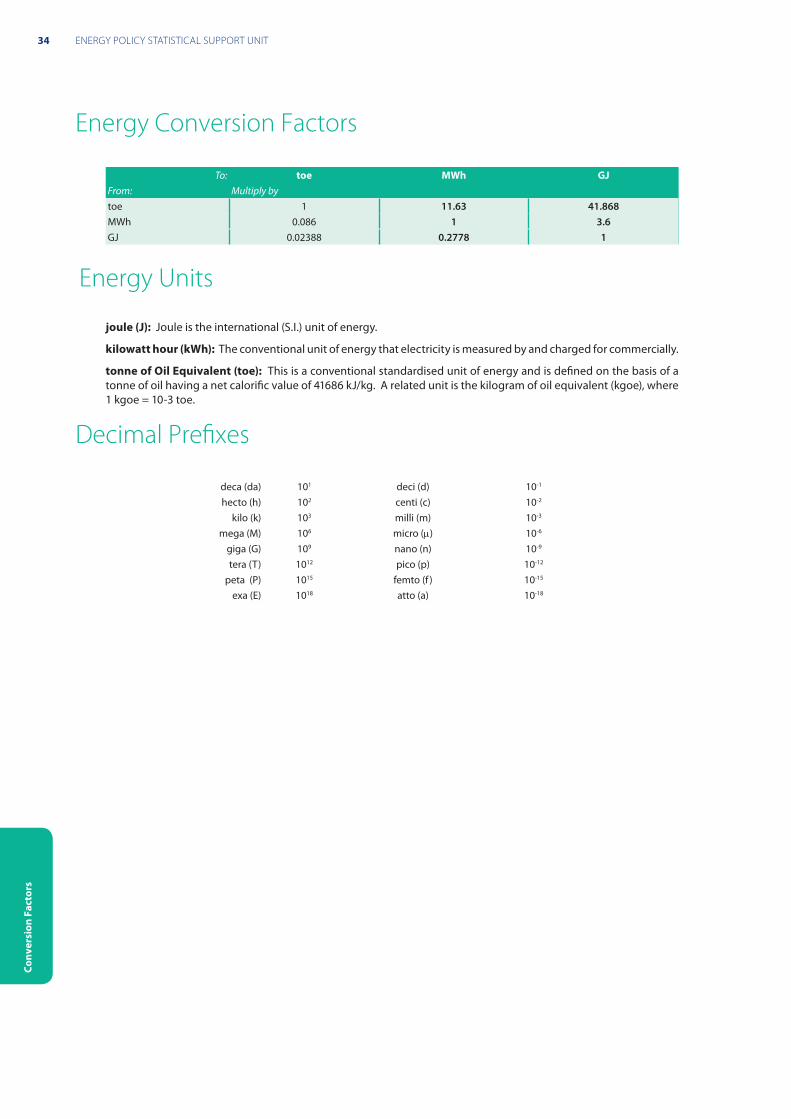
34 ENERGY POLICY STATISTICAL SUPPORT UNIT
Conv
ersi
on F
acto
rs
Energy Conversion Factors
To: toe MWh GJFrom: Multiply bytoe 1 11.63 41.868MWh 0.086 1 3.6GJ 0.02388 0.2778 1
Energy Units
joule (J): Joule is the international (S.I.) unit of energy.
kilowatt hour (kWh): The conventional unit of energy that electricity is measured by and charged for commercially.
tonne of Oil Equivalent (toe): This is a conventional standardised unit of energy and is defined on the basis of a tonne of oil having a net calorific value of 41686 kJ/kg. A related unit is the kilogram of oil equivalent (kgoe), where 1 kgoe = 10-3 toe.
Decimal Prefixes
deca (da) 101 deci (d) 10-1 hecto (h) 102 centi (c) 10-2
kilo (k) 103 milli (m) 10-3
mega (M) 106 micro (µ) 10-6
giga (G) 109 nano (n) 10-9
tera (T) 1012 pico (p) 10-12
peta (P) 1015 femto (f ) 10-15
exa (E) 1018 atto (a) 10-18
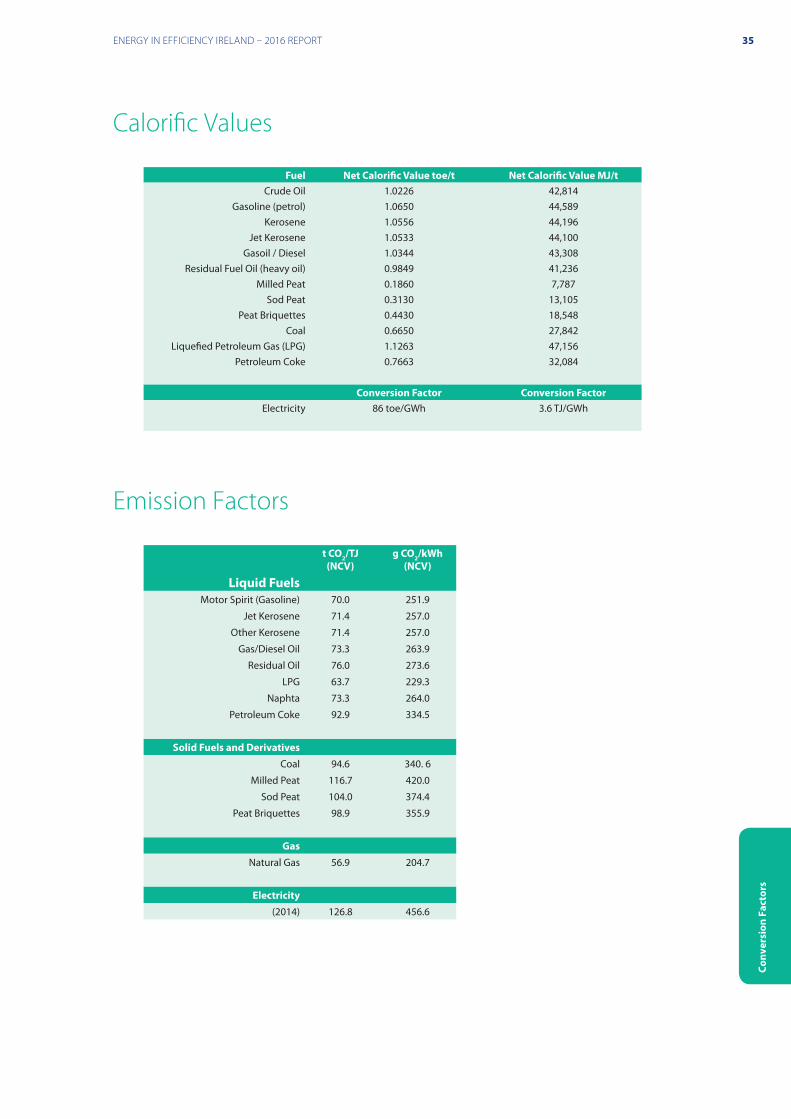
35ENERGY IN EFFICIENCY IRELAND – 2016 REPORT
Conv
ersi
on F
acto
rs
Calorific Values
Fuel Net Calorific Value toe/t Net Calorific Value MJ/tCrude Oil 1.0226 42,814
Gasoline (petrol) 1.0650 44,589Kerosene 1.0556 44,196
Jet Kerosene 1.0533 44,100Gasoil / Diesel 1.0344 43,308
Residual Fuel Oil (heavy oil) 0.9849 41,236Milled Peat 0.1860 7,787
Sod Peat 0.3130 13,105Peat Briquettes 0.4430 18,548
Coal 0.6650 27,842Liquefied Petroleum Gas (LPG) 1.1263 47,156
Petroleum Coke 0.7663 32,084
Conversion Factor Conversion FactorElectricity 86 toe/GWh 3.6 TJ/GWh
Emission Factors
t CO2/TJ(NCV)
g CO2/kWh (NCV)
Liquid FuelsMotor Spirit (Gasoline) 70.0 251.9
Jet Kerosene 71.4 257.0
Other Kerosene 71.4 257.0
Gas/Diesel Oil 73.3 263.9
Residual Oil 76.0 273.6
LPG 63.7 229.3
Naphta 73.3 264.0
Petroleum Coke 92.9 334.5
Solid Fuels and DerivativesCoal 94.6 340. 6
Milled Peat 116.7 420.0
Sod Peat 104.0 374.4
Peat Briquettes 98.9 355.9
GasNatural Gas 56.9 204.7
Electricity(2014) 126.8 456.6
36 ENERGY POLICY STATISTICAL SUPPORT UNIT
Refe
renc
es
References
Ademe, European Commission (2005), Energy Efficiency Monitoring in the EU-15, Paris: Ademe.
Bosseboeuf D. et al (2005), Energy Efficiency Monitoring in the EU-15, published by ADEME and the European Commission. Available from: www.ODYSSEE-indicators.org
Bosseboeuf D., Lapillonne B., Eichhammer W. and Landwehr M. (1999), Energy Efficiency Indicators – The European Experience, Paris: Ademe.
Bosseboeuf D., Lapillonne Dr B., Desbrosses N., 2007, Top Down Evaluative Methods for Monitoring Energy Savings, EMEEES European Expert Group Meeting, La Colle-sur-Loup.
Central Statistics Office (2012), Census 2011 Profile 4 The Roof over our Heads - Housing in Ireland, http://www.cso.ie/census/2011_preliminaryreport.htm
Central Statistics Office (2012), National Income and Expenditure – Annual Results for 2011, http://www.cso.ie/en/media/csoie/releasespublications/documents/economy/2011/nie2011.pdf.
Central Statistics Office (2012), Planning Permissions Quarter 1 2012, http://www.cso.ie/en/media/csoie/releasespublications/documents/construction/2012/planperm_q22012.pdf.
Central Statistics Office (2007), Census 2006 Volume 3 – Household Composition, Family Units and Fertility, http://www.cso.ie/census/Census2006Results.htm
Central Statistics Office (2007), Census 2006 Volume 6 – Housing, http://www.cso.ie/en/census/census2006reports/census2006volume6-housing/
Commission for Energy Regulation (Nov. 2011), Generation System Performance Report: Quarter 4, 2011, http://www.cer.ie/docs/000281/cer12001.pdf
Commission of the European Communities (1998), COM(98)353 Climate Change – Towards an EU Post-Kyoto Strategy, http://eur-lex.europa.eu/legal-content/EN/TXT/PDF/?uri=CELEX:51998DC0353&from=EN
Commission of the European Communities (1997), A Community Strategy to Promote Combined Heat and Power and to Dismantle Barriers to its Development, http://eur-lex.europa.eu/legal-content/EN/TXT/PDF/?uri=CELEX:31998Y0108(01)&from=EN
Commission of the European Communities (1997), COM(97)599 Energy for the Future: Renewable Sources of Energy – White Paper for a Community Strategy and Action Plan, http://europa.eu/documents/comm/white_papers/pdf/com97_599_en.pdf
Department of Communications, Energy and Natural Resources (2011), Biofuel Obligation Scheme. http://www.dcenr.gov.ie/Energy/Sustainable+and+Renewable+Energy+Division/Biofuels/
Department of Communications, Energy & Natural Resources (2007), Energy White Paper 2007 - Delivering a Sustainable Energy Future for Ireland, http://www.dcmnr.gov.ie/NR/rdonlyres/54C78A1E-4E96-4E28-A77A-3226220DF2FC/27356/EnergyWhitePaper12March2007.pdf
Department of Communications, Energy & Natural Resources and Sustainable Energy Ireland (2006), Bioenergy in Ireland, http://www.seai.ie/
Duffy P., Hanley E., Hyde B., O’Brien P., Ponzi J., Cotter E., and Black K. , (2012), Ireland National Inventory Report 2012, http://erc.epa.ie/ghg/nirdownloads.jsp.
EirGrid (2011), All Island Generation Capacity Statement 2012 – 2021, http://www.eirgrid.com/media/All-Island%20GCS%202012-2021.pdf
European Environment Agency, 2012, Monitoring CO2 emissions from new passenger cars in the EU: summary data for 2011, http://www.eea.europa.eu/publications/monitoring-co2-emissions-from-new
European Union (2009), DECISION No 406/2009/EC on the effort of Member States to reduce their greenhouse gas emissions to meet the Community’s greenhouse gas emission reduction commitments up to 2020, http://eur-lex.europa.eu/LexUriServ/LexUriServ.do?uri=OJ:L:2009:140:0016:0062:EN:PDF
European Union (2009), Directive 2009/28/EC on the Promotion of the Use of Energy from Renewable Sources, http://eur-lex.europa.eu/LexUriServ/LexUriServ.do?uri=OJ:L:2009:140:0016:0062:EN:PDF
European Union (2007), Decision 2007/394/EC methodology to be applied for the collection of gas and electricity prices charged to industrial end-users, http://eur-lex.europa.eu/LexUriServ/LexUriServ.do?uri=OJ:L:2007:148:0011:0016
37ENERGY IN EFFICIENCY IRELAND – 2016 REPORT
Refe
renc
es
:EN:PDF.
European Union (2006), Directive 2006/32/EC Energy End-use Efficiency and Energy Services, http://eur-lex.europa.eu/LexUriServ/LexUriServ.do?uri=OJ:L:2006:114:0064:0064:EN:PDF.
European Union (2004), Directive 2004/8/EC of the European Parliament and of the Council on the Promotion of Cogeneration based on Useful Heat Demand in the Internal Energy Market and Amending Directive 92/42/EEC, http://europa.eu.int/eur-lex/pri/en/oj/dat/2004/l_052/l_05220040221en00500060.pdf.
European Union (2003), Directive 2003/30/EC of the European Parliament and of the Council on the promotion of the use of biofuels or other renewable fuels for transport, http://eur-lex.europa.eu/LexUriServ/LexUriServ.do?uri=OJ:L:2003:123:0042:0046:EN:PDF.
European Union (2003), Directive 2003/87/EC of the European Parliament and of the Council establishing a scheme for greenhouse gas emission allowance trading within the Community and amending Council Directive 96/61/EC, http://europa.eu.int/eur-lex/pri/en/oj/dat/2003/l_275/l_27520031025en00320046.pdf.
Eurostat (2011), Energy, transport and environment indicators, http://epp.eurostat.ec.europa.eu/portal/page/portal/product_details/publication?p_product_code=KS-DK-10-001.
International Energy Agency (2015), Capturing the Multiple Benefits of Energy Efficiency, http://www.iea.org/publications/freepublications/publication/capturing-the-multiple-benefits-of-energy-efficiency.html
International Energy Agency (2014), Energy Efficiency Indicators: Fundamentals on Statistics, Paris: IEA.
International Energy Agency (2012), Energy Balances of OECD Countries 2012 Edition, Paris: IEA.
ICF Consulting & Byrne Ó Cléirigh (2004), Determining the share of national greenhouse gas emissions for emissions trading in Ireland, Department of Environment, Heritage and Local Government http://www.environ.ie/DOEI/DOEIPol.nsf/0/cf7e4b53bf0ffff280256e31003913e5/$FILE/ICFBOC Final Report on Emissions Trading.pdf
National Oil Reserves Agency (2011), Energy (Biofuel Obligation and Miscellaneous Provisions) Act 2010, http://www.nora.ie/regulations_legislation/biofuels_obligation_scheme.450.474.html
OECD / IEA / Eurostat (2005 edition), Energy Statistics Manual, Paris: OECD/International Energy Agency.
O’Rourke, Kevin. (2005), Model of the Housing Stock. Personal Communication with Energy Policy Statistical Support Unit.
Sustainable Energy Authority of Ireland (2015), Renewable Energy in Ireland – 2013 Update, http://www.seai.ie/statistics.
Sustainable Energy Authority of Ireland (2015), Understanding Electricity & Gas Prices in Ireland – 2nd Semester (July – December) 2014, http://www.seai.ie/statistics
Sustainable Energy Authority of Ireland (2014), Combined Heat and Power in Ireland – 2014 Update, www.seai.ie/statistics
Sustainable Energy Authority of Ireland (2014), Energy in Transport – 2014 Report, http://www.seai.ie/statistics.
Sustainable Energy Authority of Ireland (2013), Energy in the Residential Sector, http://www.seai.ie/statistics.
Sustainable Energy Authority of Ireland (2011), Energy Security in Ireland – A statistical overview, http://www.seai.ie/Publications/Statistics_Publications/EPSSU_Publications/.
Sustainable Energy Authority of Ireland (2009), Energy Efficiency in Ireland – 2009 Report, www.seai.ie/statistics
Sustainable Energy Authority of Ireland (2007), Energy in Industry – 2007 Report, http://www.seai.ie/statistics
Sustainable Energy Authority of Ireland (2004), Liquid Biofuels Strategy for Ireland, http://www.seai.ie/statistics
Sustainable Energy Authority of Ireland (2005), Profiling Energy and CO2 Emissions in the Services Sector, http://www.seai.ie/statistics
Sustainable Energy Authority of Ireland (2004), Profiling Energy Consumption and CO2 Emissions in Industry 2004 Update – Sensitivity to Energy Price Changes, http://www.seai.ie/statistics
UNFCCC (2003), Caring for Climate – A guide to the climate change convention and the Kyoto Protocol, http://unfccc.int/resource/cfc_guide.pdf
Vehicle Registration Unit (Department of the Environment, Heritage & Local Government), (various years), Irish Bulletin of Vehicle and Driver Statistics.

38 ENERGY POLICY STATISTICAL SUPPORT UNIT

39ENERGY IN EFFICIENCY IRELAND – 2016 REPORT

40 ENERGY POLICY STATISTICAL SUPPORT UNIT

Sustainable Energy Authority of IrelandEnergy Policy Statistical Support UnitBuilding 2100Cork Airport Business ParkCo. Cork Ireland
Sustainable Energy Authority of IrelandWilton Park HouseWilton PlaceDublin 2Ireland
t +353 1 808 2100f +353 21 240 7987
t +353 1 808 2100f +353 1 808 2002
e [email protected] www.seai.ie
e [email protected] www.seai.ie
@seai_ie
Related Documents