34 INTRODUCTORY SUMMARY Rising food prices have always made a signifi- cant contribution to inflation in Estonia. Food was, once again, behind the acceleration of the inflation rate in 2010. By December last year, consumer prices had risen by 5.7% compared to the previous year, including food, alcohol and tobacco by 3.3%, energy by 1.7% and core infla- tion components by 0.5%. Admittedly, rising commodity prices on the world market have contributed to the increase in the prices of foodstuffs, as in the previous period of rising prices (2006–2008). Many food prices have increased at a rate comparable to the one that prevailed from 2006 to 2008, or even more. This time, too, milk and cereal products, as well as vegetables, are the main contributors to infla- tion. The latter product group has been excluded from this analysis, however, because its prices have evolved in quite a similar way to other coun- tries. Unlike during the previous period of price surges, meat products have not contributed to the price increase (yet). A graphic comparison of changes in the food price level in Estonia with other EU Member States is provided in Annex 1. For many product groups (such as dairy, cereal and meat products) the price level has varied to a significantly greater extent in Estonia than in most EU Member States since 2006, indicating a possible change in food pricing. Why might the current inflation pose problems? 1) The current inflation rate in Estonia is higher than the equilibrium inflation. Considering the price level in Estonia, the neutral cycli- cal position of the economy 1 and the stable exchange rate, the equilibrium inflation could be in the order of up to 2% above the euro -1.0% -0.5% 0.0% 0.5% 1.0% 1.5% 2.0% 2.5% 2007 2008 2009 2010 2011 energy core inflation food total CPI Figure 2. Monthly contribution of consumer price index (CPI) to inflation Figure 1. Annual contribution of consumer price index (CPI) to inflation -4% -2% 0% 2% 4% 6% 8% 10% 12% 14% 2007 2008 2009 2010 2011 energy core inflation food total CPI HOW DOES THE ESTONIAN FOOD MARKET SERVE MARKET PARTICIPANTS? Martin Lindpere, Orsolya Soosaar (Eesti Pank) Kristjan Pungas (Ministry of Finance) Mario Lambing (Ministry of Economic Affairs and Communications) 1 The GDP gap and the fiscal impulse do not contribute to inflation.

Welcome message from author
This document is posted to help you gain knowledge. Please leave a comment to let me know what you think about it! Share it to your friends and learn new things together.
Transcript
34
INTROdUCTORY SUMMARY
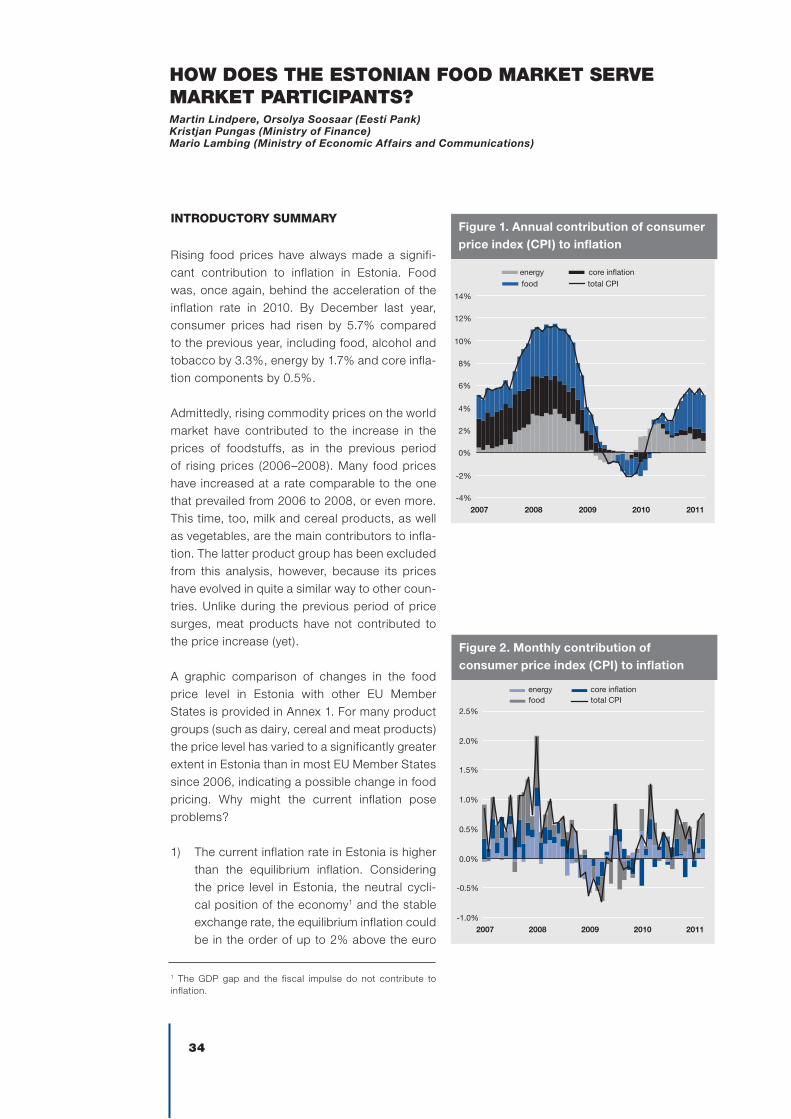
Rising food prices have always made a signifi-cant contribution to inflation in Estonia. Food was, once again, behind the acceleration of the inflation rate in 2010. By December last year, consumer prices had risen by 5.7% compared to the previous year, including food, alcohol and tobacco by 3.3%, energy by 1.7% and core infla-tion components by 0.5%.
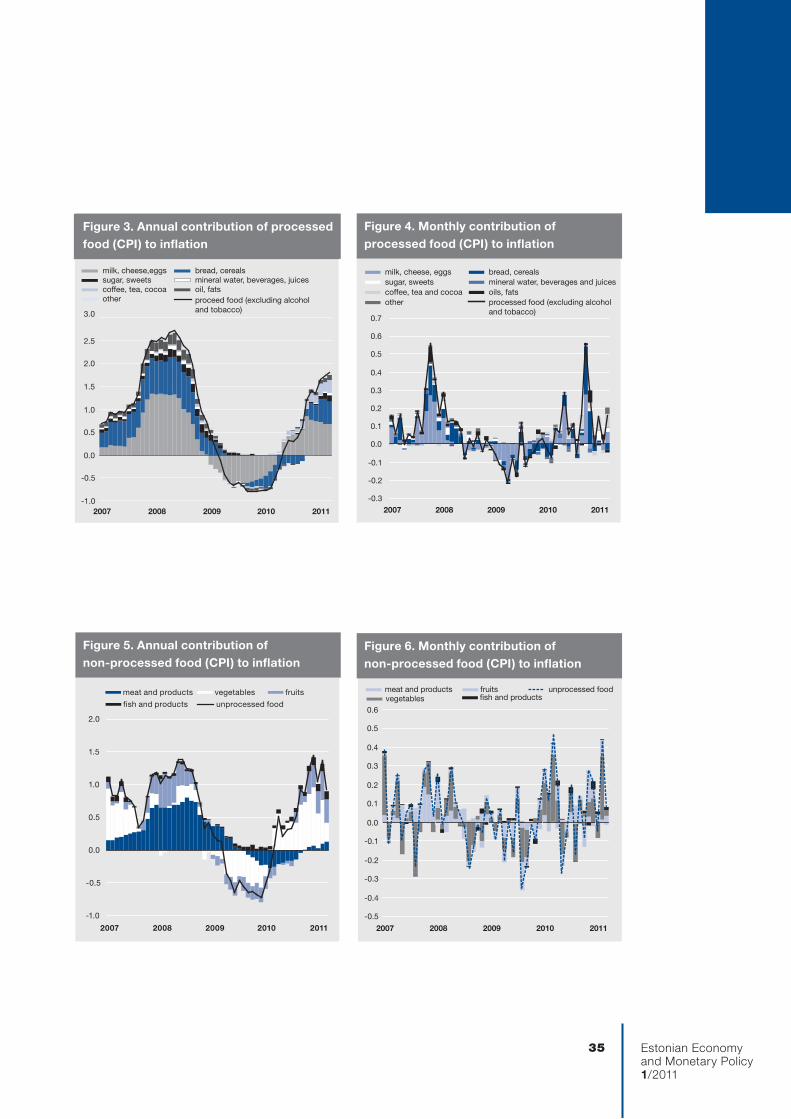
Admittedly, rising commodity prices on the world market have contributed to the increase in the prices of foodstuffs, as in the previous period of rising prices (2006–2008). Many food prices have increased at a rate comparable to the one that prevailed from 2006 to 2008, or even more. This time, too, milk and cereal products, as well as vegetables, are the main contributors to infla-tion. The latter product group has been excluded from this analysis, however, because its prices have evolved in quite a similar way to other coun-tries. Unlike during the previous period of price surges, meat products have not contributed to the price increase (yet).
A graphic comparison of changes in the food price level in Estonia with other EU Member States is provided in Annex 1. For many product groups (such as dairy, cereal and meat products) the price level has varied to a significantly greater extent in Estonia than in most EU Member States since 2006, indicating a possible change in food pricing. Why might the current inflation pose problems?
1) The current inflation rate in Estonia is higher than the equilibrium inflation. Considering the price level in Estonia, the neutral cycli-cal position of the economy1 and the stable exchange rate, the equilibrium inflation could be in the order of up to 2% above the euro
-1.0%
-0.5%
0.0%
0.5%
1.0%
1.5%
2.0%
2.5%
2007 2008 2009 2010 2011
energy core inflationfood total CPI
Figure 2. Monthly contribution of consumer price index (CpI) to inflation
Figure 1. Annual contribution of consumer price index (CpI) to inflation
-4%
-2%
0%
2%
4%
6%
8%
10%
12%
14%
2007 2008 2009 2010 2011
energy core inflationfood total CPI
HOw dOES THE ESTONIAN FOOd MARkET SERvE MARkET pARTICIpANTS?Martin Lindpere, Orsolya Soosaar (Eesti Pank)Kristjan Pungas (Ministry of Finance)Mario Lambing (Ministry of Economic Affairs and Communications)
1 The GDP gap and the fiscal impulse do not contribute to inflation.
Estonian Economyand Monetary Policy1/2011
35
-1.0
-0.5
0.0
0.5
1.0
1.5
2.0
2.5
3.0
2007 2008 2009 2010 2011
milk, cheese,eggs bread, cerealssugar, sweets mineral water, beverages, juicescoffee, tea, cocoa oil, fatsother proceed food (excluding alcohol
and tobacco)
Joonis 3. Töödeldud toidu panus (THI) inflatsiooni aastas Figure 3. Annual contribution of processed food (CpI) to inflation
-1.0
-0.5
0.0
0.5
1.0
1.5
2.0
2007 2008 2009 2010 2011
meat and products vegetables fruits
fish and products unprocessed food
Figure 5. Annual contribution of non-processed food (CpI) to inflation
-0.5
-0.4
-0.3
-0.2
-0.1
0.0
0.1
0.2
0.3
0.4
0.5
0.6
2007 2008 2009 2010 2011
meat and productsvegetables
fruitsfish and products
unprocessed food
Figure 6. Monthly contribution of non-processed food (CpI) to inflation
-0.3
-0.2
-0.1
0.0
0.1
0.2
0.3
0.4
0.5
0.6
0.7
2007 2008 2009 2010 2011
milk, cheese, eggs bread, cerealssugar, sweets mineral water, beverages and juicescoffee, tea and cocoa oils, fatsother processed food (excluding alcohol
and tobacco)
Figure 4. Monthly contribution of processed food (CpI) to inflation
36
area average.2 However, as the GDP gap (as well as the relative GDP gap compared to the euro area) was strongly negative in 2010, the inflation differential between Esto-nia and the euro area should currently be even lower, according to this calculation. In December, Estonia’s inflation rate was 5.4% under the Harmonised Index of Consumer Prices (HICP) compared to 2.2% in the euro area. An inflation rate exceeding that of equi-librium inflation could result in wasteful or even inappropriate deployment of resources in the economy. Indications of such a trend are quite limited at the moment, though.
2) A higher inflation rate is not conducive to the recovery of the Estonian economy from the recession. A very narrow-based (mainly food) and strong price increase will redis-tribute money within the economy. While the income of a small number of market partici-pants is increasing, the purchasing power of the vast majority of households is decreas-ing. The increase in the real spending of those benefitting from the price surges will probably be lower than the contraction of the real spending of the ones whose pur-chasing power is diminishing, which means that, overall, economic growth will suffer.
3) Having been among the countries with a low inflation rate, last year Estonia became one of the Member States of the European Union in which inflation was highest. This might lead to a reputation risk, especially in light of the introduction of the euro. Continuing rapid price advances over a longer term will reduce the competitiveness of the economy.
4) In comparison to many other countries, retail food prices have demonstrated much greater
2 From 1996 to 2009, the average inflation differential between Estonia and the euro area ranged between 0.5% and 0.8% per 10% price level difference. Thus, when the price level in Estonia accounted for 50% of the euro area average, the equilibrium inflation rate in Estonia was 2.5–4% above the inflation in the euro area. Source: Inflation Differentials Between Eastern and Western Europe: Should the Maastricht Inflation Criterion Be Adapted?, M. Lindpere, mimeo.
instability in Estonia in recent years. Volatility in prices could discourage investments, reducing the response of food supply to price increases.
The project aims to analyse the causes of the acceleration of food price advances in 2010, looking back at the previous boom as well. Food price formation is analysed from three different angles, and margins are calculated for selected product groups.
1) We evaluate the rate and extent of the pass-through of commodity prices to producer and consumer prices in Estonia.
2) We evaluate the impact of food exports on food prices.
3) We evaluate the intensity of competition in the food supply chain and its potential impact on food prices.
The following are the main findings and some conclusions of the different parts of the analysis.
1) Commodities play a major role in the formation of the cost price of foodstuffs. Compared to the impact of commodities, the tax changes introduced in recent years play an insignificant role in changes to cost price. The same can be said about the energy input of the supply chain, although the opening up of the electricity market in 2010 resulted in price increases. The contribution of labour costs to food price increases has been modest as well, amounting to a couple of percent during the years of fast growth in wages.
2) Changes in the margins of processing com-panies and retailers have made inflation in Estonia more volatile, weakening or amplify-ing the pass-through of cost price changes to the consumer prices of food. In differ-ent periods this factor may have had a far more significant impact on changes in the prices of some products compared to the contribution of commodities. The margins of selected foodstuffs suggest that trading
Estonian Economyand Monetary Policy1/2011
37
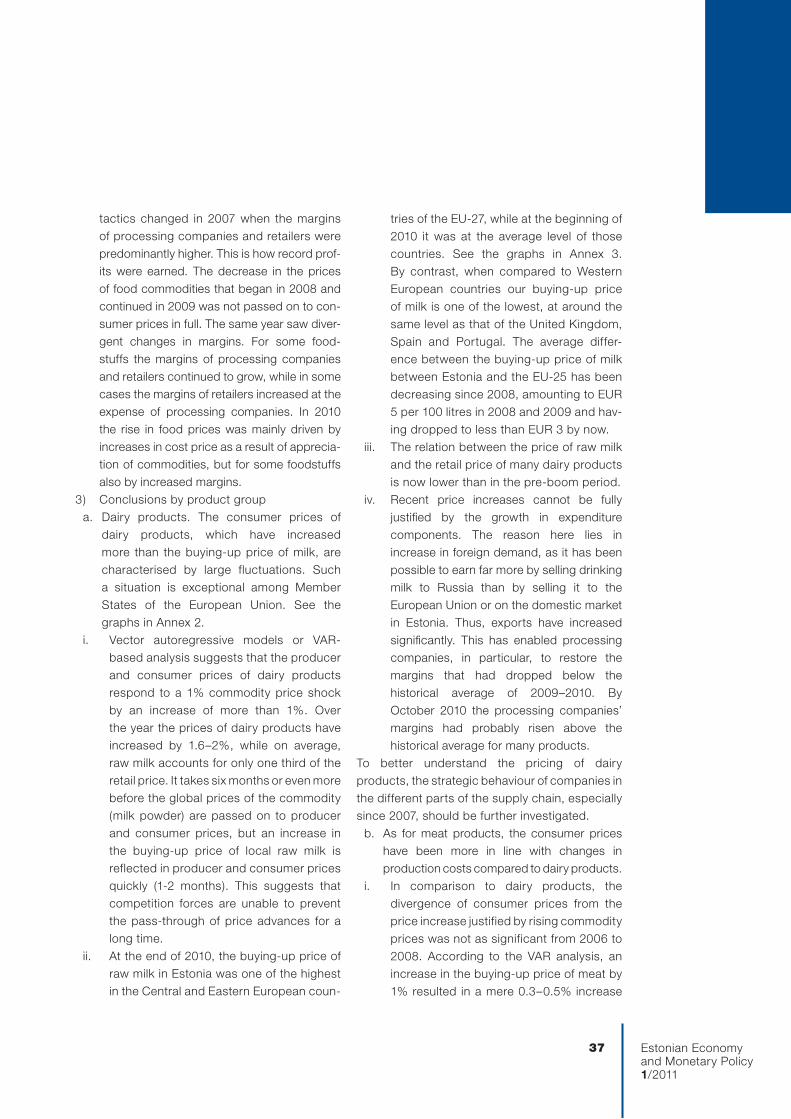
tactics changed in 2007 when the margins of processing companies and retailers were predominantly higher. This is how record prof-its were earned. The decrease in the prices of food commodities that began in 2008 and continued in 2009 was not passed on to con-sumer prices in full. The same year saw diver-gent changes in margins. For some food-stuffs the margins of processing companies and retailers continued to grow, while in some cases the margins of retailers increased at the expense of processing companies. In 2010 the rise in food prices was mainly driven by increases in cost price as a result of apprecia-tion of commodities, but for some foodstuffs also by increased margins.
3) Conclusions by product groupa. Dairy products. The consumer prices of
dairy products, which have increased more than the buying-up price of milk, are characterised by large fluctuations. Such a situation is exceptional among Member States of the European Union. See the graphs in Annex 2.
i. Vector autoregressive models or VAR-based analysis suggests that the producer and consumer prices of dairy products respond to a 1% commodity price shock by an increase of more than 1%. Over the year the prices of dairy products have increased by 1.6–2%, while on average, raw milk accounts for only one third of the retail price. It takes six months or even more before the global prices of the commodity (milk powder) are passed on to producer and consumer prices, but an increase in the buying-up price of local raw milk is reflected in producer and consumer prices quickly (1-2 months). This suggests that competition forces are unable to prevent the pass-through of price advances for a long time.
ii. At the end of 2010, the buying-up price of raw milk in Estonia was one of the highest in the Central and Eastern European coun-
tries of the EU-27, while at the beginning of 2010 it was at the average level of those countries. See the graphs in Annex 3. By contrast, when compared to Western European countries our buying-up price of milk is one of the lowest, at around the same level as that of the United Kingdom, Spain and Portugal. The average differ-ence between the buying-up price of milk between Estonia and the EU-25 has been decreasing since 2008, amounting to EUR 5 per 100 litres in 2008 and 2009 and hav-ing dropped to less than EUR 3 by now.
iii. The relation between the price of raw milk and the retail price of many dairy products is now lower than in the pre-boom period.
iv. Recent price increases cannot be fully justified by the growth in expenditure components. The reason here lies in increase in foreign demand, as it has been possible to earn far more by selling drinking milk to Russia than by selling it to the European Union or on the domestic market in Estonia. Thus, exports have increased significantly. This has enabled processing companies, in particular, to restore the margins that had dropped below the historical average of 2009–2010. By October 2010 the processing companies’ margins had probably risen above the historical average for many products.
To better understand the pricing of dairy products, the strategic behaviour of companies in the different parts of the supply chain, especially since 2007, should be further investigated.
b. As for meat products, the consumer prices have been more in line with changes in production costs compared to dairy products.
i. In comparison to dairy products, the divergence of consumer prices from the price increase justified by rising commodity prices was not as significant from 2006 to 2008. According to the VAR analysis, an increase in the buying-up price of meat by 1% resulted in a mere 0.3–0.5% increase
38
in producer and consumer prices of meat products from 2002 to 2010 on average.
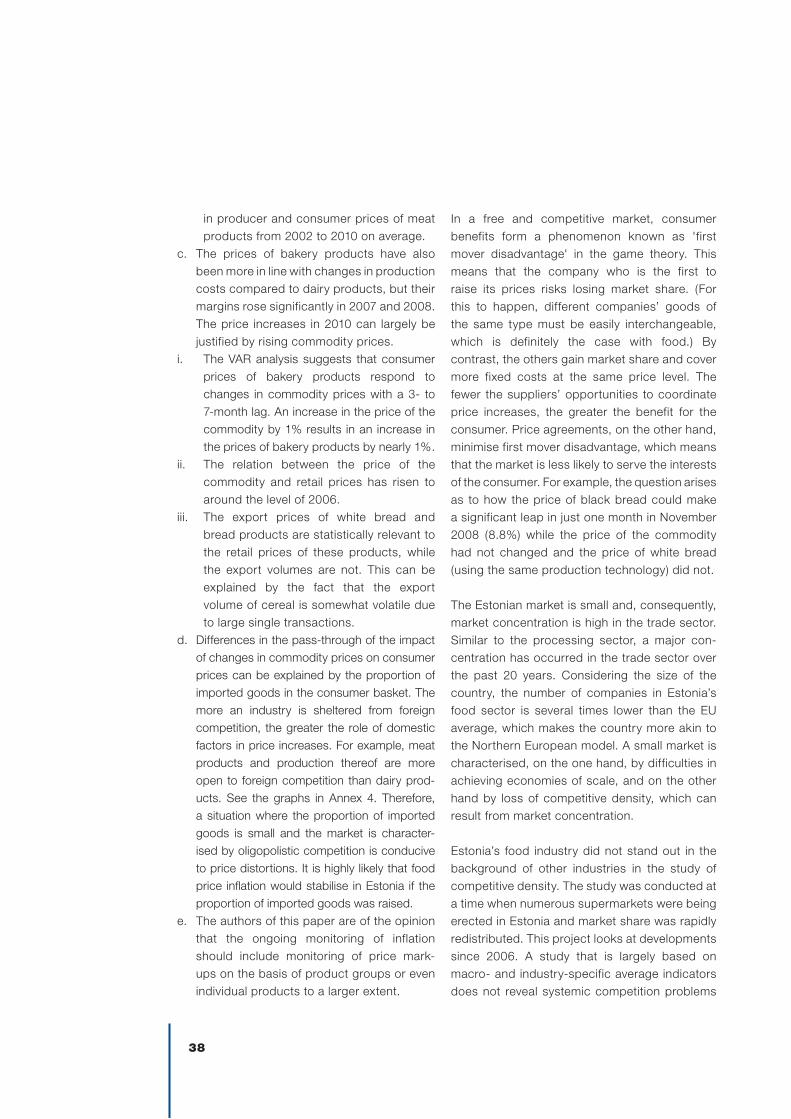
c. The prices of bakery products have also been more in line with changes in production costs compared to dairy products, but their margins rose significantly in 2007 and 2008. The price increases in 2010 can largely be justified by rising commodity prices.
i. The VAR analysis suggests that consumer prices of bakery products respond to changes in commodity prices with a 3- to 7-month lag. An increase in the price of the commodity by 1% results in an increase in the prices of bakery products by nearly 1%.
ii. The relation between the price of the commodity and retail prices has risen to around the level of 2006.
iii. The export prices of white bread and bread products are statistically relevant to the retail prices of these products, while the export volumes are not. This can be explained by the fact that the export volume of cereal is somewhat volatile due to large single transactions.
d. Differences in the pass-through of the impact of changes in commodity prices on consumer prices can be explained by the proportion of imported goods in the consumer basket. The more an industry is sheltered from foreign competition, the greater the role of domestic factors in price increases. For example, meat products and production thereof are more open to foreign competition than dairy prod-ucts. See the graphs in Annex 4. Therefore, a situation where the proportion of imported goods is small and the market is character-ised by oligopolistic competition is conducive to price distortions. It is highly likely that food price inflation would stabilise in Estonia if the proportion of imported goods was raised.
e. The authors of this paper are of the opinion that the ongoing monitoring of inflation should include monitoring of price mark-ups on the basis of product groups or even individual products to a larger extent.
In a free and competitive market, consumer benefits form a phenomenon known as 'first mover disadvantage' in the game theory. This means that the company who is the first to raise its prices risks losing market share. (For this to happen, different companies’ goods of the same type must be easily interchangeable, which is definitely the case with food.) By contrast, the others gain market share and cover more fixed costs at the same price level. The fewer the suppliers’ opportunities to coordinate price increases, the greater the benefit for the consumer. Price agreements, on the other hand, minimise first mover disadvantage, which means that the market is less likely to serve the interests of the consumer. For example, the question arises as to how the price of black bread could make a significant leap in just one month in November 2008 (8.8%) while the price of the commodity had not changed and the price of white bread (using the same production technology) did not.
The Estonian market is small and, consequently, market concentration is high in the trade sector. Similar to the processing sector, a major con-centration has occurred in the trade sector over the past 20 years. Considering the size of the country, the number of companies in Estonia’s food sector is several times lower than the EU average, which makes the country more akin to the Northern European model. A small market is characterised, on the one hand, by difficulties in achieving economies of scale, and on the other hand by loss of competitive density, which can result from market concentration.
Estonia’s food industry did not stand out in the background of other industries in the study of competitive density. The study was conducted at a time when numerous supermarkets were being erected in Estonia and market share was rapidly redistributed. This project looks at developments since 2006. A study that is largely based on macro- and industry-specific average indicators does not reveal systemic competition problems
Estonian Economyand Monetary Policy1/2011
39
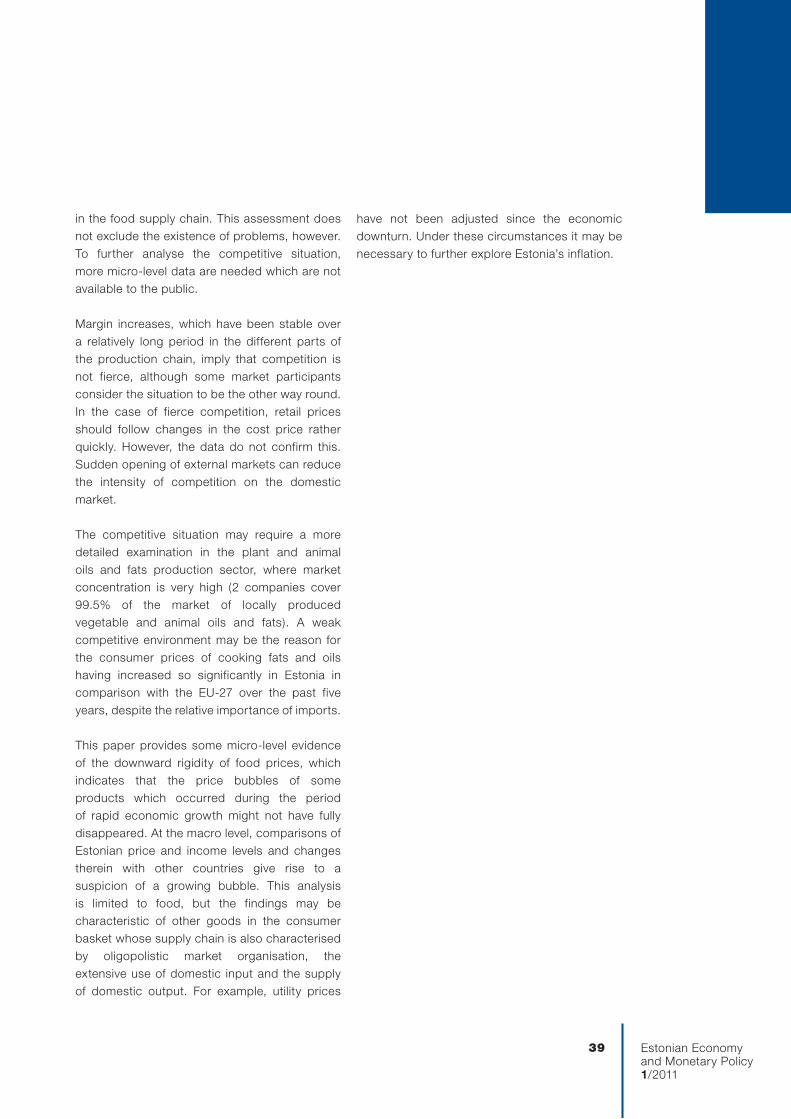
in the food supply chain. This assessment does not exclude the existence of problems, however. To further analyse the competitive situation, more micro-level data are needed which are not available to the public.
Margin increases, which have been stable over a relatively long period in the different parts of the production chain, imply that competition is not fierce, although some market participants consider the situation to be the other way round. In the case of fierce competition, retail prices should follow changes in the cost price rather quickly. However, the data do not confirm this. Sudden opening of external markets can reduce the intensity of competition on the domestic market.
The competitive situation may require a more detailed examination in the plant and animal oils and fats production sector, where market concentration is very high (2 companies cover 99.5% of the market of locally produced vegetable and animal oils and fats). A weak competitive environment may be the reason for the consumer prices of cooking fats and oils having increased so significantly in Estonia in comparison with the EU-27 over the past five years, despite the relative importance of imports.
This paper provides some micro-level evidence of the downward rigidity of food prices, which indicates that the price bubbles of some products which occurred during the period of rapid economic growth might not have fully disappeared. At the macro level, comparisons of Estonian price and income levels and changes therein with other countries give rise to a suspicion of a growing bubble. This analysis is limited to food, but the findings may be characteristic of other goods in the consumer basket whose supply chain is also characterised by oligopolistic market organisation, the extensive use of domestic input and the supply of domestic output. For example, utility prices
have not been adjusted since the economic downturn. Under these circumstances it may be necessary to further explore Estonia’s inflation.
40
pART I. COMMOdITy pRICES ANd REASONS FOR THEIR INFlATION, pRIMARIly IN 2010
During the economic boom in 2007 and 2008 the retail prices of food experienced a high growth cycle around the world. Many food articles appreciated significantly even in the second half of 2010. The most common explanation for the price increases is the appreciation of commodities caused by both supply and demand factors. Although the share of commodity prices in production costs decreases along the production chain, food commodities originating from the agricultural sector (raw milk, meat and cereals) continue to represent a significant part of the retail price of food. Fluctuations in the prices of commodities are reflected in the retail prices of foodstuffs with a lag and to a lesser extent. The immediate pass-through of price shocks is prevented by long-term supply contracts, the length of the production process and uncertainty about the duration of the shock. In Estonia and the other Baltic States, food prices increased during the previous boom far more than the EU average, and the price surge accelerated more than in other countries even in the last quarter of 2010. The extent to which the increase in retail prices in Estonia at the time can be blamed on the appreciation of internationally traded commodities is an important empirical question. Evaluation of the impact of commodity prices and the dynamics of its pass-through provides important added value in terms of predicting increases in consumer prices.
In this paper, we first calculate the hypothetical growth of consumer prices if the entire commodity price shock were passed on to them one-to-one, i.e. the ceiling of the impact of commodity prices. To this end, we use a methodology that is similar to the one applied in the study published by the Institute of Economic Research in 2008 titled “Formation of food prices and changes of margins in the value chain”3. First, based on the cost structure of industry and retailing, we calculate the share of the cost of commodities, labour and energy in the retail price. Then, based on the prices and shares of
production costs, we find the increase in the retail price wherein the relation between production costs and retail price remains unchanged, and compare the results with actual price developments. Unlike the Institute of Economic Research, we look at price developments over several years, as this gives a better overview of the timing of the pass-through of commodity price inflation.
To assess the pass-through we then use a structural VAR model inspired by the linear version of the model described in the research published by the European Central Bank in spring 2010.4 This is a simplified approach, since the pass-through of commodity prices need not be linear – large and sustained price shocks are more likely to be passed on than temporary and smaller ones. This can be explained by e.g. menu cost: changing prices result in costs that can make responding to small and temporary changes in prices unprofitable. Thus, a linear VAR model would overestimate the impact of small commodity price shocks and underestimate the impact of large commodity price shocks. In Estonia’s situation, empirical analysis is also rendered difficult by the relatively short time series, plus an important change relating to accession to the European Union in May 2004. Very short time series affect the reliability of the estimates of parameters and prevent the assessment of equations with excessively long lags.
COMMOdITY pRICES
To select the commodity indices that are the most relevant for Estonia is a difficult task, as food commodities and the derivatives based on them are traded on many exchanges around the world. Due to the common agricultural policy, not all fluctuations in world market prices are passed on to commodity prices in EU Member States. For instance, intervention prices prevent the buying-up prices of some commodity groups
3 http://www.agri.ee/public/juurkataloog/UURINGUD/eki_muud_uuringud/Toidukaupade_hindade_kujunemine_ja_marginaalide_muutused_vaartusahelas.pdf (in Estonian only).
4 http://www.ecb.europa.eu/pub/pdf/scpwps/ecbwp1168.pdf.
Estonian Economyand Monetary Policy1/2011
41
dropping below a specified level. Full convergence of prices, as well as the pass-through of short-term fluctuations, is prevented by transport costs. The shorter the shelf life of commodities, the more they are sold on the local market.
In Estonia, local farmers cover a large part of the needs of the food industry, and the local buying-up price is essentially the commodity price for the industry. Buying-up prices may be considered a connecting link that follows the prices of foreign commodities in the price chain. In an open econ-omy, the arbitrage opportunity ensures that these prices do not differ from export and import prices over a longer period, taking into account transport costs. We will now compare the buying-up prices of milk, meat and cereals in Estonia and the prices of foreign commodities, using the average EU buying-up prices published by the European Commission as approximations. Their advantage is the impact of agricultural policy measures; in addition, other EU Members States constitute most of Estonia’s export and import markets.
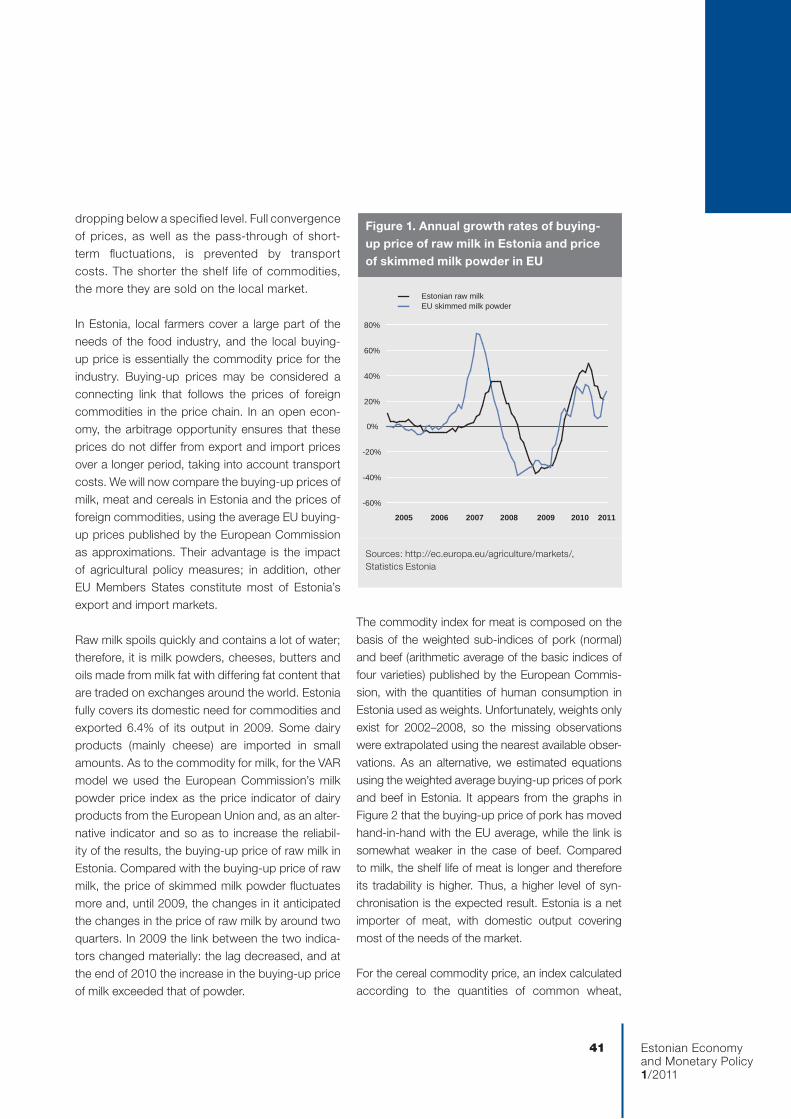
Raw milk spoils quickly and contains a lot of water; therefore, it is milk powders, cheeses, butters and oils made from milk fat with differing fat content that are traded on exchanges around the world. Estonia fully covers its domestic need for commodities and exported 6.4% of its output in 2009. Some dairy products (mainly cheese) are imported in small amounts. As to the commodity for milk, for the VAR model we used the European Commission’s milk powder price index as the price indicator of dairy products from the European Union and, as an alter-native indicator and so as to increase the reliabil-ity of the results, the buying-up price of raw milk in Estonia. Compared with the buying-up price of raw milk, the price of skimmed milk powder fluctuates more and, until 2009, the changes in it anticipated the changes in the price of raw milk by around two quarters. In 2009 the link between the two indica-tors changed materially: the lag decreased, and at the end of 2010 the increase in the buying-up price of milk exceeded that of powder.
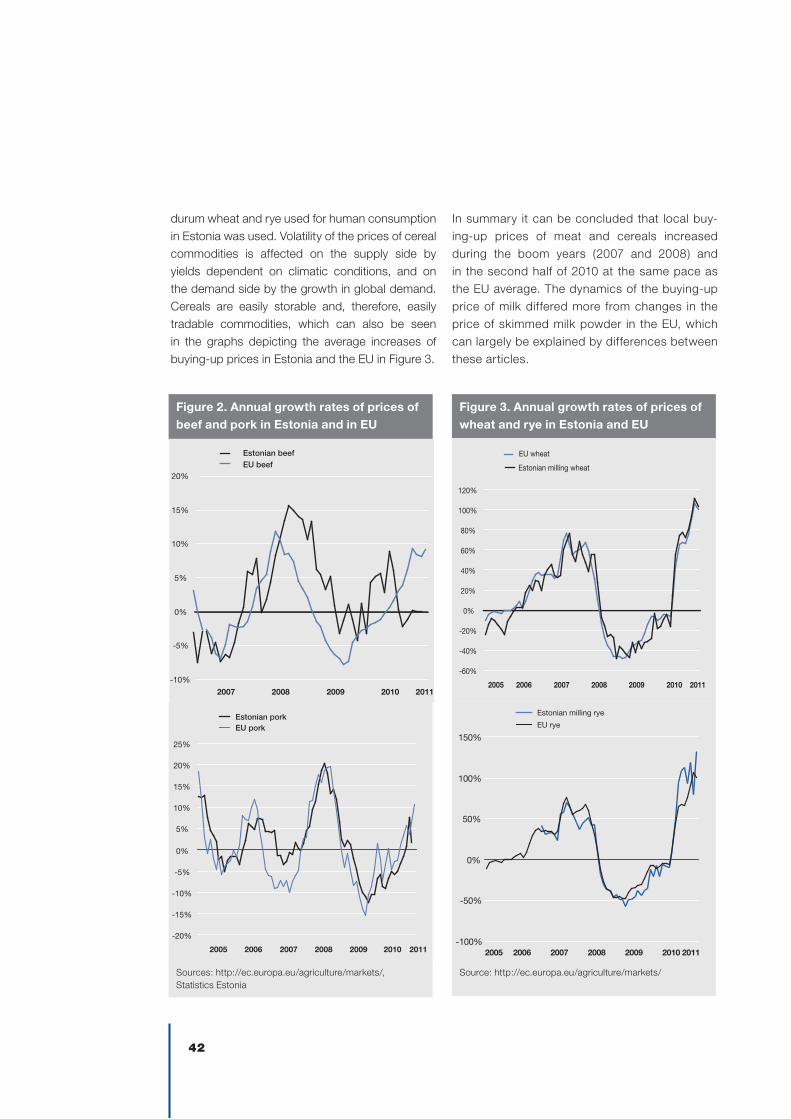
The commodity index for meat is composed on the basis of the weighted sub-indices of pork (normal) and beef (arithmetic average of the basic indices of four varieties) published by the European Commis-sion, with the quantities of human consumption in Estonia used as weights. Unfortunately, weights only exist for 2002–2008, so the missing observations were extrapolated using the nearest available obser-vations. As an alternative, we estimated equations using the weighted average buying-up prices of pork and beef in Estonia. It appears from the graphs in Figure 2 that the buying-up price of pork has moved hand-in-hand with the EU average, while the link is somewhat weaker in the case of beef. Compared to milk, the shelf life of meat is longer and therefore its tradability is higher. Thus, a higher level of syn-chronisation is the expected result. Estonia is a net importer of meat, with domestic output covering most of the needs of the market.
For the cereal commodity price, an index calculated according to the quantities of common wheat,
Figure 1. Annual growth rates of buying-up price of raw milk in Estonia and price of skimmed milk powder in EU
-60%
-40%
-20%
0%
20%
40%
60%
80%
2005 2006 2007 2008 2009 2010 2011
Estonian raw milkEU skimmed milk powder
Sources: http://ec.europa.eu/agriculture/markets/, Statistics Estonia
42
Figure 3. Annual growth rates of prices of wheat and rye in Estonia and EU
-60%
-40%
-20%
0%
20%
40%
60%
80%
100%
120%
2005 2006 2007 2008 2009 2010 2011
EU wheat
Estonian milling wheat
Source: http://ec.europa.eu/agriculture/markets/
-100%
-50%
0%
50%
100%
150%
2005 2006 2007 2008 2009 2010 2011
Estonian milling rye
EU rye
Figure 2. Annual growth rates of prices of beef and pork in Estonia and in EU
-20%
-15%
-10%
-5%
0%
5%
10%
15%
20%
25%
2005 2006 2007 2008 2009 2010 2011
Estonian porkEU pork
-10%
-5%
0%
5%
10%
15%
20%
2007 2008 2009 2010 2011
Estonian beef EU beef
Sources: http://ec.europa.eu/agriculture/markets/, Statistics Estonia
durum wheat and rye used for human consumption in Estonia was used. Volatility of the prices of cereal commodities is affected on the supply side by yields dependent on climatic conditions, and on the demand side by the growth in global demand. Cereals are easily storable and, therefore, easily tradable commodities, which can also be seen in the graphs depicting the average increases of buying-up prices in Estonia and the EU in Figure 3.
In summary it can be concluded that local buy-ing-up prices of meat and cereals increased during the boom years (2007 and 2008) and in the second half of 2010 at the same pace as the EU average. The dynamics of the buying-up price of milk differed more from changes in the price of skimmed milk powder in the EU, which can largely be explained by differences between these articles.
Estonian Economyand Monetary Policy1/2011
43
Table 1. Relation of production costs to retail revenue
processing and preserving of meat and production of meat products
2005 2006 2007 2008 2009
Materials, supplies and intermediate goods 70.4% 67.7% 66.1% 67.0% 66.3%
Electricity 1.4% 1.3% 1.2% 1.2% 1.5%
Fuel and energy 1.7% 1.7% 1.8% 2.2% 1.7%
Labour costs 11.1% 11.7% 13.2% 13.6% 13.9%
production of dairy products
2005 2006 2007 2008 2009
Raw milk 48.0% 46.0% 43.4% 42.6% 42.1%
Electricity 1.1% 1.0% 0.9% 0.9% 1.2%
Fuel and energy 2.1% 1.9% 1.7% 2.1% 1.9%
Labour costs 7.5% 7.6% 7.3% 7.9% 8.9%
production of bakery and pasta products
2005 2006 2007 2008 2009
Materials, supplies and intermediate goods 38.8% 37.8% 37.3% 36.8% 35.7%
Electricity 2.4% 2.0% 1.7% 1.5% 1.7%
Fuel and energy 2.3% 2.1% 2.1% 2.7% 2.2%
Labour costs 24.0% 23.9% 25.0% 24.4% 24.6%
Retail sales in non-specialist stores with food and beverages predominating, and retail sales of food, beverages and tobacco in specialist stores
Goods 83.6% 81.8% 81.9% 81.9% 82.7%
Electricity 0.8% 0.8% 0.7% 0.8% 1.0%
Fuel and energy 0.4% 0.4% 0.3% 0.3% 0.3%
Labour costs 6.5% 7.2% 7.8% 8.3% 7.5%
COST STRUCTURE OF FOOd pROdUCTION ANd pRICES OF COMMOdITIES
This chapter aims to calculate the magnitude of the impact of changes in production input from 2005 to 2010 on the cost price of food and to compare this to consumer price developments. A number of simplifying assumptions must be used in order to determine the share of commodities and other essential items of expenditure in the end prices of product groups. First, a supply chain can con-tain more links than a producer and a retailer. For example, wholesalers can act as intermediaries. Then again, in practice major local producers sell their produce directly to store chains. If wholesale, however, were an important link, the share of labour and energy in the product price would be under-estimated. Secondly, it is not possible to distinguish between the expenses incurred with a view to sell-ing different product groups and thus the average estimate must be used. A number of operating expenses (such as depreciation and other costs)
are excluded. Thus, no conclusions about profit-ability can be drawn. Statistics Estonia does not publish the costs of commodities among industry statistics of economic indicators: these are included in general material costs. In addition to the basic commodity, the industry also uses other materials; thus, the cost of the basic commodity would be overestimated rather than underestimated.
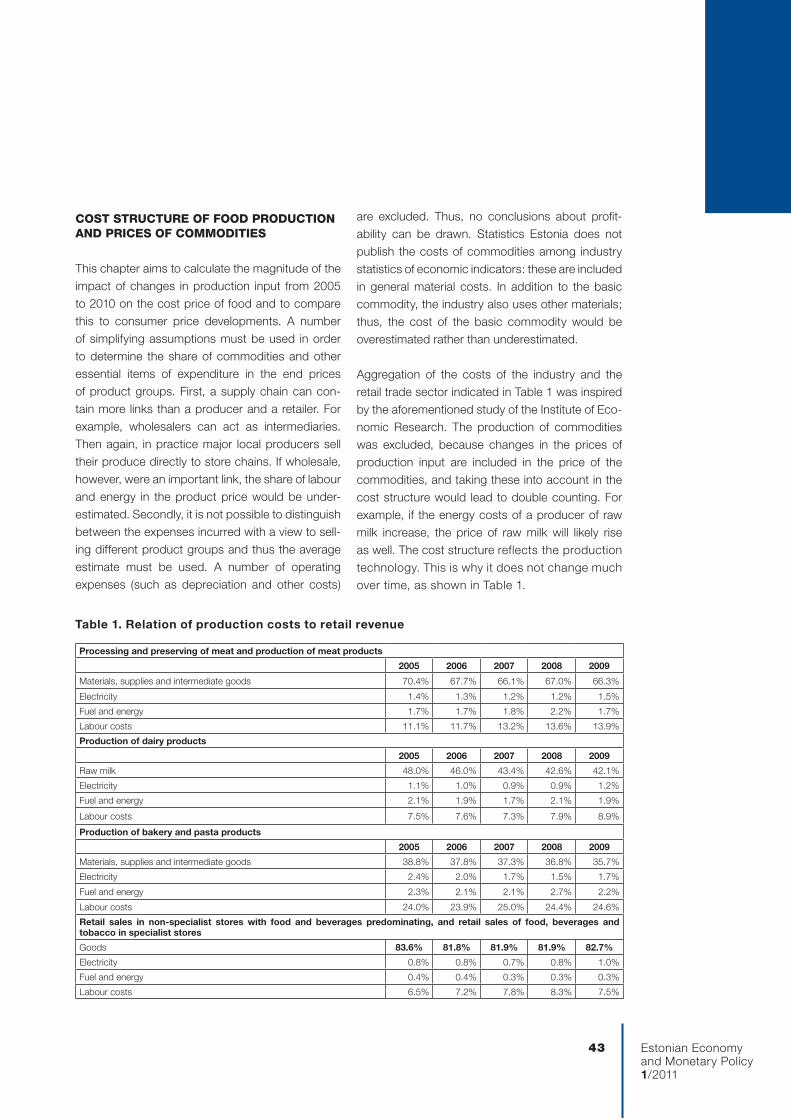
Aggregation of the costs of the industry and the retail trade sector indicated in Table 1 was inspired by the aforementioned study of the Institute of Eco-nomic Research. The production of commodities was excluded, because changes in the prices of production input are included in the price of the commodities, and taking these into account in the cost structure would lead to double counting. For example, if the energy costs of a producer of raw milk increase, the price of raw milk will likely rise as well. The cost structure reflects the production technology. This is why it does not change much over time, as shown in Table 1.
44
Commodities are: raw milk for the dairy industry; meat for the meat industry; and cereals for bakery products. The share of commodities was equated with the share of material costs. However, in the case of dairy products this was adjusted in accordance with the share of raw milk in the material costs of the dairy industry in 2007 as presented in the study of the Institute of Economic Research. As the costs of retailing cannot be differentiated by product group, the overall cost structure is used.
As for the prices of commodities, we used the buying-up prices of agricultural products published by Statistics Estonia, because meat and cereal products cover most of the local industries’ needs and dairy production exceeds them.
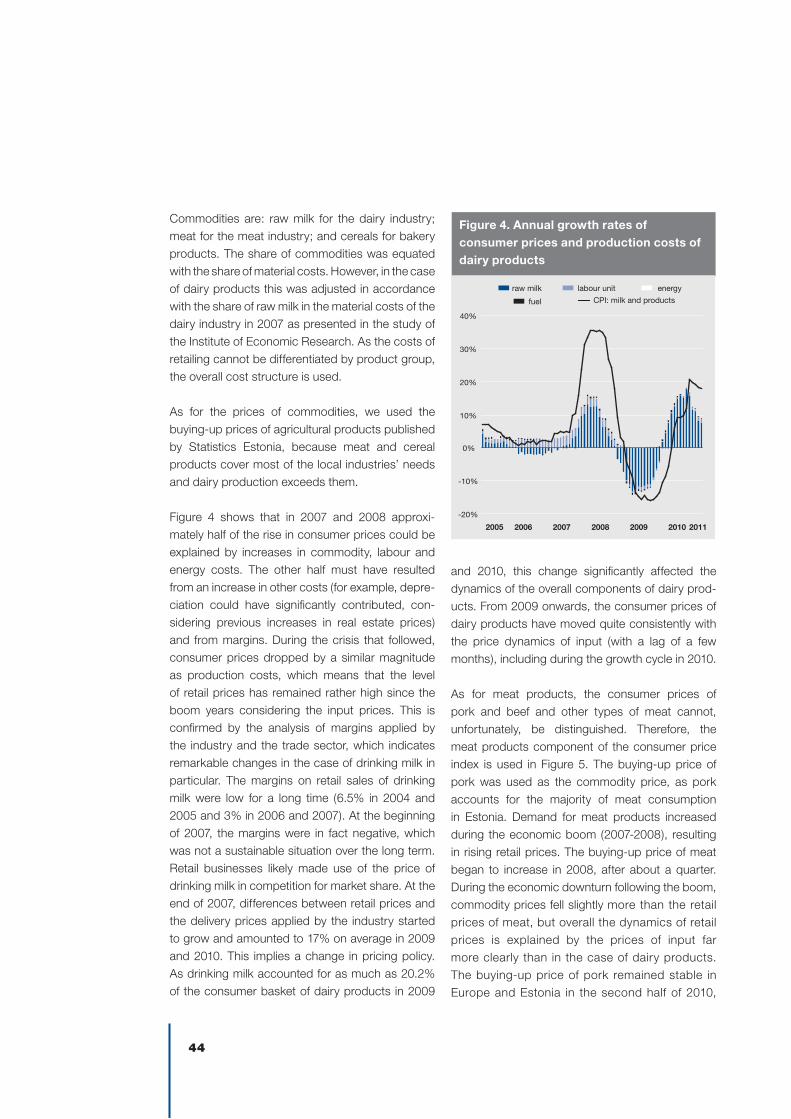
Figure 4 shows that in 2007 and 2008 approxi-mately half of the rise in consumer prices could be explained by increases in commodity, labour and energy costs. The other half must have resulted from an increase in other costs (for example, depre-ciation could have significantly contributed, con-sidering previous increases in real estate prices) and from margins. During the crisis that followed, consumer prices dropped by a similar magnitude as production costs, which means that the level of retail prices has remained rather high since the boom years considering the input prices. This is confirmed by the analysis of margins applied by the industry and the trade sector, which indicates remarkable changes in the case of drinking milk in particular. The margins on retail sales of drinking milk were low for a long time (6.5% in 2004 and 2005 and 3% in 2006 and 2007). At the beginning of 2007, the margins were in fact negative, which was not a sustainable situation over the long term. Retail businesses likely made use of the price of drinking milk in competition for market share. At the end of 2007, differences between retail prices and the delivery prices applied by the industry started to grow and amounted to 17% on average in 2009 and 2010. This implies a change in pricing policy. As drinking milk accounted for as much as 20.2% of the consumer basket of dairy products in 2009
and 2010, this change significantly affected the dynamics of the overall components of dairy prod-ucts. From 2009 onwards, the consumer prices of dairy products have moved quite consistently with the price dynamics of input (with a lag of a few months), including during the growth cycle in 2010.
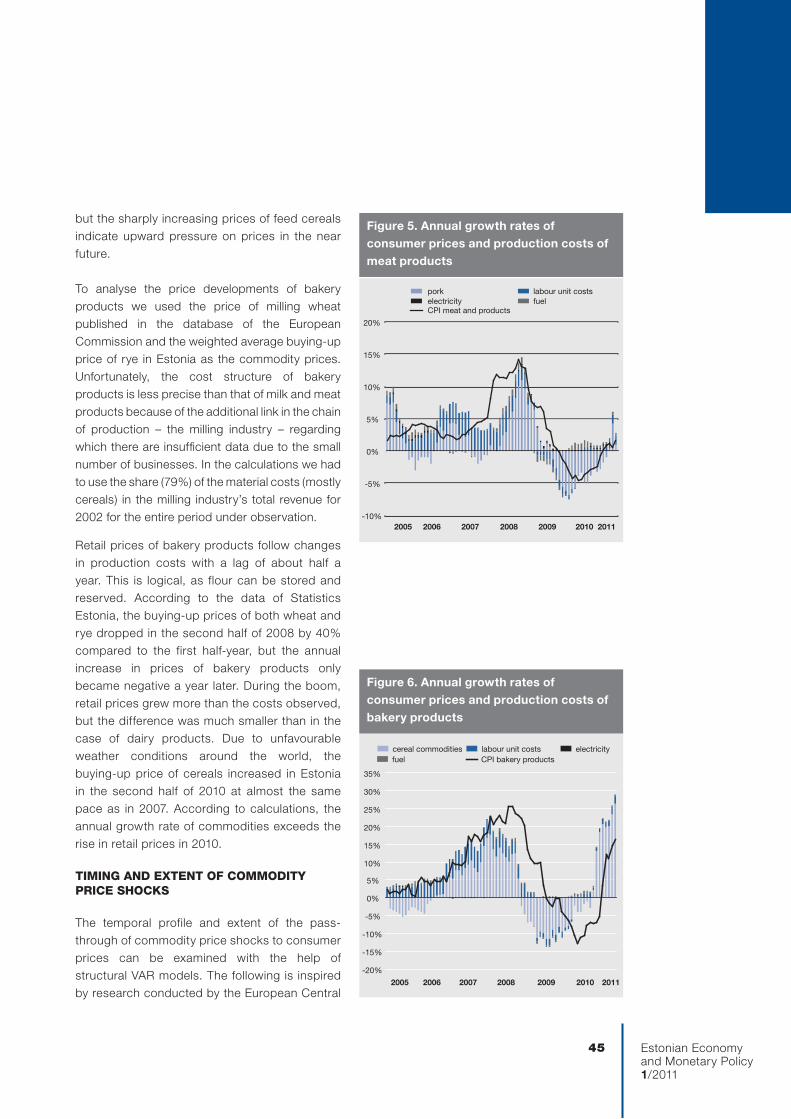
As for meat products, the consumer prices of pork and beef and other types of meat cannot, unfortunately, be distinguished. Therefore, the meat products component of the consumer price index is used in Figure 5. The buying-up price of pork was used as the commodity price, as pork accounts for the majority of meat consumption in Estonia. Demand for meat products increased during the economic boom (2007-2008), resulting in rising retail prices. The buying-up price of meat began to increase in 2008, after about a quarter. During the economic downturn following the boom, commodity prices fell slightly more than the retail prices of meat, but overall the dynamics of retail prices is explained by the prices of input far more clearly than in the case of dairy products. The buying-up price of pork remained stable in Europe and Estonia in the second half of 2010,
Figure 4. Annual growth rates of consumer prices and production costs of dairy products
2005 2006 2007 2008 2009 2010 2011
-20%
-10%
0%
10%
20%
30%
40%
raw milk labour unit energy
fuel CPI: milk and products
Estonian Economyand Monetary Policy1/2011
45
2005 2006 2007 2008 2009 2010 2011-10%
-5%
0%
5%
10%
15%
20%
pork labour unit costselectricity fuelCPI meat and products
Figure 5. Annual growth rates of consumer prices and production costs of meat products
2005 2006 2007 2008 2009 2010 2011
-20%
-15%
-10%
-5%
0%
5%
10%
15%
20%
25%
30%
35%
cereal commodities labour unit costs electricityfuel CPI bakery products
Figure 6. Annual growth rates of consumer prices and production costs of bakery products
but the sharply increasing prices of feed cereals indicate upward pressure on prices in the near future.
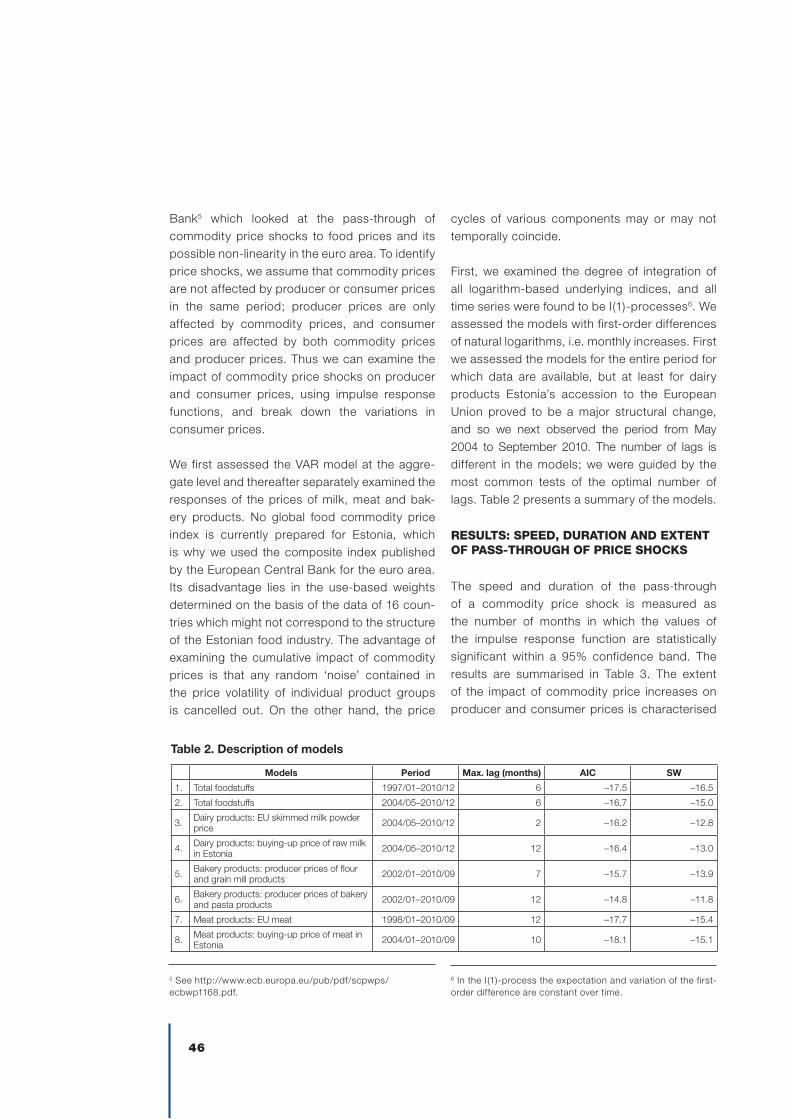
To analyse the price developments of bakery products we used the price of milling wheat published in the database of the European Commission and the weighted average buying-up price of rye in Estonia as the commodity prices. Unfortunately, the cost structure of bakery products is less precise than that of milk and meat products because of the additional link in the chain of production – the milling industry – regarding which there are insufficient data due to the small number of businesses. In the calculations we had to use the share (79%) of the material costs (mostly cereals) in the milling industry’s total revenue for 2002 for the entire period under observation.
Retail prices of bakery products follow changes in production costs with a lag of about half a year. This is logical, as flour can be stored and reserved. According to the data of Statistics Estonia, the buying-up prices of both wheat and rye dropped in the second half of 2008 by 40% compared to the first half-year, but the annual increase in prices of bakery products only became negative a year later. During the boom, retail prices grew more than the costs observed, but the difference was much smaller than in the case of dairy products. Due to unfavourable weather conditions around the world, the buying-up price of cereals increased in Estonia in the second half of 2010 at almost the same pace as in 2007. According to calculations, the annual growth rate of commodities exceeds the rise in retail prices in 2010.
TIMINg ANd EXTENT OF COMMOdITY pRICE ShOCkS
The temporal profile and extent of the pass-through of commodity price shocks to consumer prices can be examined with the help of structural VAR models. The following is inspired by research conducted by the European Central
46
Bank5 which looked at the pass-through of commodity price shocks to food prices and its possible non-linearity in the euro area. To identify price shocks, we assume that commodity prices are not affected by producer or consumer prices in the same period; producer prices are only affected by commodity prices, and consumer prices are affected by both commodity prices and producer prices. Thus we can examine the impact of commodity price shocks on producer and consumer prices, using impulse response functions, and break down the variations in consumer prices.
We first assessed the VAR model at the aggre-gate level and thereafter separately examined the responses of the prices of milk, meat and bak-ery products. No global food commodity price index is currently prepared for Estonia, which is why we used the composite index published by the European Central Bank for the euro area. Its disadvantage lies in the use-based weights determined on the basis of the data of 16 coun-tries which might not correspond to the structure of the Estonian food industry. The advantage of examining the cumulative impact of commodity prices is that any random ‘noise’ contained in the price volatility of individual product groups is cancelled out. On the other hand, the price
cycles of various components may or may not temporally coincide.
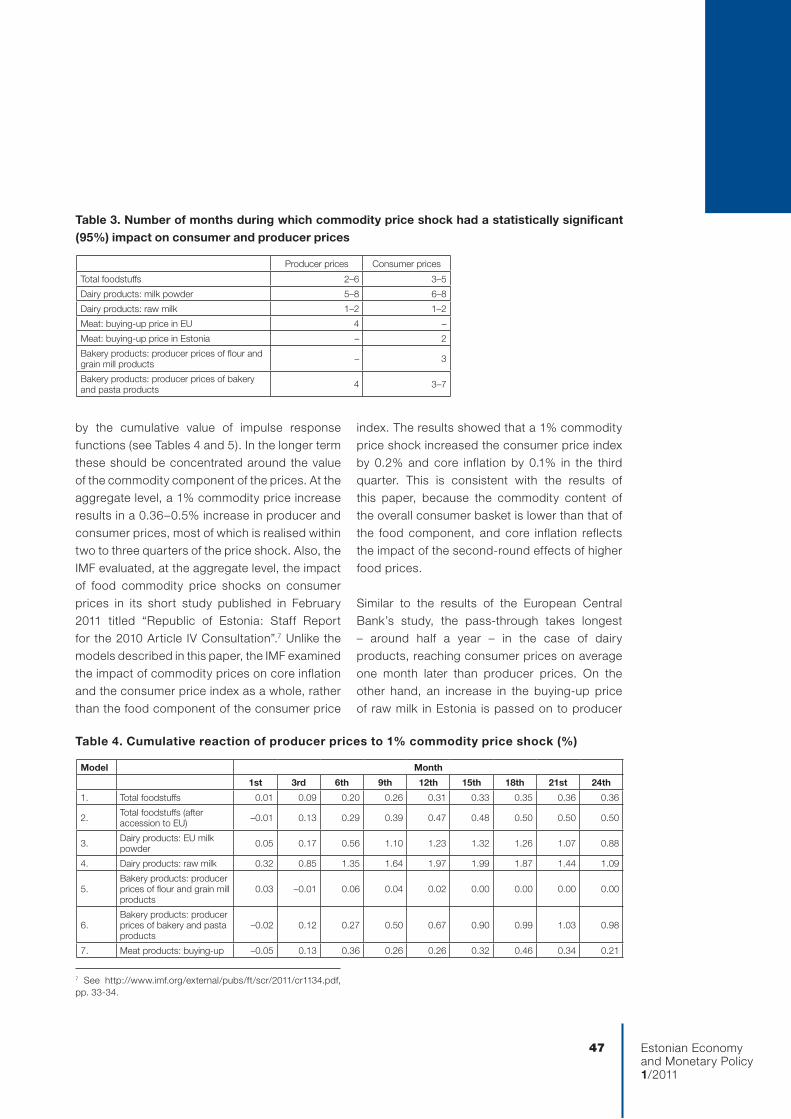
First, we examined the degree of integration of all logarithm-based underlying indices, and all time series were found to be I(1)-processes6. We assessed the models with first-order differences of natural logarithms, i.e. monthly increases. First we assessed the models for the entire period for which data are available, but at least for dairy products Estonia’s accession to the European Union proved to be a major structural change, and so we next observed the period from May 2004 to September 2010. The number of lags is different in the models; we were guided by the most common tests of the optimal number of lags. Table 2 presents a summary of the models.
RESULTS: SpEEd, dURATION ANd EXTENT OF pASS-ThROUgh OF pRICE ShOCkS
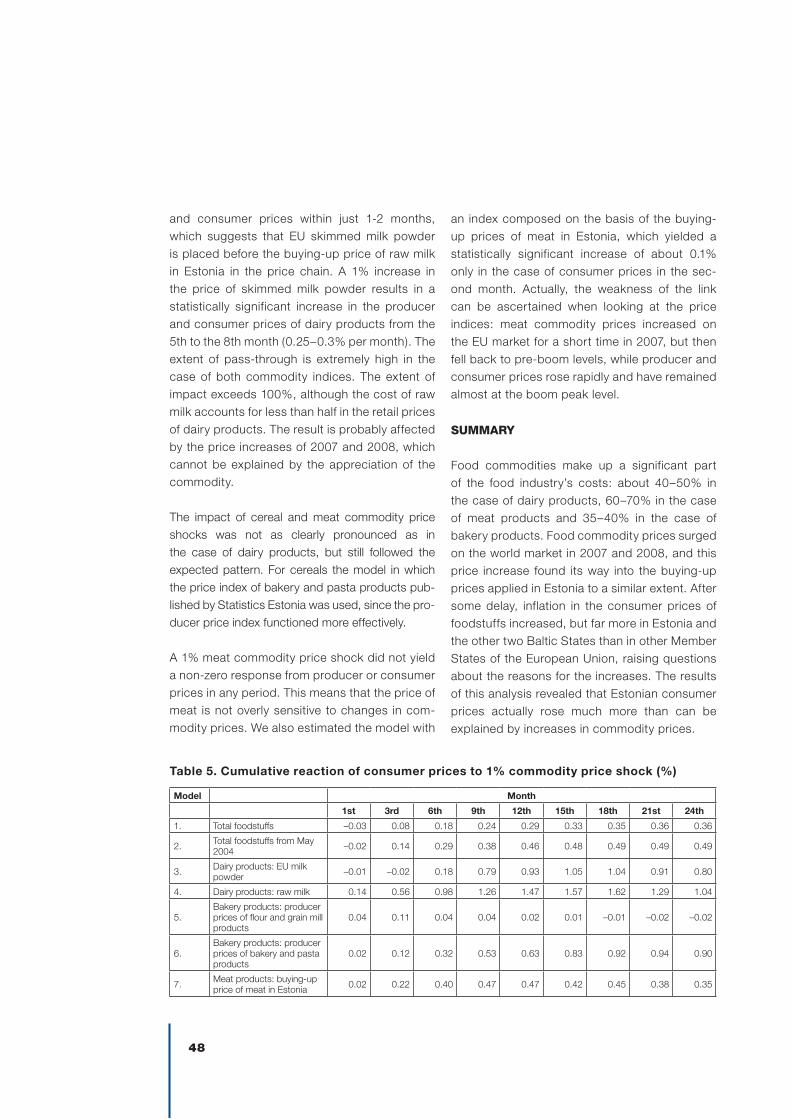
The speed and duration of the pass-through of a commodity price shock is measured as the number of months in which the values of the impulse response function are statistically significant within a 95% confidence band. The results are summarised in Table 3. The extent of the impact of commodity price increases on producer and consumer prices is characterised
Table 2. description of models
Models period Max. lag (months) AIC Sw
1. Total foodstuffs 1997/01–2010/12 6 –17.5 –16.5
2. Total foodstuffs 2004/05–2010/12 6 –16.7 –15.0
3. Dairy products: EU skimmed milk powder price 2004/05–2010/12 2 –16.2 –12.8
4. Dairy products: buying-up price of raw milk in Estonia 2004/05–2010/12 12 –16.4 –13.0
5. Bakery products: producer prices of flour and grain mill products 2002/01–2010/09 7 –15.7 –13.9
6. Bakery products: producer prices of bakery and pasta products 2002/01–2010/09 12 –14.8 –11.8
7. Meat products: EU meat 1998/01–2010/09 12 –17.7 –15.4
8. Meat products: buying-up price of meat in Estonia 2004/01–2010/09 10 –18.1 –15.1
5 See http://www.ecb.europa.eu/pub/pdf/scpwps/ecbwp1168.pdf.
6 In the I (1)-process the expectation and variation of the first-order difference are constant over time.
Estonian Economyand Monetary Policy1/2011
47
Producer prices Consumer prices
Total foodstuffs 2–6 3–5
Dairy products: milk powder 5–8 6–8
Dairy products: raw milk 1–2 1–2
Meat: buying-up price in EU 4 –
Meat: buying-up price in Estonia – 2
Bakery products: producer prices of flour and grain mill products – 3
Bakery products: producer prices of bakery and pasta products 4 3–7
Table 3. Number of months during which commodity price shock had a statistically significant (95%) impact on consumer and producer prices
Table 4. Cumulative reaction of producer prices to 1% commodity price shock (%)
Model Month
1st 3rd 6th 9th 12th 15th 18th 21st 24th
1. Total foodstuffs 0.01 0.09 0.20 0.26 0.31 0.33 0.35 0.36 0.36
2. Total foodstuffs (after accession to EU) –0.01 0.13 0.29 0.39 0.47 0.48 0.50 0.50 0.50
3. Dairy products: EU milk powder 0.05 0.17 0.56 1.10 1.23 1.32 1.26 1.07 0.88
4. Dairy products: raw milk 0.32 0.85 1.35 1.64 1.97 1.99 1.87 1.44 1.09
5.Bakery products: producer prices of flour and grain mill products
0.03 –0.01 0.06 0.04 0.02 0.00 0.00 0.00 0.00
6.Bakery products: producer prices of bakery and pasta products
–0.02 0.12 0.27 0.50 0.67 0.90 0.99 1.03 0.98
7. Meat products: buying-up –0.05 0.13 0.36 0.26 0.26 0.32 0.46 0.34 0.21
by the cumulative value of impulse response functions (see Tables 4 and 5). In the longer term these should be concentrated around the value of the commodity component of the prices. At the aggregate level, a 1% commodity price increase results in a 0.36–0.5% increase in producer and consumer prices, most of which is realised within two to three quarters of the price shock. Also, the IMF evaluated, at the aggregate level, the impact of food commodity price shocks on consumer prices in its short study published in February 2011 titled “Republic of Estonia: Staff Report for the 2010 Article IV Consultation”.7 Unlike the models described in this paper, the IMF examined the impact of commodity prices on core inflation and the consumer price index as a whole, rather than the food component of the consumer price
index. The results showed that a 1% commodity price shock increased the consumer price index by 0.2% and core inflation by 0.1% in the third quarter. This is consistent with the results of this paper, because the commodity content of the overall consumer basket is lower than that of the food component, and core inflation reflects the impact of the second-round effects of higher food prices.
Similar to the results of the European Central Bank’s study, the pass-through takes longest – around half a year – in the case of dairy products, reaching consumer prices on average one month later than producer prices. On the other hand, an increase in the buying-up price of raw milk in Estonia is passed on to producer
7 See http://www.imf.org/external/pubs/ft/scr/2011/cr1134.pdf, pp. 33-34.
48
and consumer prices within just 1-2 months, which suggests that EU skimmed milk powder is placed before the buying-up price of raw milk in Estonia in the price chain. A 1% increase in the price of skimmed milk powder results in a statistically significant increase in the producer and consumer prices of dairy products from the 5th to the 8th month (0.25–0.3% per month). The extent of pass-through is extremely high in the case of both commodity indices. The extent of impact exceeds 100%, although the cost of raw milk accounts for less than half in the retail prices of dairy products. The result is probably affected by the price increases of 2007 and 2008, which cannot be explained by the appreciation of the commodity.
The impact of cereal and meat commodity price shocks was not as clearly pronounced as in the case of dairy products, but still followed the expected pattern. For cereals the model in which the price index of bakery and pasta products pub-lished by Statistics Estonia was used, since the pro-ducer price index functioned more effectively.
A 1% meat commodity price shock did not yield a non-zero response from producer or consumer prices in any period. This means that the price of meat is not overly sensitive to changes in com-modity prices. We also estimated the model with
an index composed on the basis of the buying-up prices of meat in Estonia, which yielded a statistically significant increase of about 0.1% only in the case of consumer prices in the sec-ond month. Actually, the weakness of the link can be ascertained when looking at the price indices: meat commodity prices increased on the EU market for a short time in 2007, but then fell back to pre-boom levels, while producer and consumer prices rose rapidly and have remained almost at the boom peak level.
SUMMARY
Food commodities make up a significant part of the food industry’s costs: about 40–50% in the case of dairy products, 60–70% in the case of meat products and 35–40% in the case of bakery products. Food commodity prices surged on the world market in 2007 and 2008, and this price increase found its way into the buying-up prices applied in Estonia to a similar extent. After some delay, inflation in the consumer prices of foodstuffs increased, but far more in Estonia and the other two Baltic States than in other Member States of the European Union, raising questions about the reasons for the increases. The results of this analysis revealed that Estonian consumer prices actually rose much more than can be explained by increases in commodity prices.
Table 5. Cumulative reaction of consumer prices to 1% commodity price shock (%)
Model Month
1st 3rd 6th 9th 12th 15th 18th 21st 24th
1. Total foodstuffs –0.03 0.08 0.18 0.24 0.29 0.33 0.35 0.36 0.36
2. Total foodstuffs from May 2004 –0.02 0.14 0.29 0.38 0.46 0.48 0.49 0.49 0.49
3. Dairy products: EU milk powder –0.01 –0.02 0.18 0.79 0.93 1.05 1.04 0.91 0.80
4. Dairy products: raw milk 0.14 0.56 0.98 1.26 1.47 1.57 1.62 1.29 1.04
5.Bakery products: producer prices of flour and grain mill products
0.04 0.11 0.04 0.04 0.02 0.01 –0.01 –0.02 –0.02
6.Bakery products: producer prices of bakery and pasta products
0.02 0.12 0.32 0.53 0.63 0.83 0.92 0.94 0.90
7. Meat products: buying-up price of meat in Estonia 0.02 0.22 0.40 0.47 0.47 0.42 0.45 0.38 0.35
Estonian Economyand Monetary Policy1/2011
49
In the second half of 2010 the prices of milk commod-ity and cereals rose in the same range as in 2007 and 2008. The growth rate of the buying-up price of milk in Estonia exceeded the previous boom time levels. At the same time, the consumer prices of milk and bak-ery products increased sharply in the autumn. This time, commodity prices explain a much larger part of the consumer price increase. Increasing cereal prices have not been passed on to meat commodity prices yet, but this pass-through is expected to occur in the near future.
We examined the extent and timing of the commodity price shock with the help of a structural VAR model. At the aggregate level the figure calculated by the European Central Bank was used as the foreign food commodity price index. At the aggregate level the food component of the Estonian consumer price index responded to commodity price shocks with a 1- to 2-quarter lag, and a 1% commodity price increase resulted in a 0.36–0.50% increase in producer and consumer prices within a year and a half. The lag was lengthiest and the extent of the commodity price shock greatest in the case of dairy products. A similar result was obtained in the European Central Bank’s study. In the case of Estonia the extent of the pass-through was likely influenced by the situation prevailing in 2007 and 2008, where consumer prices rose more than could have been expected on the basis of commodity prices alone. As for meat products, no statistically significant results were obtained. In the case of bakery products, the model yielded results when we used the producer prices of bakery and pasta products. Consumer prices of bakery products responded to a cereal price shock in around the third quarter, and the final extent of the pass-through of the price shock was significant, as in the case of dairy products, i.e. up to 0.9%.
50
BASIC CONCEpTS
Exports of milk and dairy products, which account for the largest proportion of food exports, increased in 2010 by almost half. The main products behind these increased exports were raw milk (fat content 3–6%), drinking milk (1–3%) and cream (fat content 21–45%). The main target market was Russia; exports to the country almost tripled compared to 2009. Estonia’s milk production exceeds the needs of the domestic market and therefore the demand and price levels of foreign markets affect price developments in the domestic market.
In 2010, changes in the retail price of milk were better described by the export volumes and prices of packaged drinking milk. Analysis of the exports of drinking milk to the European Union and Russia reveal substantial price gaps, which result from product-specific factors. While the export prices of packaged drinking milk sold to the EU have not increased as much as the buying-up price of milk, exports to Russia appre-ciated considerably during the autumn months. Thus, the weighted average export price of drinking milk was 60% higher in October than a year ago. In addition, a sharp increase in Russia-bound export volumes was seen; this occurred at the expense of exports to the EU. The shift in the exports of packaged drinking milk can be explained by unfavourable weather conditions in Russia in 2010 which led to a reduction of out-put. Due to increased demand, higher prices are paid for milk production in Russia, and this made it possible to charge higher prices on the Estonian market as well. Increased trade mar-gins also had a certain impact: trade margins of packaged drinking milk were higher in 2010 than in previous years.
Improved export opportunities eastwards thus enabled the margins of processing companies which had dropped below normal by the end of 2009 to be restored in autumn 2010. As shown
with milk, export prices are the first to respond to changes in world market prices, and thereafter the changes are passed on to retail prices. The export prices of some dairy products, such as drinking milk (fat content 1–3%) and raw milk, have historically been lower than those in Finland and Lithuania and the EU-27 average. The reasons lie at the micro level, depending on the characteristics of the products exported.
Links between the retail prices and export volumes of milk are weak, and even weaker when we look at dairy products in their entirety. Most of the changes in the retail prices of milk can be explained by changes in the global market prices of milk, which find their way into local prices within 4–5 months. It is possible to find statistically significant relationships between retail prices and export volumes of drinking milk. Although the quantities of such milk exported to Russia have been volatile in recent years, they can be far better explained than the export volumes of all drinking milk. This most likely refers to the greater profitability of exports to Russia, which translates into the higher export prices of the milk sold there.
Estonia’s cereal harvests cover the needs of the domestic market, provided that the weather conditions are normal. Cereal exports have been quite volatile in recent years and are influenced by larger single cereal transactions. In 2010, exports of cereals and cereal products increased a little, by 3% (10% by volume). The export volumes of cereal and bakery products grew. Compared to other cereal product groups, more success was achieved in increasing exports of wheat and barley. Exports of cereal and cereal products began to recover in spring 2010, as world market prices had bottomed out. Even though the drought in Russia boosted cereal prices on the international market, export volumes did not increase significantly during the autumn months. The only exceptions were wheat and barley, exports of which clearly increased
pART II. FOREIgN TRAdE dyNAMICS ANd REASONS FOR ITS INFlATION, pRIMARIly IN 2010
Estonian Economyand Monetary Policy1/2011
51
after the harvest. High prices contributed to an increase in sales to foreign markets at the end of the year.
Analysis suggests that export prices remained at a low level until mid-2010, and it was only in July that a significant increase in export prices could be seen for some products in line with world market prices. The export prices of bakery products increased more than in other countries. Data also show that cereal export prices respond to changes in world market prices faster than buying-up prices or retail prices. In light of buying-up prices, the margins of commodity exporters were modest in 2010 compared to previous years. The rise in export prices in summer enabled export margins to be increased again. In addition, it has emerged that in 2010 the retail prices of white bread adapted more (moving downwards) than the export prices of bakery products. This could be explained by a price war between producers. The general increase in the prices of cereals in recent months was first reflected in the export prices of bread and was then passed on to retail prices.
We could not find a strong link between the export volumes of cereals and cereal products and the changes in retail prices. However, looking at price movements alone, statistically significant links can be observed between the world market prices of cereals on the one hand and the export and retail prices of cereal products on the other. Thereby, export prices somewhat better describe changes in retail prices compared to world market prices. The results of the analysis also show that in 2010 no potential excessive response occurred in the consumer prices of cereal products in comparison with export prices. The results indicate that an increase in commodity prices on foreign markets is swiftly passed on to both export and retail prices. The consumer prices of some products, such as bread, have been in line with commodity and export prices, even during
the recession period of the crisis, and quickly responded to the appreciation of commodities in autumn 2010. In the case of black bread, a change in commodity and export prices finds its way into consumer prices with a 2- to 3-month lag. Consumer prices of flour correspond better to changes in commodity prices, considering the export prices of black bread and white bread.
IMpACT OF FOOd EXpORTS ON FOOd pRICES
Consumer prices of food increased rapidly in 2010, and the food price increase was the main reason for the acceleration of inflation. In this analysis we seek to determine the extent to which the food price increase in Estonia can be explained by increasing export volumes. To do this, we take a closer look at two groups of foodstuffs: milk and dairy products; and cereals. The data we use include detailed data on foreign trade from Eurostat, producer prices and retail prices from the Institute of Economic Research, producer price and export price indices from Statistics Estonia and world food price indices from the UN Food and Agriculture Organisation.
The major export markets for agricultural and food products are our closest neighbours: Russia, Fin-land, Latvia and Lithuania. After a fall in export vol-umes in 2009, demand increased in 2010 on key foreign markets, which allowed Estonian compa-nies to increase their food export turnover by 24.6% during the first 10 months of 2010. Milk and dairy products account for the largest proportion of food exports (Chapter 04). The export volumes of cere-als and cereal products are somewhat smaller.
Milk and dairy products
Buying-up of raw milk has been fairly stable in recent years. In 2009, demand for milk dropped and the price was low; therefore, production was restricted and output decreased significantly at the beginning of 2010. Production increased in
52
thou
sand
ton
s
0
10
20
30
40
50
60
01/2
003
05/2
003
09/2
003
01/2
004
05/2
004
09/2
004
01/2
005
05/2
005
09/2
005
01/2
006
05/2
006
09/2
006
01/2
007
05/2
007
09/2
007
01/2
008
05/2
008
09/2
008
01/2
009
05/2
009
09/2
009
01/2
010
05/2
010
09/2
010
buying-up of milk milk imports milk exports
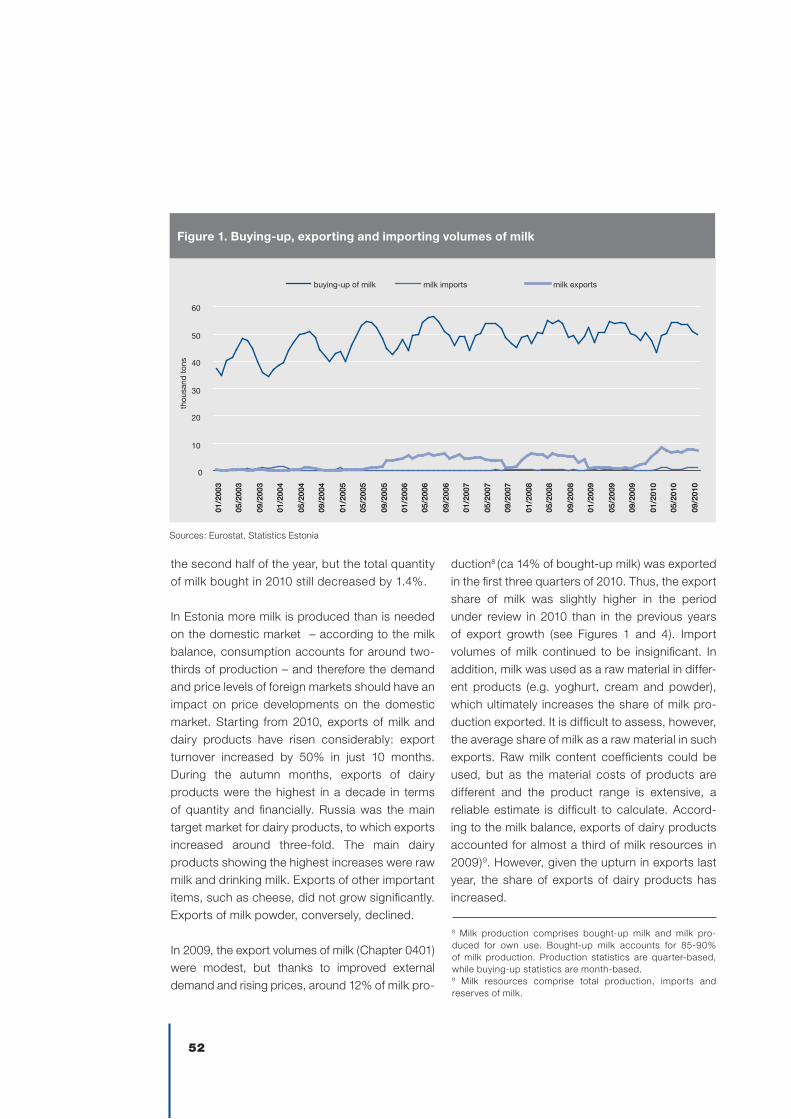
Figure 1. Buying-up, exporting and importing volumes of milk
Sources: Eurostat, Statistics Estonia
the second half of the year, but the total quantity of milk bought in 2010 still decreased by 1.4%.
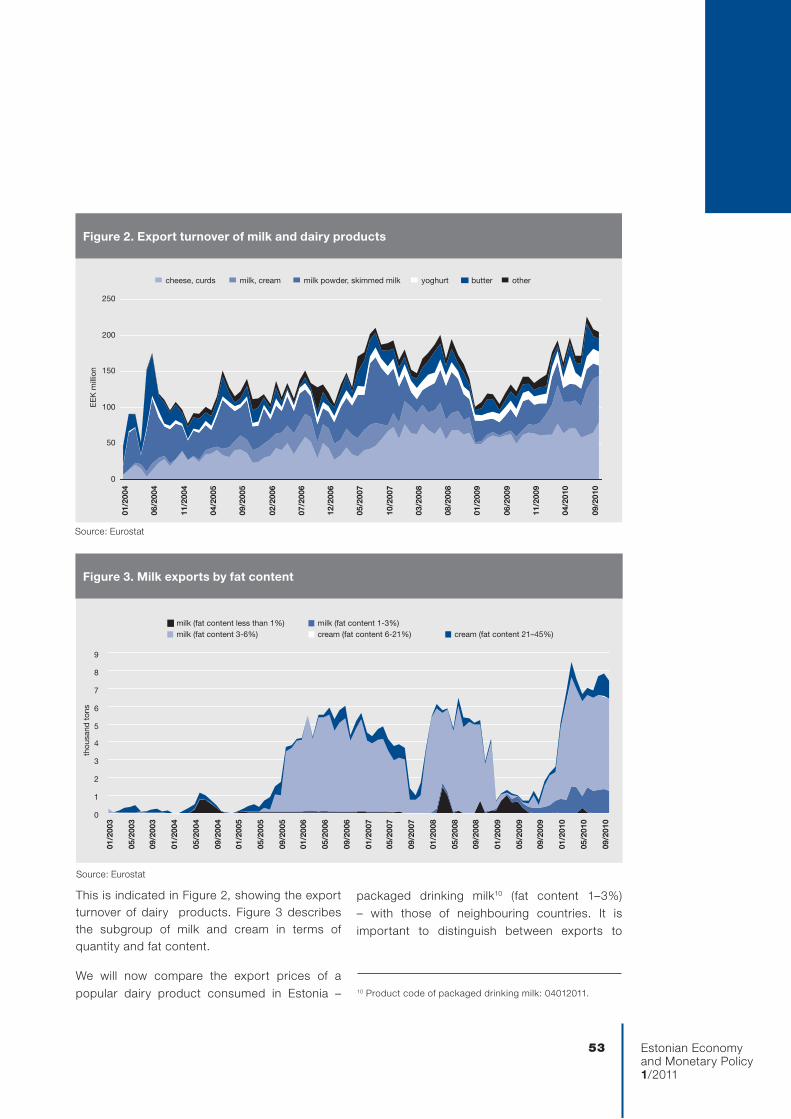
In Estonia more milk is produced than is needed on the domestic market – according to the milk balance, consumption accounts for around two-thirds of production – and therefore the demand and price levels of foreign markets should have an impact on price developments on the domestic market. Starting from 2010, exports of milk and dairy products have risen considerably: export turnover increased by 50% in just 10 months. During the autumn months, exports of dairy products were the highest in a decade in terms of quantity and financially. Russia was the main target market for dairy products, to which exports increased around three-fold. The main dairy products showing the highest increases were raw milk and drinking milk. Exports of other important items, such as cheese, did not grow significantly. Exports of milk powder, conversely, declined.
In 2009, the export volumes of milk (Chapter 0401) were modest, but thanks to improved external demand and rising prices, around 12% of milk pro-
8 Milk production comprises bought-up milk and milk pro-duced for own use. Bought-up milk accounts for 85-90% of milk production. Production statistics are quarter-based, while buying-up statistics are month-based.9 Milk resources comprise total production, imports and reserves of milk.
duction8 (ca 14% of bought-up milk) was exported in the first three quarters of 2010. Thus, the export share of milk was slightly higher in the period under review in 2010 than in the previous years of export growth (see Figures 1 and 4). Import volumes of milk continued to be insignificant. In addition, milk was used as a raw material in differ-ent products (e.g. yoghurt, cream and powder), which ultimately increases the share of milk pro-duction exported. It is difficult to assess, however, the average share of milk as a raw material in such exports. Raw milk content coefficients could be used, but as the material costs of products are different and the product range is extensive, a reliable estimate is difficult to calculate. Accord-ing to the milk balance, exports of dairy products accounted for almost a third of milk resources in 2009)9. However, given the upturn in exports last year, the share of exports of dairy products has increased.
Estonian Economyand Monetary Policy1/2011
53
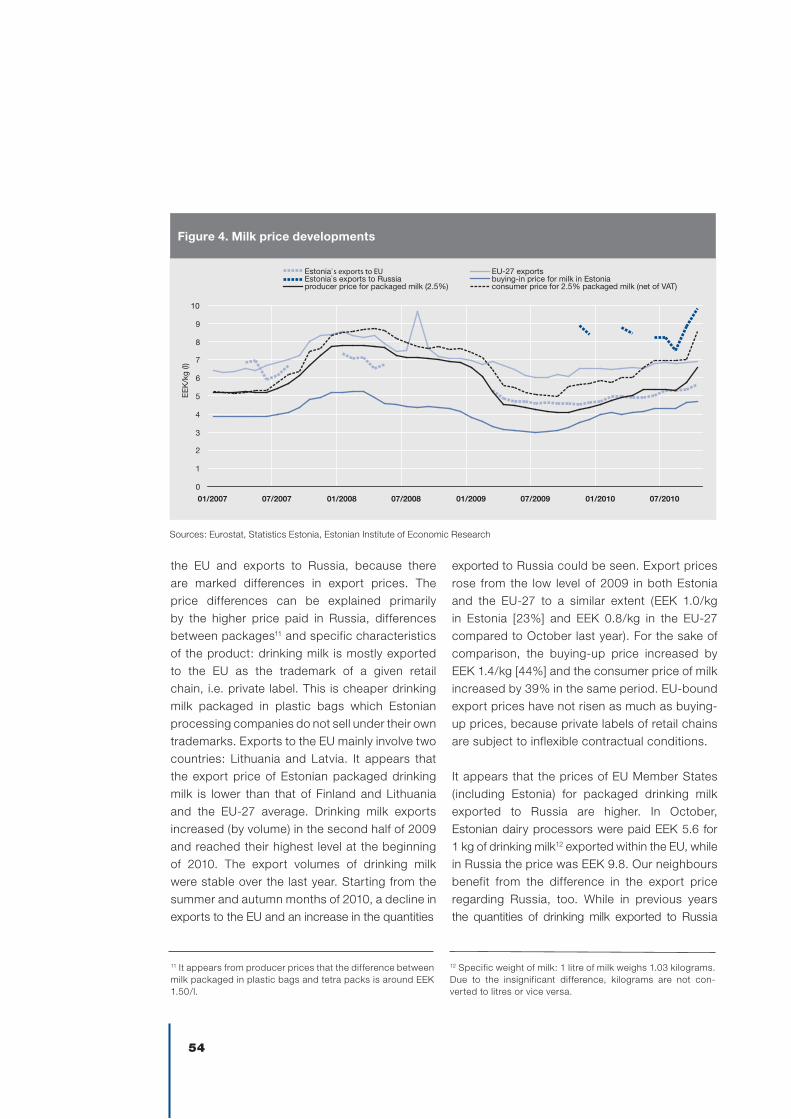
Figure 3. Milk exports by fat content
Source: Eurostat
0
1
2
3
4
5
6
7
8
9
01/2
003
05/2
003
09/2
003
01/2
004
05/2
004
09/2
004
01/2
005
05/2
005
09/2
005
01/2
006
05/2
006
09/2
006
01/2
007
05/2
007
09/2
007
01/2
008
05/2
008
09/2
008
01/2
009
05/2
009
09/2
009
01/2
010
05/2
010
09/2
010
thou
sand
ton
s
milk (fat content less than 1%) milk (fat content 1-3%)milk (fat content 3-6%) cream (fat content 6-21%) cream (fat content 21–45%)
Source: Eurostat
0
50
100
150
200
250
01/2
004
06/2
004
11/2
004
04/2
005
09/2
005
02/2
006
07/2
006
12/2
006
05/2
007
10/2
007
03/2
008
08/2
008
01/2
009
06/2
009
11/2
009
04/2
010
09/2
010
EE
K m
illio
n
cheese, curds milk, cream milk powder, skimmed milk yoghurt butter other
Figure 2. Export turnover of milk and dairy products
This is indicated in Figure 2, showing the export turnover of dairy products. Figure 3 describes the subgroup of milk and cream in terms of quantity and fat content.
We will now compare the export prices of a popular dairy product consumed in Estonia –
packaged drinking milk10 (fat content 1–3%) – with those of neighbouring countries. It is important to distinguish between exports to
10 Product code of packaged drinking milk: 04012011.
54
EE
K/k
g (l)
0
1
2
3
4
5
6
7
8
9
10
01/2007 07/2007 01/2008 07/2008 01/2009 07/2009 01/2010 07/2010
Estonia`s exports to EU EU-27 exportsEstonia`s exports to Russia buying-in price for milk in Estoniaproducer price for packaged milk (2.5%) consumer price for 2.5% packaged milk (net of VAT)
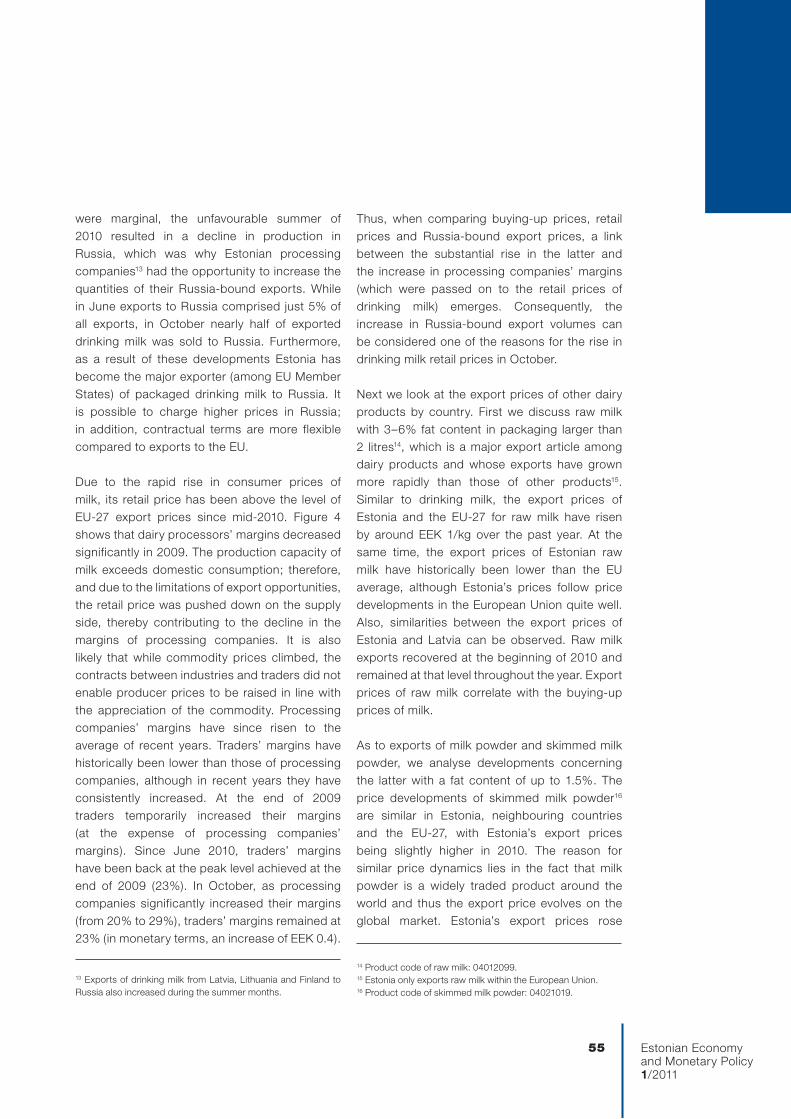
Figure 4. Milk price developments
Sources: Eurostat, Statistics Estonia, Estonian Institute of Economic Research
the EU and exports to Russia, because there are marked differences in export prices. The price differences can be explained primarily by the higher price paid in Russia, differences between packages11 and specific characteristics of the product: drinking milk is mostly exported to the EU as the trademark of a given retail chain, i.e. private label. This is cheaper drinking milk packaged in plastic bags which Estonian processing companies do not sell under their own trademarks. Exports to the EU mainly involve two countries: Lithuania and Latvia. It appears that the export price of Estonian packaged drinking milk is lower than that of Finland and Lithuania and the EU-27 average. Drinking milk exports increased (by volume) in the second half of 2009 and reached their highest level at the beginning of 2010. The export volumes of drinking milk were stable over the last year. Starting from the summer and autumn months of 2010, a decline in exports to the EU and an increase in the quantities
exported to Russia could be seen. Export prices rose from the low level of 2009 in both Estonia and the EU-27 to a similar extent (EEK 1.0/kg in Estonia [23%] and EEK 0.8/kg in the EU-27 compared to October last year). For the sake of comparison, the buying-up price increased by EEK 1.4/kg [44%] and the consumer price of milk increased by 39% in the same period. EU-bound export prices have not risen as much as buying-up prices, because private labels of retail chains are subject to inflexible contractual conditions.
It appears that the prices of EU Member States (including Estonia) for packaged drinking milk exported to Russia are higher. In October, Estonian dairy processors were paid EEK 5.6 for 1 kg of drinking milk12 exported within the EU, while in Russia the price was EEK 9.8. Our neighbours benefit from the difference in the export price regarding Russia, too. While in previous years the quantities of drinking milk exported to Russia
11 It appears from producer prices that the difference between milk packaged in plastic bags and tetra packs is around EEK 1.50/l.
12 Specific weight of milk: 1 litre of milk weighs 1.03 kilograms. Due to the insignificant difference, kilograms are not con-verted to litres or vice versa.
Estonian Economyand Monetary Policy1/2011
55
were marginal, the unfavourable summer of 2010 resulted in a decline in production in Russia, which was why Estonian processing companies13 had the opportunity to increase the quantities of their Russia-bound exports. While in June exports to Russia comprised just 5% of all exports, in October nearly half of exported drinking milk was sold to Russia. Furthermore, as a result of these developments Estonia has become the major exporter (among EU Member States) of packaged drinking milk to Russia. It is possible to charge higher prices in Russia; in addition, contractual terms are more flexible compared to exports to the EU.
Due to the rapid rise in consumer prices of milk, its retail price has been above the level of EU-27 export prices since mid-2010. Figure 4 shows that dairy processors’ margins decreased significantly in 2009. The production capacity of milk exceeds domestic consumption; therefore, and due to the limitations of export opportunities, the retail price was pushed down on the supply side, thereby contributing to the decline in the margins of processing companies. It is also likely that while commodity prices climbed, the contracts between industries and traders did not enable producer prices to be raised in line with the appreciation of the commodity. Processing companies’ margins have since risen to the average of recent years. Traders’ margins have historically been lower than those of processing companies, although in recent years they have consistently increased. At the end of 2009 traders temporarily increased their margins (at the expense of processing companies’ margins). Since June 2010, traders’ margins have been back at the peak level achieved at the end of 2009 (23%). In October, as processing companies significantly increased their margins (from 20% to 29%), traders’ margins remained at 23% (in monetary terms, an increase of EEK 0.4).
Thus, when comparing buying-up prices, retail prices and Russia-bound export prices, a link between the substantial rise in the latter and the increase in processing companies’ margins (which were passed on to the retail prices of drinking milk) emerges. Consequently, the increase in Russia-bound export volumes can be considered one of the reasons for the rise in drinking milk retail prices in October.
Next we look at the export prices of other dairy products by country. First we discuss raw milk with 3–6% fat content in packaging larger than 2 litres14, which is a major export article among dairy products and whose exports have grown more rapidly than those of other products15. Similar to drinking milk, the export prices of Estonia and the EU-27 for raw milk have risen by around EEK 1/kg over the past year. At the same time, the export prices of Estonian raw milk have historically been lower than the EU average, although Estonia’s prices follow price developments in the European Union quite well. Also, similarities between the export prices of Estonia and Latvia can be observed. Raw milk exports recovered at the beginning of 2010 and remained at that level throughout the year. Export prices of raw milk correlate with the buying-up prices of milk.
As to exports of milk powder and skimmed milk powder, we analyse developments concerning the latter with a fat content of up to 1.5%. The price developments of skimmed milk powder16
are similar in Estonia, neighbouring countries and the EU-27, with Estonia’s export prices being slightly higher in 2010. The reason for similar price dynamics lies in the fact that milk powder is a widely traded product around the world and thus the export price evolves on the global market. Estonia’s export prices rose
13 Exports of drinking milk from Latvia, Lithuania and Finland to Russia also increased during the summer months.
14 Product code of raw milk: 04012099.15 Estonia only exports raw milk within the European Union.16 Product code of skimmed milk powder: 04021019.
56
Sources: Eurostat, Statistics Estonia
0%
2%
4%
6%
8%
10%
12%
14%
16%
18%
01/2
004
05/2
004
09/2
004
01/2
005
05/2
005
09/2
005
01/2
006
05/2
006
09/2
006
01/2
007
05/2
007
09/2
007
01/2
008
05/2
008
09/2
008
01/2
009
05/2
009
09/2
009
01/2
010
05/2
010
09/2
010
-30%
-20%
-10%
0%
10%
20%
30%
40%
50%
60%
milk exports as a ratio to buying-up of milk (left scale) change in milk CPI (right scale)
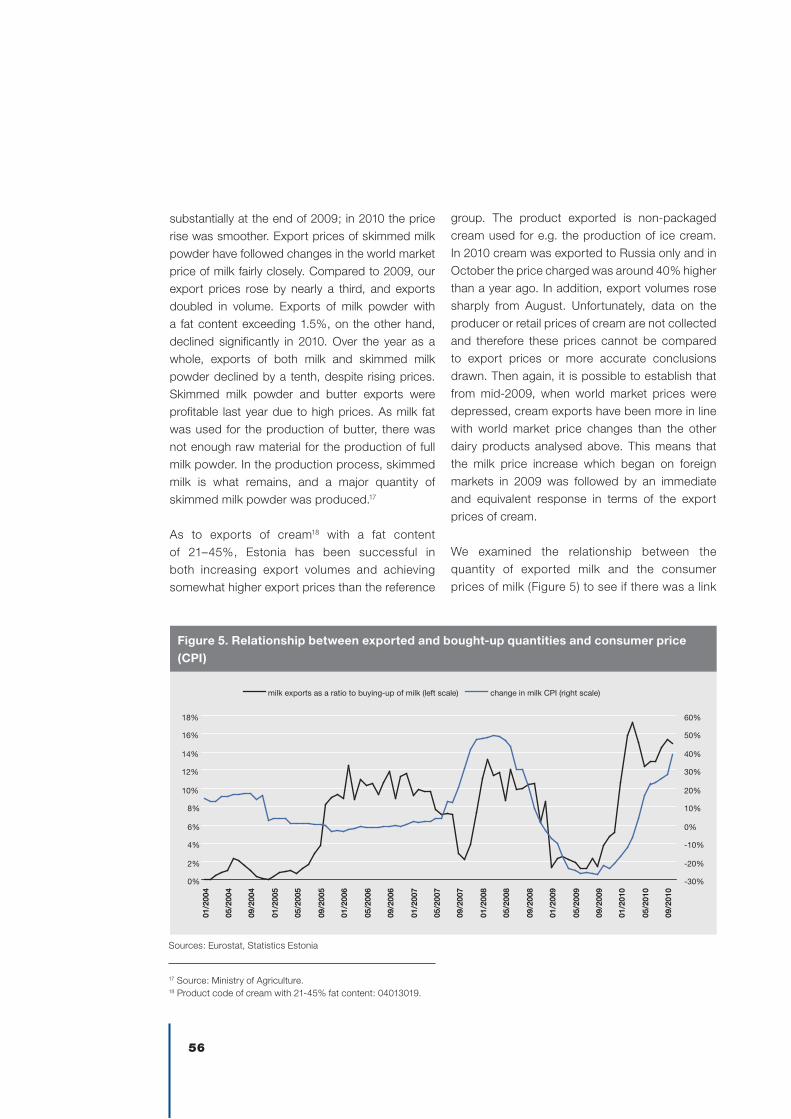
Figure 5. Relationship between exported and bought-up quantities and consumer price (CpI)
substantially at the end of 2009; in 2010 the price rise was smoother. Export prices of skimmed milk powder have followed changes in the world market price of milk fairly closely. Compared to 2009, our export prices rose by nearly a third, and exports doubled in volume. Exports of milk powder with a fat content exceeding 1.5%, on the other hand, declined significantly in 2010. Over the year as a whole, exports of both milk and skimmed milk powder declined by a tenth, despite rising prices. Skimmed milk powder and butter exports were profitable last year due to high prices. As milk fat was used for the production of butter, there was not enough raw material for the production of full milk powder. In the production process, skimmed milk is what remains, and a major quantity of skimmed milk powder was produced.17
As to exports of cream18 with a fat content of 21–45%, Estonia has been successful in both increasing export volumes and achieving somewhat higher export prices than the reference
group. The product exported is non-packaged cream used for e.g. the production of ice cream. In 2010 cream was exported to Russia only and in October the price charged was around 40% higher than a year ago. In addition, export volumes rose sharply from August. Unfortunately, data on the producer or retail prices of cream are not collected and therefore these prices cannot be compared to export prices or more accurate conclusions drawn. Then again, it is possible to establish that from mid-2009, when world market prices were depressed, cream exports have been more in line with world market price changes than the other dairy products analysed above. This means that the milk price increase which began on foreign markets in 2009 was followed by an immediate and equivalent response in terms of the export prices of cream.
We examined the relationship between the quantity of exported milk and the consumer prices of milk (Figure 5) to see if there was a link
17 Source: Ministry of Agriculture.18 Product code of cream with 21-45% fat content: 04013019.
Estonian Economyand Monetary Policy1/2011
57
between the price of milk and the quantity of milk left for domestic consumption. A clear correlation can be seen for the period 2008–2010, but no such link can be established for earlier years. The lack of correlation in 2006 could be explained by the decline in milk prices on the world market. In the second half of 2007 the increase in the price of milk on the global market found its way into retail prices and, after a few months’ delay, was reflected in increasing export volumes. The recovery in demand in 2010 caused a price increase on foreign markets, which was passed on to retail prices. Thus, the relation between exports and bought-up quantities and the dynamics of retail prices prevailing last year should indicate upward pressure on retail prices caused by increasing exports of milk.
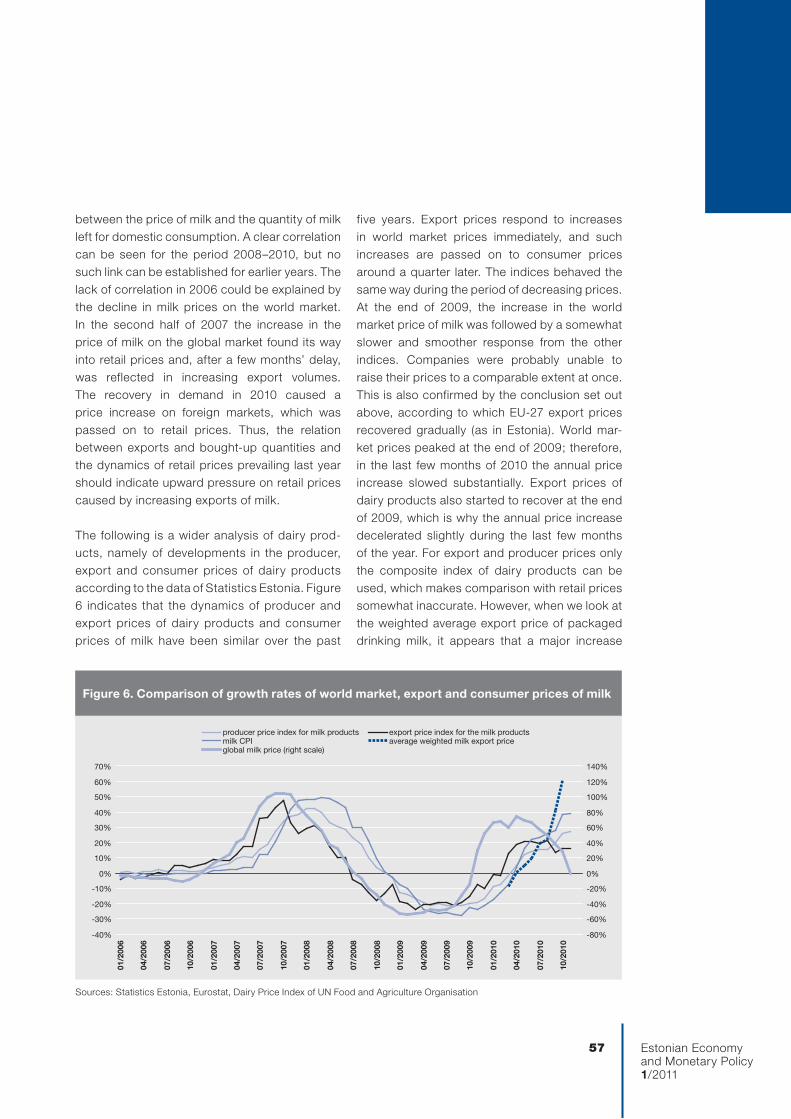
The following is a wider analysis of dairy prod-ucts, namely of developments in the producer, export and consumer prices of dairy products according to the data of Statistics Estonia. Figure 6 indicates that the dynamics of producer and export prices of dairy products and consumer prices of milk have been similar over the past
five years. Export prices respond to increases in world market prices immediately, and such increases are passed on to consumer prices around a quarter later. The indices behaved the same way during the period of decreasing prices. At the end of 2009, the increase in the world market price of milk was followed by a somewhat slower and smoother response from the other indices. Companies were probably unable to raise their prices to a comparable extent at once. This is also confirmed by the conclusion set out above, according to which EU-27 export prices recovered gradually (as in Estonia). World mar-ket prices peaked at the end of 2009; therefore, in the last few months of 2010 the annual price increase slowed substantially. Export prices of dairy products also started to recover at the end of 2009, which is why the annual price increase decelerated slightly during the last few months of the year. For export and producer prices only the composite index of dairy products can be used, which makes comparison with retail prices somewhat inaccurate. However, when we look at the weighted average export price of packaged drinking milk, it appears that a major increase
-40%
-30%
-20%
-10%
0%
10%
20%
30%
40%
50%
60%
70%
01/2
006
04/2
006
07/2
006
10/2
006
01/2
007
04/2
007
07/2
007
10/2
007
01/2
008
04/2
008
07/2
008
10/2
008
01/2
009
04/2
009
07/2
009
10/2
009
01/2
010
04/2
010
07/2
010
10/2
010
-80%
-60%
-40%
-20%
0%
20%
40%
60%
80%
100%
120%
140%
producer price index for milk products export price index for the milk productsmilk CPI average weighted milk export priceglobal milk price (right scale)
Figure 6. Comparison of growth rates of world market, export and consumer prices of milk
Sources: Statistics Estonia, Eurostat, Dairy Price Index of UN Food and Agriculture Organisation
58
in export prices occurred in autumn, amount-ing to 60% in October. Considerable exports of drinking milk began in spring 2009, which is why the time series is rather short in the figure. Nonetheless, it can be concluded that the rise in the export prices of packaged drinking milk was reflected in retail prices a month later.
Cereals and cereal products
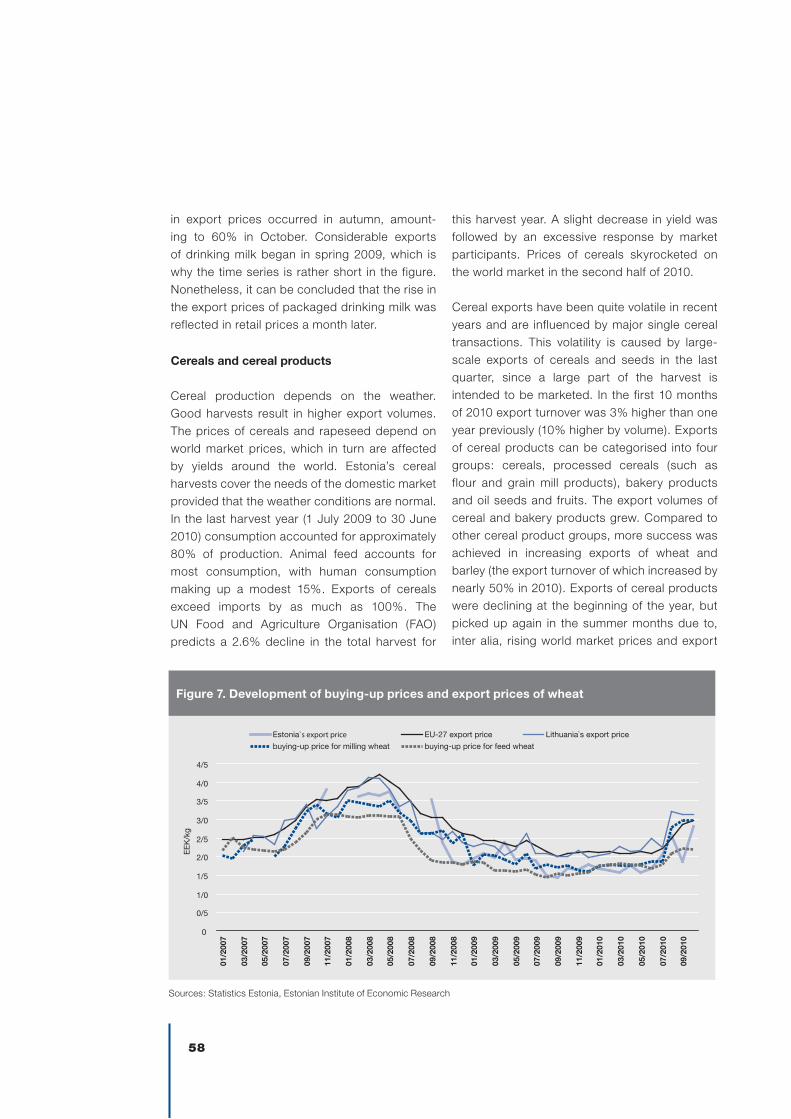
Cereal production depends on the weather. Good harvests result in higher export volumes. The prices of cereals and rapeseed depend on world market prices, which in turn are affected by yields around the world. Estonia’s cereal harvests cover the needs of the domestic market provided that the weather conditions are normal. In the last harvest year (1 July 2009 to 30 June 2010) consumption accounted for approximately 80% of production. Animal feed accounts for most consumption, with human consumption making up a modest 15%. Exports of cereals exceed imports by as much as 100%. The UN Food and Agriculture Organisation (FAO) predicts a 2.6% decline in the total harvest for
this harvest year. A slight decrease in yield was followed by an excessive response by market participants. Prices of cereals skyrocketed on the world market in the second half of 2010.
Cereal exports have been quite volatile in recent years and are influenced by major single cereal transactions. This volatility is caused by large-scale exports of cereals and seeds in the last quarter, since a large part of the harvest is intended to be marketed. In the first 10 months of 2010 export turnover was 3% higher than one year previously (10% higher by volume). Exports of cereal products can be categorised into four groups: cereals, processed cereals (such as flour and grain mill products), bakery products and oil seeds and fruits. The export volumes of cereal and bakery products grew. Compared to other cereal product groups, more success was achieved in increasing exports of wheat and barley (the export turnover of which increased by nearly 50% in 2010). Exports of cereal products were declining at the beginning of the year, but picked up again in the summer months due to, inter alia, rising world market prices and export
Sources: Statistics Estonia, Estonian Institute of Economic Research
EE
K/k
g
0
0/5
1/0
1/5
2/0
2/5
3/0
3/5
4/0
4/5
01/2
007
03/2
007
05/2
007
07/2
007
09/2
007
11/2
007
01/2
008
03/2
008
05/2
008
07/2
008
09/2
008
11/2
008
01/2
009
03/2
009
05/2
009
07/2
009
09/2
009
11/2
009
01/2
010
03/2
010
05/2
010
07/2
010
09/2
010
Estonia`s export price EU-27 export price Lithuania`s export price
buying-up price for milling wheat buying-up price for feed wheat
Figure 7. development of buying-up prices and export prices of wheat
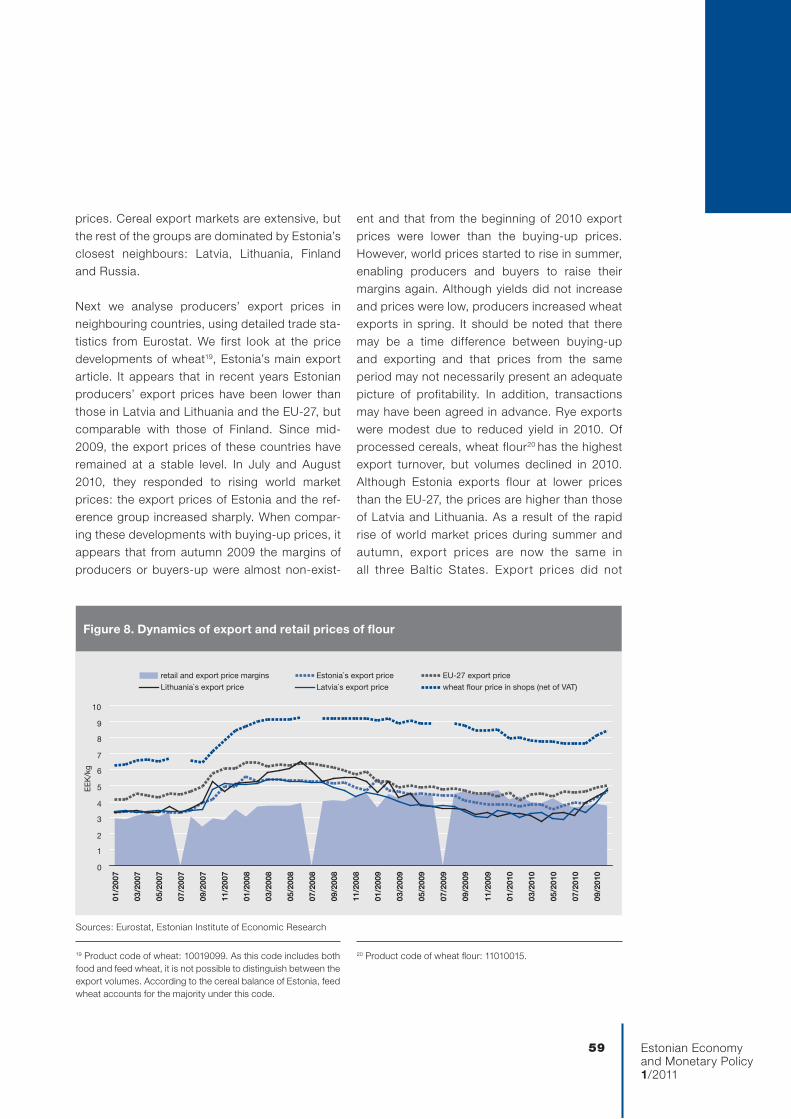
Estonian Economyand Monetary Policy1/2011
59
prices. Cereal export markets are extensive, but the rest of the groups are dominated by Estonia’s closest neighbours: Latvia, Lithuania, Finland and Russia.
Next we analyse producers’ export prices in neighbouring countries, using detailed trade sta-tistics from Eurostat. We first look at the price developments of wheat19, Estonia’s main export article. It appears that in recent years Estonian producers’ export prices have been lower than those in Latvia and Lithuania and the EU-27, but comparable with those of Finland. Since mid-2009, the export prices of these countries have remained at a stable level. In July and August 2010, they responded to rising world market prices: the export prices of Estonia and the ref-erence group increased sharply. When compar-ing these developments with buying-up prices, it appears that from autumn 2009 the margins of producers or buyers-up were almost non-exist-
ent and that from the beginning of 2010 export prices were lower than the buying-up prices. However, world prices started to rise in summer, enabling producers and buyers to raise their margins again. Although yields did not increase and prices were low, producers increased wheat exports in spring. It should be noted that there may be a time difference between buying-up and exporting and that prices from the same period may not necessarily present an adequate picture of profitability. In addition, transactions may have been agreed in advance. Rye exports were modest due to reduced yield in 2010. Of processed cereals, wheat flour20 has the highest export turnover, but volumes declined in 2010. Although Estonia exports flour at lower prices than the EU-27, the prices are higher than those of Latvia and Lithuania. As a result of the rapid rise of world market prices during summer and autumn, export prices are now the same in all three Baltic States. Export prices did not
EE
K/k
g
0
1
2
3
4
5
6
7
8
9
10
01/2
007
03/2
007
05/2
007
07/2
007
09/2
007
11/2
007
01/2
008
03/2
008
05/2
008
07/2
008
09/2
008
11/2
008
01/2
009
03/2
009
05/2
009
07/2
009
09/2
009
11/2
009
01/2
010
03/2
010
05/2
010
07/2
010
09/2
010
retail and export price margins Estonia`s export price EU-27 export price
Lithuania`s export price Latvia`s export price wheat flour price in shops (net of VAT)
Figure 8. dynamics of export and retail prices of flour
Sources: Eurostat, Estonian Institute of Economic Research
19 Product code of wheat: 10019099. As this code includes both food and feed wheat, it is not possible to distinguish between the export volumes. According to the cereal balance of Estonia, feed wheat accounts for the majority under this code.
20 Product code of wheat flour: 11010015.
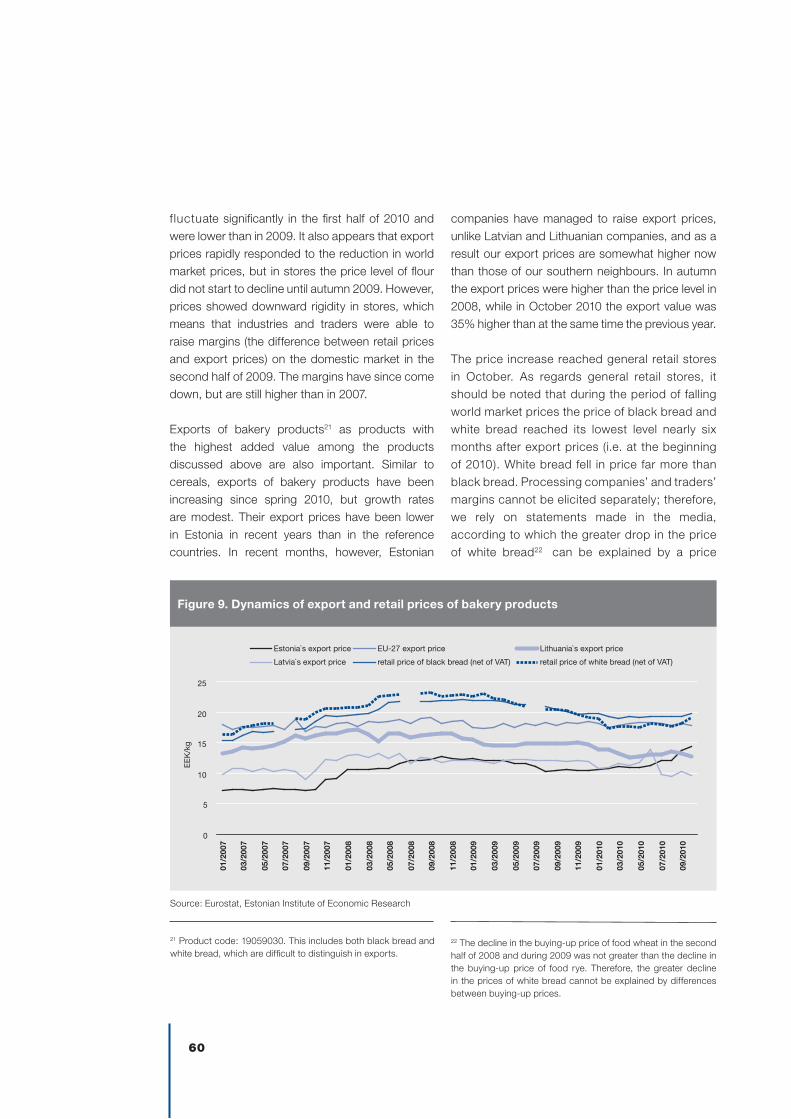
60
f luctuate significantly in the first half of 2010 and were lower than in 2009. It also appears that export prices rapidly responded to the reduction in world market prices, but in stores the price level of flour did not start to decline until autumn 2009. However, prices showed downward rigidity in stores, which means that industries and traders were able to raise margins (the difference between retail prices and export prices) on the domestic market in the second half of 2009. The margins have since come down, but are still higher than in 2007.
Exports of bakery products21 as products with the highest added value among the products discussed above are also important. Similar to cereals, exports of bakery products have been increasing since spring 2010, but growth rates are modest. Their export prices have been lower in Estonia in recent years than in the reference countries. In recent months, however, Estonian
0
5
10
15
20
25
01/2
007
03/2
007
05/2
007
07/2
007
09/2
007
11/2
007
01/2
008
03/2
008
05/2
008
07/2
008
09/2
008
11/2
008
01/2
009
03/2
009
05/2
009
07/2
009
09/2
009
11/2
009
01/2
010
03/2
010
05/2
010
07/2
010
09/2
010
EE
K/k
g
Estonia`s export price EU-27 export price Lithuania`s export price
Latvia`s export price retail price of black bread (net of VAT) retail price of white bread (net of VAT)
Figure 9. dynamics of export and retail prices of bakery products
Source: Eurostat, Estonian Institute of Economic Research
companies have managed to raise export prices, unlike Latvian and Lithuanian companies, and as a result our export prices are somewhat higher now than those of our southern neighbours. In autumn the export prices were higher than the price level in 2008, while in October 2010 the export value was 35% higher than at the same time the previous year.
The price increase reached general retail stores in October. As regards general retail stores, it should be noted that during the period of falling world market prices the price of black bread and white bread reached its lowest level nearly six months after export prices (i.e. at the beginning of 2010). White bread fell in price far more than black bread. Processing companies’ and traders’ margins cannot be elicited separately; therefore, we rely on statements made in the media, according to which the greater drop in the price of white bread22 can be explained by a price
21 Product code: 19059030. This includes both black bread and white bread, which are difficult to distinguish in exports.
22 The decline in the buying-up price of food wheat in the second half of 2008 and during 2009 was not greater than the decline in the buying-up price of food rye. Therefore, the greater decline in the prices of white bread cannot be explained by differences between buying-up prices.
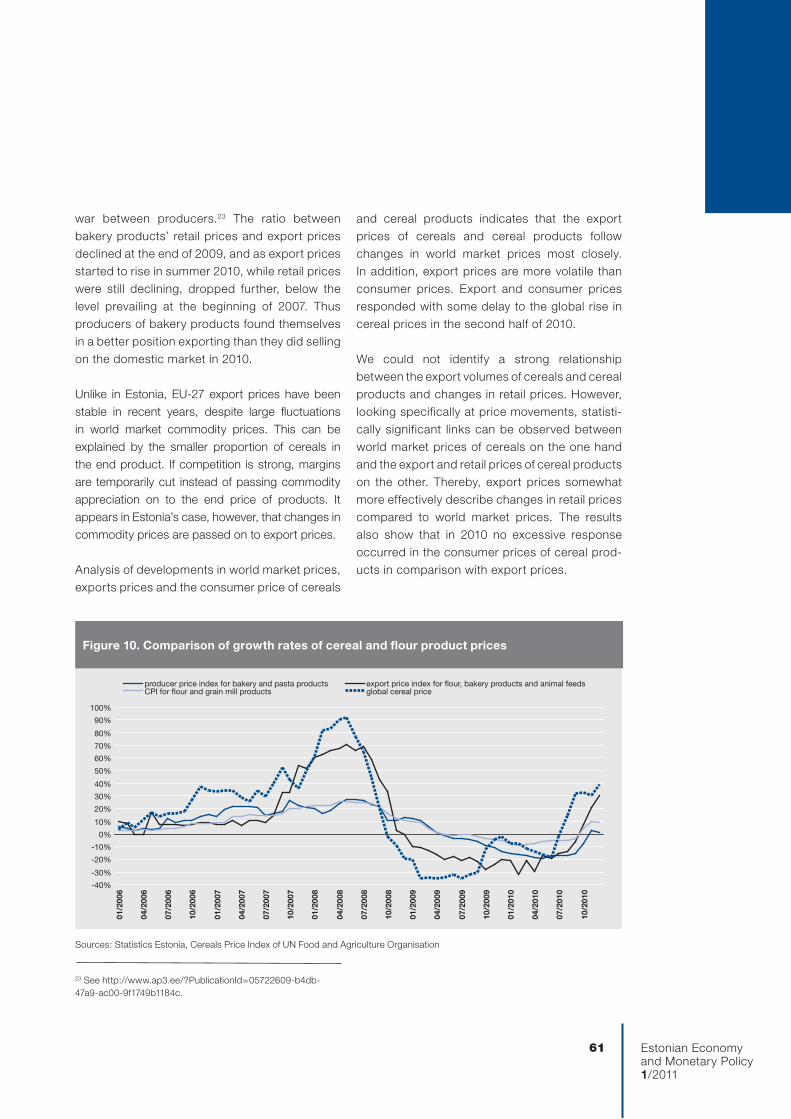
Estonian Economyand Monetary Policy1/2011
61
war between producers.23 The ratio between bakery products’ retail prices and export prices declined at the end of 2009, and as export prices started to rise in summer 2010, while retail prices were still declining, dropped further, below the level prevailing at the beginning of 2007. Thus producers of bakery products found themselves in a better position exporting than they did selling on the domestic market in 2010.
Unlike in Estonia, EU-27 export prices have been stable in recent years, despite large fluctuations in world market commodity prices. This can be explained by the smaller proportion of cereals in the end product. If competition is strong, margins are temporarily cut instead of passing commodity appreciation on to the end price of products. It appears in Estonia’s case, however, that changes in commodity prices are passed on to export prices.
Analysis of developments in world market prices, exports prices and the consumer price of cereals
and cereal products indicates that the export prices of cereals and cereal products follow changes in world market prices most closely. In addition, export prices are more volatile than consumer prices. Export and consumer prices responded with some delay to the global rise in cereal prices in the second half of 2010.
We could not identify a strong relationship between the export volumes of cereals and cereal products and changes in retail prices. However, looking specifically at price movements, statisti-cally significant links can be observed between world market prices of cereals on the one hand and the export and retail prices of cereal products on the other. Thereby, export prices somewhat more effectively describe changes in retail prices compared to world market prices. The results also show that in 2010 no excessive response occurred in the consumer prices of cereal prod-ucts in comparison with export prices.
-40%
-30%
-20%
-10%
0%
10%
20%
30%
40%
50%
60%
70%
80%
90%
100%
01/2
006
04/2
006
07/2
006
10/2
006
01/2
007
04/2
007
07/2
007
10/2
007
01/2
008
04/2
008
07/2
008
10/2
008
01/2
009
04/2
009
07/2
009
10/2
009
01/2
010
04/2
010
07/2
010
10/2
010
producer price index for bakery and pasta products export price index for flour, bakery products and animal feedsCPI for flour and grain mill products global cereal price
Figure 10. Comparison of growth rates of cereal and flour product prices
Sources: Statistics Estonia, Cereals Price Index of UN Food and Agriculture Organisation
23 See http://www.ap3.ee/?PublicationId=05722609-b4db-47a9-ac00-9f1749b1184c.
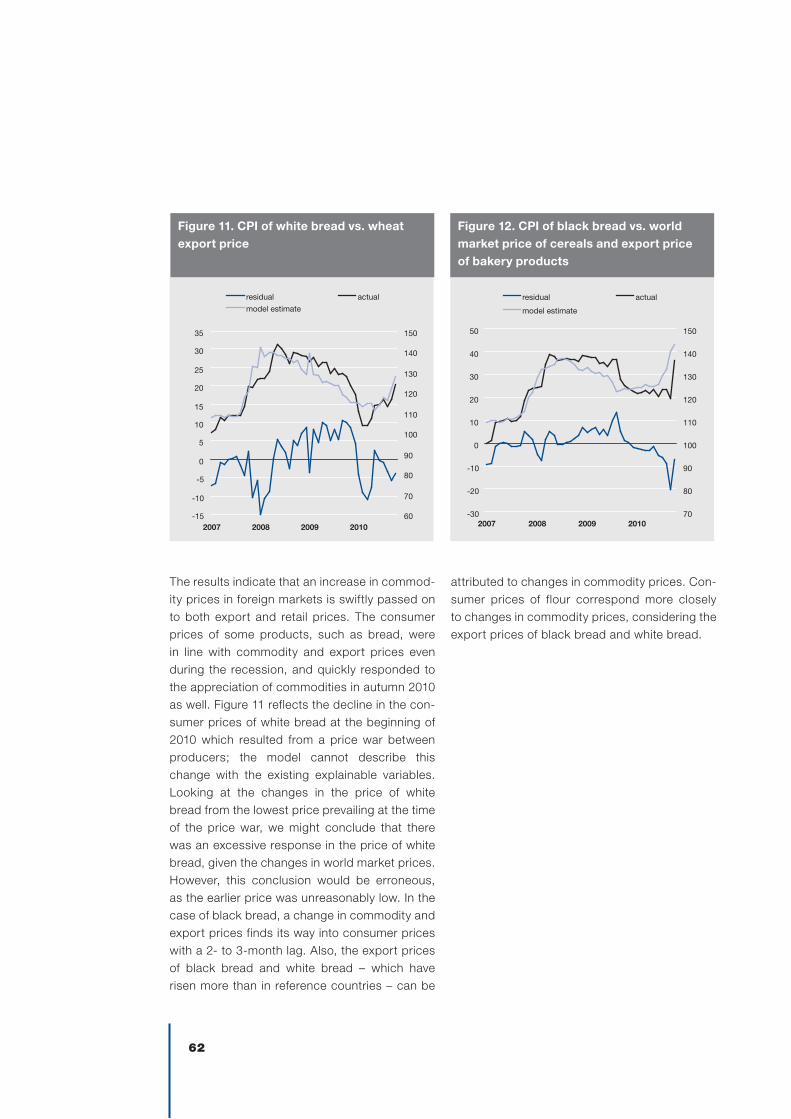
62
-30
-20
-10
0
10
20
30
40
50
2007 2008 2009 201070
80
90
100
110
120
130
140
150
residual actual
model estimate
-15
-10
-5
0
5
10
15
20
25
30
35
2007 2008 2009 201060
70
80
90
100
110
120
130
140
150
residual actual
model estimate
Figure 11. CpI of white bread vs. wheat export price
Figure 12. CpI of black bread vs. world market price of cereals and export price of bakery products
The results indicate that an increase in commod-ity prices in foreign markets is swiftly passed on to both export and retail prices. The consumer prices of some products, such as bread, were in line with commodity and export prices even during the recession, and quickly responded to the appreciation of commodities in autumn 2010 as well. Figure 11 reflects the decline in the con-sumer prices of white bread at the beginning of 2010 which resulted from a price war between producers; the model cannot describe this change with the existing explainable variables. Looking at the changes in the price of white bread from the lowest price prevailing at the time of the price war, we might conclude that there was an excessive response in the price of white bread, given the changes in world market prices. However, this conclusion would be erroneous, as the earlier price was unreasonably low. In the case of black bread, a change in commodity and export prices finds its way into consumer prices with a 2- to 3-month lag. Also, the export prices of black bread and white bread – which have risen more than in reference countries – can be
attributed to changes in commodity prices. Con-sumer prices of flour correspond more closely to changes in commodity prices, considering the export prices of black bread and white bread.
Estonian Economyand Monetary Policy1/2011
63
pART III. ANAlySIS OF COMpETITIvE SITuATION IN FOOd Supply CHAIN
SITUATION IN EUROpEAN UNION OVERALL
Close attention has been paid to the food sector in the European Union, especially since the steep price increase in 2007 and 2008. The European Commission examined24 whether concentration in the food supply chain can cause problems, whether there is price rigidity and whether these can be linked to competition failure. It is difficult to draw firm conclusions, given the different conditions in terms of products, geographical areas and seasonality.
The non-processed food sector is fragmented in the EU, with producers being the least concen-trated link in the supply chain. Fragmentation and weak links with end customers (many intermediar-ies) often lead to low productivity, as well as weak bargaining power among producers. Thus, prob-lems are seen in low concentration (rather than high concentration) in the non-processed food sector, which can be alleviated to some extent by producers’ concentration in associations.
The processed food sector (food industry) is characterised by higher concentration and the presence of multinationals who can resist pressure from the trade sector (branded prod-ucts which must be represented in the range of goods) and thus earn higher profits than the market average. There are also many smaller companies on the market that offer alternatives (in terms of range and price) but whose bargain-ing power is much weaker.
The retail sector has followed an intense con-centration trend over the last 20 years. However, there are countries in the EU whose market is shared by a higher number of companies. Despite high concentration, competition is regarded as fierce and price wars are not uncommon. All in
24 For more information, see Competition in the Food Supply Chain. Commission Staff Working Document. Brussels, 28.10.2009, SEC(2009) 1449.
25 Ibid, p. 15.
all, retail price increases have been lower than general inflation.
Nevertheless, consumers perceive that the cost of food has risen more than that of other goods and that food is too expensive. To some extent, such a perception derives from the fact that people prefer processed foods whose production, storage, transportation, advertising etc. are more expensive and in the case of which the share of commodities in the end price is small. Additional regulations have resulted in extra costs, too.
The more the intermediaries in the food supply chain, the weaker the link between the end price of a product and the commodity price: each chain adds its margin to cover costs and ensure profitability. Discrepancies between current market prices and actual costs result from seasonality, multi-year cycles involving entry into contracts and product consumption and different contractual prices. Therefore, short-term differences in price developments need not directly refer to problems; the relationship between producer prices and end consumer prices “is far from being mechanical, determinist, easily identifiable, foreseeable or immediate in time”25 (for the dairy sector). Competition violations have been ascertained and sanctions have been imposed in the food sector of the EU, with cartels being the focus of attention. Abuse of market power has not been ascertained in the retail sector. However, worrying trade practices have been identified which may prove to be problematic in certain circumstances ( joint purchases, exclusive supply agreements, certificates and increasing use of private labels by retail chains). This behaviour does not necessarily inhibit competition and could even be economically reasonable, but it may harm competition in some cases.
64
According to the data of the Estonian Competition Authority, criminal proceedings are underway in three cases concerning the food sector:
1. possible prohibited agreement on the sale of milk (a ‘milk cartel’);
2. possible prohibited agreement on certain cereal products (a ‘bread cartel’); and
3. possible prohibited agreement between mills (a ‘mill cartel’).
Earlier cases concerning the food sector date back 10–15 years.
pEOpLE’S pERCEpTIONS OF COMpETITION pOLICY ANd COMpETITIVE SITUATION IN ThE FOOd SECTOR
In November 2009 a population survey was conducted in the Member States of the European Union which looked at how people perceived competition policy.26 The survey was conducted at a time when prices (including food prices) were relatively low; therefore, such a survey could well give different results if conducted today.
Estonians’ interest in competition policy was among the lowest of all Member States; opinions regarding related issues (controlling competition between companies would benefit consumers and society; agreements on prices between companies should not be allowed; financial aid from governments to companies might give these companies an unfair advantage over their competitors; and the need for more information about competition) were also among the lowest. Estonians’ lower than average estimates in many areas, however, do not necessarily refer to the insignificance of the problems, but may rather imply a shift in general attitudes and opinions. The proportion of those who did not respond or did not have an opinion was rather large in the case of Estonia. On the other hand, the proportion of those who did not agree with the statements presented was somewhat larger.
Similar to other Member States, the energy sector is seen as a major problem area in terms of competition, with other sectors (such as medications, transportation, telecommunications and financial services) being perceived as far less important. 16% of the Estonian population perceive major competition concerns in the food sector; this is equal to the EU average.
Excessively high prices are seen as the main problem of the food sector (and other sectors) in Estonia and elsewhere. Some other problems – the quality of products, difficulties in changing suppliers and limited choice – are perceived as somewhat more important in Estonia than in other countries.
EARLIER COMpETITION ANALYSIS
Taking guidance from a competition analysis carried out in the United Kingdom,27 the Ministry of Economic Affairs and Communications assessed the competitive situation in Estonia a few years ago based on the productivity, profitability and revenue concentration of different sectors. Due to the limited nature of the data, a simplified approach was used in which sectors at the level of three-digit codes under the classification of Estonia’s economic activities (EMTAK) were arranged on the basis of the sum of scores for said indicators. It was assumed that potential competition problems should normally be accompanied by a slow increase or decrease in productivity, higher-than-average profitability and strong concentration. Based on this methodology and the data for 2003–2005, potential problem sectors were dominated by those which are relatively capital-intensive and often related to the provision of utility services (telecommunications, gas, heat and water).28
26 Flash Eurobarometer 264. EU citizens' perceptions of compe-tition policy. November 2009. http://ec.europa.eu/competition/publications/reports/citizens_en.pdf.
27 Empirical indicators for market investigations. Office of Fair Trading, September 2004. http://www.oft.gov.uk/shared_oft/reports/comp_policy/oft749a.pdf.28 Very small sectors (whose share in the total sales of companies is less than 0.19%) and export-oriented industries (where exports account for more than 50% of sales) were excluded.
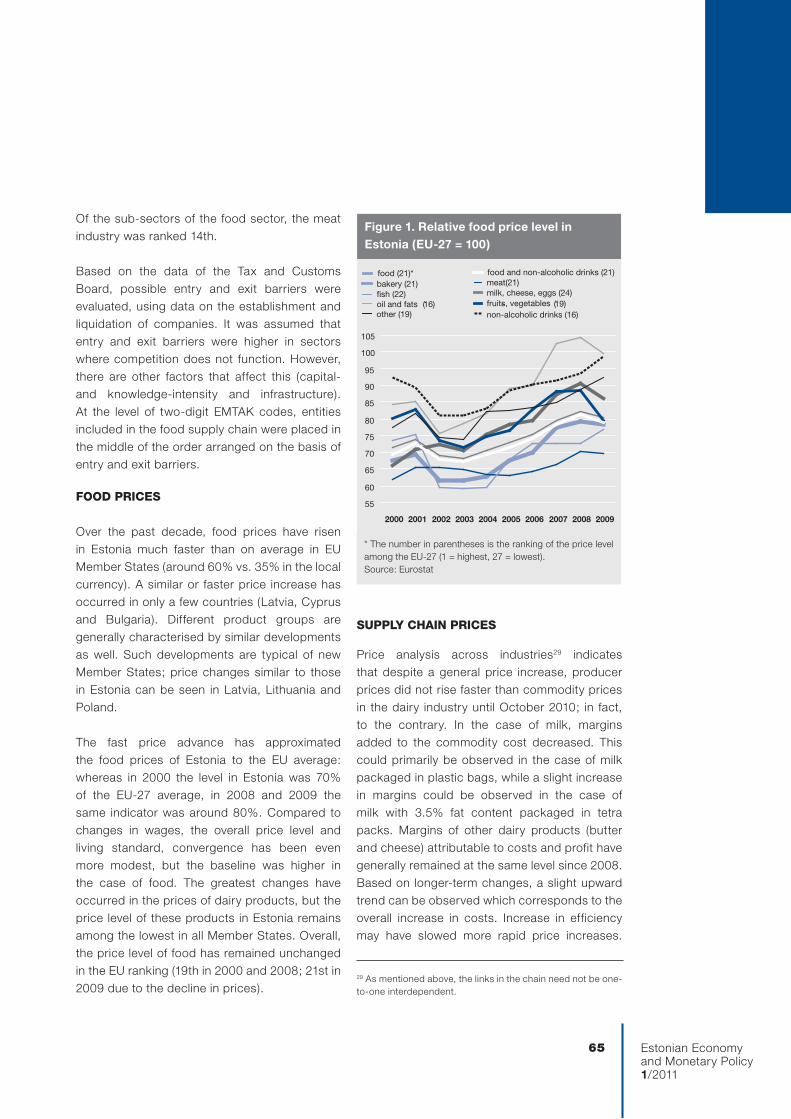
Estonian Economyand Monetary Policy1/2011
65
Of the sub-sectors of the food sector, the meat industry was ranked 14th.
Based on the data of the Tax and Customs Board, possible entry and exit barriers were evaluated, using data on the establishment and liquidation of companies. It was assumed that entry and exit barriers were higher in sectors where competition does not function. However, there are other factors that affect this (capital- and knowledge-intensity and infrastructure). At the level of two-digit EMTAK codes, entities included in the food supply chain were placed in the middle of the order arranged on the basis of entry and exit barriers.
FOOd pRICES
Over the past decade, food prices have risen in Estonia much faster than on average in EU Member States (around 60% vs. 35% in the local currency). A similar or faster price increase has occurred in only a few countries (Latvia, Cyprus and Bulgaria). Different product groups are generally characterised by similar developments as well. Such developments are typical of new Member States; price changes similar to those in Estonia can be seen in Latvia, Lithuania and Poland.
The fast price advance has approximated the food prices of Estonia to the EU average: whereas in 2000 the level in Estonia was 70% of the EU-27 average, in 2008 and 2009 the same indicator was around 80%. Compared to changes in wages, the overall price level and living standard, convergence has been even more modest, but the baseline was higher in the case of food. The greatest changes have occurred in the prices of dairy products, but the price level of these products in Estonia remains among the lowest in all Member States. Overall, the price level of food has remained unchanged in the EU ranking (19th in 2000 and 2008; 21st in 2009 due to the decline in prices).
Figure 1. Relative food price level in Estonia (EU-27 = 100)
* The number in parentheses is the ranking of the price level among the EU-27 (1 = highest, 27 = lowest).Source: Eurostat
55
60
65
70
75
80
85
90
95
100
105
2000 2001 2002 2003 2004 2005 2006 2007 2008 2009
food and non-alcoholic drinks (21)food (21)*bakery (21) meat(21)fish (22) milk, cheese, eggs (24)oil and fats (16) fruits, vegetables- (19)other (19) non-alcoholic drinks (16)
SUppLY ChAIN pRICES
Price analysis across industries29 indicates that despite a general price increase, producer prices did not rise faster than commodity prices in the dairy industry until October 2010; in fact, to the contrary. In the case of milk, margins added to the commodity cost decreased. This could primarily be observed in the case of milk packaged in plastic bags, while a slight increase in margins could be observed in the case of milk with 3.5% fat content packaged in tetra packs. Margins of other dairy products (butter and cheese) attributable to costs and profit have generally remained at the same level since 2008. Based on longer-term changes, a slight upward trend can be observed which corresponds to the overall increase in costs. Increase in efficiency may have slowed more rapid price increases.
29 As mentioned above, the links in the chain need not be one-to-one interdependent.

66
Sales revenue per employee more than doubled in the dairy industry from 2000 to 2008. Profitability30 has also improved (from roughly 3% to 6%), but Estonia does not stand out among other Member States in this regard. Although there has been some consolidation, the number of companies per capita is almost the same in Estonia as the EU average. In relative terms, the number of dairy companies in Estonia is higher than in Latvia, Lithuania, Poland, Finland, Sweden and Denmark.
The last few months of 2010, especially Octo-ber, saw quite a significant price jump: margins on milk rose in the order of 50% over a month; margins on other dairy products also increased. Although there are signs of economic recov-ery, price developments still seem steep at first glance. It should be taken into account, however, that last year was relatively difficult for compa-
Sources: Estonian Institute of Economic Research, Statistics Estonia, author’s calculations
Figure 2. Notional margins on dairy products (producer price less buying-up of milk)
Figure 3. Margins on retail sales of dairy products (retail price excluding vAT – producer price)
milk 2.5%, plastic package (l)
milk 2.5%, tetra package (l)
local cheese (kg) (right scale)
unflavoured cottage cheese 4% (kg) (right scale)
butter over 80%, small package (kg) (right scale)
farm spread (kg) (right scale)
0,0
0,5
1,0
1,5
2,0
2,5
01/0
1/20
07
01/0
1/20
08
01/0
1/20
09
01/0
1/20
10
EE
K
0
5
10
15
20
25
30
35
40
45
50
EE
K
Sources: Estonian Institute of Economic Research, Statistics Estonia, author’s calculations
0
2
4
6
8
10
12
14
01
/01
/20
02
01
/01
/20
03
01
/01
/20
04
01
/01
/20
05
01
/01
/20
06
01
/01
/20
07
01
/01
/20
08
01
/01
/20
09
01
/01
/20
10
EE
K
-10
-5
0
5
10
15
20
25
30
EE
K (c
on
diti
on
ally
)
milk 2.5%, plastic package (l)milk 2.5%, tetra package (l)milk 3.5%, plactic package(l)milk 3.5%, tetra package (l)local cheese (kg) (right scale)unflavoured cottage cheese 4% (kg) (right scale)butter over 80%, small package (kg) (right scale)farm spread, small package (kg) (right scale)
nies and profitability is expected to rise to nor-mal levels. In the fourth quarter of 2010, margins on milk and butter rose to the level of the aver-age estimate for the last three years (including the period of high food prices in 2008) or even slightly higher, while margins on cheese were lower than the average of recent years.
For cheese and butter it was assumed that it takes 10 litres of milk to produce 1 kg of cheese and 5 litres of milk to produce 1 kg of cottage cheese.32
On the production side, there were no significant signs of a more rapid rise in prices compared
30 Profitability is viewed as gross operating surplus, with interme-diate consumption of products and services, as well as labour costs, being deducted on the cost side (no depreciation is taken into account).
31 The practice of making cheese is taken as the basis (http://www.endla.joosu.ee/piim-ja-piimatooted): on average, it takes 10 kg of milk to produce 1 kg of cheese; as the specific weight of milk is a little more than 1kg/l, a litre of milk is equated to 1 kg of milk). For other products, the estimates are inaccurate; the esti-mations aim to characterise the relationship between commodity and end prices in general terms. For more information about links between milk and end products, see e.g. Dairy Technology. SPX Corporation http://www.apv.com/pdf/brochures/Dairy_Techno-logy_9002_01_07_2008_GB.pdf.
Estonian Economyand Monetary Policy1/2011
67
to commodity prices until October 2010. Similar developments occurred on the sales side, although fundamental changes in pricing can be observed in the case of some products.
Margins on milk packaged in plastic bags are particularly noteworthy. A few years ago milk was offered in stores with virtually non-existent margins (which cannot be regarded as normal in commercial terms, but rather as a strategy to attract customers). The difference between margins on milk packaged in plastic bags and tetra packs has decreased substantially since then, but the increase in milk prices in recent months can in no way be justified by an increase in cost components. (Ex-post compensation for costs could be a reason for the price increase.)
Margins on other dairy products also rose quickly in October 2010, but were comparable with average historical levels (in absolute terms and when looking at the relation of margins to producer prices).
As regards other foodstuffs, there are insuffi-cient data to analyse prices in the buying-up – producer – consumer chain; therefore, we com-pared changes in commodity buying-up prices and retail prices.32
During the last few months of 2010, margins on meat products, black bread, white bread and flour were generally close to the historical average, or slightly higher. Margins on beef, however, reached a new peak.
Other products were also characterised by rapid price hikes in October 2010, but these cannot be considered exceptional, given the developments that had already occurred.
As to the average price, it is worth noting that in practice the prices of even ‘homogeneous’ products differ significantly across regions and stores. For example, the maximum price of 2.5% milk packaged in plastic bags differed from the minimum price by anywhere between 10% and 50% in 2010. The difference was slightly lower in economy stores and markets, but even there the gaps were in the order of 20%. Price differences were even greater in the case of other products.
STRUCTURE OF FOOd INdUSTRY
Given the size (population) of the country, the number of companies in the Estonian food industry is around two times lower than the EU average. The situation is similar to northern European countries; in general, there are many companies in southern Member States. Like other countries, there has been consolidation in Estonia, which means that the number of companies has decreased over the years.
Profitability of the companies operating in Estonia’s food industry is at the level of the EU average or even below average, and the situation has not changed significantly in recent years. Also, Estonia does not differ from other countries in terms of the share of profit in added value. These observations apply to the food industry as a whole and to all sub-sectors. The meat industry has been in a somewhat better position in terms of profitability. As regards business density, there are relatively fewer companies in the Estonian flour and grain mill sector (and profitability data are not published due to confidentiality) but more in the fishing industry.
In the trade sector, business activity in Estonia’s wholesale trade segment (which includes all areas, not only food) is among the highest in Europe; the opposite is true in the retail trade segment (all sub-segments). In the segment of non-specialised retail establishments (with food, beverages or tobacco predominating),
32 We looked at simplified relations: retail price (excluding VAT) – commodity price (meat or cereal), without any additional revalua-tions of quantities based on the commodity content (1 kg of end product was compared to the price of 1 kg of the commodity).
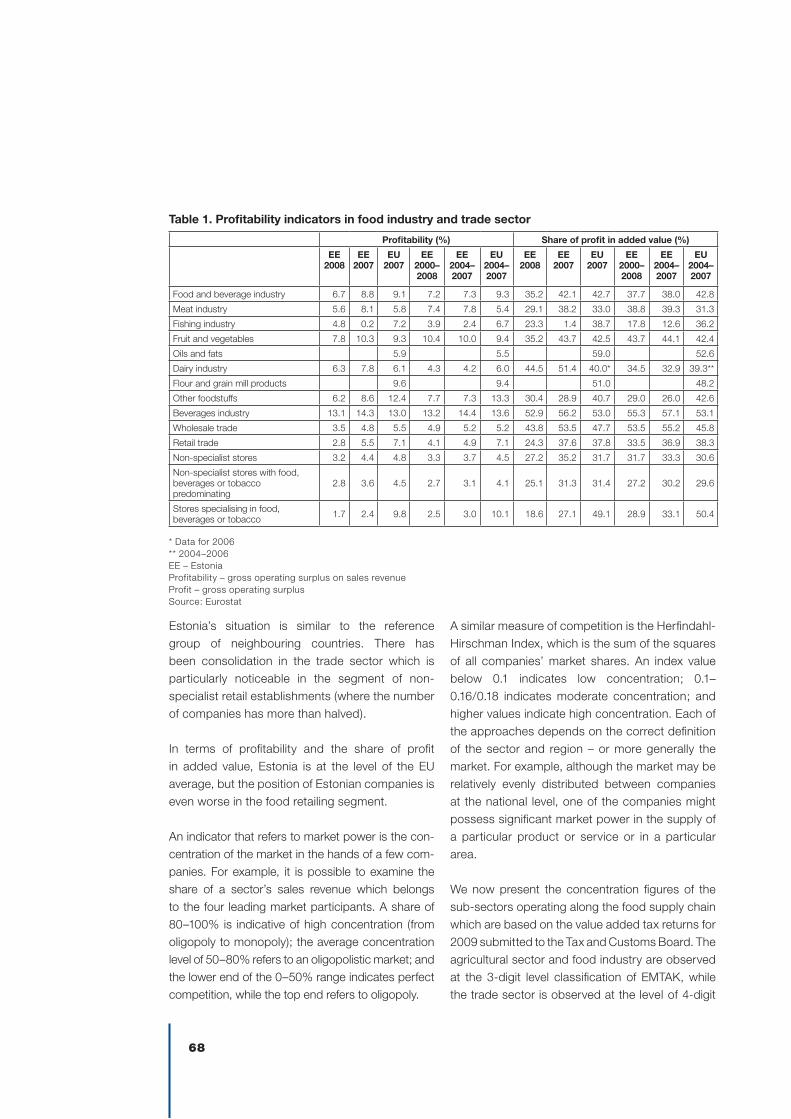
68
Estonia’s situation is similar to the reference group of neighbouring countries. There has been consolidation in the trade sector which is particularly noticeable in the segment of non-specialist retail establishments (where the number of companies has more than halved).
In terms of profitability and the share of profit in added value, Estonia is at the level of the EU average, but the position of Estonian companies is even worse in the food retailing segment.
An indicator that refers to market power is the con-centration of the market in the hands of a few com-panies. For example, it is possible to examine the share of a sector’s sales revenue which belongs to the four leading market participants. A share of 80–100% is indicative of high concentration (from oligopoly to monopoly); the average concentration level of 50–80% refers to an oligopolistic market; and the lower end of the 0–50% range indicates perfect competition, while the top end refers to oligopoly.
A similar measure of competition is the Herfindahl-Hirschman Index, which is the sum of the squares of all companies’ market shares. An index value below 0.1 indicates low concentration; 0.1–0.16/0.18 indicates moderate concentration; and higher values indicate high concentration. Each of the approaches depends on the correct definition of the sector and region – or more generally the market. For example, although the market may be relatively evenly distributed between companies at the national level, one of the companies might possess significant market power in the supply of a particular product or service or in a particular area.
We now present the concentration figures of the sub-sectors operating along the food supply chain which are based on the value added tax returns for 2009 submitted to the Tax and Customs Board. The agricultural sector and food industry are observed at the 3-digit level classification of EMTAK, while the trade sector is observed at the level of 4-digit
profitability (%) Share of profit in added value (%)
EE 2008
EE 2007
EU 2007
EE 2000–2008
EE 2004–2007
EU 2004–2007
EE 2008
EE 2007
EU 2007
EE 2000–2008
EE 2004–2007
EU 2004–2007
Food and beverage industry 6.7 8.8 9.1 7.2 7.3 9.3 35.2 42.1 42.7 37.7 38.0 42.8
Meat industry 5.6 8.1 5.8 7.4 7.8 5.4 29.1 38.2 33.0 38.8 39.3 31.3
Fishing industry 4.8 0.2 7.2 3.9 2.4 6.7 23.3 1.4 38.7 17.8 12.6 36.2
Fruit and vegetables 7.8 10.3 9.3 10.4 10.0 9.4 35.2 43.7 42.5 43.7 44.1 42.4
Oils and fats 5.9 5.5 59.0 52.6
Dairy industry 6.3 7.8 6.1 4.3 4.2 6.0 44.5 51.4 40.0* 34.5 32.9 39.3**
Flour and grain mill products 9.6 9.4 51.0 48.2
Other foodstuffs 6.2 8.6 12.4 7.7 7.3 13.3 30.4 28.9 40.7 29.0 26.0 42.6
Beverages industry 13.1 14.3 13.0 13.2 14.4 13.6 52.9 56.2 53.0 55.3 57.1 53.1
Wholesale trade 3.5 4.8 5.5 4.9 5.2 5.2 43.8 53.5 47.7 53.5 55.2 45.8
Retail trade 2.8 5.5 7.1 4.1 4.9 7.1 24.3 37.6 37.8 33.5 36.9 38.3
Non-specialist stores 3.2 4.4 4.8 3.3 3.7 4.5 27.2 35.2 31.7 31.7 33.3 30.6
Non-specialist stores with food, beverages or tobacco predominating
2.8 3.6 4.5 2.7 3.1 4.1 25.1 31.3 31.4 27.2 30.2 29.6
Stores specialising in food, beverages or tobacco 1.7 2.4 9.8 2.5 3.0 10.1 18.6 27.1 49.1 28.9 33.1 50.4
Table 1. profitability indicators in food industry and trade sector
* Data for 2006** 2004–2006EE – EstoniaProfitability – gross operating surplus on sales revenueProfit – gross operating surplusSource: Eurostat
Estonian Economyand Monetary Policy1/2011
69
codes. Smaller segments, in particular, are char-acterised by higher concentration (production of oil, production of flour and grain mill products and sales of fruit and vegetables in specialist stores still compete with non-specialist stores). Among larger segments, the production of beverages is heavily concentrated, but here the above-mentioned issue of market definition must be remembered – among the four major producers there are two brewer-ies, a producer of strong alcoholic beverages and a producer of non-alcoholic beverages. At a more detailed level the results are affected by the small-ness of Estonia (there are a just a couple of compa-nies in some segments).
The concentration indicators show that the situation is generally better in the link of unprocessed food (agriculture and fisheries); concentration can be considered moderate at the level of major food industry segments.
Some comparisons with other countries indicate a much higher concentration in the food industry of Estonia. Five leading companies generally hold over 60% of the market in Estonia; in Ireland33 and the United Kingdom34 the share of the five leading companies was several times lower (in the order of 20–40%) in the main segments of the food industry (milk, meat and fish) a few years ago. As to other sectors, the example of the United Kingdom also refers to a higher concentration in smaller segments, such as the production of confectionery products, oils and fats and soft drinks. Overall, market concentration is much higher in Estonia.
When defining a market, imports must also be taken into account. At the aggregate level,
imports account for around one-fifth of the total supply of agricultural products; in the supply of fish, food and beverages, imports make up more than a third.35 At a more detailed level, some products are presumed to exhibit ‘specialisation’: the proportion of imports is greater in the case of products that are not produced in Estonia (e.g. exotic fruits); the role of the domestic industry is greater in the case of basic foodstuffs (meat and dairy products).
Estonian foodstuffs have traditionally played a strong role on the Estonian market. According to the study “Position of Estonian foodstuffs in the domestic market” conducted by the Institute of Economic Research,36 the proportion of domestic foodstuffs in the range of products accounted for more than 60% in May 2010 (the share being higher in rural areas and lower in Tallinn). Based on sales it can be concluded that the vast majority (90% or more) of dairy products (except processed cheese), meat products (except poultry and canned meat) and bread is of Estonian origin. Imported goods cover more than half of the market in such segments as margarine and cooking oil, wheat flour, pasta, cucumbers and tomatoes, cookies and juices. Imported goods mainly originate from Latvia, Finland, Poland, Germany and Lithuania. Over the last 15 years Estonian products have lost some of their positions (in many cases, the baseline was 100% market share), but some products have increased their market share (yoghurt, vegetable and animal fats and vegetables).
33 Patrick McCloughan. What's Been Happening To Concentration in Irish Industry 1991–2001. The Economic and Social Review, Vol. 36, No. 2, Summer/Autumn, 2005, pp. 127–156; table 3, p. 144. http://www.esr.ie/Vol36_2/03_McCloughan_Artlcle.pdf.34 Sanjiv Mahajan. Office for National Statistics. Concentration ratios for businesses by industry in 2004. Economic Trends 635 October 2006, pp. 25–47; Appendix 1, pp. 42–44. http://www.statistics.gov.uk/articles/economic_trends/ET635Mahajan_Concentration_Ratios_2004.pdf.
35 Based on the supply tables for 2006.36 See the summary in the Quarterly Review of the Estonian Economy No. 3 (174) 2010, pp. 57–60.
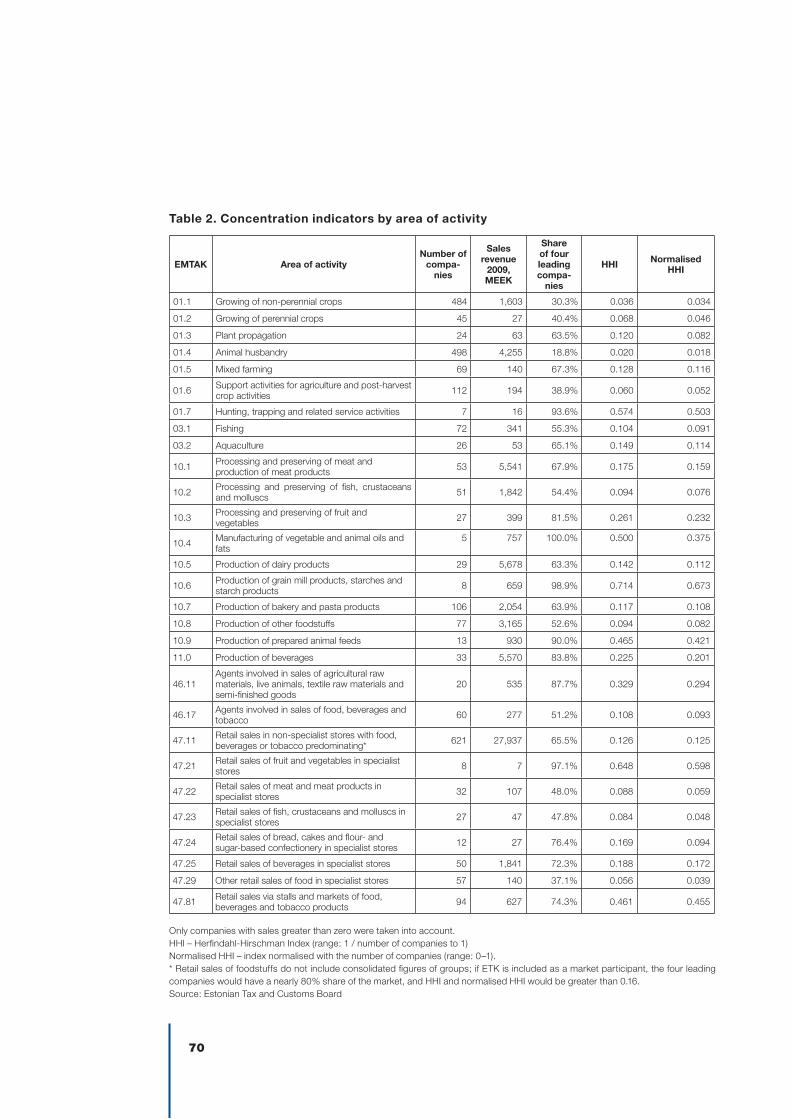
70
EMTAk Area of activityNumber of
compa-nies
Sales revenue
2009, MEEk
Share of four leading compa-
nies
HHI Normalised HHI
01.1 Growing of non-perennial crops 484 1,603 30.3% 0.036 0.034
01.2 Growing of perennial crops 45 27 40.4% 0.068 0.046
01.3 Plant propagation 24 63 63.5% 0.120 0.082
01.4 Animal husbandry 498 4,255 18.8% 0.020 0.018
01.5 Mixed farming 69 140 67.3% 0.128 0.116
01.6 Support activities for agriculture and post-harvest crop activities 112 194 38.9% 0.060 0.052
01.7 Hunting, trapping and related service activities 7 16 93.6% 0.574 0.503
03.1 Fishing 72 341 55.3% 0.104 0.091
03.2 Aquaculture 26 53 65.1% 0.149 0.114
10.1 Processing and preserving of meat and production of meat products 53 5,541 67.9% 0.175 0.159
10.2 Processing and preserving of fish, crustaceans and molluscs 51 1,842 54.4% 0.094 0.076
10.3 Processing and preserving of fruit and vegetables 27 399 81.5% 0.261 0.232
10.4 Manufacturing of vegetable and animal oils and fats
5 757 100.0% 0.500 0.375
10.5 Production of dairy products 29 5,678 63.3% 0.142 0.112
10.6 Production of grain mill products, starches and starch products 8 659 98.9% 0.714 0.673
10.7 Production of bakery and pasta products 106 2,054 63.9% 0.117 0.108
10.8 Production of other foodstuffs 77 3,165 52.6% 0.094 0.082
10.9 Production of prepared animal feeds 13 930 90.0% 0.465 0.421
11.0 Production of beverages 33 5,570 83.8% 0.225 0.201
46.11Agents involved in sales of agricultural raw materials, live animals, textile raw materials and semi-finished goods
20 535 87.7% 0.329 0.294
46.17 Agents involved in sales of food, beverages and tobacco 60 277 51.2% 0.108 0.093
47.11 Retail sales in non-specialist stores with food, beverages or tobacco predominating* 621 27,937 65.5% 0.126 0.125
47.21 Retail sales of fruit and vegetables in specialist stores 8 7 97.1% 0.648 0.598
47.22 Retail sales of meat and meat products in specialist stores 32 107 48.0% 0.088 0.059
47.23 Retail sales of fish, crustaceans and molluscs in specialist stores 27 47 47.8% 0.084 0.048
47.24 Retail sales of bread, cakes and flour- and sugar-based confectionery in specialist stores 12 27 76.4% 0.169 0.094
47.25 Retail sales of beverages in specialist stores 50 1,841 72.3% 0.188 0.172
47.29 Other retail sales of food in specialist stores 57 140 37.1% 0.056 0.039
47.81 Retail sales via stalls and markets of food, beverages and tobacco products 94 627 74.3% 0.461 0.455
Only companies with sales greater than zero were taken into account.HHI – Herfindahl-Hirschman Index (range: 1 / number of companies to 1)Normalised HHI – index normalised with the number of companies (range: 0–1).* Retail sales of foodstuffs do not include consolidated figures of groups; if ETK is included as a market participant, the four leading companies would have a nearly 80% share of the market, and HHI and normalised HHI would be greater than 0.16.Source: Estonian Tax and Customs Board
Table 2. Concentration indicators by area of activity
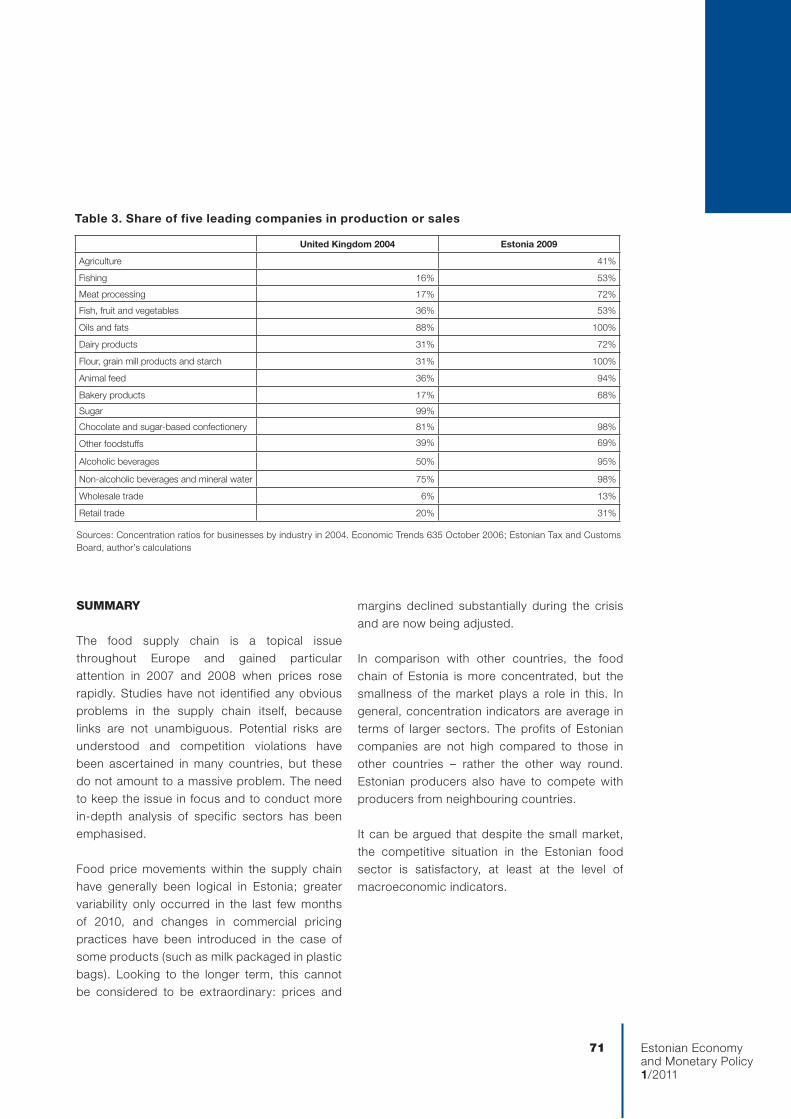
Estonian Economyand Monetary Policy1/2011
71
Table 3. Share of five leading companies in production or sales
Sources: Concentration ratios for businesses by industry in 2004. Economic Trends 635 October 2006; Estonian Tax and Customs Board, author’s calculations
United kingdom 2004 Estonia 2009
Agriculture 41%
Fishing 16% 53%
Meat processing 17% 72%
Fish, fruit and vegetables 36% 53%
Oils and fats 88% 100%
Dairy products 31% 72%
Flour, grain mill products and starch 31% 100%
Animal feed 36% 94%
Bakery products 17% 68%
Sugar 99%
Chocolate and sugar-based confectionery 81% 98%
Other foodstuffs 39% 69%
Alcoholic beverages 50% 95%
Non-alcoholic beverages and mineral water 75% 98%
Wholesale trade 6% 13%
Retail trade 20% 31%
SUMMARY
The food supply chain is a topical issue throughout Europe and gained particular attention in 2007 and 2008 when prices rose rapidly. Studies have not identified any obvious problems in the supply chain itself, because links are not unambiguous. Potential risks are understood and competition violations have been ascertained in many countries, but these do not amount to a massive problem. The need to keep the issue in focus and to conduct more in-depth analysis of specific sectors has been emphasised.
Food price movements within the supply chain have generally been logical in Estonia; greater variability only occurred in the last few months of 2010, and changes in commercial pricing practices have been introduced in the case of some products (such as milk packaged in plastic bags). Looking to the longer term, this cannot be considered to be extraordinary: prices and
margins declined substantially during the crisis and are now being adjusted.
In comparison with other countries, the food chain of Estonia is more concentrated, but the smallness of the market plays a role in this. In general, concentration indicators are average in terms of larger sectors. The profits of Estonian companies are not high compared to those in other countries – rather the other way round. Estonian producers also have to compete with producers from neighbouring countries.
It can be argued that despite the small market, the competitive situation in the Estonian food sector is satisfactory, at least at the level of macroeconomic indicators.
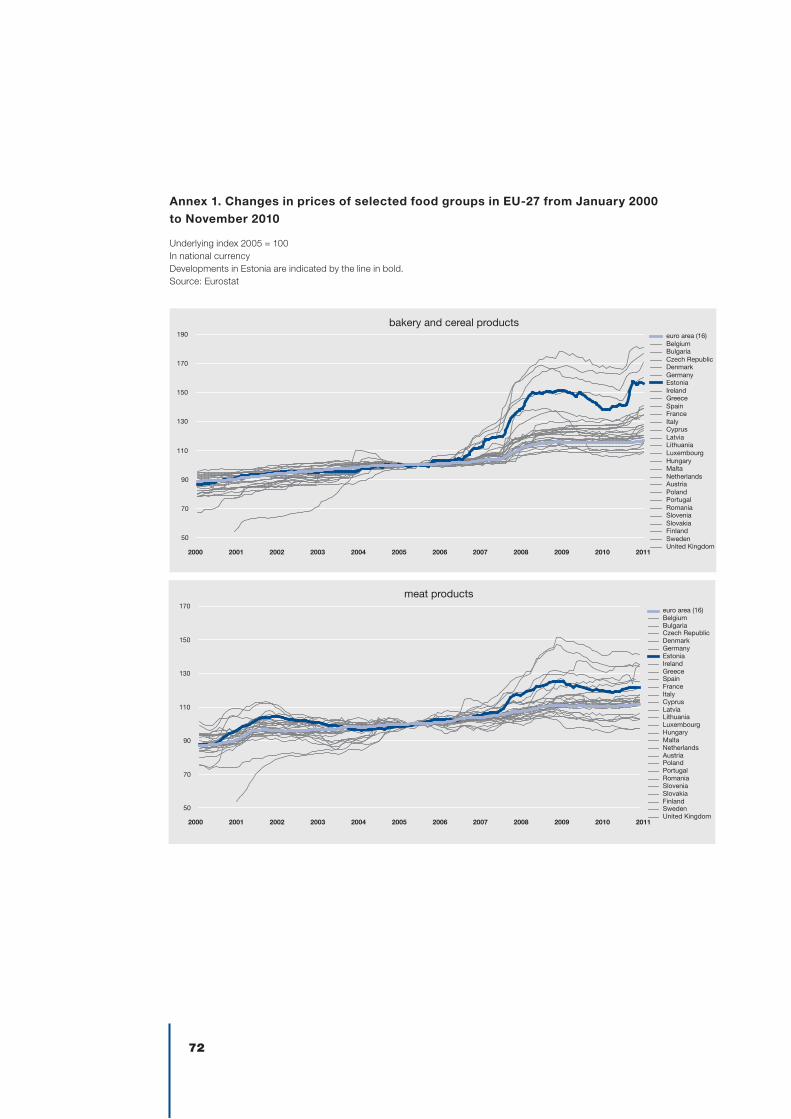
72
Annex 1. Changes in prices of selected food groups in EU-27 from January 2000to November 2010
Underlying index 2005 = 100In national currencyDevelopments in Estonia are indicated by the line in bold.Source: Eurostat
bakery and cereal products
50
70
90
110
130
150
170
190 euro area (16)BelgiumBulgariaCzech RepublicDenmarkGermanyEstoniaIrelandGreeceSpainFranceItalyCyprusLatviaLithuaniaLuxembourgHungaryMaltaNetherlandsAustriaPolandPortugalRomaniaSloveniaSlovakiaFinlandSwedenUnited Kingdom
2000 2001 2002 2003 2004 2005 2006 2007 2008 2009 2010 2011
meat products
50
70
90
110
130
150
170euro area (16)BelgiumBulgariaCzech RepublicDenmarkGermanyEstoniaIrelandGreeceSpainFranceItalyCyprusLatviaLithuaniaLuxembourgHungaryMaltaNetherlandsAustriaPolandPortugalRomaniaSloveniaSlovakiaFinlandSwedenUnited Kingdom
2000 2001 2002 2003 2004 2005 2006 2007 2008 2009 2010 2011
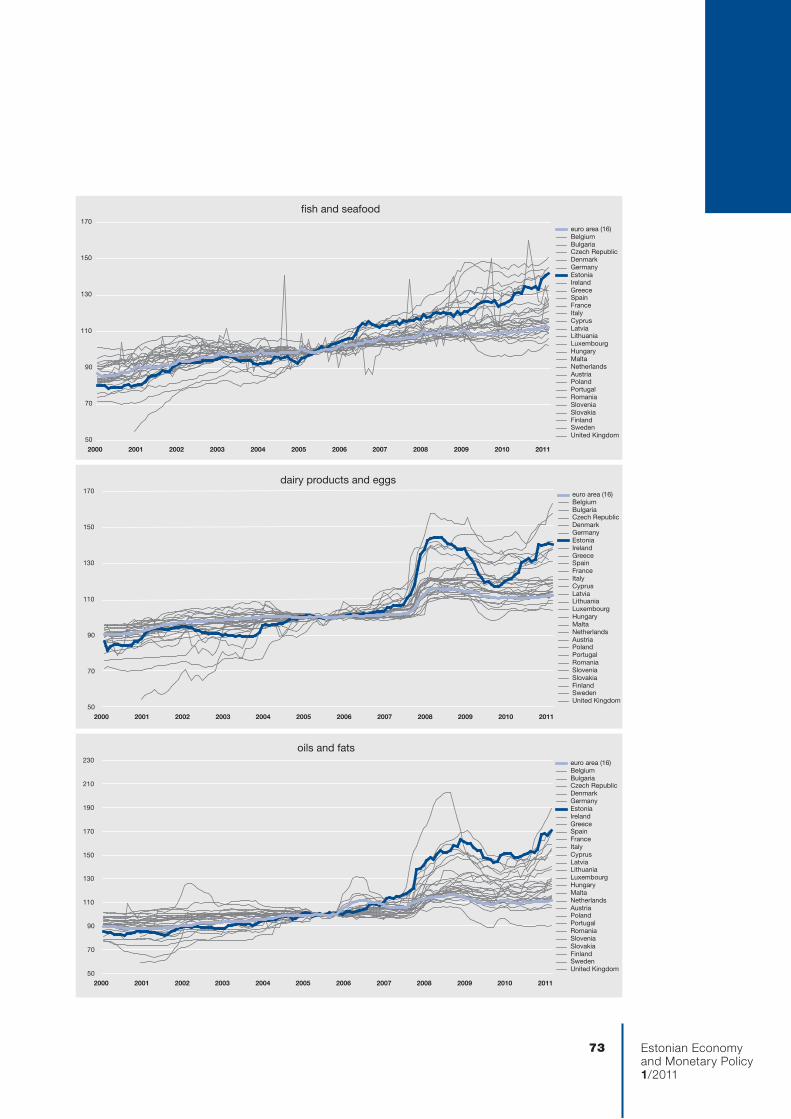
Estonian Economyand Monetary Policy1/2011
73
fish and seafood
50
70
90
110
130
150
170
2000 2001 2002 2003 2004 2005 2006 2007 2008 2009 2010 2011
euro area (16)BelgiumBulgariaCzech RepublicDenmarkGermanyEstoniaIrelandGreeceSpainFranceItalyCyprusLatviaLithuaniaLuxembourgHungaryMaltaNetherlandsAustriaPolandPortugalRomaniaSloveniaSlovakiaFinlandSwedenUnited Kingdom
dairy products and eggs
50
70
90
110
130
150
170
2000 2001 2002 2003 2004 2005 2006 2007 2008 2009 2010 2011
euro area (16)BelgiumBulgariaCzech RepublicDenmarkGermanyEstoniaIrelandGreeceSpainFranceItalyCyprusLatviaLithuaniaLuxembourgHungaryMaltaNetherlandsAustriaPolandPortugalRomaniaSloveniaSlovakiaFinlandSwedenUnited Kingdom
oils and fats
50
70
90
110
130
150
170
190
210
230
2000 2001 2002 2003 2004 2005 2006 2007 2008 2009 2010 2011
euro area (16)BelgiumBulgariaCzech RepublicDenmarkGermanyEstoniaIrelandGreeceSpainFranceItalyCyprusLatviaLithuaniaLuxembourgHungaryMaltaNetherlandsAustriaPolandPortugalRomaniaSloveniaSlovakiaFinlandSwedenUnited Kingdom
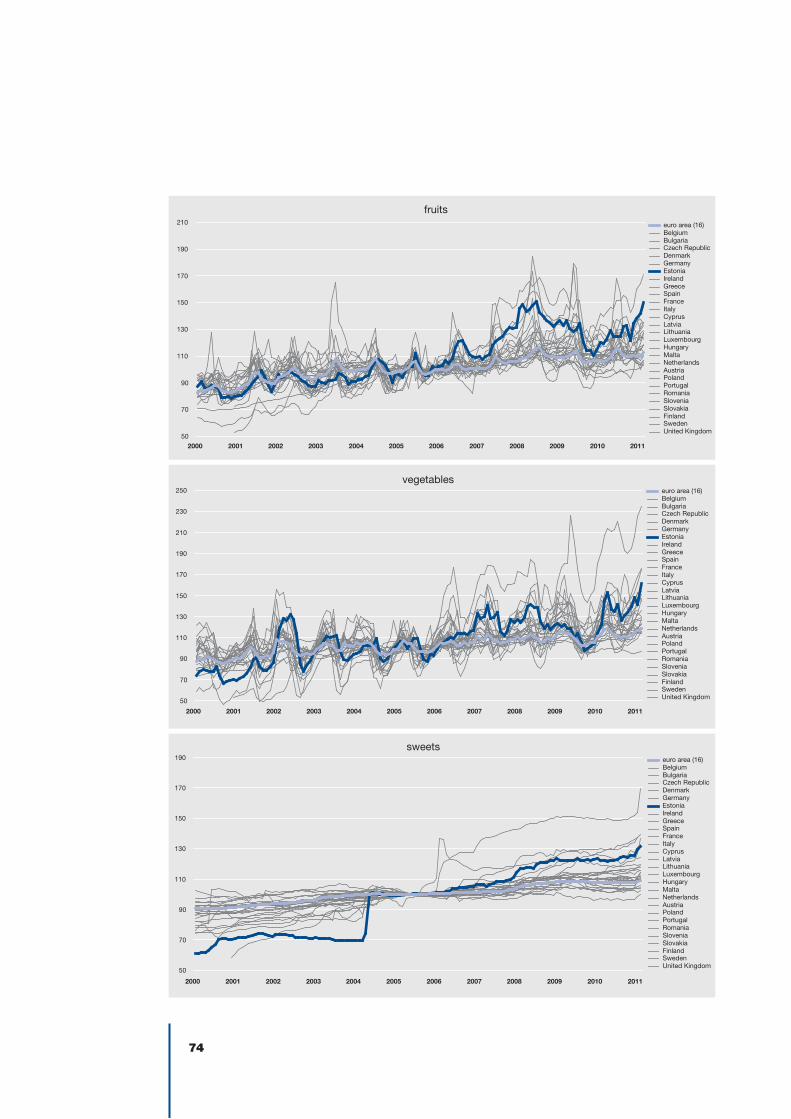
74
sweets
50
70
90
110
130
150
170
190
2000 2001 2002 2003 2004 2005 2006 2007 2008 2009 2010 2011
euro area (16)BelgiumBulgariaCzech RepublicDenmarkGermanyEstoniaIrelandGreeceSpainFranceItalyCyprusLatviaLithuaniaLuxembourgHungaryMaltaNetherlandsAustriaPolandPortugalRomaniaSloveniaSlovakiaFinlandSwedenUnited Kingdom
vegetables
50
70
90
110
130
150
170
190
210
230
250
2000 2001 2002 2003 2004 2005 2006 2007 2008 2009 2010 2011
euro area (16)BelgiumBulgariaCzech RepublicDenmarkGermanyEstoniaIrelandGreeceSpainFranceItalyCyprusLatviaLithuaniaLuxembourgHungaryMaltaNetherlandsAustriaPolandPortugalRomaniaSloveniaSlovakiaFinlandSwedenUnited Kingdom
fruits
50
70
90
110
130
150
170
190
210
2000 2001 2002 2003 2004 2005 2006 2007 2008 2009 2010 2011
euro area (16)BelgiumBulgariaCzech RepublicDenmarkGermanyEstoniaIrelandGreeceSpainFranceItalyCyprusLatviaLithuaniaLuxembourgHungaryMaltaNetherlandsAustriaPolandPortugalRomaniaSloveniaSlovakiaFinlandSwedenUnited Kingdom
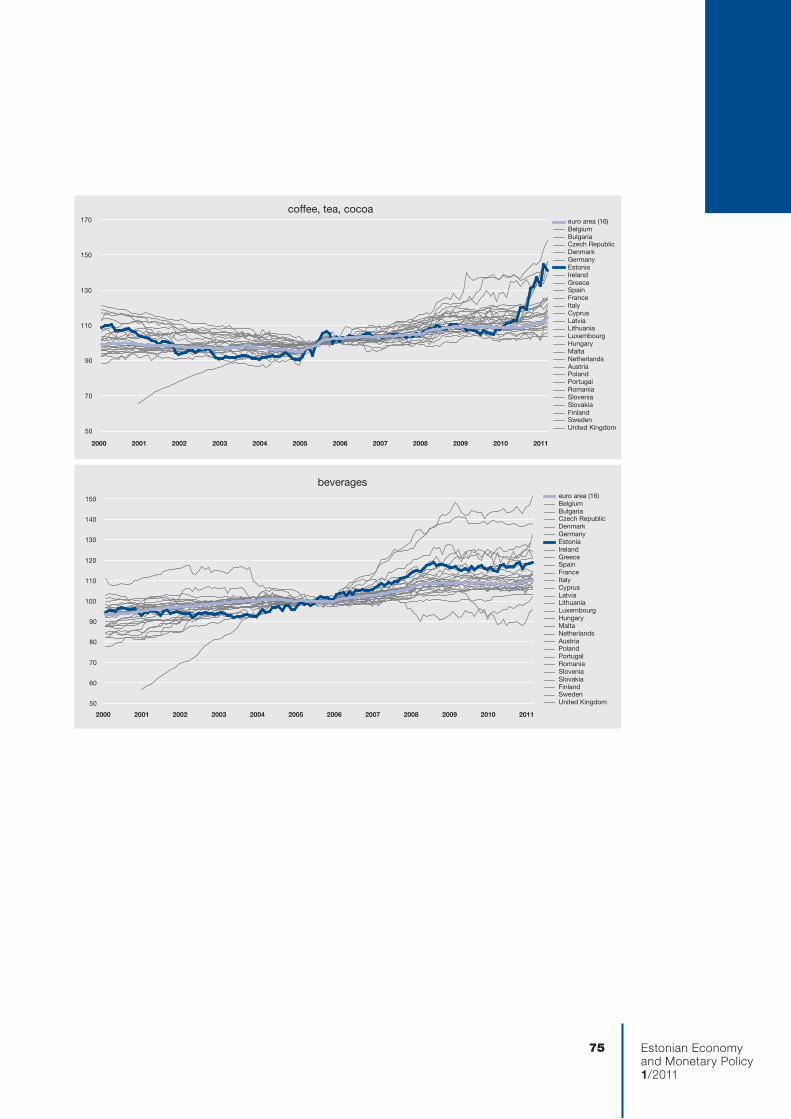
Estonian Economyand Monetary Policy1/2011
75
coffee, tea, cocoa
50
70
90
110
130
150
170
2000 2001 2002 2003 2004 2005 2006 2007 2008 2009 2010 2011
euro area (16)BelgiumBulgariaCzech RepublicDenmarkGermanyEstoniaIrelandGreeceSpainFranceItalyCyprusLatviaLithuaniaLuxembourgHungaryMaltaNetherlandsAustriaPolandPortugalRomaniaSloveniaSlovakiaFinlandSwedenUnited Kingdom
beverages
50
60
70
80
90
100
110
120
130
140
150
2000 2001 2002 2003 2004 2005 2006 2007 2008 2009 2010 2011
euro area (16)BelgiumBulgariaCzech RepublicDenmarkGermanyEstoniaIrelandGreeceSpainFranceItalyCyprusLatviaLithuaniaLuxembourgHungaryMaltaNetherlandsAustriaPolandPortugalRomaniaSloveniaSlovakiaFinlandSwedenUnited Kingdom
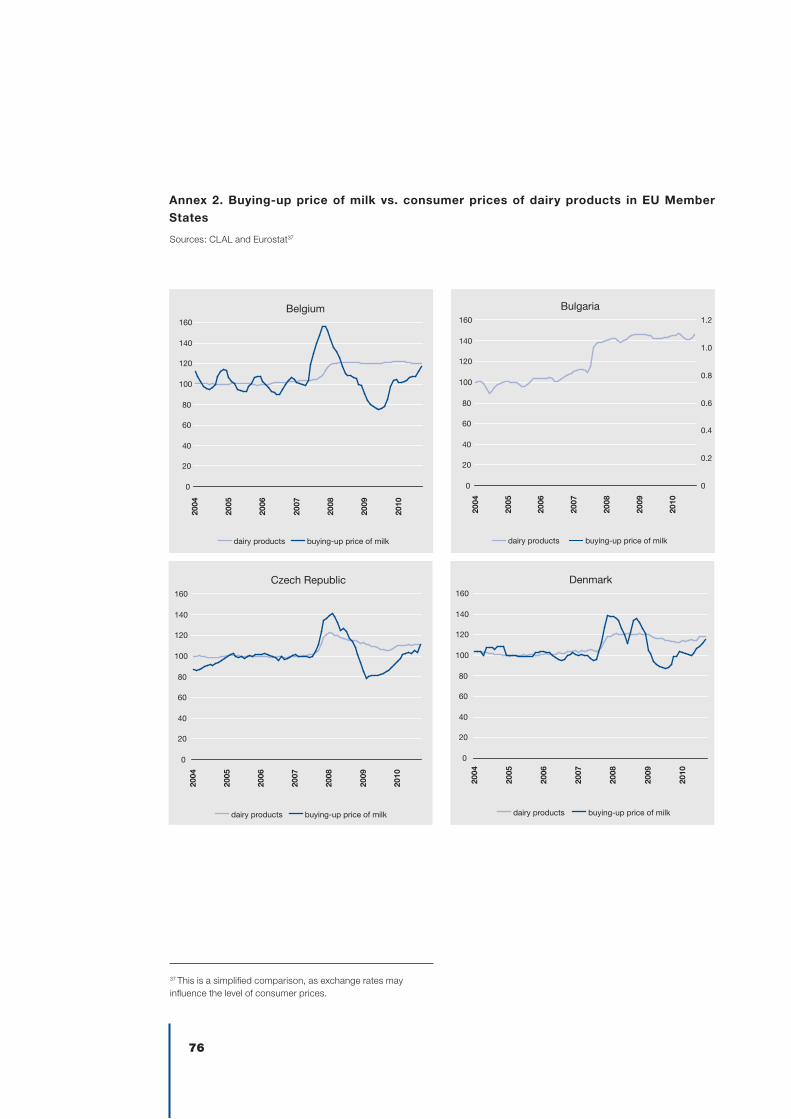
76
Annex 2. Buying-up price of milk vs. consumer prices of dairy products in EU Member States
Belgium
0
20
40
60
80
100
120
140
160
2004
2005
2006
2007
2008
2009
2010
dairy products buying-up price of milk
Bulgaria
0
20
40
60
80
100
120
140
160
2004
2005
2006
2007
2008
2009
2010
0
0.2
0.4
0.6
0.8
1.0
1.2
dairy products buying-up price of milk
Czech Republic
0
20
40
60
80
100
120
140
160
2004
2005
2006
2007
2008
2009
2010
dairy products buying-up price of milk
Denmark
0
20
40
60
80
100
120
140
160
2004
2005
2006
2007
2008
2009
2010
dairy products buying-up price of milk
Sources: CLAL and Eurostat37
37 This is a simplified comparison, as exchange rates may influence the level of consumer prices.
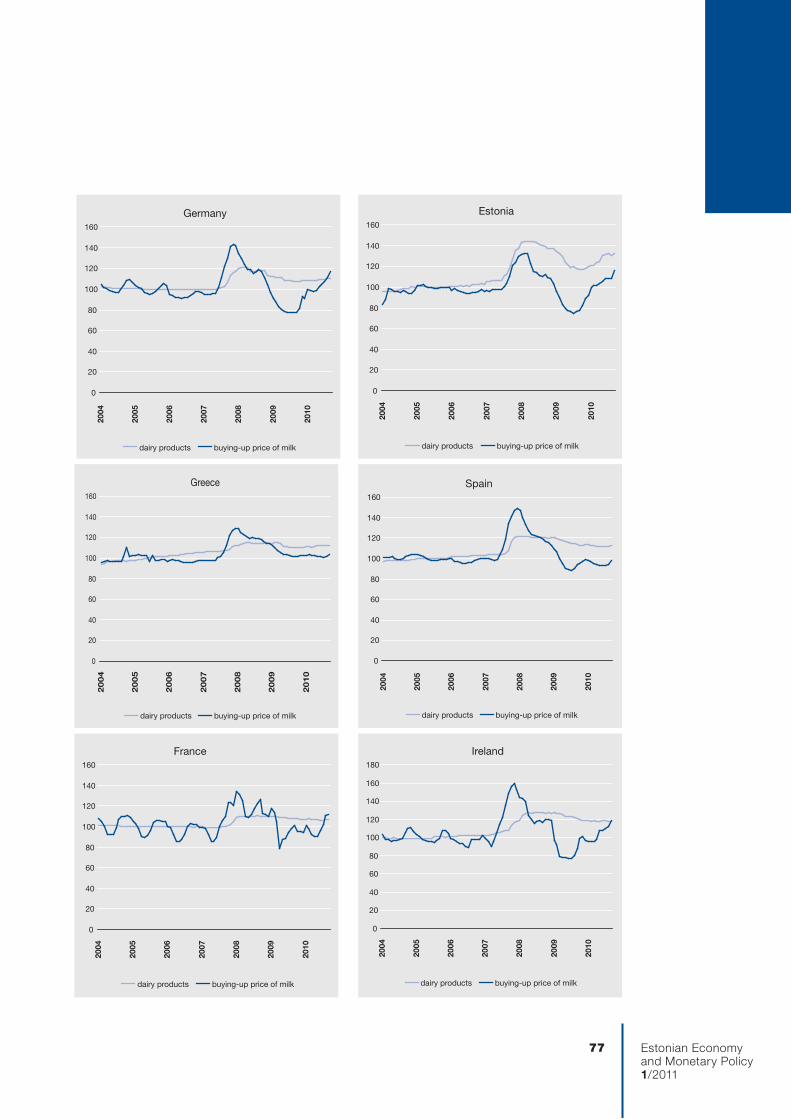
Estonian Economyand Monetary Policy1/2011
77
Germany
0
20
40
60
80
100
120
140
160
2004
2005
2006
2007
2008
2009
2010
dairy products buying-up price of milk
Estonia
0
20
40
60
80
100
120
140
160
2004
2005
2006
2007
2008
2009
2010
dairy products buying-up price of milk
Greece
0
20
40
60
80
100
120
140
160
2004
2005
2006
2007
2008
2009
2010
dairy products buying-up price of milk
Spain
0
20
40
60
80
100
120
140
160
2004
2005
2006
2007
2008
2009
2010
dairy products buying-up price of milk
France
0
20
40
60
80
100
120
140
160
2004
2005
2006
2007
2008
2009
2010
dairy products buying-up price of milk
Ireland
0
20
40
60
80
100
120
140
160
180
2004
2005
2006
2007
2008
2009
2010
dairy products buying-up price of milk
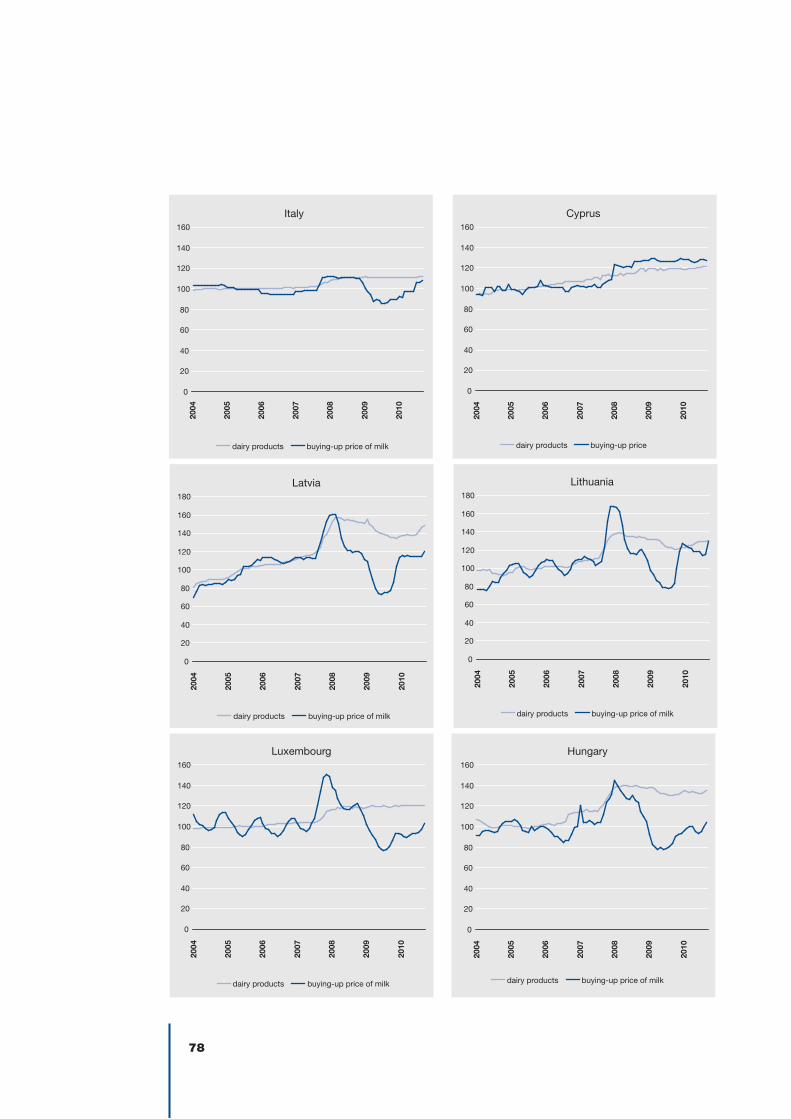
78
Italy
0
20
40
60
80
100
120
140
160
2004
2005
2006
2007
2008
2009
2010
dairy products buying-up price of milk
Cyprus
0
20
40
60
80
100
120
140
160
2004
2005
2006
2007
2008
2009
2010
dairy products buying-up price
Latvia
0
20
40
60
80
100
120
140
160
180
2004
2005
2006
2007
2008
2009
2010
dairy products buying-up price of milk
Lithuania
0
20
40
60
80
100
120
140
160
180
2004
2005
2006
2007
2008
2009
2010
dairy products buying-up price of milk
Luxembourg
0
20
40
60
80
100
120
140
160
2004
2005
2006
2007
2008
2009
2010
dairy products buying-up price of milk
Hungary
0
20
40
60
80
100
120
140
160
2004
2005
2006
2007
2008
2009
2010
dairy products buying-up price of milk
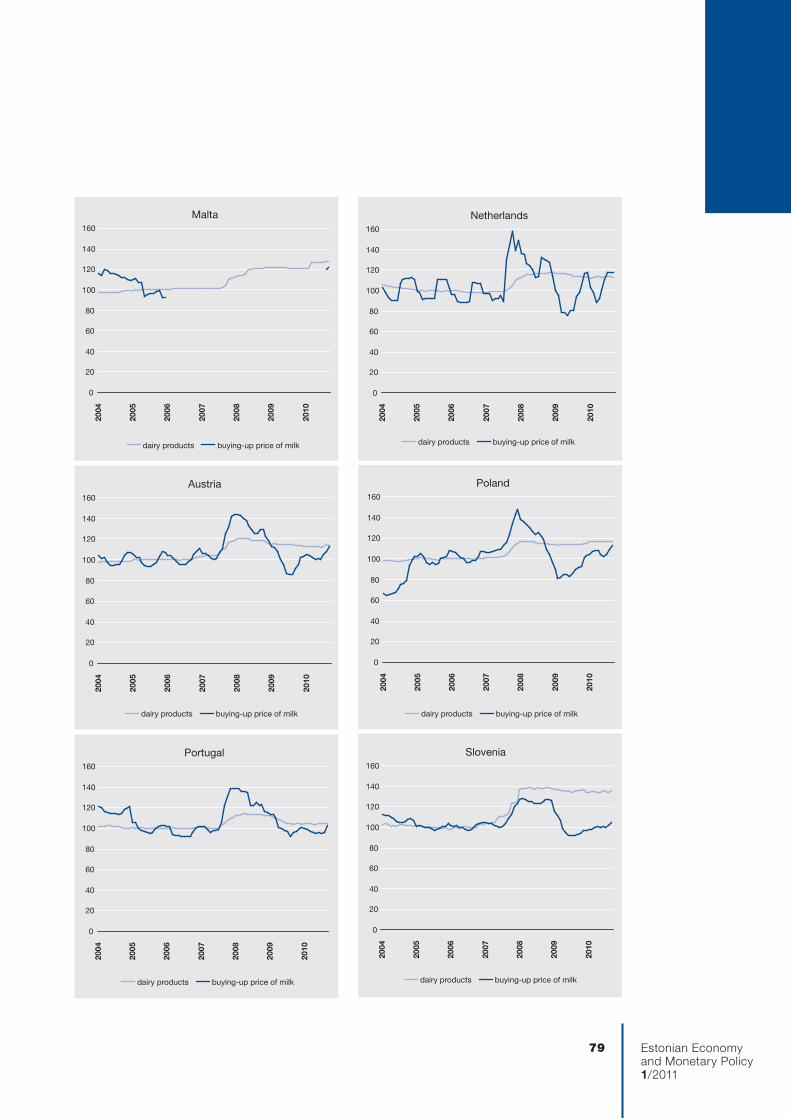
Estonian Economyand Monetary Policy1/2011
79
Malta
0
20
40
60
80
100
120
140
160
2004
2005
2006
2007
2008
2009
2010
dairy products buying-up price of milk
Netherlands
0
20
40
60
80
100
120
140
160
2004
2005
2006
2007
2008
2009
2010
dairy products buying-up price of milk
Austria
0
20
40
60
80
100
120
140
160
2004
2005
2006
2007
2008
2009
2010
dairy products buying-up price of milk
Poland
0
20
40
60
80
100
120
140
160
2004
2005
2006
2007
2008
2009
2010
dairy products buying-up price of milk
Portugal
0
20
40
60
80
100
120
140
160
2004
2005
2006
2007
2008
2009
2010
dairy products buying-up price of milk
Slovenia
0
20
40
60
80
100
120
140
160
2004
2005
2006
2007
2008
2009
2010
dairy products buying-up price of milk
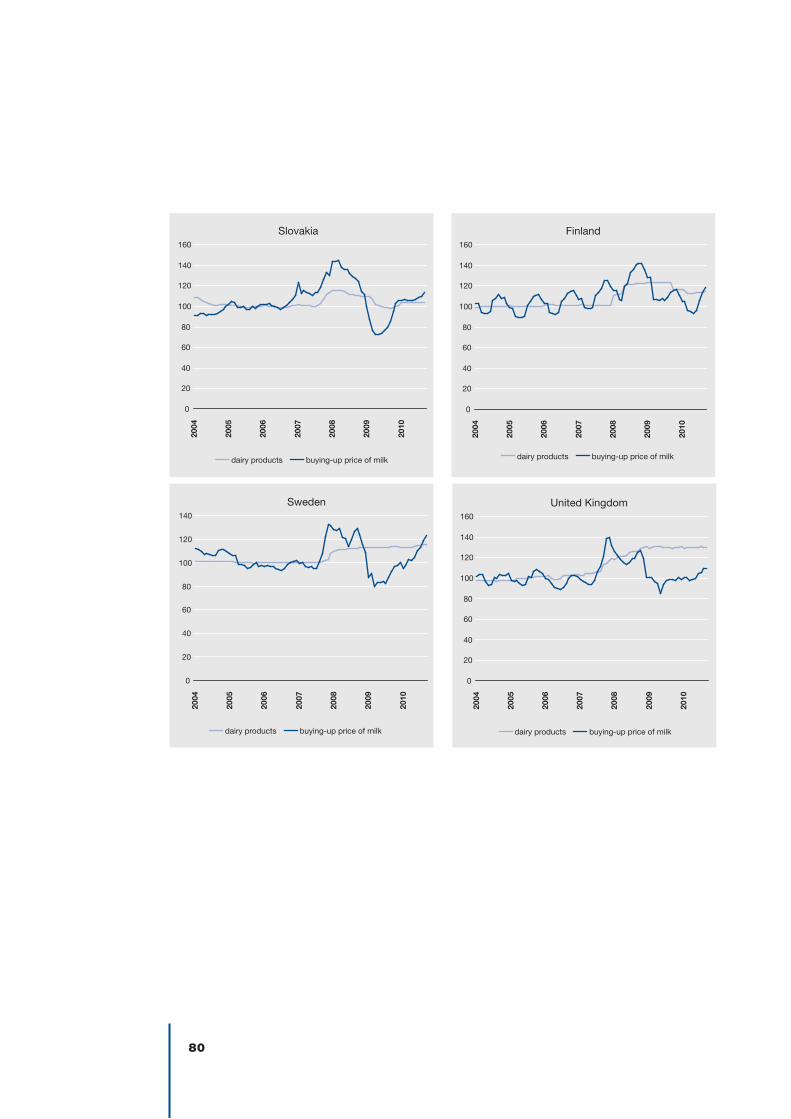
80
Slovakia
0
20
40
60
80
100
120
140
160
2004
2005
2006
2007
2008
2009
2010
dairy products buying-up price of milk
Finland
0
20
40
60
80
100
120
140
160
2004
2005
2006
2007
2008
2009
2010
dairy products buying-up price of milk
Sweden
0
20
40
60
80
100
120
140
2004
2005
2006
2007
2008
2009
2010
dairy products buying-up price of milk
United Kingdom
0
20
40
60
80
100
120
140
160
2004
2005
2006
2007
2008
2009
2010
dairy products buying-up price of milk
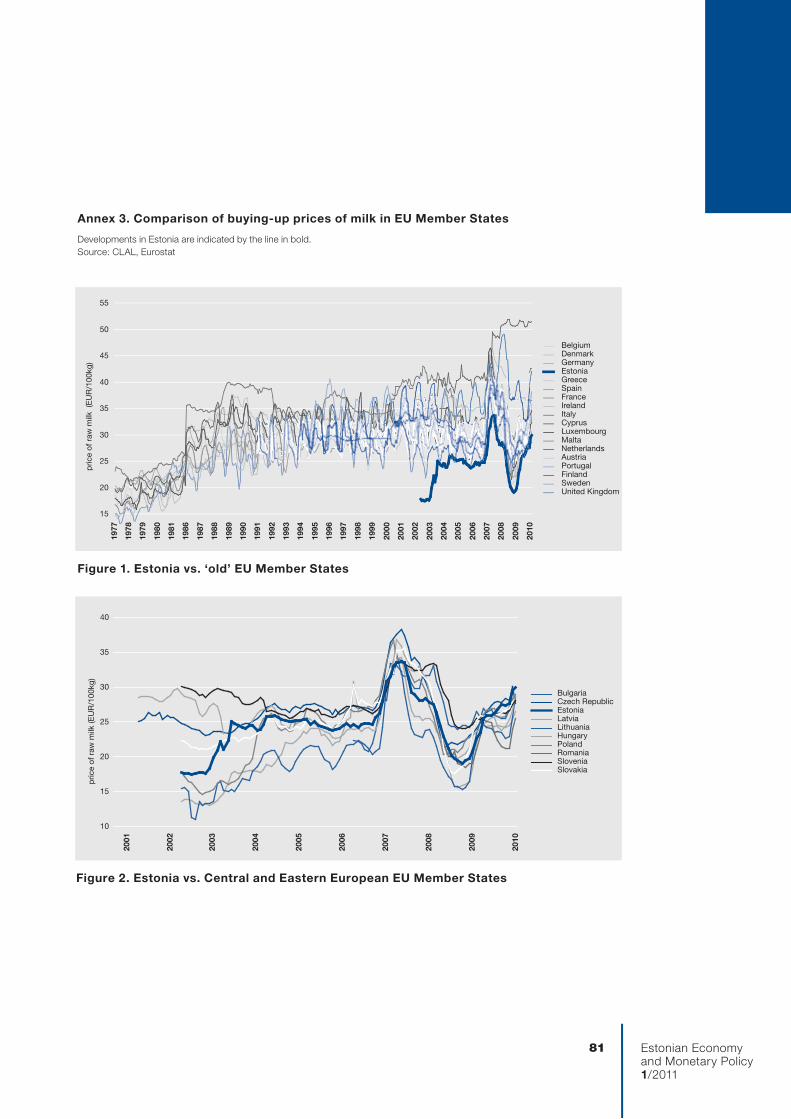
Estonian Economyand Monetary Policy1/2011
81
Figure 2. Estonia vs. Central and Eastern European EU Member States
Annex 3. Comparison of buying-up prices of milk in EU Member States
Figure 1. Estonia vs. ‘old’ EU Member States
Developments in Estonia are indicated by the line in bold.Source: CLAL, Eurostat
pric
e of
raw
milk
(E
UR
/100
kg)
15
20
25
30
35
40
45
50
55
1977
1978
1979
1980
1981
1986
1987
1988
1989
1990
1991
1992
1993
1994
1995
1996
1997
1998
1999
2000
2001
2002
2003
2004
2005
2006
2007
2008
2009
2010
BelgiumDenmarkGermanyEstoniaGreeceSpainFranceIrelandItalyCyprusLuxembourgMaltaNetherlandsAustriaPortugalFinlandSwedenUnited Kingdom
pric
e of
raw
milk
(EU
R/1
00kg
)
10
15
20
25
30
35
40
2001
2002
2003
2004
2005
2006
2007
2008
2009
2010
BulgariaCzech RepublicEstoniaLatviaLithuaniaHungaryPolandRomaniaSloveniaSlovakia
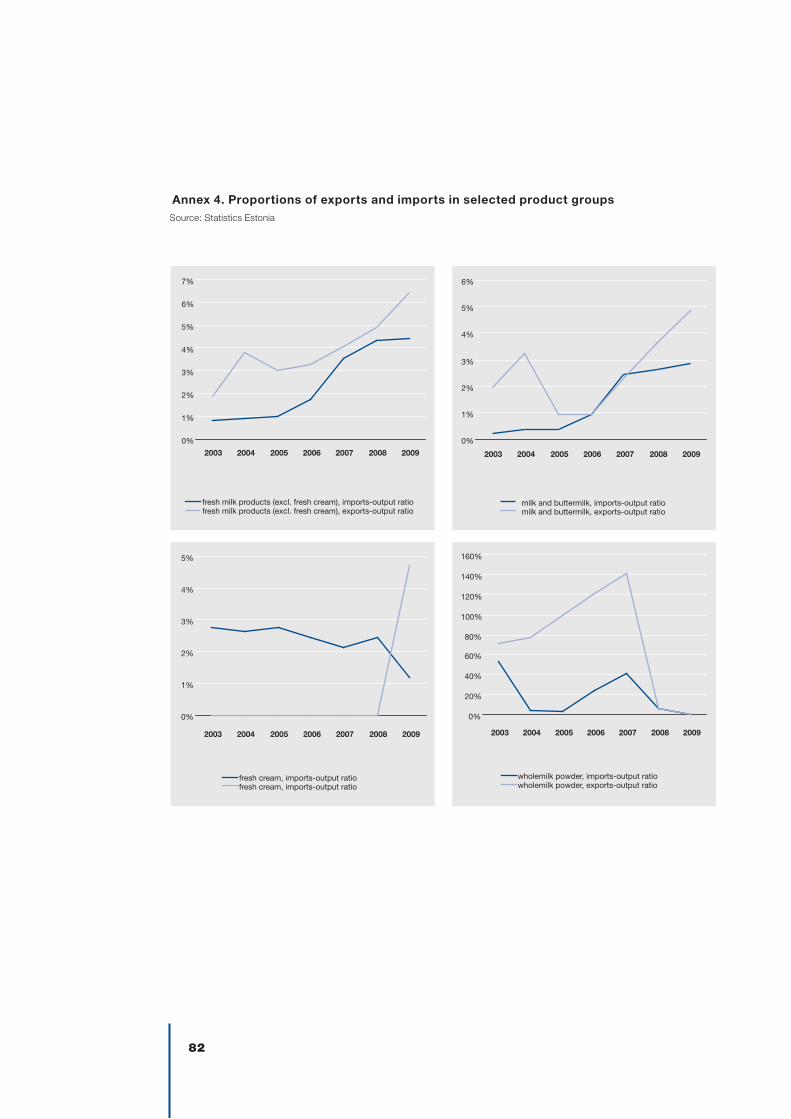
82
Annex 4. proportions of exports and imports in selected product groupsSource: Statistics Estonia
0%
1%
2%
3%
4%
5%
6%
7%
2003 2004 2005 2006 2007 2008 2009
fresh milk products (excl. fresh cream), imports-output ratiofresh milk products (excl. fresh cream), exports-output ratio
0%
1%
2%
3%
4%
5%
6%
2003 2004 2005 2006 2007 2008 2009
milk and buttermilk, imports-output ratio milk and buttermilk, exports-output ratio
0%
1%
2%
3%
4%
5%
2003 2004 2005 2006 2007 2008 2009
fresh cream, imports-output ratiofresh cream, imports-output ratio
0%
20%
40%
60%
80%
100%
120%
140%
160%
2003 2004 2005 2006 2007 2008 2009
wholemilk powder, imports-output ratiowholemilk powder, exports-output ratio
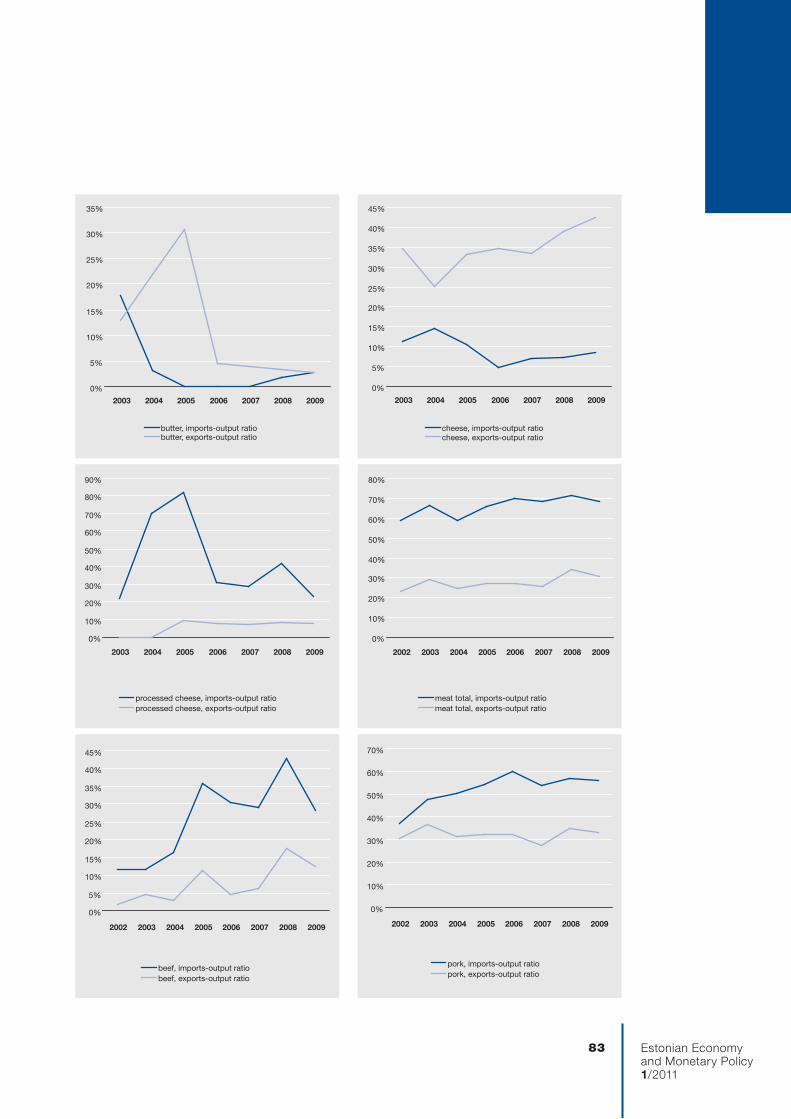
Estonian Economyand Monetary Policy1/2011
83
0%
5%
10%
15%
20%
25%
30%
35%
2003 2004 2005 2006 2007 2008 2009
butter, imports-output ratio butter, exports-output ratio
0%
5%
10%
15%
20%
25%
30%
35%
40%
45%
2003 2004 2005 2006 2007 2008 2009
cheese, imports-output ratiocheese, exports-output ratio
0%
10%
20%
30%
40%
50%
60%
70%
80%
90%
2003 2004 2005 2006 2007 2008 2009
processed cheese, imports-output ratioprocessed cheese, exports-output ratio
0%
10%
20%
30%
40%
50%
60%
70%
80%
2002 2003 2004 2005 2006 2007 2008 2009
meat total, imports-output ratiomeat total, exports-output ratio
0%
5%
10%
15%
20%
25%
30%
35%
40%
45%
2002 2003 2004 2005 2006 2007 2008 2009
beef, imports-output ratiobeef, exports-output ratio
0%
10%
20%
30%
40%
50%
60%
70%
2002 2003 2004 2005 2006 2007 2008 2009
pork, imports-output ratiopork, exports-output ratio
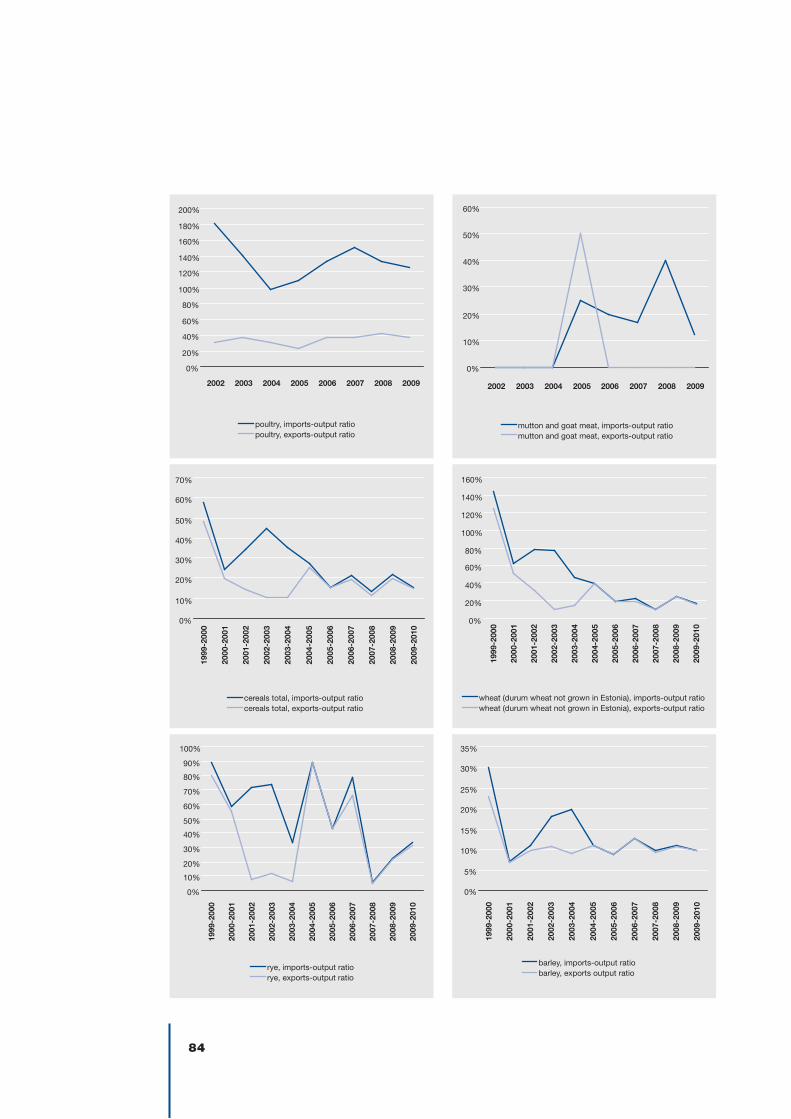
84
0%
20%
40%
60%
80%
100%
120%
140%
160%
180%
200%
2002 2003 2004 2005 2006 2007 2008 2009
poultry, imports-output ratiopoultry, exports-output ratio
0%
10%
20%
30%
40%
50%
60%
2002 2003 2004 2005 2006 2007 2008 2009
mutton and goat meat, imports-output ratiomutton and goat meat, exports-output ratio
0%
10%
20%
30%
40%
50%
60%
70%
1999
-200
0
2000
-200
1
2001
-200
2
2002
-200
3
2003
-200
4
2004
-200
5
2005
-200
6
2006
-200
7
2007
-200
8
2008
-200
9
2009
-201
0
cereals total, imports-output ratiocereals total, exports-output ratio
0%
20%
40%
60%
80%
100%
120%
140%
160%
1999
-200
0
2000
-200
1
2001
-200
2
2002
-200
3
2003
-200
4
2004
-200
5
2005
-200
6
2006
-200
7
2007
-200
8
2008
-200
9
2009
-201
0wheat (durum wheat not grown in Estonia), imports-output ratiowheat (durum wheat not grown in Estonia), exports-output ratio
0%
10%
20%
30%
40%
50%
60%
70%
80%
90%
100%
1999
-200
0
2000
-200
1
2001
-200
2
2002
-200
3
2003
-200
4
2004
-200
5
2005
-200
6
2006
-200
7
2007
-200
8
2008
-200
9
2009
-201
0
rye, imports-output ratiorye, exports-output ratio
0%
5%
10%
15%
20%
25%
30%
35%
1999
-200
0
2000
-200
1
2001
-200
2
2002
-200
3
2003
-200
4
2004
-200
5
2005
-200
6
2006
-200
7
2007
-200
8
2008
-200
9
2009
-201
0
barley, imports-output ratiobarley, exports output ratio
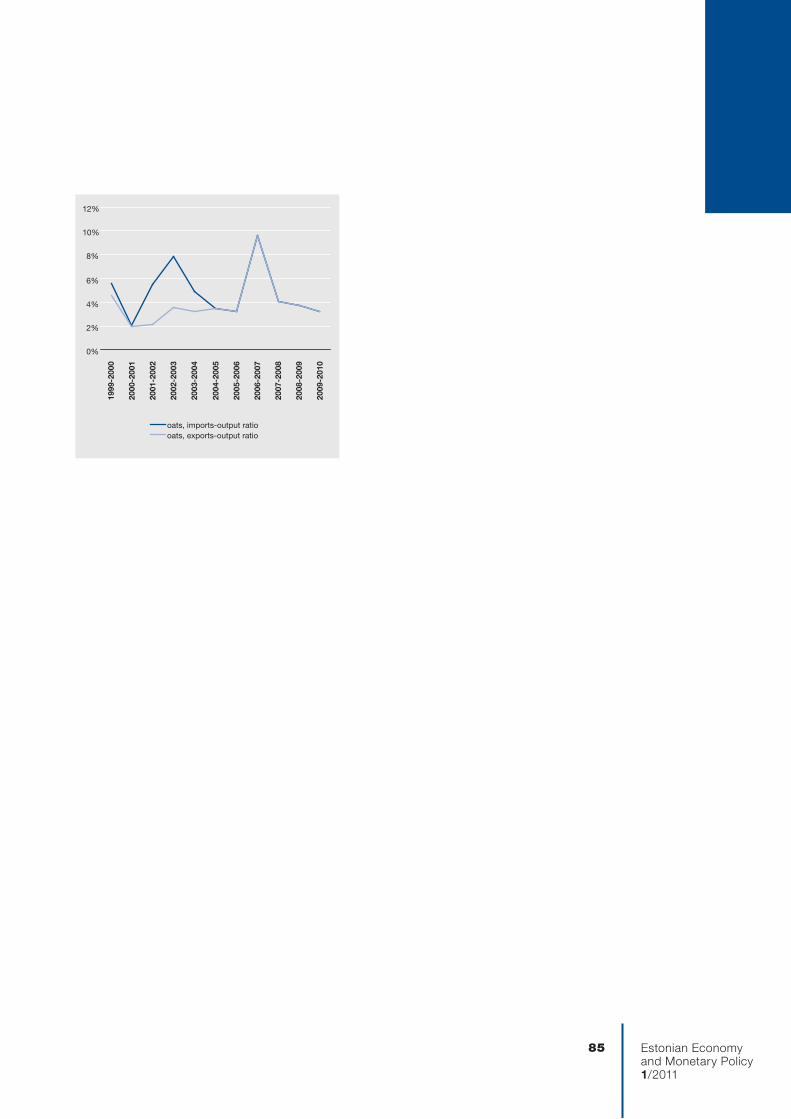
Estonian Economyand Monetary Policy1/2011
85
0%
2%
4%
6%
8%
10%
12%
1999
-200
0
2000
-200
1
2001
-200
2
2002
-200
3
2003
-200
4
2004
-200
5
2005
-200
6
2006
-200
7
2007
-200
8
2008
-200
9
2009
-201
0
oats, imports-output ratiooats, exports-output ratio
Related Documents