2 HOW DOES BUSINESS ANALYTICS CONTRIBUTE TO BUSINESS VALUE? Abstract This paper presents a model, synthesized from the literature, of factors that explain how business analytics contributes to business value. It also reports results from a preliminary assessment of that model. The model consists of two parts: a process and a variance model. The process model depicts the analyze-insight-decision-action process through which use of an organization’s business-analytic capabilities is intended to create business value. The variance model proposes that the five factors in Davenport et al.’s (2010) DELTA model of business-analytics success factors, six from Watson and Wixom (2007), and three from Seddon et al.’s (2010) model of organizational benefits from enterprise systems, assist a firm to gain business value from business analytics. A preliminary assessment of the model was conducted using data from 100 customer-success stories from vendors such as IBM, SAP, and Teradata. Our conclusion is that the business-analytics success model (BASM) is likely to be a useful basis for future research. Keywords: business analytics, business value, business intelligence, organizational benefits, success model This article is protected by copyright. All rights reserved. This is the author manuscript accepted for publication and has undergone full peer review but has not been through the copyediting, typesetting, pagination and proofreading process, which may lead to differences between this version and the Version of Record. Please cite this article as doi: 10.1111/isj.12101

Welcome message from author
This document is posted to help you gain knowledge. Please leave a comment to let me know what you think about it! Share it to your friends and learn new things together.
Transcript

2
HOW DOES BUSINESS ANALYTICS CONTRIBUTE TO BUSINESS VALUE?
Abstract
This paper presents a model, synthesized from the literature, of factors that explain how business analytics contributes to business value. It also reports results from a preliminary assessment of that model. The model consists of two parts: a process and a variance model. The process model depicts the analyze-insight-decision-action process through which use of an organization’s business-analytic capabilities is intended to create business value. The variance model proposes that the five factors in Davenport et al.’s (2010) DELTA model of business-analytics success factors, six from Watson and Wixom (2007), and three from Seddon et al.’s (2010) model of organizational benefits from enterprise systems, assist a firm to gain business value from business analytics. A preliminary assessment of the model was conducted using data from 100 customer-success stories from vendors such as IBM, SAP, and Teradata. Our conclusion is that the business-analytics success model (BASM) is likely to be a useful basis for future research.
Keywords: business analytics, business value, business intelligence, organizational benefits,
success model
This article is protected by copyright. All rights reserved.
This is the author manuscript accepted for publication and has undergone full peer review but hasnot been through the copyediting, typesetting, pagination and proofreading process, which maylead to differences between this version and the Version of Record. Please cite this article as doi:10.1111/isj.12101

3
HOW DOES BUSINESS ANALYTICS
CONTRIBUTE TO BUSINESS VALUE? Introduction
Although there are many definitions of both “business analytics” and “business intelligence”, in this
paper we define business analytics (BA) as the use of data to make sounder, more evidence-based
business decisions1, and business intelligence (BI) as IT-based tools, e.g., data warehouses, on-line
analytical processing (OLAP), statistical and quantitative tools, visualization tools, and data mining
tools that enable BA (Howson, 2011; Negash, 2004; Ramamurthy et al. 2008). In the past decade,
there has been massive interest worldwide in both BA and BI. As evidence, BI topped the list of
“Technical priorities for CIOs” in Gartner’s annual global surveys of CIOs in the three of the five years,
2007-2011 (Hagerty et al., 2012, p. 47). Further, the spate of multi-billion dollar takeovers of BI
firms2, as well as various vendors’ current advertising of their in-memory database technologies (IBM,
2015; SAP, 2014) suggests that IT vendors believe that BA is likely to make a major contribution to
firm performance in the coming decade. Echoing this view, advisory-services firms such as McKinsey
(McGuire, 2013) and the International Institute for Analytics (IIA) also argue that analytics promises
to be a major source of competitive advantage in years to come. Finally, professional organizations
such as INFORMS and TDWI now offer analytics certification. Clearly, BA in all its variants—
including so-called “big data”—is a topic of great interest to the business community.
Organizations invest in BA in the pursuit of competitive advantage3, or if they are not–for-profit
organizations, to help them find ways to achieve their goals more effectively or with fewer resources.
To achieve these benefits, managers need to have a clear understanding of how an organization’s BA
capabilities actually influence organizational performance. However, the various models that we have
been able to find in the literature are so different that it must be hard for managers to decide what
they need to do to realize greater business value from BA. As evidence, in online Appendix 1 we have
reproduced 16 models of factors affecting organizational benefits, or business value, from BA4. These
models were identified using Google and Google Scholar to search for topics such as “business
analytics”, “business intelligence”, “data warehousing”, etc., then selecting documents that contained
implicit or explicit models of factors affecting organizational benefits from BA. Models from three of
1Holsapple et al. (2014) list 18 different definitions of BA, and end with a definition similar to ours: “we adopt a general core characterization of business analytics as concerned with evidence-based problem recognition and solving that happen within the context of business situations”. 2 e.g., of Hyperion by Oracle, of Cognos and SPSS by IBM, of BusinessObjects by SAP, and of Omniture by Adobe. 3 According to Peteraf and Barney (2003, p.314), “An enterprise has a Competitive Advantage if it is able to create more economic value than the marginal (breakeven) competitor in its product market”. 4 In this paper, we treat the two terms “organizational benefits” and “business value” as synonyms.
This article is protected by copyright. All rights reserved.

4
the most highly cited studies have been reproduced in Figure 1. Figure 1A, from Wixom and Watson
(2001)—an MIS Quarterly paper with 1138 Google-Scholar citations in November 2015—claims that
the key to data warehousing success is to run successful implementation projects that result in high
data and system quality. Figure 1B, our depiction of the DELTA model in Davenport et al. (2010)—a
book with 252 Google-Scholar citations in November 2015—claims that the key to business value from
BA is to achieve high scores on five factors: Data quality, Enterprise-wide integration, Leadership,
well-chosen Targets, and Analytic people. Figure 1C, from Clark et al. (2007)—an MIS Quarterly
paper with 201 Google-Scholar citations in November 2015—shows 20 interrelated factors that
influence Perceived Management Support System (MSS) Benefits. As one works one’s way through
model after model in Appendix 1, each introducing new factors and its own perspective on how BA
contributes to organizational performance, it is hard to discern many underlying patterns that
managers can build on to guide their own decision making. For example, Data Quality is mentioned
in Figures 1A and 1B; aspects of leadership (Champion, Leadership, and Executive Commitment) are
mentioned in Figures 1A, 1B, and 1C; implementation projects are highlighted in Figure 1A and
mentioned in Figure 1C (“Development Effort”). Does this mean that Data Quality, Leadership, and
Implementation projects are fundamental factors affecting business value from BA? If so, how are
these factors inter-related? Moreover, few of the papers presenting the 16 different models
reproduced in Appendix 1 cite the Psychology and Management literatures. Yet topics such as human
problem solving, the nature of insight, and human decision making—which are important for
understanding how BA contributes to organizational performance—have been studied for years in
those literatures. Why have not more BA studies attempted to build on this well-researched
literature?
After asking many questions such as these, we came to the conclusions that (a) Business Analytics is
such a new and rapidly evolving research topic that there has been very little chance yet to develop any
cumulative research tradition, and (b) it would be helpful if a literature-review-based summary or
synthesis were undertaken to combine key insights from all these models and literatures. We
therefore found ourselves asking the following two research questions:
1. How does business analytics contribute to business value?
2. What can managers do to realize greater organizational benefits from business analytics?
To answer both these questions we synthesized an integrated model from the various bodies of
literature, then conducted a preliminary assessment of the explanatory power of the new model by
examining the extent to which it corresponded to success stories about BA use that various BI vendors
had published on their websites.
For structuring this paper, we decided follow Zmud’s (1995) guidelines. Those guidelines say: (a)
“With an empirical article, the theory section would typically follow the introduction and precede the
This article is protected by copyright. All rights reserved.
5
discussion of the research methodology, analysis and results” (p.xxxviii), and (b) “the theory section
should begin with an overview of the conceptual or research model being developed. Ideally, such an
overview should be accompanied by a visual aid to ease the readers’ comprehension of your ideas”
(p.xxxix). We have followed these guidelines below. The development of our business analytics
success model (BASM) is discussed in the first (and longer) part of this paper. Results of our
preliminary assessment of the model are presented in the second part of the paper.
Theory
The Business-Analytics Success Model (BASM) that we synthesized from the literature is shown in
Figure 2. This model was developed to include what we judged to be key insights from (a) the 16
models presented in online Appendix 1, particularly Davenport at al.’s (2010) DELTA model, which we
judged to be the strongest model that we reviewed, (b) the broader IS literature, particularly the key
insight from Seddon et al. (2010) that most of the increases in organizational benefits from enterprise
systems (ES) may be attributed to ongoing major ES improvement projects, (c) the psychology
literature on the nature of human decision making and the meaning of “insight”, and (d) the
management literature on how use of scarce BA resources might result in competitive advantage5. The
result of this literature-based sense-making effort was the BASM. The BASM is intended to apply to
any organization that uses BA in the pursuit of competitive advantage.
[Figure 2 goes here]
The BASM (Figure 2) consists of two mutually compatible views of how use of business analytics
contributes to organizational performance: a process model (in Panel A) that answers research
question 1, and a variance model (in Panel B) that answers research question 2. Constructs for these
two views are defined in Tables 1 and 2, respectively. Webster and Watson (2002) explain the
difference between process and variance theories (we take the term “theories” to include models) as
follows: “Variance theories incorporate independent variables that cause variation in dependent
variables. In contrast, process theories use events and states to help explain dynamic phenomena.”
(p.xix). Another helpful explanation comes from Langley who says that process research “explicitly
incorporates temporal progressions of activities as elements of explanation and understanding”
(Langley et al. 2013, p.1).
The two sub-models in Figure 2 thus provide two different—though mutually compatible—
explanations of how BA use in organizations leads to organizational benefits. The process in Panel A
is executed over and over by different people and groups as they use analytic tools and make decisions
in the focal organization. By contrast, Panel B assumes that Panel A’s processes are in full flight in
many parts of the organization, and compares levels of variables hypothesized to be causally related to
5 A more detailed discussion of the method used for synthesizing the BASM is presented in Appendix 2.
This article is protected by copyright. All rights reserved.

6
organizational benefits from BA use. Said differently, the integrated BI platform, high-quality data,
and analytical people in the process model refer to the same physical things as those referenced in H1-
H3 in the variance model, yet the process model refers to the actual things, whereas the variance
model compares attributes of those things, e.g., the quality of the analytical people in H3. Use of
these two sub-models allows us to say more about how business analytics contributes to business
value than is possible with either model alone.
The BASM is explained and justified in more detail in the next two major sections.
The Process Model in the BASM (Panel A in Figure 2)
The process model in the BASM (Panel A in Figure 2) presents a process- or temporally oriented
explanation of how individual organizations use business analytics to create business value. It is
intended to be consistent with the literature on problem solving (Newell and Simon 1972, Pretz et al.
2003), insight (Sternberg and Davidson 1996, Bowden et al. 2005), the resource-based view of the
firm (Barney 1991, Barney et al. 2011), the dynamic-capabilities view of the firm (Teece et al. 1997),
Beer’s (1972, 1984) Viable System Model (VSM), and the IS literature on business analytics and
business intelligence, particularly the work of Davenport and Harris (2007), Davenport et al. (2010),
and Davenport and Kim (2013). In this process model it is argued that the prime drivers of business
value from BA are actions driven by new insights and improved decision making. (By contrast, the
prime drivers of business value from, say, investments in large-scale enterprise systems are greater
integration and improved business processes (Davenport et al. 2004).)
The focal organization in the BASM process model may be an organization or any of its subunits, e.g.,
its divisions or departments. Within its environment, the focal organization uses its many resources to
design, produce, and supply goods and/or services to its customers. By “resources” we mean “all
assets, capabilities, organizational processes, firm attributes, information, knowledge, etc. controlled
by a firm that enable the firm to conceive of and implement strategies that improve its efficiency and
effectiveness” (Barney 1991, p.101). Use of these resources enables the firm to survive, and in some
cases, thrive. However, as pointed out by Beer (1972), managing the use of an organization’s resources
requires huge amounts of information from both within and outside the organization. The BASM
assumes that resources, including people, for analyzing this information are embedded in many places
throughout the focal organization.
The left-hand side of Panel A relates to the use of business-analytic resources within the focal
organization to produce information, insight, and decisions. The right-hand side relates to the use of
that organization’s entire set of resources to produce business value. The single-line arrows in Panel A
mean “leads to” in the sense that A leads to, or must be completed before, B. The two block arrows
labeled “enable” are intended to remind the reader that the organization must control resources in
This article is protected by copyright. All rights reserved.

7
order to use them. It is these resources, owned or controlled by the organization, that are depicted on
the lower left and lower right of Panel A of Figure 2.
[Table 1 goes here]
The three paths in Panel A
Within the process model in Panel A, three paths have been highlighted, numbered 1 to 3. Each path
is now discussed in turn. First, reading horizontally from left to right across the top of Panel A, Path 1
says that in a viable organization, Use of the organization’s current Analytic Resources by people in
many different parts of the organization produces Insights that lead to Decisions that lead (via the
arrow labeled “Path 1”) to Intendedly Value-Creating Actions (e.g., competitive actions) that lead to
outcomes that senior managers in the organization would regard as beneficial, termed Organizational
Benefits (e.g., profit). Path-1 usage leverages existing resources to produce value. The most common
BI tools likely to be used in Path-1 are those identified in Howson’s (2011) report, based on a survey of
460 BI users, which says that the “most successful” (i.e., most used) BI modules were, in descending
order: Business or Ad Hoc Query 62%, Fixed reports 54%, Dashboards 54%, and OLAP 36% (Howson
2011, p.12). These tools, which may have been purchased or specially developed by the organization to
support groups of users, are the most likely sources of insight for end users (including executive end
users) in the process model in Panel A. However, use of spreadsheets (Albright et al. 2010) and search
engines are other examples of Path-1 usage. (Search engines allow users to search for information and
patterns in the huge unstructured distributed database that is the World Wide Web.)
Second, reading horizontally again from left to right, Path 2 says that sometimes Use of an
organization’s current analytical resources by people in different parts of the organization produces
Insights that lead to Decisions that lead (via the arrows labeled “Path 2”) to Intendedly Value-Creating
actions that change organizational resources. Assuming these changed resources enable the
organization to operate or compete more effectively in future, this is a dynamic-capabilities view of
how use of business analytics creates business value (Teece 2009).
Third, Path 3 on the left of Panel A is intended to recognize that Use of analytic resources may
sometimes lead directly to changes in those analytic resources. Examples of such changes might
include improved data quality as the result of data-cleansing efforts, or more capable analytical
people, as a result of their learning how to use analytic tools more effectively, or organizational
learning about how to use analytics effectively (Shanks and Bekmamedova 2012b). Our goal in this
paper is to focus on the intendedly value-creating actions in Paths 1 and 2, so Path 3 is not discussed
any further.
A good example to illustrate the meaning of Paths 1 and 2 in the process model in Panel A comes from
Davenport and Harris (2007). According to those authors, some years ago the UK supermarket chain,
This article is protected by copyright. All rights reserved.

8
Tesco, set up a Clubcard loyalty program that motivates customers to present their card with most
purchases. Tesco now uses its analytic resources to analyze checkout data to understand the
purchasing preferences of its customers. Based on those preferences, Tesco makes automated offers
in its direct-marketing program. This program has apparently been so effective that at the time the
book was written Tesco had a coupon redemption rate ten times the industry average:
“Tesco says that it issues 7 million targeted variations of product coupons a year, driving the
coupon redemption rate, customer loyalty, and ultimately financial performance to market-leading
heights.” (Davenport and Harris 2007, pp.90-91)
The setting up of the loyalty program and the building of the systems and processes to analyze data
correspond to Intendedly value-creating actions that change the organization’s resources (see the
lower right of Panel A in Figure 2). It is not clear from Davenport and Harris (2007) whether the
decision to build these resources at Tesco was based on use of business analytics, but if it had been, it
would have been an example of execution of Path 2, i.e., of use of analytics that resulted in a change in
organizational resources. Once the new BA resources were built, Tesco’s regular use of these
resources to make offers in its direct-marketing program corresponds to Path 1 in Panel A in Figure 2,
i.e., to Shanks and Bekmamedova’s (2012) Operational BA use.
Extending the Tesco example further, non-routine analysis of the same checkout data by Tesco’s data
scientists (Davenport and Patil 2012) might lead Tesco to gain insights into patterns of purchases in
inner city stores that lead it to create new organizational resources, e.g., to open a new chain of
convenience stores that sells only a narrow range of products. Such actions would be another example
of execution of Path 2 in Panel A of Figure 2. Subsequent operations of these stores (not necessarily
involving use of BA) would then be the source of business value for Tesco flowing from the BA-driven
decision to change organizational resources.
Our goal now is to convince the reader that (a) the three constructs Use Analytic Resources,
Insight(s), and Decisions(s) on the left of the process model in Panel A of Figure 2 are each critical in
the process that produces business value from BA, and (b) these three process steps are all intensely
human activities.
BA Use is Problem Solving
Use Analytic Resources means usage of BI technology by people across the organization. This BA
Usage is the fundamental driver of business value from BA. The reason is simple: no use, no benefits!
The resources involved in BA usage are depicted in the box labeled Analytical Resources in the lower
left of Panel A. The five dot points in this box, and their grouping under the headings Enabling
Technology and Analytical People, are our attempt to summarize concepts discussed in chapters 8
and 7, respectively, of Davenport and Harris (2007). In those two chapters, Davenport and Harris
This article is protected by copyright. All rights reserved.

9
(2007) argue that Enabling Technology and Analytical People are key resources that an organization
must have to be able to create business value from BA. With respect to technology, Davenport and
Harris (2007) use the term “BI architecture” to describe an organization’s enabling technology:
“The business intelligence architecture (a subset of the overall IT architecture) is an umbrella term
for an enterprise-wide set of systems, applications, and governance processes that enable
sophisticated analytics, by allowing data, content, and analyses to flow to those who need it, when
they need it.” (Davenport and Harris 2007, p.155)
We now want to examine the Use Analytical Resources construct at the top left of Figure 2, and ask:
‘What do human beings actually do when they use the enabling BI Technology?’ Our answer is that
what they do is intendedly rational problem solving (Simon 1955), and their goal is to produce insights
from the available data. BA Usage is not often described as human problem solving6, but that, we
argue, is what it is. Human problem solving is a hugely complex and much studied topic (Simon 1955,
Newell and Simon 1972, Amabile 1983, Davidson and Sternberg 2003), but Pretz et al. (2003) explain
that in simple terms it may be viewed as a cycle consisting of the seven steps shown in the Figure 37.
Pretz et al. (2003) also explain that these steps are often not executed in the vertical step-1 to step-7
sequence shown (that is the reason for all the arrows on the left of the boxes in Figure 3).
[Figure 3 goes here]
Since it is hard to appreciate both the personal human effort and sometimes very creative thinking in
the process depicted in Figure 3, we have decided to use the following trivial example of BA use to
remind the reader of the difficult and very-human process of attempting to extract insight from even a
tiny sample of data. With the goal of bringing the process depicted in Figure 3 to life, we ask the
reader to please consider the data headed x1, x2, and y shown in columns A, B, and C of Figure 4.
Looking only at columns A, B, and C, can you, the reader, see any relationship between the numbers
in the columns?
[Figure 4 goes here]
Assuming that the reader has now spent a minute or so trying to identify the relationship between x1,
x2, and y in columns A, B, and C, we now offer the following comments. First, scanning down
columns A, B, and C, one can see that when x1 and x2 (columns A and B) are high (e.g., in rows 8 and
11), y is high, and when x1 and x2 are low (e.g., row 16), y is low. But it is hard to see a clear pattern.
6 For example, the term “problem solving” appears only once in Davenport and Harris (2007), thrice in Albright et al. (2010), and twice in Loshin (2012). However, this absence of reference to “problem solving” is remedied by Davenport and Kim (2013), who make is clear that—consistent with Figure 3—doing BA means: (a) problem framing, (b) problem solving, and (c) communicating the results. 7 We, the authors of this paper, prepared this diagram. It is not in Pretz et al. (2003). Amabile (1983, Fig 2, p.362) shows a similar process, though her diagram has only five steps.
This article is protected by copyright. All rights reserved.

10
Second, since both the problem (finding the relationship between x1, x2, and y) and representation
(the data for these three variables are represented in columns A-C in Figure 4) in this example (step 2
in Figure 3) are clear, many of us would jump quickly to step 3 in Figure 3 and propose a solution
strategy that involves using, say, a combination of scatterplots (data visualization) and OLS
regression to explore the relationship. Third, knowing (step 4) that the spreadsheet program (Excel)
can both draw graphs and do OLS regression, we might decide to allocate mental and physical
resources (step 5) to solving the problem by (i) drawing various graphs (e.g., the scatterplot in the top
right of Figure 4, which shows an underlying positive correlation between x2 and y), and (ii) clicking
on “Data Analysis” at the top right of Figure 4 and producing the output shown in columns G to M of
Figure 4. Fourth, using our knowledge of statistics (back to step 4), we might infer that 23% (cell H6)
of the variance in column y may be explained by an equation of the form y=6.90-0.16*x1+0.49*x2
(cells H17-H19) (step 5). Fifth, to assess progress towards our goal (step 6) of explaining the
relationship between x1, x2, and y, we might compute the value estimated for y for each row (step 5).
This is shown in column E. Sixth, Evaluating our solution for accuracy (step 7), i.e., comparing
column E with C, we might note that the value for our y-estimate is high(ish) for row 8 and low(ish)
for row 16, which is comforting, but there is still much variance in y that is not explained by x1 and x2.
Seventh, having achieved a clearer understanding of the problem (back to step 1) we might find
ourselves asking what to do next. (At this point, we shall terminate the exercise.)
Our reason for including this example (Figures 2 and 3 and the paragraph above) in this paper is to
make three very simple points: (1) despite all the computing power available to the analyst, the
creative work (e.g., sense-making, framing, understanding, and deciding) in using business-analytics
tools is done by people, not computers, (2) the work these people do is called “human problem
solving”, a much-studied topic of huge complexity, and (3) the model in Figure 3 provides a useful
depiction of this intensely human problem-solving activity. In other words, it is people who look at
the data, assign meaning to it, search for patterns, sense opportunities, and so on. Further, it is
people—with all their different knowledge and cognitive capabilities and limitations—who derive
insights, through a process like that depicted in Figure 3.
It is our contention that the problem-solving process depicted in Figure 3 must be executed over and
over in organizations around the world as people in the organization seek to gain value from BA. This
problem-solving activity is the first key and necessary step along the pathway from BA Use to
Organizational Benefits from BA depicted in Panel A of Figure 2.
Insight
Having examined the box labeled Use Analytic Resources, and shown how much personal sense-
making effort is required from the people using BI tools, we now turn to the box labeled Insight(s) in
This article is protected by copyright. All rights reserved.

11
Panel A of Figure 2. In this BA context, “Insights” are defined in Table 1 to mean “The gaining of a
deep or deeper understanding of something, arising from use of business-analytic (BA) capabilities.”
Davenport and Patil (2012) describe insights as “treasure” coaxed “out of messy, unstructured data”
(p.70). The goal of BA usage is to produce such insights. Again, it is important to point out that
insights occur in people’s heads, not in computers, and that they are—possibly erroneous—
interpretations of reality (Daft and Weick 1984, Shah et al. 2012).
At this point, we would like to reveal to the reader that the spreadsheet formula used for computing
the values in column C in Figure 4 was y= rand()*10+0.3*x1+0.4*x2, where “rand()” generates a
random number between 0 and 1. Please consider for a moment how this formula led to the
generation of the numbers in column C. For example, the number in cell C2 was computed as:
y=0.774*10+ 0.3*4+0.4*10 (where 0.774 is a random number between 0 and 1 that was generated
automatically by Excel, x1=4 in cell A2, and x2=10 in cell B2). There is so much randomness in y due
to the first term in the formula that for the data in Figure 4, the regression algorithm has struggled to
identify the true underlying relationship (y= 5+0.3*x1+0.4*x2). Of course, in the real world, the
analyst does not know the true relationship. He/she has to make do with the OLS regression-
coefficient estimates such as those in cells H17-H19 of Figure 4. As is clear from this example, these
estimates can be quite misleading8.
It is our hope that when the equation for column C was revealed, the reader suddenly “saw” the
relationship between the columns more clearly. Such clarity of understanding is called “insight”.
According to the literature on insight (e.g., Dominowski and Dallob 1996, Gruber 1996, Mayer 1996,
Schooler et al. 1996, Bowden et al. 2005), some insights are clearer, or likely to be more valuable, than
others, and problem solvers often report a sudden “flash” of insight: “When the solution is seen, all the
parts suddenly seem to fit together” (Schooler et al. 1996, p.579). Bowden et al. (2005) report that
such “flashes” of insight correspond to measurable electrical activity in the brain. In addition, BA
users are often aware of the value of their different insights. For example, in a study of the use of
data-visualization BI tools such as Tibco’s Spotfire (http://spotfire.tibco.com/), Saraiya et al. (2006,
p.4) asked a group of bioinformaticians to rank insights on a scale from 1-5, with 5 being “the most
significant”. The tables that follow in their paper suggest that the analysts were able to do this quite
easily (though we are not told how accurately).
Our goal in this paper to not to explore in depth the nature of human insight formation, but we do
argue that, as shown in Panel A of Figure 2, insight formation is the second key and necessary step
along the pathway from BA Use to Organizational Benefits from BA.
8 With 1,000 “observations”, i.e., rows of data in the spreadsheet, the estimated coefficients were much closer to the true values, and the p-values in cells K17, K18, and K19 were highly significant.
This article is protected by copyright. All rights reserved.

12
Decisions
We now turn to the box labeled Decision(s) in Panel A of Figure 2. Decision-making, too, is an
intensely human personal (and often group) activity. Akinci and Sadler-Smith (2012) and Eisenhardt
and Zbaracki (1992) provide two excellent summaries of knowledge about human decision making.
Akinci and Sadler-Smith (2012), in particular, take the reader on a guided tour of the evolution of
world’s understanding of how individual managers make decisions. Highpoints along their tour are
the work of three Nobel Prize winners: (1) Simon’s work on bounded rationality and his behavioral
theory of organizational decision making, (2) Kahneman and Tversky’s work on heuristic biases in
human decision making, and (3) Sperry’s work on the functional specialization of the cerebral
hemispheres of our brains. Akinci and Sadler-Smith’s (2012) summary of managerial decision making
is complemented by Eisenhardt and Zbaracki’s (1992) review of strategic decision making in
organizations. Their conclusion is succinctly summarized as follows:
“It is clear that people are rational, but only boundedly so, that power wins battles of choice, and
that chance affects the course of strategic decision making. It is also clear that a synthesis of
bounded rationality and political perspectives provides a compelling description of strategic
decision making.” (Eisenhardt and Zbaracki, 1992, p.18)
Our point, again, is that like the preceding two steps in the process model in Panel A in Figure 2, the
decision-making step is also an intensely human activity. It is by no means assured, for instance, that
insights from analytics use will result in any intendedly value-creating actions at all, or if actions are
taken, whether they will be guided by some earlier insight or by other interests. In proposing the
process model in Panel A of Figure 2, we are arguing that Decision-making is the third key and
necessary step along the pathway from BA Use to Organizational Benefits from BA.
Intendedly value-creating actions
The Intendedly value-creating actions in the process model in Panel A of Figure 2 were discussed
earlier under the heading “The three paths in Panel A”. As pointed out then, such actions normally
require the use of many of the organization’s other, non-BA, resources9. Our claim is that these
Intendedly value-creating actions are the fourth key and necessary step along the pathway from BA
Use to Organizational Benefits from BA10. The logic is: no actions taken, no value from BA!
9 Strictly speaking, therefore, the shorthand expression “Organizational benefits from BA use” is incorrect: the organizational benefits are the result of using many of the organization’s resources. Our justification for using the shorthand expression is that BA-usage is regarded as the causal driver of the benefits. Ricardo (1817) used a similar shorthand when he attributed the economic rent from ownership of scarce highly productive corn-growing land to the land, and ignored the contribution of all the people and other resources needed to work the land to produce the corn and get it to market. 10 In saying that the action step is always necessary, we treat inaction following a decision not to act in a way that had been previously planned as a type of action.
This article is protected by copyright. All rights reserved.

13
Summary: The Process Model in the BASM (Panel A in Figure 2)
Analytics use sometimes leads to insights, insights inform decision making, and if those decisions lead
to beneficial actions, they also lead to business benefits from BA use. Equally, if there are no insights,
or insights do not lead to decisions that lead to beneficial actions, there will be no benefits from BA
use. Further, the first three steps in the process shown in Panel A of Figure 2 are intensely human
activities. Our first major knowledge claim in this paper is simply that the process depicted in Panel A
of Figure 2 is fundamental to the realization of benefits from BA. Because no other academic
researcher seems to have made a similar claim (certainly none of the academic authors whose models
appear in online Appendix 1 has done so), we regard this model as the first major contribution of this
paper.
We have one final point to make before leaving this discussion of the process model in Figure 2. This
is that value from BA may be generated by many people in an organization, not just data scientists
(Davenport and Patil 2012). For this reason, the words “executed over and over again in different
parts of the organization” in Figure 2 are very important. Our argument is that (a) many, many people
throughout an organization may have access to BA tools, (b) all of them may have useful insights, and
(c) one million “ten-dollar” insights are worth as much as one “ten-million dollar” insight. In other
words, repeated execution of the process in Panel A of Figure 2, by people all over the organization, is
the fundamental driver of benefits from business analytics.
The Variance Model in the BASM (Panel B in Figure 2)
The variance model in the BASM (Panel B in Figure 2) presents a different, but complementary,
explanation of how organizations use business analytics to create business value. It answers Research
Question 2 by focusing on things that managers can do to help their organization realize greater
business value from BA. In constructing this sub-model, we drew mainly on insights from Davenport
and Harris (2007), Davenport et al.’s (2010) DELTA model, Watson and Wixom (2007), and Seddon
et al.’s (2010) OBES model. All five factors from DELTA, all six factors from Watson and Wixom
(2007), and three of the six factors from OBES are included in this model. The model—which is a
special case of both Seddon et al.’s (2010) OBES model and Murer et al.’s (2011) enterprise-
architecture-planning approach applied to business analytics—argues that an important mechanism11
through which firms derive increased benefits from business analytics is through on-going BA-
improvement projects. BA-improvement projects include both the implementation of new BI
software (that delivers new analytics functionality) and initiatives that apply existing functionality to
new areas of decision making.
11 Here the word “mechanism” is used in the same sense as in Critical Realism (Bhaskar 1978).
This article is protected by copyright. All rights reserved.

14
Apart from the Organizational Benefits construct, none of the concepts in this variance model is
present in the process model. Yet as we now show, the constructs in the variance model provide an
equally powerful explanation of how BA contributes business value. This is why we see the two views
in the BASM as complementary.
The right-hand project side of the model in Panel B of Figure 2 hypothesizes, as H1-H4, that the
greater the extent of functional fit (H1), ready availability of high-quality data (H2), analytical people
(H3), and success in overcoming organizational inertia (H4) resulting from a BA-improvement
project, the greater the organization’s success in realizing benefits from that project. The left-hand
side of Panel B hypothesizes that in the long term, it is analytic leadership (H5), the adoption of an
enterprise-wide analytics orientation (H6), the selection of well-chosen targets (H7), the extent to
which evidence-based decision making is embedded in the “DNA” of the organization (H8), and
execution of multiple BA-improvement projects (possibly over many years) (H9) that drive benefits
from business analytics. Each of these hypotheses is now explained and justified in turn.
Hypothesis Development (Hypotheses 1-9)
It is hypothesized in the BASM that variance in Organizational Benefits from Analytics Use (with Use
being as described in the process model section, and Benefits being assessed from the perspective of
senior management) is driven by variance in each of the nine independent variables defined in Table 2
and discussed below.
[Table 2 goes here]
Functional fit
As defined in Table 2, row 16, Functional fit (FF) is “the extent to which the functionality provided by
the BA platform matches the functionality that the organization needs to access and analyze data
effectively and efficiently”. This concept is very similar to Clark et al.’s (2007) “Management Support
Systems Functionality”. Our FF concept comes from Seddon et al. (2010), who argue that
“organizations invest in ES for their functionality” (“ES” being “enterprise systems”). Similarly, we
argue here that the fitness for purpose of functionality provided by BI toolset, e.g., for business and ad
hoc queries, fixed reports, dashboards, OLAP, and/or visualization (Howson 2011), is an important
determinant of the benefits that an organization can derive from a BA-improvement project (post go-
live). Such projects might involve either the implementation of new software to deliver new BI
functionality to the organization, or initiatives that apply existing (and possibly unused) functionality
to a new area of decision making. Further evidence of the importance of functional fit is that two of the
three most significant path coefficients reported by Işik (2010) in her n=111 survey on BI Success were
related to Functional fit (her H1e Flexibility and H2a User Access Quality). Since toolset functional fit
This article is protected by copyright. All rights reserved.

15
helps to determine benefits that flow from each BA-improvement project, it is hypothesized that:
H1: The greater the Functional fit (FF) resulting from each BA-improvement project, the greater the
Organizational Benefits from BA Use.
Note that current vendor interest in products such as SAP HANA, Oracle Exalytics, and Every Angle
suggests that an important attribute of functional fit is speed of access to information. The massive
reductions in the time to access information, e.g., from hours to minutes, enabled by such products
make it more likely that decision makers with ready access to such tools will search for information to
support decision making more frequently than those without such access, and so derive more value
from business analytics.
Readily available high-quality data
As defined in Table 2, row 17, Readily available high-quality data is “The extent to which relevant
and accurate data are readily available for analytics use, from sources both within and external to the
organization”. According to Davenport et al. (2010, p.23), data are “the prerequisite for everything
analytical”, and “You can’t be analytical without data and you can’t be really good at analytics without
really good data.” They also argue that appropriate governance arrangements need to be in place to
ensure data accessibility. Watson and Wixom (2007) and Sabherwal and Becerra-Ferandez (2011)
make a similar point. For example, Watson and Wixom (2007, p.98) say that a key to BI success is
that “There is a strong decision support data infrastructure”. Since readily available high-quality data
is likely to vary from BA-implementation project to project, it is hypothesized that:
H2: The greater the extent of readily available high-quality data available for each BA-improvement
project, the greater the Organizational Benefits from BA Use.
Analytical people
As defined in Table 2, row 18, the variable, Analytical people, is “The extent to which there are people
within the organizational unit with an analytic mindset who help drive business value from BA.” Such
people include Davenport et al.’s (2010, pp.91-98) analytical champions, professionals, semi-
professionals, and amateurs. According to Davenport and Harris (2007, p.131), “It is people who
make analytics work and who are the scarce ingredient in analytic competition”, not the organization’s
access to, for example, high-powered data-mining tools. Since the availability of capable analytical
people is likely to vary from project to project, it is hypothesized that:
H3: The greater the quality of analytical people available on each BA-improvement project, the
greater the Organizational Benefits from BA Use.
This article is protected by copyright. All rights reserved.

16
Overcoming Organizational Inertia
As defined in Table 2, row 19, Overcoming Organizational Inertia (OOI) is “The extent to which
members of the organization have been motivated to learn, use, and accept the new system”. This
concept comes from Seddon et al. (2010), who argue that “no matter how good the technical system,
unless people in the organization are motivated to use the system, and have sufficient knowledge of
how to use the system effectively (Purvis et al. 2001), the organization is unlikely to gain the benefits it
might from the system”. In a similar vein we argue here that if a BA-improvement project is intended
to result in a system that users in some part of the organization must be persuaded to learn and use,
the organization’s success in overcoming organizational inertia will be a key determinant of benefits
from that BA project. Watson and Wixom (2007, p.98) make a similar point when they say that a key
to BI success is that “Users have the necessary tools, training, and support to be successful”. Further,
since the organization’s success in overcoming organizational inertia is likely to vary from project to
project, it is hypothesized that:
H4: The greater the success in Overcoming Organizational Inertia (OOI) in each BA-improvement
project, the greater the Organizational Benefits from BA Use.
The significant path coefficient of 0.33 (n=419, p<0.001, from 347 organizational units) between
operational managers’ Absorptive Capacity (a characteristic of the people using BI) and BI
Assimilation (a measure of business benefits attributed to use of BI) reported by Elbashir et al. (2011)
lends further support for the likely validity of H3 and H4.
Analytic Leadership
As defined in Table 2, row 11, Analytic Leadership is “The extent to which people in any
organizational unit take leadership of initiatives or projects to increase use of business analytics for
organizational gain”. With respect to leadership, Davenport et al. (2010, p.57) say: “If we had to
choose a single factor to determine how analytical an organization will be, it would be leadership. …
Leaders have a strong influence on culture and can mobilize people, money, and time to help push for
more analytical decision making.” In a similar vein, Watson and Wixom (2007, p.98) say a key success
factor for BI success is that “Senior management believes in and drives use of BI.” Since analytic
leadership seems so important for the realization of benefits from BA, across projects, not just for
individual projects, it is hypothesized in the BASM that:
H5: The greater the extent of analytic leadership in the organization, the greater the Organizational
Benefits from BA Use.
Enterprise-wide Analytics Orientation
As defined in Table 2, row 12, an Enterprise-wide Analytics Orientation is “The extent to which the
This article is protected by copyright. All rights reserved.

17
organization has adopted an enterprise-wide orientation to the use of business analytics”. The
definition in Table 2 further explains that ‘Such an enterprise-wide view is normally supported by an
integrated BI platform that provides “a single, holistic view of the company” (Davenport et al. 2010,
p.45) rather than, for example, multiple datamarts’. Davenport et al. (2010, Ch.3) argue forcefully
that an enterprise-wide view of the role of BA is critical to BA’s success. “To develop an enterprise-
wide view of analytics, a company must do more than integrate data, combine analysts, or build a
corporate IT platform. It must eradicate all of the limited, piecemeal perspectives harbored by
managers with their own agendas, needs and fear—and replace them with a single, holistic view of the
company.” (Davenport et al. 2010, p.45). This same message appears again in Davenport et al.’s
(2010) Ch.7, where they make the point that organization-wide optimization of business processes is
often more valuable than local optimization, and organization-wide optimization requires an
enterprise-wide analytics orientation. Since an enterprise-wide analytics orientation seems so
important for the realization of benefits from BA, across projects, not just for individual projects, it is
hypothesized that:
H6: The greater the extent to which the organization has adopted an Enterprise-wide Analytics
Orientation the greater the Organizational Benefits from BA Use.
Well-chosen targets
As defined in Table 2, row 13, Well-chosen targets is “The extent to which targets for new analytics
initiatives are selected carefully based on the combination of their business potential and whether the
necessary resources, including data, are available (Davenport et al. 2010, Ch.5)”. For a firm new to
analytics, Davenport et al. (2010, p.73) suggest that a specific business problem might be a good
target. For more analytically advanced organizations, the best targets, according to Davenport et al.
(2010), will be those that help the organization enhance the distinctive resources that provide it with
competitive advantage. Watson and Wixom (2007, p.98) similarly draw attention to the need for
well-chosen targets when they say that BI is more successful if “There is alignment between the
business and BI strategies”, and “There is effective BI governance”. In a similar vein, Sabherwal and
Becerra-Fernandez (2011) argue that BI governance processes, e.g., articulation of BI principles, and
creation of a BI Steering Committee, are important drivers of benefits from BI. Finally, from Murer et
al.’s (2011) perspective, well-chosen targets should also increase future BI agility as well as producing
business value today. Since choosing sound targets for future initiatives is clearly a key driver of
future BI benefits, it is hypothesized that:
H7: The sounder the governance processes for selecting (well-chosen) targets for future BI initiatives,
the greater the Organizational Benefits from BA Use.
This article is protected by copyright. All rights reserved.

18
Extent to which evidence-based decision making is embedded in the “DNA” of the
organization
In the BASM, the construct Extent to which evidence-based decision making is embedded in the
“DNA” of the organization (Table 2, row 14) is an attempt to assess the extent to which evidence-
based decision making is embedded in the core values and processes of the organization. Kettinger et
al. (2011) describe this concept as the firm’s Information Orientation. Howson (2008) and IDC
(Vesset and McDonough 2009) call it Pervasive BI. In the first Davenport book on BA, Davenport
and Harris (2007) describe firms where evidence-based decision making has become the very basis of
their competitive advantage as “analytic competitors”: “We define an analytical competitor as an
organization that uses analytics extensively and systematically to outthink and outexecute the
competition” (p.23). However, as Davenport et al. (2010, p.vii) point out in the preface to their second
book, their first book was about “the earliest and most aggressive adopters of analytics”. Many other
firms, they explain in their second book, just want to know how to become more analytical. The
implication of these comments is that as organizations become more analytical (i.e., as evidence-based
decision making becomes more and more deeply embedded in their “DNA”) they will realize
increasingly more benefits from their use of BA. Similar arguments are presented in Kettinger et al.
(2011), Accenture (2011), LaValle et al. (2011), and Watson and Wixom (2007). For example, Watson
and Wixom (2007, p.98) say that BI is more successful when “The use of information and analytics is
part of the organization’s culture”. In terms of barriers to the use of analytics, Accenture’s 2010 global
survey of 800 “directors and senior managers” reported that “corporate culture still presents a major
barrier” to the wider use of customer “analytics and fact based decision making” (Accenture 2011).
The above insights are summarized in the following hypothesis:
H8: The greater the extent to which evidence-based decision making is embedded in the “DNA” of the
organization, the greater the Organizational Benefits from BA Use.
On-going BA-improvement projects
Finally, as defined in Table 2, row 15, On-going BA-improvement projects is “A measure of the
number and extent of investment in BA-improvement projects. Such projects include both the
implementation of new BI software (that delivers new analytics functionality) and initiatives that
apply existing functionality to new areas of decision making.” The claim that On-going projects is a
source of business value builds on the work of Seddon et al. (2010), who argue that the primary driver
of benefits from Enterprise Systems (ES) is “on-going improvement projects that deliver new
functionality to users.” A similar idea is discussed by Murer et al. (2011) in the context of enterprise
architecture, e.g., see their Figure 7.1, p.204. The importance and beneficial consequences of ongoing
BA projects are clearly evident in Shanks and Bekmamedova (2012a, b).
This article is protected by copyright. All rights reserved.

19
In Seddon et al. (2010), new functionality is delivered by projects that implement new ES software. In
the BASM in Figure 2, we have extended the project concept to include both (i) projects that
implement new BA software, and (ii) projects that using existing software in new ways or in new
areas, called new initiatives. The benefits driver in both cases is the running of new projects. This
insight—that BA-improvement projects are likely to be a primary driver of new analytics resources
that, in turn, deliver new benefits—is captured in the following hypothesis:
H9: The greater the organization’s investment in on-going Business Analytics-improvement projects,
the greater the Organizational Benefits from BA Use.
Summary
The Business-Analytics Success Model (BASM) model in Figure 2 is a synthesis of many ideas from
the BA literature, as well as from the broader IS, Psychology, and Management literatures. It is an
attempt to identify the most important mechanisms through which organizations achieve business
value from business analytics, and to place them as logically as possible in a well-defined model. In
terms of context, the BASM views organizations and their subunits as acting like living things within a
highly competitive environment, where those living things need information to know how to react to
changes in that environment (Beer 1972, 1984).
The BASM presents two different, though mutually compatible, perspectives to explain how use of
business analytics contributes to business value. First, the process model in Panel A of Figure 2 shows
the focal organization’s use of its BA resources to conduct routine and non-routine analyses of both
internally and externally-sourced data to contribute to business value by revealing insights that lead to
decisions to take intendedly value-creating actions. Some of these actions (path 2 in Panel A) lead to
changes in organizational resources, but as pointed out by Shanks and Bekmamedova (2012a,b), many
use existing resources (path 1) to produce business value. The process in Panel A is executed over and
over by different people in different parts of the focal organization.
Second, in addition to the preceding “process” view, the BASM also offers a variance-model
explanation of how firms use BA to create business value. In the variance model, it is argued that in
the long term the key to achieving greater business value from BA is to have strong analytical
leadership (H5), adopt an enterprise-wide orientation (H6), direct resources towards high-return
targets (H7), and embed a positive attitude to evidence-based decision making in the “DNA” of the
organization (H8). In addition, the BASM argues that these four drivers will induce managers in the
focal organization to embark on new BA-improvement projects, either to implement new BI resources,
or to use BI in new ways (H9). For each of these projects, success in generating business value, the
BASM argues, is likely to be higher if the new capabilities are a good fit with business needs (H1),
high-quality data are readily available (H2), the organization has the analytic-people capabilities to
This article is protected by copyright. All rights reserved.

20
use the BI tools available (H3), and training and change management are used to support any changes
in work practices required to use new systems (H4).
As an example of the application of this “projects” side of the BASM, if the project involves developing,
say, a new dashboard for assessing credit risk of customers in the Finance department of a merchant
bank, the model asserts that it is the specific dashboard functionality delivered (H1), the ready
availability of relevant high-quality data (H2), the analytic capabilities of the Finance-department staff
(not others elsewhere in the organization) (H3), and the capacity and motivation of dashboard users
to learn to use the new functionality (H4) that will drive benefits from the project. Further, the
organization’s capacity to execute this dashboard-implementation project, and to absorb the changes
in work practices that flow from it, is an example of a dynamic capability (Teece et al. 1997; Path 2 in
Panel A of Figure 2). Finally, once the organization has gone live with its new dashboard system,
benefits from use will flow from repeated execution of the process depicted in Panel A of Figure 2.
Although many variance models of factors affecting realization of organizational benefits from BA
have been published (see models 5 to 16 in Online Appendix 1), no other researcher seems to have
developed as comprehensive a variance model as that shown in Panel B in Figure 2. We therefore
regard this variance model as the second major contribution of this paper.
Preliminary Assessment of the Validity of the BASM: Methodology
To conduct a preliminary assessment of the validity of the BASM (Figure 2), we downloaded a series
of BA customer-success stories from various vendor websites and examined those stories to see how
frequently concepts and relationships identified in the BASM were discussed in those stories in a
manner consistent with the model. The reasoning behind this method of assessment is that in their
attempts to convince potential purchasers of the value of buying their software, vendors are likely to
discuss the things that they think are most important to the realization of benefits from their software.
Vendors are also particularly well placed to understand factors affecting benefits from BA, because
they discuss these factors with their customers on a daily basis over many years. Therefore, a good
model should highlight things that are mentioned frequently in the vendors’ customer-success stories.
The downside of using vendors’ customer-success stories is that such stories always paint a rose-
colored picture of the use of the vendor’s software. However, success stories are built on a scaffolding
of facts about people and processes that can be used, with care, to gain much easier access to a wide
range of BI-using organizations than is possible through, say, organizing and conducting case studies
or surveys oneself. For example, Işik (2010) reported a disappointingly low (less than 1%) response
rate to a survey mailed out to over 11,000 “corporate and IS buyers of business intelligence”. Thus in
this study, as an alternative to a survey, we used vendor-published BA customer-success stories as our
source of data. Seddon et al. (2010) used a similar method in their preliminary test of their OBES
This article is protected by copyright. All rights reserved.

21
model, published in MIS Quarterly.
Characteristics of the sample
Our sample of customer-success stories was gathered by visiting major BI-vendor websites and
looking for success stories related to the use of analytics to create business value. We found that so-
called “case studies” from IBM, SAP, and Teradata were the most useful because they were typically
longer than those of other vendors. Stories from other vendors, e.g., Oracle, MicroStrategy, and SAS,
were less comprehensive and therefore less useful for our purpose. Customer-success stories were
selected when they discussed some aspect of the use of business analytics. In other words, stories
focusing on just technology or implementation, but not use, were excluded. Using these criteria, we
downloaded 160 customer-success stories. These stories cover use of business analytics in a wide
range of different sized, mainly US-based firms, from a wide range of industries and government.
From these stories we used a random-number generator to select 100 stories for analysis for this
paper12. The resulting sample contained 39 stories from IBM, 28 from SAP (including seven 20-
minute videos from SapphireNow), 19 from Teradata, plus a handful from each of Information
Builders, Microsoft, and Qliktech). In total, the data consisted of over 410 pages of text, seven 20-
minute videos, and 98 PowerPoint screens. A good example of a customer-success story is a seven-
page article from IBM Cognos on Sharp HealthCare (IBM, 2010) discussed in the next section.
Coding
For our preliminary assessment of the validity of the BASM, two coauthors first worked together to
code a small number of examples from the 100 selected. Both coders then worked independently
coding the remaining stories, meeting three times to discuss and reconcile codes. We used a
spreadsheet with one row per success story, and 18 columns for the 18 concepts in the BASM to record
results of our analysis. For each story, coding involved asking whether any of the 18 concepts in the
BASM, e.g., analytic leadership, readily available high-quality data, etc., was mentioned in the success
story in a way that was consistent with its use in the model. If the answer was Yes, a ‘1’ was placed in
spreadsheet in the cell for that concept (column) for that success story (row). If a concept was not
mentioned in the success story in a manner consistent with the model, a zero was placed in the cell.
Occasionally, if the evidence was present, but weak, we scored the strength of evidence as 0.5, not 1.
Apart from the spreadsheet, no other software was used for coding. The initial level of agreement
between the coders was 76%. After discussing differences, agreement increased to 98%. Final
12 We restricted our analysis to only 100 stories, because the pattern of percentages in the Results table, Table 4, was already evident after 50 stories had been coded. That pattern had hardly changed after 100 stories had been coded, so we decided to stop coding at that point. Details of all 100 success stories analyzed are presented in online Appendix 3.
This article is protected by copyright. All rights reserved.

22
decisions on the last 2% were made by the lead author of this paper. After coding was complete, totals
for each column were used to calculate the percentage of success stories that contained mention of a
construct from the BASM in a way that was consistent with the model.
To illustrate these coding judgments, consider the Sharp Healthcare example in Figure 5. First, the
story describes a two-year project led by Vonda Brown, Manager, Decision Support Systems, to
replace hundreds of Excel spreadsheets and Access databases by a central data warehouse (p.2):
“The data warehouse unites charge, expense, revenue and clinical information—from clinic,
medical group, hospital, lab, pharmacy, physician orders, vital signs, allergies, immunizations,
operating room, encounters and referral data—into one place to make operational decisions easier
and more effective.”
[Figure 5 goes here]
This was clearly an enterprise-wide software-implementation project, led by a key manager, that
affected the work practices of many people at Sharp Healthcare. So there was a good fit between the
project-oriented view the BASM inherited from Seddon et al. (2010), and the success story as told by
IBM. Second, the “Key Benefits” section of Figure 5 says that BI is now being used in this organization
as an integrated reporting tool for improving organizational effectiveness, not as the primary basis for
competition like the case studies in Davenport and Harris (2007). So, again, there was a good fit
between the “operational use of BA” view the process model in the BASM inherited from Shanks and
Bekmamedova (2012a,b) and this success story from IBM.
Turning now to the detailed coding, we treated comments in the text of the success stories as evidence
of support or otherwise for different parts of the model. As “outside researchers” (Walsham 2006),
our analysis was of the printed text. However, we relied on our own understanding of the situations
described to interpret the words on the pages. Examples of coding are shown in Table 3. The text was
presumably written by marketing people at IBM, and the quotations are from Vonda Brown, the
Decision Support Systems manager, and Carol Wanke, Director, Patient Financial Services, for Sharp
Healthcare. There is not enough space in this paper to present examples of all coding even for this
single success story, but Figure 5, the quotation above, and the 13 examples in Table 3 show the nature
of the evidence used. The reader is encouraged to read the actual success story13 for more details.
[Table 3 goes here]
13 http://locussolutions.com/wp-content/uploads/2015/03/Case-study-Sharp-Healthcare.pdf (viewed Nov 2015)
This article is protected by copyright. All rights reserved.

23
Results
Results from our analysis of the 100 vendor-sourced business-analytics success stories are
summarized in both Table 4 and Figures 6 and 7. The table reports the percentages of times that the
various concepts from the BASM in Figure 2 were mentioned in the success stories in a way that was
consistent with the model.
[Table 4 goes here]
Process Model
With respect to the process model (rows 1-10 in Table 4), we expected that all the stories would report
that BA Resources (technology and analytical people) were being used to produce insights leading to
decisions and actions that—in conjunction with each organization’s many non-BA resources—led to
Organizational benefits. The high percentages (above 75%) for seven of the nine constructs in
Figure 6 are consistent with this expectation. Given that all the success stories came from technology
vendors, it is no surprise that 100% of stories mentioned Enabling technology. The implications of the
two low percentages (6% in row 5 and 12% in row 8 of Table 4) are discussed shortly.
[Figure 6 goes here]
Variance Model
With respect to the variance model (rows 11-19 in Table 4), given the strength of Davenport et al.’s
(2010) arguments about the importance of the factors in their DELTA model and Seddon et al.’s
(2010) claims about the importance of the factors in their OBES model, we expected strong support
for all hypotheses except for H8 (row 14), where Davenport et al. (2010) had already reported that few
firms that they studied were “analytic competitors”. However, the results in Table 4 and Figure 7
show high percentages (above 75%) for only five of these nine hypotheses. There was strong support
for four of Davenport et al.’s five DELTA factors, namely, Data (H2, row 17, 86%), Enterprise-wide
orientation (H6, row 12, 76%), Leadership (H5, row 11, 92%), and Targets (H7, row 13, 88%), but
support was weak for DELTA’s fifth factor, Analytical people (H3, row 18, 13%). There was also strong
support for one of Seddon et al.’s three factors, namely Functional Fit (H1, row 16, 89%), but support
was weaker for the two other factors from OBES, On-going improvement projects (H9, row 15, 44%)
and Overcoming Organizational Inertia (H4, row 19, 35%).
[Figure 7 goes here]
Discussion
What are the implications for the BASM of the cells with low percentages in Table 4? One way of
interpreting the percentages in Table 4 is that they are all above zero, which means that there was
This article is protected by copyright. All rights reserved.

24
evidence in at least some success stories that all constructs in the BASM are helpful for understanding
how BA contributes to business value. However, this does not explain why six of the 18 percentages in
Table 4 are so much smaller than the others. Our explanations for the six low percentages, and their
implications for the BASM, are as follows:
Row 5: Only 6% of organizations in our sample made changes to organizational resources flowing
from use of BA. This is consistent with Shanks and Bekmamadova’s (2012) punctuated-
equilibrium model where firms made occasional changes to BA resources then used the resulting
resources for months before changing them again. It is also consistent with the Tesco example
discussed earlier. However, the change-resources path (path 2 in Panel A of Figure 2) was
sometimes taken, and when it was, it led to important changes, e.g., reduction in staff. Therefore,
we decided that the Change resources path is a meaningful option, and is worth retaining in the
BASM.
Rows 8 and 18: Only 12-13% of success stories in our sample made reference to analytical people
(defined in row 18 of Table 2). The success stories frequently report people gaining insight from
their use of BI tools, but as with H8 (row 14, discussed next), they don’t often discuss whether
those people have analytic mindsets. Clearly, specialist analysts are required to use sophisticated
BI tools, e.g., data mining, so the concept of analytical people is valid and worth retaining in the
BASM. But it appears that the extent to which regular users of analytic tools are “analytic people”
is not something that vendors have chosen to discuss much in their success stories. Due to the
importance of analytical people in our process model, we have decided that it is a construct worth
retaining in the BASM.
Row 14 (H8): As noted above, Davenport et al. (2010) have already reported that few firms that
they studied in their second study were “analytic competitors”. It is no surprise, therefore, that
only 14% of firms in our sample showed evidence of an organization-wide commitment to
analytics. However, the fact that some did, and that consultants talk of “pervasive BI” (Howson
2008), shows the value of having H8 (which is inherited from both Davenport & Harris (2007)
and Davenport et al. (2010)) in the BASM. So we have decided to retain this construct in the
BASM.
Row 15 (H9): Only 44% of success stories in our sample discussed on-going improvement projects.
This percentage was smaller than expected, but 44 organizations is more than enough to show
that this concept can be an important driver of organizational benefits from BA. Therefore, both
this construct and H9 are worth retaining in the BASM. Importantly, the evidence that 44% of
success stories discussed multiple projects also demonstrates the merit of structuring the BASM
variance model in two parts: long-term and project-by-project. If few organizations ran multiple
projects, there would be little reason for structuring the BASM variance model in two parts.
This article is protected by copyright. All rights reserved.

25
Row 19 (H4): Only 35% of organizations in our sample discussed efforts to overcome organizational
inertia. This percentage was also smaller than expected, but 35 organizations is still more than
enough to show that this concept can be an important driver of organizational benefits from BA.
Therefore, both this construct and H4 are worth retaining in the BASM.
In addition to asking whether factors included in the BASM were discussed in the vendors’ business-
analytics success stories, it is also important when assessing a model to ask whether there were any
factors mentioned in the stories that are not captured in the BASM or concepts that were not
meaningful. Here, we have three insights to share. First, a type of benefit not captured in the current
BASM is that implementation of BI tools often enables users to develop their own reports, which
reduces pressure on the IT department to create new reports. This user-self-service benefit to IT was
frequently reported, and needs to be factored into future versions of the BASM. Second, two success
stories discussed the use of BI resources by their organization’s customers, not their own employees.
For example, the speaker from Omnicom OMD explained that OMD’s BI/Dashboard offering had
been “a key differentiator in major client account wins” (LoFrumento 2011, slide 18). To support this
claim, he quoted Nancy Bhagat, Intel’s VP of Sales and Marketing, who said of Intel’s new $300-
million media contract: “Each of the finalists impressed us, but OMD gave us a stronger sense of
possessing world-class media-industry leadership and state-of-the-art business intelligence and
analytics” (McIlroy 2008). Use of BI resources as a product, or for product differentiation, was not
considered when the BASM in Figure 2 was formulated. It makes one think of users and data
scientists working outside the focal organization. Third, it is clear from the success stories that
different users use different BI tools in very different ways. Drilling down into these different patterns
of tool use would be helpful. In future work, it would be useful to try to extend the BASM to reflect
these three insights.
Overall, despite these suggested areas for improvement, there is strong support for the existing BASM
in the vendors’ customer-success stories. In other words, the current BASM appears to provide a solid
basis for future model development. Further, because the sample used for this preliminary
assessment of the validity of the BASM comes from a broad range of organizations, we would expect it
to be applicable to a wide range of organizations in different industries and countries.
Limitations
The BASM in Figure 2 is the result of our attempt at sifting through the literature, then integrating
and summarizing insights from many prior researchers (e.g., see those in the online Appendix 1, but
also the broader IS, Psychology, and Management literatures) about the mechanisms through which
organizations realize benefits from BA. It is unlikely to be perfect. The major difficulties in such an
exercise are (a) deciding which ideas appear to be the more important, and (b) integrating them into a
This article is protected by copyright. All rights reserved.

26
coherent whole. In making the choices we did, we were also informed by the work of non-BA
researchers, e.g., Pretz et al. (2003), Sternberg and Davidson (1996), Akinci and Sadler-Smith (2012),
Eisenhardt and Zbaracki (1991), Barney (1991), Teece et al. (1997), and Beer (1972, 1984).
It seems to us that the best way to assess the result of all these judgments is empirically. That is why
we decided to analyze the 100 vendor-supplied BA-customer success stories. However, the
assessment we conducted is very preliminary. Much further work is still needed to assess the validity
of the BASM. It seems to us that the process model is very strong, however the structure and choice of
factors for the variance model may need more work. In particular, Quality of the BA platform is not a
factor in the variance model, yet it is a frequently mentioned factor in prior research (see Appendix 1).
Organization size and Industry may also be useful controls to add to any quantitative test of the
model14.
Finally, many of the more human-oriented aspects of the BASM (analytical people (H3); overcoming
organizational inertia (H4); and decision-making culture (H8)), received only modest support from
the vendor-sourced success stories. By contrast, the more technology-oriented factors (enabling
technology; well-chosen BA-project targets (H7); functional fit (H1); and high-quality data (H2))
received stronger support. This is probably another limitation of relying on vendor-sourced success
stories, which understandably tend to focus more on the technology (i.e., the vendor’s product
offerings), than people. Future empirical research using primary data collection to test the BASM
would help overcome this limitation.
Conclusion
As mentioned in the Introduction (and illustrated in Appendix 1), many models of factors that drive
benefits from BI and BA have now been published. Some are very complex, e.g., Clark et al.’s (2007)
model summarizes an extremely comprehensive review of the management-support-systems (MSS)
literature. Some are very high-level, e.g., Elbashir et al. (2011) who used highly abstract concepts, such
as absorptive capacity, to explain BI assimilation. Some are very simple, e.g., Işik (2010) found some
simple empirical relationships between technical and organizational BI resources and BI success. And
some are very implementation-project focused, e.g., Wixom and Watson (2001). However, most of
these models are so different that it is hard to identify any emerging consensus.
In an effort to consolidate what is known, our goal in this paper has been to create a model that
captures many of the key insights from the BA literature. We have also tried to extend that literature
by adding insights from the psychology, management, and IS literatures. In our opinion, the two-part
BASM in Figure 2—together with the two tables of definitions, the description of the process model,
and justifications of hypotheses in the variance model—provides a better explanation of what firms
14 Thanks to an anonymous review for this point.
This article is protected by copyright. All rights reserved.

27
need to do to realize greater benefits from BA than any prior work with which we are familiar (i.e., the
16 models in Appendix 1), and is thus the primary contribution of the paper. Finally, although much
more rigorous testing is clearly necessary, the empirical results summarized in Table 4 and Figures 5
and 6—which provide preliminary support for the model—are also a useful, though minor,
contribution.
We hope that other researchers will be able to take and extend our ideas, and conduct further tests of
the BASM or similar models. Testing of the process model would probably best be done by in-depth
case studies. One might begin by asking BA-users, especially data scientists, to think of times when
they have gained insight from use of BA, then to follow through to see whether the business had
realized benefits from these insights. Alternatively, one might start with instances of claimed benefits
from BA and work back to see what sorts of insights (and whose insights) had preceded them. In both
cases, the BASM process model provides a template for the expected pathways to benefits. Variance
models are probably better suited to cross-sectional testing, so the best way to test the BASM variance
model may be through surveys. For such testing, researchers might use the definitions in Table 2 to
develop questions for a survey instrument that could then be sent to knowledgeable people (e.g., the
senior person responsible for BA) in an appropriate sample of firms. The unit of analysis for the
survey might be BA efforts in the firm overall, or individual BA-improvement projects (in most firms,
one would expect a number of them). These efforts would provide clearer evidence of the validity or
otherwise of the various parts of BASM. This would, in turn, help managers, students, and fellow
researchers gain a clearer understanding of how firms realize business value from business analytics
and what they need to do to realize greater value in future.
This article is protected by copyright. All rights reserved.

28
References
Accenture (2011). Customer Experience Suffers As Organizations Make Inconsistent Use of Analytics, Accenture Research Finds, https://newsroom.accenture.com/subjects/analytics/customer-experience-suffers-as-organizations-make-inconsistent-use-analytics-accenture-research-finds.htm (viewed Nov 2015).
Accenture (2012). The Analytics Journey to ROI. http://www.accenture.com/us-en/Pages/insight-analytics-journey-roi-insights-summary.aspx (viewed August 2014)
Akinci, C., and Sadler-Smith, E. 2012. “Intuition in Management Research: A Historical Review,” International Journal of Management Reviews (14:1), pp. 104–122.
Albright, S. C., Winston, W. L., & Zappe, C. J. (2010). Data analysis and decision making with Microsoft Excel. South-Western Publishing.
Amabile, T. M. (1983). The social psychology of creativity: A componential conceptualization. Journal of personality and social psychology, 45(2), 357-376.
Barney, J. B. (1991). “Firm Resources and Sustained Competitive Advantage,” Journal of Management (17:1), pp. 99-120.
Barney, J.B., Ketchen D.J., and Wright, M. (2011) “The Future of Resource-Based Theory: Revitalization or Decline?,” Journal of Management 37(5) pp.1299-1315.
Beer, S. 1972. Brain of the Firm. Allen Lane, London: Penguin Press, First Edition. Beer, S. 1984. “The Viable System Model: Its Provenance, Development, Methodology and Pathology,”
The Journal of the Operational Research Society (35:1), pp. 7-25. Bhaskar R (1978). A Realist Theory of Science. Hassocks, Sussex: Harvester, UK. Bowden, E. M., Jung-Beeman, M., Fleck, J., & Kounios, J. (2005). New approaches to demystifying
insight. Trends in Cognitive Sciences, 9(7), 322-328. Clark T. D., Jones, M. C., and Armstrong, C.P. (2007). “The dynamic structure of management
support systems: Theory development, research focus and direction,” MIS Quarterly (31:3), pp. 579-615.
Daft, R. L., and Weick, K. E. (1984). Toward a model of organizations as interpretation systems. Academy of Management Review, 284-295.
Davenport, T.H. and Dyché, J. 2013. Big Data in Big Companies, International Institute for Analytics Davenport, T. H., Harris, J. G., and Cantrell, S. (2004). Enterprise systems and ongoing process
change. Business Process Management Journal, 10(1), 16-26. Davenport, T. H., and Harris, J. G. 2007. Competing on Analytics, Cambridge, MA: Harvard Business
School Press. Davenport, T. H., and Harris, J. G., and Morison, R. (2010). Analytics at Work, Cambridge, MA:
Harvard Business School Press. Davenport, T. H., and Kim, J. (2013). Keeping up with the Quants, Cambridge, MA: Harvard Business
School Press Davenport, T. H. and Patil D. J. (2012), Data Scientist: The Sexiest Job of the 21st Century, Harvard
Business Review October, pp.70-76 Davidson JE and Sternberg RJ eds. 2003. The Psychology of Problem Solving, Cambridge University
Press. DeLone, W. H., & McLean, E. R. (1992). Information systems success: the quest for the dependent
variable. Information systems research, 3(1), 60-95. Dominowski, R. L. and Dallob, P. (1996), Insight and Problem Solving, in Sternberg RJ and Davidson
JE eds. The Nature of Insight, The MIT Press, 1996, pp.33-62 Eisenhardt, K. M., and Zbaracki, M. J. 1992. “Strategic Decision Making,” Strategic Management
Journal (13:S2), pp. 17–37. Elbashir, M., Collier, P., and Sutton, S. (2011). “The role of organizational absorptive capacity in
strategic use of business intelligence to support integrated management control systems.” The Accounting Review (86), pp. 155-184.
Gregor, S. (2006). The nature of theory in information systems. MIS Quarterly, 30(3), 611-642. Gruber H. E. (1996). Insight and Affect in the History of Science, in Sternberg RJ and Davidson JE
eds. The Nature of Insight, The MIT Press, 1996, pp.397-431.
This article is protected by copyright. All rights reserved.

29
Hagerty, J., Sallam, R. L., and Richardson, J. (2012). Magic Quadrant for Business Intelligence Platforms, Gartner document G00225500, 6 Feb 2012
Hartono, E., Santhanam, R., & Holsapple, C. W. (2007). Factors that contribute to management support system success: An analysis of field studies. Decision Support Systems, 43(1), 256-268.
Helfat, C. E., Finkelstein, S., Mitchell, W., Peteraf, M. A., Singh, H., Teece, D. J., and Winter, S. G. (2007). Dynamic Capabilities: Understanding Strategic Change in Organizations, Carlton, Blackwell
Holsapple, C. Anita Lee-Post, and Ram Pakath (2014). A unified foundation for business analytics, Decision Support Systems, 64, pp.130-141.
Hopkins, M. S. (2010). “Interview with Eric Brynjolfsson: The four ways that IT is innovation,” MITSloan Management Review (51:3), pp. 51-56.
Howson, C. 2008. “The Road to Making BI Available to Everyone,” Information Week, Feb 23, 2008. http://www.informationweek.com/news/206801074 (viewed Nov 2015).
Howson, C. 2011. “BI Scorecard Strategic and Product Summary Q3 2011.” ASK LLC d.b.a. BI Scorecard, www.BIScorecard.com
IBM (2010). Case Study: Sharp HealthCare gets ahead of the curve:Performance management with IBM Cognos software, http://public.dhe.ibm.com/common/ssi/ecm/en/imc14503caen/ IMC14503CAEN.PDF (viewed June 2013).
IBM (2015). IBM PureData System, https://www-01.ibm.com/software/data/puredata/ (viewed Nov 2015).
Işik, Ö. (2010). Business Intelligence Success: An Empirical Evaluation of the Role of BI Capabilities and the Decision Environment, Doctoral Dissertation, University of North Texas, http://digital.library.unt.edu/ark:/67531/metadc30472/m2/1/high_res_d/dissertation.pdf (viewed Nov 2015).
Kettinger, W. J., Zhang, C., and Marchand, D. (2011). “CIO and Business Executive Leadership Approaches to Establishing Company-wide Information Orientation,” MISQ Executive (10:4), pp. 157-174.
LaValle, S., Lesser, E., Shockley, R., Hopkins, M. S., and Kruschwitz, N. (2011). Big data, analytics and the path from insights to value. MIT Sloan Management Review, 52(2), 21-32.
Langley, A. (1999). Strategies for theorizing from process data. Academy of Management review, 24(4), 691-710.
Langley, A., Smallman, C., Tsoukas, H., & Van de Ven, A. H. (2013). Process studies of change in organization and management: unveiling temporality, activity, and flow. Academy of Management Journal, 56(1), 1-13.
Liberatore, M. J., & Luo, W. (2010). The analytics movement: Implications for operations research. Interfaces, 40(4), 313-324.
LoFrumento, T. (2011). “Bringing Business Intelligence to the Media Industry,” SapphireNow presentation 2011, http://events.sap.com/sapphirenow/en/session/613 , (viewed Nov 2015).
Loshin, D. (2012). Business intelligence: the savvy manager's guide. Morgan Kaufmann Pub. Mayer R. E. (1996). The Search for Insight: Grappling with Gestalt Psychology’s Unanswered
Questions, in Sternberg RJ and Davidson JE eds. The Nature of Insight, The MIT Press, pp.3-32. McGuire, T. (2013). Making data analytics work: Three key challenges, Insights & Publications,
McKinsey&Company, http://www.mckinsey.com/insights/business_technology/making_data_ analytics_work (viewed Nov 2015)
McIlroy, M. (2008). “OMD Wins Intel’s $300 Million Account,” Adage.com, http://adage.com/article/agency-news/omd-wins-intel-s-300-million-account/126697/ (viewed Nov 2015).
Mingers, J. (2012). "Abduction: The Missing Link between Deduction and Induction. A Comment on Ormerod's 'Rational Inference: Deductive, Inductive and Probabilistic Thinking'." Journal of the Operational Research Society 63: 860-861.
Mohr, L.B. (1982). Explaining organizational behavior, San Francisco: Jossey Bass Murer, S., Bonati, B., and Furrer, F. J. (2011). Managed Evolution: A Strategy for Very Large
Information Systems, Berlin: Springer. Negash, S. (2004). “Business Intelligence,” Communications of the AIS (13), pp. 177-195. Newell, A., and Simon, H. A. (1972). Human problem solving. Englewood Cliffs, NJ: Prentice-Hall.
This article is protected by copyright. All rights reserved.

30
Peteraf, M. A., & Barney, J. B. (2003). Unraveling the resource-based tangle. Managerial and Decision Economics, 24(4), 309-323.
Popovič, A., Hackney, R., Coelho, P. S., & Jaklič, J. (2012). Towards business intelligence systems success: Effects of maturity and culture on analytical decision making. Decision Support Systems, 54(1), 729-739.
Pretz, J.E., Naples, A.J., and Sternberg, R.J. (2003). “Recognizing, Defining, and Representing Problems”, in Davidson JE and Sternberg RJ eds. The Psychology of Problem Solving, Cambridge University Press, 2003, pp.3-30
Purvis, R. L., Sambamurthy, V., and Zmud, R. W. (2001). “The Assimilation of Knowledge Platforms in Organizations: An Empirical Investigation,” Organization Science (12:2), pp.117-135.
Ramamurthy, K. R., Sen, A., & Sinha, A. P. (2008). An empirical investigation of the key determinants of data warehouse adoption. Decision Support Systems, 44(4), 817-841.
Ricardo, D. (1817). On the Principles of Political Economy and Taxation, London: John Murray http://www.econlib.org/library/Ricardo/ricPCover.html
SAP (2014). SAP HANA is a completely re-imagined platform for real-time business, http://www.saphana.com/welcome (viewed August 2014)
Sabherwal, R. and Becerra-Fernandez, I. (2011). Business Intelligence, Practices Technologies and Management, New Jersey:Wiley.
Saraiya, P., North, C., Lam, V., and Duca, K.A. (2006). An Insight-Based Longitudinal Study of Visual Analytics. IEEE Transactions on Visualization and Computer Graphics (12, 6), pp.1511-1522.
Schooler, J. W., Fallshore, M. and Fiore, S. M. (1996). “Epilogue: Putting Insight into Perspective”, in Sternberg RJ and Davidson JE, eds. The Nature of Insight, MIT Press, 1996, pp.559-587.
Seddon, P. B., Calvert, C., and Yang, S. (2010). “A multiproject model of key factors affecting organizational benefits from enterprise systems,” MIS Quarterly (32:2), pp.305-328.
Shah S., Horne A., and Capella J. (2012). “Good data won’t guarantee good decisions”, Harvard Business Review 90(4), 23–25.
Shanks, G. and Bekmamedova, N. (2012a). “Integrating Business Analytics Systems with the Enterprise Environment: an Evolutionary Process Perspective,” Proceedings DSS2012 – 16th IFIP WG8.3 International Conference on Decision Support Systems, Anávissos, Greece, June.
Shanks, G. and Bekmamedova, N. (2012b). Achieving benefits with business analytics systems: An evolutionary process perspective. Journal of Decision Systems, 21(3), 231-244.
Sharma, R. S., Reynolds, P. J., Scheepers, R. S., Seddon, P. B., and Shanks, G. (2010). “Business Analytics and Competitive Advantage: A Review and Research Agenda,” in Bridging the Socio-technical Gap in Decision Support Systems - Challenges for the Next Decade. Amsterdam, Netherlands: IOS Press, pp. 187-198.
Simon, H. A. (1955). A behavioral model of rational choice. The Quarterly Journal of Economics, 69(1), 99-118.
Sternberg R. J. and Davidson J. E. (1996). The Nature of Insight, Cambridge MA: The MIT Press Teece, D. J. 2009. Dynamic Capabilities and Strategic Management, Organizing for Innovation and
Growth, Oxford: Oxford University Press. Teece, D. J., Pisano, G., and Shuen, A. (1997). “Dynamic Capabilities and Strategic Management,”
Strategic Management Journal (18:7), pp. 509-533. Trkman, P., McCormack, K., De Oliveira, M. P. V., & Ladeira, M. B. (2010). The impact of business
analytics on supply chain performance. Decision Support Systems, 49(3), 318-327. Vesset, D., and McDonough, B. (2009). “Improving Organizational Performance Management
Through Pervasive Business Intelligence.” IDC White paper #217286. Walsham, G. 2006. “Doing interpretive research,” European Journal of Information Systems (15:3),
pp. 320–330. Watson, H. J., and Wixom, B. H. (2007). “The Current State of Business Intelligence,” Computer
(40:9), pp. 96-99. Webster, J., and Watson, R. T. (2002). “Analyzing the Past to Prepare for the Future: Writing a
Literature Review,” MIS Quarterly (26:2), pp. xiii-xxiii. Wixom, B. H., and Watson, H. J. (2001). “An empirical investigation of the factors affecting data
warehousing success,” MIS Quarterly (25:1), pp. 17-41. Wolfswinkel, J. F., Furtmueller, E., & Wilderom, C. P. (2013). Using grounded theory as a method for
This article is protected by copyright. All rights reserved.

31
rigorously reviewing literature. European Journal of Information Systems, 22(1), 45-55. Yogev, N., Fink, L., and Even, A. (2012). "How Business Intelligence Creates Value" ECIS 2012
Proceedings. Paper 84. http://aisel.aisnet.org/ecis2012/84 (viewed Nov 2015). Zmud, R. (1995) Editor’s Comments, MIS Quarterly (19:3), pp.xxxvii-xxxix.
This article is protected by copyright. All rights reserved.

32
A. Fig. 1 from Wixom and Watson (2001), MISQ, 11355 Google Scholar (GS) citations in Nov 2015 (= an average of 81 GS cites/year)
B. Our diagrammatic representation of Davenport et al.’s (2010) D-E-L-T-A model, 249 Google Scholar citations in Nov 2015 (= average of 50 GS cites/year).
C. Fig. 1 from Clark et al. (2007), MISQ, 201 Google Scholar citations in Nov 2015 (= average of 25 GS cites/year). “MSS” stands for “management support systems”.
Business value from Business Analytics
A: Analytical People
D: Data Quality
L: Leadership, not just from the top
E: Enterprise-wide Integrated Business-Intelligence Platform
T: Well-chosen targets
This article is protected by copyright. All rights reserved.

33
Figure 1: Three highly cited models of factors leading to business value from analytics
This article is protected by copyright. All rights reserved.

34
Panel A: Process Model (executed over and over again in different parts of the one organization)
Panel B: Variance model
Figure 2: Proposed Business-Analytics Success Model (BASM)
Organizational Benefits from Analytics Use, from the perspective of Senior Management
enable
Insight(s) Decision(s)
Intendedly value-creating actions that change the
organization’sresources
Use Analytic
Resources
Analytical Resources
Analytical People• Analytical executives• Analytical professionals• Analytical employees
Enabling Technology• Integrated Business-
Intelligence Platform• High-quality data
Intendedly value-creating actions that use the
organization’s existingresources
Path 1
Organizational Resources
enable
= results in
Path 3: results in changes in, e.g., learning
Path 2: results in changes in
Path 2
Path 1
Organizational Benefits from System Use, from the perspective of Senior Management, for this project.
Functional fit (FF)
Overcoming organizational inertia (OOI)
Delivering a working system (DWS)
Precondition for achieving benefits
Organizational Benefits from System Use, from the perspective of Senior Management, for this project.
Functional fit (FF)
Overcoming organizational inertia (OOI)
Delivering a working system (DWS)
Precondition for achieving benefits
Enterprise-wide Analytics Orientation
On-going Business-Analytics Improvement Projects
Project “n”
On-going Business-Analytics Improvement Projects
Long-term organizational benefits model Short-term model: Factors driving benefits from each project
Pursuit of the next well-chosen targets guides decisions about which BA-improvement projects are to be undertaken in future.
Analytic Leadership
Extent to which evidence-based decision making is embedded in the “DNA” of the organization
H7
Organizational Benefits from Analytics Use, from the perspective of Senior Management
Well-chosen targets
H5
H6
H8
years
Expected long-term benefits from many projects
H9 Organizational Benefits from Analytics Use, from the perspective of Senior Management, for this project.
Functional fit of BA tools
Overcoming organizational inertia (OOI)
Analytical people
Readily available high-quality data
(post go-live)
H1
H2
H3
H4
This article is protected by copyright. All rights reserved.

35
Figure 3: Our depiction of Pretz et al.’s (2003) model of the human problem-solving process
Figure 4: An example to illustrate human problem solving when using a simple business-analytics tool
1. Recognize or identify the problem (well-defined or ill-defined)
2. Define and represent the problem mentally
3. Develop a solution strategy
4. Organize one’s own knowledge about the problem
5. Allocate mental and physical resources for solving the problem
6. Monitor progress toward the goal
7. Evaluate the solution for accuracy
This article is protected by copyright. All rights reserved.
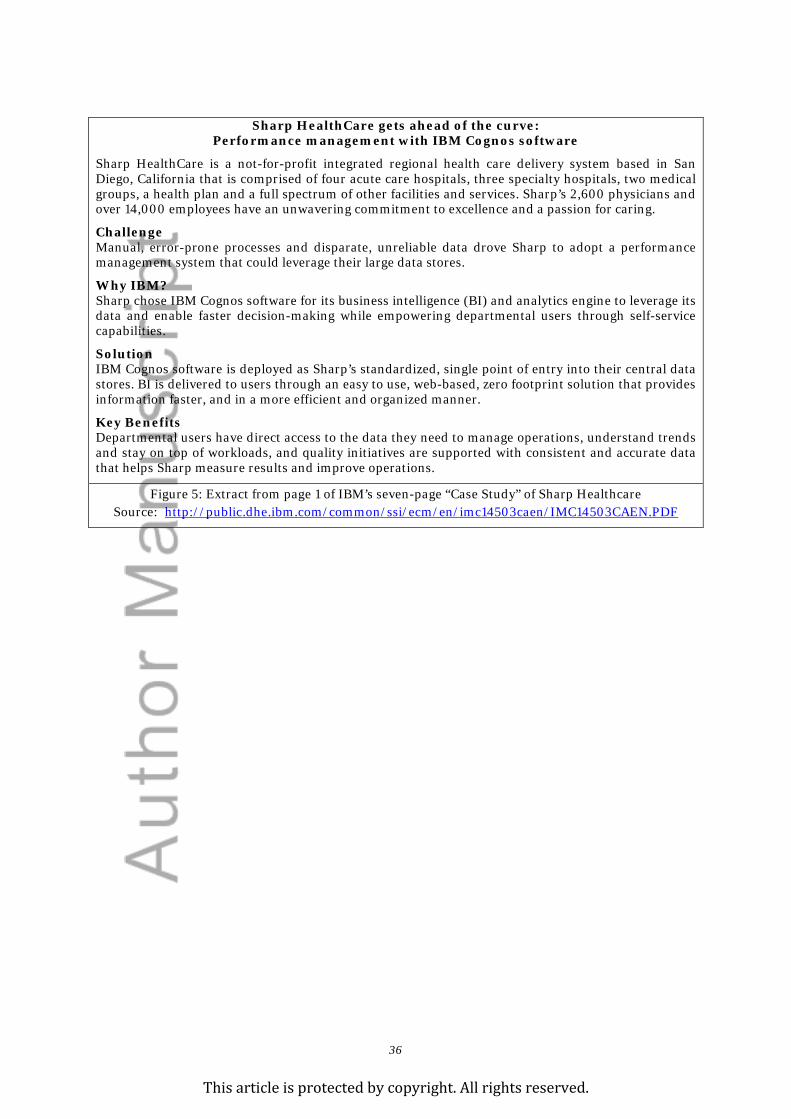
36
Sharp HealthCare gets ahead of the curve: Performance management with IBM Cognos software
Sharp HealthCare is a not-for-profit integrated regional health care delivery system based in San Diego, California that is comprised of four acute care hospitals, three specialty hospitals, two medical groups, a health plan and a full spectrum of other facilities and services. Sharp’s 2,600 physicians and over 14,000 employees have an unwavering commitment to excellence and a passion for caring.
Challenge Manual, error-prone processes and disparate, unreliable data drove Sharp to adopt a performance management system that could leverage their large data stores.
Why IBM? Sharp chose IBM Cognos software for its business intelligence (BI) and analytics engine to leverage its data and enable faster decision-making while empowering departmental users through self-service capabilities.
Solution IBM Cognos software is deployed as Sharp’s standardized, single point of entry into their central data stores. BI is delivered to users through an easy to use, web-based, zero footprint solution that provides information faster, and in a more efficient and organized manner.
Key Benefits Departmental users have direct access to the data they need to manage operations, understand trends and stay on top of workloads, and quality initiatives are supported with consistent and accurate data that helps Sharp measure results and improve operations.
Figure 5: Extract from page 1 of IBM’s seven-page “Case Study” of Sharp Healthcare Source: http://public.dhe.ibm.com/common/ssi/ecm/en/imc14503caen/IMC14503CAEN.PDF
This article is protected by copyright. All rights reserved.

37
Figure 6: Percentages of vendor success stories mentioning the concept in the BASM process model
Figure 7: Percentages of vendor success stories mentioning the concept in the BASM variance model
Organizational Benefits from Analytics Use, from the perspective of Senior Management
enable
Insight(s) Decision(s)
Intendedly value-creating actions that change the
organization’sresources
Use Analytic
Resources
Analytical Resources
Analytical People• Analytical executives• Analytical professionals• Analytical employees
Enabling Technology• Integrated Business-
Intelligence Platform• High-quality data
Intendedly value-creating actions that use the
organization’s existingresources
Path 1
Organizational Resources
enable
= results in
Path 3: results in changes in, e.g., learning
Path 2: results in changes in
Path 2
Path 198%
12%100%
98%
88%
6%
81%89%
100%
100%
Organizational Benefits from System Use, from the perspective of Senior Management, for this project.
Functional fit (FF)
Overcoming organizational inertia (OOI)
Delivering a working system (DWS)
Precondition for achieving benefits
Organizational Benefits from System Use, from the perspective of Senior Management, for this project.
Functional fit (FF)
Overcoming organizational inertia (OOI)
Delivering a working system (DWS)
Precondition for achieving benefits
Enterprise-wide Analytics Orientation
On-going Business-Analytics Improvement Projects
Project “n”
On-going Business-Analytics Improvement Projects
Long-term organizational benefits model Short-term model: Factors driving benefits from each project
Pursuit of the next well-chosen targets guides decisions about which BA-improvement projects are to be undertaken in future.
Analytic Leadership
Extent to which evidence-based decision making is embedded in the “DNA” of the organization
88%
Organizational Benefits from Analytics Use, from the perspective of Senior Management
Well-chosen targets
92%
76%
14%
years
Expected long-term benefits from many projects
44% Organizational Benefits from Analytics Use, from the perspective of Senior Management, for this project.
Functional fit of BA tools
Overcoming organizational inertia (OOI)
Analytical people
Readily available high-quality data
(post go-live)
89%
86%
13%
35%
This article is protected by copyright. All rights reserved.

38
Table 1. Definition of concepts in the BASM Process Model (Figure 2, Panel A)
Concept* Definition
1. Use Analytic Capabilities
Use of business-analytic capabilities by any person or organizational unit to analyze routine and/or non-routine, internal and/or external data to support more evidence-based decision making. Howson (2011) classifies BA usage types as: query, report, analyze, visualize, and alert, and points out that people in different roles use BA in different ways.
2. Insight(s) The gaining of a deep or deeper understanding of something, arising from use of business-analytic (BA) capabilities. Some insights are more valuable, or more profound, than others. In the simplest of cases, insight may arise simply as a result of reading a new report or viewing a dashboard. Sometimes there is a flash of insight: “When the solution is seen, all the parts suddenly seem to fit together” (Schooler et al. 1996, p.579).
3. Decision(s) Decisions flowing from insights flowing from use of BA capabilities.
4. Intendedly value-creating actions that use the organization’s existing capabilities
Actions taken by the organization with a view to creating business value that use its existing organizational capabilities (defined in row 10). Shanks and Bekmamedova (2012a) call this concept Operational use of BA capabilities.
5. Intendedly value-creating actions to change the organization’s capabilities
Actions taken by the organization with a view to creating business value that lead to changes in its organizational capabilities (defined in row 10). The capability to perform such actions, which includes the IT department’s capability to run IT-based projects successfully, is a dynamic capability (Teece et al. 1997; Helfat et al. 2007).
6. Organizational Benefits from Analytics Use
see Table 2, row 20, for the definition of this concept
7. Enabling Technology The hardware, software, data, processes (e.g., extract, transform and load processes), and governance capabilities that make up the organization’s business-intelligence platform(s). (Davenport and Harris, 2007, Ch.8)
8. Analytical People see Table 2, row 18, for the definition of this concept
9. Analytical Resources The organization’s combination of people, technology, and data-analysis processes that enable it to make more evidence-based decisions. These are a very small subset of the organization’s overall resources (row 10). In the empirical analysis reported later, this construct was operationalized as the union of scores for concepts in rows 7 and 8.
10. Organizational Resources
The full set of resources, i.e., people, technology, and processes, owned or controlled by the organization that enable it to provide goods and services (i.e., value) to its customers and other stakeholders. Some of these resources will be the valuable, rare, inimitable, and non-substitutable resources that the resource-based view of the firm (Barney 1991, Barney et al. 2011) argues are the primary source of a firm’s competitive advantage.
* Numbered rows correspond to row numbers in Table 4
This article is protected by copyright. All rights reserved.

39
Table 2. Definition of concepts in the BASM Variance Model (Figure 2, Panel B)
Concept* Definition
11. Analytic Leadership
The extent to which people in any organizational unit take leadership of initiatives or projects to increase use of business analytics for organizational gain (Davenport et al. 2010, Ch.4, pp.57-72).
12. Enterprise-wide Analytics Orientation
The extent to which the organization has adopted an enterprise-wide orientation to the use of business analytics. Such an enterprise-wide view is normally supported by an integrated BI platform that provides “a single, holistic view of the company” (Davenport et al. 2010, p.45) rather than, for example, multiple datamarts.
13. Well-chosen targets
The extent to which targets for new analytics initiatives are selected carefully based on the combination of their business potential and whether the necessary resources, including data, are available (Davenport et al. 2010, Ch.5).
14. Extent to which evidence-based decision making is embedded in the “DNA” of the organization
The extent to which a culture of evidence-based decision making is embedded in the core values and processes of the organization (Davenport and Harris 2007, Ch.2; Davenport et al. 2010, Ch.1, 7, and 8). Kettinger et al. (2011) describe this concept as the firm’s Information Orientation. Howson (2008) and IDC (Vesset and McDonaugh 2009) call it “pervasive BI”. Brynjolfsson calls it a “higher information metabolism” (Hopkins 2010).
15. On-going Business-Analytics improvement projects
A measure of the number and extent of investment in BA-improvement projects. Such projects include both the implementation of new software (that delivers new analytics functionality) and initiatives that apply existing functionality to new areas of decision making. These projects are represented by the series of BA-Improvement Projects depicted on the right of Panel B in Figure 2.
16. Functional fit of BA tools (FF)
The extent to which the functionality provided by the BI platform matches the functionality that the organization needs to access and analyze data effectively and efficiently. Saying that BA toolset has good functional fit is equivalent to saying that the BA toolset helps people in the organization gain useful insights from the organization’s data. This includes providing fast access to information when sought. Although FF is a meaningful concept for the organization overall, in the BASM it is conceptualized as being delivered and measured project by project (Seddon et al. 2010).
17. Readily available high-quality data
The extent to which relevant and accurate data are readily available for analytics use, from sources both within and external to the organization. (Davenport et al. 2010, Ch.2, pp.23-43)
18. Analytical people The extent to which there are people within the organizational unit with an analytic mindset who help drive business value from BA. (Davenport et al. 2010)
19. Overcoming organizational inertia (OOI)
The extent to which members of the organization have been motivated to learn, use, and accept the new system. During initial implementation and subsequent projects, considerable change-management effort, training, and support are needed to overcome organizational inertia. OOI is conceptualized as being measured project by project (Seddon et al. 2010).
20. Organizational Benefits from Analytics Use, from the
An overall measure of senior management’s perception of the benefits from analytics use. Such benefits—which may be assessed either for the use of BA overall, or for individual BA projects—usually revolve around the use of analytics to enable greater visibility into organizational data, resulting in
This article is protected by copyright. All rights reserved.

40
perspective of Senior Management
better, more evidence-based, decision making. In almost all cases, such benefits vary over time, e.g., as depicted in the two graphs in Figure 2. This concept, which is directly analogous to the Organizational Benefits dependent variable in Seddon et al. (2010), is a synonym for Business Value from Business Analytics.
* Numbered rows correspond to row numbers in Table 4 Table 3: Examples of text from the Sharp Healthcare success story that was treated as
providing evidence that the construct was a driver of organizational benefits
Construct Exact copies of the text from the success story1 Organizational Benefits, from the perspective of senior management
Sharp utilized IBM Cognos BI reporting capabilities to dramatically improve the productivity of billers and claim processors by automating its claims management inventory. (p.4)
“I hear consistent feedback from users that they are able to access information to improve productivity.” (DSS Manager, Brown, p.2)
Sharp was named a recipient of the 2007 Malcolm Baldrige National Quality Award. … Sharp’s Rees-Stealy Medical Group has been recognized by Integrated Healthcare Association (IHA) for best overall performance on important health care quality measures, including preventive care and chronic care management, patient satisfaction and use of information technology to support safer care. (p.6, emphasis added)
Analytic Leadership (H5)
“I think we are ahead of the curve in implementing performance management because not many other healthcare organizations have had a data warehouse as long as we’ve had.” (DSS Manager, Brown, p.2)
Enterprise-wide Analytics Orientation (H6)
The data warehouse unites charge, expense, revenue and clinical information—from clinic, medical group, hospital, lab, pharmacy, physician orders, vital signs, allergies, immunizations, operating room, encounters and referral data—into one place to make operational decisions easier and more effective. (p.2)
It took the organization almost two years to make the transition from multiple toolsets to an enterprise standard for reporting. (pp.3-4)
Ongoing projects (H9)
“We capture information on about 17 different quality indicators, and are developing a dashboard and custom report that will let physicians see where they stand against each of these indicators on a monthly basis” (DSS Manager, Brown, p.6)
Sharp is in the process of deploying its new clinical information system to support electronic medical records. (p.7)
Functional fit (H1)
“For the most part, my IT team does not build reports,” she said. “We have done a few that go across multiple medical groups or multiple entities, but for the most part, we build the infrastructure—the data models—and allow our users to just go ahead and access the BI and performance information they need.” (Brown p.4)
In addition, IBM Cognos BI software delivers graphical Excel integration capabilities, which according to Brown, “have been very helpful for convincing die-hard spreadsheet users to switch over!”(p.4)
Ready availability of high-quality data (H2)
“I am now 100 percent confident in the data that we have so that users can count on the reliability of their reports” (DSS Manager, Brown, p.2)
Overcoming Organizational Inertia (H4)
[Brown:] “Change is always hard,” she continued. “And by going from five tools to a single tool we were changing the way that many users did their jobs. We were
This article is protected by copyright. All rights reserved.

41
afraid that users would not respond well to change” (DSS Manager, Brown, p.4)
“Moving over to performance management entails a huge learning curve for any organization,” said Carol Wanke. “Change management is significant, and the support must be there.” (Director, Patient Financial Services, Wanke, p.5)
Success story: http://public.dhe.ibm.com/common/ssi/ecm/en/imc14503caen/IMC14503CAEN.PDF (viewed Aug 2014) reproduced on http://locussolutions.com/wp-content/uploads/2015/03/Case-study-Sharp-Healthcare.pdf (viewed Nov 2015).
1 The words in the right column above are exact quotations from the 8-page success story. Words in quotation marks were in quotation marks in the success story.
This article is protected by copyright. All rights reserved.

42
Table 4: Results from analysis of 100 customer-success stories
Concept from the Business-Analytics Success Model (BASM)# % of stories
mentioning*
Process Model (Panel A, Figure 2):
1. Use of business analytic resources by any organizational unit to analyze routine and/or non-routine, internal and/or external data 98%
2. Insight(s) (arising from use of business analytic resources) 89%
3. Decision(s) (flowing from insights flowing from use of BA resources) 81%
4. BA-driven Competitive actions that use existing organizational resources 88%
5. BA-driven Competitive actions to change organizational resources 6%
6. Organizational Benefits from Analytics Use, from the perspective of Senior Management 98%
7. Enabling technology 100%
8. Analytical people 12%
9. Analytical resources (union of the sets of codes for rows 7 and 8) see row 7
10. Organizational resources (being used in the creation of business value) 100%
Variance Model (Panel B, Figure 2):
11. H5: Analytic leadership (as a long-term driver of organizational benefits) 92%
12. H6: Enterprise-wide Analytics Orientation (as a driver of org. benefits) 76%
13. H7: Well-chosen targets (for new BA initiatives) (as a driver of org. benefits) 88%
14. H8: Extent to which evidence-based decision making is embedded in the “DNA” of the organization (as a driver of org. benefits) 14%
15. H9: On-going BA-improvement projects (as a driver of org. benefits) 44%
16. H1: Functional fit (of the BI tools to meet the needs of users for this project) 89%
17. H2: Readily available high-quality data (as a driver of org. benefits, for this project) 86%
18. H3: Analytical people (as a driver of org. benefits for this project) 13%
19. H4: Overcoming organizational inertia (as a driver of org. benefits for this proj.) 35%
20. Organizational Benefits from Analytics Use see row 6
* Percentages are of the 100 vendors’ customer-success stories analyzed. # Numbered rows correspond to row numbers in Tables 1 and 2.
This article is protected by copyright. All rights reserved.

1
HOW DOES BUSINESS ANALYTICS
CONTRIBUTE TO BUSINESS VALUE?
Suggested running headline: How does analytics contribute business value?
Peter B. Seddon Department of Computing and Information Systems
The University of Melbourne, Victoria, Australia [email protected]
Dora Constantinidis Department of Computing and Information Systems
The University of Melbourne, Victoria, Australia [email protected]
Toomas Tamm Department of Computing and Information Systems
The University of Melbourne, Victoria, Australia [email protected]
Harjot Dod Department of Computing and Information Systems
The University of Melbourne, Victoria, Australia [email protected]
Paper length: 11,600 words
This article is protected by copyright. All rights reserved.

Minerva Access is the Institutional Repository of The University of Melbourne
Author/s:Seddon, PB;Constantinidis, D;Tamm, T;Dod, H
Title:How does business analytics contribute to business value?
Date:2017-05-01
Citation:Seddon, P. B., Constantinidis, D., Tamm, T. & Dod, H. (2017). How does business analyticscontribute to business value?. INFORMATION SYSTEMS JOURNAL, 27 (3), pp.237-269.https://doi.org/10.1111/isj.12101.
Persistent Link:http://hdl.handle.net/11343/291169
Related Documents