How Consumers Manage Textile Waste by Sabine Weber A thesis presented to University of Waterloo in fulfillment of the thesis requirement for degree of Master of Environmental Studies in Environment and Resource Studies Waterloo, Ontario, Canada, 2015 ©Sabine Weber 2015

Welcome message from author
This document is posted to help you gain knowledge. Please leave a comment to let me know what you think about it! Share it to your friends and learn new things together.
Transcript
How Consumers Manage Textile Waste
by
Sabine Weber
A thesis
presented to University of Waterloo
in fulfillment of the
thesis requirement for degree of
Master of Environmental Studies
in
Environment and Resource Studies
Waterloo, Ontario, Canada, 2015
©Sabine Weber 2015

ii
Author’s Declaration
I hereby declare that I am the sole author of this thesis. This is a true copy of the thesis,
Including any required final revisions, as accepted by my examiners.
I understand that my thesis may be made electronically available to the public.

iii
Abstract
Past studies have considered the impact of fashion on consumer textile disposal behaviour, but have
focused mainly on drivers of clothing waste. There is a paucity of studies that have sought to model
consumer attitudes and behaviours regarding fashion interest, shopping frequency, and disposal methods.
The main goal of this thesis was to collect information regarding the largely unexamined topic of textile
waste management in Canada and to link consumer waste disposal behaviour with an individual’s level of
fashion interest. This study conducted an electronic survey to ask 410 people in Ontario with varying
demographic characteristics how they currently manage their textile waste including personal reuse, resell,
swap, take-back, donation and disposal. A 5-point Likert scale was used to ask participants sixteen
questions about their fashion interest and shopping frequency to develop a fashion scale and assign each
participant a fashion index value. Statistical analysis was used to establish whether there is a link between
textile waste behaviour and fashion index. The results indicate that an individual’s fashion index is
dependent on gender and age and that there are significant differences in the way consumers with high
fashion index (fashion consumers) and consumers with low fashion index (non-fashion consumers)
manage their textile waste. While the majority of participants donate and dispose of unwanted clothes,
fashion consumers are more interested in, and more likely to participate in, alternative methods to
removing unwanted textiles. Although fashion and especially fast-fashion consumers acquire the most
garments, and this inevitably leads to more unwanted garments kept for a shorter time period than non-
fashion consumers, fashion consumers were found have a lower disposal rate than non-fashion consumers
(38 percent to 50 percent, respectively). Results also show that while personal reuse and donation are
widely practiced, so too is disposal. Many consumers demonstrated a lack of awareness about alternative
channels, including take-back, reselling and swapping. However, the interest and willingness of fashion
consumers to participate in these channels suggests opportunities to shift textile disposal behaviour so that
the amount of waste going to landfill can be reduced. The results establish the influence of a fashion scale
on consumer textile waste management practices in Ontario, Canada, which can be applied to other
regions as well. Since there is usually a discrepancy between self-reported behaviour and actual behaviour,
these results can only be seen as a tendency, but they nonetheless show that further research is needed
into how alternative channels for textile removal can be fostered as well as the effect that alternative
channels for extending the use of a garment will have on its condition and therefore its final disposal.
KEYWORDS: Textile, Consumer, Behaviour, Disposal, Fashion, Clothing Consumption, Fashion scale, Waste
Management, Sustainability, Recycling, Swapping, Take-Back, Donation, Resell

iv
Acknowledgements
I am very thankful for the opportunity to make a Master’s thesis at the University of Waterloo. My thanks
also goes to Professor Steven B. Young for his invaluable support and Professor Jennifer Lynes for her
practical advice and compassion. A special thanks to Professor Brent Doberstein, for reading so much in so
little time and making it possible to have a defence on such short notice.
I am indebted to my husband, Olaf Weber. Without his advice and encouragement I would have never
thought about writing a Master’s thesis, nor would I have been able to finish. Thanks are also due to our
children Lukas and Johannes, who sometimes suffered from my lack of time, but hopefully they will think it
was worth it. I hope my Master thesis will inspire them to pursue their own passions.
Finally I would like to express my gratitude to everyone that helped me along the way. My friends,
colleagues, participants of my survey, and other people which I met during the last two years and who
were connected to me and my studies. In particular, I would like to thank Pamela D’Ettorre for introducing
me to sustainable fashion, Markus Moos for his feedback on my pilot survey, John Jackson who I was happy
to assist at the waste management course at University of Waterloo, Daniela Siggia from Waste Diversion
for explaining to me the difficulty of textile collections, Leila Nattagh from Goodwill Industries and her
introduction into used clothing processing and Lori Andrews from Waste Diversion Ontario who was
always helpful to look for textile data. Finally, I dedicate this work to Grace Schmidt, my tutor and mentor
in this confusing and wonderful English language, who passed away in February 2015. My profoundest
thanks for all that you’ve inspired in me.
v
TABLE OF CONTENTS
List of Tables ......................................................................................................................................... ix
List of Figures ........................................................................................................................................ xi
1 Introduction ................................................................................................................................... 1
1.1 Problem statement and Research questions ............................................................................ 3
1.2 Key terms ................................................................................................................................ 6
1.3 List of Abbreviations and Acronyms ......................................................................................... 8
1.4 Map of the thesis .................................................................................................................... 8
2 Literature Review ......................................................................................................................... 10
2.1 Landfills ................................................................................................................................ 10
2.1.1 The impact of fibres in landfills ................................................................................................ 11
2.2 Ontario provincial waste management & recycling mandates for textiles ............................... 13
2.2.1 Waste Diversion Act and Waste Reduction Act ....................................................................... 14
2.2.2 The Environmental Protection Act (EPA) ................................................................................. 15
2.3 Data about municipal solid waste .......................................................................................... 17
2.3.1 Putting municipal waste in context with textile waste ............................................................ 19
2.3.2 Examining textile collection and data monitoring in the region of Waterloo ......................... 20
2.4 The purpose of recycling ........................................................................................................ 22
2.4.1 Material flow of garment production ...................................................................................... 23
2.4.2 The function of charities in the textile recycling process ........................................................ 25
2.5 Apparel consumption ............................................................................................................ 26
2.5.1 Increased consumption due to reduced garment prices ......................................................... 27
2.5.2 Increased consumption the difference between clothes, fashion, and “Fast Fashion” .......... 29
2.5.3 Increased consumption due to market segmentation ............................................................ 30

vi
2.6 Reasons why people want to discard their clothes ................................................................. 32
2.6.1 Psychological characteristics of garment ownership ............................................................... 33
2.6.2 How the consumer’s relationship towards environment effects textile disposal ................... 33
2.6.3 Intrinsic factors to the product: Durability and reparability .................................................... 34
2.6.4 How product quality and the purchasing price affect textile disposal .................................... 35
2.6.5 Situational factors extrinsic to the product ............................................................................. 36
2.6.6 How long a garment will be kept before its disposal ............................................................... 36
2.7 Managing unwanted clothing ................................................................................................ 37
2.7.1 Channels for clothing reuse, recycling, and disposal ............................................................... 37
2.7.2 Motivational factors for reuse, recycle, and disposal channels............................................... 39
2.7.3 Waste management strategies behind reuse, recycle, and disposal channels ....................... 41
2.8 Channels that consumers use to manage their unwanted garments ........................................ 42
2.8.1 Reselling used clothing ............................................................................................................. 43
2.8.2 Take-back programs ................................................................................................................. 44
2.8.3 Swapping used clothing ........................................................................................................... 47
2.8.4 Donating used clothing ............................................................................................................ 48
3 Methods ...................................................................................................................................... 53
3.1 Research design .................................................................................................................... 53
3.2 The questionnaire ................................................................................................................. 53
3.2.1 Part I: Demographics ................................................................................................................ 54
3.2.2 Part II: Developing a fashion scale ........................................................................................... 54
3.2.3 Part III: The possibilities to manage unwanted clothing .......................................................... 60
3.3 Sample .................................................................................................................................. 62
3.4 Limitations of this study ........................................................................................................ 63
4 Results ......................................................................................................................................... 65
4.1 Descriptive statistics .............................................................................................................. 65

vii
4.1.1 Demographics: ......................................................................................................................... 65
4.1.2 Shopping frequency ................................................................................................................. 69
4.1.3 Reasons to clean out a closet ................................................................................................... 69
4.1.4 Managing unwanted clothing .................................................................................................. 70
4.1.5 Channels for managing unwanted clothing ............................................................................. 74
4.1.6 Barriers behind reuse, recycle, and disposal channels ............................................................ 79
4.2 Statistical Analysis ................................................................................................................. 81
4.2.1 Developing a fashion scale ....................................................................................................... 81
4.2.1.5 Is the fashion scale ................................................................................................................... 89
4.2.2 Managing unwanted clothing .................................................................................................. 90
4.2.2.5.1 How does gender and age relate to donation of clothing? .................................... 99
5 Discussion .................................................................................................................................. 101
5.1 Managing unwanted clothing in Ontario .............................................................................. 101
5.1.1 Cleaning out a closet: ............................................................................................................. 101
5.1.2 Personal reuse/repurpose: .................................................................................................... 102
5.1.3 Numbers of channels used to manage unwanted textiles: ................................................... 103
5.1.4 Choice of channels: ................................................................................................................ 103
5.1.5 The degree to which reuse, recycle and disposal channels are used: ................................... 104
5.2 Fashion scale index ............................................................................................................. 105
5.3 Channels to manage unwanted clothing .............................................................................. 106
5.3.1 Swapping ................................................................................................................................ 106
5.3.2 Take-back programs ............................................................................................................... 108
5.3.3 Resell ...................................................................................................................................... 110
5.3.4 Donate .................................................................................................................................... 112
5.3.5 Disposal .................................................................................................................................. 113
5.3.6 Overview of channels used by fashion and non-fashion consumers ..................................... 115

viii
5.4 Targeting waste diversion by fashion consumers .................................................................. 115
5.5 The future of donation in Ontario ........................................................................................ 117
5.6 Recommendations .............................................................................................................. 118
6 Conclusions ................................................................................................................................ 122
6.1 Introduction ........................................................................................................................ 122
6.2 Main findings from this research ......................................................................................... 123
6.3 Future areas of research ...................................................................................................... 124
6.4 Final words ......................................................................................................................... 127
References ......................................................................................................................................... 128
Appendix A: Survey Questionnaire ...................................................................................................... 134
Appendix B: Correlation Table of fashion scale .................................................................................... 147
Appendix C: Communalities of fashion interest and Shopping Behaviour ............................................. 149
Appendix D: Total Variance of fashion scale ........................................................................................ 150
Appendix E: Multiple Comparison, fashion scale-age, gender, swapping .............................................. 151
Appendix F: Cross tabulation between Swapping and Income.............................................................. 152
Appendix G: Results of Scheffé Test: Subsets of Groups According to Attitudes Towards Take-Back
Programs ........................................................................................................................................... 153
Appendix H: Cross Tabulation of attitude and Participation in Take-Back programs ............................. 154
Appendix I: Sample responses from participants of Survey .................................................................. 155
ix
LIST OF TABLES
Table 1: The partnerships in Ontario which collected and monitored the most textiles in 2011 (table
compiled by the author from WDO (2012)) ..................................................................................................... 15
Table 2: Waste generation and diversion of the US and Canada (table compiled by the author from United
States Environmental Protection Agency (2014); Statistics Canada (2014b)). ................................................ 18
Table 3: Waste generation per capita and waste diversion rate of the US, Canada, and Germany (table
compiled by the author from United States Environmental Protection Agency (2014); Statistics Canada
(2014b); Europaeische Kommission (2012)). ................................................................................................... 18
Table 4: Textile waste in the region of Waterloo (table compiled by the author from Region of Waterloo
(2013); Council for Textile Recycling (2014); Waste Diversion Ontario (2012)). ............................................. 22
Table 5: Clothing imports and exports penetration (figures in millions of US dollars), (tables compiled by
the author from International Trade Statistics, Section 2 (World Trade Organization, 2009, 2012, 2013)). .. 28
Table 6: Motivational factors behind reuse, recycle and disposal channels (table compiled by the author
from Joung & Park-Poaps (2013)). ................................................................................................................... 39
Table 7: Motivational factors behind the five channels identified for this study (table compiled by the
author from Joung & Park-Poaps (2013); Shim (1995)). .................................................................................. 40
Table 8: Ranking of the textile reuse, recycle and disposal channels from a resource perspective (table
created by the author using data compiled from European Commission Environment (2015)). ................... 42
Table 9: Age and gender distribution of Ontario population and sample in percent (compiled by the author
from Statistics Canada (2011a)) ....................................................................................................................... 67
Table 10: Income distribution of Ontario population and sample in percent (compiled by the author from
Statistics Canada (2014a)) ................................................................................................................................ 68
Table 11: Distribution of types of residential environment of sample in percent .......................................... 68
Table 12: Frequency of the options used to extend the lifecycle of clothing in percent ................................ 71
Table 13: Mean usage and standard deviation of channels for getting rid of clothing in percent ................. 75
Table 14: Garments in varying degrees of use and the planned channels to get rid of them in percent ....... 77
Table 15: Comparison between planned and estimated use of all disposal, reuse, and recycling channels in
percent ............................................................................................................................................................. 78
Table 16: Comparison between how participants handle small and large volumes of clothing in percent.... 79
Table 17: Barriers for reuse, recycle and disposal channels in percent .......................................................... 80
x
Table 18: Mean and standard deviation of each question identifying a person’s fashion interest and
shopping frequency (1 = low, 5 = high) ............................................................................................................ 82
Table 19: Mean of the fashion scale according to age range (1 = low, 5 = high) ............................................. 87
Table 20: Mean of the fashion scale according to income level (1 = low, 5 = high) ........................................ 88
Table 21: Mean of the fashion scale according to type of residential environment (1 = low, 5 = high) ......... 89
Table 22: Mean of the fashion scale according to marital status (1 = low, 5 = high) ...................................... 90
Table 23: Mean of the fashion scale according to involvement in swap events (1 = low, 5 = high) ............... 90
Table 24: Mean of the fashion scale according to attitudes and behaviours towards take-back programs (1 =
low, 5 = high) .................................................................................................................................................... 92
Table 25: Mean of the fashion scale according to attitudes and behaviours towards reselling (1 = low, 5 =
high) ................................................................................................................................................................. 95
Table 26: Mean fashion scale according to attitudes and behaviours towards disposal (1 = low, 5 = high) .. 99
Table 27: Interaction with each channel for fashion and non-fashion consumers ....................................... 115
Table 28: Correlation of all fashion questions (correlation coefficient and significance level, N = 410) ...... 148
Table 29: Principal component analysis: Communalities of the fashion interest and shopping behaviour. 149
Table 30: Total variance of fashion scale ....................................................................................................... 150
Table 31: Multiple Comparison, fashion scale – age, gender, swapping ....................................................... 151
Table 32: Interest in swapping compared with income levels ...................................................................... 152
Table 33: Mean fashion scale for each subset of groups according to categories of attitudes towards take-
back programs (1 = low, 5 = high) .................................................................................................................. 153
Table 34: Attitude towards take-back programs compared with participation ............................................ 154

xi
LIST OF FIGURES
Figure 1: Recycling of textiles according to the Environmental Protection Act (figure created by the author
using data compiled from Service Ontario (2011)). ......................................................................................... 17
Figure 2: Sankey Diagram of garment production (figure created by the author using data compiled from
(Council for Textile Recycling, Section 3 and 4 of Table 1 (2014)). .................................................................. 24
Figure 3: Rogers diffusion of innovations model, modeling percentage of adopters over time (figure from
Rogers (1983, p. 247)) ...................................................................................................................................... 31
Figure 4: Textile Reuse, Recycle, and Disposal Channels including motivational factors and waste
management strategies (figure created by author using data compiled from Joung & Park-Poaps (2013);
Shim (1995); Rivoli (2005)). .............................................................................................................................. 43
Figure 5: Donations to charitable organizations including example cases (figure created by author and
compiled from the following sources: Rivoli (2005)). ...................................................................................... 49
Figure 6: Age and gender distribution of the sample in percent ..................................................................... 66
Figure 7: Categories of shopping frequency in percent ................................................................................... 69
Figure 8: Frequency of reasons to clean out a closet in percent ..................................................................... 70
Figure 9: Comparison between frequencies of options used to extend the clothing lifecycle in percent ...... 72
Figure 10: Reasons for clothing disposal in percent ........................................................................................ 74
Figure 11: Mean usage of channels for getting rid of clothing in percent....................................................... 75
Figure 12: Comparison between planned and estimated use of reuse, recycle, and disposal channels in
percent ............................................................................................................................................................. 78
Figure 13: Scree plot of total variance of fashion scale ................................................................................... 84
Figure 14: Plot of the fashion scale .................................................................................................................. 85
Figure 15: Distribution of fashion scale ........................................................................................................... 86
Figure 16: Mean of the fashion scale according to attitudes and behaviours towards swap events (1 = low, 5
= high) .............................................................................................................................................................. 91
Figure 17: Mean fashion scale according to attitudes and behaviours towards take–back programs (1 = low,
5 = high) ........................................................................................................................................................... 93
Figure 18: Mean fashion scale according to attitudes and behaviours towards resell (1 = low, 5 = high)...... 96
Figure 19: Mean fashion scale according to attitudes and behaviours towards reuse/repurpose (1 = low, 5 =
high) ................................................................................................................................................................. 97

xii
Figure 20: Frequency of personal reuse/repurpose attitude and behaviour divided by gender .................... 98
Figure 21: Mean fashion scale according to attitudes and behaviours towards disposal (1 = low, 5 = high)
....................................................................................................................................................................... 100
Figure 22: Relationship between a consumer’s fashion index and his or her potential textile waste .......... 116

1
1 INTRODUCTION
In Canada, textile waste can come from residential or industrial, commercial and institutional (IC&I) waste,
however collection systems and waste policies differ between residential and IC&I sectors. This thesis
focuses only on the residential sector. In Ontario, both the provincial government and municipalities are
responsible for managing residential waste and recycling programs.
Residential textile waste is mainly clothing and home textiles (towels, curtains, bedding). Both groups
consist of synthetic and natural fibres. Synthetic fibres will not biodegrade and expand the volume of
landfill space and natural fibres which are similar to other organic materials cause aggressive leachate to
the groundwater and contribute to greenhouse gas emissions. However, for the majority of municipal
waste departments, textiles are not considered a problem because textile fibres are generally not toxic and
do not raise extreme problems in landfills in the same way that batteries, tires, or light bulbs may. Nor are
municipalities expecting a lot of textiles in their waste stream, since municipalities have partnered with
charity organizations to collect used clothing. These factors have allowed municipalities to underestimate
two aspects of textile waste: 1) the degree to which local residents are willing to bring to bring their
unwanted clothing to one of the recycling boxes or donation stations (Domina & Koch, 2001; Ha-Brookshire
& Hodges, 2009; Laitala, 2014; Morgan & Birtwistle, 2009; Shim, 1995), and 2) the volume of textiles that
end up in the landfill. The volume of textile waste comes from an increased textile consumption resulting
from cheaper garment prices due to offshore manufacturing and due to an increased demand for textiles
from consumers to use clothes as a mean to differentiate their personality. The value of clothes has shifted
away from a physical need and garment function towards fashion driven by trends and multiple collections
per year.
Whether provinces and municipalities find it unreasonable or unnecessary to consider textiles as an issue
remains unclear, though both do little to address textile waste. According to Laurie Giroux, in a report
commissioned by Canadian Council of Ministers of the Environment, there are no “province or territory-
wide diversion programs for textiles [in Canada]” (Giroux, 2014, p. 33). However, this does not mean it is
not an issue. Indeed, this attitude might change as more waste is diverted and as more municipalities run
out of space in their landfills. In fact, although data about textile waste in Canada is rare and the figures
can only be assumed, it can be estimated that textile waste accounts between 5-10 percent in Canada’s
landfills. This estimation is based on data from the United States Environmental Protection Agency (EPA) in
the US (2013), which reports 5.2 percent of textile waste in US landfills, as well as a waste audit conducted

2
by the Resource Recovery Fund Board (RRFB) in 2012 in Nova Scotia, where textile waste accounted for 10
percent of the waste stream (Jensen, 2012).
In their article “Unexplored Directions in Solid Waste Reduction: Household Textiles and Clothing
Recycling”, Celia Stall-Meadows and Cynthia Goudeau describe textile waste as the “unnecessary solid
waste”(2012), and go on to note that “every ounce of household clothing and textile items can be recycled
in some way” (2012). The problem with textile waste is that despite being 100 percent recyclable (Stall-
Meadows & Goudeau, 2012), textiles often nonetheless end up in landfills. Although this is a Canada-wide
issue, it can only be solved at the Provincial level, because the Provinces are responsible for the waste and
recycling policies. Using US figures provided by the Council for Textile Recycling, which shows that each
person in the US produces 37.2 kg of textile waste per year (2014), it is estimated that Ontario produces an
estimated 500,000 million tonnes of textile waste annually. To account for the indifference of
municipalities and to raise awareness of this topic in Ontario, this thesis addresses the consumer practices
and behaviours that lead to this unnecessary waste. Ontario is experiencing change in provincial policy and
municipal levels, for example as product stewardship programs are developed to address waste
management. The overriding goal of this thesis is to provide empirical data about a largely unexamined
topic of waste management in Canada, and show textile waste is an issue that needs to be addressed.
Textile waste it is not grounded in a specific academic discipline. In environmental departments waste is
often not seen as a resource and receives little attention and research interest. Waste research is mainly
about the technical aspect of landfills or incinerators, and less about consumer waste behaviour. Fashion
design universities are more interested in developing and marketing fashion trends than they are in
defining the waste they produce. As such, little or no research about textile waste exists. In her overview of
clothing disposal studies covering the past thirty years, “Consumers’ Clothing Disposal Behaviour”, Kirsi
Laitala (2014) does not mention a single scholarly publication about textile waste in Canada. Laitala also
mentions that between 1980 and 2000 there were only 15 publications on textile waste worldwide.
Nonetheless, recent years have seen an increased interest in the topic, and Laitala notes that from 2001 to
2013 there were twice as many publications as the previous twenty years (32 publications). Most empirical
work in this area was conducted with surveys samples based on women, especially students (Laitala, 2014).
Furthermore, Laitala notes a need to study “the importance of fashion as a driver for clothing disposal”
(2014, p. 455). Since no research exists that is based on a balanced distribution of genders, ages,
geographic areas and income levels, little has been done to fully explore the relationship between fashion
attitude and a person’s textile disposal behaviour.
3
1.1 Problem statement and Research questions
Since there is such a high amount of unnecessary textile waste in Ontario, and no Ontario-wide textile
recycling program in place, the overall research question for this thesis is:
How can the proportion of end-of-life textiles (i.e. clothing) being disposed of into landfill be
reduced?
In order to answer this question it is necessary to divide this question into more specific sub-questions that
focus specifically on the generators of textile waste.
1. How are Ontario residents currently managing unwanted clothing that they no longer need or use?
2. Do ‘fashion’ consumers and ‘non-fashion’ consumers manage their unwanted clothing differently?
3. What are the internal and external barriers for consumers which lead them to dispose rather than
to reuse, resell, take-back, swap, or donate their unwanted textiles?
How are Ontario residents currently managing unwanted clothing that they no longer need or use?
Although consumers have different options to get rid of their unwanted garments, the majority of
garments go in the solid waste stream and end up in landfill. Research shows that consumers determine
their disposal and recycling channels based on convenience and accessibility; in other words, the proximity
of textile recycling stations and donation depots play a deciding factor in whether garments are recycled,
donated or thrown into the waste stream (Domina & Koch, 2001; Ha-Brookshire & Hodges, 2009; Laitala,
2014; Morgan & Birtwistle, 2009; Shim, 1995).
While consumers in general know that gently used garments should be donated to charities, consumers are
not aware of the value the fibres in each garment hold, nor are they aware that this value extends beyond
whether the garment can be reused or not (Stall-Meadows & Goudeau, 2012). As a result, consumers often
feel they should throw their used clothes into the waste bin because of stains, damage, or signs of wear
and tear (Laitala, 2014), thereby wasting the potential fibre value of the garments.
Recycling programs such as the green bin and blue box are well-established in Ontario, and consumers
know about waste diversion. The study aims to find out if consumers in Ontario divert their textile waste
and if so, what channels they use to manage their unwanted garments.
4
Do ‘fashion’ consumers and ‘non-fashion’ consumers manage their unwanted clothing differently?
Consumers have different wants and needs. The threshold between non-fashion consumers and fashion
consumers is defined by interest in fashion and its acquisition. A fashion consumer wants fashionable
clothing, with a focus on fashion, a non-fashion consumers wants clothing because it is a physical necessity.
Kate Fletcher further emphasizes the distinction as follows: “Fashion and clothing are different concepts
and entities. They contribute to human well –being both functionally and emotionally. Clothing is material
production: fashion is symbolic production” (Fletcher, 2008, p. 119). A non-fashion consumer is therefore
not looking for fashion but for clothing and owns only enough clothing so as to fulfill basic clothing needs.
When consumers start purchasing more clothing than they actually need non-fashion consumers begin to
become fashion consumers. This consumption is driven by the consumers emotional need for new
experiences (Fletcher, 2008). On the other end of the scale are fast fashion consumers, who represent the
peak of fashion consumption and interest and are often addicted to new clothing based on fashion trends.
Fast fashion consumers are highly fashion conscious and adapt faster to fashion trends than other fashion
consumers (Morgan & Birtwistle, 2009) and are identified as consumers who keep their garments only for a
very short time. This is confirmed by Cynthia Goudeau who concluded that: “participants disposed of fast
fashion apparel at a faster rate than non-fast fashion” (V. Goudeau, 2014, p. iv). Fast fashion clothing
retailers cater to fast fashion consumers in particular with cheap, trendy clothes designed for short-term
use—what Bhardwaj and Fairhust describe as “throwaway fashion” (Bhardwaj & Fairhurst, 2010, p. 165).
Presumably then, fast fashion consumers manage their textile waste differently than fashion or non-
fashion consumers, and the studies that have been conducted regarding textile waste tend to focus
attention solely on this first group. For example, while Birtwistle and Moore found that fast fashion
consumers mainly dispose of their unwanted clothing because it was “damaged due to wear and tear, was
personally significant or was of ‘no use’ to other people (e.g. clothing which was especially unfashionable)”
(Birtwistle & Moore, 2007, p. 213). Although it is easy to determine the limits of the scale between non-
fashion consumers and fast fashion consumers, the delineation along the continuum among fashion
consumers is less clearly defined. There is a research gap regarding how and why other fashion consumers
manage their textile waste and what the difference is compared to non-fashion consumers.
5
What are the internal and external barriers for consumers which lead them to dispose rather than to
reuse, resell, take-back, swap, or donate their unwanted textiles?
In terms of managing textile waste, there are many competing possibilities. The unsustainable behaviour is
to throw the unwanted garments into waste; the desired sustainable behaviour is the personal reuse,
reselling, swapping, take back or donation of the garment. Each behaviour can have multiple internal or
external barriers or benefits, and research is needed to identify these. McKenzie-Mohr recommends a
survey in order to identify the barriers or benefits of the behaviour for the different consumer groups
(2013). Though studies have examined the barriers for donation (Daneshvary, Daneshvary, & Schwer, 1998;
Lee, Halter, Johnson, & Ju, 2013), a research gap exists regarding barriers for reuse, take back and
swapping.
Asking these questions will lead to a nuanced and detailed examination of consumer habits and it will show
consumers’ self-reported actions to manage their unwanted clothing. It will further show barriers and
interests in textile disposal methods. This will lead to new information which can be used to develop
strategies to shift the consumer behaviour to reduce the amount of textiles going to landfills.
Research Approach
In order to answer these research questions, an electronic survey was conducted to ask 410 people in
Ontario with varying demographic characteristics how they currently manage their textile waste including
personal reuse, resell, swap, take-back, donation and disposal. Participants were also asked about the
personal barriers which might impede them from participating in more sustainable practices to manage
their unwanted garments. A 5-point Likert scale was used to ask participants sixteen questions about their
fashion interest and shopping frequency to develop a fashion scale and assign each participant a fashion
index value. Statistical analysis was used to establish whether there is a link between textile waste
behaviour and fashion index.
6
1.2 Key terms
This thesis combines the language from different academic fields; hence there is a need to explain key
terms.
Textile and fashion industry: Garment production begins with harvesting or generating fibres. Farms, fibre
associations and corporations work together to bring the fibres to market. Fibres are bought by textile
mills, spun into yarn, and the yarn is woven or knitted into fabric. There are multiple processes involved to
produce, embellish, and improve fabrics. The textile industry is responsible for all activities related to
textile manufacturing and the apparel industry is responsible for the garment production. Hence, apparel
manufacturers buy fabrics and accessories and produce garments. Although the textile and fashion are two
different industries it is common to combine them as textile industry.
Textiles: In the current study, textiles describe consumer clothing and home textiles such as towels, linens,
and drapery. Since this thesis focuses on fibre textiles, it will exclude leather, fur, shoes, bags, carpets and
mattresses.
Textile waste: Textile waste describes unwanted textiles, where the owner has no further use and wants to
get rid of them. Although consumers might want to get rid of their clothing, these garments will be become
textile waste.
Pre-consumer textile waste: Textile waste that is mainly caused during production before the consumer
takes ownership for a textile product is referred to as pre-consumer textile waste. There is only a very small
amount of textile waste produced by the industry because there is hardly any textile production in North
America. This type of waste is only briefly examined in section 2.3.1: Sankey Diagram of Textile production.
Post-consumer textile waste: Textile waste which arises after the use phase is referred to as post-
consumer textile waste. Since textile waste in North America is predominately generated by consumers,
this thesis focuses solely on post-consumer textile waste.
Disposal: Methods of waste disposal in Canada are defined as landfills and incineration; disposal does not
include recycling or composting. However, in colloquial language and in many academic papers, the word
dispose refers to any option to get rid of unwanted clothing, including donations which lead to reuse and
recycling. For example, Jacoby, et al. describes ‘temporary disposal’ as loaning and renting garments
(Jacoby, et al., 1977). This thesis, in keeping with a Canadian waste management perspective, does not
7
include the temporal as an aspect in disposal, and considers garments disposed of only when they finally
enter the waste stream.
Discard: The word “discard” mainly describes impulsive disposal and refers exclusively to the act of
throwing unwanted clothing into the waste.
Consumer management of textile waste: Waste management is mainly used by municipalities to refer to
all the possibilities a municipality has to deal with waste, including both recycling and waste disposal. This
thesis borrows this concept of waste management and uses the word “manage” to focus on how
consumers deal with their textile waste, such as reuse, resell, take back, swap, donate, or disposal.
Reuse, recycle and disposal channels: These categories refer to more specific methods of removing
unwanted textiles, including reselling as a reuse channel, and take-back, swapping and donating as a
recycle channel. The personal reuse or repurpose of a garment is not considered in this thesis as a channel
for reuse, recycle and disposal.
Fast fashion: clothing designed to be cheap, trendy and disposable. A style phase is not prompted by
seasons like spring and fall, but by product turnover every two weeks. Typically offered by large-scale
specialist fashion chains like Zara, H&M and Forever 21, fast fashion can be purchased by any consumer
group, but is predominantly purchased by fast fashion consumers.
Fast fashion consumers: typically buy affordable and trendy clothes which they will wear only a few times.
This group gets bored easily by their clothes, and seeks new clothes to replace the old ones. They are
excited by new trends, new materials and new styles, and enjoy the social aspect of fashion consumption,
including browsing for new clothes.
Fashion scale: is a continuum that measures a person’s fashion interest and shopping frequency. The low
end of the scale refers to non-fashion consumers, the high end of the scale refers to fast-fashion
consumers.
Fashion index: a value that corresponds to an individual’s position on the fashion scale.

8
1.3 List of Abbreviations and Acronyms
Waste Diversion Ontario (WDO),
Waste Diversion Act (WDA),
Waste Reduction Act (WRA),
Environmental Protection Act (EPA),
Municipal Solid Waste (MSW),
Council for Textile Recycling (CTR),
Secondary Materials and Recycled Textiles Association (SMART),
World Trade Organization (WTO),
Used Clothing Industry (UCI),
Principal Component Analysis (PCA),
An analysis of variance (ANOVA),
Survey Sample International (SSI)
1.4 Map of the thesis
This thesis is intended to determine why so many textiles end up in landfills without being recycled. Before
approaching the question directly, Section 2 (Literature Review) describes the state of landfill operations in
Ontario, and considers the impact of textile fibres in these landfills. The literature review then examines
the laws and regulations the province has in place to deal with textile waste, and the role of municipalities
in carrying out these provincially-mandated regulations, since these regulations and their implementation
will have a direct impact on the disposal and recycling methods available to consumers. Next, the focus of
the literature review turns to the consumer and discusses the relationship between textile consumption
and textile waste. The level of clothing consumption in Canada is higher than ever, and this consumption
has a direct impact on the volume of textile waste that is generated. Therefore, the reasons underlying this

9
increased textile consumption are examined, especially given their role in determining the motivations
behind why consumers get rid of their clothes, which the thesis then examines. The literature review
concludes by describing the opportunities available to consumers for managing their unwanted clothes.
Section 3 presents an overview of the methodology behind the creation of the questionnaire, from which
the results are analyzed using descriptive statistics. The questionnaire was developed by researching the
available materials and conducting interviews with private textile collectors, members of the Recycling
Council and Waste Diversion Ontario, as well as research trips to landfills and charity organizations. Current
gaps in the research identified during the course of this investigation served as inspiration for aspects of
the questionnaire. A questionnaire was favoured over other methods, such as a field study or focus groups,
since it provided a broader, province-wide perspective on the topic, including all demographics. Section 4
then provides a summary of the main results from the descriptive statistics and statistical analysis while
Section 5 - the discussion section - provides the key findings and discussion points for each possibility to
manage unwanted garments, but also about also the main findings of the fashion scale. Recommendations
are provided for each stakeholder to help shift consumer textile disposal behaviour towards more
sustainable options. The conclusions are listed in Section 6. The conclusion discusses the contributions of
this thesis to the issue of textile waste management in Ontario and lists the main takeaway points of this
study. Finally, directions for future research are suggested.
10
2 LITERATURE REVIEW
The literature review will incorporate knowledge about landfills, textile recycling, waste regulations and
textile disposal data to provide a description of the current textile waste situation in Ontario and the
impact of textile fibres in landfills. Next, the reasons for textile waste are examined, focusing specifically on
consumer disposal habits, including the reasons and impediments consumers choose each option to
manage unwanted garments.
2.1 Landfills
Along with being the most populous province in Canada, encompassing nearly 40 percent of Canada’s total
population, approximately 13,500,000 people (Statistics Canada, 2013), Ontario also has the highest
amount of residential waste with 9.8 million tonnes in 2010 (Giroux, 2014). To manage this waste, the
Province of Ontario operates 850 small and 32 large landfills sites (only a few accept hazardous or
industrial, commercial and institutional waste) (Service Ontario, 2014), and landfill operations have
increased by 17 percent since 1990 (Environment Canada, 2012). The larger task is the search for new sites,
as many of the remaining sites will reach capacity in the next few years. In fact, 1,525 small landfills are
already closed (Service Ontario, 2014) and require maintenance. Many citizens refuse to live close to a
landfill site and are against new developments in their neighbourhood; a “not in my backyard” mentality
(Tammemagi, 1999). Tammemagi describes the landfill situation as follows: “Good agricultural land [in
Ontario] is scarce, and much of it is close to major cities, placing it in direct competition with landfills,
which are also close to the municipalities they serve” (Tammemagi, 1999 p.6). As a result, siting processes
have become long and difficult and many municipalities try to avoid this process.
Not only do landfills occupy valuable agricultural and residential space, they also contribute to greenhouse
gas emissions. Canada’s nationwide 2010 Emission Breakdown Report examined which economic sectors
contributed the most to Canada’s total greenhouse gas emissions (and therefore to climate change) and
found that the “Waste & Other” sector contributed seven percent. Only nine percent of this seven percent
was related to “other”, leaving 91 percent related to “waste”. In other words, roughly 6.4 percent of all
greenhouse gas emissions in Canada come from landfills.
11
In order to reduce greenhouse gas emissions Canada has implemented a policy to monitor soil gases and
to installed collection systems (Tammemagi, 1999). The National Inventory Report mentions that “[t]he
number of landfill sites with LFG capture systems is rapidly rising in Canada, with 68 such systems in
operation in 2010 (about a 45 percent increase since 2005)”(Environment Canada, 2012, p. 11). The
National Inventory Report also outlines an 81 percent increase in gases captured from landfills since 1990.
Of the roughly 349 kg of CH₄ collected in 2010, the report notes that “51 percent of the LFG [landfill gases]
was utilized in energy applications and the rest was flared” (Environment Canada, 2012, p. 11). While
efforts are underway to minimize the impact of methane release, the escape of leachate due to cracked
liners and covers remains problematic (Tammemagi, 1999). Since the decomposition of biodegradable
materials produces acid leachate, most municipalities in Ontario have set up green bin programs to divert
biodegradable material from landfills.
Although Canada lacks data regarding the volume of textile waste in its landfills, textiles represent 5.2
percent of the total municipal solid waste stream in the US (see section 2.3.1 "Putting municipal waste in
context with textile waste”). Since only about eight percent of Canada’s municipal waste is incinerated
(Gilbert, 1998), textile waste mainly goes into landfills. In contrast, this situation is the opposite in the
European Union (EU), which in 2015 banned textiles from landfills in EU countries.
2.1.1 The impact of fibres in landfills
Textiles have different effects on landfills depending on the fibres and their treatment. Two fibre groups
exist:
1. Natural fibres, which are based on natural polymers and are divided into vegetable fibres (from
cellulose), and animal fibres (from protein) (Eberle et al., 2004).
2. Man-made fibres, which are artificially formed through spinning and are based on cellulose
polymers (called cellulosic fibres) or petroleum polymers (called synthetic fibres) (Eberle, et al.,
2004).
Fibres based on natural cellulose (such as cotton, flax or hemp) or protein (such as wool and silk) and
artificial cellulosic fibers (such as Viscose, known as Rayon in the U.S.A., Modal, or Lyocell, known as Tencel
in the U.S.A,) will biodegrade (Eberle, et al., 2004; European Man-made Fibres Association CIRFS).
According to Li, Frey, and Browning, cotton significantly biodegrades in a compost environment. The
biodegrading rate depends on the finishing treatments. Finishing treatments like bleaching, dyeing,

12
printing, surface modification, and modification can enhance or slow down the biodegradable process
(Eberle, et al., 2004; Li, Frey, & Browning, 2010). Because biodegradable materials produce acid leachate,
methane, nitrogen gases, and toxic hydrogen sulfide in landfills (Tammemagi, 1999), textiles made of
natural and cellulosic man-made fibres should be discarded in composting facilities as part of a green bin
program. This method would also have a huge potential to reduce waste.
Synthetic fibers will not biodegrade. Tests from Li, Frey, and Browning have shown polyester fabrics may
show slight initial signs of degradation, but will nonetheless remain intact in a composting environment (Li,
Frey, & Browning, 2010). Therefore, as plastic, textiles made of synthetic fabrics like polyester or nylon will
need space in landfills. In order to preserve landfill capacities, it would be desirable to keep synthetics out
of the landfills. Therefore the MSW mantra is “diversion” – which is possible through recycling or
combustion. Garments made of synthetic fibres could be included as part of a blue bin program, to be
collected, melted and re-spun into new fibres, or burned in an incinerator for energy.
The efficacy of any recycling program will be complicated by the composition of modern day garments.
While it would be simple to sort textiles according to their fibres in a recycling program as either organic or
synthetic, the reality is more difficult because many fabrics today are made of a blend of natural and
synthetic fibres. The benefits of fibre blends is that they improve performance in use, clothing comfort,
aftercare, the look of the fabric and production costs (Eberle et al., 2004). Fabrics are also blended to
combine the benefits of each fibre. Organic fibres like cotton are commonly mixed with synthetic fibres,
such as polyester. For example, socks are often made of 80 percent cotton and 20 percent polyester to
combine the comfort of cotton with the strength of polyester. Fabric blends have become extremely
popular and very common. Textiles made of fibre blends can be produced either in the yarn stage, when
different fibres are spun into one yarn, or in the fabric stage when fabrics are woven or knitted with
different yarn types (Eberle, et al., 2004). The numerous possibilities for fabric blends complicate research
regarding the recycling of blended textiles. It is unclear to what extent, if any, fabric blends biodegrade in
landfills. It is likely that only the organic portion degrades under reasonable timeframe and the synthetic
part will not, but more research is necessary.
Not only are garments often made of different fabrics (which can be made of different fibres), they are
often made with different accessories, such as buttons or zippers, which are made of different materials.
All these new materials influence the ability of the garment to biodegrade or the possibility to recycle the
product. While it is possible to indicate the impact of textiles (fabrics) in landfills, each garment of each
13
production model1 must be assessed individually. Currently, there is no information on the sewing label of
the garment that advises a consumer if a garment is biodegradable or recyclable. Therefore, consumers
cannot know what would be the best practice to discard this textile. However, because of the lack of
infrastructure for textile recycling, even if consumers know the best practice, they cannot practice it. The
following example explains the situation.
Some companies in the fashion industry, realizing the huge number of garments in the waste stream, have
begun designing garments which are easy to recycle. Easy to recycle in this case means garments are made
of biodegradable material, and they usually come with detachable accessories. For example, the company
Freitag in Switzerland has just developed a product line of “100 Percent Compostable Clothing Made From
Plants” (Zimmer, 2014). However, this pioneering effort only addresses part of the problem. As it stands,
biodegradable clothing cannot be discarded of as intended by its manufacturers in a green bin program
because municipalities have no infrastructure to control the disposal of garments. At present, the
consumers gain no direct advantage to buying biodegradable clothing except the satisfaction of having
done so.
2.2 Ontario provincial waste management & recycling mandates for textiles
There is an absence of data and information about post-consumer textile waste in Ontario. This may be due
to the fact that municipalities which are responsible for collecting textile waste rarely collect data about it.
Institutions like Waste Diversion Ontario (WDO) do not monitor textile waste in any significant detail.
Without monitoring, there is limited data (if any) available about textile waste in Ontario, or even Canada.
Despite municipalities setting up collection systems designed to divert textiles from landfills, there remains
a high volume of textile waste in Ontario going directly into landfills without being reused or recycled.
Though textile waste is increasing throughout Canada, the issue can be properly addressed only at the
provincial level. The Federal government is responsible for hazardous (paints, solvents, pesticides etc.) and
1 Production model refers to the specific style of a given garment. For example, a producer might make 100,000 units of one style of shirt, and 100,000 of another style, resulting in two production models.

14
radioactive waste, and for the international and interprovincial transportation of toxic substances. The
provincial governments manage the residential waste and recycling services, which are carried out by the
local municipalities. Hence, each municipality in Ontario develops its own waste management program
(Meek, 2012; Recycling Council of Ontario, 2014). To understand why so little textile waste is collected, it is
necessary to examine the province of Ontario’s waste management regulations. Two acts mainly influence
textile waste: the Waste Diversion Act (WDA), which is proposed to be replaced by the Waste Reduction
Act (WRA), and the Regulations in the Environmental Protection Act (EPA).
2.2.1 Waste Diversion Act and Waste Reduction Act
The Ontario Ministry of Environment operates under the WDA. The WDA created the non- governmental
organization WDO to monitor waste and to develop recycling programs in cooperation with industry
funding organizations such as Stewardship Ontario (Service Ontario, 2002). Although the WDO is mandated
to enhance waste diversion programs2, a lack of resources and interest from the municipalities prevents
the WDO from including textiles as part of its diversion programs. The WDO tries to monitor the textile
waste volumes, but can only do so by making a Data Call to municipalities. However, the choice lies with
the municipality to respond. A Data Call in 2012 about “other recyclables” (materials such as textiles, bulky
goods, scrap metal, drywall, wood, or brick & concrete) highlights both the collection and monitoring issues
faced by the WDO. Out of 233 waste-management partnerships3 (which comprised 444 municipalities)
asked to provide data about their “other recyclables,” only eighteen partnerships in Ontario responded
with their figures regarding textile waste. Municipalities collect textiles through various means other than
through blue box curbside programs, such as through charities, schools, or with an environment event day.
More municipalities may have collected, but they did not monitor their textile waste; the low figure
nonetheless demonstrates that partnerships do not consider textile waste collection and monitoring to be
an issue. Indeed, according to the WDO, all partnerships in Ontario collected 1,676 tonnes of textiles while
the total amount of “Other” recyclable collected material (without textiles) was 110,606 tonnes4 .
Therefore collected textiles account for 1.5 percent of the “Other Recyclables” collected. The following
2 Diversion programs prevent the disposal of recyclable products from the waste stream. 3 A partnership might be a few cities or municipalities that have partnered up in terms of waste management. 4 The Other recyclables consists of: bulky goods, scrap metal, drywall, wood, brick & concrete and other C&D recyclables
15
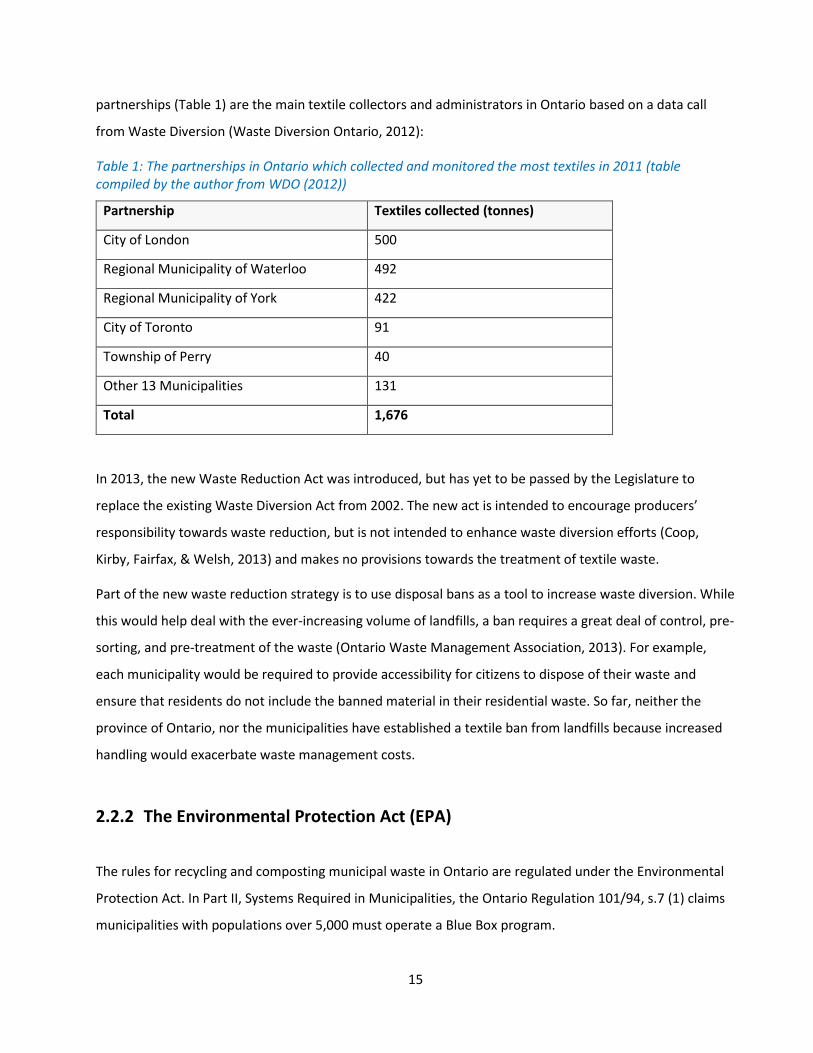
partnerships (Table 1) are the main textile collectors and administrators in Ontario based on a data call
from Waste Diversion (Waste Diversion Ontario, 2012):
Table 1: The partnerships in Ontario which collected and monitored the most textiles in 2011 (table compiled by the author from WDO (2012))
Partnership Textiles collected (tonnes)
City of London 500
Regional Municipality of Waterloo 492
Regional Municipality of York 422
City of Toronto 91
Township of Perry 40
Other 13 Municipalities 131
Total 1,676
In 2013, the new Waste Reduction Act was introduced, but has yet to be passed by the Legislature to
replace the existing Waste Diversion Act from 2002. The new act is intended to encourage producers’
responsibility towards waste reduction, but is not intended to enhance waste diversion efforts (Coop,
Kirby, Fairfax, & Welsh, 2013) and makes no provisions towards the treatment of textile waste.
Part of the new waste reduction strategy is to use disposal bans as a tool to increase waste diversion. While
this would help deal with the ever-increasing volume of landfills, a ban requires a great deal of control, pre-
sorting, and pre-treatment of the waste (Ontario Waste Management Association, 2013). For example,
each municipality would be required to provide accessibility for citizens to dispose of their waste and
ensure that residents do not include the banned material in their residential waste. So far, neither the
province of Ontario, nor the municipalities have established a textile ban from landfills because increased
handling would exacerbate waste management costs.
2.2.2 The Environmental Protection Act (EPA)
The rules for recycling and composting municipal waste in Ontario are regulated under the Environmental
Protection Act. In Part II, Systems Required in Municipalities, the Ontario Regulation 101/94, s.7 (1) claims
municipalities with populations over 5,000 must operate a Blue Box program.
16
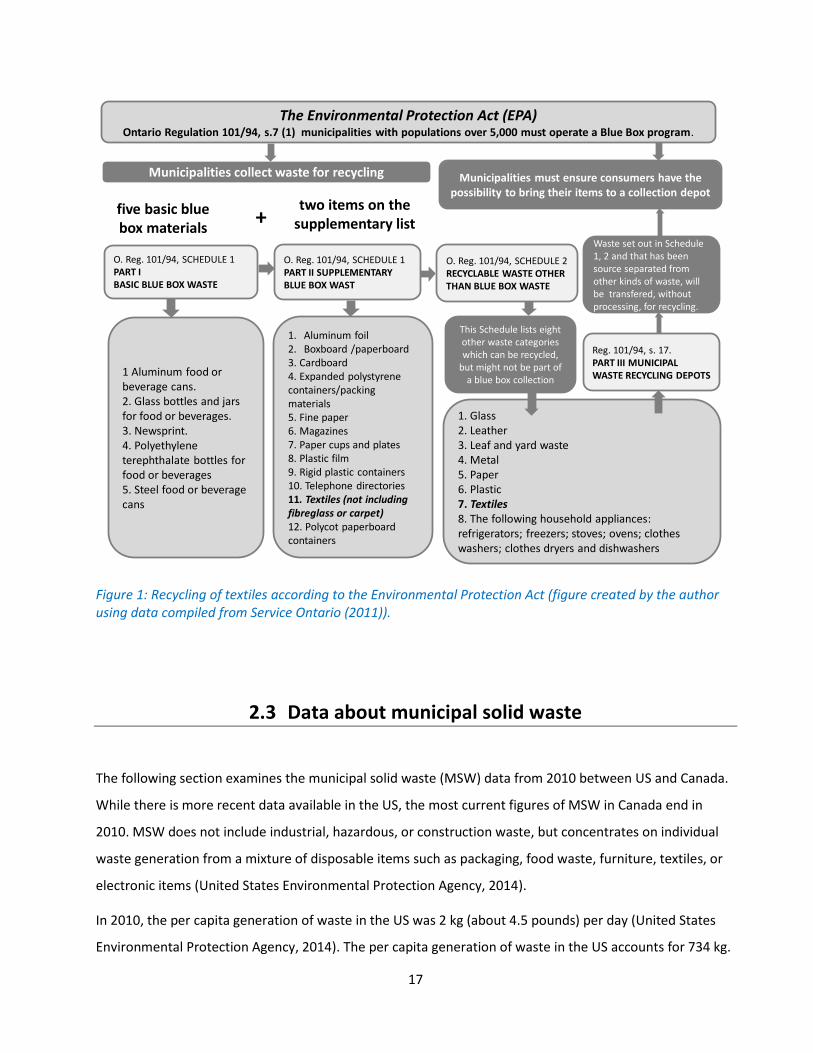
Next to the five basic blue box materials (aluminum food or beverage cans, glass bottles and jars,
newsprint, polyethylene terephthalate bottles for food or beverages, and steel food or beverage cans
(Service Ontario, 2011)) which municipalities have to collect, they have the option under the Ontario
Regulation 101/94, s.7 (4) to decide which two items on the supplementary list they want to add. The
following articles are listed as supplementary: aluminum foil, box and paperboard, cardboard, polystyrene
food or beverage containers, fine paper, magazines, paper cups and plates, plastic film being, rigid plastic
containers being, telephone directories, textiles, and polycot paperboard containers (Service Ontario,
2011). Although textiles are listed as an option, most municipalities choose other items because they can
achieve higher revenue with them. For example: aluminum foil, cardboard, fine paper, or magazines.
Items not collected as part of a blue box program fall automatically under the Ontario Regulation 101/94,
Sched. 2: “Recyclable waste other than blue box waste”. This Schedule lists eight other waste categories
which can be recycled, but might not be part of a blue box collection program because of the associated
cost and effort of collection. Textiles compete for selection among other common recyclable items like:
household appliances, plastic, paper, metal, leaf and yard waste, leather, or glass. When municipalities
decide to not collect a specific category, there is also less effort to monitor and record data about these
categories.
Waste listed in schedule 2 is further described in the Ontario Regulations 101/94, under Part III, Municipal
Waste Recycling Depots s. 17. This regulation describes waste which is separated from other kinds of waste
and which will be transferred with or without processing for recycling. According to the regulations 101/94,
s.17, municipalities must ensure consumers have the possibility to bring their items to a collection depot,
but due to the associated costs, municipalities have no interest in further processing or recycling them.
One reason why textiles often end up in this waste category is the fact that textiles are easy to transport,
hence it is reasonable for citizens to bring their textile waste to a collection depot. Therefore, many
municipalities have partnered up with charities or semi-private charities, which become responsible for the
textile collection and the collection depots. As an allowance for the financial expenditures, charities can
keep the collected material. Over the years, charities have built up a network for used clothing and are
usually able to generate revenue by selling the textiles which is usually invested in their mission and in new
jobs in the community (see section 2.4.2. “The function of charities in the textile recycling process”). Figure
1 outlines the Ontario Regulation 101/94 and lists the products given in each Schedule.
17
Figure 1: Recycling of textiles according to the Environmental Protection Act (figure created by the author using data compiled from Service Ontario (2011)).
2.3 Data about municipal solid waste
The following section examines the municipal solid waste (MSW) data from 2010 between US and Canada.
While there is more recent data available in the US, the most current figures of MSW in Canada end in
2010. MSW does not include industrial, hazardous, or construction waste, but concentrates on individual
waste generation from a mixture of disposable items such as packaging, food waste, furniture, textiles, or
electronic items (United States Environmental Protection Agency, 2014).
In 2010, the per capita generation of waste in the US was 2 kg (about 4.5 pounds) per day (United States
Environmental Protection Agency, 2014). The per capita generation of waste in the US accounts for 734 kg.
1 Aluminum food or beverage cans. 2. Glass bottles and jars for food or beverages.3. Newsprint.4. Polyethylene terephthalate bottles for food or beverages 5. Steel food or beverage cans
1. Aluminum foil 2. Boxboard /paperboard3. Cardboard 4. Expanded polystyrene containers/packing materials5. Fine paper6. Magazines7. Paper cups and plates8. Plastic film9. Rigid plastic containers 10. Telephone directories11. Textiles (not including fibreglass or carpet)12. Polycot paperboardcontainers
1. Glass2. Leather3. Leaf and yard waste4. Metal5. Paper 6. Plastic7. Textiles8. The following household appliances: refrigerators; freezers; stoves; ovens; clothes washers; clothes dryers and dishwashers
O. Reg. 101/94, SCHEDULE 1PART IBASIC BLUE BOX WASTE
O. Reg. 101/94, SCHEDULE 1PART II SUPPLEMENTARY BLUE BOX WAST
O. Reg. 101/94, SCHEDULE 2RECYCLABLE WASTE OTHER THAN BLUE BOX WASTE
five basic blue box materials
two items on the supplementary list
The Environmental Protection Act (EPA)Ontario Regulation 101/94, s.7 (1) municipalities with populations over 5,000 must operate a Blue Box program.
Reg. 101/94, s. 17.PART III MUNICIPAL WASTE RECYCLING DEPOTS
+
Municipalities collect waste for recycling Municipalities must ensure consumers have the possibility to bring their items to a collection depot
This Schedule lists eight other waste categories which can be recycled,
but might not be part of a blue box collection
Waste set out in Schedule 1, 2 and that has been source separated from other kinds of waste, will be transfered, without processing, for recycling.

18
The Canadian waste disposal per capita in 2010 was 725 kg (Statistics Canada, 2014b). This has an
equivalent of 2 kg per day. Further, in 2012, the recycling rate in the US was 34 percent (United States
Environmental Protection Agency, 2014). Therefore, Americans diverted 229 kg material per capita. Each
Canadian diverted 235 kg, which accounts for a recycling rate of 32 percent. Table 2 lists the numbers of
the waste generation and diversion of Canada and the US.
Table 2: Waste generation and diversion of the US and Canada (table compiled by the author from United States Environmental Protection Agency (2014); Statistics Canada (2014b)).
2010 US Canada
Per Capita generation of waste per day 2 kg 2 kg
Per Capita generation of waste per year (365 days) 734 kg 725 kg
Waste Diversion rate
( A combined recycling and composting rate)
34 % 32 %
Diverted material per capita 229 kg 235 kg
Although, the numbers for MSW in the US and Canada are not exactly the same, the figures are similar
enough to be comparable. While a diversion rate difference of 2% might seem like a big difference, the
variation between North American and European countries is much higher. For example Germany, whose
MSW figures (Table 3) roughly correlate with that of other developed nations in Europe, had in 2010 a per
capita waste generation of 583 kg, a recycling rate of 45 percent, a composting rate of 17 percent and a
combined composting recycling rate of 62 percent in 2010 (Europaeische Kommission, 2012).
Table 3: Waste generation per capita and waste diversion rate of the US, Canada, and Germany (table compiled by the author from United States Environmental Protection Agency (2014); Statistics Canada (2014b); Europaeische Kommission (2012)).
2010 US Canada Germany
Per Capita generation of waste
per year (365 days)
734 kg 725 kg 583 kg
Waste Diversion rate
(A combined recycling and composting rate)
34 % 32 % 62%
Comparing the data from the waste management in Canada with that of Germany, the close similarity of
MSW between US and Canada becomes more apparent.

19
There are no data available about textile waste in Canada5, but the US monitors and publishes its textile
waste data. Since Municipal Solid Waste (MSW) generation and the recycling and composting rate in
Canada are very similar to the US, the data for US textile waste can substitute for the currently
unmonitored figures of textile waste in Canada. For the remainder of this thesis, textile waste data will be
based on US figures.
2.3.1 Putting municipal waste in context with textile waste
Not only do Canada and the US have similar MSW figures, both countries also share similar textile waste
collection programs. In Canada and in the US, textile waste is usually not included as part of recycling
collections. Instead, most municipalities cooperate with charity organizations to set up semi-private textile
collection systems. Although these partnerships between charity organizations and municipalities seem to
be promising, the current textile recycling and reuse rate in the US is 15 percent. This figure might be even
lower, however, since it does not account for the amount of reused second hand clothing that might
eventually end up in the waste stream. Comparing this 15 percent against the recovery rates of other
recyclable materials emphasizes the low figures and the inefficiency of these partnerships. For example, in
2012, Americans recovered: 96 percent of lead-acid batteries, 71 percent of steel cans, 70 percent of
newspaper/mechanical papers, 55 percent of aluminium beer and soda cans, 45 percent of tires and 34
percent of glass containers (United States Environmental Protection Agency, 2014). These numbers show
Americans can achieve high recovery rates. It thus becomes necessary to question why these charity textile
collection systems have failed and only achieve 15 percent recovery rate. There is no simple answer. It
might be the convenience charities provide to municipalities for collecting the unwanted textiles, or the
municipalities saving money because they can avoid setting up additional collection programs, or the long-
standing relationships. These reasons are only speculation, but it is clear that most textiles are going
directly into waste rather than being recycled or reused and that the current textile collection system is not
working as efficiently as it should (see section 2.4.1 “Material flow of garment production”).
However, these collection programs can only divert material they are given, so the focus must turn to the
consumer. Most people throw their textiles away into the garbage bin. From there, the waste enters the
municipalities’ solid waste stream, to the extent that in the US 85 percent of all textiles end up in landfills
5 Except the textile waste data from a waste audit of six landfills in Nova Scotia conducted by the Resource Recovery Fund Board (RRFB) in 2012 (see section 1 “Introduction”).

20
(Council for Textile Recycling, 2014). In fact, each American resident produces on average about 37.2 kg (82
lbs) of textile waste per year (Council for Textile Recycling, 2014). Moreover, because of the constant
increase of textile consumption, the amount of textile waste is also growing (Council for Textile Recycling,
2014).
The huge volume of textiles in landfills has already been recognized in the US to an extent from some
municipalities such as San Francisco, and from organizations like the Zero Waste Alliance and the Council
for Textile Recycling (CTR). The CTR was founded in 1992 by the Secondary Materials and Recycled Textiles
Association (SMART) when they realized a need for an organization whose only determination was to
promote textile recycling (Secondary Materials and Recycled Textiles, 2015). The CTR became an
independent, non-profit organization dedicated to increasing awareness about textile waste among the
general public and to keep post-consumer textile waste out of the solid waste stream. Its goal is to achieve
zero textiles going to landfills by 2037, but the CTR is not specifying how this goal will be achieved
(Secondary Materials and Recycled Textiles, 2015) . Although textile waste has been recognized as an issue
in the US, little awareness about this problem exists in Canada.
2.3.2 Examining textile collection and data monitoring in the region of Waterloo
The following example of the Region of Waterloo shows how the textile collection system, based on
voluntary participation, works and explains why a donation system is not equivalent to a professional,
mandatory, recycling program.
The greater Region of Waterloo (Cambridge, Kitchener, North Dumfries, Waterloo, Wellesley, Wilmot, and
Woolwich) is known for its progressive waste management (Kitchener was the town where the first blue
box recycling system was implemented in the mid-1980s). In terms of textile waste, the region has
partnered with Goodwill Industry to ensure consumers have the possibility of bringing their garments to a
collection depot or a drop-off location. On the Region’s website, textile waste is located under “other
recycling programs,” and its citizens are referred to the Goodwill Industry website, which provides more
specific information on how to recycle and donate their textiles. While Goodwill accepts clothing,
outerwear and footwear, they place restrictions on the type of clothing and its condition. The website says
garments must be: “In-season, gently used for men, women & children” (Region of Waterloo, 2010). The
problem with this partnership is that Goodwill industry is mainly interested in reselling clothing, not in
recycling. This mentality is contained in the restrictions Goodwill places on the clothing it will accept.

21
Goodwill advises citizens to pre-sort in-season garments that are gently used: “While we appreciate all
donations we do ask that you take the time to sort your donations before bringing them to one of our
Donation Centre locations, to remove any items that we cannot resell” (Goodwill, 2010). The reasons they
offer are financial, since “sorting out and disposing of items [which Goodwill] cannot sell takes time and
resources away from fulfilling [its] mission” (Goodwill, 2010). Goodwill does not recycle any of the clothes
it receives; the organization instead resells every article depending on its condition. These categories are
limited and remain undefined on the organization’s website. For example, the website does not provide
any criterion for what “gently used” means. Therefore, citizens may erroneously conclude from the website
that their clothes must be in ideal condition in order to be donated. However, the condition of the garment
only matters when the garment is for re-sale, textile recycling does not require garments in good shape.
The Goodwill recycling program might be better termed as a resale program.
While the Goodwill drop-off centre also accepts garments out of season and seems to follow the
requirements less strictly, the information on the website might mislead citizens and create an external
barrier6 for them to donate clothes. However, since many consumers sort their clothes for disposal at the
end of the season, with a peak of donations around Easter, usually after spring clean-up (Ha-Brookshire &
Hodges, 2009), restricting consumers from donating out of season clothing is problematic because many
items will be not be suitable for Goodwill, but they would be fine for reuse. Further, citizens get no advice
on what to do with textiles which do not fulfill Goodwill’s requirements.
The problem of the partnership between the municipality and Goodwill towards the textile collection
becomes clear when examining the data call from the Waste Diversion Ontario (see Table 4).
In 2012 the Region of Waterloo had an estimated population of 556,400 people (Region of Waterloo,
2013). Since the Canadian value is unavailable, the US figure for the amount of textile waste per person per
year of 37.2 kg (Council for Textile Recycling, 2014) was used instead, which would put the amount of
textile waste in the region of Waterloo at 20,700,000 kg. While the Region has collected and monitored
492,000 kg of textile waste (Waste Diversion Ontario, 2012), its textile recovery rate is 2.4 percent. The
recovery rate indicates the percentage of received, separated and prepared textiles for recycling (in this
case reuse) (Table 4).
6 External barriers are hurdles which a person has to overcome in order to do something. If these hurdles are related to the person itself, they are internal. If they are based on the environment they are external.

22
Table 4: Textile waste in the region of Waterloo (table compiled by the author from Region of Waterloo (2013); Council for Textile Recycling (2014); Waste Diversion Ontario (2012)).
Population
number in the
Region of
Waterloo 2012
Average Textile
Waste per person
per year
Total Textile
Waste produced
in the Region
2012
Total Textile Waste in
the Region collected
and monitored based
on data call Waste
Textile
Recovery Rate
556,400 7 37.2 kg 8 20,700,000 kg 492,000 kg 9 2.4%
Because textile collection in the Region of Waterloo might not be fully monitored, it is difficult to compare
and determine how successful a recovery rate of 2.4 percent is, but the amount is extremely low
nonetheless. For example, U.S.A. currently maintains a 15 percent textile recycling and reuse rate. While
the Region of Waterloo is ranked second in Ontario in terms of their monitored textile collection amount,
their estimated textile recovery rate suggests there is room for improvement in the Region of Waterloo,
and in the Province of Ontario.
2.4 The purpose of recycling
In the early 1980s, recycling was understood as either unnecessary or irrelevant. Today, blue box programs
are standard, and communities have even begun to introduce green bin collections. Part of this trend
towards recycling was fueled by concern of an imminent waste crisis (Tammemagi, 1999), and even though
the crisis never came to pass, recycling remains a socially accepted process. The main reason is that nobody
questions the utility of recycling, and most view it as a morally just cause (Ackerman, 1996). Additionally,
the fact that everybody can participate in a recycling program gives social pressure towards those who do
not (Ackerman, 1996). As a result, recycling was treated as the answer to our environmental pollution.
Despite the social acceptance it has achieved, and the advantages recycling offers—such as reducing
7 Source: Region of Waterloo (2013). 8 Figure simulated using comparable data from Council for Textile Recycling (2014). 9 Source: Waste Diversion Ontario (2012).

23
landfill space, conserving natural habitats, and preserving natural resources (Babooram & Wang, 2007)—it
will not solve all our environmental problems.
Recycling must be seen as a strategy for waste reduction, a source for material resources and means to
reduce emissions and net energy demand. Recycling glass, paper, or metal proves all these advantages.
Recycling textiles could offer the same advantages but is largely unexplored. Research from the UK by
Woolridge, Ward, Phillips, Collins and Gandy (2006) used life cycle assessment to quantify the energy
consumption of reused and recycled textiles. They found that in addition to, the fact that new textiles
made of recycled material instead of virgin materials save resources; there is also a high net energy benefit.
The researchers state that “[f]or every kilogram of virgin cotton displaced by second hand clothing
approximately 65 kWh is saved, and for every kilogram of polyester around 90 kWh is saved” (2006, p. 94).
Muthu, Li, Hu and Ze (2012) mention even further benefits to recycling used textiles, citing it as a means of
“reduc[ing] the carbon footprint in the textile process chain” (2012, p. 1065).
While recycling can save resources there are also social and economic benefits of recycling. Frank
Ackerman describes recycling as preferable to waste disposal for purely economic reasons:
There are good economic reasons to expect recycling to create jobs. Money spent on recycling
leads to more employment than the same amount spent on garbage disposal. Recycling is a labor-
intensive activity, involving sorting and processing of waste materials. Disposal, in contrast involves
heavy equipment, large tracts of land, and very little labor. (Ackerman, 1996 p. 81)
However, although recycling is desirable and textile recycling in particular should increase, not producing
waste in the first place is best, since any kind of recycling requires energy and not every product can be
recycled in an endless loop. Since recycling is socially accepted and since textile recycling can reduce the
burden on the environment, it is surprising that there is so little textile recycling.
2.4.1 Material flow of garment production
The low rate of textile recycling becomes visible when the available data are presented in a Sankey
diagram, which shows flows in a given system (Schmidt, 2008). The Sankey diagram (Figure 2) depicts the
material flow between the different production stages of a garment and the potential destinations for
recycling materials. Note the present study does not examine pre-consumer textile waste; no further
research was undertaken to find the appropriate figures. Therefore, data for material lost during the fibre,

24
yarn, fabric and garment production processes are estimated, and the lines shown in the diagram
represent an approximate figure of these totals. The figures for textile waste after the use phase are based
on data from the “Lifecycle of Second-Hand Clothing” (Council for Textile Recycling, 2014, Section 3 and 4
of Table 1). Also note that this Sankey diagram does not include garments which are privately re-sold
because these garments will be further reused.
Figure 2: Sankey Diagram of garment production (figure created by the author using data compiled from (Council for Textile Recycling, Section 3 and 4 of Table 1 (2014)).
The thicker the line on the diagram means the greater the amount of material involved. The thickest line
branching from the use phase represents the 85 percent of all textiles which end up directly in the landfill.
While 6.8 percent of the donated garments are reused as second-hand clothes (the line leaving and
entering the use phase), only 3 percent of the garments are primary recycled into new fibres (the line
leaving the use phase and entering the fabric making phase). The line leaving the use phase and going
straight forward represents the 4.5 percent of textiles that are recycled and converted into new products
such as desk counters, insulation or stuffing materials.
Recycled/converted 4.5%
Organic fibre
production
Synthetic fibre
production
Fibres are spun into yarn,
yarn is knitted or woven into
fabric
Fabric is cut and made into
clothes
Fabric dying and finishing
process
Consumer use/reuse
85% Landfill
material lossmaterial loss material loss
Recycled into fibre 3%
Mainly reused as second hand clothes 6.75%
material lo
ss
Landfill 0.75%
15 % Collected

25
An ideal system of garment production would keep a high percentage of material in a closed loop supply
(Ehrenfeld & Gertler, 1997), which would mean that the lines looping back from the use phase to the fabric
making would be much thicker. This loop would reduce the amount of virgin materials required for textile
production. Also in this ideal system, the other line looping back from the use phase would lead to reuse of
the garment, representing a reduction of consumption.
Reused clothes, textiles converted into insulation or stuffing material, and textiles recycled into fibres only
account for 14.3 percent of the total textile waste. Further research is necessary to find out why more
textiles are not recycled, and go instead from use to disposal.
2.4.2 The function of charities in the textile recycling process
Before material can be recycled, it needs to be collected. While typical blue box materials are collected by
municipalities, currently no municipality in Ontario has a textile collection system in place (see section 2.2.2
“The Environmental Protection Act (EPA)”). Instead, everybody in Ontario who is interested in collecting
used garments can do so since no licence is necessary. Though this could be considered beneficial to the
environment, the downside is that there is no data on collections. Perhaps ironically, the dollar value of a
used garment is actually much higher than most of the materials collected in the blue box program, so it is
interesting that municipalities allow anybody to collect used textiles. Other countries are facing similar
issues, and academics are responding to them. For example, Moa Porse (2013) argues in her master’s
thesis, “Is Sweden ready to implement a textile recycling system?”, that Sweden requires legislation to
regulate who is allowed to collect textile waste, with determinations about which agencies can issue a
licence and the responsibilities it entails.
Usually charitable organizations in Ontario are in charge of collecting textiles; they do so to raise funds to
finance their missions such as social services, offering shelter, or feeding people in need. Therefore,
charities have no interest or obligation in collecting textiles except to make money. By law, that is their
primary priority. As a result charitable organizations have restrictions in what they collect because
collecting all clothing in any condition is not fiscally viable for them. However, there is a lack of
communication and information about what consumers should do with their textiles which do not fulfill
these requirements and although charities could tell consumers what to do with these textiles, they do not
do so because it is not their mission. This is often not considered by municipalities which partner up with
charity organization for garment collection. This might be one reason why only 15 percent of the unwanted
26
garments are collected (see section 2.4.1 “Material flow of garment production”), despite processes and
infrastructure already in place to collect the majority of unwanted textiles.
The used clothing industry will buy unsellable clothing from charities by weight. The used clothing industry
is specialized in further processing these garments by either reselling or recycling them. Further, most used
clothing enterprises own used clothing recycling bins, or have agreements with the public and private
sector from which they will receive old unwanted textiles. For example, bed sheets from hospitals,
tablecloths from hotels. The difference between a charity and the used clothing industry is that the latter
collect any item of clothing in a textile recycling bin regardless of its condition. However, many used
clothing companies operate clandestinely because there are critical voices against them and charities are
hesitant to partner with for-profit businesses. The negative perception of the used clothing industry comes
from a few companies in this sector that have very problematic practices, Porse pejoratively refers to these
companies as “fishy organizations” (Porse, 2013, p. 50), and the fact that although many companies in the
used clothing industry like to call themselves recyclers, they do not recycle the collected textiles. Therefore,
the boxes do not advertise that they will take any clothes in any condition, because clothing in a bad
condition costs money to process, so most companies would rather not get them. Hence, there is again a
lack of communication from the used clothing industry about the fibre value of the garments which
misleads consumers to think that their garments have little use or value beyond their mere resale
potential.
If the used clothing industry developed proper textile recycling facilities and procedures, for example
creating a textile refinery in Ontario dedicated to and capable of processing every textile in every condition,
the communication regarding textile collection and recycling might change for the better.
2.5 Apparel consumption
Although the environmental impact of producing a single article of clothing is not by itself problematic, this
impact becomes multiplied in accordance with the volume of textiles currently produced globally. It is
important to consider that volume is driven by the rapidly increasing rate of textile consumption. According
to the American Apparel and Footwear Association, the average American consumer (based on all people
in the US regardless gender or age) bought 62 garments in 2011 (The American Apparel & Footwear
Association, 2012).
27
An increase in apparel consumption correlates with an increase in the amount of textile waste. Within a
ten year span, post-consumer textile waste in the US increased 40 percent, from 18.2 billion pounds in
1999 to 24.46 billion pounds in 2009 and the Council for Textile Recycling expects this number to increase
further to 35.4 billion pounds by 2019. Unfortunately, the waste diversion rate has increased only two
percent over the same period of time (Council for Textile Recycling, 2014).
2.5.1 Increased consumption due to reduced garment prices
This rapid change in consumption can only be adequately understood by considering its historical context.
Industrialization in the textile industry began in the late eighteenth century with the development of the
spinning jenny, allowing for the mass production of clothing on an unprecedented scale. The speed and
efficiency by which clothing could be produced, and in large quantities, allowed for clothing to be sold
cheaply and in larger quantities. In the 1950s, clothing makers began searching for the cheapest
manufacturing prices and shifted manufacturing from developed countries to developing and newly
developed countries due to extreme wage differentials (Kunz & Garner, 2011). As a result of reduced
labour costs, textiles became cheaper to manufacture and garment prices fell accordingly. By the end of
the twentieth century, globalization had decreased garment prices to the extent that everybody could
afford multiple pairs of clothes. Today, everybody in America or Canada can afford to dress well thanks to
decreased garment prices (Rivoli, 2005).
In 2011, the average American consumer spent $910 US on apparel, roughly $14.60 US for each garment at
a rate of more than one garment (1.2) per week (The American Apparel & Footwear Association, 2012).
This $14.60 US for one garment entails the cost of producing the fibre, spinning, waving and colouring the
fabric, cutting the fabric, sewing and transporting this garment thousands of kilometres around the world
and the overhead costs of the retailer. In comparison, the price for a Big Mac in the US in 2011 was $4.04
US (N.N., 2011). For about three Big Macs a consumer can instead buy a pair of jeans. Although garments
could theoretically last for years and could be replaced over a period of time like other durable goods,
garments have become short-lived consumer goods. As a result, Americans buy clothes like food on a
weekly basis. The president and CEO of the American Apparel & Footwear Association, Kevin M. Burke,
said: "apparel and footwear contributed $354 billion to the U.S. economy in 2012, a bigger contribution
than new cars, fast food, or practically any other industry” (The American Apparel & Footwear Association,
2014). This level of clothing consumption is unparalleled in history.
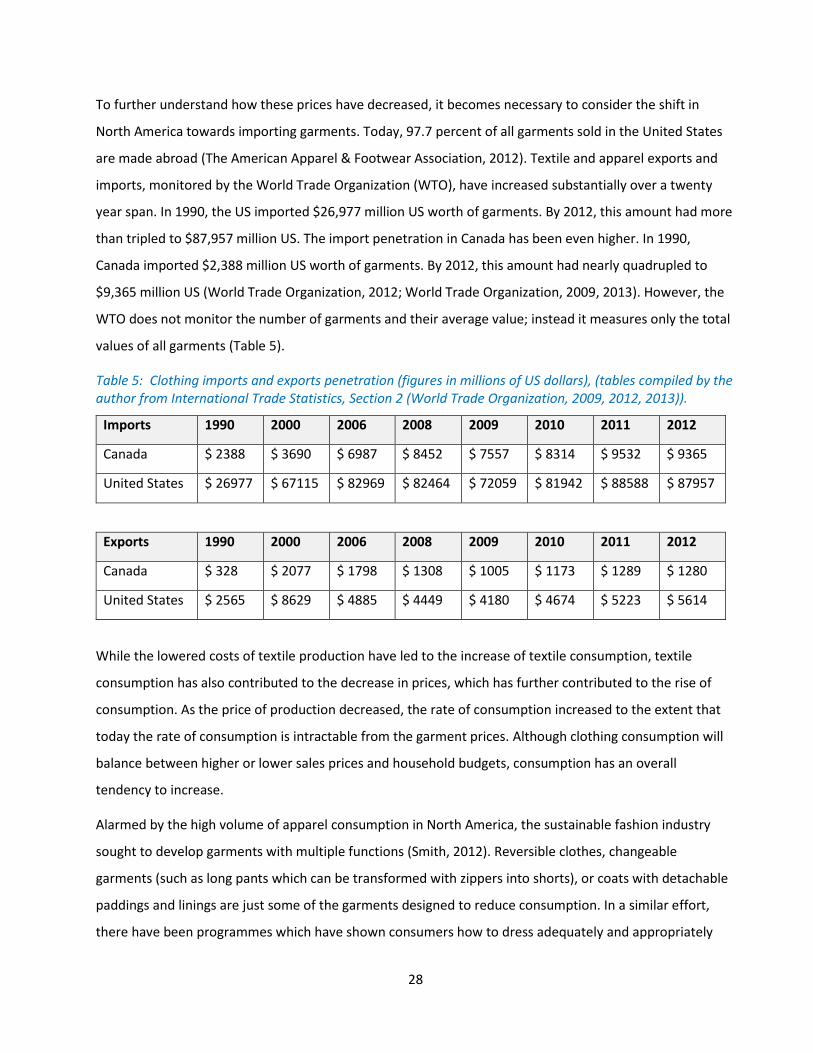
28
To further understand how these prices have decreased, it becomes necessary to consider the shift in
North America towards importing garments. Today, 97.7 percent of all garments sold in the United States
are made abroad (The American Apparel & Footwear Association, 2012). Textile and apparel exports and
imports, monitored by the World Trade Organization (WTO), have increased substantially over a twenty
year span. In 1990, the US imported $26,977 million US worth of garments. By 2012, this amount had more
than tripled to $87,957 million US. The import penetration in Canada has been even higher. In 1990,
Canada imported $2,388 million US worth of garments. By 2012, this amount had nearly quadrupled to
$9,365 million US (World Trade Organization, 2012; World Trade Organization, 2009, 2013). However, the
WTO does not monitor the number of garments and their average value; instead it measures only the total
values of all garments (Table 5).
Table 5: Clothing imports and exports penetration (figures in millions of US dollars), (tables compiled by the author from International Trade Statistics, Section 2 (World Trade Organization, 2009, 2012, 2013)).
Imports 1990 2000 2006 2008 2009 2010 2011 2012
Canada $ 2388 $ 3690 $ 6987 $ 8452 $ 7557 $ 8314 $ 9532 $ 9365
United States $ 26977 $ 67115 $ 82969 $ 82464 $ 72059 $ 81942 $ 88588 $ 87957
Exports 1990 2000 2006 2008 2009 2010 2011 2012
Canada $ 328 $ 2077 $ 1798 $ 1308 $ 1005 $ 1173 $ 1289 $ 1280
United States $ 2565 $ 8629 $ 4885 $ 4449 $ 4180 $ 4674 $ 5223 $ 5614
While the lowered costs of textile production have led to the increase of textile consumption, textile
consumption has also contributed to the decrease in prices, which has further contributed to the rise of
consumption. As the price of production decreased, the rate of consumption increased to the extent that
today the rate of consumption is intractable from the garment prices. Although clothing consumption will
balance between higher or lower sales prices and household budgets, consumption has an overall
tendency to increase.
Alarmed by the high volume of apparel consumption in North America, the sustainable fashion industry
sought to develop garments with multiple functions (Smith, 2012). Reversible clothes, changeable
garments (such as long pants which can be transformed with zippers into shorts), or coats with detachable
paddings and linings are just some of the garments designed to reduce consumption. In a similar effort,
there have been programmes which have shown consumers how to dress adequately and appropriately
29
with fewer garments. For example, an article in The Globe and Mail featured a report on “the one-month
wardrobe challenge”, wherein only six pieces of clothing were allowed for a full month to show how a
woman might dress herself using considerably fewer garments than usual (Self, 2011). Yet neither these
garments nor these initiatives address the impulse consumers have to purchase (consume) apparel.
Indeed, consumers seem to have no interest in avoiding consumption. In fact, according to the American
Apparel & Footwear Association, even during an economic recession Americans continued to buy a high
volume of clothing, and when the economy began to recover garment consumption returned to its pre-
recession levels (The American Apparel & Footwear Association, 2012). There are plenty of possibilities of
reducing garment consumption, but consumers seem to have no interest, and instead even increase their
budgets for clothes (The American Apparel & Footwear Association, 2012).
2.5.2 Increased consumption the difference between clothes, fashion, and “Fast
Fashion”
The increasingly cheaper prices of garments have given rise to new consumer spending attitudes towards
fashion. With the rise of consumerism, the significance of garments has shifted from clothes with a physical
function towards fashion with an emotional value (Fletcher, 2008) (see section 1.1 “Problem statement and
Research questions”). In “Prosperity without growth” Tim Jackson argues that people have become
addicted to consumerism in order to participate in social life (Jackson, 2011). This impulse can be seen in
the need people have to find the appropriate outfit for every occasion. This consumerist lifestyle changed
from buying clothing towards buying fashion. If fashion is consumed with even higher speed it is called
‘fast fashion’ (Barnes & Lea-Greenwood, 2006) (see section 1.1 “Problem statement and Research
questions”). Fast fashion has become the impetus for global textile supply chains. This new approach to
fashion is driven by innovative products, the cheapest prices, and the shortest lead times for the
production (Barnes & Lea-Greenwood, 2006). Where fashion was once dictated by seasonal need, such as
needing warmer clothing and multiple layers in winter, fast fashion has developed arbitrary cycles
irrespective of actual seasons. Clothes are manufactured and sold according to a seasonal range; and the
classical calendar seasons have been extended by adding more seasons, which the fashion industry now
call phases. This trend towards fast fashion results in a shorter life span of the clothes purchased as well as
a significant increase in textile consumption since the mid-1980s (Bhardwaj & Fairhurst, 2010). Although
peoples’ closets have increased in capacity—for example, Hawley reports American modern home closets

30
have increased by an average of 60 percent since the 1960s (Hawley, 2007)—most people do not have
enough space for their clothes. As a result, fast fashion has become ‘disposable’ or ‘throwaway’ fashion,
where clothes are only kept for a limited short time (Bhardwaj & Fairhurst, 2010) and only worn a few
times (Birtwistle & Moore, 2007).
2.5.3 Increased consumption due to market segmentation
However fashion and in particular fast fashion is not only challenging the waste departments, the whole
textile supply chain from producer to retailers had to adjust their way of working and thinking towards fast
fashion. Bruce and Daly write: “Fashion consumers expect and drive on constant change and so new
products have to be available on a frequent basis”(Bruce & Daly, 2006, p. 329). In order to deliver the “right
products” product developers, buyers and retailers divide consumers into different groups to differentiate
among them, in order to identify a target audience (Cahill, 2006). The objective behind the development of
consumer groups is to develop the right strategy to match the consumers and increase their consumption,
since non-fashion consumers have totally different needs than fashion or even fast-fashion consumers.
Consumer groups are often described as market segments. Keiser and Garner describe market
segmentation in apparel marketing as “the trend … to break down markets into increasingly smaller, well
defined groups to identify niche markets” (Keiser & Garner, 2012, p. 583). Two major grouping schemes are
used to describe market segments: one focuses on the physical attributes of the consumer, the other on
the behavioural attributes.
The segmentation scheme that uses the physical attributes examines the geographic, demographic or geo-
demographic attributes (Cahill, 2006). Geographic criteria are: nations, states, regions, countries, cities or
even postal codes of specific neighbourhoods. Demographic attributes describe: age, gender, material
status, family size, income, spending habits, occupation, education, and region or ethnicity (Keiser &
Garner, 2012). However, demographic and geographic attributes are often combined to geo-demographics.
The present study examines consumers in the province of Ontario, using age, marital status, gender, and
income as demographic attributes.
The second segmentation scheme uses behavioral attributes and examines the lifestyle, life stage,
psychographics, and product usage of the consumer (Cahill, 2006, p. 7). Psychographic data describe the
social and psychological aspects that influence a consumer, such as personality, attitude, class
consciousness or motivation. Psychographic criteria often enhance the other criteria, but are hard to

31
measure because they are not objective (Keiser & Garner, 2012). The amount of unwanted textiles a
person generates depends on the person’s textile consumption (the garments he or she acquires),
therefore the main drivers for textile waste are consumers attitudes towards clothing, fashion and how
quickly they adopt to new fashion trends. Therefore, consumers can be trend setters or trend followers.
One way of segmenting consumers can be done using Rogers (1962) diffusion of Innovations theory, which
describes how trends are adopted by different consumer segments over a given time frame. The theory
models how each segment influences the attitudes of the next. Since the development of the theory in the
1960s, it has been applied “to a variety of academic disciplines [and more than] 5000 studies” (Rogers,
2004, p. 13). This theory is demonstrated by the Rogers Diffusion Model, shown in Figure 3.
Figure 3: Rogers diffusion of innovations model, modeling percentage of adopters over time (figure from Rogers (1983, p. 247))
Morgan and Birtwistle (2009) applied Rogers’ model to the textile and fashion industry. Based on Rogers’
percentages, Morgan and Birtwistle identified the Innovators (2.5 percent) and Early Adopters (13.5
percent), which account for 16 percent of the total population, as fast fashion consumers. The market
share for fast fashion consumers in the UK is “one-fifth of the total clothing market” (Morgan & Birtwistle,
2009 p. 190). This means 16 percent of the consumers account for 20 percent of the market. Although this
is an influential segment which has a huge impact on textile waste, the other consumer segments—Early
and Late Majority and Laggards—account for 80 percent of the market share. However, because the trend
adoption of Laggards takes so long, and they seem to purchase clothes for practical rather than fashionable
considerations, fashion retailers do not advertise or cater to this consumer group and these Laggards,
which account for 16 percent, can be described as non-fashion consumers (see section 1.1 “Problem

32
statement and Research questions”). In contrast, all the other consumers are considered fashion
consumers (Innovators, Early Adopters, Early and Late Majority).
2.6 Reasons why people want to discard their clothes
To understand the consumer textile disposal behaviour it is necessary to understand what consumers do
with their purchased garments. In most wardrobes, there will be clothes that are actively worn and used,
and there will also be inactive, unused clothes that are mainly stored. Gaal Cluver (2008) categorised
consumer’s wardrobe inventories into different levels of inactivity: permanent (garments which will
probably never be disposed because of emotional attachment), temporary (garments which will be
eventually disposed, but kept in case of future opportunity for use), invisible (garments are somehow
forgotten and invisible, not noticed), and transitional (garments are intended for disposal, but consumer
requires time and psychological preparation to do so; these garments might be stored separately in the
interim) (Cluver, 2008). It is possible that a garment that had been in the inactive stage of a wardrobe can
be reactivated, but it can also move into any of the other inactive stages.
However, most inactive garments will be eventually disposed. The impact of inactive garments on textile
waste is exacerbated by the high percentage of inactive clothing that consumers keep in their closets. A
study from the UK reveals that participants estimated 60 percent of their wardrobe as inactive (Smith,
2012). Therefore, it is necessary to understand what makes a garment inactive, that is to say, what reasons
are responsible for consumers to not wear a garment since the same reasons will eventually lead to a
disposition of the garment.
There are many reasons why consumers want to get rid of their garments and remove them from their
wardrobes. In their essay “What About Disposition”, Jacoby, Berning and Dietvorst (1977 p. 26) describe
different factors which influence a consumer’s choice of disposition and grouped them in three categories:
“psychological characteristics of the decision maker” such as personality, attitude, or social conscience;
“intrinsic factors to the product” such as condition, age, style, or initial cost; and “situational factors
extrinsic to the product” such as finances, storage space, or fashion change. Different academic researchers
have found different factors for textile disposal (Birtwistle & Moore, 2007; Lee, et al., 2013; Smith, 2012)
and Laila describes: “These categories can interact and partly even overlap” (Laitala, 2014 p. 445). Note

33
also that while all factors individually can lead to disposal, a garment can also have several reasons for
disposal (Laitala, 2014).
2.6.1 Psychological characteristics of garment ownership
Managing unwanted textiles is based on individual, product, and situational factors, and will ultimately
depend on the consumer. Focusing on the consumer is essential because even if a garment loses its value
due to wear and tear (see section 2.6.3 “Intrinsic factors to the product: Durability and reparability”) the
consumer decides whether the garment can still be worn or if it is ready for disposal. Consumers might
wear garments even with signs of wear and tear if the garment is particularly comfortable (Cluver, 2008),
or the garment might hold sentimental value for the consumer (Sego, 2010). The main reason for garment
disposal noted by Smith was the consumer disliking the garment style, which is a shift usually connected
with the consumer’s fashion identity: Reasons include a person’s perceptions of age and body shape and
the wish to be appropriately dressed (Smith, 2012).
2.6.2 How the consumer’s relationship towards environment effects textile
disposal
Shim (1995), Joung and Park-Poaps (2013) examined how consumers’ relationship towards the
environment influences textile disposal behaviour. Shims found that consumer’s with environmental
concern are less likely to discard their used clothing, preferring to donate or reuse them. She also
determined that environmentally conscious consumers are more aware of their waste and are more willing
to overcome the inconvenience of clothing donation or reuse. Joung and Park-Poaps found that resale and
donation were linked to environmental concerns. Resale was also driven by economic concerns, as was
reuse. Moreover, family attitudes towards environmental concerns influenced attitudes towards donating
(2013). In another study, Joung (2013) surveyed more than 300 college students, dividing them into two
groups of consumers, materialistic and non-materialistic, and determined that materialistic consumers are
more interested in fashion and buy more garments, but are less interested in the environment. However,
both groups participate equally in recycling. Hence, “consumers’ participation in recycling is not related to
environmental attitude” (H.-M. Joung, 2013, p. 533).

34
2.6.3 Intrinsic factors to the product: Durability and reparability
Although the consumer decides whether to discard or to do something else with a used garment, the
product itself may influence his or her decision. Product attributes, such as durability and price, influence
behaviour towards textile consumption and textile disposal.
Guarantees, warranties, and taxes are policies that can extend the lifecycle of a product because they
enjoin the manufacturer to produce goods that are more durable and repairable (Cooper, 2004). While
such guidelines are in place for all kinds of products, there are no such regulations for textiles. As a result,
retailers sell clothing without responsibility for durability, and there is typically no information to a
consumer on how long a product could last. Consumers accept that garments lose their value due to use
and obsolescence. This is commonly described as wear and tear, for example by colour fading. To achieve
the maximum of a garment’s colourfastness, the colour needs to be added early during the production
process. However, a consumer is not able to see at which level the colour is added, and manufacturers
have no interest to colour fibres instead of fabrics because of the higher risk and cost. As a result, most
garments are coloured on the fabric level and will suffer early from signs of wear and tear after a few
washings.
Another product attribute which will influence the lifespan of a garment is its reparability. Over the last
thirty years the industry has removed the possibility of garment adjustments; therefore alterations are
difficult if not impossible to accomplish. Products which are not durable and not repairable can only be
discarded. This has led to a ‘throwaway society’, where planned obsolescence is widely practiced and
accepted (Cooper, 2004, p. 421). However, the industry is only partly responsible for this throwaway
practice. Gibson and Stanes found that younger generations lack the skills to do even minor clothing repairs
such as sew on buttons or fix hems. If a repair is necessary it is usually done by parents or grandparents. If
they are not available, items will be discarded, because professional repair has the reputation to be
expensive, particularly in relation to the low purchasing prices of garments (Gibson & Stanes, 2011).
35
2.6.4 How product quality and the purchasing price affect textile disposal
To reduce textile waste, sustainable textiles and fashion expert Kate Fletcher called for increasing the
quality of clothing to increase longevity (Fletcher, 2008). However, in an online survey with over 500
women and men in the US, Lang, Armstrong, and Brannon discovered that participants who considered
themselves quality- conscious when purchasing clothes tend to dispose their garments more frequently
than others. One potential reason given for this behaviour might be higher standards when they decide
whether a garment is worn out and shows signs of wear and tear (Lang, Armstrong, & Brannon, 2013).The
later study shows, that the garment quality has no direct influence how long the first owner will keep the
garment, but it remains unclear whether quality adds to the second hand value of the garment and its
overall lifespan. This example also shows that the individual consumer attributes has a stronger influence
on the textile disposal behaviour as the product attributes (see Psychological characteristics of garment
ownership).
While there is evidence to suggest that quality garments will not be kept longer, there is no consensus
what this level of quality entails. As a result, many consumers take purchasing price as an indicator for
quality, assuming a high purchasing price equals high product quality. Unfortunately, there is no evidence
that price can be used as a general indicator for quality, nor does high price necessarily mean heightened
resistance to wear and tear. Decreased garment prices and fast fashion (which is typically associated with
lower prices and quality) have been the motor for increased consumption, and the increased consumption
is responsible for the enlarged rate of clothing disposal (Park, Kim, & Forney, 2006), but the purchasing
price of a garment is not necessary responsible for how long the garment will be kept or used by the
consumer (Lang, et al., 2013). Lang et al discovered that participants of their survey who considered
themselves price conscious when purchasing clothes “tend to dispose of their clothing less frequently … as
consumers who wish to make their dollar count may be more likely to make the most of what they own,
resisting disposal” (Lang, et al., 2013, p. 712). Consumers with higher wealth might be more inclined to
dispose of their expensive clothing more frequently since they possess the financial freedom to do so
(Lang, et al., 2013).
During a lecture from April 2013, Professor Roland Clift said: “Angels wear Prada, devils wear Walmart”. In
other words, the worst offenders of clothing disposal are those who buy cheap, low quality clothing, while
those who buy expensive and high quality, high fashion clothing are considered superior. While this
aphorism might seem true at first glance, it completely disregards the evidence regarding consumer textile

36
waste. Consumers who purchase cheap and low quality clothes will not discard their clothes more
frequently than consumers buying expensive clothes, and high quality clothes will not necessarily be kept
longer than low quality clothes (Lang, et al., 2013). Clift’s statement, while rational at first glance, discounts
the specifics of consumer habits and especially consumer mentality. Logically, higher quality and more
expensive garments would be expected to be kept longer (and as Lee et al. have shown, garment price and
quality is a factor in disposal), but this logic omits the overriding effect of fashion on how long clothing will
be kept. Expensive and high quality brand name clothing like Prada is acquired and maintained
predominantly by its fashionability, not by its price. The angels may not be wearing Walmart, but when it
comes to textile disposal, the devil still wears Prada.
2.6.5 Situational factors extrinsic to the product
Young and Wallendorf describe disposal as a process rather than an act. The process of cleaning up is
emotional and physical work (Young & Wallendorf, 1989). Many consumers sort their garments and move
them to transition areas or intermediate storage spaces until they are emotionally ready to redistribute
their unwanted garments (Sego, 2010). “At this point, the individual still retains possession of the item, but
has taken a psychological and behavioral step towards transferring the title of the item to other persons,
businesses, organizations, or the waste stream” (Cluver, 2008, p. 100). However, the process of removal
can be difficult. Some people even experience fear when they have to dispose something (Winsberg,
Cassic, & Koran, 1999) to the extent that they keep their garments instead. The phenomenon of hoarding is
examined in different studies (Frost et al., 1998; Steketee & Frost, 2010; Winsberg, et al., 1999). The overall
increase in clothing consumption has led to more disposals but also to hoarding of textiles.
2.6.6 How long a garment will be kept before its disposal
Garments are worn frequently during the first year when purchased (Smith, 2012). Fewer than half of
garments are still worn on a regular basis after the second year (Smith, 2012). As soon as garments are
inactive, they become candidates for disposal. Morgen and Birtwistle examined the disposal behaviour of
female fashion consumers aged 17 to 25 and found that young fashion consumers are “more likely to
retain expensive clothing, even if they no longer wore it” (Morgan & Birtwistle, 2009, p. 195). Bye and
McKinney questioned women aged 35 to 65 about the reasons that they keep an inactive garment and

37
found that investment value, weight management, sentimental value and aesthetic object were offered as
the main reasons (Bye & McKinney, 2007). However, garments might be kept in a wardrobe for years
without being used while some consumers will extend the use of their old clothes by wearing them when
they perform garden or other hands-on work, will repurpose them as cleaning rags, or might pass their
garments down to other family members or close friends (see section 2.7.1 “Channels for clothing reuse,
recycling, and disposal”). Although figures for the duration textiles will be retained are not available for
Canada, a study in the Netherlands found out that on average consumers get rid of their garments after
three years and five months regardless of use (Uitdenbogerd, Brouwer, & Groot-Marcus, 1998).
2.7 Managing unwanted clothing
Sooner or later, consumers want to get rid of garments. It should be noted that some of the garments
which will be disposed of have never been worn. A study of Norwegian women found that as much as 13
percent of their total wardrobe was dedicated to clothing that had never been worn (Klepp, 2001).
Managing used clothing will be described in three sections. The different channels for clothing reuse,
recycling, and disposal will be examined first, then the motivations which might lead to the preference for
one channel over any other will follow, and lastly waste management strategies will be described.
2.7.1 Channels for clothing reuse, recycling, and disposal
Although previous researchers list slightly different channels for disposition, they are consistent in that
they examine disposal options from a consumer perspective, which is unsurprising given that the consumer
is responsible for acquiring garments and disposing of them. Joung and Park-Poaps list resale, donation,
reusing and discarding as disposal channels (2013) and Lee et al. list “throwing items away, … donating to
non-profit organizations, … passing to other family members, … or selling on action sites” (2013, p. 67).
From a Canadian waste management perspective these are not disposal channels (see section 1.1 “Key
terms”), but possibilities to manage unwanted garments. There are nonetheless some issues with the
channels currently under discussion. New social awareness about textile waste has prompted retailers to
offer alternative means of textile disposition known as “take- back” programs that allow consumer to

38
return old clothes. Because of their newness, take-back programs have yet to be included in the broader
critical discussion about viable methods of textile waste management. This study will be among the first to
include this component, since no academic studies before 2014 have considered take-back programs as an
option of textile disposition (Laitala, 2014) (see section 2.8.2 “Take-back programs”).
Another new phenomenon not yet considered in academic research is swapping. This channel offers new
possibilities for consumers to get rid of their clothes by meeting with other consumers to exchange old
garments. It is difficult to say if swapping is a new way of shopping or a new method of recycling and reuse.
To clarify this issue then, this study adopts a new academic approach by treating swapping as an option to
manage textile waste. In most swap events the leftover clothes will be donated to a charity, and if
someone cannot find something during the swap event, he or she at least removes old clothes (see section
2.8.3 “Swapping used clothing”).
This study considers personal reuse (handing clothes down to a family member or close friend, or wearing
clothes for hands on work) or repurpose (reusing clothes as cleaning rags) as options to manage unwanted
clothing but does not include them as reuse, recycle or disposal channels (see section 1.2 “Key terms”).
Other researchers see this method differently and treat passing on clothes to a friend as a disposal method
(Birtwistle & Moore, 2007; Lee, et al., 2013; Shim, 1995). However, this does not seem to be garment
disposal as it is a kind of personal reuse. Either the garment continues to be used or worn by the owner, or
the former owner remains connected with the passed down garment due to the relationship between
garment owner and the recipient. For example, a mother passes down a sweater to her daughter. The
garment is not disposed of so much as it is moved into another room in the household. Even when clothes
are passed on to a close friend, there remains a level of interaction between the garment and the original
owner. In contrast, during a swap event participants typically exchange their clothes with participants they
might not know or most likely do not share a residence. Participants will likely never see the original
garment again; the owner relinquishes all control over the garment.
In summary, five channels are identified as available to consumers to manage unwanted clothes: reselling,
take-back, swapping, donating, and disposal. The options are similar in that they involve the consumer
relinquishing control of their garments, but differ in compensation the consumer receives and the amount
of time involved with each channel.
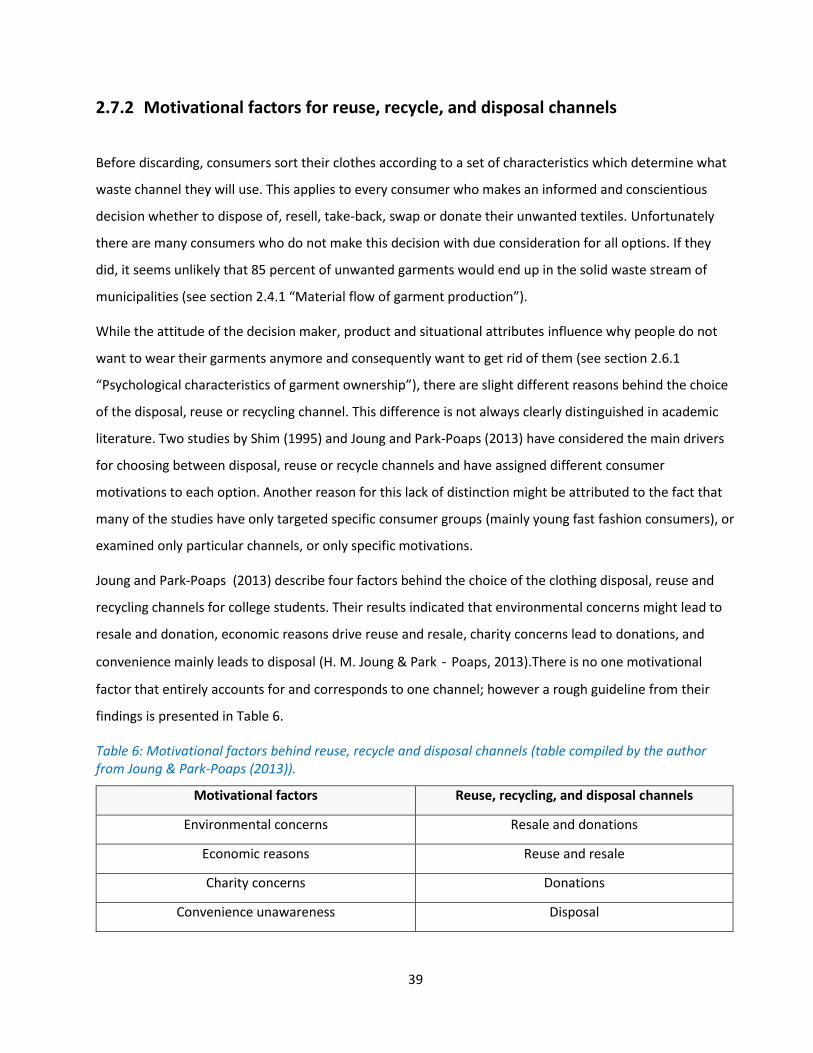
39
2.7.2 Motivational factors for reuse, recycle, and disposal channels
Before discarding, consumers sort their clothes according to a set of characteristics which determine what
waste channel they will use. This applies to every consumer who makes an informed and conscientious
decision whether to dispose of, resell, take-back, swap or donate their unwanted textiles. Unfortunately
there are many consumers who do not make this decision with due consideration for all options. If they
did, it seems unlikely that 85 percent of unwanted garments would end up in the solid waste stream of
municipalities (see section 2.4.1 “Material flow of garment production”).
While the attitude of the decision maker, product and situational attributes influence why people do not
want to wear their garments anymore and consequently want to get rid of them (see section 2.6.1
“Psychological characteristics of garment ownership”), there are slight different reasons behind the choice
of the disposal, reuse or recycling channel. This difference is not always clearly distinguished in academic
literature. Two studies by Shim (1995) and Joung and Park-Poaps (2013) have considered the main drivers
for choosing between disposal, reuse or recycle channels and have assigned different consumer
motivations to each option. Another reason for this lack of distinction might be attributed to the fact that
many of the studies have only targeted specific consumer groups (mainly young fast fashion consumers), or
examined only particular channels, or only specific motivations.
Joung and Park-Poaps (2013) describe four factors behind the choice of the clothing disposal, reuse and
recycling channels for college students. Their results indicated that environmental concerns might lead to
resale and donation, economic reasons drive reuse and resale, charity concerns lead to donations, and
convenience mainly leads to disposal (H. M. Joung & Park‐Poaps, 2013).There is no one motivational
factor that entirely accounts for and corresponds to one channel; however a rough guideline from their
findings is presented in Table 6.
Table 6: Motivational factors behind reuse, recycle and disposal channels (table compiled by the author from Joung & Park-Poaps (2013)).
Motivational factors Reuse, recycling, and disposal channels
Environmental concerns Resale and donations
Economic reasons Reuse and resale
Charity concerns Donations
Convenience unawareness Disposal

40
Although consumers are influenced by more than one type of motivation, Shim suggests that there is a
predominate motivation which will lead to a certain behaviour (Shim, 1995). While Joung and Park-Poaps
(2013) consider these factors as the primary motivation for a given disposal, reuse, or recycling channel,
Shim considers whether consumers’ decision might be more nuanced, involving multiple motivations for
each channel (Shim, 1995). While some consumers might resell their clothes for income, for example,
others might do so for environmental reasons (Shim, 1995).
Though there may be multiple factors at play in any consumer’s decision to dispose of a garment, this study
will only list and examine the predominant motivational factors behind each disposal, reuse, or recycling
channel, following Shim (1995), and Joung and Park-Poaps’ (2013) research results for resale, donation and
disposal. No study has yet examined the motivational factors behind swapping and take-back programs.
Hence this study provides only hypothetical suggestions. Swapping seems to rely on a social component,
while a take-back program is unique in that its very structure enables and even invokes multiple
motivational factors: environmental, charity and economic. Taken together, these three features might be
more broadly organized under the concept of sustainability (Table 7).
Table 7: Motivational factors behind the five channels identified for this study (table compiled by the author from Joung & Park-Poaps (2013); Shim (1995)).
Motivational factors Recycling, reuse and disposal channels
Economic Resale
Sustainability Take-back
Social Swap
Charity Donations
Convenience, unawareness Disposal
When considering only one predominate motivation behind each channel, environmental motivations
disappear. This is probably because environmental motivations are usually connected with recycling, an
option that is missing as a direct channel for consumers to remove their unwanted textiles.
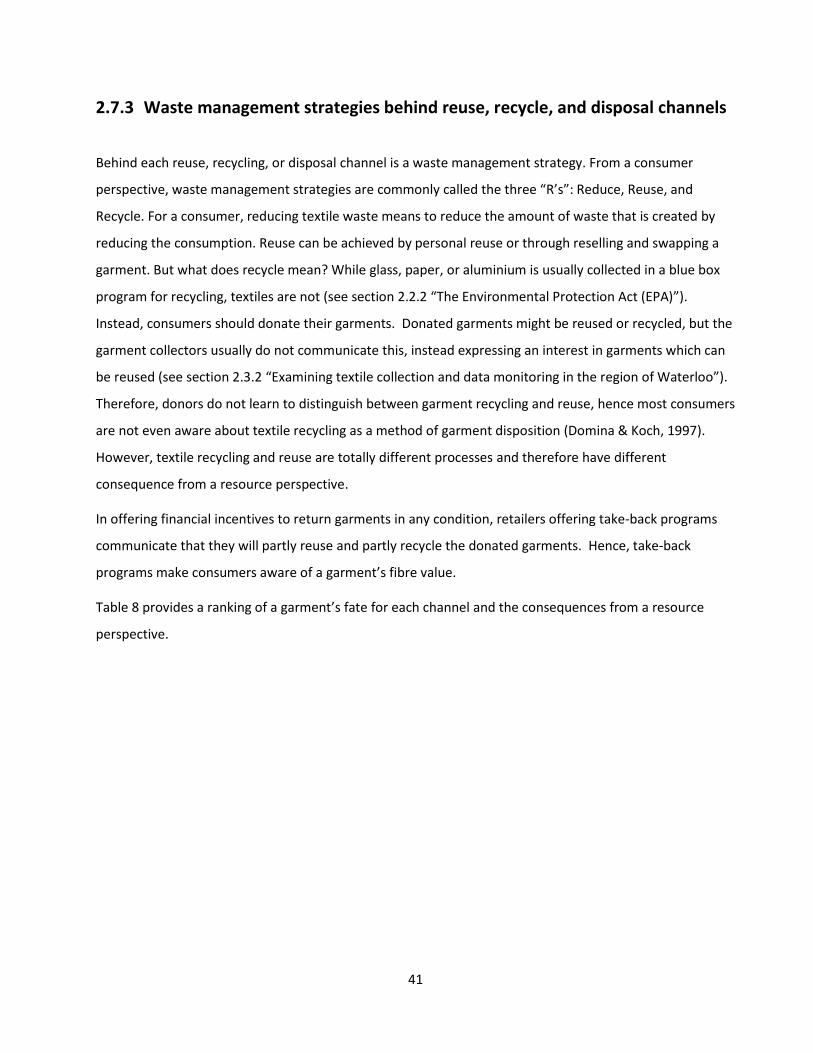
41
2.7.3 Waste management strategies behind reuse, recycle, and disposal channels
Behind each reuse, recycling, or disposal channel is a waste management strategy. From a consumer
perspective, waste management strategies are commonly called the three “R’s”: Reduce, Reuse, and
Recycle. For a consumer, reducing textile waste means to reduce the amount of waste that is created by
reducing the consumption. Reuse can be achieved by personal reuse or through reselling and swapping a
garment. But what does recycle mean? While glass, paper, or aluminium is usually collected in a blue box
program for recycling, textiles are not (see section 2.2.2 “The Environmental Protection Act (EPA)”).
Instead, consumers should donate their garments. Donated garments might be reused or recycled, but the
garment collectors usually do not communicate this, instead expressing an interest in garments which can
be reused (see section 2.3.2 “Examining textile collection and data monitoring in the region of Waterloo”).
Therefore, donors do not learn to distinguish between garment recycling and reuse, hence most consumers
are not even aware about textile recycling as a method of garment disposition (Domina & Koch, 1997).
However, textile recycling and reuse are totally different processes and therefore have different
consequence from a resource perspective.
In offering financial incentives to return garments in any condition, retailers offering take-back programs
communicate that they will partly reuse and partly recycle the donated garments. Hence, take-back
programs make consumers aware of a garment’s fibre value.
Table 8 provides a ranking of a garment’s fate for each channel and the consequences from a resource
perspective.
42
Table 8: Ranking of the textile reuse, recycle and disposal channels from a resource perspective (table created by the author using data compiled from European Commission Environment (2015)).
Value Garment fate when entering the reuse,
recycle, and disposal channels
Consequence from a resource
perspective
High
Low
The garment’s lifespan is extended through
reuse at the product level
Reuse will lead to a reduction of new
garments production
Parts of the garments are reused (for
example the sleeves of a sweater) for new
garments and the remaining parts of the
garment (the body or the hoody of the
sweater) are recycled for its fibre value
This strategy might leads to a reduction
in production of new garments
The garment is recycled in a re- spinning
process for its fibre value the fibre length
and therefore the fibre quality is kept
Fibres can be used for new garments
leads to a reduction of virgin fibre
requirement
The garment is recycled in a shredding
process for its fibre value, but the fibres are
shortened, this results in a quality loss of
the fibre
Fibres can be used for new products but
not for garments, there is some kind of
resource use reduction (often into
products of lower quality like stiffing
materials)
No value Garments and material are disposed of and
not reused or recycled
There is no reduction of resource use
2.8 Channels that consumers use to manage their unwanted garments
Figure 4 describes the reuse, recycle, and disposal channels consumers have to resell, take-back, swap,
donate or dispose their unwanted garments. Further, it provides the predominant motivational factors and
shows the waste management strategies behind each channel.
The section after Figure 4 will further explain and describe each reuse, recycle and disposal channel, the
motivational factors, and the environmental considerations of waste management strategies. Each recycle
and disposal channel is then evaluated in terms of its consequences from a resource perspective using the
scale outlined in Table 8 .

43
Figure 4: Textile Reuse, Recycle, and Disposal Channels including motivational factors and waste management strategies (figure created by author using data compiled from Joung & Park-Poaps (2013); Shim (1995); Rivoli (2005)).
2.8.1 Reselling used clothing
Selling garments can be conducted directly between consumers, or with the assistance of a retailer.
Whether the reselling is done online or through shops, including second-hand, or even at a garage sale, the
purpose remains the same: to discard clothes and receive money as compensation for them. However,
selling the garments requires the consumers’ time and energy, and the received money is little compared
to the original retail price. The Canadian Budget Binder advertises second-hand purchases with the
following slogan: “It’s not about how much money you make. It’s how you save it!”(Canadian Budget
Binder, 2012 ). This slogan hints at the low product margins for used clothing, which are under additional
pressure from low prices and special offers on new garments. By contrast, consumers interested in buying
used clothing are attracted by the low prices and the opportunity to find a bargain. According to a study
44
from the America’s Research Group and posted by the Association of Resale Professionals, about 12-15
percent of Americans shop at resale or consignment shops and even 16-18 percent of Americans at thrift
stores.10 The resale business had a growth of approximately 7 percent for the last two years and is the
fastest growing retail segment (NARTS The Association of Resale Professionals, 2014). Although the
predominant motivation for a consumer to resell used clothing might be the economic benefit, since the
resell prices are often low the economic motivation might not be the only factor. Other reasons such as
environmental or charity motivations exist (H. M. Joung & Park‐Poaps, 2013; Shim, 1995).
Through reselling, the lifespan of the textile product will be extended by further use. Also, since the new
owner has spent money for a “new” second-hand garment, this might reduce his or her budget and might
lead to a source reduction of new garments. However, this reduction might be mitigated by the seller
buying new garments with the profits made by selling the old garments, or from the buyer not counting the
bargain towards his or her clothes budget. From a resource perspective this channel provides a high value
(see Table 8)
2.8.2 Take-back programs
As already mentioned in the previous sections, over the last few years many retailers have offered take-
back programs which ask customers to return used clothing, often in exchange for financial incentives (see
section 2.7.3 “Waste management strategies behind reuse, recycle, and disposal channels”). In 2013, the
Swedish retailer Hennes & Mauritz (H&M) launched its garment recycling initiative by encouraging its
customers to bring a bag of used clothing to receive a 15 percent discount on their next purchase. H&M
cooperates with the used-clothing-corporation I: Collect and has started to collect used clothing from their
customers on all of their sales markets on a regular basis (CharityStar, 2014). Consumers are allowed to
bring back any garments, no matter the brand or condition, but limited to one bag per person per day. The
market presence of H&M, and the efficacy and scope of its take-back system place this method as a new
and viable way for consumers to get rid of their clothes. Since the beginning of their take-back program in
2013, H&M has collected 109,300 kg garments in Canada and 9,715,142 kg worldwide (CharityStar, 2014).
10 A resale or consignment store accepts products and will sell items based on a small commission or compensation fee. If the products do not sell in a given time, the owner will get the products back. A thrift store purchases the used products from its owner or receives donations. From the beginning, thrift shops take on ownership of the item and resell the item at its own risk.
45
H&M’s take-back program reaches a consumer segment which would otherwise discard their garments.
H&M is a fast fashion retailer that is popular among young, female fashion consumers and is therefore
partly responsible for the worldwide increased consumption of clothing. Morgan and Birtwistle found that
young female fashion consumers are concerned about the environment, but that this awareness of the
environment does not influence their textile disposal behaviour and their attitude towards textile reuse
and recycling. Hence, young female, fast fashion consumers tend to throw their used garments into the
waste bin (Morgan & Birtwistle, 2009).
From a consumer perspective, take-back programs are an easy way to receive some financial benefit for
little effort. There is no need for any additional driving to different places and searching for drop-off stops.
It is an ideal option for fast fashion consumers since they visit these stores frequently anyway, adopt new
fashion trends faster than any other consumer segment (Birtwistle & Moore, 2007), and enjoy any
discount. In terms of consumer motivation there is economic benefit, but also environmental and social
consciousness, as most retailers explain their reasons are based on sustainability.
However, what becomes of the used garments from take-back programs is at the discretion of the retailer,
which has the possibility to resell, recycle or donate those garments. The benefit from a resource
perspective will depend accordingly.
Resell for reuse:
“Green Eileen”, a subsection of clothing retailer Eileen Fisher, offers a simple take-back program on
used Eileen Fisher clothing, whereby customers return old Eileen Fisher clothing, the garments are
sorted and gently used items get professionally cleaned and resold in Green Eileen stores (Fisher, 2014).
This program expands the lifespan of the textile product through further use. Since the new owner has
spent money for a “new” second-hand garment this might reduce her budget for new clothes and might
lead to a source reduction of new garments. From a resource perspective this channel provides a high
value (see Table 8).
Restyling for resell and reuse:
Though seldom practiced, companies have occasionally asked consumers for used garments in order to
restyle them. For example, Levi Strauss & Co called for used denim pants and restyled them into new
denim coats. The restyling process expands the lifespan of the garment or parts of it, but this process
requires energy. At the same time there is a possibility of source reduction for of new garments or for
virgin fibres. From a resource perspective this channel provides a medium high value (see Table 8)
46
Resell:
While the two examples above require the retailer to become active, there is another option where the
collected garments are sold to the used clothing industry. This industry is often referred to as the
snowflake industry because every item that enters this industry is unique, so the business is mainly
about one’s expertise in picking and matching the snowflakes with customers (Rivoli, 2005). While only
a small part of the collected garments from retailers will be sold to the Used Clothing Industry (UCI), this
stream is used often by charities. This stream will be given a more detailed description in the section
2.8.4 “Donating used clothing”. If retailers sell the collected garments to the UCI, it is unknown what
happens with the garments, however, making it difficult to rate this option.
Recycle:
On January 17, 2014, H&M announced the launch of the first products made from the fibres of the used
clothing it had collected (Ferguson, 2014). According to H&M, it is working on a closed loop of textile
production. The fibre value of the used garment is used, but energy is required to produce the new
textile product. There is a source reduction of virgin fibres. From a resource perspective fiber recycling
for new fabrics is one of the most desirable options to manage textile waste (resale and reuse being the
best). From a resource perspective this channel provides a medium high value (see Table 8).
Donating:
The simplest way for a retailer to use the clothes it receives from a take-back program is to donate the
collected garments to a charity or to partner up with a charity. For example, the British retailer Marks
and Spencer (M&S) has an agreement with the charity organization Oxfam, and every consumer who
donates a used article of M&S clothing at Oxfam’s receives a £5 off voucher his or her next purchase at
M&S if it is above £35 (M&S, 2014). Most take-back programs donate at least a portion of the clothes to
a charity or donate money which they made out of the returned garments. Since it is unknown what
charities do with the received clothing it is difficult to rate this option (see section 2.8.4 “Donating used
clothing”). Eileen Fisher offers a unique garment donation program. Returned Eileen Fisher garments
that have holes or damages and which are not suited for resale will be re-purposed. Therefore the
company has established hands-on workshops, where consumers can join local artisan events to create
something new out of an old Eileen Fisher garment by using its fabric and other materials such as
buttons. These events expand the lifespan of a garment’s fabric and materials by further use.

47
Additionally, these events create a community centred on sustainability (Fisher, 2014). This program
extends the lifespan of parts of the garment, the fabric, and the materials. But because new products
are made energy is also needed for the production and the cleaning. However, new products can be
developed without the use of virgin materials; therefore a source reduction is possible. From a resource
perspective this channel provides a medium high value (see Table 8).
2.8.3 Swapping used clothing
There is a new awareness among consumers about the environmental impact of textiles, the conditions
under which garments are produced, the high-volume of consumption and the large amount of waste. This
awareness might be one of the reasons why swap parties have become a trend as a response to more
sustainable fashion. Even young female fast fashion consumers (who have a high consumption of clothing,
but want to wear their clothes only few times) are interested in swapping their clothes with friends
(Morgan & Birtwistle, 2009).
Swap events are often privately organized by fashion fans who invite friends and acquaintances. Everybody
is encouraged to bring old unwanted clothes and to swap them. Swaps parties are fun social events with a
strong community-building aspect. The idea behind these events is that everybody can take home
something “new” while getting rid of something with which they are bored. 11 Items which remain un-
swapped are usually donated to charities.
Over the last few years, these typically private events have become recognized as business opportunities.
For the past three years, for example, the Canadian social enterprise Swapsity has promoted private
swaps, while also organizing live swap events in Toronto (Swapsity, 2014). Not only have swap events
become popular in person, “swapping” is also booming online. However, the need for an event to get rid of
unwanted clothes can present a problem for consumers, because they become dependent on other people
and the event requires time. The advantage compared to selling is that they can get rid of clothing with
minimal time and effort (unlike taking photos of the product, registering it on a website, or getting it
accepted at a consignment store). The predominant motivation for swapping can only be assumed, but the
social aspect might be a large factor. A further motivation might be environmental consciousness, but it is
11 I use the term bored specifically because it’s a tendency noted by and shared amongst fast-fashion consumers, who note that their desire for new clothes is linked to their growing boredom with their old clothes.
48
unclear how one’s willingness to wear second-hand clothes relates to one’s environmental awareness. If
young fashion consumers swap their clothes there might be also an economic motivation. Due to the
willingness to donate the leftover garments, also altruistic, charity motivations might play a role.
From an environmental point of view, swapping is the best option to get rid of a garment. Reuse and
donation will extend the product life span and it might lead to source reduction if the participants can fulfill
their needs without purchasing something new. Since the garments are free, consumers might choose
garments which they are not really interested in and may discard at a later date more easily than if they
had paid for them. From a resource perspective this channel provides a high value (see Table 8).
2.8.4 Donating used clothing
Consumers have the possibility to donate clothes to charities. There are plenty of charities and so-called
‘charity’ organizations that are privately owned and operated for profit or not; these organizations have
different collection systems such as pick-up services, depot boxes, and drop off stations (see section 2.4.2
“The function of charities in the textile recycling process”).
Donation is mainly considered when garments are small and handy, only gently worn, but unwanted, no
longer desired, or out of fashion (Stall-Meadows & Goudeau, 2012). Lee et al interviewed young women
aged 18 to 25 and many of their participants describe “that their donations [of unwanted garments] to
charity shops … made them feel good” (Lee, et al., 2013 p.69). This statement could lead to the conclusion
that donations are solely made by consumer’s public perception and a desire to help society and in fact,
charities and some studies support this claim (Goodwill Industries International, 2014; H. M. Joung & Park‐
Poaps, 2013; Shim, 1995). Brookshire and Hodges explored “used clothing Donation Behaviour” and found
out that consumers donated because of their “self-orientation” (Ha-Brookshire & Hodges, 2009 p. 179).
The researchers determined that rather than out of any charitable impulse, consumers donate based on
their recognition of the utilitarian and hedonic value of doing so. Consumers feel a sense of relief that they
have cleaned their closets and created new space for new purchases (utilitarian value), while they
experience personal pleasure and the diminishment of guilt for owning so many clothes (hedonic value).
This guilt stems mainly from the shame and waste they feel either at their overconsumption or because the
garments are seldom worn. The guiltier the consumers felt, the more inclined they were to donate (Ha-
Brookshire & Hodges, 2009).
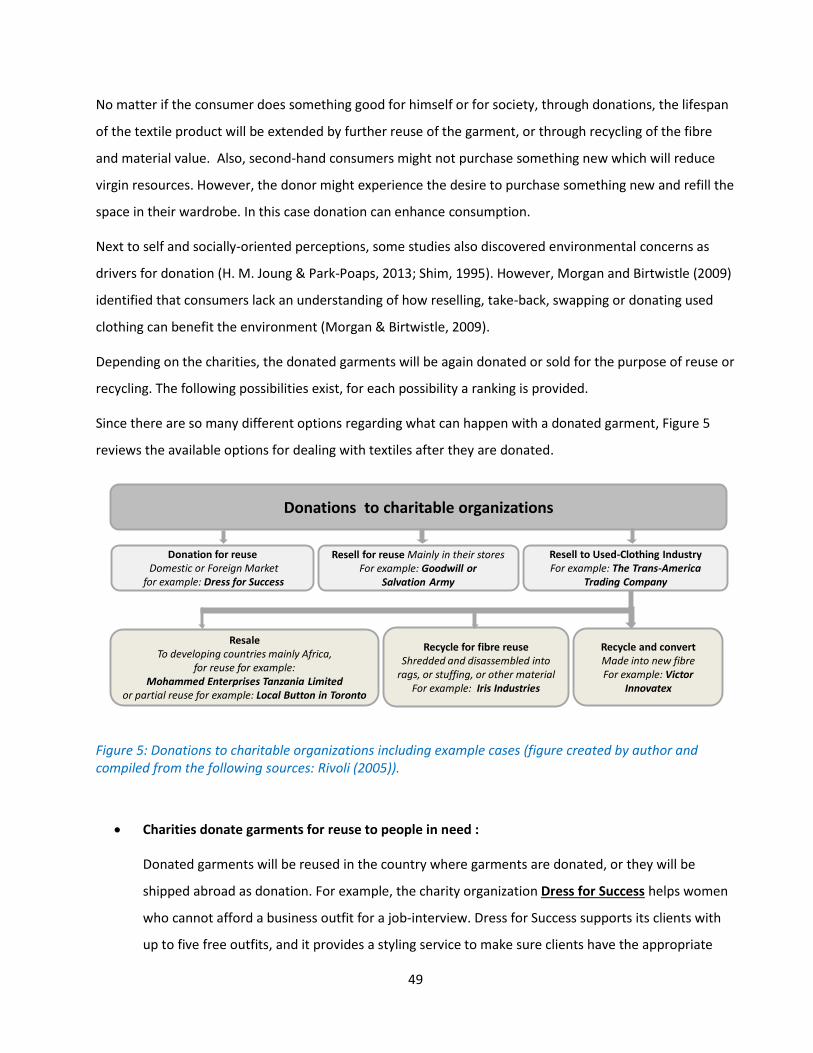
49
No matter if the consumer does something good for himself or for society, through donations, the lifespan
of the textile product will be extended by further reuse of the garment, or through recycling of the fibre
and material value. Also, second-hand consumers might not purchase something new which will reduce
virgin resources. However, the donor might experience the desire to purchase something new and refill the
space in their wardrobe. In this case donation can enhance consumption.
Next to self and socially-oriented perceptions, some studies also discovered environmental concerns as
drivers for donation (H. M. Joung & Park‐Poaps, 2013; Shim, 1995). However, Morgan and Birtwistle (2009)
identified that consumers lack an understanding of how reselling, take-back, swapping or donating used
clothing can benefit the environment (Morgan & Birtwistle, 2009).
Depending on the charities, the donated garments will be again donated or sold for the purpose of reuse or
recycling. The following possibilities exist, for each possibility a ranking is provided.
Since there are so many different options regarding what can happen with a donated garment, Figure 5
reviews the available options for dealing with textiles after they are donated.
Figure 5: Donations to charitable organizations including example cases (figure created by author and compiled from the following sources: Rivoli (2005)).
Charities donate garments for reuse to people in need :
Donated garments will be reused in the country where garments are donated, or they will be
shipped abroad as donation. For example, the charity organization Dress for Success helps women
who cannot afford a business outfit for a job-interview. Dress for Success supports its clients with
up to five free outfits, and it provides a styling service to make sure clients have the appropriate
Donation for reuse Domestic or Foreign Market
for example: Dress for Success
Donations to charitable organizations
ResaleTo developing countries mainly Africa,
for reuse for example: Mohammed Enterprises Tanzania Limited
or partial reuse for example: Local Button in Toronto
Resell for reuse Mainly in their storesFor example: Goodwill or
Salvation Army
Resell to Used-Clothing IndustryFor example: The Trans-America
Trading Company
Recycle for fibre reuseShredded and disassembled into
rags, or stuffing, or other materialFor example: Iris Industries
Recycle and convert Made into new fibreFor example: Victor
Innovatex
50
appearance for job interviews and business. Garments which are not used for their clients are
resold to maintain the office (Dress for Success, 2014). From a resource perspective this channel
provides a high value (see Table 8).
Charities resell the garments for reuse in their own stores:
Charities like Goodwill or Salvation Army sell the donated garments mainly in their own local
stores with very attractive prices. Therefore, these charities provide individuals in the community
with affordable apparel and create local employment. The garments lifespan’s is extended, and
there is an opportunity for source reduction. From a resource perspective this channel provides a
high value (see Table 8).
Charities sell garments to the used clothing industry:
Many of the donated garments charities receive are not sellable or useable for their customers.
Instead, charities will resell the unwanted garments either through personal contacts to specific
clients, or to the used clothing industry. Used clothing is a traded commodity and the prices
depend on the market. Over the last thirty years, the second-hand clothing business has become
very competitive due to the cheap import of virgin fibres and garments mainly from East Asia to
large chain stores. The cheap prices for new material have lowered the prices for second-hand
textiles and the used clothing businesses have come under high pressure (Fletcher, 2008). Today
many charities claim that the amount of money they receive from the used clothing industry does
not cover their operation costs. Daniela Siggia, the Director of Business, from Development for
Textile Waste Diversion Inc., has claimed in an email to this author in spring 2013: “It used to be
that people mostly donated only 'good stuff' but now that they are getting better educated about
waste diversion, they are giving us ALL their textile waste (which is great) but its yielding us no
return as there is no current value in shreddables but very labour intensive to shred” (personal
communication, April 7, 2013). The used clothing industry sorts the received garments mainly by
hand or with the help of technology. Garments are sorted according to condition and the types of
fibres used. When garments are sorted they are distributed to other destinations (Bureau of
International Recycling, 2013). The Trans-America Trading Company is an enterprise of the used
clothing industry located in New York, it receives about 70,000 pounds of clothing every working
day and it will sort the garments into more than 400 different groups (Rivoli, 2005). About half of
the clothing it receives will be sold to the ‘second world’ (Rivoli, 2005, p. 183), but the main part of

51
the garments will be shipped to Africa, although more than 30 countries in Africa have import
embargos against used clothes (Rivoli, 2005). From an environmental point of view, selling
garments to Africa extends the use phase and this deserves the best environmental ranking.
However, there are many opponents against imports of used, Western clothes to Africa because
those garments destroy the African garment culture and the African textile industry. While the
used garments may destroy jobs and industry in all importing countries, they also create jobs and
industry. Two examples are provided:
The used clothing industry sell the garments for reuse or partial reuse
Today, the company Mohammed Enterprises Tanzania Limited (MeTL) employs 24,000 people
in Tanzania in all key businesses and is a leading economic force in that country (Mohammed
Enterprises Tanzania Limited, 2014). The company started to trade used clothing in 1985 when
“mitumba”, or second-hand, trade was legalised in Tanzania. This used-clothing network
formed the basis of MeTL’s expansive empire, serving as the basis for all further success
(Rivoli, 2005). Tanzania is one of the biggest used clothing markets for used American apparel
(Rivoli, 2005). From a resource perspective this channel provides a high value (see Table 8).
The enterprise Local Button in Toronto travels to Haiti, the least developed country in the
American continent (Kunz & Garner, 2011), purchases used clothing from the local second
hand markets, washes them, opens the seams and uses the fabric and materials to create new
garments which are then resold in North America (Local Buttons, 2014). Ironically, perhaps,
clothes donated from North America to Haiti are resold from Haiti to North Americans. As this
option does not reuse the garments, but restyles them, this channel provides a medium high
value (see Table 8).
Sells the garments for their fibre value for new products
The majority of garments which are not wearable anymore are sold to the “flocking” (Porse,
2013 p. 15) or shoddy industry (this term originally derives from North England), where the
garments will be disassembled into rags or cleaning clothes, or shredded. Shredding is mainly a
mechanical process without innovation over the last 200 years. Fibres are broken-down with
carding machines; this ripping reduces the fibres’ staple length and the fibres lose their
strength and typical characteristics (Fletcher, 2008). Usually, the short fibres are no longer
52
useable for woven textile products, but can be used for other applications such as stuffing in
mattresses, coffins, upholstery, or disposable diapers (Bureau of International Recycling,
2013). A small portion of the used garments are shredded and converted into new products
with high value. Iris Industries, an innovative company, specializes in the development and
commercialization of sustainable materials and it is purchasing shredded denim fibres and is
recycling them into new consumer products such as countertops or furniture and even jewels
(Iris Industries, 2013). From a resource perspective this channel provides a medium high value
(see Table 8).
Sells the garments for their fibre value as a base for new fabrics (reclaimed fibre).
The USI might sell some garments for textile reclamation. The shredded garments are
transformed into short fibres and then become re-spun into yarn, but the yarn will only
achieve a low-grade quality. However, when the spinning can be made in a chemical process,
fibres can be melted and re-spun to the same length as virgin fibres and the same quality can
be achieved (Bureau of International Recycling, 2013). A chemical spinning process is possible
for all manmade fibres, for cellulosic fibres such as viscose, or for synthetic fibres such as
polyester. The fabric mill, Victor Innovatex, in Quebec produces an “eco intelligent polyester”
fibre made out of recycled polyester garments. The company claims that such fibre can be
produced with 80% less greenhouse gas emissions (Group.Inc, 2008). From a resource
perspective this channel provides a medium high value (see Table 8).
While donations can either lead to reuse or recycling, both waste management strategies are accepted.
Although reuse is higher in the waste hierarchy and therefore preferable, in terms of textiles the recycling
might be even more desirable. So far only three percent of the donated or take-back garments are
recovered into new material (Council for Textile Recycling, 2014) ( see section 2.4.1 “Material flow of
garment production”). Due to the worldwide rising fibre demand, especially from newly developing
countries such as China, new sources of fibre are necessary. Converting old and discarded garments into
new fabrics should be the future for the textile waste and could relieve the environmental cost associated
with the production of virgin fibres. Further innovation in technology is necessary to develop stronger and
finer materials, especially for recycled organic materials. Innovation will only happen, however, if there is
more demand for reclaimed material, but also more material which can be recycled.
53
3 METHODS
This section explains the research behind the design and format of the questionnaire then describes the
sample group of the survey and concludes with the limitations of this study.
3.1 Research design
This study aimed to examine and understand how Ontario residents manage their unwanted garments.
Internal and external barriers that impede individuals from choosing more sustainable reuse recycle, and
disposal channels are identified. Further, this study sought to determine whether fashion and non-fashion
consumers manage their unwanted clothing differently, and used quantitative research to do so. Since this
research aimed to gain information from Ontario users, including participants who live in rural areas, it was
decided to use an online survey. Apart from being a cost-effective option, an online survey allowed a larger
number of participants to answer a broad range of questions at their own pace about their attitudes,
beliefs and barriers related to textile consumption and disposal. The questionnaire required about twelve
to fifteen minutes to complete and consisted of twenty sets of questions (the sixteen questions which
comprised the fashion scale index counted as one question set, for example), and the amount of sets
participants were asked depended on the answers provided (i.e. some questions were filtered out based
on a respondent’s answer). The majority of questions were closed responses that used either a five-point
Likert scale or a choice of answers. One question asked for an approximate percentage, three questions
asked for further clarification from the participants (e.g. ‘did you enjoy participating in a swap event?’), and
one open-ended question sought clarification on additional aspects of textile waste disposal and allowed
participants to make their own comments. Likert scale and multiple-choice questions were chosen to allow
statistical methods to analyze and compare responses from participants.
3.2 The questionnaire
The following section describes the different parts of the questionnaire and explains the rationale for each
question.
54
The questionnaire consisted of three different parts. The first part asked participants about their
demographics, the second part identified whether participants were fashion or non-fashion consumers,
and the third part of the survey asked how they manage their unwanted clothing. This latter part consisted
of different subsections. An overview of the different parts as well as the subsections of the questionnaire
are listed below, summarised and briefly explained.
3.2.1 Part I: Demographics
Demographic factors will cumulatively affect the fashion interest level of an individual. For example,
individuals typically lose fashion interest as they age, favouring comfort and affordability over fashion
(Keiser & Garner, 2012); or, people living in urban areas are typically more interested in fashion than those
living in rural areas.
However, in comparing 41 research projects, Laitala (2014) discovered that most studies about clothing
disposal are conducted using non-representative samples since they are dominated by females. There is a
lack of studies that include both genders, all age groups, income and different marital status (Laitala, 2014).
The survey that was conducted for this research included all genders and age groups, income levels, marital
status, and geographic areas in the Province of Ontario.
3.2.2 Part II: Developing a fashion scale
Research suggests that people who are highly involved in fashion purchase also discard more clothing (H.-
M. Joung, 2013; Lang, et al., 2013; Lee, et al., 2013; Morgan & Birtwistle, 2009), but there is no research to
determine whether there is a difference between how fashion and non-fashion consumers manage their
unwanted clothing. This study aims to determine whether fashion attitude is connected to fashion disposal
and to close this research gap. In order to determine an individual’s fashion attitude it is necessary to ask
individuals questions about their interest in fashion. However, so far there is no singularly approved
fashion scale which predicts a person’s fashion attitude. As such, different researchers have developed
different questions and created different scales. For this study, a fashion scale was constructed based on
three studies (Lang, et al., 2013; Morgan & Birtwistle, 2009; Tigert, Ring, & King, 1976), taking questions
from each that provided the most applicable model for general consumer fashion attitude. Though not
interchangeable, each scale shares common traits and features that invite comparison. Although there is

55
no defined language about a fashion scale, there are nonetheless factors which recur in every study,
including fashion interest, fashion trend sensitivity, and fashion innovation, which serve as the basis for the
scale used in this current study.
The next section will describe these three previous studies (Lang, et al., 2013; Morgan & Birtwistle, 2009;
Tigert, et al., 1976) and their applicability to this questionnaire. Furthermore, the questions raised in these
studies will be examined to determine their applicability in determining a fashion scale, and will list which
questions were used for this study and those which were omitted. Although all three studies have
developed something along the lines of a fashion scale, each study gave this scale a different name. Tigert
et al. (1976) label the scale as “fashion interest” or “fashion involvement”, Lang et al. (2013) refer to it as
“fashion trend sensitivity” and “shopping frequency”, while Morgan & Birtwistle (2009) conducted street
interviews based on six different questionnaire sections. The sections are titled as followed: the purchasing
stores, fashion innovations, fashion purchasing behaviour, general disposal and recycling behaviour,
clothing and textile disposal habits and finally demographic factors.
Tigert et al. (1976) note how consumers involved in fashion also purchase more clothing than others. Their
research is based on the theoretical and methodological framework of the Rogers diffusion of innovations
model (Rogers, 1971) (see section 2.5.3 “Increased consumption due to market segmentation”), which
shows how involvement in trends can be divided into different consumer segments. Essentially, people
adopt innovations in different ways and in different rates depending on different characteristics. Tigert et
al. (1976) used this tendency to understand how to increase fashion consumption at a retail level. Their
focus was obviously different from the current study about textile waste. Nonetheless, the authors offer a
fashion scale that can serve as a point of comparison for this current study. They identified five dimensions
to describe fashion involvement and developed for each category a question to measure a ‘fashion
involvement index’ (Tigert, et al., 1976, pp. 45-52). The five categories and the questions which the
researchers developed to identify a person’s fashion involvement are listed below (Tigert, et al., 1976, pp.
48-49):
1. “Fashion innovativeness and time of purchase” (Tigert, et al., 1976, p. 48):
“Would you say you buy new men’s clothing fashions earlier in the season, about the same time, or later in
the season than most other men?” (Tigert, et al., 1976, p. 48)
2. “Fashion interpersonal communication” (Tigert, et al., 1976, p. 48):
“Would you say you give very little information, an average amount of information, or a greater deal of
information about new men’s clothing fashions to your friends?” (Tigert, et al., 1976, p. 48)
56
3. “Fashion interest” (Tigert, et al., 1976, p. 48):
“In general, would you say you are less interested, about as interested, or more interested in men’s
clothing fashions than most other men?” (Tigert, et al., 1976, p. 49)
4. “Fashion knowledgeability” (Tigert, et al., 1976, p. 48):
“Compared with most other men, are you less likely, about as likely, or more likely to be asked for advice
about new men’s clothing fashions?” (Tigert, et al., 1976, p. 49)
5. “Fashion awareness, and reaction to changing fashion trends” (Tigert, et al., 1976, p. 48):
Which one of the statements below best describes your reaction to changing fashions in men’s clothes:
I read the fashion news regularly and try to keep my wardrobe up-to-date with fashion trends
I keep up-to-date on all the fashion changes, although I do not always attempt to dress
accordingly to these changes
I check to see what is currently fashionable only when I need to buy some new clothes
I do not pay much attention to fashion trends unless a major change takes place
I am not at all interested in fashion trends. (Tigert, et al., 1976, p. 49)
Since 1976, when Tigert et al.’s survey was conducted, fashion consumption has drastically increased, and
the role of innovators and early adopters has achieved an even more pronounced role. Indeed, in their
conclusion, Tigert et al. (1976, p. 51) claim that “the driving force in the fashion adoption process, the
highly fashion involved consumers represent an important market as heavy clothing buyers”. This
importance was especially prominent in a study conducted in 2009 by Morgan and Birtwistle. They used
Rogers diffusion of innovations model and Goldsmith and Hofacker‘s scale (1991), both of which model
consumer innovation, and applied these models to consumers fashion involvement (2009). Morgan and
Birtwistle (2009, p. 191) used the following characteristics to describe fast fashion consumers:
• Very fashion conscious and very much aware of new trends
“Heavily influenced by the fashion media”, shop and purchase fashion items more frequently
Influenced by the purchasing habits of celebrities
• Spending more per month than they did previously
Wearing their clothing “for socializing are only worn a few times, work garments are expected to
be kept for longer”
Not concerned if clothing is practical and could be worn again the following season, ‘must-have’
garments

57
With increased fashion consumption comes an increase in textile waste. In 2013 Lang et al. developed a
scale with eighteen questions to define a person’s fashion trend sensitivity and fashion shopping frequency
to better understand consumer disposal habits. The study found that “fashion trend sensitivity, fashion
shopping frequency, higher incomes, younger age groups and being female are all positively correlated
with frequent clothing disposal” (Lang, et al., 2013, p. 706). The results also indicated that “price
consciousness was negatively related to clothing disposal frequency” while “quality consciousness” had the
opposite effect (Lang, et al., 2013, p. 706). The research from Lang et al. (2013) is the closest to this
current study not only because it is the most recent, but because it also examined the impact of fashion
interest on textile disposal behaviour. Although Lang et al. (2013) did not further categorize their fashion
trend sensitivity and shopping frequency questions, the content of their questions nonetheless invites such
categorization. Indeed, analyzing the questions of Lang et al. (2013) in regard to the five categories
identified by Tigert et al. (1976) reveals a close alignment between the two sets of questions. Certain
questions were nonetheless omitted from this current study at Lang’s suggestion after contacting the
author via email in February 2015 since the wording of reverse-coded questions might have influenced the
scale validity. Lang et al. also asked questions about quality and price consciousness which are not relevant
for this study and therefore these were not asked in this current study.
This research used a combination of questions based on the aforementioned studies to develop a fashion
scale which determine the fashion index of respondents which could be used to later classify this consumer
as a fashion or non- fashion consumer. Below is an overview of all the sixteen questions used in the survey
and the source in which they were first published. Questions without sources were created by the author,
in order to replace the reverse coded questions from Lang et al. and to complete the categories. Questions
made by the author are based on the literature review, the study of Morgan and Birtwistle (2009) and the
replacement questions from Lang et al. (Lang, et al., 2013).
When the question set was composed, the categories were constructed by combining the dimensions
defined by Tigert et al. (1976) with the characteristics of fast-fashion consumer behaviour noted by Morgan
and Birtwistle (2009) to give seven categories in total (which Tigert et al. refer to as dimensions).
Fashion scale:
1. Fashion innovativeness and time of purchase:
1.1. “I like to buy new clothing early; just when the fashion trend comes out begins” (Lang, et al., 2013,
p. 711).
58
1.2. “I am usually the first among my friends to buy the latest clothing styles” (Lang, et al., 2013, p.
711).
2. Fashion interpersonal communication:
2.1. “I often influence the types of clothing styles my friends buy” (Lang, et al., 2013, p. 711).
3. Fashion interest:
3.1. I usually buy clothing because I am thrilled by a new fashion trend.
3.2. “I am usually the first to know the latest fashion trends” (Lang, et al., 2013, p. 711).
3.3. I think I am a trendsetter and my clothes are very fashionable.
3.4. I seek out new fashion trends and I spend a fairly high proportion of my income and time on
fashion.
3.5. “Compared to my friends, I own more of the latest fashion styles” (Lang, et al., 2013, p. 711).
4. Fashion knowledgeability:
4.1. “Friends regard me as a good source of fashion advice” (Lang, et al., 2013, p. 711).
5. Fashion awareness, and reaction to changing fashion trends:
5.1. “I read the fashion news regularly and try to keep my wardrobe up-to date with fashion trends”
(Tigert, et al., 1976, p. 49).
5.2. I follow the fashion styles of celebrities and I find they influence my fashion purchasing habits.
5.3. “I usually try to be different from others by wearing fashionable clothing” (Lang, et al., 2013, p.
711).
6. Places to shop:
6.1. “I am interested in shopping at fashion specialty stores rather than department stores for my
fashion needs” (Lang, et al., 2013, p. 711).
7. Fashion shopping frequency:
7.1. “I buy new clothing often, even if I do not need it” (Lang, et al., 2013, p. 711).
7.2. I am not concerned if clothing is practical or timeless, and can still be worn in the next season.
7.3. “I purchase new clothing more often than my friends” (Lang, et al., 2013, p. 711).
As there is no unique fashion scale, questions directly related to fashion attitude are not clearly defined. A
Likert scale question was used because this type of question is easy to understand for participants who can
answer the questions on a symmetric scale and do not have to decide whether they agree or not but can
answer with a degree of agreement. All questions measure the same attitude; therefore the fashion scale
can be described according to Grace-Martin (2008) as a true Likert scale in contrast to a Likert-type scale. In
keeping with the format designed by Lang et al. (2013), the questions in this survey addressing the fashion

59
scale were conducted on a 5-point Likert scale (1 = strongly disagree, 2 = disagree, 3 = neither disagree nor
agree, 4 = agree, 5 = strongly agree). Each question received the same values (from one to five), and all
questions were given the same weight. This was necessary in order to compare and analyze them.
Although each question has the same value, each category is weighted according to the number of
questions in each category. The category “awareness of changing fashion trends”, for example, is
represented by three questions, while only one question aimed to determine “fashion interpersonal
communication”, or “fashion knowledgeability”. Fashion interest, the shopping frequency and the fashion
awareness were deemed the most important categories, and as a result five questions were asked for each
category. While consumers might have different values depending on the question, the average of all the
values will be their fashion index.
While Lang et al. (2013) developed eighteen questions to ask for fashion trend sensitivity and shopping
frequency, and using these as a guide this study reduced the questions to sixteen. In contrast, Tigert et al.
(1976) developed five questions. In order for the fashion scale to have a high reliability, the questions were
devised so that participants would achieve a consistent score for similarly themed questions and that
participants with the same interest would achieve roughly the same score for each question. To test
whether the sixteen questions actually form such a homogeneous scale, both a Cronbach’s alpha analysis
(Cronbach, 1951) and Principal Component Analysis (Rencher, 2002) are conducted. Both methods analyze
whether a number of items measure the same construct, in this case: the fashion scale.
The purpose of the fashion scale is to create a fashion scale index and determine whether the reuse,
recycle and disposal behaviour of an individual is dependent on his or her fashion index. The fashion scale
was also used to distinguish between the disposal behaviours of fashion consumers and non-fashion
consumers. This distinction between the two groups of consumers was made using a simplified version of
Rogers diffusion of innovations model. According to Roger’s model (1971), fast fashion consumers have a
fashion index value between 4.4 - 5 and corresponds to the highest 16 percent of the distribution, while
the early and late majority of fashion consumers are between 1.7 - 4.3 and correspond to the middle 68
percent, and the laggards have a value as low as 1 - 1.6 and correspond to the lowest 16 percent of the
distribution. Therefore, in regard to the fashion scale, fashion consumers have a value between 1.7 - 5 (the
top 84 percent of the distribution), and non-fashion consumers have a value below 1.7, representing the
lowest 16 percent of the distribution (see section 1.1 “Problem statement and Research questions”).
60
3.2.3 Part III: The possibilities to manage unwanted clothing
The following section describes the questions of the survey designed to indicate people’s behaviour
towards each disposal channel. The conclusions drawn from the responses will be used to develop a
strategy to change people’s attitudes towards certain channels to reduce the amount of textiles going into
the landfill.
According to Laitala (2014), while most studies have examined re-use, donations, giving away to friend and
reselling as channels to manage unwanted clothing, many do not mention take-back programs. Though
swapping was included in the study of Lee et al. (2013), it too is often overlooked. In order to achieve a
more detailed understanding of how people manage their unwanted clothing, all channels have been
included in this study.
Since take-back and swapping are both new channels to manage used clothing, this study seeks to
determine how well-known those possibilities are and whether or not people are interested. For swapping,
participants were asked if they know what swapping is, if they have visited a swap event and if they are
interested in visiting a swap event. For take-back, participants were asked if they have taken a garment
back to a retailer and what they think about the possibility to take a garment back to a retailer.
Reselling is an established possibility to manage unwanted clothing, but consumers’ use of this channel
varies. Hence, this study asked participants whether they practice reuse and whether they think it works
well or not. Donations are also a well-established method to manage unwanted clothing, but donations are
dependent on accessibility of donation boxes. Thus, participants were asked if they know a place for a
donation box and whether or not it is convenient to reach.
Although this study does not consider reuse and repurpose as a channel to manage unwanted garments, it
is still seen as a method where the garment is used for something different than originally planned. While
some studies equate reuse with giving clothes to friends (Bianchi & Birtwistle, 2012), there are other
possibilities to reuse or repurpose unwanted garments. As such, the questionnaire asks participants
whether they reuse or repurpose their clothes and if so, in what ways.
Different reasons for clothing disposal were identified as well. Since Laitala (2014) concluded that most
garments are disposed of because consumers think their clothes have no value for others, show signs of
use, do not fit anymore or are out of fashion (2014), the questionnaire sought to determine the main
reasons participants in this survey dispose of clothing.

61
In order to be able to develop strategies to alter consumers’ textile waste behaviour, it is necessary to
know which consumers are managing unwanted clothes, and this means discovering whether consumers
manage their unwanted garments themselves, or if somebody else does it for them. Laitala et al. (2014)
note that women often manage the unwanted clothing of the whole family. Therefore, participants in the
survey were asked if they manage the clothes for family members or if somebody else manages their
unwanted garments.
Research shows that people use multiple channels to manage their unwanted clothes (Lee, et al., 2013;
Shim, 1995; Smith, 2012), but does not specify the percentage each channel is used. In this study,
participants were asked to estimate, using an approximate percentage, the degree to which they use each
channel. Because there is a difference between peoples’ intentions and what they finally will do,
participants were asked what they do with specific products. Although this experiment is only a simulation
of a real situation, it nonetheless offers a more accurate understanding of the degree to which each
channel is used. To determine whether participants alter their sorting habits for the different channels,
different products with different issues were given.
According to Domina and Koch (2001) consumers change their disposal behaviour when they have a lot of
clothing to dispose of versus a few pieces. The volume can highly influence a person’s behaviour, and the
aim of this section was to determine the extent of this influence.
Many studies have examined the motivational factors behind the different reuse, recycle and disposal
channels, but little is known about the barriers which keep participants from practising them. Participants
were therefore asked about the different barriers behind the disposal channels.
People who shop more frequently than others usually tend to possess more clothing than others. If people
have more clothes in their closets, they have more pressure to clean up their closets due to a lack of space.
For example, Brookshire and Hodges (2009) found that people donated unwanted clothing because they
needed space in their closet for new garments. Therefore, shopping frequency and clothing volume
influences how unwanted garments are managed. Therefore, participants were asked the reasons why
they clean out their closet, whether it is done on a regular basis or not, and how often they shop for
clothing.
The last question of the survey is an open question, in which people were encouraged to give any kind of
feedback to the survey or the topic.
The questionnaire can be found in section 0 “
62
Appendix A: Survey Questionnaire”. The results were examined with descriptive statistical analyses,
analyses of variance (ANOVA), Chi Square tests, and qualitative data analyses. Before the results are
presented, the sample is described in the following section.
3.3 Sample
Following the project plan, data was collected in February 2015 in the Province of Ontario. In order to
utilize the planned target population, collaboration with the professional survey provider Survey Sample
International (SSI) was made. The sample provider has a pre-existing relationship with potential survey
participants and rewards them with small incentives such as air miles or bonus points for participating.
Participants could decline to answer any questions they wished and could withdraw their participation at
any time by not submitting their response.
The survey was designed and programmed in fluid survey. The sample provider had sent an email invitation
to their consumer panel to those who indicated Ontario as their residence in their profile. As such, this
sample might include a small minority of consumers who have multiple homes (for example, to attend
school or university, or for job reasons). At the beginning of the survey each respondent was informed
about the study and the ethical approval by the University of Waterloo. This convenience sampling method
targeted a 95% incidence12 in Ontario with a balanced distribution on gender and age. The sample intended
to include all income levels, participants with different material status and consumers from rural and
different sizes of urban regions, but did not seek an equal distribution of these demographic factors. Since
the fluid survey version that was used did not allow for setting quotas, the invitations were sent in small
portions over a time period of two weeks and researchers attempted to control the distribution manually.
The sample provider SSI contacted 422 potential participants and 400 questionnaires returned completed
and 10 were partially completed, giving 410 valid surveys. Out of 422 contacted persons 12 respondents
withdrew without answering any questions. This is a positive response rate of 97.18% and a completion
rate of 94.79%.13
12 “Survey Incidence is the rate at which people qualified for the survey. This is derived from taking the total number of completes divided by the total number of completes + screen outs” (Survey Sampling International, 2012). 13 It should be noted that there is a slight difference in the number of valid surveys used to analyse each question, due to the following reasons: Firstly not all participants answered all questions. For example, a participant might have
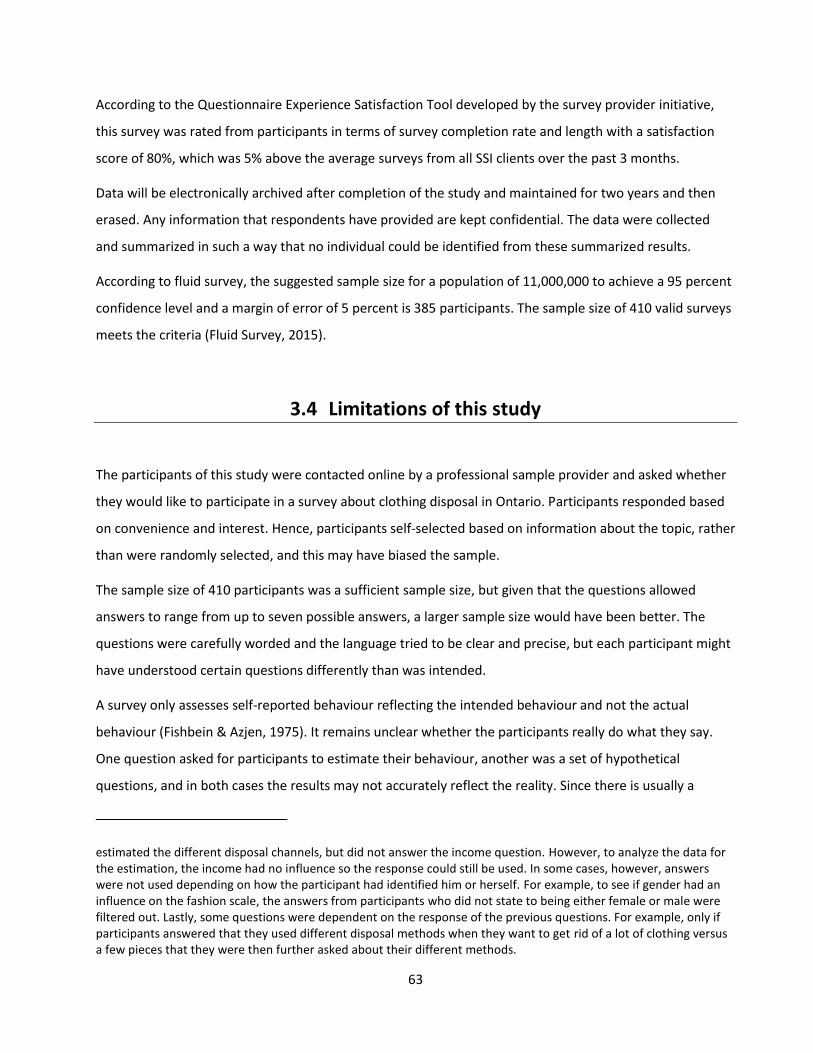
63
According to the Questionnaire Experience Satisfaction Tool developed by the survey provider initiative,
this survey was rated from participants in terms of survey completion rate and length with a satisfaction
score of 80%, which was 5% above the average surveys from all SSI clients over the past 3 months.
Data will be electronically archived after completion of the study and maintained for two years and then
erased. Any information that respondents have provided are kept confidential. The data were collected
and summarized in such a way that no individual could be identified from these summarized results.
According to fluid survey, the suggested sample size for a population of 11,000,000 to achieve a 95 percent
confidence level and a margin of error of 5 percent is 385 participants. The sample size of 410 valid surveys
meets the criteria (Fluid Survey, 2015).
3.4 Limitations of this study
The participants of this study were contacted online by a professional sample provider and asked whether
they would like to participate in a survey about clothing disposal in Ontario. Participants responded based
on convenience and interest. Hence, participants self-selected based on information about the topic, rather
than were randomly selected, and this may have biased the sample.
The sample size of 410 participants was a sufficient sample size, but given that the questions allowed
answers to range from up to seven possible answers, a larger sample size would have been better. The
questions were carefully worded and the language tried to be clear and precise, but each participant might
have understood certain questions differently than was intended.
A survey only assesses self-reported behaviour reflecting the intended behaviour and not the actual
behaviour (Fishbein & Azjen, 1975). It remains unclear whether the participants really do what they say.
One question asked for participants to estimate their behaviour, another was a set of hypothetical
questions, and in both cases the results may not accurately reflect the reality. Since there is usually a
estimated the different disposal channels, but did not answer the income question. However, to analyze the data for the estimation, the income had no influence so the response could still be used. In some cases, however, answers were not used depending on how the participant had identified him or herself. For example, to see if gender had an influence on the fashion scale, the answers from participants who did not state to being either female or male were filtered out. Lastly, some questions were dependent on the response of the previous questions. For example, only if participants answered that they used different disposal methods when they want to get rid of a lot of clothing versus a few pieces that they were then further asked about their different methods.

64
discrepancy between what people think and what they finally do, these numbers can only be seen as a
tendency.
It is even debatable whether these results between the planned and estimated disposal questions can be
adequately compared, since each question involved a unique set of hypothetical variables. For example,
the results from the question in which people were asked to give a specific percentage of the clothing they
dispose of versus the amount they donate may not be comparable to results from the series of questions in
which participants were asked the specific channels they would use to remove particular garments from
their wardrobe. In neither instance was a specific total volume of clothing specified, but the amount may
have influenced their response, nor did the hypothetical garments possess any emotional or sentimental
value for the respondents. The articles of clothing mentioned in the hypothetical scenario do not
necessarily represent a typical wardrobe, which is especially problematic given the wide demographic of
the respondents, which would have made it impossible to cater that question to each respondent
specifically.
Part of the study was to develop a fashion scale based on previous literature. As a result, each participant
of the survey received a fashion index. Since the distribution of the sample participants in terms of their
fashion index was not normally distributed, it is unclear whether the fashion scale will reflect a normal
distribution or whether the participants of the sample have a lower fashion index. It could also be that the
population is not normally distributed. Since many questions were based on the research from Lang et al.
(2013) in the US and since their participants had also a skewed distribution of their fashion trend
sensitivity, this might lead to the assumption that the fashion scale does not reflect a normal distribution of
a population. It could also be that the sample was not representative because there were a higher number
of less fashionable participants than would be expected following the normal distribution pattern. Since
this survey had more men above 55 years participate, this might have skewed the distribution of the
fashion scale (see section 4.2.1 “Developing a fashion scale”).
When comparing the aim of this study against that from Tigert et al. which was made in Toronto 40 years
ago using Rogers Diffusion Model in order to increase consumption, it becomes obvious that attitudes
towards fashion and its consumption change. Hence this study only reflects a limited time span and a
specific geographic area and results cannot be generalized out of the study conditions. The textile
consumption in North America currently might represent the peak of consumption, especially as studies
continue to try to reverse this consumer behaviour. Maybe in ten years from now fast fashion will not be a
subject anymore and textile disposal will have been resolved.

65
4 RESULTS
This section describes the results of the statistical analysis of the questionnaire. First is shown the
descriptive statistics with information about frequencies, percentages, mean and charts. Second, the
fashion scale index is developed, statistical tests are conducted and the results are presented.
4.1 Descriptive statistics
4.1.1 Demographics:
The following section will compare the survey sample with the rest of the population of Ontario, including
gender, age, income and type of residential environment.
4.1.1.1 Gender and age
The survey was intended to provide a balanced gender distribution. This goal was achieved, since 51
percent of the participants that responded to the questionnaire were women and 49 percent were men.
The gender distribution of the sample is comparable with the gender distribution of the province of
Ontario: 52 percent women and 48 percent men (Table 9).
The survey sought to create an equal distribution of men and women in each age range segment. While the
genders were balanced for 18 – 24 year old participants, the distribution between women and men had a
maximal difference of 4 percent in the age group of 45 – 54 years. In the age groups of 25 – 34 years, 35 –
44 years and 45 – 54 years, more women than men participated. However, above 55 years of age more
men than women responded (Figure 6, Table 9).
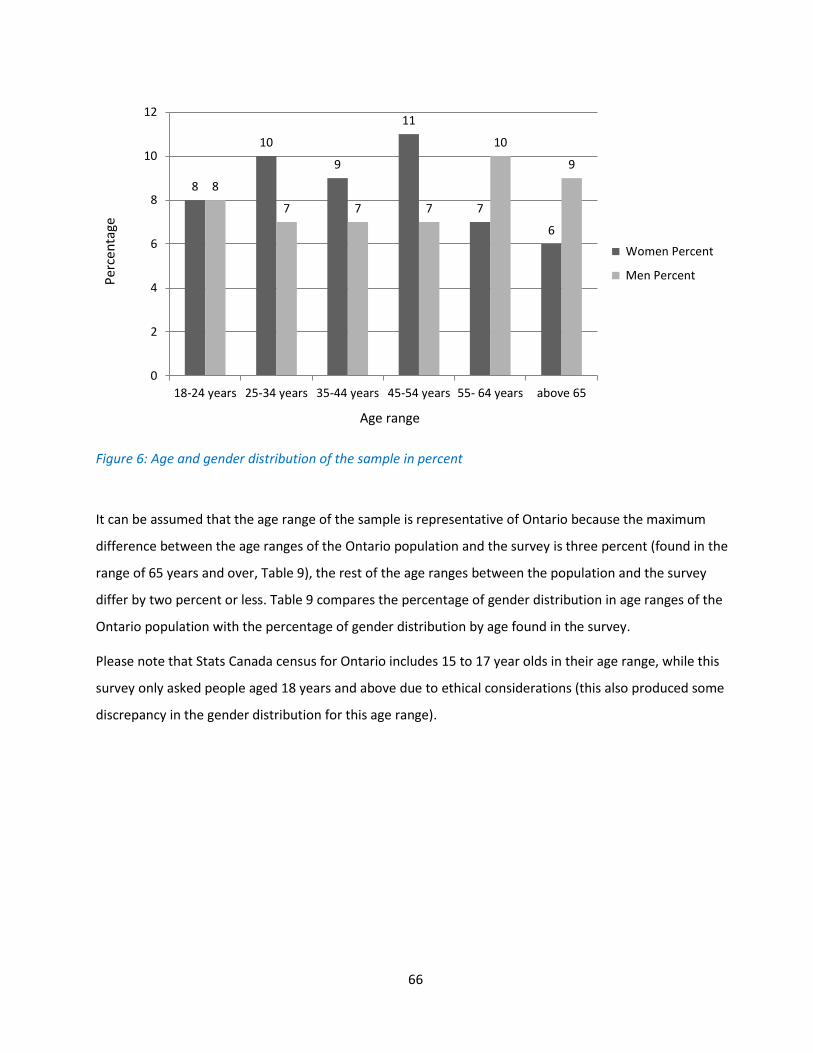
66
Figure 6: Age and gender distribution of the sample in percent
It can be assumed that the age range of the sample is representative of Ontario because the maximum
difference between the age ranges of the Ontario population and the survey is three percent (found in the
range of 65 years and over, Table 9), the rest of the age ranges between the population and the survey
differ by two percent or less. Table 9 compares the percentage of gender distribution in age ranges of the
Ontario population with the percentage of gender distribution by age found in the survey.
Please note that Stats Canada census for Ontario includes 15 to 17 year olds in their age range, while this
survey only asked people aged 18 years and above due to ethical considerations (this also produced some
discrepancy in the gender distribution for this age range).
8
10
9
11
7
6
8
7 7 7
10
9
0
2
4
6
8
10
12
18-24 years 25-34 years 35-44 years 45-54 years 55- 64 years above 65
Women Percent
Men Percent
Age range
Per
cen
tage
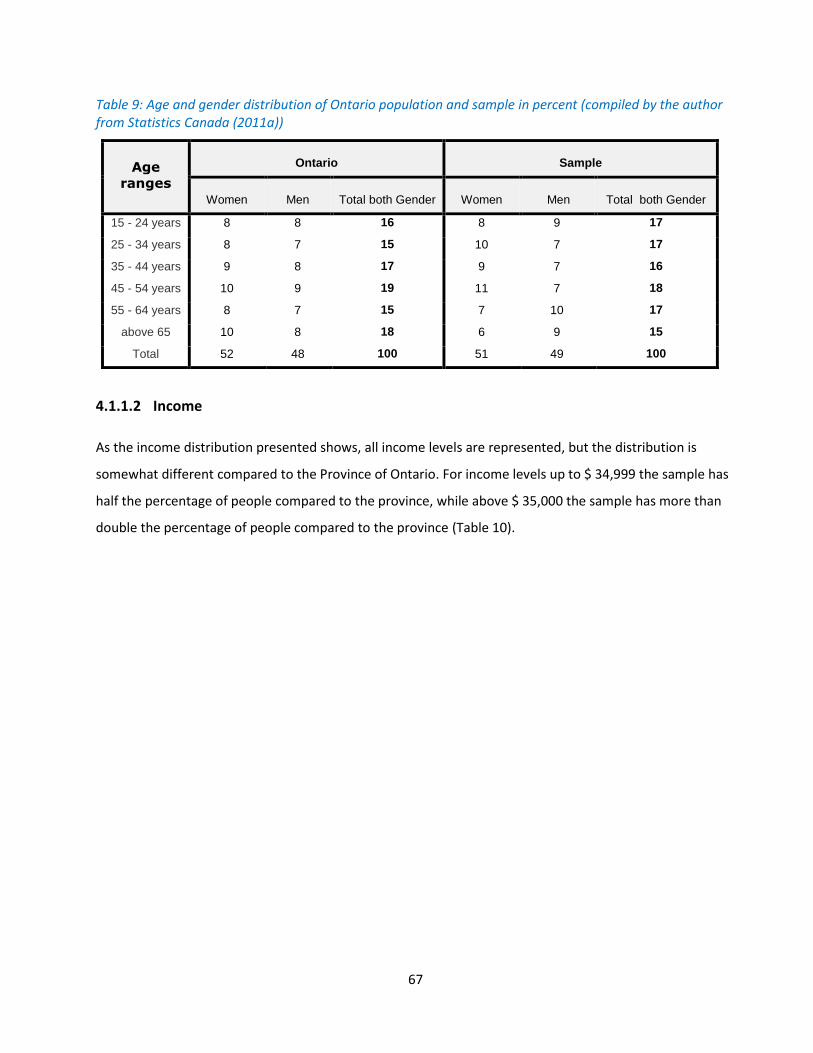
67
Table 9: Age and gender distribution of Ontario population and sample in percent (compiled by the author from Statistics Canada (2011a))
Age
ranges
Ontario
Sample
Women
Men
Total both Gender
Women
Men
Total both Gender
15 - 24 years 8 8 16 8 9 17
25 - 34 years 8 7 15 10 7 17
35 - 44 years 9 8 17 9 7 16
45 - 54 years 10 9 19 11 7 18
55 - 64 years 8 7 15 7 10 17
above 65 10 8 18 6 9 15
Total 52 48 100 51 49 100
4.1.1.2 Income
As the income distribution presented shows, all income levels are represented, but the distribution is
somewhat different compared to the Province of Ontario. For income levels up to $ 34,999 the sample has
half the percentage of people compared to the province, while above $ 35,000 the sample has more than
double the percentage of people compared to the province (Table 10).

68
Table 10: Income distribution of Ontario population and sample in percent (compiled by the author from Statistics Canada (2014a))
Income groups
Income Distribution Sample
Income Distribution
Ontario 2012
Less than $ 10,000 per year 11 20.5
Between $ 10,000 and $ 34,999 25.1 58.2
Between $ 35,000 and $ 49,999 16.2 9.4
Between $ 50,000 and $ 74,999 17 6.3
Between $ 75,000 and $ 99,999 12.3 3.1
Between $ 100,000 and $ 149,999 7.9 1.5
Between $ 150,000 and $ 199,999 6.1 0.5
Between $ 200,000 and $ 249,999 1.9 0.3
Above $ 250,000 2.6 0.2
4.1.1.3 Type of residential environment
Participants were asked about the region they live in. Little comparison can be made between the sample
distribution and the figures provided by Statistics Canada, since Statistics Canada does not distinguish
between urban areas according to population density, and offers only population totals according to cities
and regions. However, while Statistics Canada suggests that 14 percent of Ontarians live in rural areas
(Statistics Canada, 2011b), our sample had 7 percent of the respondents who claim to live in a rural area
with a population with fewer than 1000 inhabitants (Table 11). Nonetheless, the sample distribution shows
that all residential environments are represented.
Table 11: Distribution of types of residential environment of sample in percent
Type of residential environment Percent
A rural area, in a village with a population below 1000 inhabitants 7
In a town or city above 1000 - 3,999 inhabitants 4.0
In a town or city between 4,000 - 9,999 inhabitants 7
In a town or city between 10,000 - 49,999 inhabitants 10
In a city between 50,000 - 99,999 inhabitants 10
In a city between 100,000 - 499,999 inhabitants 22
In a city with 500,000 inhabitants and more 40
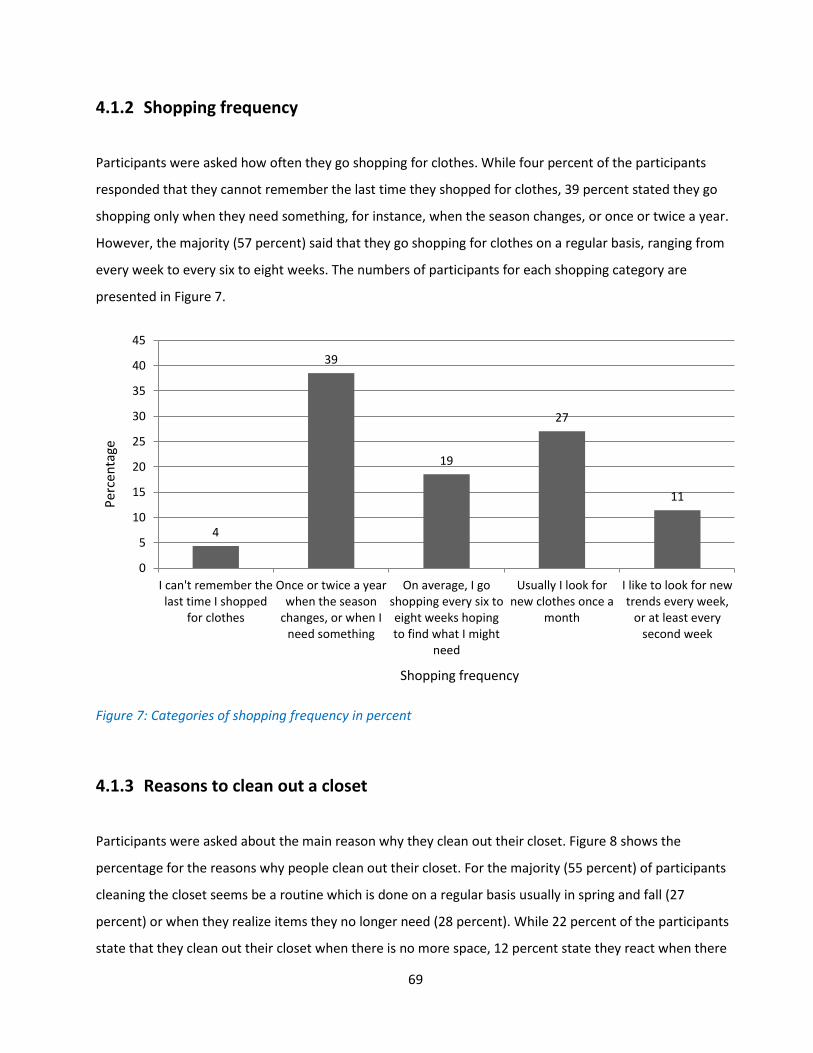
69
4.1.2 Shopping frequency
Participants were asked how often they go shopping for clothes. While four percent of the participants
responded that they cannot remember the last time they shopped for clothes, 39 percent stated they go
shopping only when they need something, for instance, when the season changes, or once or twice a year.
However, the majority (57 percent) said that they go shopping for clothes on a regular basis, ranging from
every week to every six to eight weeks. The numbers of participants for each shopping category are
presented in Figure 7.
Figure 7: Categories of shopping frequency in percent
4.1.3 Reasons to clean out a closet
Participants were asked about the main reason why they clean out their closet. Figure 8 shows the
percentage for the reasons why people clean out their closet. For the majority (55 percent) of participants
cleaning the closet seems be a routine which is done on a regular basis usually in spring and fall (27
percent) or when they realize items they no longer need (28 percent). While 22 percent of the participants
state that they clean out their closet when there is no more space, 12 percent state they react when there
4
39
19
27
11
0
5
10
15
20
25
30
35
40
45
I can't remember thelast time I shopped
for clothes
Once or twice a yearwhen the season
changes, or when Ineed something
On average, I goshopping every six toeight weeks hopingto find what I might
need
Usually I look fornew clothes once a
month
I like to look for newtrends every week,
or at least everysecond week
Per
cen
tage
Shopping frequency
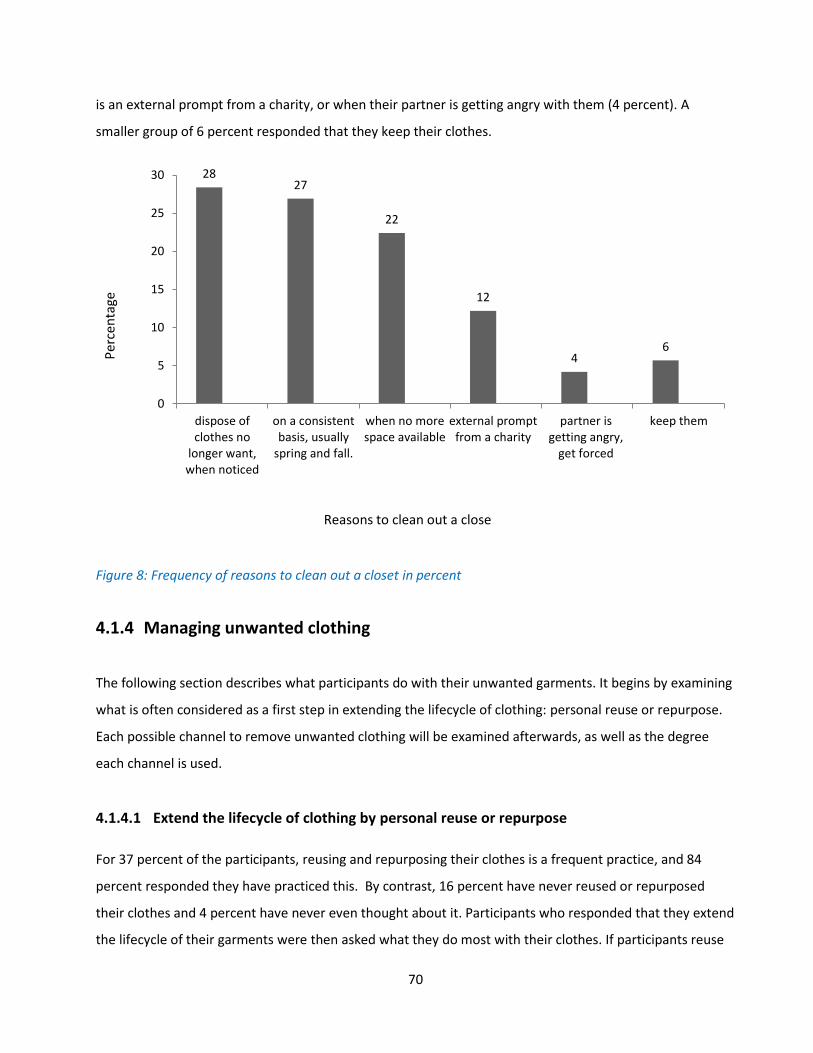
70
is an external prompt from a charity, or when their partner is getting angry with them (4 percent). A
smaller group of 6 percent responded that they keep their clothes.
Figure 8: Frequency of reasons to clean out a closet in percent
4.1.4 Managing unwanted clothing
The following section describes what participants do with their unwanted garments. It begins by examining
what is often considered as a first step in extending the lifecycle of clothing: personal reuse or repurpose.
Each possible channel to remove unwanted clothing will be examined afterwards, as well as the degree
each channel is used.
4.1.4.1 Extend the lifecycle of clothing by personal reuse or repurpose
For 37 percent of the participants, reusing and repurposing their clothes is a frequent practice, and 84
percent responded they have practiced this. By contrast, 16 percent have never reused or repurposed
their clothes and 4 percent have never even thought about it. Participants who responded that they extend
the lifecycle of their garments were then asked what they do most with their clothes. If participants reuse
2827
22
12
46
0
5
10
15
20
25
30
dispose ofclothes no
longer want,when noticed
on a consistentbasis, usually
spring and fall.
when no morespace available
external promptfrom a charity
partner isgetting angry,
get forced
keep them
Per
cen
tage
Reasons to clean out a close

71
or repurpose their unwanted clothing they often wear it for hands-on work (32 percent). They often pass
them to friends and family members (18 percent), but a high proportion of respondents claimed that they
rarely use them as cleaning rags (20 percent), and never restyle them into something new (38 percent)
(Table 12).
Table 12: Frequency of the options used to extend the lifecycle of clothing in percent
Frequency
Options to extend lifecycle of clothing
Passing on
garments
Wearing garments
for hands-on work
Using garments as
cleaning rags
Restyling garments
into new things
never 10 4 12 38
rarely 19 9 20 22
sometimes 33 40 36 22
most often 20 15 10 5
often 18 32 23 12
Figure 9 shows that the majority of respondents reuse or repurpose their garments, and often wear their
clothes for hands-on work, but never restyle their clothing.
percenpercent
agepercentage
tage

72
Per
cen
tage
Figure 9: Comparison between frequencies of options used to extend the clothing lifecycle in percent
4.1.4.2 Swapping
Participants were asked whether they have ever visited a swap event. Nearly one third responded they did
not know what swapping is. Nearly a fifth of all participants (18 percent) have visited a swap event and only
4 percent did not like it. About one third of all participants are interested in visiting a swap event.
4.1.4.3 Take–back program
Participants were asked their opinion about bringing used clothing back to a retailer and receiving some
incentives for them. The majority of participants (70 percent) think take-back programs are a great idea.
While 17 percent stated they have never heard about this possibility, 11 percent think nobody wants their
old clothing and 3 percent think it is too complicated to bring used clothing back to a retailer. That 11
104
12
3819
9
20
2233
40
36
2320
15
10
5
18
32
23
12
0
10
20
30
40
50
60
70
80
90
100
Pass on Wear for hands onwork
Use as cleaning rags Restyle into newthings
Options to extend the lifecycle of clothing
often
most often
sometimes
rarely
never
73
percent of the participants see no value in their old clothing is of particular interest. In the next question,
participants were asked if they have ever participated in a take-back program and 12 percent said they
have done this before, while 88 percent declared they have never done this before. The reasons for this
lack of involvement are not fully clear, because while 70 percent think take-back programs are a great idea,
only 31 percent stated they did not know of a retailer who offered this opportunity. It is unclear if the other
39 percent know where a take-back program is offered and simply have other barriers to participating.
4.1.4.4 Resell
Participants were asked whether they have ever re-sold a garment in a second-hand store or online and 38
percent answered they have tried to do so but only 7 percent thought reselling used garments works very
well. This means 62 percent have never tried to resell their unwanted garments.
4.1.4.5 Convenience and accessibility of donation boxes
The majority of all participants (75 percent) responded they know at least the place of one donation box
and it is reasonable to reach, while 12 percent responded they know where they could donate their
unwanted garments but the place is not very convenient to reach. 8 percent do not even know one place
where to donate their clothes, and 5 percent of the participants rely on charities to call and arrange to pick
up their donations.
4.1.4.6 Disposal
Almost all participants said that they throw some garments into the waste. As a follow-up question, those
participants were asked why they do so. However, 18 percent of these participants responded that this
question is not applicable for them. This discrepancy might suggest the attitude of these participants
toward textile disposal (their claim that no textiles should be disposed) versus their actual behaviour in
regards to disposing unwanted clothing. These participants might assume that they have only a very small
amount of clothing for disposal, which they then assume does not count as actual disposal, or at least not
enough to be concerned about. The main reason for disposal of unwanted garments, given by nearly 50
percent of all participants, was that these clothes are in such bad condition that nobody could wear them
anymore. At least 16 percent of all participants stated that they want to get rid of their clothing
immediately and in the most convenient way. Of particular concern is the high number of participants (9

74
percent) who are not even aware about other possibilities what could be done with their clothes except
disposal (Figure 10).
Figure 10: Reasons for clothing disposal in percent
The majority of participants (89 percent) said they discard their own unwanted clothing. However, when
participants were asked whether they discard old clothes for others, 21 percent of all participants said they
usually do so for their spouses, children, or other family members. This number contradicts the 11 percent
of all respondent who stated that someone else disposes of their unwanted garments, suggesting that
people are perhaps not as aware of how their clothing is managed as they think they are.
4.1.5 Channels for managing unwanted clothing
Participants were asked what they do with their clothes when they want to get rid of them. They provided
an estimate of the degree to which channels they chose, using a range from 0 to 100 percent (Table 13). On
average, people estimated that they participate less in take-back programs, swapping, or reselling than
9 107 6
2
49
18
2
0
10
20
30
40
50
60
There seemsto be no
other option.I never
thoughtabout doing
anything elsewith them.
It is the mostconvenientway. It's toomuch time
and effort todrive around
donatingclothes.
I want to getrid of myclothes
immediately.
I don't thinkmy old
clothes haveany value. Ithrow them
out whenthey are out
of fashion
I don't wantanybody to
wear my oldclothes.
When Ieventuallydecide tothrow my
clothes away,they are insuch a bad
condition thatnobody could
wear themanymore.
Notapplicable
Other
Per
cen
tage
Reasons for disposal

75
they did in donating and disposing their garments; however the range of responses was quite variable. The
participants estimated that they donate on average nearly 60 percent of their unwanted clothes and throw
away about one quarter of their unwanted material (Table 13, Figure 11). However, when respondents
were later asked about their practices using examples of unwanted clothes, the donation number dropped
and the disposal number increased (see Table 15).
Table 13: Mean usage and standard deviation of channels for getting rid of clothing in percent
Channels
Resell Take -back Swap Donate
Throw out /
disposal
Mean 8 4 4 59 25
Std. Deviation 17.8 10.1 10.6 34.1 29.4
Figure 11: Mean usage of channels for getting rid of clothing in percent
4.1.5.1 Number of channels
About a fifth of all participants (21 percent) answered that they use only one channel to remove their
unwanted garments. If participants claimed to use only one channel to remove 100 percent of their
unwanted clothing, 30 percent choose disposal and 64 percent donate. About half of all participants use
two channels to get rid of their clothing (46 percent). If participants use two channels to get rid of their
84
4
59
25
Mean in percent
Resell
Take -back
Swap
Donate
Disposal

76
clothing all consider donation while 90 percent consider disposal. Of the 12 percent of participants who
consider three channels, all consider donation and 86 percent consider disposal. When participants
consider four channels (11 percent), all consider donation and 84 percent consider disposal. All five
channels are used by 10 percent of the participants. Donation is the channel which most often mentioned
independent of the number of channels a participant uses to get rid of unwanted clothing. Further, it
shows that most participants use two channels to manage their unwanted clothing, but that about a third
of the participants uses more than two channels.
4.1.5.2 Selection of reuse, recycle, and disposal channels
Participants were given a set of hypothetical garments in varying degrees of use and were asked to select
from a variety of reuse, recycle, and disposal options (Table 14). In total, 402 participants had to manage
3,618 garments (Each participant had to make decisions about nine different garments).
Most participants would prefer to throw away heavily used socks (71 percent) and used underwear (57
percent). They also said they would donate a dress which is out of fashion (70 percent), a sweater that has
lost its colour (50 percent), or an expensive wool coat with signs of use (63 percent). There is less
agreement when participants want to get rid of a pair of ripped jeans: most participants will throw them
into the waste (35 percent) but they might also be reused and repurposed (27 percent) or donated (26
percent). While a shirt with stains is more likely to be thrown away (34 percent), a winter coat with a
broken front zipper is most likely to be donated (46 percent). An unworn shirt, however, will likely be
donated (56 percent) or reused and repurposed (18 percent) rather than resold (9 percent).
Removing the portion of “Not applicable” responses (where respondents chose not to answer for a given
garment) provides a better understanding of what participants actually do with their unwanted clothing by
providing a more accurate percentage of the use of each channel.
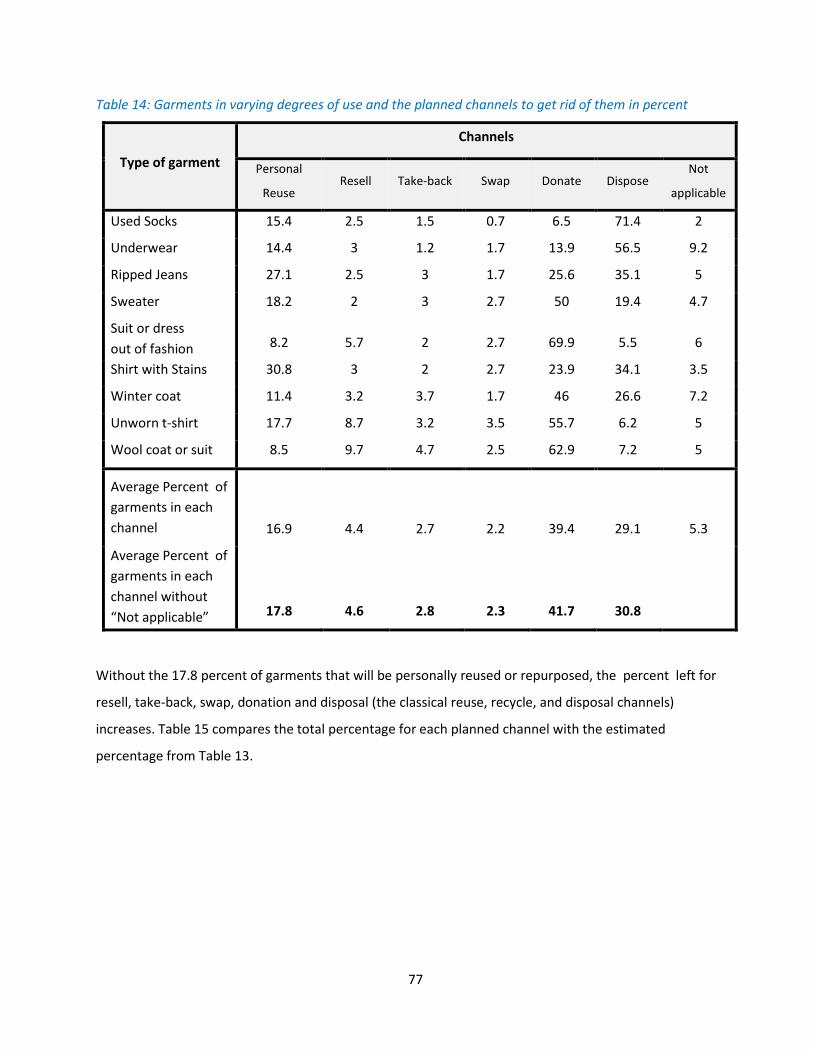
77
Table 14: Garments in varying degrees of use and the planned channels to get rid of them in percent
Type of garment
Channels
Personal
Reuse Resell Take-back Swap Donate Dispose
Not
applicable
Used Socks 15.4 2.5 1.5 0.7 6.5 71.4 2
Underwear 14.4 3 1.2 1.7 13.9 56.5 9.2
Ripped Jeans 27.1 2.5 3 1.7 25.6 35.1 5
Sweater 18.2 2 3 2.7 50 19.4 4.7
Suit or dress
out of fashion 8.2 5.7 2 2.7 69.9 5.5 6
Shirt with Stains 30.8 3 2 2.7 23.9 34.1 3.5
Winter coat 11.4 3.2 3.7 1.7 46 26.6 7.2
Unworn t-shirt 17.7 8.7 3.2 3.5 55.7 6.2 5
Wool coat or suit 8.5 9.7 4.7 2.5 62.9 7.2 5
Average Percent of
garments in each
channel 16.9 4.4 2.7 2.2 39.4 29.1 5.3
Average Percent of
garments in each
channel without
“Not applicable” 17.8 4.6 2.8 2.3 41.7 30.8
Without the 17.8 percent of garments that will be personally reused or repurposed, the percent left for
resell, take-back, swap, donation and disposal (the classical reuse, recycle, and disposal channels)
increases. Table 15 compares the total percentage for each planned channel with the estimated
percentage from Table 13.

78
Table 15: Comparison between planned and estimated use of all disposal, reuse, and recycling channels in percent
Channels
Planned use of
each channel
Planned use of each
channel excluding
personal reuse
Estimate for intended
use of each channel
(from Table 13)
Difference
Personal Reuse 17.8
Resell 4.6 6 8 2
Take-back 2.8 3 4 1
Swap 2.3 3 4 1
Donate 41.7 51 59 8
Dispose 30.8 38 25 -13
There is a significant gap between what people plan to do with their unwanted garments and the
percentage they estimated they would use reuse, recycling and disposal channels. The degree to which
people claimed they would throw out particular garments was 13 percent higher than the percentage they
originally estimated without mentioning particular garments; for donation, meanwhile, this difference was
8 percent lower than what they had originally estimated (Table 15, Figure 12).
Figure 12: Comparison between planned and estimated use of reuse, recycle, and disposal channels in percent
63 3
51
38
84 4
59
25
0
10
20
30
40
50
60
70
Resell Take-back Swap Donate Dispose
Planned
Estimate
Pe
rcen
tage
Channels
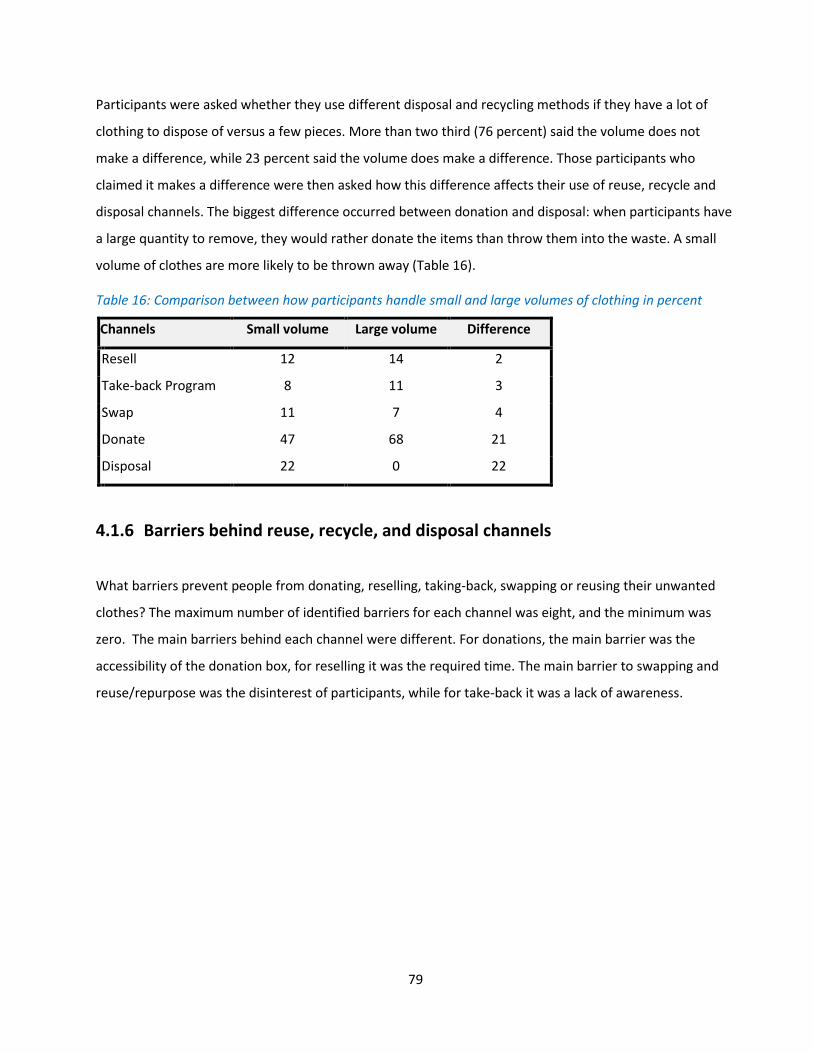
79
Participants were asked whether they use different disposal and recycling methods if they have a lot of
clothing to dispose of versus a few pieces. More than two third (76 percent) said the volume does not
make a difference, while 23 percent said the volume does make a difference. Those participants who
claimed it makes a difference were then asked how this difference affects their use of reuse, recycle and
disposal channels. The biggest difference occurred between donation and disposal: when participants have
a large quantity to remove, they would rather donate the items than throw them into the waste. A small
volume of clothes are more likely to be thrown away (Table 16).
Table 16: Comparison between how participants handle small and large volumes of clothing in percent
Channels Small volume Large volume Difference
Resell 12 14 2
Take-back Program 8 11 3
Swap 11 7 4
Donate 47 68 21
Disposal 22 0 22
4.1.6 Barriers behind reuse, recycle, and disposal channels
What barriers prevent people from donating, reselling, taking-back, swapping or reusing their unwanted
clothes? The maximum number of identified barriers for each channel was eight, and the minimum was
zero. The main barriers behind each channel were different. For donations, the main barrier was the
accessibility of the donation box, for reselling it was the required time. The main barrier to swapping and
reuse/repurpose was the disinterest of participants, while for take-back it was a lack of awareness.

80
Table 17: Barriers for reuse, recycle and disposal channels in percent
Channels
Barriers
No
barriers
Time
required
Ease of
access
Financial
benefit
No
interest
Clothes
no
value
Too
much
effort
Not
aware Other
Donation 66 12 14 3 4 5 5 2 3
Reselling 14 32 13 19 22 13 21 8 2
Take-back 15 16 13 5 19 7 10 31 2
Swapping 15 16 14 5 24 6 14 24 3
Reuse-
Repurpose 56 13 6 4 14 4 9 6 2
When it comes to donating, 66 percent of all participants replied that they have no barrier to donating
their clothing, while the remainder cited numerous reasons including accessibility of donation spots (14
percent), the time needed to donate (12 percent) and the perception that their clothes had no value (5
percent) (Table 17).
Reselling had the highest numbers of participants with barriers (86 percent) (Table 17) and the highest
factor of barriers (1.6). This means the participants identified on average nearly two barriers impeding
them from practicing reuse. Factors included the required time (32 percent), lack of interest (22 percent),
required effort (21 percent) and the small financial benefit (19 percent) as the main reasons for not
reselling their unwanted clothing (Table 17).
The biggest barrier for take-back programs is a lack of awareness (31 percent) and a lack of interest (19
percent), followed by the required time (16 percent). Accessibility was a problem for 13 percent of all
participants (Table 17). Take back programs and swapping had the lowest factor of barriers with 1.2.
For swapping, 24 percent of all participants stated a lack of interest and the same percentage claim they
are unaware of this method (Table 17).
More than half of all participants (56 percent) have no barrier to reusing or repurposing their unwanted
garments, but 14 percent state that they have no interest in doing so (Table 17).

81
4.2 Statistical Analysis
The following section presents statistical tests that analyze whether consumers who score high on the
fashion scale manage their unwanted clothing differently than those scoring low on the fashion scale.
4.2.1 Developing a fashion scale
The survey aimed to identify a person’s fashion interest and shopping behaviour to determine whether
fashion consumers and non-fashion consumers have different practices to manage their unwanted
clothing. Fashion interest and shopping behaviour were combined into one factor called fashion scale.
Sixteen questions were asked about a person’s fashion scale and respondents answered these questions on
a 5-point Likert scale. As described in Methods section 3.2.2 “Part II: Developing a fashion scale”, the scale
was created by adding together all points from the sixteen statements. The maximum sum which could be
achieved for the fashion scale was eighty (sixteen times five) points of discriminations or dispersions. The
concepts of continuousness and equal intervals between points underlie this scale, and therefore it meets
the assumptions recommended by Grace-Martin (2008) for the use of parametric statistical procedures in
combination with Likert scales. Hence, it can be justified that the fashion scale is considered as a set of
ordered categories, therefore it is legitimate to proceed with parametric statistical methods, such as mean,
Pearson correlation, T-test, and ANOVA.
The mean for each question is listed in Table 18. Questions were answered on a 5-point Likert scale with
the highest possible value of 5 (strongly agree) and the lowest value of 1 (strongly disagree). The means
vary between 2.4 and 2.9 with standard deviations between 1.2 and 1.4.

82
Table 18: Mean and standard deviation of each question identifying a person’s fashion interest and shopping frequency (1 = low, 5 = high)
Questions to identify a person’s fashion interest and shopping behaviour Mean
Std.
Deviation
I seek out new fashion trends and I spend a fairly high proportion of my income
and time on fashion 2.6 1.3
I read the fashion news regularly and try to keep my wardrobe up-to-date with
fashion trends 2.6 1.3
I usually try to be different from others by wearing fashionable clothing 2.8 1.3
I am interested in shopping at fashion specialty stores rather than department
stores for my fashion needs 2.8 1.3
I am usually the first among my friends to buy the latest clothing styles 2.5 1.3
Compared to my friends, I own more of the latest fashion styles 2.7 1.3
I think I am a trendsetter and my clothes are very fashionable 2.9 1.2
I am usually the first to know the latest fashion trends 2.6 1.2
Friends regard me as a good source of fashion advice 2.8 1.3
I like to buy new clothing early, just when the fashion trend begins 2.7 1.3
I follow the fashion styles of celebrities and I find they influence my fashion
purchasing habits 2.4 1.3
I often influence the types of clothing styles my friends buy 2.6 1.3
I usually buy clothing because I am thrilled by a new fashion trend 2.7 1.3
I buy new clothing often, even if I don’t need it 2.7 1.4
I am not concerned if clothing is practical or timeless, and can still be worn in the
next season. 3.1 1.3
I purchase new clothing more often than my friends 2.7 1.3
In order to determine if these questions can be summarized into one factor, the correlation between all
questions was calculated using parametric Pearson correlation. The results suggest that all questions
correlated positively with p < 0.0001 (see section “Appendix B: Correlation Table of fashion scale”). Grace-
Martin (2008) recommends that if Likert data is used in parametric analysis the results should require alpha
levels below 0.01 or even below 0.005, instead of 0.05.
Next, a Principal Component Analysis (PCA) was conducted to analyze whether all questions load on one
factor (Rencher, 2002). PCA analyzes the similarity of a data table (in this case the responses to the
questions). The main result of PCA is communalities that describe the correlation between a single item
and an extracted variable, the principal component—in this case the fashion scale. The values of the
communalities vary between 0 and 1. They can be interpreted in a similar way as r2, describing the
explanation of variance. Except one question (marked in bold) which has an extraction factor of 0.11, all
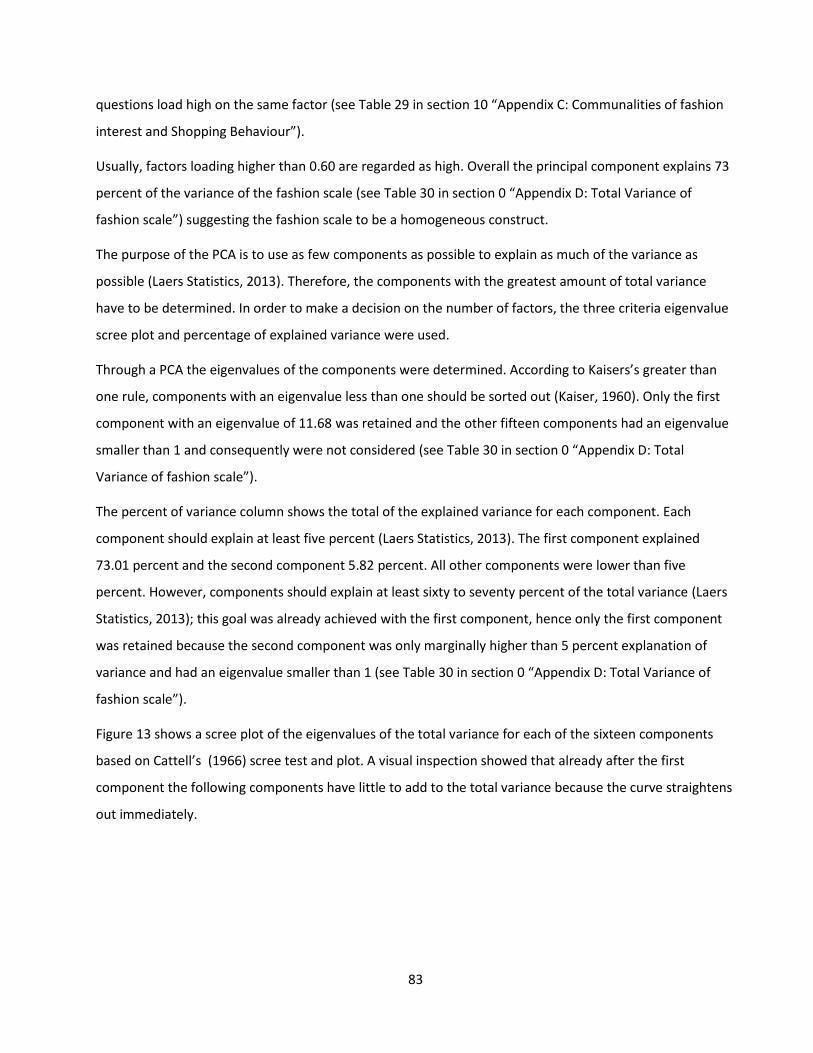
83
questions load high on the same factor (see Table 29 in section 10 “Appendix C: Communalities of fashion
interest and Shopping Behaviour”).
Usually, factors loading higher than 0.60 are regarded as high. Overall the principal component explains 73
percent of the variance of the fashion scale (see Table 30 in section 0 “Appendix D: Total Variance of
fashion scale”) suggesting the fashion scale to be a homogeneous construct.
The purpose of the PCA is to use as few components as possible to explain as much of the variance as
possible (Laers Statistics, 2013). Therefore, the components with the greatest amount of total variance
have to be determined. In order to make a decision on the number of factors, the three criteria eigenvalue
scree plot and percentage of explained variance were used.
Through a PCA the eigenvalues of the components were determined. According to Kaisers’s greater than
one rule, components with an eigenvalue less than one should be sorted out (Kaiser, 1960). Only the first
component with an eigenvalue of 11.68 was retained and the other fifteen components had an eigenvalue
smaller than 1 and consequently were not considered (see Table 30 in section 0 “Appendix D: Total
Variance of fashion scale”).
The percent of variance column shows the total of the explained variance for each component. Each
component should explain at least five percent (Laers Statistics, 2013). The first component explained
73.01 percent and the second component 5.82 percent. All other components were lower than five
percent. However, components should explain at least sixty to seventy percent of the total variance (Laers
Statistics, 2013); this goal was already achieved with the first component, hence only the first component
was retained because the second component was only marginally higher than 5 percent explanation of
variance and had an eigenvalue smaller than 1 (see Table 30 in section 0 “Appendix D: Total Variance of
fashion scale”).
Figure 13 shows a scree plot of the eigenvalues of the total variance for each of the sixteen components
based on Cattell’s (1966) scree test and plot. A visual inspection showed that already after the first
component the following components have little to add to the total variance because the curve straightens
out immediately.

84
Figure 13: Scree plot of total variance of fashion scale
While different criteria can help to determine the number of components which should be retained, the
final decision is subjective to the researcher (Laers Statistics, 2013). Since two criteria suggested one
component and one criterion recommended one or two components it was decided to use one component
with all questions. Consequently, the fashion scale was created by adding the values of all questions and
dividing this value by the number of questions (16).
The values of the fashion scale of the sample are all close to the linear slope that indicates a normal
distribution (Figure 14), however, the fashion scale of the sample is not normally distributed as it has a
skewness of 0.081.
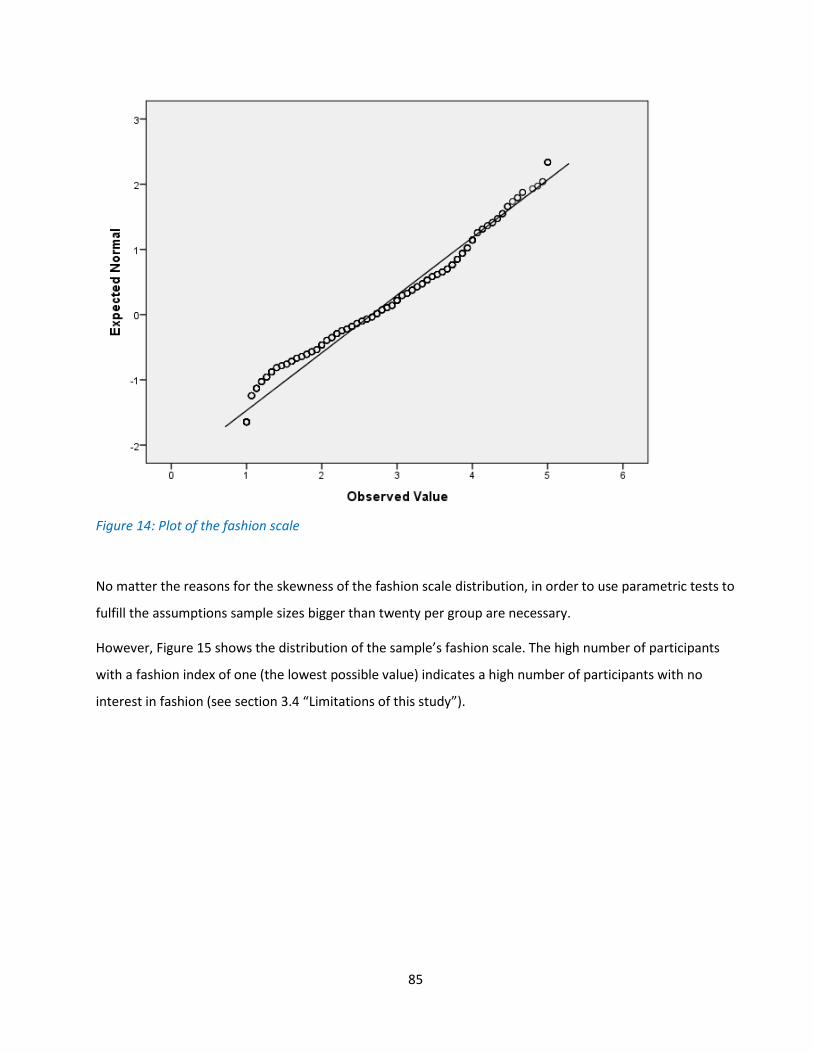
85
Figure 14: Plot of the fashion scale
No matter the reasons for the skewness of the fashion scale distribution, in order to use parametric tests to
fulfill the assumptions sample sizes bigger than twenty per group are necessary.
However, Figure 15 shows the distribution of the sample’s fashion scale. The high number of participants
with a fashion index of one (the lowest possible value) indicates a high number of participants with no
interest in fashion (see section 3.4 “Limitations of this study”).
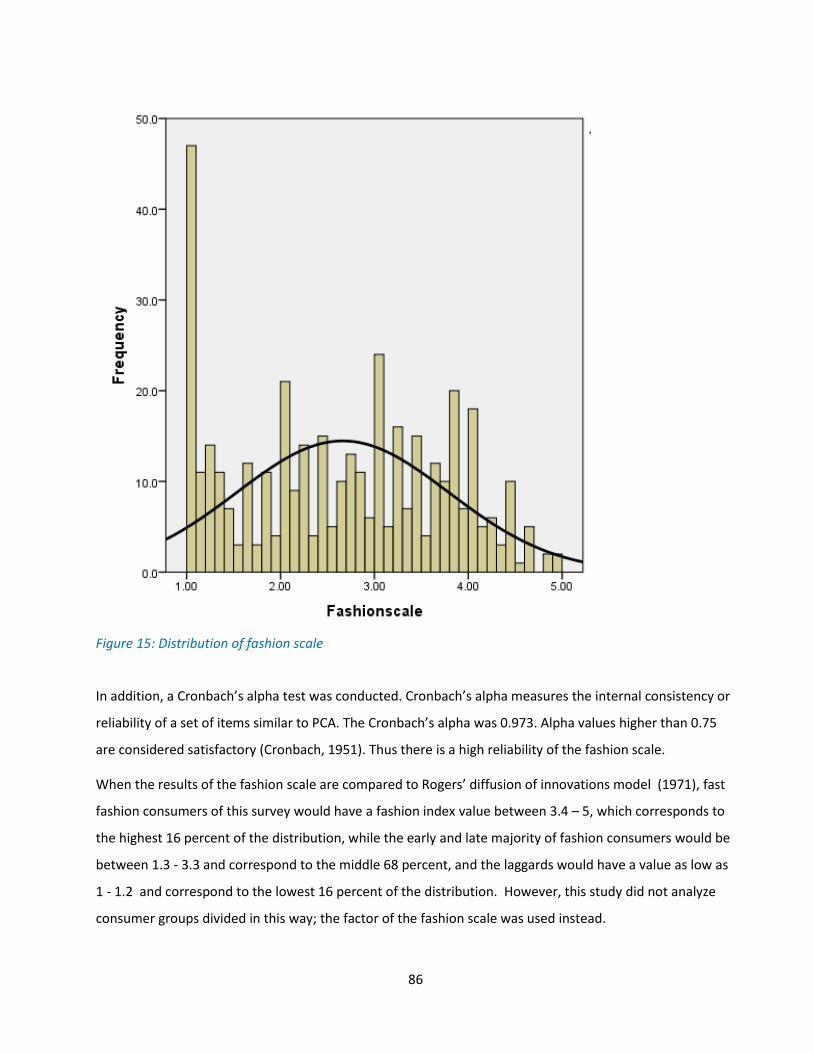
86
Figure 15: Distribution of fashion scale
In addition, a Cronbach’s alpha test was conducted. Cronbach’s alpha measures the internal consistency or
reliability of a set of items similar to PCA. The Cronbach’s alpha was 0.973. Alpha values higher than 0.75
are considered satisfactory (Cronbach, 1951). Thus there is a high reliability of the fashion scale.
When the results of the fashion scale are compared to Rogers’ diffusion of innovations model (1971), fast
fashion consumers of this survey would have a fashion index value between 3.4 – 5, which corresponds to
the highest 16 percent of the distribution, while the early and late majority of fashion consumers would be
between 1.3 - 3.3 and correspond to the middle 68 percent, and the laggards would have a value as low as
1 - 1.2 and correspond to the lowest 16 percent of the distribution. However, this study did not analyze
consumer groups divided in this way; the factor of the fashion scale was used instead.

87
The following section analyzes the dependency of the fashion scale on different variables such as age,
gender, income, marital status, and type of residential environment.
4.2.1.1 Is the fashion scale dependent on gender?
A t-test was conducted in order to analyze whether gender influences the fashion scale, with gender as
factor and fashion scale as dependent variable. The results show that women (�̅� = 2.8115, N = 208) have a
significantly higher fashion scale value index than men (�̅�= 2.5127, N = 200; t-test: p = 0.008, df =1, t = 2.7).
4.2.1.2 Is the fashion scale dependent on age?
An analysis of variance (ANOVA) was conducted to analyze whether gender influences the fashion scale,
with age group as factor and fashion scale as dependent variable. Six age groups were used. The results
indicate a significant difference between age groups with regard to the fashion scale (N = 409; F = 24.4; df =
5; p < 0.0001). Table 19 indicates that younger participants have higher values on the fashion scale.
Table 19: Mean of the fashion scale according to age range (1 = low, 5 = high)
Age ranges Mean
18-24 years 3.3
25-34 years 3.1
35-44 years 3.1
45-54 years 2.6
55-64 years 2.0
above 65 1.8
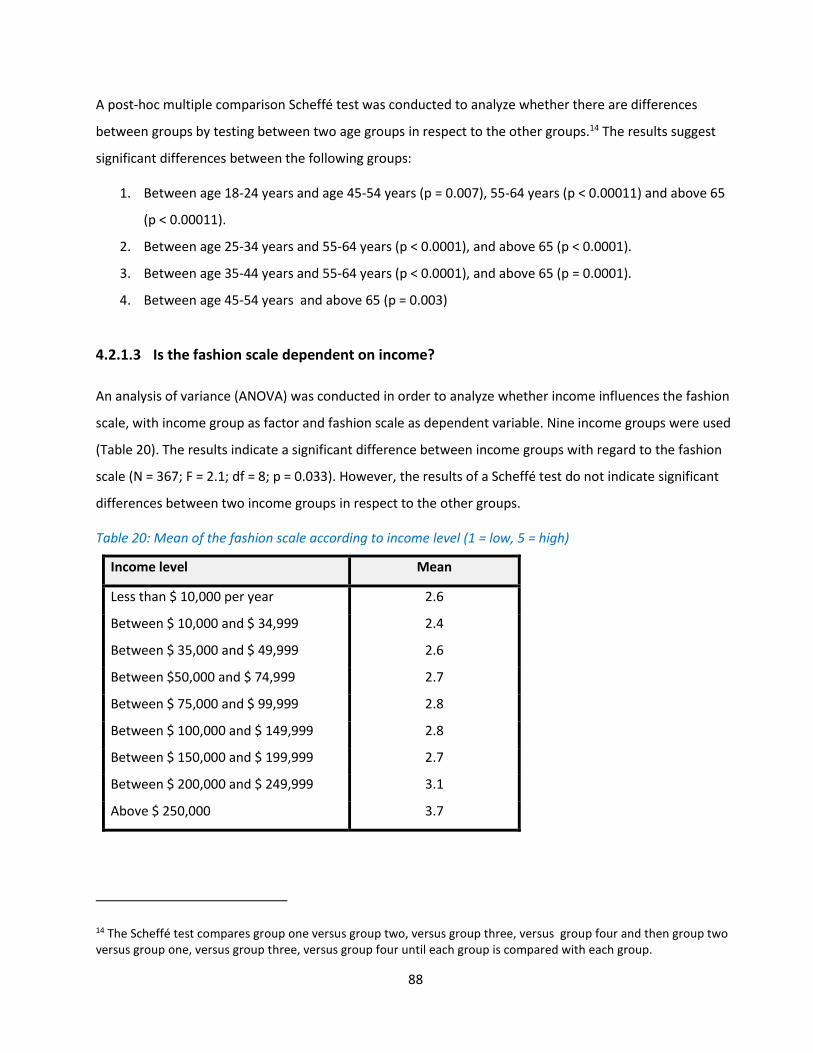
88
A post-hoc multiple comparison Scheffé test was conducted to analyze whether there are differences
between groups by testing between two age groups in respect to the other groups.14 The results suggest
significant differences between the following groups:
1. Between age 18-24 years and age 45-54 years (p = 0.007), 55-64 years (p < 0.00011) and above 65
(p < 0.00011).
2. Between age 25-34 years and 55-64 years (p < 0.0001), and above 65 (p < 0.0001).
3. Between age 35-44 years and 55-64 years (p < 0.0001), and above 65 (p = 0.0001).
4. Between age 45-54 years and above 65 (p = 0.003)
4.2.1.3 Is the fashion scale dependent on income?
An analysis of variance (ANOVA) was conducted in order to analyze whether income influences the fashion
scale, with income group as factor and fashion scale as dependent variable. Nine income groups were used
(Table 20). The results indicate a significant difference between income groups with regard to the fashion
scale (N = 367; F = 2.1; df = 8; p = 0.033). However, the results of a Scheffé test do not indicate significant
differences between two income groups in respect to the other groups.
Table 20: Mean of the fashion scale according to income level (1 = low, 5 = high)
Income level Mean
Less than $ 10,000 per year 2.6
Between $ 10,000 and $ 34,999 2.4
Between $ 35,000 and $ 49,999 2.6
Between $50,000 and $ 74,999 2.7
Between $ 75,000 and $ 99,999 2.8
Between $ 100,000 and $ 149,999 2.8
Between $ 150,000 and $ 199,999 2.7
Between $ 200,000 and $ 249,999 3.1
Above $ 250,000 3.7
14 The Scheffé test compares group one versus group two, versus group three, versus group four and then group two versus group one, versus group three, versus group four until each group is compared with each group.

89
4.2.1.4 Is the fashion scale dependent on the type of residential environment?
The type of residential environment was divided into seven categories (see Table 21). An ANOVA was
conducted in order to analyze whether the residential environment influences the fashion scale, with the
type of residential environment as factor and fashion scale as dependent variable. The results indicate a
significant difference between the types of residential environment groups with regard to the fashion scale
(N = 401; F = 3.2; df =6; p= 0.004). However, the results of a Scheffé test do not indicate significant
differences between two groups of residential environment.
Table 21: Mean of the fashion scale according to type of residential environment (1 = low, 5 = high)
Residential environment Mean
A rural area, in a village with a population below 1000 inhabitants 1.8
In a town or city above 1000 - 3,999 inhabitants 2.7
In a town or city between 4,000 - 9,999 inhabitants 2.9
In a town or city between 10,000 - 49,999 inhabitants 2.6
In a city between 50,000 - 99,999 inhabitants 2.8
In a city between 100,000 - 499,999 inhabitants 2.7
In a city with 500,000 inhabitants and more 2.8
4.2.1.5 Is the fashion scale dependent on marital status?
An ANOVA was conducted to analyze whether marital status influences the fashion scale, with marital
status as factor and fashion scale as dependent variable. Five groups were used for marital status (Table
22). The results indicate a significant difference between marital status groups with regard to the fashion
scale (N = 379; F = 9.6; df = 4; p < 0.0001). The results of the Scheffé test suggest significant differences
between the following groups:
Single living with parents and Single living with partner (p < 0.0001);
Living with partner and living with partner and children (p = 0.002).

90
Table 22: Mean of the fashion scale according to marital status (1 = low, 5 = high)
Marital status Mean
Single 2.7
Single living with parents 3.5
Single with children 2.7
Living with partner 2.3
Living with partner and children 3.0
4.2.2 Managing unwanted clothing
The following section will explore whether the different methods to manage unwanted clothing (swapping,
take-back programs, resell, donating, disposal, reuse and repurpose) depend on people’s fashion scale,
gender, or age.
4.2.2.1 Does participation in swap events depend on a person’s fashion scale?
The following section analyses the connection between participation in swap events and fashion scale. The
results of ANOVA suggest that there is a significant difference between participants visiting swap events
and their fashion scale (F = 17.4; df = 4; p < 0.0001). Participants who have visited a swap event have a
higher fashion scale (see Table 23).
Table 23: Mean of the fashion scale according to involvement in swap events (1 = low, 5 = high)
Categories for swap events Mean
I don't know what this is 2.3
No, I haven't and I have no interest 2.3
No, I haven't but I would like to visit one. 3.0
Yes, I have but I didn't like it 3.4
Yes, I have and I liked it 3.3
A Post-Hoc Scheffé test suggests a significant difference between the following groups:
“Have visited a swap event liked it” and participants that “don’t know what swapping is” (p <
0.0001) and those that “have no interest in swapping” (p < 0.0001).

91
“Haven’t visited a swap event, but would like to visit one” with participants that “don’t know what
swapping is” (p < 0.0001) and those that “have no interest in swapping” (p < 0.0001).
Figure 16 shows the relationship between the fashion scale and the interest in swapping. The curve
changes its direction with the responses that indicated an interest in visiting a swap event. This suggests
that there are two groups of participants, those interested in swapping and those without interest.
Likewise, participants with higher fashion scale are more interested in swapping. However, the value on
the fashion scale might indicate whether someone is interested in swapping, but it cannot predict whether
someone likes swapping.
Mea
n
Categories for swap events
Figure 16: Mean of the fashion scale according to attitudes and behaviours towards swap events (1 = low, 5 = high)

92
4.2.2.1.1 How does gender and age relate to the fashion scale and swapping?
A multi-factor ANOVA was conducted to determine the impact of swapping, age, and gender on the fashion
scale, with fashion scale as the dependent variable. The fixed factors are swapping, age and gender. The
model is significant (N = 407; F = 4.5; df = 55; p < 0.0001). The results show that a person’s fashion scale is
dependent on age and on the participation in swapping but not on gender (see Table 31 in Section 0
“Appendix E: Multiple Comparison, fashion scale-age, gender, swapping”).
4.2.2.1.2 Does the interest in swapping depend on income?
A cross tabulation with interest in and awareness of swapping was conducted. The results do not indicate a
significant correlation between income and swapping (see Table 32 in section 0 “Appendix F: Cross
tabulation between Swapping and Income”). Interest in swapping is not dependent on income.
4.2.2.2 Does the fashion scale correlate with attitudes towards take-back programs?
An ANOVA was conducted to analyze whether participants with higher fashion scale are interested in
retailers’ take-back programs. The attitude towards take-back programs was assessed using a five-point
scale (Table 24).
Table 24: Mean of the fashion scale according to attitudes and behaviours towards take-back programs (1 = low, 5 = high)
Categories for take-back programs Mean
I think this is too complicated 2.6
I have never heard about this possibility 2.1
I don't think anybody wants my old clothing 2.0
I think this is a great idea, but I don't know a retailer who offers this
opportunity 2.7
I think this is a great idea 3.1
The results of the ANOVA suggest a significant difference between participants being interested in take-
back programs and their fashion scale (F = 16.17; df = 4; p < 0.0001). A Scheffé test shows that there is a
significant difference between participants of the following two groups:

93
The group “I have never heard about this possibility” is significantly different to the groups that
think take-back programs are a great idea, but don't know a retailer who offers this opportunity (p=
0.004), and that think take-back programs are a great idea (p < 0.0001).
The group “I don't think anybody wants my old clothing” is significantly different to the groups that
that think take-back programs are a great idea, but do not know a retailer who offers this
opportunity (p = 0.005), and those who think that take-back programs are a great idea (p< 0.0001).
Figure 17 and the two subsets identified in the Scheffé test show the relationship between the fashion
scale and the interest in take-back programs (see section “Appendix G: Results of Scheffé Test: Subsets of
Groups According to Attitudes Towards Take-Back Programs”).
Mea
n
Categories for take-back programs
Figure 17: Mean fashion scale according to attitudes and behaviours towards take–back programs (1 = low, 5 = high)

94
It is obvious that participants with a high fashion scale support take-back programs. The curve changes its
direction with the response “I don’t think anybody wants my old clothing”. Participants who have given this
answer also had the lowest fashion scale. This suggests that there are two groups of participants, those
interested in take-back programs (higher fashion scale) and those not interested in take-back programs
(lower fashion scale) (see section “Appendix G: Results of Scheffé Test: Subsets of Groups According to
Attitudes Towards Take-Back Programs”).
4.2.2.2.1 How does gender and age, and attitude towards take-back programs relate to
the fashion scale?
A multi-factor ANOVA was conducted to analyze whether gender, age and the attitude towards take –
back- programs are different with regard to fashion scale, with attitude towards take- back, age and gender
as the fixed factors and fashion scale as the dependent variable. The model is significant (F = 3.96; df = 53;
p < 0.0001) and all three factors are significantly different with regard to fashion scale. There is no
significant interaction between the factors.
4.2.2.2.2 Does attitude towards take–back programs influence participation in take-
back?
A Chi square test was used to examine if those that already participated in take-back programs have a
different attitude towards take-back programs than those that have not participated in a take-back
program. The Chi square test was significant (Chi2=16.485; df =4; p = 0.002,) and demonstrates that more
participants in take-back programs (N = 29) than expected (N = 18) think that take back-programs are a
great idea. By contrast, the number of people who have participated in a take-back program (N = 128) was
lower than expected (N = 139), yet an overwhelming majority noted a positive attitude towards take-back
programs (see section “Appendix H: Cross Tabulation of attitude and Participation in Take-Back programs”).
4.2.2.3 Reselling garments and fashion scale
An ANOVA was conducted to analyze whether participants with higher fashion scale are more open to
resell garments. The results of the ANOVA suggest that there is a significant difference between openness
to reselling and fashion scale (F = 26.9; df = 4; p < 0.0001).

95
Table 25: Mean of the fashion scale according to attitudes and behaviours towards reselling (1 = low, 5 = high)
Categories for reselling Mean
I often practise this; I think it works very well 3.4
I have tried and it worked 3.3
I have tried, but it either didn’t work or I don’t find it’s worth the time 2.9
I have never tried, but maybe I should 2.6
I have never tried and I have no interest in doing so 2.0
The post hoc Scheffé test indicates that there are significant differences between participants in the
following groups:
Those who “often practice this and it works very well” have a higher fashion scale than those who
think “I have never tried, but maybe I should” (p < 0.002) and those who “have never tried and
have no interest in doing so” (p < 0.0001).
Those who “have tried and it worked” have a higher fashion scale than participants who think “I
have never tried, but maybe I should” (p < 0.0001) and those who “have never tried and have no
interest in doing so” (p < 0.0001).
Those who “I have tried, but it either didn't work” or “I don't find it's worth the time” have a higher
fashion scale than participants who “have never tried and have no interest in doing so” (p = 0.001).
Figure 18 shows the relationship between the fashion scale and the interest and practice in reselling
clothes. Participants with high fashion scale values practise reselling often while participants with a low
fashion scale have never tried reselling and have no interest.
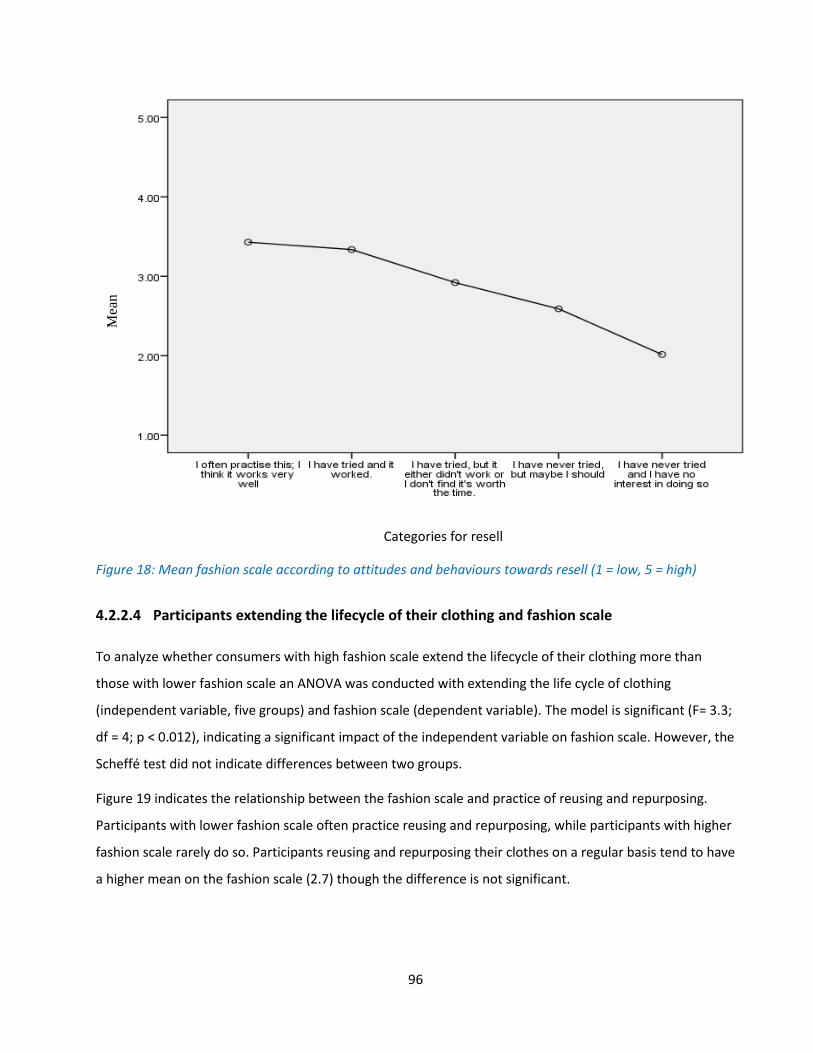
96
Mea
n
Categories for resell
Figure 18: Mean fashion scale according to attitudes and behaviours towards resell (1 = low, 5 = high)
4.2.2.4 Participants extending the lifecycle of their clothing and fashion scale
To analyze whether consumers with high fashion scale extend the lifecycle of their clothing more than
those with lower fashion scale an ANOVA was conducted with extending the life cycle of clothing
(independent variable, five groups) and fashion scale (dependent variable). The model is significant (F= 3.3;
df = 4; p < 0.012), indicating a significant impact of the independent variable on fashion scale. However, the
Scheffé test did not indicate differences between two groups.
Figure 19 indicates the relationship between the fashion scale and practice of reusing and repurposing.
Participants with lower fashion scale often practice reusing and repurposing, while participants with higher
fashion scale rarely do so. Participants reusing and repurposing their clothes on a regular basis tend to have
a higher mean on the fashion scale (2.7) though the difference is not significant.

97
Mea
n
Categories for reuse/repurpose
Figure 19: Mean fashion scale according to attitudes and behaviours towards reuse/repurpose (1 = low, 5 = high)
4.2.2.4.1 How does gender relate to participants extending the lifecycle of their
clothing?
Do men and women show different behaviour with respect to extending the lifecycle of their clothing? A
Chi-Square Test was used for the five categories of reuse. The results of the Chi-Square test indicate a
significant difference between men and women (Chi2 = 11.9; df = 4; p = 0.018). Overall, most participants
practice reuses and repurpose (see Figure 20). Fourteen percent of all women do not reuse or repurpose
their clothing. About six percent of all men responded to not having thought about it (see Figure 20).
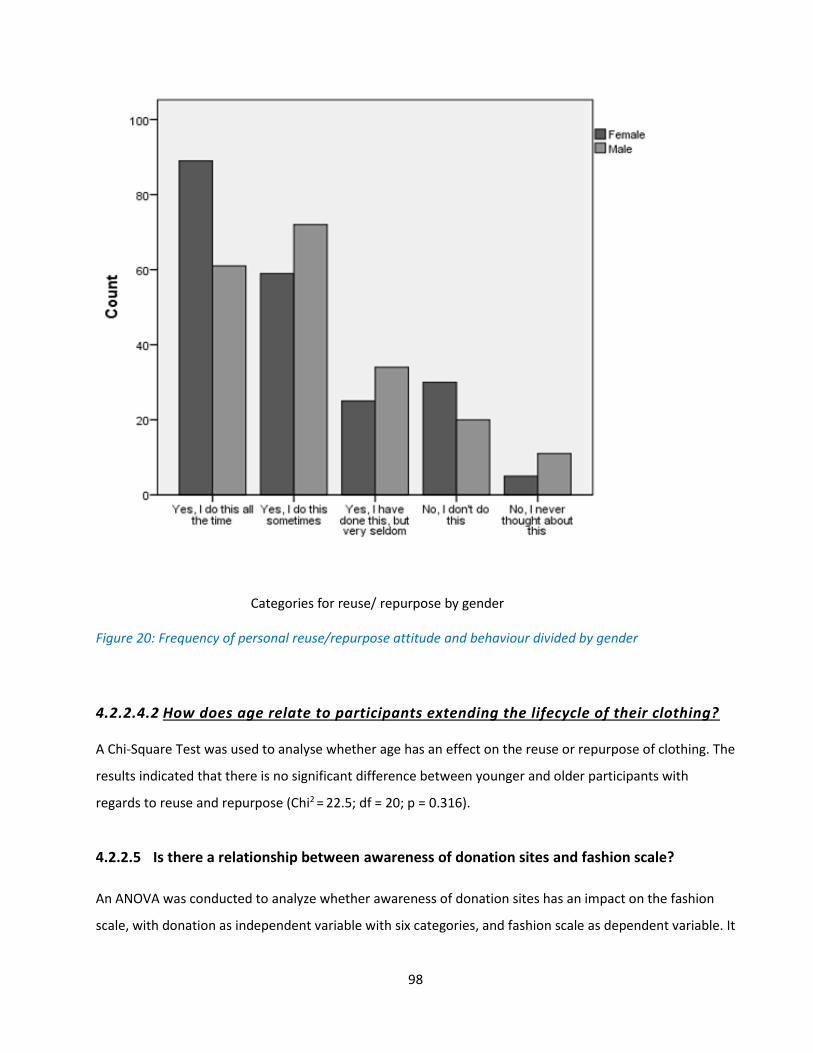
98
Categories for reuse/ repurpose by gender
Figure 20: Frequency of personal reuse/repurpose attitude and behaviour divided by gender
4.2.2.4.2 How does age relate to participants extending the lifecycle of their clothing?
A Chi-Square Test was used to analyse whether age has an effect on the reuse or repurpose of clothing. The
results indicated that there is no significant difference between younger and older participants with
regards to reuse and repurpose (Chi2 = 22.5; df = 20; p = 0.316).
4.2.2.5 Is there a relationship between awareness of donation sites and fashion scale?
An ANOVA was conducted to analyze whether awareness of donation sites has an impact on the fashion
scale, with donation as independent variable with six categories, and fashion scale as dependent variable. It
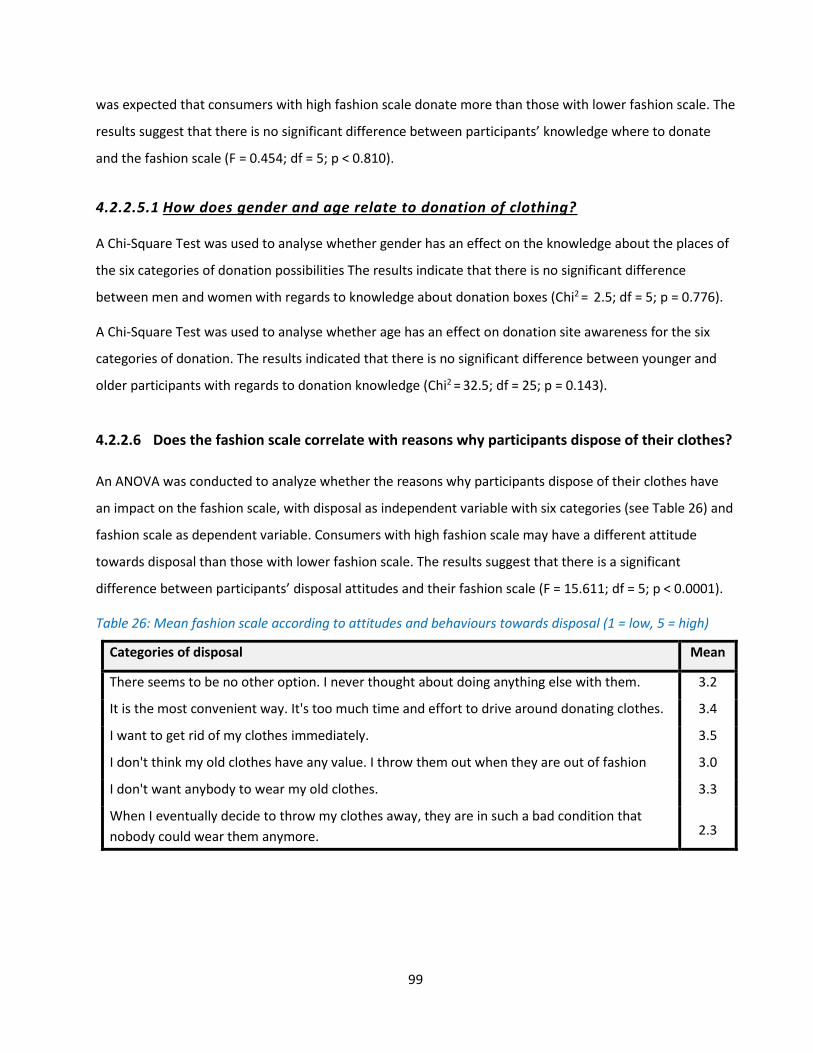
99
was expected that consumers with high fashion scale donate more than those with lower fashion scale. The
results suggest that there is no significant difference between participants’ knowledge where to donate
and the fashion scale (F = 0.454; df = 5; p < 0.810).
4.2.2.5.1 How does gender and age relate to donation of clothing?
A Chi-Square Test was used to analyse whether gender has an effect on the knowledge about the places of
the six categories of donation possibilities The results indicate that there is no significant difference
between men and women with regards to knowledge about donation boxes (Chi2 = 2.5; df = 5; p = 0.776).
A Chi-Square Test was used to analyse whether age has an effect on donation site awareness for the six
categories of donation. The results indicated that there is no significant difference between younger and
older participants with regards to donation knowledge (Chi2 = 32.5; df = 25; p = 0.143).
4.2.2.6 Does the fashion scale correlate with reasons why participants dispose of their clothes?
An ANOVA was conducted to analyze whether the reasons why participants dispose of their clothes have
an impact on the fashion scale, with disposal as independent variable with six categories (see Table 26) and
fashion scale as dependent variable. Consumers with high fashion scale may have a different attitude
towards disposal than those with lower fashion scale. The results suggest that there is a significant
difference between participants’ disposal attitudes and their fashion scale (F = 15.611; df = 5; p < 0.0001).
Table 26: Mean fashion scale according to attitudes and behaviours towards disposal (1 = low, 5 = high)
Categories of disposal Mean
There seems to be no other option. I never thought about doing anything else with them. 3.2
It is the most convenient way. It's too much time and effort to drive around donating clothes. 3.4
I want to get rid of my clothes immediately. 3.5
I don't think my old clothes have any value. I throw them out when they are out of fashion 3.0
I don't want anybody to wear my old clothes. 3.3
When I eventually decide to throw my clothes away, they are in such a bad condition that
nobody could wear them anymore. 2.3

100
A Scheffé test suggests differences between the following groups:
“There seems to be no other option. I never thought about doing anything else with them” vs.
“When I eventually decide to throw my clothes away, they are in such a bad condition that nobody
could wear them anymore” (p < 0.0001).
“It is the most convenient way. It's too much time and effort to drive around donating clothes” vs.
“When I eventually decide to throw my clothes away, they are in such a bad condition that nobody
could wear them anymore” (p < 0.0001).
“I want to get rid of my clothes immediately” vs. “When I eventually decide to throw my clothes
away, they are in such a bad condition that nobody could wear them anymore” (p < 0.0001).
Figure 21 shows the relationship between the fashion scale and the disposal behaviour. Participants with a
lower fashion scale dispose of their unwanted garments because they think that nobody could wear their
old garments anymore.
Mea
n
Categories for disposal
Figure 21: Mean fashion scale according to attitudes and behaviours towards disposal (1 = low, 5 = high)

101
5 DISCUSSION
This section examines the findings of the survey and combines the results of the descriptive and statistical
analyses beginning with the fashion scale and then the different reuse, recycle and disposal channels. This
section concludes with recommendations for various stakeholders to reduce textile waste.
5.1 Managing unwanted clothing in Ontario
Managing used clothing is for the majority of the participants a personal decision (see section 4.1.4.6
“Disposal”). Although women typically manage the unwanted garments for their families (Laitala, Hauge, &
Klepp, 2009), in the current study the survey results suggest that men deal with disposal of their clothing
just as much as women do.
5.1.1 Cleaning out a closet:
Nearly a third (28 percent) of the respondents stated that they get rid of their unwanted clothing whenever
they notice them (see section 4.1.3 “Reasons to clean out a closet”). This rate suggests that these people
would take advantage of a weekly or monthly collection service in curbside recycling programs. This finding
is confirmed by Domina and Koch (2002), who state that collecting textiles as part of a blue box system
would significantly increase textile collection rates.
Additionally, consumers change their disposal behaviour when they have a lot of clothing to dispose of
versus a few pieces, and the results of this study indicated that people are more likely to dispose of
garments in the waste when the volume is low. This finding is consistent with results offered by Domina
and Koch (2001). Since people who clean out their closet on a regular basis might have only a small volume
of textiles to manage, and therefore are more likely to dispose of these clothes in the waste, a weekly
textile collection could help divert them from landfills. The weekly portion of textiles might be small, but
the annual portion could amount to a lot.
Nearly the same amount of people keep their clothes for a spring and fall clean-up (27 percent), or until
there is no more space in their closet (22 percent), suggesting that these people have more clothes to get
102
rid of when they finally do decide to get rid of them, and that a seasonal collection day would be useful as a
prompt to clean their closets.
Participants who claimed they clean up their closet on a consistent basis (27 percent) said they usually do
so in spring and fall. Perhaps not coincidentally, this is usually the same time when clothing retail business
experience strong sales. Twelve percent of participants responded that they clean out their closet after a
prompt from a charity. This means nearly 40 percent of all participants follow a pattern to clean out their
closet, which suggests an opportunity for municipalities to collect more textiles, but also for charities to
plan for collecting these unwanted garments. In the Netherlands, for example, where this system is quite
common, collectors distribute their own clear plastic bags one week in advance, five times a year, to inform
residents and increase their collection rate (GAD Gooi en Vechtstreek, 2015). A good time for collection
may be around Easter and in September, after children are back in school. Another possibility to reach
these consumers other than donation bin installations would be special collection events at specific places
that maintain a high frequency of pedestrian traffic by clothing collection companies.
5.1.2 Personal reuse/repurpose:
After people decide to get rid of unwanted clothes, they choose the method based on what they deem the
most appropriate given the style and condition of the clothing. Since 84 percent of the respondents have
reused and repurposed their clothes and 69 percent declared to do this often or sometimes (see section
4.1.4.1 “Extend the lifecycle of clothing by personal reuse or repurpose”), the number of people who first
consider personal reuse of their garments is very high and can only be achieved if both genders practice
reuse and repurpose at all ages. However, the results suggest a significant difference between men and
women. While more women are committed to reuse and repurpose all the time, men are more likely to
only practice it sometimes and are more likely to not have thought about this method (see section 4.2.2.4.1
“How does gender relate to participants extending the lifecycle of their clothing?”). This suggests men need
to be made more aware of this option. Although a great deal of participants reuse and repurpose their
clothes, at least 1 in 5 do not.
Moreover, though reuse and repurpose are preferable interim alternatives to getting rid of textiles, these
practices nonetheless degrade the quality of the garment, and when a garment is so heavily re-used that it
can serve no other function for the consumer, it will be in such a bad condition that the consumer will only
consider the garment for disposal, and not donation. In fact, the results show that 49 percent of consumers

103
will use their clothes to the point that they think these clothes can only be thrown into the waste. Indeed,
heavily-used clothes are often in such a state of disrepair when they are finally disposed of that they only
carry a fibre value (and cannot be donated). However, since few facilities and programs exist in Canada
aimed towards fibre reclamation and recycling, not only will there be few opportunities that the fibres will
be reclaimed and recycled, the consumer may also be unaware that this option even exists (see section
2.4.2 “The function of charities in the textile recycling process”).
When it comes to how people reuse and repurpose their clothes, most consider first to wear them for
hands-on work, in particular shirts with stains and ripped jeans with holes. However, not every garment
will provide the right outfit to work in the garden, therefore residents also consider passing the garments
to friends or family members, especially when the style is nice and the garment is in good condition, or
donate them when the garment shows signs of wear and tear. Unwanted garments are also frequently
used as cleaning rags but it is less likely that the participants restyle their old garments into something new.
This is not surprising, as most people might not have the ability to restyle their old clothes (Gibson &
Stanes, 2011). However, 16 percent of respondents do not consider any personal reuse of their clothing
(see section 4.1.4.1 “Extend the lifecycle of clothing by personal reuse or repurpose”).
5.1.3 Numbers of channels used to manage unwanted textiles:
Shim (1995), Morgan & Birtwistle (2009) and Lee et al (2013) describe that consumers typically use more
than one channel to manage their unwanted textiles, this is confirmed as 79 percent of participants
estimated they use more than one channel. Nearly half of the participants use donation and disposal as
their channels to manage unwanted garments. However, when participants use only one channel to
manage their unwanted clothing, the one most frequently used is donation (at 64 percent). This means
that 13 percent of participants donate all their clothes no matter the condition (see section 4.1.5.1
“Number of channels”). These numbers also suggest that the majority of people are making clear decisions
about what to do with their unwanted garments.
5.1.4 Choice of channels:
When consumers decide between different channel options they follow patterns in which they sort their
garments. Understandably, very personal items like underwear and articles which typically have strong

104
signs of use, such as socks, end up in the waste. Garments that will be donated are those which are in good
condition but out of fashion, have lost their colour, are assumed to be valuable, or are never worn.
Depending on their perceived value, even garments with defects such as a winter coat with a broken front
zipper will be donated.
People who consider reselling their unwanted garments will do so particularly with garments they assume
are valuable, and less so with articles of minor value or frequent personal use. The decision to swap or
take-back to a retailer depends less on the garment than it does whether the consumer uses these
channels or not. Nevertheless, the least popular article for a take-back program is underwear because
people might feel embarrassed or see these items as without value, and the article swapped the least is
heavily-used socks, probably for much the same reason as the underwear. Swapping and reselling are
therefore limited in the range of garments that will be included, so these options cannot manage all issues
related to textile consumption and disposal (see section 4.1.5.2 “Selection of reuse, recycle, and disposal
channels”).
While participants intend to donate most of their unwanted garments, they place restrictions on the kinds
of garment that they will donate. These restrictions were most readily apparent when participants were
given a set of hypothetical garments in various states of use and had to choose whether they would resell,
take-back, swap, donate or dispose of them. In every instance, their choices differed from the percentage
they had previously estimated they used each channel. This suggests that people assume they do more to
manage their textiles in a more sustainable manner than they actually do.
5.1.5 The degree to which reuse, recycle and disposal channels are used:
While people first estimated they would donate 59 percent of their garments (see section 4.1.5 “Channels
for managing unwanted clothing”), the percentage dropped by 9 percent to 50 percent when presented
with specific articles of clothing in specific states of use. Re-use, resell, take-back, and swap percentages
dropped as well, but not as much as donation did because the figures were much lower from the
beginning. This figure may not be an accurate reflection however, as consumers might have distinguished
between item and mass in the first estimate, whereas in the set of hypotheticals the questions clearly
specified items (see section 3.4 “Limitations of this study”). Disposal increased by 13 percent, from 25
percent to 38 percent. Therefore, a gap exists between what the participants estimate they do with
unwanted clothes and what they actually intend to do with them. However, since 85 percent of unwanted

105
textiles go to the landfill in the USA (Council for Textile Recycling, 2014) (see section 2.3.1 “Putting
municipal waste in context with textile waste”), this figure of 38 percent suggest that Ontario participants
are doing a better job of managing their used textiles than US citizens. However, the difference between
what people intend and what they really do with their unwanted garments might further decrease when
they do finally eliminate their unwanted garments, because of perceived barriers to re-use or
recycle(McKenzie-Mohr, 2013). Therefore, the results can only be seen as an indication, not as exact
figures. Truer figures might be determined with waste audits or landfill mining (Tammemagi, 1999).
Nevertheless, these figures provide information about whether participants know about channels and
suggest that the choice of the disposal channel is essentially determined by a participant’s personal
evaluation about the garment’s value depending on its condition and style. Therefore, this study confirms
McKenzie–Mohr and Smith’s (1999) finding that the choice depends on a participant’s knowledge about
the different channel options, as well as internal and external barriers. Jacoby et al. (1977) used similar
considerations as McKenzie-Mohr and Smith—the psychological characteristics of the decision maker, the
intrinsic factors of the product and the situational factors extrinsic to the product—and the results of this
survey seem to confirm these factors as well.
This section has mainly examined how the intrinsic factors of a product (style and condition) influenced the
choice of the disposal channel; the following sections will examine the personal fashion attitude of the
decision maker towards different reuse, recycle and disposal channels and the extrinsic factors of the
product.
5.2 Fashion scale index
While the overall fashion index distribution of participants in this study was lower than expected, a
similarly skewed distribution towards a lower involvement in fashion was observed 40 years earlier in 1976
by Tigert et al. (1976) in their study of the metropolitan area of Toronto and also the study from Lang et al
in the US in (2013) had a skewed distribution of their participants in terms of their fashion trend sensitivity
(Confirmed by Lang after contact with the author via email in April 2015). However, results of using this
scale demonstrated that there are major differences among consumers in Ontario in terms of fashion index
depending on gender, age, and income:
106
Gender: The results suggested that women have a significantly higher fashion scale than men. That means
women are more involved in fashion than men. This result corresponds with results offered by Tigert et al.
(1976), who found major differences between men and women in terms of fashion involvement and Lang
et al. (2013), who demonstrated that women in the USA are more fashion trend sensitive than men.
Age Range: Furthermore, the results showed that the younger the age range, the higher the fashion scale.
The result corresponds with Lang et al. (2013), who found a similar correlation between age groups and
their fashion trend sensitivity. This result also corresponds with the findings of Morgan and Birtwistle
(2009), who identified young consumers specifically as fast-fashion consumers.
Income: While Morgan and Birtwistle found out that there is no correlation between fashion
innovativeness and annual household income (2007), the results of this survey show that income
influences the fashion scale significantly but also that the differences are not significant between specific
income levels. There is a tendency for the fashion scale to increase with the income. People with the
highest income have the highest fashion scale. However, particular consumers with an income less than
$10,000 per year (lowest income level) have a remarkably high fashion scale. This might be due to two
circumstances: firstly, lower income consumers who cannot afford houses or expensive cars might try to
compensate by investing in their clothes; secondly, students and other young people supported by their
parents have a lower income but maintain a high interest in fashion.
5.3 Channels to manage unwanted clothing
The following section describes how the respondents participate in the different resell, recycle, and
disposal channels and examines whether the behaviour is dependent on a fashion scale, gender or age, and
if there is an interaction among these factors. The results showed different consumer groups with different
fashion index values, those values showed that ‘fashion’ consumers and ‘non-fashion’ consumers manage
their textiles differently.
5.3.1 Swapping
Swapping is a relatively new phenomenon, so new in fact that 28 percent of the participants still have not
heard about this possibility to manage unwanted clothing and stated to not knowing about it. Not

107
surprisingly, only 18 percent have visited a swap event. However, the large majority of people who visited a
swap event have enjoyed it. Generally, people are interested in swapping and nearly one third of the
participants would like to visit such an event. So why have participants not visited a swap event? Is there a
lack of events?
5.3.1.1 Swap practices for fashion and non-fashion consumers:
The high interest in swapping could lead to the assumption that swapping is the new solution to manage
textile waste (see section 2.8.3 “Swapping used clothing”). However, participants of this study are split into
two groups: those with higher fashion scale who know what swapping is and have or would like to visit a
swap event, and those with low fashion scale who have no interest in swapping or do not know what it is.
Thus, while swapping might be a new way to manage unwanted clothing, it is only for people with a higher
fashion scale. Morgan and Birtwistle (2009) confirm this finding by reporting that some young fashion
innovators have used swapping to exchange clothes with friends (see section 4.2.2.1 “Does participation in
swap events depend on a person’s fashion scale?”).
5.3.1.2 Barriers behind swapping:
The participants of this study responded that their main barriers which prevent them from visiting swap
events are their own lack of interest and not being aware of this possibility. Participants who list these
barriers might have a low fashion scale, since most people with a high fashion index are also highly
interested in swapping. Fashion consumers might be interested in swapping because they think that their
clothes are too good for donations, especially those who spend a fair amount of money for their clothing.
Ironically, these participants might also think that reselling old clothes is too complicated and the financial
benefit too small. Ideally, these people would pass their unwanted clothes to a friend, but not everybody
has the right friend for the unwanted garment and not everybody feels comfortable to ask friends if they
are interested in their used clothes. Swapping seems like a compromise, because in a semi-private
atmosphere there are no barriers to exchange clothes, everybody who participates has the same interest in
getting rid of garments, and as an added benefit there is even a chance to find something valuable (see
section 2.8.3 “Swapping used clothing”). However, despite these benefits, swapping has received little
research and attention.

108
5.3.1.3 Who swaps?
While this study focuses on whether participants with a high fashion scale manage their unwanted clothing
differently than participants with a low fashion scale, the data offers further possibilities for analysis. In
terms of swapping, one question seems self-evident: is a person’s interest in swapping dependent on
income? This research found out that swapping is independent from a person’s income, meaning people
with higher income are equally interested in swapping as people with lower income. However, people with
higher income might have different garments than people with lower income. Similarly, students might
have a different fashion style than professionals; hence it might be difficult for them to swap their clothes.
More research is necessary to determine what will make for the most successful swap event. However, if
swap events are to become a lasting method for managing unwanted clothing, municipalities should
consider organizing and fostering such events.
5.3.2 Take-back programs
Although 70 percent of the participants think that take-back programs are a great idea, only 12 percent
have ever taken a garment back to a retailer. However, participants who have already participated in a
take-back program are more open to the idea than those who have not participated in a take-back
program. This might be because they have experienced how easy it is to bring a used garment back to a
retailer, and they enjoyed some monetary incentives or rewards. Any kind of reward usually increases the
recycling behaviour (Jacobs & Bailey, 1982) (see section 2.8.2 “Take–back program”).
5.3.2.1 Take-back practices of fashion and non-fashion consumers:
The study also found a significant difference between participants being interested in take-back programs
and their fashion scale (see section 4.2.2.2 “Does the fashion scale correlate with attitudes towards take-
back programs?”). The results suggest that the participants are split into two groups: the first group, which
has a higher fashion index, are those participants who think take-back programs are a great idea and who
may or may not know a retailer who offers this opportunity. Participants of the second group have a lower
fashion index and think nobody wants their old clothing and they may have never heard about this
possibility. Interestingly, some women with a higher fashion index have responded that they think take-
back programs are too complicated. This is surprising, because people with a high fashion index shop more
109
often than people with a lower fashion index, hence it should be easier to take a garment back to a retailer
than for those who shop only once or twice a year.
5.3.2.2 Barriers behind take-back:
The main barriers which participants must overcome to participate in take-back programs are awareness
and lack of interest (see section 4.1.6 “Barriers behind reuse, recycle, and disposal channels”). Those
participants who responded that their main barrier is a lack of interest are probably those with a low
fashion index who avoid clothes shopping. Most consumers purchase their clothes in a limited number of
shops. Thus, if none of their retailers offers a take-back program there is little chance that they will become
aware about this possibility. Of particular interest is that 11 percent of the participants see no value in their
old clothing and do not understand why they should bring their unwanted garments back to a retailer.
Since retailers so far do not require “valuable clothing” for take-back programs, this number suggests that
some consumers either do not see the fiber value of their clothing or are unaware about the actual take-
back procedures.
5.3.2.3 The current status of take-back programs:
Take-back programs should be considered as part of Extended Producer Responsibility (EPR) programs
(Thorpe, Kruszewska, & McPherson, 2004). In such programs, the government defines the products, the
stewards, clear targets and performance measures and deadlines for achieving them. Additionally, these
EPR programs include a promotional component and an educational component intended to inform
consumers about why the program exists and what they need to do. So far, Ontario has no EPR program for
clothing; hence the take-back programs offered by some retailers are on a voluntary basis and even if those
retailers are committed to their initiatives and promote them, they will unlikely receive the same attention
as a government program (see section 2.8.2 “Take-back programs”). No wonder only few participants are
aware about this possibility. The Ontario proposed Waste Reduction Act (WDA) would at least include
some components of an EPR program and results suggest the province would do well to foster mandatory
clothing EPR programs.
110
5.3.3 Resell
Only about one third of the survey participants have ever tried to resell a garment and only very few think
reselling clothes in a second-hand store or online works very well. The majority of the participants do not
consider reselling as an option for managing their unwanted garments. Furthermore, 30 percent are not
interested in reselling (see section 4.1.4.4 “Resell”).
5.3.3.1 Resell practices of fashion and non-fashion consumers:
A significant difference was noted between a respondent’s fashion scale and their openness to resell.
Consumers who resell clothing have a higher fashion scale (see 4.2.2.3 “Reselling garments and fashion
scale”). The results suggest that in order to successfully resell a used garment, a person must have a high
fashion scale. The reasons why reselling used garments requires a higher fashion scale could be the
following: it may be that the person has a different attitude, interest, or expectations towards reselling or
whether they try to sell different garments. Whatever the reason, the results nonetheless show that
people with low fashion scale will not practice reselling, nor do they see it as an option to manage their
unwanted clothing. Regardless of the correlation between fashion index and reselling practices, few people
actually participate in reselling anyway. This seems due in large part to the high number of barriers people
associate with this practice.
5.3.3.2 Barriers behind take-back:
The majority of participants responded to having at least one barrier when it comes to reselling. From all
possibilities to manage unwanted clothing, reselling has the highest number of all barriers mentioned by
the respondents (see section 4.1.6 “Barriers behind reuse, recycle, and disposal channels”). Joung and
Park-Poaps (2013) state consumers resell garments because of economic concerns. Interestingly, despite
serving as the motivation and the benefit of reselling, economic considerations are also the biggest barrier.
Most participant think reselling requires too much time and effort in relation to the financial benefit.
Reselling suffers from having to compete with the already low prices of most new products—as already
mentioned, the average selling price in the US for a new garment is $14.60 (The American Apparel &
Footwear Association, 2012) (see section 2.5.1 “Increased consumption due to reduced garment prices”).
111
Private resellers experience the same problems as professional recyclers: the market is overwhelmed with
volume of mass clothing but lacks profitable markets and demand (Fletcher, 2008). When consumer
purchase used clothing, they do not want to spend more than for a new product, so it becomes pointless to
resell used garments. Though internet and some second-hand designer stores can enable used clothing to
achieve higher resell prices, this is typically only achieved when the garment is a designer piece, when it is
of high quality, or a prized vintage piece. Part of the problem is that the majority of consumers often have
little or no ability to recognize and evaluate the value of the used garments. The only hints for value are the
brand labels, the type of clothing, or if the garment somehow attracts a consumer’s personal taste. The
price of second-hand clothes is further complicated by the competitive prices set by charities for donated
clothes. As a result, the margin for used clothing is so low that most respondents declared reselling as an
unappealing method to manage their unwanted clothing.
5.3.3.3 The current status of reselling
Changing or removing these barriers will be difficult and require time. The main practice that needs to
change is a shift in textile consumption, from mass production and endless consumption towards a more
selective consumption. Further, consumers need more knowledge about textiles in order to better
understand quality and value. Often, second-hand garments have minor damages, so a basic knowledge in
repair or mending would be required—but many sellers want to get rid of their garments for exactly this
reason (see section 2.6.3 “Intrinsic factors to the product: Durability and reparability”).
Although the internet has made it possible for everybody to become a seller, it still requires pictures,
descriptions, a basic competency of Internet and computers, and the effort to list, sell and ship clothes.
Potential consumers often like to try on clothing, and this presents an additional hurdle to be overcome for
garments sold online. Even selling clothes at a brick and mortar second-hand store can present challenges,
as the owner has to bring the garments to a store, but if the store is not interested in the clothing the
owner might not be able to get rid of them. In conclusion, reselling used garments requires a higher fashion
scale from people, but even for participants with higher fashion index reselling includes multiple barriers
such as required time, required effort and low financial benefit. In order to overcome these barriers and to
foster reselling, municipalities need to develop a market where numerous vendors and customers can
meet with a minimum of effort and no additional costs. In short, municipalities need to reinvent flea
markets.

112
5.3.4 Donate
This study found that clothing donations are not dependent on gender, age, or fashion index. This means
no matter whether participants are women or men, young or old, have a high or a low fashion index, they
nonetheless donate their unwanted clothing. The overwhelming majority of all respondents (nearly 92
percent) know where to donate their garments, and participants of this study have estimated that they
donate nearly 60 percent of all their garments. However, if donations are not dependent on a person’s
demographic factors or fashion scale, what do they depend upon?
5.3.4.1 Barriers behind donation:
Convenience and accessibility of donation spots seem to be the determining factors (Birtwistle & Moore,
2007; Domina & Koch, 2002; Laitala & Boks, 2012), and the key for persuading people to donate will be to
address these issues. This finding is confirmed by this study. According to participants, the biggest barrier
which they have to overcome is the accessibility of the donation spot and the time it requires to reach
these spots. 34 percent of all participants name these two factors as their barriers. In other words, with
more donation spots, in more convenient locations, the quantity of donated clothing could increase.
Nonetheless, donation is the channel with the least overall barriers. In fact, the majority of all participants
(66 percent) claim they have no barriers to donate their clothes.
Clothing donations follows the same patterns as other waste diversion methods. According to Domina and
Koch (2002) the more convenient recycling is, the more materials will be recycled. This explains the success
of Ontario’s blue box system, since it is based on convenience. According to the Environmental Protection
Act, textiles could be added to the blue box system, which would increase the textile collection rate
significantly, but usually they are not (see section 2.2.2 “The Environmental Protection Act (EPA)”). Though
municipalities ensure residents have the possibility to bring their clothes to a collection depot, clothing
collection boxes are not supervised by the municipalities, so the availability and accessibility is dependent
upon the actions of the charities in charge of donation. To increase the ease and access to donation bins,
municipalities should cooperate with textile collectors to create more locations for donation boxes.
Therefore, municipalities might need more partners for textile collections. Cities which are committed to
zero waste, like San Francisco, have many partners helping to collect textiles and offer the possibility for
businesses, apartment buildings, or community groups to order free textile collection bins. Further,
113
municipalities could add information on their websites about where to find the nearest drop-off location
for textiles (SF Environment, 2015).
5.3.4.2 The current status of donation:
While the participants of this survey plan to donate half of all their unwanted garments, only 42 percent
claimed they know a few places where to donate their old clothes and at least one spot is very convenient
to reach. These numbers suggest that people in Ontario believe that there are not enough donation boxes
to make clothing donation convenient to reach. This observation cannot be corroborated, however, due to
the lack of data on donation box locations and methods for finding these boxes. It may be that donation
boxes are indeed in convenient and accessible locations for most, but that most simply are unaware about
them, or the opposite might be true. Further research is needed. An additional consideration is whether
the environmental benefit of donating clothes is offset by the potentially long distances people need to
drive in order to get to the nearest donation box.
A question also arises regarding who is responsible to put up donation boxes. While donation boxes usually
are owned by charities or privately owned textile collecting companies, consumers typically consider
municipalities responsible for the sites. However, municipalities have no access to boxes, nor are they
involved in where these boxes will be placed. The choice remains with landholders to grant permission to
charities and textile collection companies to place donation bins on their premises. Better communication
regarding the roles in textile collection is thus needed, and municipalities need to take a stronger role in
securing locations for donation bins (see section 2.4.2 “The function of charities in the textile recycling
process”).
5.3.5 Disposal
According to results in this study, only six percent of all participants state that they dispose of garments
because the garments have no value and are out of fashion, but nearly half (49 percent) dispose of
unwanted garments because they think their clothes have become too shoddy to donate, tendencies
similarly noted by Birtwistle and Moore (2007, p. 213). Seventeen percent see disposal as the most
convenient (ten percent) and fastest way (seven percent) (see section 4.1.4.6: “

114
Disposal”). Nine percent declare that they have never even thought about doing something else with their
unwanted garments–this number may correspond to the eight percent who do not know where to donate
their used clothes. To put this number in context, it means that roughly 1.2 million people in Ontario throw
all of their unwanted clothes into the waste bin, at a rate of roughly 45,000 tonnes of textile waste per
year15.
5.3.5.1 Disposal practices of fashion and non-fashion consumers:
Like the other channels except donation, a significant difference was found between the disposal attitude
and the fashion index. There are two different groups of consumers: those with a lower fashion index who
think that when they eventually decide to throw their clothes away, they are in such a bad condition that
nobody could wear them anymore, and those with a higher fashion index who think there seems to be no
other option, it is the most convenient way, as well as those who want to get rid of their clothes
immediately (see section 4.2.2.6 “Does the fashion scale correlate with reasons why participants dispose of
their clothes?”).
Interestingly, different reasons for disposal exist for those with a higher fashion index, while everyone with
a lower fashion index shares one common attitude about their used clothes: when they eventually decide
to throw their clothes away, they think their clothes have become too shoddy to wear. Looking at the
reasons why a consumer disposes of unwanted garments, there is a major difference between fashion and
non-fashion consumer. For those with low fashion index, the problem is a perceived lack of value in the
garments, while for those with a high fashion index the issue is not so much value as it is convenience and
time. This difference is important because it shows these consumer groups need to be addressed
differently. To shift the behaviour from disposal towards donation, non-fashion consumers need to learn
that each garment has a fibre value and can be recycled. Fashion consumers, meanwhile, already
understand the value of the clothes they are throwing into the waste bin, but do not appreciate the need
to donate them. Unlike non-fashion consumers, whose clothes are often discarded when only a fibre value
remains, the clothes that fashion consumers discard are often still usable as clothes. Fashion consumers
must be encouraged to take the required time to bring the used clothing to the donation box.
15 These totals were calculated using the same method by which the total textile waste for Ontario was calculated in the introduction: by using the textile waste figures provided by the US Recycling Council for each individual in the US and comparing it to the population of Ontario (see section 1: “Introduction”).
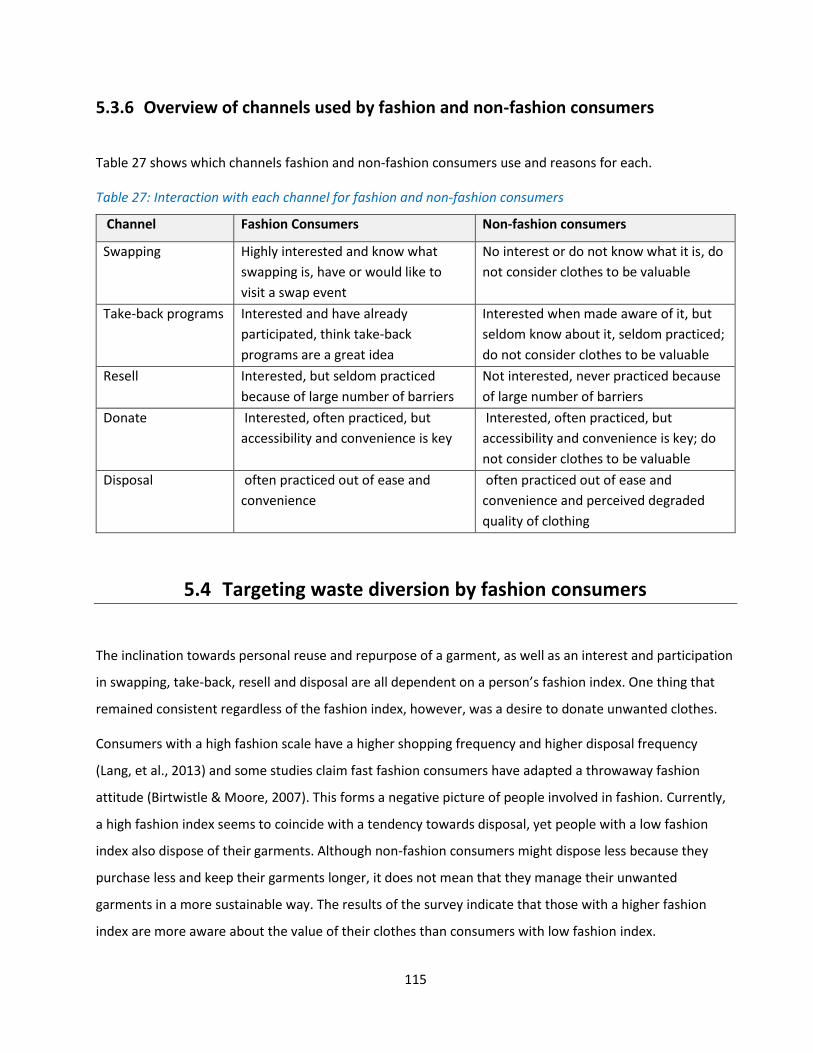
115
5.3.6 Overview of channels used by fashion and non-fashion consumers
Table 27 shows which channels fashion and non-fashion consumers use and reasons for each.
Table 27: Interaction with each channel for fashion and non-fashion consumers
Channel Fashion Consumers Non-fashion consumers
Swapping Highly interested and know what
swapping is, have or would like to
visit a swap event
No interest or do not know what it is, do
not consider clothes to be valuable
Take-back programs Interested and have already
participated, think take-back
programs are a great idea
Interested when made aware of it, but
seldom know about it, seldom practiced;
do not consider clothes to be valuable
Resell Interested, but seldom practiced
because of large number of barriers
Not interested, never practiced because
of large number of barriers
Donate Interested, often practiced, but
accessibility and convenience is key
Interested, often practiced, but
accessibility and convenience is key; do
not consider clothes to be valuable
Disposal often practiced out of ease and
convenience
often practiced out of ease and
convenience and perceived degraded
quality of clothing
5.4 Targeting waste diversion by fashion consumers
The inclination towards personal reuse and repurpose of a garment, as well as an interest and participation
in swapping, take-back, resell and disposal are all dependent on a person’s fashion index. One thing that
remained consistent regardless of the fashion index, however, was a desire to donate unwanted clothes.
Consumers with a high fashion scale have a higher shopping frequency and higher disposal frequency
(Lang, et al., 2013) and some studies claim fast fashion consumers have adapted a throwaway fashion
attitude (Birtwistle & Moore, 2007). This forms a negative picture of people involved in fashion. Currently,
a high fashion index seems to coincide with a tendency towards disposal, yet people with a low fashion
index also dispose of their garments. Although non-fashion consumers might dispose less because they
purchase less and keep their garments longer, it does not mean that they manage their unwanted
garments in a more sustainable way. The results of the survey indicate that those with a higher fashion
index are more aware about the value of their clothes than consumers with low fashion index.
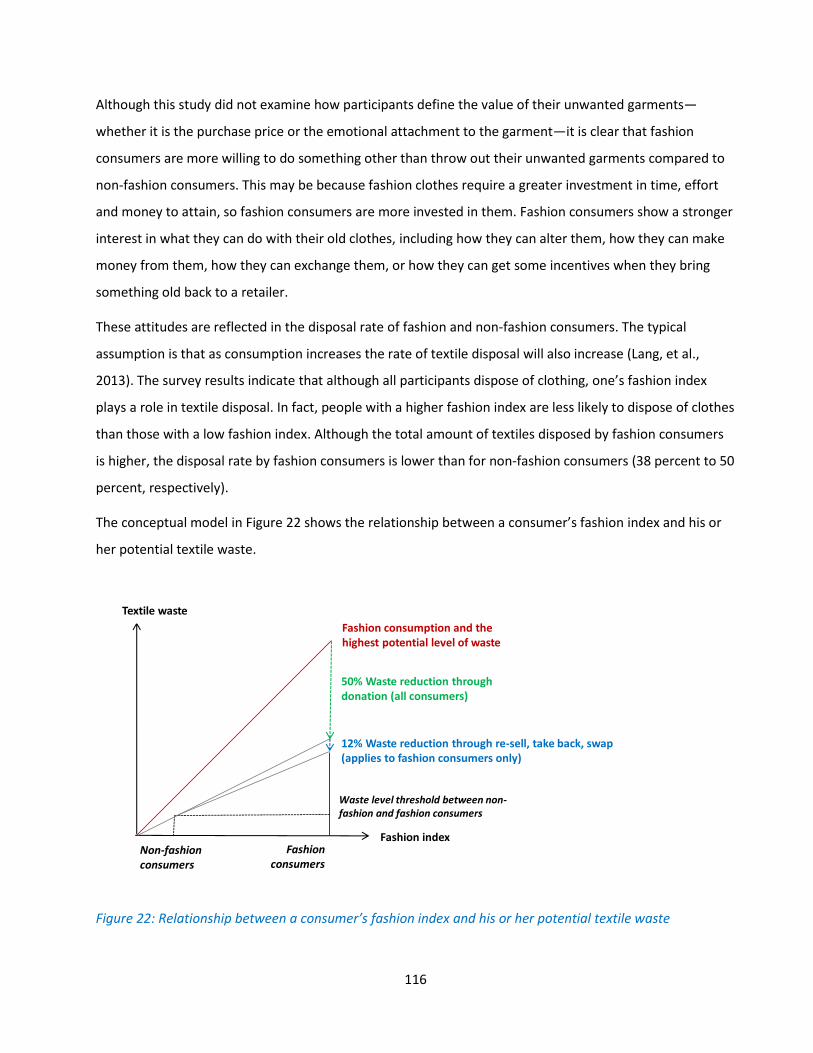
116
Although this study did not examine how participants define the value of their unwanted garments—
whether it is the purchase price or the emotional attachment to the garment—it is clear that fashion
consumers are more willing to do something other than throw out their unwanted garments compared to
non-fashion consumers. This may be because fashion clothes require a greater investment in time, effort
and money to attain, so fashion consumers are more invested in them. Fashion consumers show a stronger
interest in what they can do with their old clothes, including how they can alter them, how they can make
money from them, how they can exchange them, or how they can get some incentives when they bring
something old back to a retailer.
These attitudes are reflected in the disposal rate of fashion and non-fashion consumers. The typical
assumption is that as consumption increases the rate of textile disposal will also increase (Lang, et al.,
2013). The survey results indicate that although all participants dispose of clothing, one’s fashion index
plays a role in textile disposal. In fact, people with a higher fashion index are less likely to dispose of clothes
than those with a low fashion index. Although the total amount of textiles disposed by fashion consumers
is higher, the disposal rate by fashion consumers is lower than for non-fashion consumers (38 percent to 50
percent, respectively).
The conceptual model in Figure 22 shows the relationship between a consumer’s fashion index and his or
her potential textile waste.
Figure 22: Relationship between a consumer’s fashion index and his or her potential textile waste
Fashion consumption and the highest potential level of waste
Textile waste
Non-fashion consumers
Fashion consumers
50% Waste reduction through donation (all consumers)
12% Waste reduction through re-sell, take back, swap (applies to fashion consumers only)
Relationship between a consumer’s fashion scale and his or her potential textile waste :
Fashion index
Waste level threshold between non-fashion and fashion consumers
117
The model shows, how the textile consumption and potential level of waste increases as the fashion index
increases (the top line). Regardless of their fashion index, the majority of consumers donate about half of
the total of their unwanted clothes, thus reducing the amount of their textiles which will be disposed by 50
percent (second line from the top). The threshold between non-fashion consumers and fashion consumers
occurs around a fashion index of 1.2. After this point the consumers become increasingly interested in
reselling, take-back and swapping of their clothing, and these channels lead to further reductions in textile
disposal—to a maximum of about 12 percent (third line from the top). This model shows textile
consumption cannot be directly equated with textile waste, and textile consumption cannot even be
equated with textile waste because garments will be reused. It might be more accurate to say instead that
increased consumption will increase the volume of unwanted garments.
Because fashion consumers reduce their textile disposal by 62 percent while non-fashion consumers do so
by 50 percent, this means that for every 10 articles of clothing purchased a fashion consumer will dispose
of 4.4, while a non-fashion consumer will dispose of 5 garments. However, consumers with a high fashion
index will nonetheless purchase clothes at an accelerated rate compared to consumers with a low fashion
index.
While donation would allow a waste reduction across all consumers, there is also greater potential for
waste reduction among fashion consumers by encouraging and promoting alternative methods like take-
back, resell and swapping.
5.5 The future of donation in Ontario
For more than 90 percent of all participants, donating clothing is an established channel to manage
unwanted clothing. It is so established that participants of the survey claimed that they intended to donate
more than 50 percent of all their garments. This number was consistent among fashion and non-fashion
consumers, and across demographics. Donating unwanted garments seems to be a social norm. For
example, charities in the UK have also reported an increase in clothing collections, and noted an increase in
people’s willingness to donate clothes (Birtwistle & Moore, 2007). In Ontario, meanwhile, Waste Diversion
Ontario has documented in their data call from municipalities an increase of “monitored “ textile collection
from 185 tonnes in 2002 to 2,317 tonnes in 2013 (Waste Diversion Ontario, 2015).

118
Nonetheless, the Council for Textile Recycling (2014) states that only 14.25 percent of all the garments will
be donated. This leaves 85 percent of garments going to landfills. Part of this high volume of textile waste
may be attributable to the fact that charities and textile collectors in Ontario place restrictions on the
condition of the clothing they collect (see section 2.3.2 “Examining textile collection and data monitoring in
the region of Waterloo”). Charities could further increase collections by encouraging consumers to donate
everything. Such a change would run the risk of charities receiving even more unsellable garments, as the
Council for Textile Recycling notes that of the donated material, only 47 percent can be reused; the
remaining 53 percent must be recycled due to their poor condition (Council for Textile Recycling, 2014).
Some clothing collectors already claim that the quality of the collected material has decreased because
consumers just donate everything (see section 2.8.4 “Donating used clothing”). In fact, 13 percent of
survey participants claim they donate everything regardless of the condition. Since 69 percent of survey
participants claimed they often or sometimes extend the lifecycle of their clothing, this will further reduce
the quality of garments that are eventually donated, to the point that they may even require recycling.
Textile recycling is possible for many textile products, but such an industry does not currently exist in
Ontario, and the energy cost for recycling some garments can be quite substantial (see section 2.4 “The
purpose of recycling”). Textile recycling is thus desirable, but often not financially viable (Porse, 2013), and
seems unlikely to succeed without sufficient support from the Ontario government. Increasing the amount
of textiles collected will unavoidably increase the amount of textiles that will require recycling, and the
success of the former action can only be achieved by considering ways of managing the latter.
5.6 Recommendations
The following recommendations are directed to those who have the ability to alter the management of
textile waste. Because of the logistics involved in each recommendation, which will determine their
feasibility, they are not listed according to a specific priority.
Province of Ontario
Ban textiles from landfills, similar to the European Union which introduced a textile ban in 2015
(see section 2.2.2 “The Environmental Protection Act (EPA)”).
Extend the basic blue box materials to include textiles.
Establish a textile recycling industry. This requires investments, knowledge and a constant supply
of used textiles.

119
Extend producer responsibility, making the producer responsible for the product past the point at
which it is sold to consumers. Doing so completely changes the way companies would design,
produce and market their products, and can only make for a more sustainable product which
reduces waste.
Teach basic knowledge about textiles and their repair. Though once a staple of school curriculum,
garment mending and sowing has since been removed, and no wonder there is now a lack of
knowledge when it comes to reusing and repurposing textiles. Unfortunately, most consumers also
have no knowledge of how to identify the quality of a garment and are not aware abut recycled
fibres.
Waste Management Organizations
The Recycling Council of Ontario (non-profit) could make textile recycling one of their topics.
Non-crown corporations like Waste Diversion Ontario (WDO) should not only monitor textile waste
but should help to develop further recycling programs in cooperation with industry funding
organizations (IFM) such as Stewardship Ontario (Service Ontario, 2002) (see section 2.2 “Ontario
provincial waste management & recycling mandates for textiles”) . Right now, a lack of resources
and interest from the municipalities prevents the WDO from including textiles as part of its
diversion programs.
Municipalities
Partner up with more charities, and also with companies from the used clothing industry for their
textile waste (see section 5.3.4 “Donate”).
Ban textiles in municipal landfills (if it is not done by the Province). Such a ban would immediately
increase the donations without additional costs to the municipality.
Connect property managers and business owners with the used clothing industry to host used
clothing bins. Since some companies from the used clothing industry have a bad reputation
because of their business practices (see section 2.4.2 “The function of charities in the textile
recycling process”), municipalities should consider giving licences for textile collections, this would
also help ban suspicious companies.
Increase accessibility to donation opportunities. This is key when it comes to textile recycling.
Multi-apartment houses, universities, or shopping malls should have donation boxes. However,
municipalities could also consider collecting textiles themselves by having monthly clothing waste
pick-up, maybe in clear plastic bags.

120
Initiate new platforms for flea markets and swap events to foster the second-hand market by
helping to organize these events and by providing the place and opportunity.
Textile collectors
Partner with privately owned companies from the used clothing industry, which accept garments
whatever the condition. Since charities are only interested in fundraising their missions, this would
allow charities to collect all textile materials without restrictions. Many charities have so far been
reluctant to partner up out of concern that the association might damage their image. They are
also hesitant about pairing with their closest competition.
Seek out new partnerships so that they can collect more garments no matter what the condition.
This may reduce profits, but the larger volume of donated material would help offset this.
Partner with recycling facilities. If textile collectors can cooperate with textile mills to deliver
specific fibres, fewer clothes will need to be shipped abroad. This would also develop and
contribute to a larger market for reclaimed fibres. Investments from the private sector and support
from the public is necessary to build and sustain these reclaimed fabric mills.
Retailers and Brands
Take back the products they sell and should use recycled materials in new products. This would
immediately increase the demand for recycled materials and would help to build up textiles
refineries.
Make products more durable and possible for alterations. This could reduce waste and increase the
potential use of garments. However, since every product will eventually be unwanted, products
should be easy to recycle, such as making products 100 percent polyester or by making products
which would be biodegradable.
Add additional information about resale, reuse and recycling methods to the already mandatory
sewn-in label for each garment.
Fast -fashion and fashion consumers
Remember that less consumption means less waste. Before buying a new garment, it is necessary
to consider whether new garments are really needed at this time (especially if their closets are
already overfull), and to consider other possibilities to rent, share or lease garments. Companies
like Rent frock Repeat in Toronto specialize in renting designer dresses for special occasions. When
looking for something new, they should consider second-hand first.

121
Seek out swap events as a means for acquiring new clothing and also to get rid of unwanted ones.
Resell unwanted garments. If they find second-hand stores too complicated they should try flea
market and garage sales.
Bring unwanted garments back to a retailer whenever shopping or browsing.
All consumers
Make better choices when purchasing new products, such as purchasing high quality products that
will last longer and are better designed for any kind of reuse. If shopping in a store, they should
seek out products made from reclaimed fibres by checking the material contents on the left side
seam of the product. Australian company Billabong offers T-shirts in fabric blends of recycled
polyester and organic cotton. US company Patagonia also has a range of products made from
reclaimed fibres. If their favourite store does not offer recycled fabrics, consumers should ask for
them by talking to a sales associate and expressing an interest.
Pass unwanted garments to friends, or reuse and repurpose them as cleaning rags.
Donate clothes to a specific charity either in store or at a drop-off bin.
Remember that fibre value is more important than the type or condition of garment. Even torn
socks can be recycled, and so they should donate no matter the condition. Although charities do
not advertise that they will take any clothes in any condition, they are collecting them. If
consumers feel uncomfortable with the idea that their clothes might end up in Africa (and there is
no guarantee that this will not happen) if nothing else, they should cut their unwanted clothes into
pieces and then donate those.
Remember that every fibre has a value and should be considered as a resource, not as a waste
source.
122
6 CONCLUSIONS
This section offers key take-away points from the research and results, as well as provides future areas of
research.
6.1 Introduction
This study establishes the fashion index of consumers as a predictor for the ways in which they will manage
their unwanted textiles. Past studies have considered the impact of attitudes towards fashion on consumer
textile disposal behaviour, but have focused mainly on drivers of clothing waste; nor have they sought to
construct a scale to actively model consumer attitudes and behaviours regarding fashion interest, shopping
frequency, and disposal methods. This study designed an online questionnaire and received more than 400
completed surveys. Participants were asked sixteen questions that utilized a 5-point Likert scale to model
their fashion interest, shopping frequency and disposal behaviour. The fashion index was developed by
integrating various academic research results to provide a metric for modeling an individual’s fashion
interest and textile disposal behaviours. The scale divides consumers into two main groups: fashion and
non-fashion consumers. The results indicate that an individual’s fashion scale is dependent on gender and
age but not on income, young women in particular had the highest fashion index, which confirms the
findings of Morgan and Birtwistle (2009) and Lang et al. (2013). What this study found (and which the
others did not even seek to examine) is that there are significant differences in the way fashion and non-
fashion consumers manage their textile waste. While all participants donate and dispose of unwanted
clothes, fashion consumers are more interested in and more likely to participate in alternative methods to
removing unwanted textiles such as swapping, reselling and take-back. Results also show that while
personal reuse and donation is widely practiced, so too is disposal. Interestingly, many consumers also
demonstrated a lack of awareness about alternatives to these common methods, in particular take-back
and swapping.
Establishing the influence of fashion interest on consumer waste management practices is a new approach
to examining and defining waste and required an interdisciplinary thinking and understanding to clarify the
terminology. The lack of a unified concept of “disposal” in the academic literature was particularly
123
challenging for developing a comprehensive scale. The refinement of word in this study contributes to a
better exchange between the academic disciplines regarding this topic.
6.2 Main findings from this research
This study is unique in Canada and at the very least serves to raise awareness about the issue of textile
waste. Many participants expressed a positive attitude towards the survey and some indicated that it
succeeded in educating them about new methods for managing their textile waste (see section “Appendix
I: Sample responses from participants of Survey”) suggesting that one of the main impediments to
consumers choosing environmentally sustainable methods of textile disposal is merely a lack of awareness
about the various options available.
1 Although the majority of participants reuse or repurpose their clothing, about a quarter of all
participants admit that they have no interest in reusing or repurposing their clothes.
2 Despite a discrepancy between what consumers estimate they do and what they finally will do,
clothing donation nonetheless remains an accepted social norm. People know that they should donate
their clothes and most consumers admit they have no barrier to doing so. Barriers which impede
participants from donating are the accessibility and the required time needed to bring unwanted
clothes to a required location.
3 The majority of participants are not aware about the fibre value of a garment.
4 About half of all participants get rid of their unwanted garments mainly using donation and disposal,
but nearly a tenth admit they throw everything into the waste.
5 About a third of all participants clean their closet whenever they notice something. This means that
people might only have few pieces when they want to get rid of them. Since participants will more
likely throw their unwanted garments into the waste when they have only a small volume, there is a
high potential for the garments mentioned to end up in the waste.
6 Take-back programs have a high acceptance but little implementation by retailers. There is therefore a
need to find possibilities to foster this channel. However, about a third of all participants were not
aware about this possibility. Barriers behind take – back programs are lack of interest and the required
time to bring the garment back to a retailer.
124
7 Although two out of five participants are highly interested in swap events, nearly a third were
unaware about this possibility to manage their unwanted garments.
8 While a small group of participants resell their garments and they state it works very well, the majority
of participants have barriers such as the required time and the feeling that the effort to sell a garment
is not worth the economic value.
6.3 Future areas of research
Swapping
Despite an interest in clothes swapping, few people have visited a swap event. The whole concept
is in early development, and requires further research. How great a role can swapping play in
diverting textiles from the landfill? Who should create and manage swapping events? Does it work
better among specific consumers and specific products, for example, among students or in a
neighbourhood association; or with specific kinds of clothes like children’s clothing or sports
equipment?
Waste Diversion
A problem remains determining a metric for successfully measuring the implementation of waste
diversion. For instance, to what extent does re-using a t-shirt as a cleaning rag count as a successful
reduction of waste? The next difficulty will be to find a way to apply this metric and accurately
measure the success of these activities. What happens to these garments after they are re-used,
swapped or re-sold? Will they remain in use as long as other garments? Or are they inevitably
destined for the landfill? Will acquiring second-hand garments reduce desire for new products?
More research is necessary to determine to what extent consumers treat second-hand garments
differently than newly purchased clothes.
Textile Recycling
All textiles can be recycled—but little research has examined the best methods. Should organic
material be composted or shredded? What kind of fabric material can be made with these new
“reclaimed fibres”? Since there is hardly any garment manufacturing in North American fashion,
fabric might be the wrong textile to produce, so what kind of industrial fabrics can be made
125
instead? For example, can these fibres be used for medical fabrics? What are the requirements
(including economic and legislative) for creating such a textile recycling industry in Canada?
More data is needed regarding the volume and condition of textiles that go to landfills in Canada.
These figures might compel municipalities to develop strategies for dealing with textile waste. For
example, if consumers typically only throw out heavily soiled and damaged garments that cannot
be reused, it would require a recycling industry rather than increased awareness about donation.
Fashion scale
Since the fashion scale did not receive a normal distribution in this survey, the next areas to
consider are whether the sample was representative or whether the questions need refinement.
Areas to consider would be how many questions are really necessary for such a scale, the degree to
which questions should be weighted, and whether a fashion scale can even reflect a normal
distribution.
Further research is needed to determine if consumers with a high fashion scale have different
barriers for dealing with unwanted garments than non-fashion consumers.
The fashion scale could be further developed as a tool by increasing the sample size and by
surveying specific consumer groups. Determining the fashion index distribution of employees at
Vogue, for example, would demonstrate whether the questionnaire could validly determine
fashion index and fashion scale.
More research is needed to determine the correlation between fashion attitude and behaviour. For
example, determining the fashion index of customers who bought something at a fast-fashion
retailer would indicate whether the fashion attitude reflects the fashion behaviour.
The fashion scale developed in this study could be applied to other studies to further determine
the impact of fashion interest on textile disposal behaviour, and even for other sectors as well,
such as determining the relationship between fashion interest and environmental attitude. More
research into correlating fashion index with environmental outlook would enable municipalities
and environmental groups to develop optimal strategies for improving environmental awareness
by targeting specific consumer groups based on their fashion index.
Further research is also needed to determine the impact of cultural traditions and beliefs on the
fashion scale. Is this current fashion scale applicable as a universal fashion scale, one that could be
used to model two culturally distinct nations like India and China, for example, or would each

126
culture require its own fashion scale? Another area to consider would be whether the fashion scale
is influenced by a nation’s economic development.
127
6.4 Final words
It is necessary to understand fashion consumers and in particular fast fashion consumers not simply as an
unmanageable problem as they are so often treated in many academic studies (Bhardwaj & Fairhurst,
2010; Birtwistle & Moore, 2007; Morgan & Birtwistle, 2009). While it is true that fashion consumers often
become bored by their clothes and seek new garments for pleasure rather than for need, there
nonetheless remains a possibility to moderate their consumption. Consumers can remain involved with
fashion without purchasing new products. Reusing, swapping, and reselling unwanted garments offer the
possibility to decrease consumption. Taken together, these channels offer a great opportunity to shift the
behaviour of fashion consumers away from fashion disposal towards more sustainable alternatives.
The problem of textile waste is still unaddressed in Ontario. Therefore, additional data about textile waste,
for example quantitative data about textile waste in Ontario’s landfills, are necessary to raise awareness
and further actions. The first step then before any of the other proposed actions is for the province and
municipalities to treat textile waste as an issue and to coordinate industry activities around monitoring,
recycling, reducing and hopefully eliminating textile waste in Ontario.
128
REFERENCES
Ackerman, F. (1996). Why do We Recycle?: markets, values, and public policy. Washington, DC: Island Press.
Babooram, A., & Wang, J. (2007). Recycling can help reduce the amount of waste entering landfills and help
conserve natural resources. EnviroStats, 1(1), 3-8.
Barnes, L., & Lea-Greenwood, G. (2006). Fast fashioning the supply chain: shaping the research agenda.
Journal of Fashion Marketing and Management, 10(3), 259-271.
Bhardwaj, V., & Fairhurst, A. (2010). Fast fashion: response to changes in the fashion industry. The
International Review of Retail, Distribution and Consumer Research, 20(1), 165-173.
Bianchi, C., & Birtwistle, G. (2012). Consumer clothing disposal behaviour: a comparative study.
International Journal of Consumer Studies, 36(3), 335-341.
Birtwistle, G., & Moore, C. (2007). Fashion clothing–where does it all end up? International Journal of Retail
& Distribution Management, 35(3), 210-216.
Bruce, M., & Daly, L. (2006). Buyer behaviour for fast fashion. Journal of Fashion Marketing and
Management, 10(3), 329-344.
Bureau of International Recycling. (2013). Textiles Retrieved December, 2013, from
http://www.bir.org/industry/textiles/?locale=en_US
Bye, E., & McKinney, E. (2007). Sizing up the Wardrobe—Why We Keep Clothes That Do Not Fit. Fashion
Theory: The Journal of Dress, Body & Culture, 11(4), 483-498.
Canadian Budget Binder. (2012 ). Buying Clothes from Second Hand Shops. Is it worth it? Retrieved
November, 2014, from http://canadianbudgetbinder.com/2012/02/28/buying-clothes-from-second-
hand-shops-is-it-worth-it/
Cattell, R. B. (1966). The scree test for the number of factors. Multivariate behavioral research, 1(2), 245-
276.
CharityStar. (2014). H & M COUNTRIES ACTIVITIES Retrieved November, 2014, from
http://hm.charitystar.com/en/home/
Cluver, B. G. (2008). Consumer clothing inventory management: ProQuest.
Coop, J., Kirby, D., Fairfax, J., & Welsh, P. (2013). Ontario Introduces Waste Reduction Strategy and
Proposed Waste Reduction Act, 2013 Retrieved October, 2014, from
http://www.osler.com/NewsResources/Ontario-Introduces-Waste-Reduction-Strategy-and-
Proposed-Waste-Reduction-Act-2013/
Cooper, T. (2004). Inadequate life? Evidence of consumer attitudes to product obsolescence. Journal of
Consumer Policy, 27(4), 421-449.
Council for Textile Recycling. (2014) Retrieved February, 17, 2014, from
http://www.weardonaterecycle.org/about/issue.html
Cronbach, L. J. (1951). Coefficient alpha and the internal structure of tests. Psychometrika, 16, 297-334.
Daneshvary, N., Daneshvary, R., & Schwer, R. K. (1998). Solid-waste recycling behavior and support for
curbside textile recycling. Environment and behavior, 30(2), 144-161.
Domina, T., & Koch, K. (1997). The textile waste lifecycle. Clothing and Textiles Research Journal, 15(2), 96-
102.

129
Domina, T., & Koch, K. (2001). Textile Recycling, Convenience, and the Older Adult. Journal of Family and
Consumer Sciences: From Research to Practice, 93(5), 35-40.
Domina, T., & Koch, K. (2002). Convenience and Frequency of Recycling Implications for Including Textiles
in Curbside Recycling Programs. Environment and behavior, 34(2), 216-238.
Dress for Success. (2014) Retrieved April 22, 2014, from http://www.dressforsuccess.org/
Eberle, H., Hermeling, H., Hornberger, M., Kilgus, R., Menzer, D., & Ring, W. (2004). Clothing technology.
Haan-Gruiten, Germany: Verlag Europa-Lehrmittel.
Ehrenfeld, J., & Gertler, N. (1997). Industrial ecology in practice: the evolution of interdependence at
Kalundborg. Journal of Industrial Ecology, 1(1), 67-79.
Environment Canada. (2012). National Inventory Report 1990-2010, Greenhouse Gas Sources and Sinks in
Canada
Europaeische Kommission. (2012). Deutschland spitze beim Recycling [Germany leading with regard to
recycling] Retrieved September, 2014, from
http://ec.europa.eu/deutschland/press/pr_releases/10551_de.htm
European Commission Environment. (2015). Directive 2008/98/EC on waste (Waste Framework Directive)
Retrieved June, 2015, from http://ec.europa.eu/environment/waste/framework/
Ferguson, M. L. (2014). H&M Launching Recycled Denim Capsule Retrieved February 8, 2014, from
http://www.wwd.com/fashion-news/fashion-scoops/hm-launching-recycled-denim-7371302
Fishbein, M., & Azjen, I. (1975). Belief, Attitude, Intention, and Behaviour: An Introduction to Theory and
Research: Addison-Wesley.
Fisher, E. (2014). Green Eileen Retrieved November, 2014, from http://www.greeneileen.org/
Fletcher, K. (2008). Sustainable Fashion and Textiles Design Journeys. London: Earthscan.
Fluid Survey. (2015). Survey Sample Size Calculator Retrieved February, 2015, from
https://fluidsurveys.com/survey-sample-size-calculator/
Frost, R. O., Kim, H.-J., Morris, C., Bloss, C., Murray-Close, M., & Steketee, G. (1998). Hoarding, compulsive
buying and reasons for saving. Behaviour Research and Therapy, 36(7), 657-664.
GAD Gooi en Vechtstreek. (2015). Wat gebeurt er met mijn afval? Retrieved May, 2015, from
http://www.gad.nl/Wat-gebeurt-er-met-uw-afval-.aspx
Gibson, C., & Stanes, E. (2011). Is green the new black? Exploring ethical fashion consumption. In T. Lewis &
E. Potter (Eds.), Ethical consumption : a critical introduction (pp. 169-185). Abingdon, UK: Routledge.
Giroux, L. (2014). State of Waste Management in Canada (pp. 134). Kanata, Ontario: Giroux Environmental
Consulting.
Goldsmith, R. E., & Hofacker, C. F. (1991). Measuring consumer innovativeness. Journal of the Academy of
Marketing Science, 19(3), 209-221.
Goodwill Industries International. (2014). Donate Stuff Retrieved November, 2014, from
https://www.goodwill.org/donate-and-shop/
Grace-Martin, K. (2008). Can Likert scale data ever be continuous. Article Alley.
Group.Inc, V. (2008). Victor Innovator Retrieved April, 22, 2014, from http://www.victor-innovatex.com
Ha-Brookshire, J. E., & Hodges, N. N. (2009). Socially responsible consumer behavior? Exploring used
clothing donation behavior. Clothing and Textiles Research Journal, 27(3), 179-196.
Hawley, J. (2007). From my closet to Africa: The dirt on post-consumer recycling. In L. Hoffman (Ed.), Future
Fashion White Papers (pp. 105-112). New York NY: Earth Pledge.

130
Iris Industries. (2013) Retrieved April, 22, 2014, from http://www.iris-industries.com/
Jackson, T. (2011). Prosperity without growth: Economics for a finite planet. London: Routledge.
Jacobs, H. E., & Bailey, J. S. (1982). Evaluating participation in a residential recycling program. Journal of
Environmental Systems, 12(2), 141-152.
Jacoby, J., Berning, C. K., & Dietvorst, T. F. (1977). What about disposition? The Journal of Marketing, 41(2),
22-28.
Jensen, J. (2012). Waste Audit Services Project Final Summary Report. In I. N. S. Resource Recovery Fund
Board (Ed.), (pp. 9). Halifax.
Joung, H.-M. (2013). Materialism and clothing post-purchase behaviors. Journal of consumer marketing,
30(6), 530-537.
Joung, H. M., & Park‐Poaps, H. (2013). Factors motivating and influencing clothing disposal behaviours.
International Journal of Consumer Studies, 37(1), 105-111.
Kaiser, H. F. (1960). The application of electronic computers to factor analysis. Educational and
psychological measurement.
Keiser, S. J., & Garner, M. B. (2012). Beyond design (Third ed.): New York, NY: Fairchild Publications, Inc.
Klepp, I. G. (2001). Hvorfor går klær ut av bruk [Why women stop using clothes ?] Avhending sett i forhold
til kvinners klesvaner Lysaker, SIFO Rapport (pp. 188). Oslo, Norway: Statens Instittut for
Forbruksforskining.
Kunz, G. I., & Garner, M. B. (2011). Going Global (2 ed.). New York: Fairchild.
Laers Statistics. (2013). Principal components analysis in SPSS Statistics Retrieved May, 2015, from
https://statistics.laerd.com/aboutus.php
Laitala, K. (2014). Consumers' clothing disposal behaviour–a synthesis of research results. International
Journal of Consumer Studies, 38(5), 444-457.
Laitala, K., & Boks, C. (2012). Sustainable clothing design: use matters. Journal of Design Research, 10(1),
121-139.
Laitala, K., Hauge, B., & Klepp, I. G. (2009). Large?: Clothing Sizes and Size Labeling: Nordic Council of
Ministers.
Lang, C., Armstrong, C. M., & Brannon, L. A. (2013). Drivers of clothing disposal in the US: An exploration of
the role of personal attributes and behaviours in frequent disposal. International Journal of
Consumer Studies, 37(6), 706-714.
Lee, J. Y., Halter, H., Johnson, K. K., & Ju, H. (2013). Investigating fashion disposition with young consumers.
Young Consumers: Insight and Ideas for Responsible Marketers, 14(1), 67-78.
Li, L., Frey, M., & Browning, K. J. (2010). Biodegradability study on cotton and polyester fabrics. Journal of
Engineered Fibers and Fabrics, 5(4), 42-53.
Local Buttons. (2014) Retrieved February, 2014, from http://www.localbuttons.ca/
M&S. (2014). Product and Servives Retrieved November, 2014, from
http://help.marksandspencer.com/support/products-services/oxfam-voucher
McKenzie-Mohr, D. (2013). Fostering sustainable behavior: An introduction to community-based social
marketing: New society publishers.
Meek, N. (2012). Waste Management Legislation in a Nutshell Retrieved October, 2014, from
http://haltonrecycles.wordpress.com/2012/06/13/waste-management-legislation-in-a-nutshell/

131
Mohammed Enterprises Tanzania Limited, M. (2014). Company Profile Retrieved November, 2014, from
http://www.metl.net/about/company-profile
Morgan, L. R., & Birtwistle, G. (2009). An investigation of young fashion consumers' disposal habits.
International Journal of Consumer Studies, 33(2), 190-198.
Muthu, S. S., Li, Y., Hu, J. Y., & Ze, L. (2012). Carbon footprint reduction in the textile process chain:
Recycling of textile materials. Fibers and Polymers, 13(8), 1065-1070.
N.N. (2011). The Big Mac Index in 2011 Retrieved October, 2014, from
http://www.economist.com/blogs/dailychart/2011/07/big-mac-index
NARTS The Association of Resale Professionals. (2014). Industry Statistics & Trends Retrieved November,
2014, from http://www.narts.org/i4a/pages/index.cfm?pageid=3285
Ontario Waste Management Association. (2013). DISPOSAL BANS ReThink Policy Paper Series (pp. 9).
Brampton: Ontario Waste Management Association.
Organization, W. T. (2012). Mexico files dispute against China on alleged subsidies to clothing and textile
products Retrieved November 22, 2013, from
http://www.wto.org/english/news_e/news12_e/ds451rfc_15oct12_e.htm
Park, E. J., Kim, E. Y., & Forney, J. C. (2006). A structural model of fashion-oriented impulse buying behavior.
Journal of Fashion Marketing and Management, 10(4), 433-446.
Porse, M. (2013). Is Sweden ready to implement a textile recycling system? Master, Textilhoegskolan, Boras,
Sweden.
Recycling Council of Ontario. (2014). How Waste is Regulated Retrieved July 14, 2014, from
https://www.rco.on.ca/how_waste_is_regulated
Region of Waterloo. (2013). Year End 2013 Population and Household Estimates for the Region of
Waterloo. In M. Parkin (Ed.). Waterloo.
Rencher, A. C. (2002). Principal component analysis. Methods of Multivariate Analysis, Second Edition, 380-
407.
Rivoli, P. (2005). The travels of a t-shirt in the global economy. Hoboken, NJ: John Wiley & Sons.
Rogers, E. M. (1971). Diffusion of innovations (2 ed.). New York: Free Press.
Rogers, E. M. (1983). Diffusion of Innovations (3rd ed.). New York: The Free Press.
Rogers, E. M. (2004). A prospective and retrospective look at the diffusion model. Journal of Health
Communication, 9(S1), 13-19.
Schmidt, M. (2008). The Sankey diagram in energy and material flow management. Journal of Industrial
Ecology, 12(1), 82-94.
Secondary Materials and Recycled Textiles. (2015, May). About Us: Council for Textile Recycling Retrieved
May, 2015, from http://www.smartasn.org/about/recycling_council.cfm
Sego, T. (2010). Mothers' experiences related to the disposal of children's clothing and gear: keeping Mister
Clatters but tossing broken Barbie. Journal of Consumer Behaviour, 9(1), 57-68.
Service Ontario. (2002). An Act to promote the reduction, reuse and recycling of waste Retrieved October,
2014, from http://www.e-
laws.gov.on.ca/html/source/statutes/english/2002/elaws_src_s02006_e.htm
Service Ontario. (2011). Ontario Regulation 101/94 Recycling and composting of municipal waste Retrieved
September, 2014, from http://www.e-laws.gov.on.ca/html/regs/english/elaws_regs_940101_e.htm

132
SF Environment. (2015). Clothes piling up? Retrieved April, 2015, from
http://www.sfenvironment.org/textiles
Shim, S. (1995). Environmentalism and consumers' clothing disposal patterns: an exploratory study.
Clothing and Textiles Research Journal, 13(1), 38-48.
Smith, J. (2012, April 17 – 19). How can understanding the consumer make fashion more sustainable? Paper
presented at the 10th European academy of design conference–crafting the future., Gothenburg,
Sweden.
Stall-Meadows, C., & Goudeau, C. (2012). An Unexplored Direction in Solid Waste Reduction: Household
Textiles and Clothing Recycling. Journal of Extension, 50(5), 5RIB3.
Statistics Canada. (2011a). Focus on Geography Series Retrieved April, 2015, from
http://www12.statcan.gc.ca/census-recensement/2011/as-sa/fogs-spg/Facts-pr-
eng.cfm?Lang=eng&GC=35
Statistics Canada. (2011b). Population, urban and rural, by province and territory (Ontario) Retrieved
March, 2015, from http://www.statcan.gc.ca/tables-tableaux/sum-som/l01/cst01/demo62g-eng.htm
Statistics Canada. (2013). Population by year, by province and territory Retrieved September, 2014, from
http://www.statcan.gc.ca/tables-tableaux/sum-som/l01/cst01/demo02a-eng.htm
Statistics Canada. (2014a). Individuals by total income level, by province and territory (Ontario) Retrieved
May, 2015, from http://www.statcan.gc.ca/tables-tableaux/sum-som/l01/cst01/famil105g-eng.htm
Statistics Canada. (2014b). Waste disposal per capita Retrieved September, 2014, from
http://www.statcan.gc.ca/tables-tableaux/sum-som/l01/cst01/envir32b-eng.htm
Steketee, G., & Frost, R. (2010). Stuff: Compulsive hoarding and the meaning of things: Houghton Mifflin
Harcourt.
Survey Sampling International. (2012). SSI POV: Online, 2015, from http://www.surveysampling.com/ssi-
media/Corporate/POVs-2012/Understanding_Incidence_POV.image
Swapsity. (2014). Swapsity Retrieved November, 2014, from http://www.swapsity.ca/pages/about
Tammemagi, H. Y. (1999). The waste crisis: landfills, incinerators, and the search for a sustainable future.
New York: Oxford University Press.
The American Apparel & Footwear Association. (2012). AAFA Releases Apparel Stats 2012 Report
Retrieved October, 2014, from https://www.wewear.org/aafa-releases-apparelstats-2012-report/
The American Apparel & Footwear Association. (2014). AAFA Releases ApparelStats 2013 and ShoeStats
2013 Reports Retrieved November, 2014, from https://www.wewear.org/aafa-releases-
apparelstats-2013-and-shoestats-2013-reports/
Thorpe, B., Kruszewska, I., & McPherson, A. (2004). Extended producer responsibility Clean Production
Action.
Tigert, D. J., Ring, L. J., & King, C. W. (1976). Fashion involvement and buying behavior: A methodological
study. Advances in consumer research, 3(1), 46-52.
Uitdenbogerd, D. E., Brouwer, N. E., & Groot-Marcus, J. P. (1998). Domestic energy saving potentials for
food and textiles: an empirical study. Wageningen, The Netherlands: Wageningen Institute for
Environment and Climate Research
United States Environmental Protection Agency. (2013). Textiles Retrieved February 18, 2014, from
http://www.epa.gov/epawaste/nonhaz/municipal/msw99.htm

133
United States Environmental Protection Agency. (2014). Municipal Solid Waste Generation, Recycling, and
Disposal in the United States:
Facts and Figures for 2012 Retrieved September, 2014, from
http://www.epa.gov/osw/nonhaz/municipal/pubs/2012_msw_fs.pdf
V. Goudeau, C. (2014). Ready to Tear? A study on Fashion and Consumer Disposal Behavior. Doctor,
Oklahoma State University, Oklahoma.
Waste Diversion Ontario. (2012). 2012 Other Recyclables (Residential). 18.
Waste Diversion Ontario. (2015). Other Municipal Recyclables Programs Retrieved May, 2015, from
http://www.wdo.ca/learn/documents/
Winsberg, M. E., Cassic, K. S., & Koran, L. M. (1999). Hoarding in obsessive-compulsive disorder: a report of
20 cases. Journal of Clinical Psychiatry.
Woolridge, A. C., Ward, G. D., Phillips, P. S., Collins, M., & Gandy, S. (2006). Life cycle assessment for
reuse/recycling of donated waste textiles compared to use of virgin material: An UK energy saving
perspective. Resources, conservation and recycling, 46(1), 94-103.
World Trade Organization. (2009). International Trade Statistics. Section 2;Merchandise trade by product
(107-114) Retrieved November 24, 2013, from
http://www.wto.org/english/res_e/statis_e/its2009_e/its09_merch_trade_product_e.pdf
World Trade Organization. (2012). International Trade Statistics. Section 2;Merchandise trade by product
(107-114) Retrieved November 24, 2013, from
http://www.wto.org/english/res_e/statis_e/its2009_e/its09_merch_trade_product_e.pdf
World Trade Organization. (2013). International Trade Statistics. Section 2;Merchandise trade by product
(120-132) Retrieved November 2014, from
http://www.wto.org/english/res_e/statis_e/its2013_e/its2013_e.pdf
Young, M. M., & Wallendorf, M. (1989). Ashes to ashes, dust to dust: Conceptualizing consumer disposition
of possessions. Paper presented at the Proceedings of the AMA winter educator’s conference.
Zimmer, L. (2014). Freitag Launches 100 Percent Compostable Clothing Made From Plants Retrieved
October, 2014, from http://www.ecouterre.com/freitag-launches-100-percent-compostable-fabric-
made-from-plants/

134
APPENDIX A: SURVEY QUESTIONNAIRE
Ontario Clothing Survey
[Q1] What is your gender identity?
Female
Male
Other
I prefer not to answer this question
[Q2] What is your current marital status?
Single
Single living with parents
Single with children
Living with partner
Living with partner and children
Other, please specify... ______________________
I prefer not to answer this question
[Q3] Your age range is between
18-24 years
25-34 years
35-44 years
45-54 years
55-64 years
above 65
I prefer not to answer this question

135
For each of the statements below, please choose the response that best describes your interest in fashion?

136
strongly
agree
agree neither agree
or disagree
disagree strongly
disagree
[Q4 a0] I seek out new fashion trends and I
spend a fairly high proportion of my
income and time on fashion
[Q4 a1] I read the fashion news regularly
and try to keep my wardrobe up-to date
with fashion trends
[Q4 a2] I usually try to be different from
others by wearing fashionable clothing
[Q4 a3] I am interested in shopping at
fashion specialty stores rather than
department stores for my fashion needs
[Q4 a4] I am usually the first among my
friends to buy the latest clothing styles
[Q4 a5] Compared to my friends, I own
more of the latest fashion styles
strongly
agree
agree neither agree
or disagree
disagree strongly
disagree
[Q4 b0] I think I am a trendsetter and my
clothes are very fashionable
[Q4 b1] I am usually the first to know the
latest fashion trends
[Q4 b2] Friends regard me as a good source
of fashion advice
[Q4 b3] I like to buy new clothing early, just
when the fashion trend begins
[Q4 b4] I follow the fashion styles of
celebrities and I find they influence my
fashion purchasing habits
[Q4 b5] I often influence the types of
clothing styles my friends buy
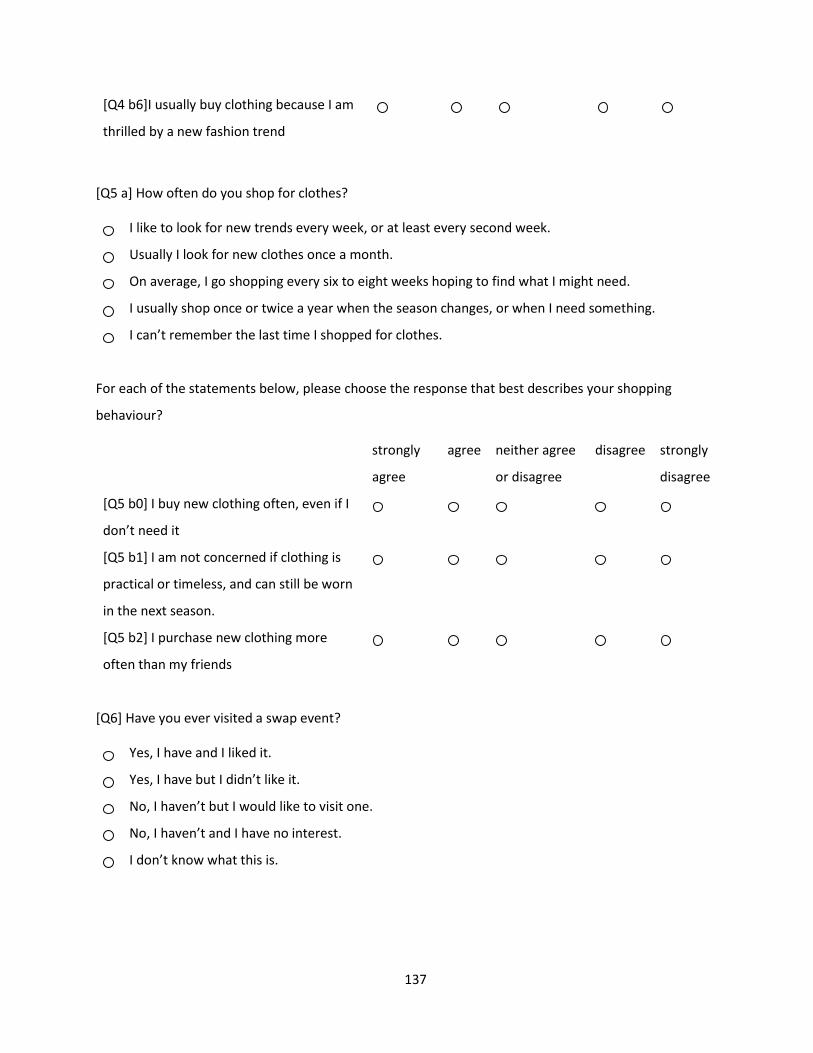
137
[Q4 b6]I usually buy clothing because I am
thrilled by a new fashion trend
[Q5 a] How often do you shop for clothes?
I like to look for new trends every week, or at least every second week.
Usually I look for new clothes once a month.
On average, I go shopping every six to eight weeks hoping to find what I might need.
I usually shop once or twice a year when the season changes, or when I need something.
I can’t remember the last time I shopped for clothes.
For each of the statements below, please choose the response that best describes your shopping
behaviour?
strongly
agree
agree neither agree
or disagree
disagree strongly
disagree
[Q5 b0] I buy new clothing often, even if I
don’t need it
[Q5 b1] I am not concerned if clothing is
practical or timeless, and can still be worn
in the next season.
[Q5 b2] I purchase new clothing more
often than my friends
[Q6] Have you ever visited a swap event?
Yes, I have and I liked it.
Yes, I have but I didn’t like it.
No, I haven’t but I would like to visit one.
No, I haven’t and I have no interest.
I don’t know what this is.

138
I don’t know what this is: Swapping is a new trend which offers possibilities for consumers to discard their
clothes by meeting with other consumers and friends to exchange their old garments. Usually at the end of
a swap event the leftover clothes will be donated to a charity.
[Q7 a] What do you think about bringing your used clothing back to a retailer and receiving some incentives
for them?
I think this is a great idea.
I think this is a great idea, but I don’t know a retailer who offers this opportunity.
I don't think anybody wants my old clothing.
I have never heard about this possibility
I think this is too complicated.
[Q7 b] Have you ever participated in such a retailer “take-back program”?
Yes, I have done this before.
No, I haven’t done this before.
[Q8] Have you ever re-sold a garment in a second-hand store or online?
I often practise this; I think it works very well.
I have tried and it worked.
I have tried, but it either didn’t work or I don’t find it’s worth the time.
I have never tried, but maybe I should.
I have never tried and I have no interest in doing so.
[Q9] Considering distance and accessibility, how convenient is your nearest donation spot or charity store?
I know a few places and at least one is very convenient for me to reach.
I know where a donation box or a store is and it is reasonable to reach.
I know at least one place, but it is not very convenient to reach.
I don’t know where to donate my clothes, but I would like to know.
I don’t know where to donate my clothes, and I don’t care.

139
I don’t need a donation station or charity store, I can call a charity and they will pick up my clothing.
[Q10] Do you extend the lifecycle of your clothing? (This means reusing or repurposing your clothing, which
includes giving old clothes to friends or other family members, restyling old clothes, repurposing clothes as
working clothes, or using clothes as cleaning rags)
Yes, I do this all the time
Yes, I do this sometimes
Yes, I have done this, but very seldom
No, I don't do this
No, I never thought about this
If you extend the lifecycle of your clothes, please evaluate what you do most.
most
often
often sometimes rarely never
[Q11 0] I pass them to friends or family members
[ Q 11 1] I wear them for gardening and other hands-
on work
[Q11 2] I use them as cleaning rags
[Q11 3] I restyle my old garments into new garments
or other things

140
When you really have no other use for YOUR old clothes (i.e. not the clothes of your partner or children),
how do you discard them? Estimate, using an approximate percentage, the degree to which you use each
method. The amounts given for all five methods should total 100% If there are options which you don’t
consider, give them a zero.
[Q12 0]I try to resell them
[Q12 1]I take them back to a retailer
[Q12 2] I swap my clothes
[Q12 3] I donate my clothes
[Q12 4] I throw them out
[Q13] For those who responded that they throw some of their clothing into the waste, please choose the
most applicable answer for why this method is used: (For those who responded that they throw 0% of their
clothing into the waste, please choose "not applicable".)
There seems to be no other option. I never thought about doing anything else with them.
It is the most convenient way. It’s too much time and effort to drive around donating clothes.
I want to get rid of my clothes immediately.
I don’t think my old clothes have any value. I throw them out when they are out of fashion.
I don’t want anybody to wear my old clothes.
When I eventually decide to throw my clothes away, they are in such a bad condition and show signs
of wear and tear that nobody could wear them anymore.
Not applicable.
Other, please specify… ______________________
141
[Q14 a] Do you discard the old clothes THAT BELONG TO your family members, partners, or friends?
Yes, I do this for my ______________________
No, I don't do this
[Q 14 b] Do you usually discard your old clothing yourself or does somebody else do it for you?
I discard my own unwanted clothing
Somebody else discards my clothes for me

142
What do you do with the following when you want them gone? Choose the most applicable answer.
Reuse or
Repurpose
Re-
sell
them
Take-back
Program
Swap Donate Throw
out
Not
applicable
[Q15 0] Your heavily-used
socks (elastic is loose, soles
are thinning or have
holes)
[Q15 1] Your clean but
used underwear, still in
good condition
[Q15 2] Your jeans with
rips or holes in the front or
the seams
[Q15 3] Your sweater that
has lost its colour
[Q15 4] Your suit or dress
that is out of fashion
[Q 15 5] Your shirt with
some stains
[Q 15 6] Your winter coat
with a broken front zipper,
extremely difficult and
expensive to mend
[Q15 7] Your unworn t-
shirt
[Q 15 8] Your expensive
wool coat, suit, or dress,
no longer worn, and signs
of use

143
[Q 16 a] Do you use different disposal methods if you have a lot of clothing to dispose of versus a few
pieces?
Yes, I use a different method.
No, I don’t use a different method.
What is the difference in how you discard of your clothing depending on the volume and the number of
pieces you have?
Re- sell
them
Take back to
a retailer
Swap
them
Donate
them
Throw
them out
[Q16 b0] If the volume is small, or if I only
have a few pieces of clothing to discard, I
prefer to
[Q16 b1] If the volume is large, or if I have
a lot of clothes to discard, I prefer to
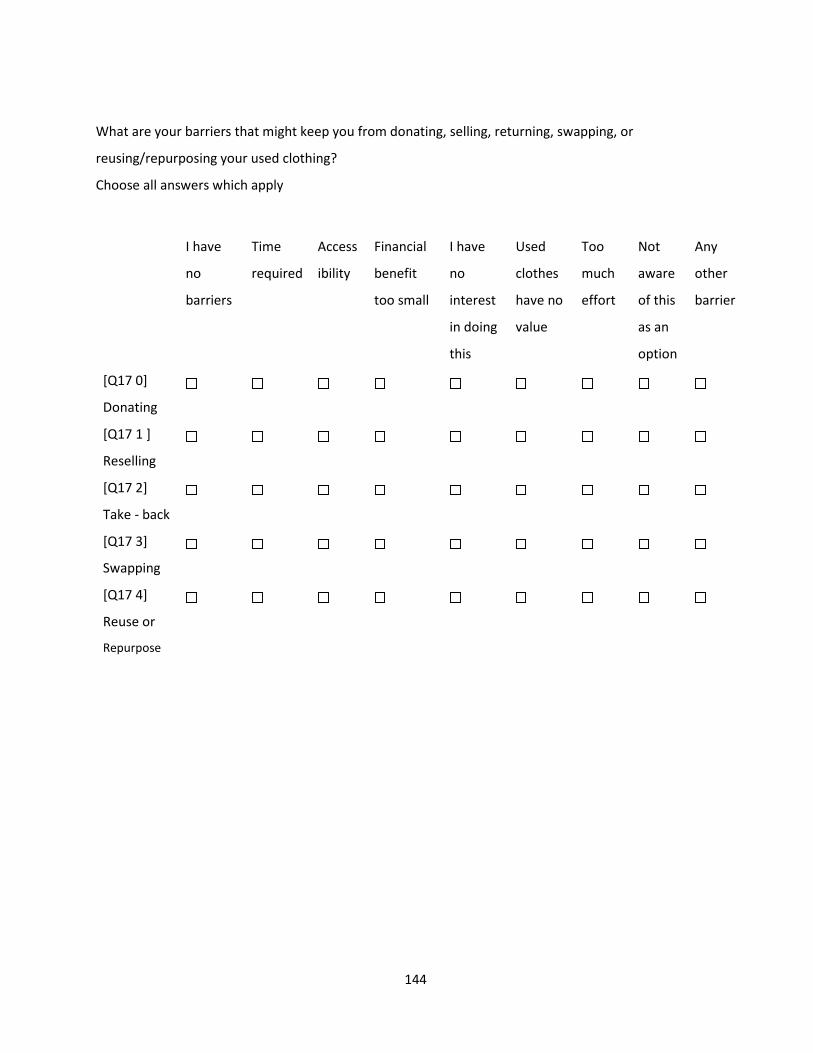
144
What are your barriers that might keep you from donating, selling, returning, swapping, or
reusing/repurposing your used clothing?
Choose all answers which apply
I have
no
barriers
Time
required
Access
ibility
Financial
benefit
too small
I have
no
interest
in doing
this
Used
clothes
have no
value
Too
much
effort
Not
aware
of this
as an
option
Any
other
barrier
[Q17 0]
Donating
[Q17 1 ]
Reselling
[Q17 2]
Take - back
[Q17 3]
Swapping
[Q17 4]
Reuse or
Repurpose

145
[Q18] Which statement best describes the MAIN reason you usually clean out your closet or clothing
drawers?
I dispose of clothes I no longer want when I notice them.
I sort and dispose of clothes in my closet on a consistent basis, usually in the spring and fall.
When I have no more space in my closet, I sort and dispose my clothes.
When there is an external prompt, like a call from a charity for clothing donations.
When my partner is getting angry about me and forces me to do so.
It is so hard for me to dispose of my clothes, so I keep them
[Q19 a] What is your personal income?
Less than $ 10,000 per year
Between $ 10,000 and $ 34,999
Between $ 35,000 and $ 49,999
Between $ 50,000 and $ 74,999
Between $ 75,000 and $ 99,999
Between $ 100,000 and $ 149,999
Between $ 150,000 and $ 199,999
Between $ 200,000 and $ 249,999
Above $ 250,000
I have no personal income, but I share a household income.
I prefer not to answer this question

146
[Q19 b] What is your household income?
Less than $ 10,000 per year
Between $ 10,000 and $ 34,999
Between $ 35,000 and $ 49,999
Between $ 50,000 and $ 74,999
Between $ 75,000 and $ 99,999
Between $ 100,000 and $ 149,999
Between $ 150,000 and $199,999
Between $ 200,000 and $ 249,999
Above $ 250,000
I don’t want to answer this question
[Q20] Where do you live?
A rural area, in a village with a population below 1000 inhabitants
In a town or city above 1000 – 3,999 inhabitants
In a town or city between 4,000 – 9,999 inhabitants
In a town or city between 10,000 – 49,999 inhabitants
In a city between 50,000 – 99,999 inhabitants
In a city between 100,000 – 499,999 inhabitants
In a city with 500,000 inhabitants and more
[Q21] NEARLY DONE
do you have any additional comments about this survey? Is there anything you want to share with the
investigator? You are more than welcome to provide any comment, but because this is an anonymous
survey the researchers have no way of identifying you or getting in touch with you should you choose to
tell something about yourself or your life experiences.

147
APPENDIX B: CORRELATION TABLE OF FASHION SCALE
See following page.
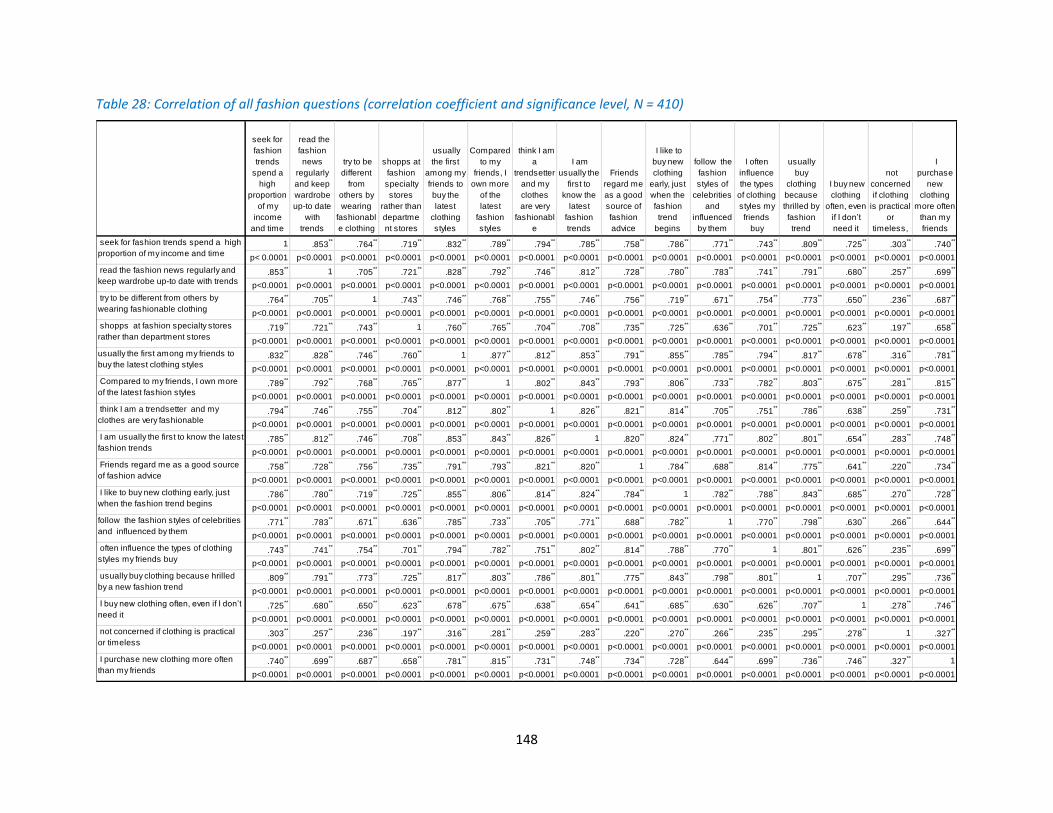
148
Table 28: Correlation of all fashion questions (correlation coefficient and significance level, N = 410)
seek for
fashion
trends
spend a
high
proportion
of my
income
and time
read the
fashion
news
regularly
and keep
wardrobe
up-to date
with
trends
try to be
different
from
others by
wearing
fashionabl
e clothing
shopps at
fashion
specialty
stores
rather than
departme
nt stores
usually
the first
among my
friends to
buy the
latest
clothing
styles
Compared
to my
friends, I
own more
of the
latest
fashion
styles
think I am
a
trendsetter
and my
clothes
are very
fashionabl
e
I am
usually the
first to
know the
latest
fashion
trends
Friends
regard me
as a good
source of
fashion
advice
I like to
buy new
clothing
early, just
when the
fashion
trend
begins
follow the
fashion
styles of
celebrities
and
influenced
by them
I often
influence
the types
of clothing
styles my
friends
buy
usually
buy
clothing
because
thrilled by
fashion
trend
I buy new
clothing
often, even
if I don’t
need it
not
concerned
if clothing
is practical
or
timeless,
I
purchase
new
clothing
more often
than my
friends
1 .853**
.764**
.719**
.832**
.789**
.794**
.785**
.758**
.786**
.771**
.743**
.809**
.725**
.303**
.740**
p< 0.0001 p<0.0001 p<0.0001 p<0.0001 p<0.0001 p<0.0001 p<0.0001 p<0.0001 p<0.0001 p<0.0001 p<0.0001 p<0.0001 p<0.0001 p<0.0001 p<0.0001 p<0.0001
.853** 1 .705
**.721
**.828
**.792
**.746
**.812
**.728
**.780
**.783
**.741
**.791
**.680
**.257
**.699
**
p<0.0001 p<0.0001 p<0.0001 p<0.0001 p<0.0001 p<0.0001 p<0.0001 p<0.0001 p<0.0001 p<0.0001 p<0.0001 p<0.0001 p<0.0001 p<0.0001 p<0.0001 p<0.0001
.764**
.705** 1 .743
**.746
**.768
**.755
**.746
**.756
**.719
**.671
**.754
**.773
**.650
**.236
**.687
**
p<0.0001 p<0.0001 p<0.0001 p<0.0001 p<0.0001 p<0.0001 p<0.0001 p<0.0001 p<0.0001 p<0.0001 p<0.0001 p<0.0001 p<0.0001 p<0.0001 p<0.0001 p<0.0001
.719**
.721**
.743** 1 .760
**.765
**.704
**.708
**.735
**.725
**.636
**.701
**.725
**.623
**.197
**.658
**
p<0.0001 p<0.0001 p<0.0001 p<0.0001 p<0.0001 p<0.0001 p<0.0001 p<0.0001 p<0.0001 p<0.0001 p<0.0001 p<0.0001 p<0.0001 p<0.0001 p<0.0001 p<0.0001
.832**
.828**
.746**
.760** 1 .877
**.812
**.853
**.791
**.855
**.785
**.794
**.817
**.678
**.316
**.781
**
p<0.0001 p<0.0001 p<0.0001 p<0.0001 p<0.0001 p<0.0001 p<0.0001 p<0.0001 p<0.0001 p<0.0001 p<0.0001 p<0.0001 p<0.0001 p<0.0001 p<0.0001 p<0.0001
.789**
.792**
.768**
.765**
.877** 1 .802
**.843
**.793
**.806
**.733
**.782
**.803
**.675
**.281
**.815
**
p<0.0001 p<0.0001 p<0.0001 p<0.0001 p<0.0001 p<0.0001 p<0.0001 p<0.0001 p<0.0001 p<0.0001 p<0.0001 p<0.0001 p<0.0001 p<0.0001 p<0.0001 p<0.0001
.794**
.746**
.755**
.704**
.812**
.802** 1 .826
**.821
**.814
**.705
**.751
**.786
**.638
**.259
**.731
**
p<0.0001 p<0.0001 p<0.0001 p<0.0001 p<0.0001 p<0.0001 p<0.0001 p<0.0001 p<0.0001 p<0.0001 p<0.0001 p<0.0001 p<0.0001 p<0.0001 p<0.0001 p<0.0001
.785**
.812**
.746**
.708**
.853**
.843**
.826** 1 .820
**.824
**.771
**.802
**.801
**.654
**.283
**.748
**
p<0.0001 p<0.0001 p<0.0001 p<0.0001 p<0.0001 p<0.0001 p<0.0001 p<0.0001 p<0.0001 p<0.0001 p<0.0001 p<0.0001 p<0.0001 p<0.0001 p<0.0001 p<0.0001
.758**
.728**
.756**
.735**
.791**
.793**
.821**
.820** 1 .784
**.688
**.814
**.775
**.641
**.220
**.734
**
p<0.0001 p<0.0001 p<0.0001 p<0.0001 p<0.0001 p<0.0001 p<0.0001 p<0.0001 p<0.0001 p<0.0001 p<0.0001 p<0.0001 p<0.0001 p<0.0001 p<0.0001 p<0.0001
.786**
.780**
.719**
.725**
.855**
.806**
.814**
.824**
.784** 1 .782
**.788
**.843
**.685
**.270
**.728
**
p<0.0001 p<0.0001 p<0.0001 p<0.0001 p<0.0001 p<0.0001 p<0.0001 p<0.0001 p<0.0001 p<0.0001 p<0.0001 p<0.0001 p<0.0001 p<0.0001 p<0.0001 p<0.0001
.771**
.783**
.671**
.636**
.785**
.733**
.705**
.771**
.688**
.782** 1 .770
**.798
**.630
**.266
**.644
**
p<0.0001 p<0.0001 p<0.0001 p<0.0001 p<0.0001 p<0.0001 p<0.0001 p<0.0001 p<0.0001 p<0.0001 p<0.0001 p<0.0001 p<0.0001 p<0.0001 p<0.0001 p<0.0001
.743**
.741**
.754**
.701**
.794**
.782**
.751**
.802**
.814**
.788**
.770** 1 .801
**.626
**.235
**.699
**
p<0.0001 p<0.0001 p<0.0001 p<0.0001 p<0.0001 p<0.0001 p<0.0001 p<0.0001 p<0.0001 p<0.0001 p<0.0001 p<0.0001 p<0.0001 p<0.0001 p<0.0001 p<0.0001
.809**
.791**
.773**
.725**
.817**
.803**
.786**
.801**
.775**
.843**
.798**
.801** 1 .707
**.295
**.736
**
p<0.0001 p<0.0001 p<0.0001 p<0.0001 p<0.0001 p<0.0001 p<0.0001 p<0.0001 p<0.0001 p<0.0001 p<0.0001 p<0.0001 p<0.0001 p<0.0001 p<0.0001 p<0.0001
.725**
.680**
.650**
.623**
.678**
.675**
.638**
.654**
.641**
.685**
.630**
.626**
.707** 1 .278
**.746
**
p<0.0001 p<0.0001 p<0.0001 p<0.0001 p<0.0001 p<0.0001 p<0.0001 p<0.0001 p<0.0001 p<0.0001 p<0.0001 p<0.0001 p<0.0001 p<0.0001 p<0.0001 p<0.0001
.303**
.257**
.236**
.197**
.316**
.281**
.259**
.283**
.220**
.270**
.266**
.235**
.295**
.278** 1 .327
**
p<0.0001 p<0.0001 p<0.0001 p<0.0001 p<0.0001 p<0.0001 p<0.0001 p<0.0001 p<0.0001 p<0.0001 p<0.0001 p<0.0001 p<0.0001 p<0.0001 p<0.0001 p<0.0001
.740**
.699**
.687**
.658**
.781**
.815**
.731**
.748**
.734**
.728**
.644**
.699**
.736**
.746**
.327** 1
p<0.0001 p<0.0001 p<0.0001 p<0.0001 p<0.0001 p<0.0001 p<0.0001 p<0.0001 p<0.0001 p<0.0001 p<0.0001 p<0.0001 p<0.0001 p<0.0001 p<0.0001 p<0.0001
I like to buy new clothing early, just
when the fashion trend begins
seek for fashion trends spend a high
proportion of my income and time
read the fashion news regularly and
keep wardrobe up-to date with trends
try to be different from others by
wearing fashionable clothing
shopps at fashion specialty stores
rather than department stores
usually the first among my friends to
buy the latest clothing styles
Compared to my friends, I own more
of the latest fashion styles
think I am a trendsetter and my
clothes are very fashionable
I am usually the first to know the latest
fashion trends
Friends regard me as a good source
of fashion advice
follow the fashion styles of celebrities
and influenced by them
often influence the types of clothing
styles my friends buy
usually buy clothing because hrilled
by a new fashion trend
I buy new clothing often, even if I don’t
need it
not concerned if clothing is practical
or timeless
I purchase new clothing more often
than my friends

149
APPENDIX C: COMMUNALITIES OF FASHION INTEREST AND SHOPPING BEHAVIOUR
Table 29: Principal component analysis: Communalities of the fashion interest and shopping behaviour
Questions to identify a person’s fashion interest and shopping behaviour Communalities
I seek out new fashion trends and I spend a fairly high proportion of my income and
time on fashion
0.81
I read the fashion news regularly and try to keep my wardrobe up-to-date with fashion
trends
0.78
I usually try to be different from others by wearing fashionable clothing 0.73
I am interested in shopping at fashion specialty stores rather than department stores
for my fashion needs
0.68
I am usually the first among my friends to buy the latest clothing styles 0.86
Compared to my friends, I own more of the latest fashion styles 0.84
I think I am a trendsetter and my clothes are very fashionable 0.79
I am usually the first to know the latest fashion trends 0.83
Friends regard me as a good source of fashion advice 0.78
I like to buy new clothing early, just when the fashion trend begins 0.82
I follow the fashion styles of celebrities and I find they influence my fashion purchasing
habits
0.72
I often influence the types of clothing styles my friends buy 0.77
I usually buy clothing because I am thrilled by a new fashion trend 0.83
I buy new clothing often, even if I don’t need it 0.61
I am not concerned if clothing is practical or timeless, and can still be worn in the next
season.
0.11
I purchase new clothing more often than my friends 0.72
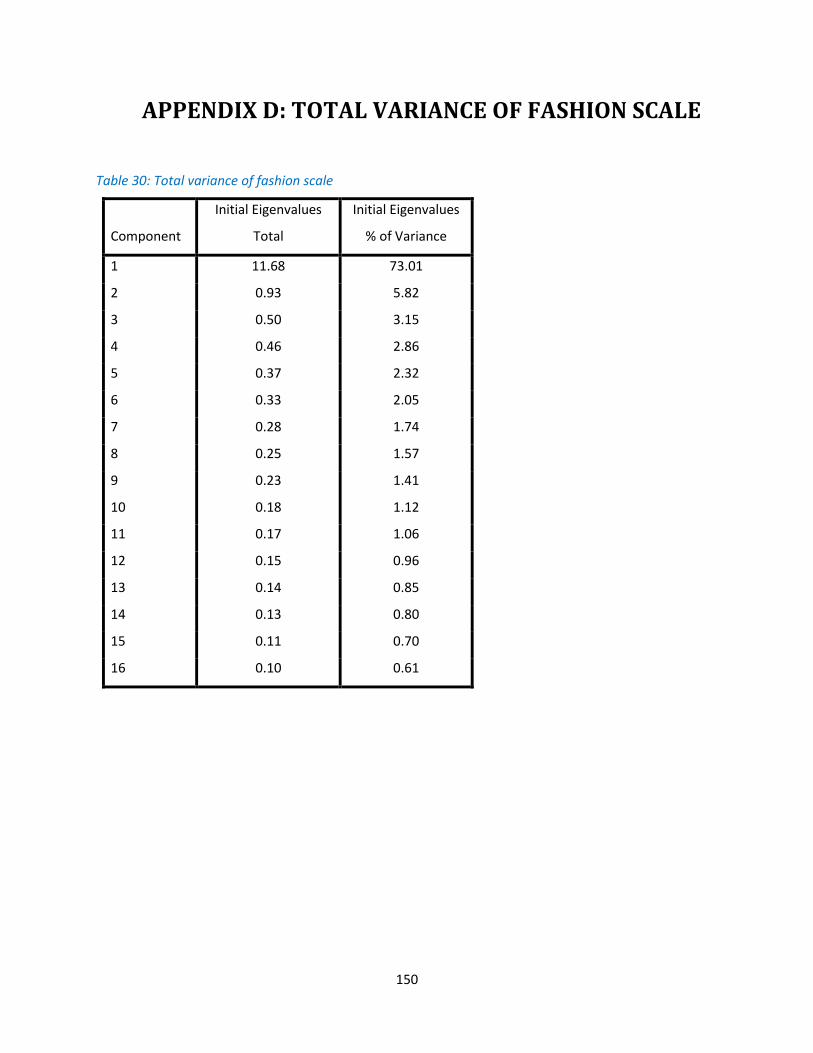
150
APPENDIX D: TOTAL VARIANCE OF FASHION SCALE
Table 30: Total variance of fashion scale
Component
Initial Eigenvalues
Total
Initial Eigenvalues
% of Variance
1 11.68 73.01
2 0.93 5.82
3 0.50 3.15
4 0.46 2.86
5 0.37 2.32
6 0.33 2.05
7 0.28 1.74
8 0.25 1.57
9 0.23 1.41
10 0.18 1.12
11 0.17 1.06
12 0.15 0.96
13 0.14 0.85
14 0.13 0.80
15 0.11 0.70
16 0.10 0.61

151
APPENDIX E: MULTIPLE COMPARISON, FASHION SCALE-AGE, GENDER, SWAPPING
Table 31: Multiple Comparison, fashion scale – age, gender, swapping
Source df F Sig.
Corrected Model 53 4.5 <0.0001
Intercept 1 1447.6 <0.0001
Swapping 4 6.8 <0.0001
Gender 1 0.4 0.548
Age 5 14.9 <0.0001
Swapping * Gender 4 1.3 0.280
Swapping * Age 19 1.1 0.388
Gender * Age 5 1.7 0.132
Swapping * Gender * Age 15 1.6 0.077
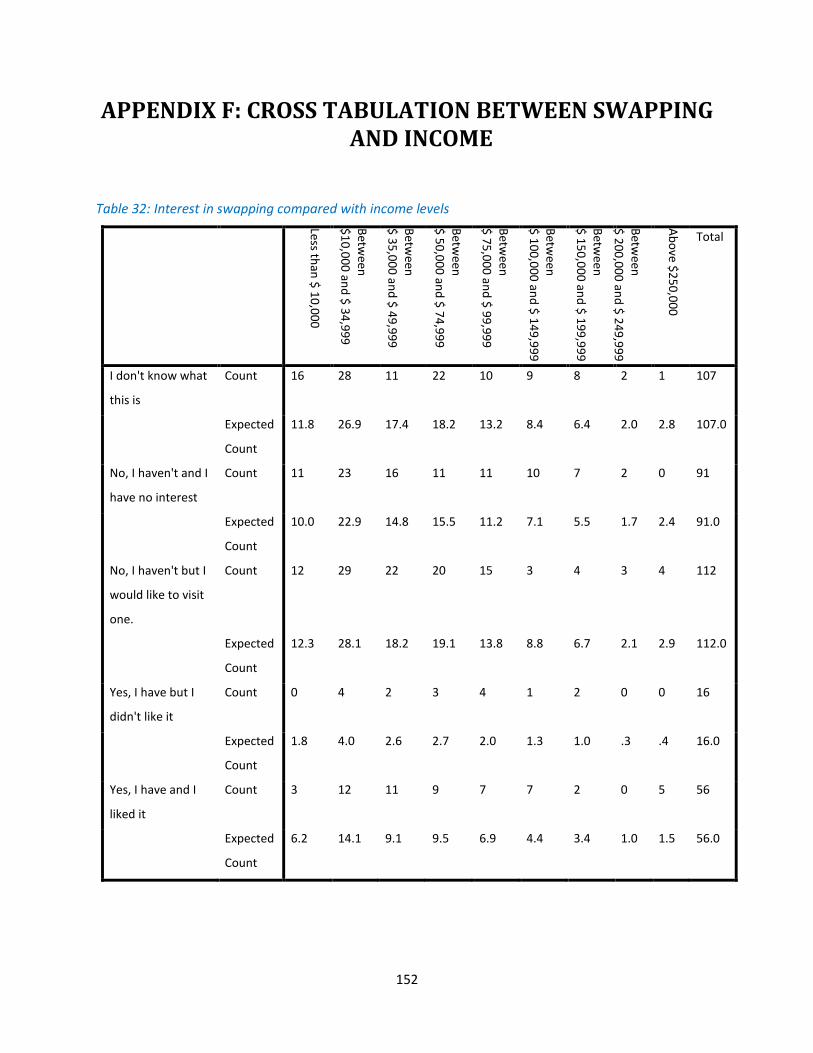
152
APPENDIX F: CROSS TABULATION BETWEEN SWAPPING AND INCOME
Table 32: Interest in swapping compared with income levels
Less than
$ 1
0,0
00
Betw
een
$1
0,0
00
and
$ 3
4,9
99
Betw
een
$ 3
5,0
00
and
$ 4
9,9
99
Betw
een
$ 5
0,0
00
and
$ 7
4,9
99
Betw
een
$ 7
5,0
00
and
$ 9
9,9
99
Betw
een
$ 1
00
,00
0 an
d $
14
9,9
99
Betw
een
$ 1
50
,00
0 an
d $
19
9,9
99
Betw
een
$ 2
00
,00
0 an
d $
24
9,9
99
Ab
ove $
25
0,0
00
Total
I don't know what
this is
Count 16 28 11 22 10 9 8 2 1 107
Expected
Count
11.8 26.9 17.4 18.2 13.2 8.4 6.4 2.0 2.8 107.0
No, I haven't and I
have no interest
Count 11 23 16 11 11 10 7 2 0 91
Expected
Count
10.0 22.9 14.8 15.5 11.2 7.1 5.5 1.7 2.4 91.0
No, I haven't but I
would like to visit
one.
Count 12 29 22 20 15 3 4 3 4 112
Expected
Count
12.3 28.1 18.2 19.1 13.8 8.8 6.7 2.1 2.9 112.0
Yes, I have but I
didn't like it
Count 0 4 2 3 4 1 2 0 0 16
Expected
Count
1.8 4.0 2.6 2.7 2.0 1.3 1.0 .3 .4 16.0
Yes, I have and I
liked it
Count 3 12 11 9 7 7 2 0 5 56
Expected
Count
6.2 14.1 9.1 9.5 6.9 4.4 3.4 1.0 1.5 56.0

153
APPENDIX G: RESULTS OF SCHEFFÉ TEST: SUBSETS OF GROUPS ACCORDING TO ATTITUDES TOWARDS
TAKE-BACK PROGRAMS
Table 33: Mean fashion scale for each subset of groups according to categories of attitudes towards take-back programs (1 = low, 5 = high)
Take-back attitude N
Subset for alpha = 0.05
1 2
I don’t think anybody wants my old clothing 45 1.9956
I have never heard about this possibility 68 2.0755
I think this is too complicated 11 2.5697 2.5697
I think this is a great idea, but I don’t know a retailer who offers this
opportunity 127 2.7029 2.7029
I think this is a great idea 157 3.0883
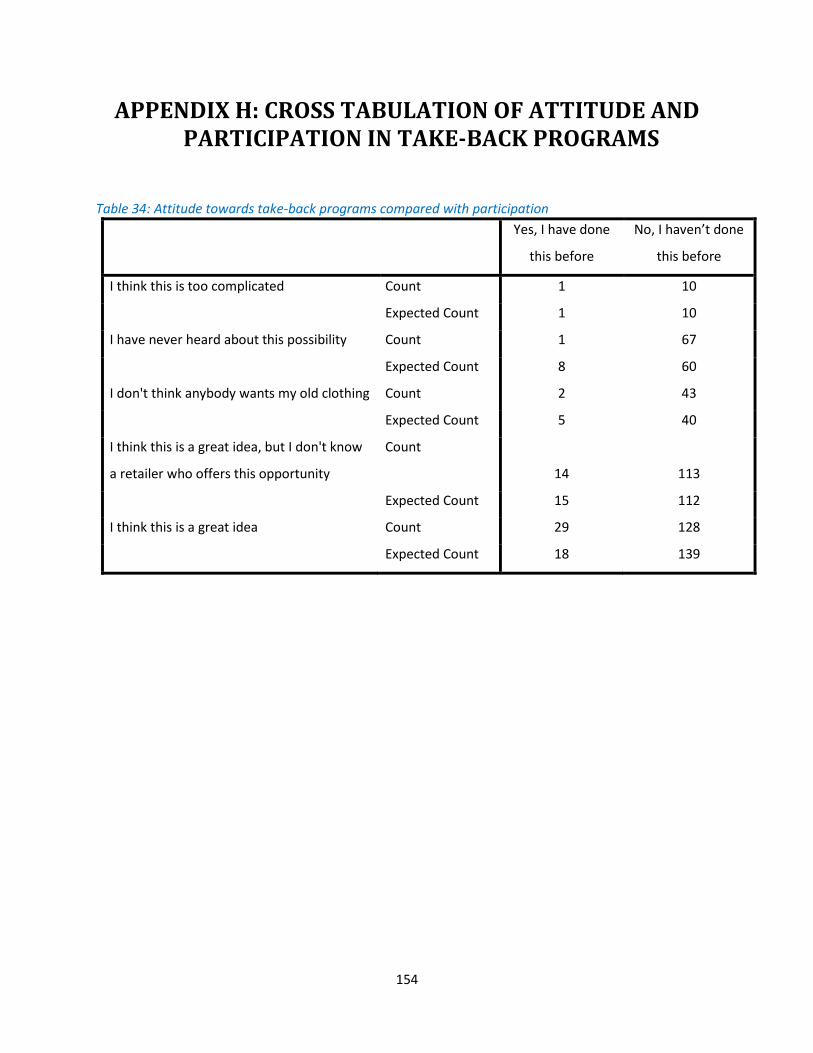
154
APPENDIX H: CROSS TABULATION OF ATTITUDE AND PARTICIPATION IN TAKE-BACK PROGRAMS
Table 34: Attitude towards take-back programs compared with participation
Yes, I have done
this before
No, I haven’t done
this before
I think this is too complicated Count 1 10
Expected Count 1 10
I have never heard about this possibility Count 1 67
Expected Count 8 60
I don't think anybody wants my old clothing Count 2 43
Expected Count 5 40
I think this is a great idea, but I don't know
a retailer who offers this opportunity
Count
14 113
Expected Count 15 112
I think this is a great idea Count 29 128
Expected Count 18 139
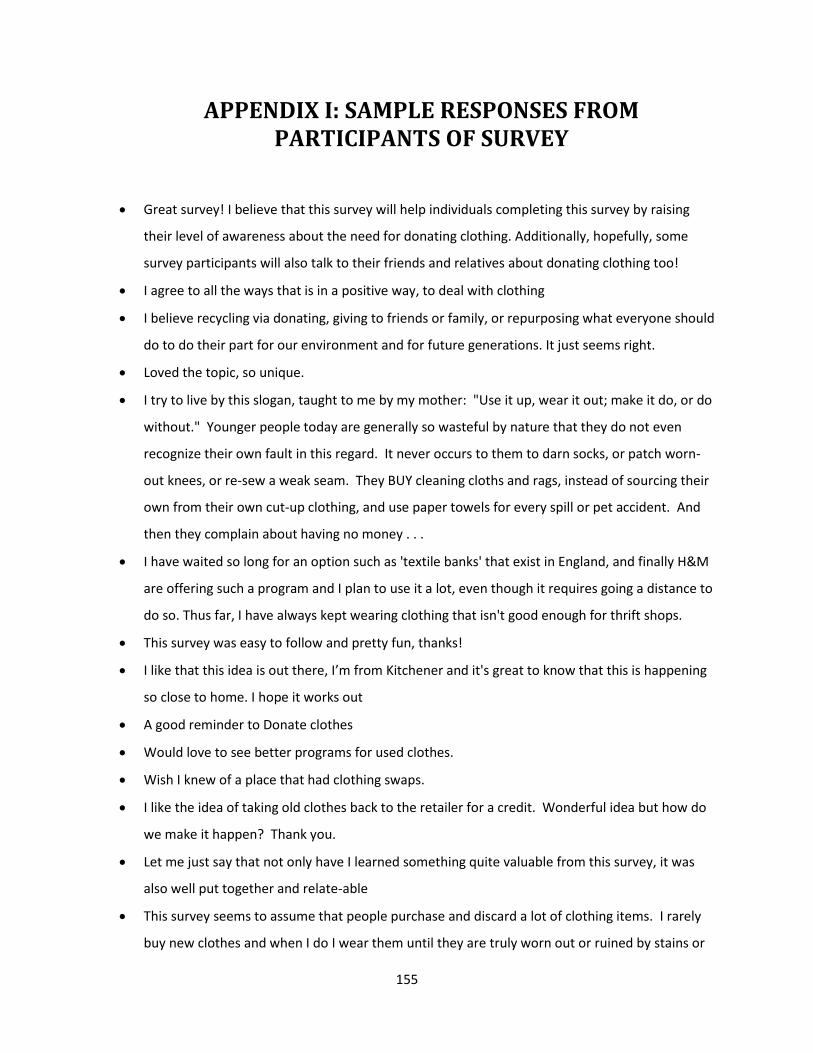
155
APPENDIX I: SAMPLE RESPONSES FROM PARTICIPANTS OF SURVEY
Great survey! I believe that this survey will help individuals completing this survey by raising
their level of awareness about the need for donating clothing. Additionally, hopefully, some
survey participants will also talk to their friends and relatives about donating clothing too!
I agree to all the ways that is in a positive way, to deal with clothing
I believe recycling via donating, giving to friends or family, or repurposing what everyone should
do to do their part for our environment and for future generations. It just seems right.
Loved the topic, so unique.
I try to live by this slogan, taught to me by my mother: "Use it up, wear it out; make it do, or do
without." Younger people today are generally so wasteful by nature that they do not even
recognize their own fault in this regard. It never occurs to them to darn socks, or patch worn-
out knees, or re-sew a weak seam. They BUY cleaning cloths and rags, instead of sourcing their
own from their own cut-up clothing, and use paper towels for every spill or pet accident. And
then they complain about having no money . . .
I have waited so long for an option such as 'textile banks' that exist in England, and finally H&M
are offering such a program and I plan to use it a lot, even though it requires going a distance to
do so. Thus far, I have always kept wearing clothing that isn't good enough for thrift shops.
This survey was easy to follow and pretty fun, thanks!
I like that this idea is out there, I’m from Kitchener and it's great to know that this is happening
so close to home. I hope it works out
A good reminder to Donate clothes
Would love to see better programs for used clothes.
Wish I knew of a place that had clothing swaps.
I like the idea of taking old clothes back to the retailer for a credit. Wonderful idea but how do
we make it happen? Thank you.
Let me just say that not only have I learned something quite valuable from this survey, it was
also well put together and relate-able
This survey seems to assume that people purchase and discard a lot of clothing items. I rarely
buy new clothes and when I do I wear them until they are truly worn out or ruined by stains or

156
severe damage, in which case I use them for rags, when possible, or play them in the garbage if
not usable as a rag.
It would be great if retailers would take their cloths back and give you a credit / cash back.
This is a good survey to raise awareness
Related Documents


![Textile Technology [Read-Only]textile.yazd.ac.ir/ms.ahmadi/Downloads/Textile Technology/Textile... · Textile Technology (Pictures) Edited by: M. S. Ahmadi Textile Technology 1 Yazd](https://static.cupdf.com/doc/110x72/5e786641131316263558e076/textile-technology-read-only-technologytextile-textile-technology-pictures.jpg)


