Household Demographics and Economics May 31, 2006

Household Demographics and Economics May 31, 2006.
Dec 23, 2015
Welcome message from author
This document is posted to help you gain knowledge. Please leave a comment to let me know what you think about it! Share it to your friends and learn new things together.
Transcript

Household Demographics and
Economics
May 31, 2006

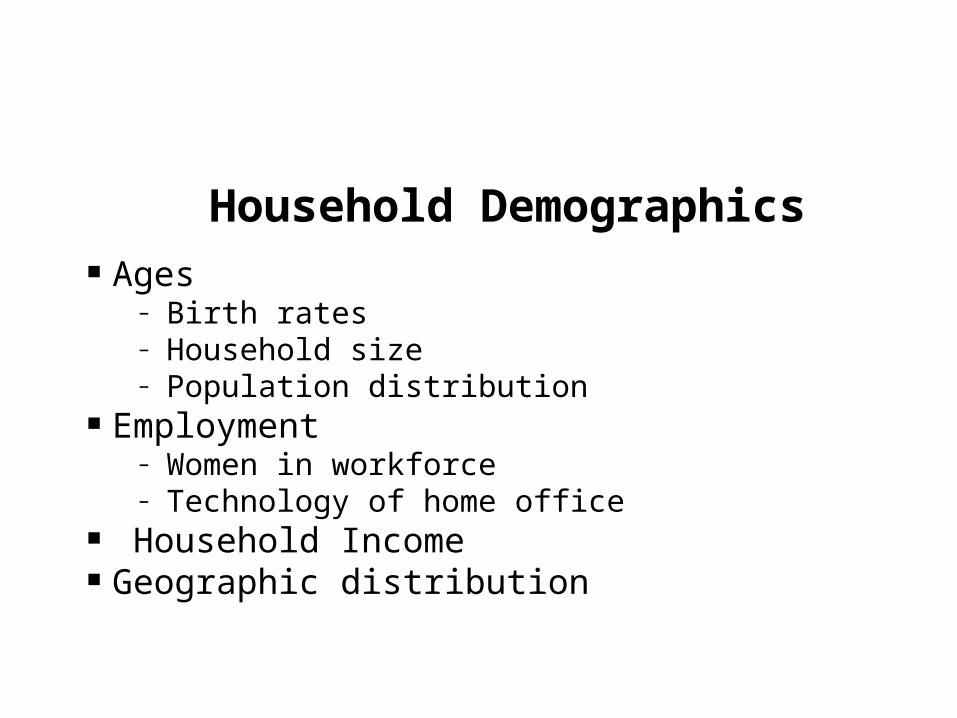
Household Demographics Ages
– Birth rates– Household size– Population distribution
Employment– Women in workforce– Technology of home office
Household Income Geographic distribution
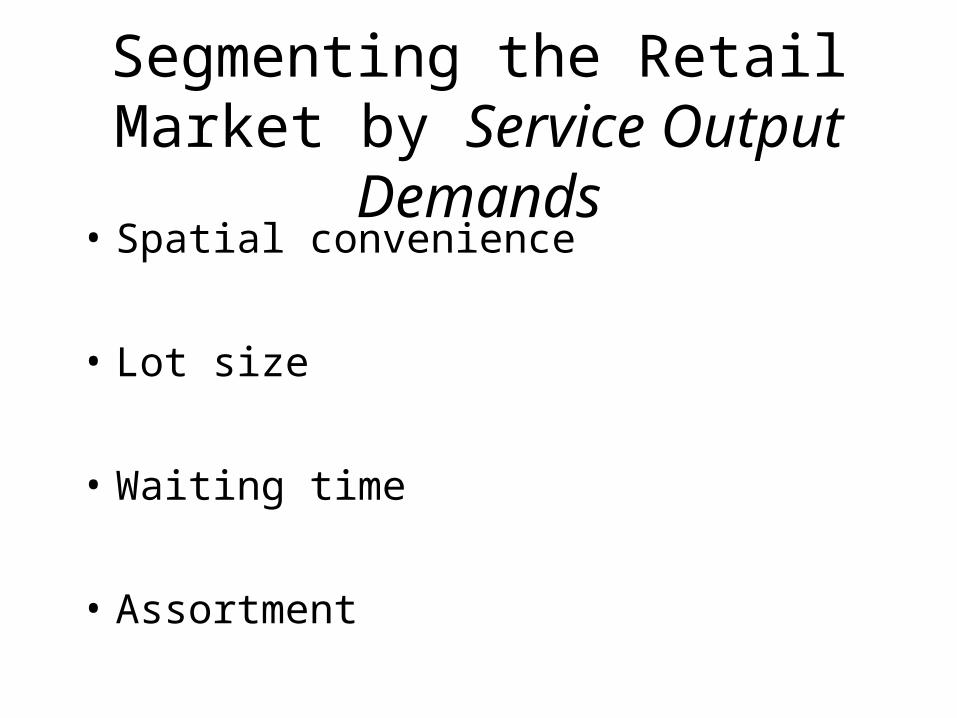
Segmenting the Retail Market by Service Output Demands
• Spatial convenience
• Lot size
• Waiting time
• Assortment

Coughlin, et al, p. 65
• “The channel segmentation process should be carefully designed to produce groups of buyers who (1) are maximally similar within a group, (2) are maximally different between groups, and (3) differ on dimensions that matter for a distribution system.
• In retailing, this culminates in…

What are the economies of the household—why has it persisted as an institution?
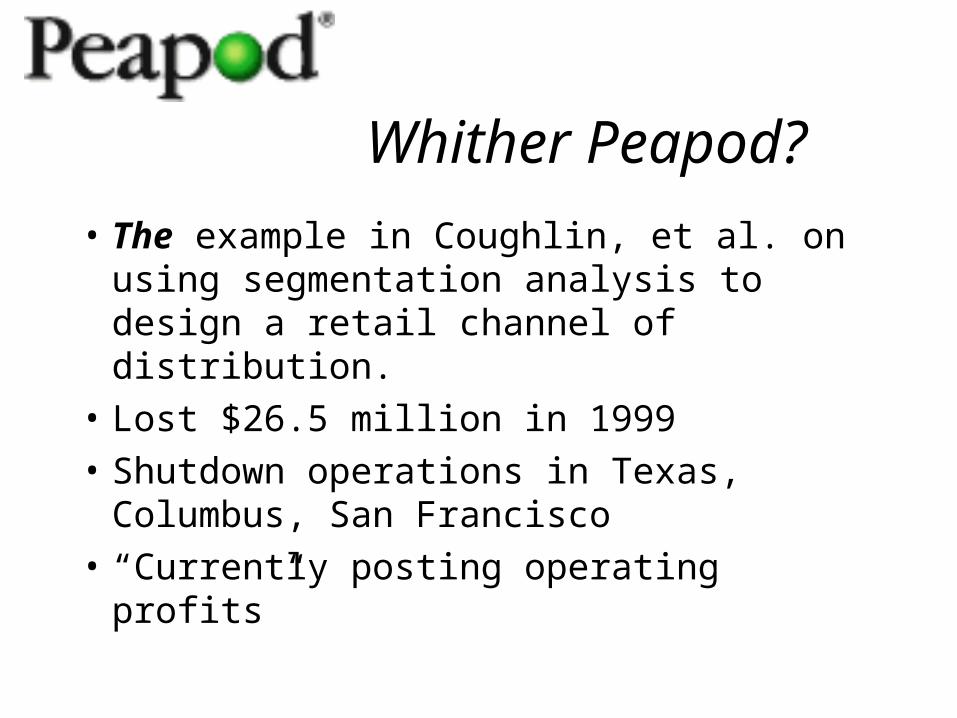
Whither Peapod?
• The example in Coughlin, et al. on using segmentation analysis to design a retail channel of distribution.
• Lost $26.5 million in 1999
• Shutdown operations in Texas, Columbus, San Francisco
• “Currently posting operating profits”
Household Demographics Ages
– Birth rates– Household size– Population distribution
Employment– Women in workforce– Technology of home office
Household Income Geographic distribution

Live Births per 1,000
14.0
14.5
15.0
15.5
16.0
16.5
17.0
1975 1980 1985 1990 1995 2000
Birth rates, reported in number of live births per 1,000 persons.
Denominator problems?

1976 1998 2004All Women 5,684,000 11,113,000 11,535,000Children ever born 100.0% 100.0% 100.0%None 10.2% 19.0% 19.3%One 9.6% 17.3% 17.4%Two 21.7% 35.8% 34.5%Three 22.7% 18.2% 18.1%Four or more 35.9% 9.6% 7.4%
Fertility IndicatorsWomen 40-44

5x number of “never married”
Never married women 228,000 1,118,000Children ever born 100.0% 100.0%None 75.5% 66.8%One 8.7% 10.9%Two or more 15.8% 22.3%

Live Births and the Household:
• Ages of mothers:
• Family status for the newborn infant:
• Future challenges to the family:

United States 15.9 12.4% Arkansas 14.4 18.8 Texas 18.2 15.0 Utah 22.0 9.5 West Virginia 12.0 9.7
Birth Rates, 1988 (per 1000)
Percent to Women under 20
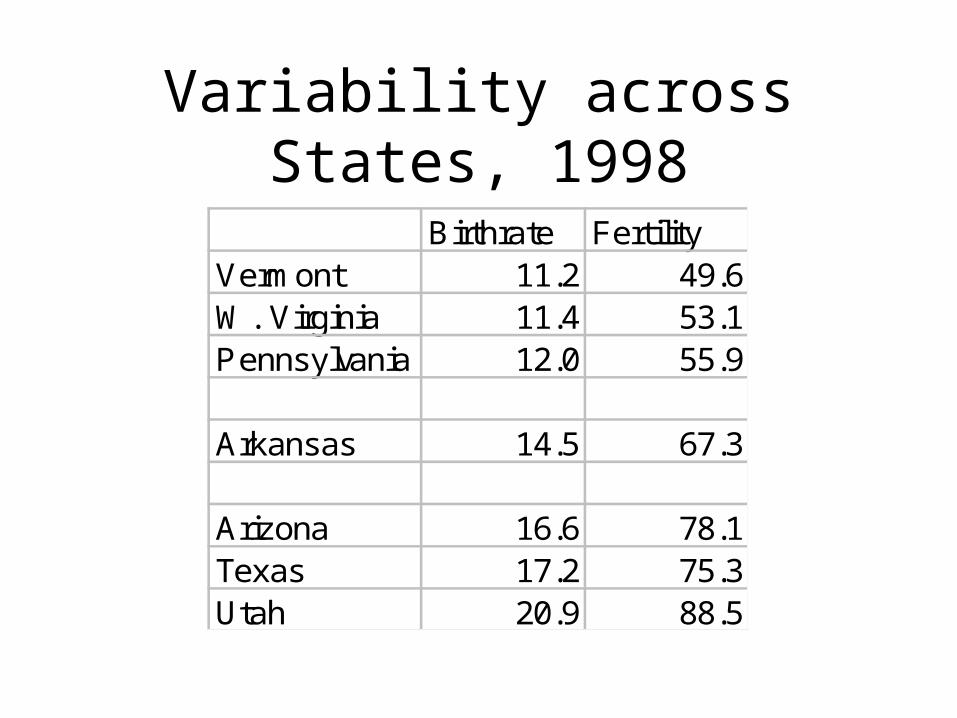
Variability across States, 1998
Birthrate FertilityVermont 11.2 49.6W. Virginia 11.4 53.1Pennsylvania 12.0 55.9
Arkansas 14.5 67.3
Arizona 16.6 78.1Texas 17.2 75.3Utah 20.9 88.5
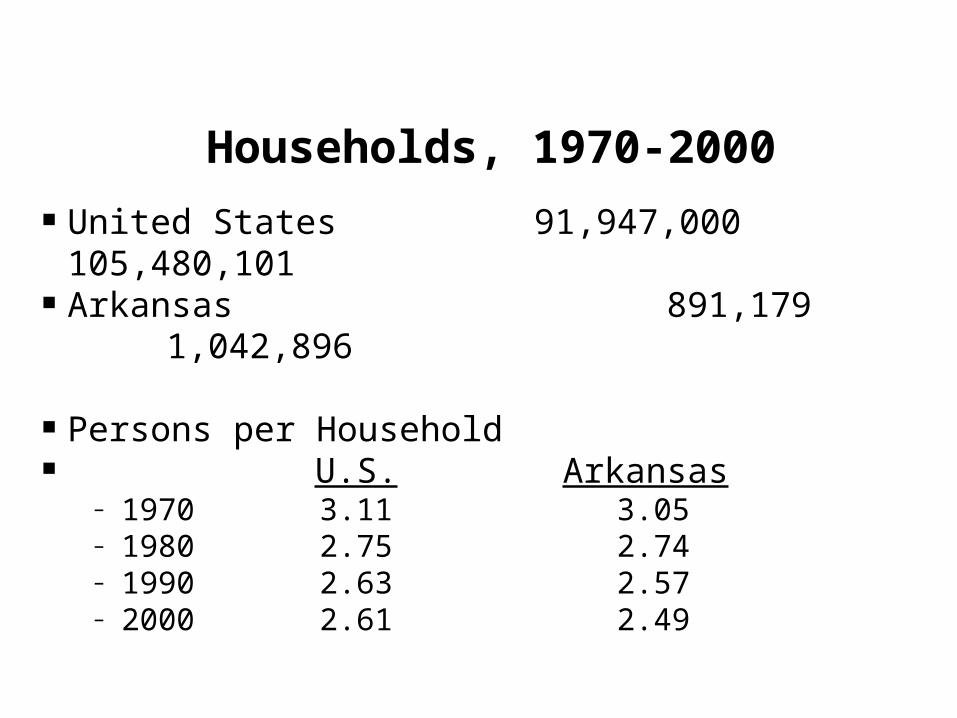
Households, 1970-2000 United States 91,947,000 105,480,101 Arkansas 891,179 1,042,896
Persons per Household U.S. Arkansas
– 1970 3.11 3.05– 1980 2.75 2.74– 1990 2.63 2.57– 2000 2.61 2.49
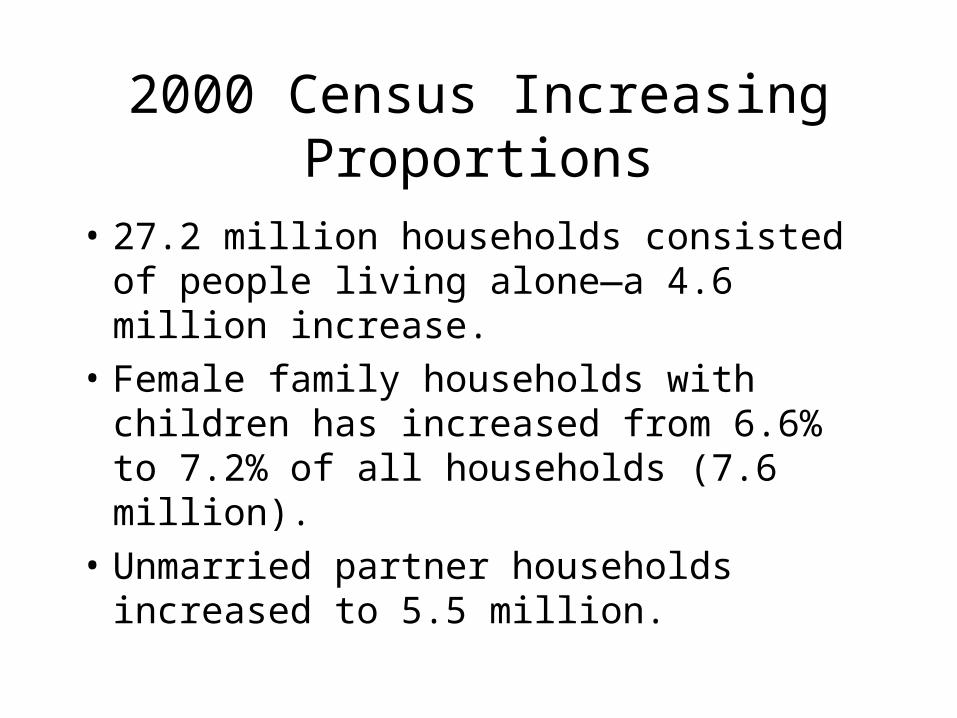
2000 Census Increasing Proportions
• 27.2 million households consisted of people living alone—a 4.6 million increase.
• Female family households with children has increased from 6.6% to 7.2% of all households (7.6 million).
• Unmarried partner households increased to 5.5 million.

Separate Issues for Retailers
Birthrate HH size IncomeNew Jersey 14.1 2.68 48,021Alaska 16.3 2.74 47,994Maryland 13.8 2.61 46,685
Mississippi 15.2 2.63 28,499W. Virginia 11.4 2.60 27,488Arkansas 14.5 2.49 26,162

Birthrate and Household Size: States
10.0
12.0
14.0
16.0
18.0
20.0
22.0
2.00 2.20 2.40 2.60 2.80 3.00 3.20

State Household Income and Household Size
20,000
25,000
30,000
35,000
40,000
45,000
50,000
2.00 2.20 2.40 2.60 2.80 3.00 3.20

Implications
Favors (?)– Discount department store
chains– Supercenter concept– "Category Killers"– Internet & mail order
searching– Home appliance dealers– Convenience oriented
retailers
Hurts (?)– Traditional department
stores– "High end" specialty stores– Conventional grocery store
chains– Independent office supply
firms– Direct selling organizations
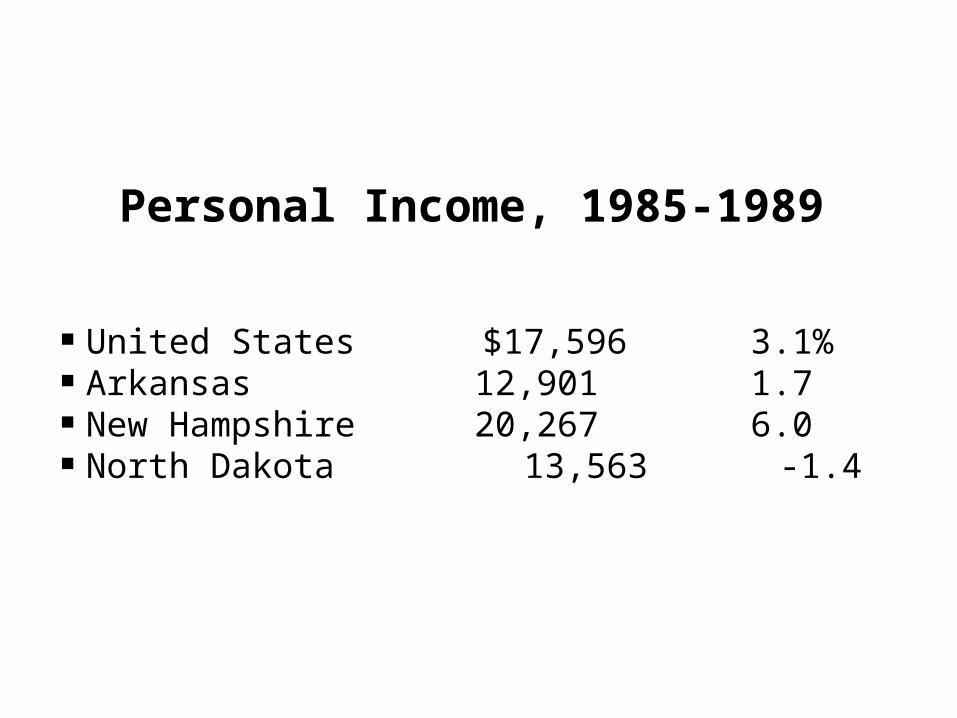
Personal Income, 1985-1989
United States $17,596 3.1% Arkansas 12,901 1.7 New Hampshire 20,267 6.0 North Dakota 13,563 -1.4

"Going Stale"Tupperware
Profile of a "Tupperware Lady" in San Jose, CA Household of the 1950s is rare occurrence today
– Difficult to schedule parties– Difficult to find salespeople– 40% of Tupperware's sales are from people who skip the
parties A product suitable for direct mail, but potential dealer
rebellion prevents it.

Household Economics
Declining household size Almost 60% of the women with children under 6 are
working outside the home. Share of households with two parents and at least one
child has dropped from 45% (1960) to 25%. Smaller household incomes Fixed costs and discretionary income?

Generational Cohorts
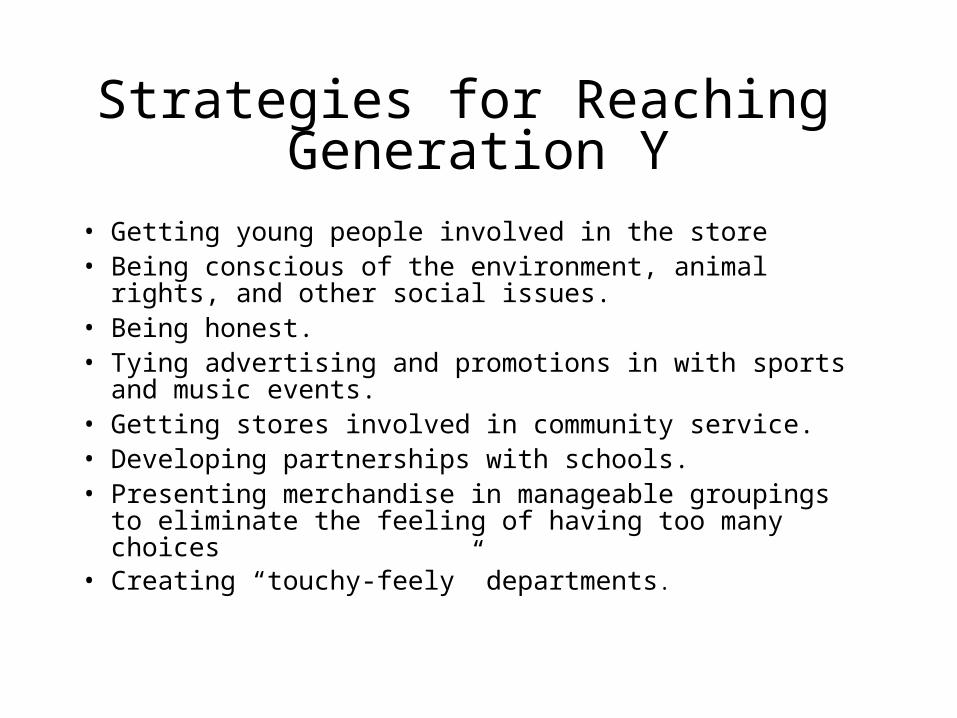
Strategies for Reaching Generation Y
• Getting young people involved in the store• Being conscious of the environment, animal rights, and other
social issues.• Being honest.• Tying advertising and promotions in with sports and music
events.• Getting stores involved in community service.• Developing partnerships with schools.• Presenting merchandise in manageable groupings to eliminate
the feeling of having too many choices• Creating “touchy-feely” departments.

How to Sell to Generation X
• They don’t like to wait
• They don’t like to be “sold”
• They don’t care about status products
• They like options and product information
• They like technology

Characteristics of Baby-Boomers
• They are individualistic.
• Leisure time is a high priority.
• They believe that they can always take care of themselves.
• They have an obsession with maintaining their youth.
• They will always love rock and roll.

How to Sell to Baby-Boomers
• Nostalgia
• Natural
• Youth and Fitness

Retailing to the Silver Streakers
BETTER SERVICERetailers are making shopping easier for older people
1. Have someone available who know where things are to help older shoppers find things in the store.
2. Train all people to understand old citizen’s needs, including simple, clear explanations and reassurance.
3. Employ older people. They can help other older people. They can reduce shoplifting losses because it is harder to steal from nice older people than from huge impersonal corporations. Wal-Mart hires older people as greeters to make customers of all ages feel welcome.
4. Encourage older people to order things by telephone or mail when they wish.
5. Provide places for them to sit down in different parts of the store.
6. Put up plenty of signs with big print and contrasting colors. cont.

Retailing to the Silver Streakers
7. Don’t move products to new locations all the time.
8. Have good lighting. Make sure lighting changes gradually, especially from the outside.
9, Locate restrooms in the front of the store for convenience and security.
10. Post directories throughout the the store as convenient points of interest.
11. Don’t put products that older shoppers tend to buy on the very top or bottom shelves.
12. Make store, mail, and parking lot security prevalent and visible.
13. Provide product information, such as information cards and brochures.
REFACT 17% of web users are over 50 years old
Selling to the Mass-Middle and Lower Income Markets
Who does it?
• Old Navy Clothing Company, Dollar General, Grow Biz International, Consolidated Stores,
Mervyn’s, Wal-Mart, Kmart, and Target
How do they do it?
• Atmosphere communicates value
• Nice but not too nice
• Merchandise assortment is credible
• Relentlessly promote both sale merchandise and everyday low prices.
How Big is Internet?
Mid - 1996: online population of the United States was 35 million.
Mid - 1998: population became 72.6 million.
April 1999: more than 83 million users online above age 16.

PPT 4-13How Big is E-Retailing?
1998: 18.6 million people bought goods over the Internet for a total of over $26 billion.
By 2002 this number is expected to increase to 64 million people and $268 billion.

What do People Buy on the Internet?
• software
• hardware
• books
• travel
• music
• clothing

Why Do People Use the Internet?
Personal information, work, education, entertainment, shopping,
time wasting, communication
• Females use: personal information, education, communication
• Male use: work, entertainment, shopping, time wasting
• 21-25 year old use: same reasons, greater for personal information and work.
• 26-50 year old use: mainly for personal information and work.
• Above 50 use: primarily for personal information.

How Retailers Can Encourage Sales From Time-Poor Society
Be Available When TheCustomer Needs You
Provider Alternatives ToStore Visits
Improve Customer Service
Give Information&
Automate Process
Offer Opportunities forOne-Stop Shopping
RefactRefact: The number of hours spent shopping in stores per month has declined significantly from an average of 4.8 hours in 1993 to 3.3 hours in 1997. Internet sales are expected to significantly reduce store shopping even further.

Has the Saturn Concept Been Consistent with Changing Household Demographics
• Women in the workforce?
• Changing household demographics?
• Poverty of time?
• Mobile consumer?
• Aging consumer?
Related Documents


