Global Services Executive News Reports What’s Hot around the Globe: Insights on Growth in Household Products

Welcome message from author
This document is posted to help you gain knowledge. Please leave a comment to let me know what you think about it! Share it to your friends and learn new things together.
Transcript

Global Services
Execut ive News Reports
What’s Hot around the Globe:Insights on Growth in Household Products

What’s Hot around the Globe
Insights on Growth in Household Products
Executive News Report from ACNielsen Global Services
July 2006
Table of Contents Executive Summary 2
Global Findings 6
Category and Segment Growth 12
Fastest Growing Categories 18
Private Label Trends 30
Methodology 33
The information contained in this report has been collected from ACNielsen in 66 markets around the world. For questions or to obtain more detailed information by market please contact your local ACNielsen Global Services representative or Mark Chesney at [email protected]. The information contained in this report is not to be used with sources outside of your company without the express written permission of ACNielsen Global Services.
Copyright © 2006 ACNielsen. All rights reserved. ACNielsen and ACNielsen with globe design are trademarks or registered trademarks of AC Nielsen (US), Inc. Other brand and product names are trademarks or registered trademarks of their respective companies.
Executive Summary

What’s Hot around the Globe
Insights on Growth in Household Products
Executive News Report from ACNielsen Global Services
July 2006 3
Executive Summary What’s Hot around the Globe – Insights on Growth in Household Products is the latest in ACNielsen’s series of reports on the fastest-growing product areas and the underlying drivers of category growth around the world. Previous studies have focused on Food & Beverage categories and Personal Care, as well as a global look at private label products. This edition focuses on Household Products – categories that contain products used around the home to keep it clean and running smoothly. Examples include dish, laundry and hand detergents; brooms, brushes and mops; bleaches and disinfectants; batteries; and plastic and aluminum wraps and bags. We hope you find this useful in identifying the trends and drivers within the global Fast Moving Consumer Goods (FMCG) industry. Overall Findings: Global growth was 4% Overall, the global growth of Household Product categories measured was just four percent in 2005. However, the growth rates varied significantly between regions and within categories. Based on our analysis, there are several key themes that have affected the growth within the Household Products categories in this study:
• New products – driven by innovation and technological advances – deliver growth o Four out of the nine fastest growing categories had new innovative products
introduced into the categories
• Health and Wellness – a key concern among consumers – impacts the growth of Household Products
o Products that help prevent the spread of disease (e.g. Disinfectants and Insect Control) showed strong growth
• Convenience impacts certain categories – making cleaning “one step easier” wins
with consumers o Fabric Softeners, Power Cleaners and Dish Detergents are sparked by new
formats that eliminate steps
• Geographically – two-thirds of the dollar growth is attributable to the developing markets
Regional Findings: Less-developed areas drove growth As one might expect, the more economically developed regions of Europe and North America experienced slightly lower-than-average overall growth rates, while the less-developed regions of Latin America and Emerging Markets experienced higher growth. The Asia Pacific region, with its mix between developed and developing markets, had a slightly higher-than-average growth rate.

What’s Hot around the Globe
Insights on Growth in Household Products
Executive News Report from ACNielsen Global Services
July 2006 4
Interestingly, when all developing markets around the world were grouped together, more than two-thirds of the dollar value growth in Household Products came from these developing markets. It is clear that these new markets are driving the vast majority of dollar growth for Household Products. Category and Segment Findings: Only 9 grew faster than average Among the 29 categories, only nine grew faster than the global average. Contrary to previous studies, the fastest-growing categories were not always the smallest in terms of dollar sales value. For example, Garbage Bags, Household Cleaners, Air Fresheners, Insect Control and Fabric Softener were all growing faster than the global average and were among the top categories in terms of value sales. The list below highlights the top nine categories and a key to its growth in the past year:
Top Categories
’04-’05 Growth Rate
What’s Helping the Growth in Value Sales?
1. Abrasive Cleaning Pads 13% Strong marketing focus in Latin America
2. Disinfectants 13% Wipes continue popularity in North America
3. Garbage Bags 8% New innovations, rising cost of raw materials
4. Laundry Stain Remover/Booster 6% No-wash and oxi stain removers growing
5. Household Cleaners 6% Power Cleaners boost overall category
6. Air Fresheners 5% Premium pricing; new and innovative products
7. Insect Control 5% Premium pricing; disease concerns
8. Plastic Storage Bags 5% Strong private label growth in most of the world
9. Fabric Softener 5% “Hassle-free” products very popular in developing countries
Private Label: Mixed performance across regions, categories Private label products showed mixed performance across the 29 categories and 66 markets. In almost half of the categories, manufacturer brands outpaced the growth of private label brands. The most significant private label share gains were made within the Brooms, Brushes, Mops category (which includes floor cleaning systems as well as more traditional brooms and mops). Looking at the overall growth trends in Household Products, there does not seem to be a correlation between category size or growth rate and the strength of private label.

What’s Hot around the Globe
Insights on Growth in Household Products
Executive News Report from ACNielsen Global Services
July 2006 5
About the Study This survey of Household Products included 66 markets around the world and 29 categories. These 66 markets account for more than 90% of the world’s GDP and over 75% of the world’s population. The markets have been grouped regionally into five areas: Asia Pacific, Emerging Markets, Europe, Latin America and North America. For the purposes of this study, Mexico has been included in Latin America. A full detailing of markets and categories is contained in the Methodology section in the report appendix. ACNielsen analyzed data across 29 Household Products categories, comparing year ending December 2005 with December 2004. Within these 29 categories, ACNielsen reviewed sub-categories of products, which for the purposes of this study are called “segments.” This study looks at some of these key segments to understand the changes impacting the categories. New to the study this year is the inclusion and analysis of private label products within each category. We intend to include private label information in future reports on product areas, to show the impact of both manufacturer and retailer products as drivers of consumer purchasing behavior. As with our other studies, this report is based on purchasing information from retailers in grocery, drug and mass merchandise outlets and generally excludes kiosks or vending machines. In a few markets, sales from convenience stores may be included. Within the United States, data from the ACNielsen Homescan consumer panel service has been included to provide a total market read that includes Wal-Mart information.
Global Findings

What’s Hot around the Globe
Insights on Growth in Household Products
Executive News Report from ACNielsen Global Services
July 2006 7
Global Findings Overall, Household Products grew globally by 4% in 2005 Across the 66 markets included in the study the aggregated sales of the 29 Household Product areas grew by just four percent in 2005. This growth rate is consistent with the global growth rates previously seen in other What’s Hot studies (such as Food & Beverages and Personal Care). Also consistent with previous studies is the fact that the growth rates varied considerably across regions. The developed regions of Europe and North America experienced overall growth less than the global average. In fact, sales in Europe were virtually flat, with seven out of 19 markets measured in Europe actually showing a decline in Household Product value sales in 2005. At the other end of the spectrum, both Latin America and the Emerging Markets experienced double-digit growth, 11% and 13% respectively. In the Emerging Markets, both Romania and Russia experienced over 25% growth in the last year. Given that Asia Pacific is a region that is made up of both developing and developed markets, there was significant disparity across the region. Developing markets such as China grew by 14%, while Japan’s growth was in alignment with the global average of four percent. In absolute dollars, Asia Pacific contributed the largest dollar value growth overall, at just under one billion dollars in 2005.
Value Sales (US$m) in Household Products*
Global Growth in Household Products* (2004 – 2005)
*Based on number of countries measured
(Number of countries in parentheses)
Global (66)
Europe (19)
North America (2)
Asia Pacific (15)
Latin America (12)
Emerging Markets (18)
4%
0%
3%
6%
11%
13%
0% 5% 10% 15%
Global (66)
Europe (19)
North America (2)
Asia Pacific (15)
Latin America (12)
Emerging Markets (18)
0 $100,000$50,000
What’s Hot around the Globe
Insights on Growth in Household Products
Executive News Report from ACNielsen Global Services
July 2006 8
Growth in Household Products varied by regions Europe Europe is a more mature region, and across the Household Products categories experienced flat growth overall. This was due in part to pricing pressures from increased retailer competition, development of hard-discount retailers and private label. Even so, Europe is still the largest Household Products region, accounting for 35% of total dollar value sales. In the markets measured, the number-one growing category in Europe was Brooms, Brushes, Mops, which was not one of the fastest growing categories on a global basis. One major reason was due to the increased competition in this category – both for “traditional” products as well as with newer, innovative products such as mop kits that include a handle and replacement heads. This parallels the introduction of Swiffer-style cleaning systems in North America a few years ago, which showed strong growth initially. Several countries showed strong growth through promotion and private label in Europe. Both Sainsbury and Tesco introduced their private label buckets and mops, fueling strong growth across Europe. Countries like Germany, Austria, and the Netherlands showed very strong growth in private label products in this category, with high double-digit increases from prior year in sales of Brooms, Brushes, Mops. North America North America grew at 3% compared to the prior year. Despite there being only two markets in this region (United States and Canada) the region is a large contributor to the global total, with these two markets accounting for more than 30% of the total dollar value sales of Household Products. North America was fueled by the growth in Disinfectants (+23%), helping to make it the number-two growth category globally. In the United States, this category saw great successes with innovative new product types such as the pre-moistened disinfectant wipes. These wipes speak to consumers’ desire for convenience and health, as they disinfect and are disposable after one use. Other innovative products helped drive overall growth in North America, including Laundry Stain Removers (including “to-go” stain removal sticks and “oxi” cleaning items). Again, these new products tapped into consumers’ desires for innovative products that work in an improved manner, making it easier to care for clothing. Time will tell if these products deliver on their promises and have staying power. A final big driver for North America is Garbage Bags, the third category to show double-digit growth. Some of the growth is due to innovation – such as biodegradable bags and bags that resist tearing. However, business realities, such as increased SKU sizes and rising prices (due to the increased cost of raw materials), also contributed to the increase.
What’s Hot around the Globe
Insights on Growth in Household Products
Executive News Report from ACNielsen Global Services
July 2006 9
Asia Pacific Asia Pacific is a true mix of economies – from the mature markets of Japan and Australia, to newly growing markets such as China and India. The region’s growth in Household Products also comes from a mixture of new, innovative products and more traditional categories. Overall, the region is smaller than Europe or North America, accounting for 17% of total dollar value sales. However, in terms of its contribution to dollar value growth, the Asia Pacific region accounted for 27% of the global growth dollars of the markets measured in this study – the largest contribution of any region. The categories Auto Dish Detergent and Auto Dish Additives were the number one and two growing categories in this region. What fueled this growth? Innovation was one key element, as detergent tablets (rather than liquid or powder) had new entries. For example, Australia saw strong growth in one of its top brands through the introduction of a new tablet-form product. Japan also saw growth through innovation, as the number-one brand extended its product line, adding new features to help it clean better. Growth came from new markets such as China, which showed a significant year-over-year increase. However, while the growth is encouraging, the small size of the market must be taken into account due to limited demand, as dishwashing machines are not yet universally popular in China. Latin America Accounting for nine percent of total regional sales, Latin America showed the second highest year-over-year growth rate overall. Many categories have shown strong growth here due to the launch of new products and increased advertising support. Abrasive cleaning pads took off by growing at over 70%, as competition between two top brands took place in Brazil. Consumers may appreciate the convenience and value these products provide as they are touted as multi-use products – for cleaning sinks, ovens and polishing metals. Perhaps what is most interesting about this region are the top-ranking categories that only show up in this part of the world – Bleach/Ammonia products, and Insect Control. Bleach/Ammonia was fueled by several factors – in Brazil it was through new product introductions; in Chile, there was a significant growth in private label, which spurred increased promotion by the number-two brand in the category. Colombia saw strong growth with its number-one brand through lower prices and line extensions. Insect Control is another big-growth category in Latin America that did not demonstrate significant increases around the rest of the world. This is likely due to several factors. First, parts of Latin America had an atypical summer season in 2004, depressing sales of Insect Control products and leading to a natural rebound in 2005. Another contributing factor to category growth has been the concern over dengue fever. The Brazilian government has been working to raise awareness through mass media advertisements, which may have positively impacted Insect Control sales in that country.

What’s Hot around the Globe
Insights on Growth in Household Products
Executive News Report from ACNielsen Global Services
July 2006 10
Emerging Markets The Emerging Markets represent great challenges and also opportunities for marketers. Typically, less modern infrastructures dominate the region. The Emerging Markets account for just eight percent of overall Household Product sales. However, manufacturers and retailers have the chance to make their mark early while competition is not completely saturated and consumers begin looking for “global” brands. While this region is still small in terms of the actual dollars spent on Household Products, it is growing faster than any other region. This also makes the Emerging Markets a strong contributor to global growth, accounting for almost 24% of global dollar growth in Household Products. Across the board, the top ten categories in Emerging Markets are growing faster than the top ten categories in other regions. Primary to this region’s growth have been products to freshen the home – Fabric Fresheners, Carpet Cleaners, and Air Fresheners. Despite showing a decline globally, Fabric Fresheners showed over 200% growth in the Emerging Markets region, driven by significant increases in Turkey and Israel. The Emerging Markets was the only region with all three categories in the top ten.

What’s Hot around the Globe
Insights on Growth in Household Products
Executive News Report from ACNielsen Global Services
July 2006 11
Cross-regional analysis: overall developing markets contributed significantly to Household Product growth Across the regions, a significant growth was driven by developing markets, as defined by the World Bank (which includes low- and middle-income economies). While these markets measured in this study accounted for 25% of total dollar sales in Household Products, they contributed far more than that in terms of global growth dollars – more than 66%. These developing markets present an opportunity for manufacturers, as those economies continue their development and consumers can afford more products to make their lives easier. While the growth rates in developing markets were strong, it is interesting to note that some of these markets were quite large as well in terms of actual dollar sales. In fact, some contributed more than $1 billion each in overall sales of Household Products. The table below highlights these markets and their significance in terms of year-over-year growth. Developing Market* growth rates for Household Products (2004 – 2005)
Growth Rate
10% and Higher Between
4% and 9% Between
0% and 4% Negative Growth Argentina Colombia Costa Rica Chile Brazil El Salvador Guatemala Czech Republic Bulgaria Hungary Panama Honduras China India Philippines Malaysia Croatia Latvia Poland Slovakia Egypt Mexico South Africa Tunisia Estonia Morocco Indonesia Sri Lanka Kazakhstan Uruguay Lithuania Nicaragua Romania Russia Thailand Turkey Vietnam
* Developing markets are defined using the World Bank definition, which includes low-income and middle-income
economies.

What’s Hot around the Globe
Insights on Growth in Household Products
Executive News Report from ACNielsen Global Services
July 2006 12
Category and Segment Growth

What’s Hot around the Globe
Insights on Growth in Household Products
Executive News Report from ACNielsen Global Services
July 2006 13
Category and Segment Growth Only nine categories grew faster than 4% Among the 29 categories, only nine grew faster than the global average. Contrary to previous studies, the fastest-growing categories were not always the smallest in terms of dollar sales value. For example, Garbage Bags, Household Cleaners, Air Fresheners, Insect Control and Fabric Softener were all growing faster than the global average and were among the largest categories in value sales. Within these categories, there are specific segments that showed strong performance. Within the Air Freshener category, for example, innovations drove growth – whether through battery-operated freshening systems or air sanitizing sprays. Also, within Household Cleaners, the power cleaning segment made a good showing with introductions of multi-use cleaners, ones with oxidizing (“oxi”) ingredients for stain removal, and no-wash stain removers. In recent years, products that are part of a cleaning system (such as a re-usable handle with disposable cloths, sponges or brushes) have been introduced, as manufacturers look to replicate the success of the Swiffer dry and damp cleaning systems. These systems have been introduced in numerous categories, including bathroom cleaners, toilet bowl cleaners, dusters, air care and insect control. It remains to be seen if the idea of a cleaning “system” will resonate with consumers in all categories and continue to drive growth. The dry/damp cleaning systems are contained in the Brooms, Brushes, Mops category, which has shown significant differences in performance regionally. While overall growth in Brooms, Brushes and Mops has been small, some markets such as Germany, Austria and the Netherlands have seen enormous growth due to private label introductions and heavy promotion. In North America, these systems are experiencing declines from prior years, but this is likely due to the huge success and initial investment in dry/damp systems in previous years. Even so, North America is far and away the largest region for the Brooms, Brushes, Mops category. Finally, with consumers’ focus on health, an effort to sanitize while cleaning may also be occurring. Household Cleaners and Disinfectants were two categories showing stronger-than-average growth rates. These new categories may represent a shift in the type of products used to clean, and are trends worth watching globally.

What’s Hot around the Globe
Insights on Growth in Household Products
Executive News Report from ACNielsen Global Services
July 2006 14
Only nine categories grew faster than 4% Of the 29 categories included in the study, only nine experienced growth that was higher than the overall global growth. Two of the nine experienced double-digit growth.
Top Growing Categories No. of Markets
Growing/ Measured
Category Growth Rate
04-05
Category Growth Value
$ 000 1. Abrasive Cleaning Pads 13 of 23 13% 129,215 2. Disinfectants 18 of 26 13% 81,148 3. Garbage Bags* 15 of 19 8% 209,806 4. Laundry Stain Remover/Booster 30 of 37 6% 82,876 5. Household Cleaners* 55 of 65 6% 338,553 6. Air Fresheners* 50 of 61 5% 244,081 7. Insect Control* 28 of 47 5% 168,489 8. Plastic Storage Bags 28 of 34 5% 78,040 9. Fabric Softener* 44 of 58 5% 255,008
Positive Growth Categories No. of Markets
Growing/ Measured
Category Growth Rate
04-05
Category Growth Value
$ 000 10. Bleach/Ammonia 32 of 46 4% 105,602 11. Auto Dish Detergent 36 of 42 4% 104,468 12. Hand Dish Detergent* 44 of 62 4% 167,714 13. Kitchen Paper/Towel* 32 of 45 4% 216,908 14. Laundry Detergent* 42 of 66 4% 889,103 15. Auto Dish Additives 26 of 35 3% 17,324 16. Toilet Care* 40 of 57 3% 63,260 17. Brooms, Brushes, Mops 19 of 23 2% 48,246 18. Batteries* 41 of 56 2% 164,429 19. Cleaning Cloths/Sponges 17 of 26 2% 20,387 20. Waste Pipe Openers 12 of 25 2% 9,351 21. Aluminum Foil 12 of 27 2% 19,264 22. Laundry Water Softeners 13 of 25 1% 5,653
*Also amongst the largest 10 categories in value sales
What’s Hot around the Globe
Insights on Growth in Household Products
Executive News Report from ACNielsen Global Services
July 2006 15
Negative Growth No. of Markets
Growing/ Measured
Category Growth Rate
04-05
Category Growth Value
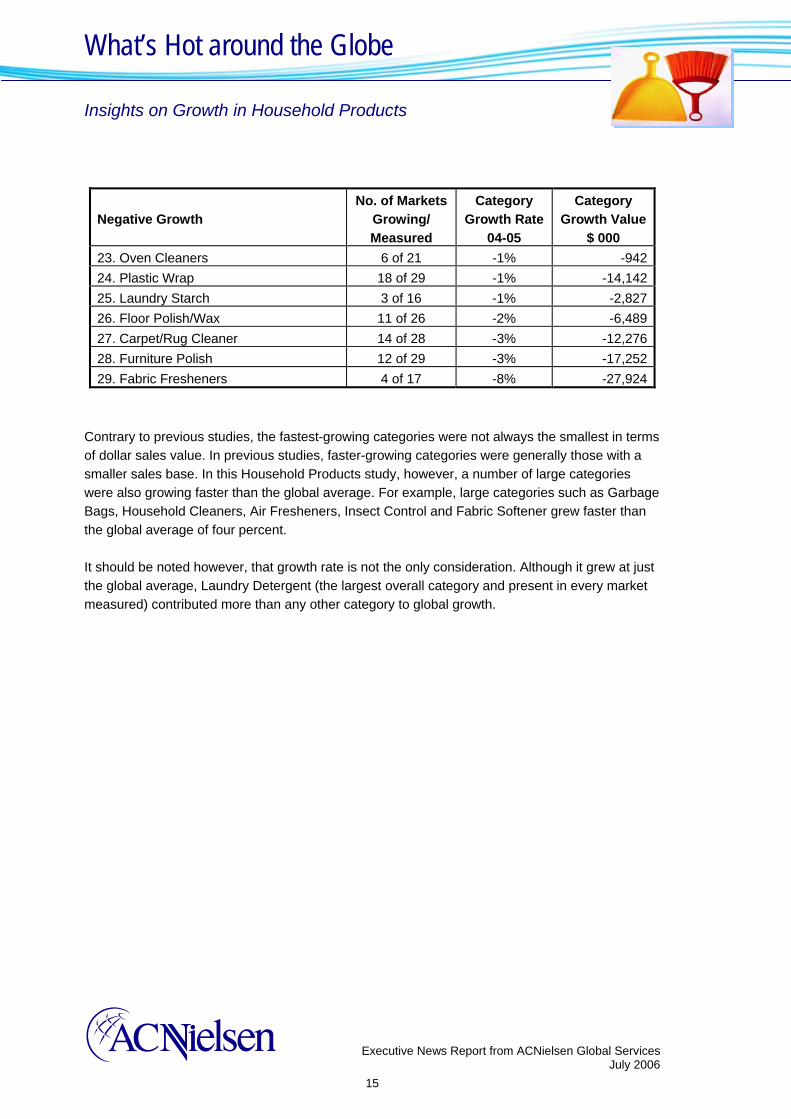
$ 000 23. Oven Cleaners 6 of 21 -1% -942 24. Plastic Wrap 18 of 29 -1% -14,142 25. Laundry Starch 3 of 16 -1% -2,827 26. Floor Polish/Wax 11 of 26 -2% -6,489 27. Carpet/Rug Cleaner 14 of 28 -3% -12,276 28. Furniture Polish 12 of 29 -3% -17,252 29. Fabric Fresheners 4 of 17 -8% -27,924
Contrary to previous studies, the fastest-growing categories were not always the smallest in terms of dollar sales value. In previous studies, faster-growing categories were generally those with a smaller sales base. In this Household Products study, however, a number of large categories were also growing faster than the global average. For example, large categories such as Garbage Bags, Household Cleaners, Air Fresheners, Insect Control and Fabric Softener grew faster than the global average of four percent. It should be noted however, that growth rate is not the only consideration. Although it grew at just the global average, Laundry Detergent (the largest overall category and present in every market measured) contributed more than any other category to global growth.

What’s Hot around the Globe
Insights on Growth in Household Products
Executive News Report from ACNielsen Global Services
July 2006 16
Innovation and expansion within category segments fuel growth Looking at the data from a category level is not the only way to consider the information. By drilling down into specific segments, we can look within the categories to see the things that are fueling the overall growth within this study. New product introductions and technology innovations brought new life to a number of categories within Household Products, especially in the Air Fresheners and Household Cleaners categories. The Air Fresheners category had three segments boosting growth: batteries, candles and air sanitizers. Far from the simple potpourri of days past, these new products actually work to capture and neutralize the odors to remove them from the home. Household Cleaners also got a boost, with spray-on and power cleaner segments driving growth in this strong category. Consumers maintained a concern for health and wellness in their homes by purchasing these cleaners as well as Disinfectant Sprays and odor sanitizers.
Category Segment No. of Markets
Growing/ Measured
Category Growth
Rate 04-05
Category Growth
Value $ 000 Air Fresheners ** Battery Air Fresheners 20 of 24 191% 99,638Air Fresheners ** Odor Eliminator/Air Sanitizer 16 of 20 36% 44,942Air Fresheners ** Air Freshener Candles 21 of 39 8% 24,395Household Cleaners ** Power Cleaners 12 of 14 75% 144,561Household Cleaners ** Household Cleaning Spray-On 24 of 24 11% 142,476
Auto Dish Detergent Multi-Functional Auto Dish Detergent (2in1, 3in1, 4in1)
20 of 21 20% 129,328
Laundry Stain Remover/ Booster **
Oxi Stain Remover/Booster 7 of 10 11% 24,499
Batteries Rechargeable Batteries 29 of 30 10% 58,190Disinfectants ** Disinfectant Sprays 11 of 19 10% 15,540Toilet Care Toilet Care Wipes 9 of 15 8% 10,563
**Fastest Growing Categories
But convenience also continues to drive consumer purchase. However, convenience may mean different things to different consumers. For example, while spray-on cleaners seem convenient for most, a wipe may be even more convenient – demonstrating a need for appropriate marketing to consumers who are willing and able to pay the premium
What’s Hot around the Globe
Insights on Growth in Household Products
Executive News Report from ACNielsen Global Services
July 2006 17
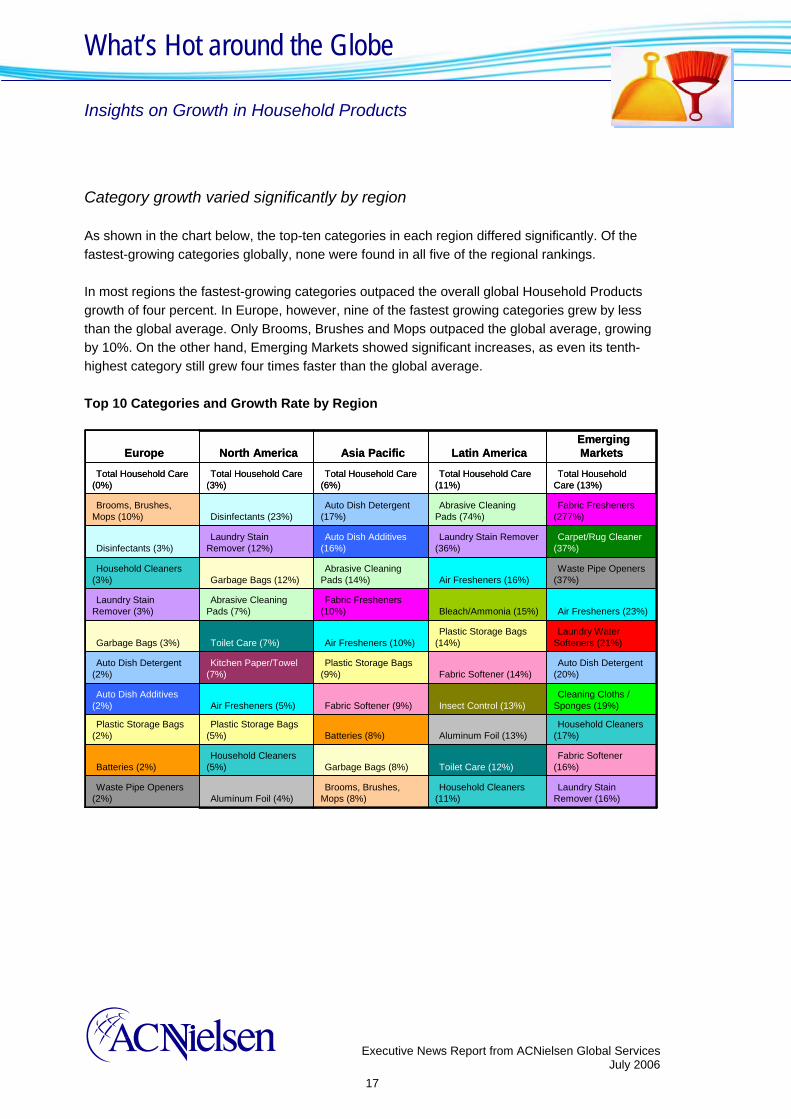
Category growth varied significantly by region As shown in the chart below, the top-ten categories in each region differed significantly. Of the fastest-growing categories globally, none were found in all five of the regional rankings. In most regions the fastest-growing categories outpaced the overall global Household Products growth of four percent. In Europe, however, nine of the fastest growing categories grew by less than the global average. Only Brooms, Brushes and Mops outpaced the global average, growing by 10%. On the other hand, Emerging Markets showed significant increases, as even its tenth-highest category still grew four times faster than the global average. Top 10 Categories and Growth Rate by Region
Aluminum Foil (4%)
Household Cleaners (5%)
Plastic Storage Bags (5%)
Air Fresheners (5%)
Kitchen Paper/Towel (7%)
Toilet Care (7%)
Abrasive Cleaning Pads (7%)
Garbage Bags (12%)
Laundry Stain Remover (12%)
Disinfectants (23%)
Total Household Care (3%)
North America
Total Household Care (13%)
Total Household Care (11%)
Total Household Care (6%)
Total Household Care (0%)
Carpet/Rug Cleaner (37%)
Laundry Stain Remover (36%)
Auto Dish Additives (16%)Disinfectants (3%)
Laundry Stain Remover (16%)
Household Cleaners (11%)
Brooms, Brushes, Mops (8%)
Waste Pipe Openers (2%)
Fabric Softener (16%)Toilet Care (12%)Garbage Bags (8%)Batteries (2%)
Household Cleaners (17%) Aluminum Foil (13%)Batteries (8%)
Plastic Storage Bags (2%)
Cleaning Cloths / Sponges (19%)Insect Control (13%)Fabric Softener (9%)
Auto Dish Additives (2%)
Auto Dish Detergent (20%)Fabric Softener (14%)
Plastic Storage Bags (9%)
Auto Dish Detergent (2%)
Laundry Water Softeners (21%)
Plastic Storage Bags (14%)Air Fresheners (10%)Garbage Bags (3%)
Air Fresheners (23%)Bleach/Ammonia (15%)Fabric Fresheners
(10%)Laundry Stain
Remover (3%)
Waste Pipe Openers (37%)Air Fresheners (16%)
Abrasive Cleaning Pads (14%)
Household Cleaners (3%)
Fabric Fresheners (277%)
Abrasive Cleaning Pads (74%)
Auto Dish Detergent (17%)
Brooms, Brushes, Mops (10%)
Emerging MarketsLatin AmericaAsia PacificEurope
Fastest Growing Categories

What’s Hot around the Globe
Insights on Growth in Household Products
Executive News Report from ACNielsen Global Services
July 2006 19
Global Share of Abrasive Cleaning Pads (2005)
Rank within Region
#4
#3
#1
1. Abrasive Cleaning Pads – Global Growth of 13% The Abrasive Cleaning Pads category grew by 13% in the last year. As seen below, the growth of this category in Latin America far outpaced any other region.
The growth in Latin America was primarily attributable to growth of the category in Brazil. The top three brands in Brazil accounted for over 95% of the total category.
These three brands each grew significantly, the top brand by over 45% and the next two, in terms of value sales, each by over 200%. Such significant growth has been attributed to strong media investments, primarily in TV. Globally, brand dominance is not as strong as in Latin America. On a global basis, the top three brands accounted for 65% of sales while all other brands hold 19% of the total category and private label brands hold 16%.
Global Growth in Abrasive Cleaning Pads (2004 - 2005)
Value Sales (US$m) in Abrasive Cleaning Pads (2005)
Private Label16%
Top 3 Brands
66%
All Other18%
0 200 400 600 800 1,000 1,200
Global (23)
Europe (12)
North America (2)
Asia Pacific (4)
Latin America (2)
Emerging Markets (3)
13%
0%
7%
14%
74%
11%
0% 20% 40% 60% 80%
Global (23)
Europe (12)
North America (2)
Asia Pacific (4)
Latin America (2)
Emerging Markets (3)

What’s Hot around the Globe
Insights on Growth in Household Products
Executive News Report from ACNielsen Global Services
July 2006 20
2. Disinfectants - Global Growth of 13% On a global basis, the Disinfectants category grew by 13% in 2005. This growth was primarily driven by North America where sales grew by 23%. This was specifically attributed to the United States.
Eighty percent of the absolute dollar growth in the United States (excluding Wal-Mart) was accounted for by a 60% growth in wipes. Strong growth in this segment was particularly seen in private label, Clorox and Scotch-Brite. Disinfectant Wipes, measured in only five markets, grew on a global basis by over 35% in 2005. Disinfectant Sprays, on the other hand, grew in 12 of the 19 markets in which
they were measured, growing by 10% overall, making it one of the fastest growing categories. Consumers want to be sure their homes are not just clean but germ free.
*Includes US Wal-Mart
Rank within Region
#3
#1
Global Growth in Disinfectants (2004 - 2005)*
Value Sales (US$m) in Disinfectants (2005)
Disinfectants in the US (excl. Wal-Mart)
0 200 400 600 800
Global (26)
Europe (5)
North America (2)
Asia Pacific (4)
Latin America (10)
Emerging Markets (5)
13%
3%
23%
2%
10%
14%
0% 5% 10% 15% 20% 25%
Global (26)
Europe (5)
North America (2)
Asia Pacific (4)
Latin America (10)
Emerging Markets (5)
0 50 100 150 200
TotalCategory
Wipes
Sprays
$ Million
2004 2005
21%
60%
6%

What’s Hot around the Globe
Insights on Growth in Household Products
Executive News Report from ACNielsen Global Services
July 2006 21
2. Disinfectants – Global Growth of 13% continued The Disinfectants category is extremely concentrated, with 71% of the global dollar sales being accounted for by the cumulative sales of the top 3 brands within each of the markets. Although retailer brands hold only 8% share of the market, global dollar sales for private label grew by 26% in 2005. Global Share of Disinfectants (2005)
Private Label
8%
Top 3 Brands
72%
All Other20%

What’s Hot around the Globe
Insights on Growth in Household Products
Executive News Report from ACNielsen Global Services
July 2006 22
3. Garbage Bags – Global Growth of 8% Garbage Bag dollar sales saw strong growth in a number of regions over the last year, giving a global sales growth of 8%. North America was the only region to experience double-digit growth.
0 500 1,000 1,500 2,000 2,500 3,000
Global (19)
Europe(12)
NorthAmerica
(2)
AsiaPacific (2)
EmergingMarkets (3)
8%
3%
12%
8%
9%
0% 5% 10% 15%
Global(19)
Europe(12)
NorthAmerica
(2)
AsiaPacific (2)
EmergingMarkets
(3)
The value sales growth of Garbage Bags in North America has been attributed to a couple of factors. First, there has been significant innovation in the category, including the introduction of bags with multiple added benefits, which justified higher prices. Garbage Bags can now fix themselves to the garbage bin, stretch rather than rip, and contain odors…all with a variety of convenient tying options. These innovations have not just been limited to North America, however, and have contributed to the growth of the category in other regions of the world as well.
Another factor that boosted the growth in value sales was increased prices due to the rising cost of resin used to make the bags themselves. Finally, the significant presence of private label products in this category must be noted. Private label products held 40% of value sales in 2005 and grew by a further 8% (keeping pace with manufacturer brands).
Private Label40%
Top 3 Brands
49%
All Other11%Global Share of Garbage Bags (2005)
Rank within Region
#5
#3
#9
Global Growth in Garbage Bags (2004 - 2005)
Value Sales (US$m) in Garbage Bags (2005)

What’s Hot around the Globe
Insights on Growth in Household Products
Executive News Report from ACNielsen Global Services
July 2006 23
Private Label
5%
Top 3 Brands
72%
All Other23%
4. Laundry Stain Remover – Global Growth of 6% The Laundry Stain Remover category, which includes both pre-wash and in-wash products, saw double-digit growth in three of the five regions: North America, Latin America and the Emerging Markets. Four of the five regions rated this within its top ten. The lower-than-average growth rate in Asia Pacific and Europe, the largest region, brought the cumulative global growth to 6%.
0 500 1,000 1,500
Global (37)
Europe (18)
North America (2)
Asia Pacific (5)
Latin America (2)
Emerging Markets (10)
6%
3%
12%
1%
36%
16%
0% 10% 20% 30% 40%
Global (37)
Europe (18)
North America (2)
Asia Pacific (5)
Latin America (2)
Emerging Markets (10)
On a global basis, the ‘oxi’ phenomenon has truly impacted this category. As seen in the table on page six, Oxi Stain Removers grew in seven of the 10 markets in which it was measured and grew overall by 11%, therefore placing it as one of the fastest growing segments in Household Products.
Another innovative was No-Wash Stain Removers. While they were only measured in a handful of markets, these products grew by over 200% in 2005.
This category is certainly one which is led by key manufacturers, with 72% of value sales held by the top three brands within each market. Furthermore, the manufacturer of the number-one brand (Reckitt Benckiser) is quite consistent across a number of those markets.
Global Share of Laundry Stain Removers (2005)
Rank within Region
#4
#2
#2
#10
Global Growth in Laundry Stain Removers (2004 - 2005)
Value Sales (US$m) in Laundry Stain Removers (2005)

What’s Hot around the Globe
Insights on Growth in Household Products
Executive News Report from ACNielsen Global Services
July 2006 24
Global Share of Household Cleaners (2005)
5. Household Cleaners – Global Growth of 6% The Household Cleaners category (including all-purpose products as well as those targeted towards kitchens, bathrooms, windows and floors) grew by 6% globally in 2005. Four of the five regions rated this within its top ten.
0 2,000 4,000 6,000 8,000
Global (65)
Europe (19)
North America (2)
Asia Pacific (14)
Latin America (12)
Emerging Markets (18)
6%
3%
5%
3%
11%
17%
0% 5% 10% 15% 20%
Global (65)
Europe (19)
North America (2)
Asia Pacific (14)
Latin America (12)
Emerging Markets (18)
Consumers want their cleaning products to be convenient and effective. With many multinational manufacturers (including Colgate-Palmolive, Henkel, Procter & Gamble, Reckitt Benckiser, SCJohnson and Unilever) entering into the Power Cleaner segment, value sales of Power Cleaners grew by 75% in the last year. This segment, one of the fastest growing within Household Products, provided the Household Cleaners category a boost in most regions of the world.
Considering all household cleaning products, the convenience of Spray-ons has not gone unnoticed. Spray-ons grew by 11% in the last year making it one of the faster growing segments overall. Spray-ons grew in all markets in which it was measured. With so many different types of products included in this category, there are similarly a huge number of brands, with only 43% of the value sales held by the top three brands within each market. Private label products held only 9% share of total category in 2005 and grew at a lower rate than total category sales.
Private Label
9%
Top 3 Brands
43%
All Other48%
Rank within Region
#3
#9
#10
#8
Global Growth in Household Cleaners (2004 - 2005)
Value Sales (US$m) in Household Cleaners (2005)

What’s Hot around the Globe
Insights on Growth in Household Products
Executive News Report from ACNielsen Global Services
July 2006 25
Global Share of Air Fresheners (2005)
Private Label
6%
Top 3 Brands
66%
All Other28%
6. Air Fresheners – Global Growth of 5% The Air Fresheners category grew by double digits in Asia Pacific, Latin America and the Emerging Markets, with the category saw much more modest growth in North America. Four of the five regions rated this within its top ten. With a combination of markets growing and declining in Europe, the overall sales value growth was flat in 2005.
Air Fresheners have been revitalized by the introduction of numerous new products in the last couple of years. In fact, three of the fastest growing segments in Household Products were found to be within Air Fresheners. Battery Air Fresheners, an innovative product launched in numerous markets in the last year, saw a global sales growth of over 150%. Odor Eliminators (or Air Sanitizers), a new type of product designed to eliminate the odors, rather than mask them, grew globally by 36% in 2005. Finally, Air Freshener
Candles have also seen innovation with new scented oils and a subsequent growth of 8%. Another factor driving value sales growth has been the premium prices these added benefits can justify. The globalization of the Air Freshener category has resulted in the top brands being consistent across numerous markets. The global brands of SCJohnson and Reckitt Benckiser were often found to hold the number one and two spots. The strength of these manufacturers within each market has led the Air Fresheners category to be dominated by the top three brands, holding a 65% share of global value sales.
Rank within Region
#7
#5
#3
#4
Global Growth in Air Fresheners (2004 - 2005)
Value Sales (US$m) in Air Fresheners (2005)
0 1,000 2,000 3,000 4,000 5,000
Global (61)
Europe (19)
North America (2)
Asia Pacific (13)
Latin America (12)
Emerging Markets (15)
5%
0%
5%
10%
16%
23%
0% 5% 10% 15% 20% 25%
Global (61)
Europe (19)
North America (2)
Asia Pacific (13)
Latin America (12)
Emerging Markets (15)

What’s Hot around the Globe
Insights on Growth in Household Products
Executive News Report from ACNielsen Global Services
July 2006 26
Private Label
2%
Top 3 Brands
49%
All Other49%
Global Share of Insect Control (2005)
7. Insect Control – Global Growth of 5% Insect Control was the eighth fastest-growing category in terms of global value sales, with a growth of 5% measured in the last year. The size of the category in Asia Pacific was far larger than any other region including both Europe and North America. Both China and Japan (the two largest markets for Insect Control products) saw strong growth in the last year.
0 1,000 2,000 3,000 4,000
Global (47)
Europe (15)
North America (2)
Asia Pacific (15)
Latin America (5)
Emerging Markets (10)
5%
-1%
0%
7%
13%
8%
-5% 0% 5% 10% 15%
Global (47)
Europe (15)
North America (2)
Asia Pacific (15)
Latin America (5)
Emerging Markets (10)
As with Air Fresheners, Insect Control products have also been developed beyond the traditional sprays to innovative products that are stronger, faster and wider reaching, some of which even use electrical power. As these products have become more popular, the premium prices they justify have again driven growth in value sales.
Another factor driving growth in the Insect Control category has been a focus on health. In Brazil, for example, the government aired a number of advertisements on television with the aim of motivating people to combat illnesses such
as dengue fever (a mosquito born disease) by using more Insect Control products. Although North America overall saw no growth, Insect Control in Canada grew by 7% in the last year. This could similarly be related to increasing concerns about mosquito-borne diseases, in this case, West Nile Virus. Of all Household Product categories, private label products had the least presence in the Insect Control category and furthermore saw declines in the last year. A factor contributing to this trend could be the lower penetration of private label in general in the markets holding the majority of value share.
Rank within Region
#7
Global Growth in Insect Control (2004 - 2005)
Value Sales (US$m) in Insect Control (2005)

What’s Hot around the Globe
Insights on Growth in Household Products
Executive News Report from ACNielsen Global Services
July 2006 27
8. Plastic Storage Bags – Global Growth of 5% Plastic Storage Bags grew by 5% in the last year. Although very small in absolute dollars, the fastest growth was seen in Latin America (+14%) and Asia Pacific (+9%). Four of the five regions rated this within its top ten.
0 500 1,000 1,500 2,000
Global (34)
Europe (13)
North America (2)
Asia Pacific (7)
Latin America (9)
Emerging Markets (3)
5%
2%
5%
9%
14%
2%
0% 5% 10% 15%
Global (34)
Europe (13)
North America (2)
Asia Pacific (7)
Latin America (9)
Emerging Markets (3)
The strength of private label products in Plastic Storage Bags was significant. On a global level, private label sales accounted for 41% of the category sales in the last year and outpaced manufacturer brands in growth (8% vs. 3%). The trend, however, varied across regions, as seen in the chart on the following page. Private label actually accounted for 61% of value sales in Europe in the last year. The most significant gains for private label brands were made in North America and Emerging Markets, where private label gained two share points in each market and Asia Pacific where private label gained one share point.
Rank within Region
#8
#8
#6
#5
Global Growth in Plastic Storage Bags (2004 - 2005)
Value Sales (US$m) in Plastic Storage Bags (2005)

What’s Hot around the Globe
Insights on Growth in Household Products
Executive News Report from ACNielsen Global Services
July 2006 28
8. Plastic Storage Bags – Global Growth of 5% continued Private Label Share and Growth by Region – Plastic Storage Bags
REGION
PL SHARE
PL GROWTH RATE
MANUF GROWTH RATE
Global 41% 8% 3% Europe 61% 2% 2% North America 40% 11% 1% Asia Pacific 9% 29% 8% Latin America 4% 16% 14% Emerging Markets 28% 12% -1%
Global Share of Plastic Storage Bags (2005)
Private Label41%
Top 3 Brands
52%
All Other7%

What’s Hot around the Globe
Insights on Growth in Household Products
Executive News Report from ACNielsen Global Services
July 2006 29
Global Share of Fabric Softener (2005)
9. Fabric Softener – Global Growth of 5% On a global basis, the Fabric Softener category grew by 5%. However, the regional growth rates varied significantly. Latin America and the Emerging Markets experienced double-digit growth whereas Europe and North America had essentially flat sales rates.
0 1,000 2,000 3,000 4,000 5,000 6,000
Global (58)
Europe (19)
North America (2)
Asia Pacific (13)
Latin America (9)
Emerging Markets (15)
5%
1%
0%
9%
14%
16%
0% 5% 10% 15% 20%
Global (58)
Europe (19)
North America (2)
Asia Pacific (13)
Latin America (9)
Emerging Markets (15)
The global growth in this category has been driven by changes in usage habits in less developed markets. Mexico, for example, experienced 14% growth in Fabric Softeners in the last year due to the launch of “hassle free” products such as Downy Libre Enjuague (Rinse Free). For consumers who hand-wash their garments, this product allows them to skip the rinse step before softening their clothes. In certain parts of Asia Pacific, fabric softeners in sachet form have grown volumes as well. Latin America and the Emerging Markets linked growth to new product launches, increased distribution as well as greater consumer acceptance. They also made reference to increased advertising and lower prices making the category
more affordable. Fabric Softener is another category within which key global manufacturers, in this case, Unilever, Procter & Gamble, Colgate-Palmolive and Henkel hold the number one, two and three brand positions across the majority of markets measured. Private label maintained a reasonable share of 11% of global value sales; however, it did not experience growth rates equal to manufacturer brands.
Private Label11%
Top 3 Brands
68%
All Other21%
Rank within Region
#7
#6
#9
Global Growth in Fabric Softener (2004 - 2005)
Value Sales (US$m) in Fabric Softener (2005)

Private Label Trends

What’s Hot around the Globe
Insights on Growth in Household Products
Executive News Report from ACNielsen Global Services
July 2006 31
Private Label Trends Overall, private label products accounted for 12% share of the global value sales in Household Products in 2005. This is lower than the overall penetration of Private Label products found in ACNielsen’s 2005 Power of Private Label study. Sales of Private Label Household Products grew at four percent, in alignment with the manufacturer brands; hence, over the last year Private Label did not gain share points. As highlighted in the table on the following page, private label share and growth varied significantly by category. Of all 29 categories, the table on the next page shows that for 12 categories, manufacturer brands outpaced the growth of private label brands. Private label brands therefore gained share points in the remaining 17 categories. The most significant private label share gains were made within the Brooms, Brushes, Mops category (which includes floor cleaning systems) where private label growth was 18% but manufacturer brands only grew by 1%. The private label gains in this category, Brooms, Brushes, Mops, were most considerable in Europe and Asia Pacific. In Household Products, private label had a high penetration in segments that could be considered a commodity (such as foil, storage and garbage bags, towels, cloths and sponges), and lower share in segments such as insect control and waste pipe openers. Looking at the overall growth trends in Household Products, there does not seem to be a direct or inverse correlation between category growth and presence of private label. For example, the fastest growing categories have a range of private label shares from 41% (Plastic Storage Bags) to 1% (Insect Control). From this, it can be said that category growth is not a determinant of private label popularity; rather private label can have an effect within a category, but it varies considerably according to the type of products included in the category.

What’s Hot around the Globe
Insights on Growth in Household Products
Executive News Report from ACNielsen Global Services
July 2006 32
Private Label Growth by Category
**Fastest Growing Categories
Manufacturer brands growing faster than Private Label
PRODUCT AREA PL
SHARE PL GROWTH MANU GROWTH 1 Aluminum Foil 43% 0% 3% 2 Plastic Storage Bags** 41% 8% 3% 3 Garbage Bags** 40% 8% 8% 4 Kitchen Paper/Towel 28% 5% 3% 5 Cleaning Cloths/Sponges 26% 7% 1% 6 Auto Dish Additives 22% 1% 4% 7 Plastic Wrap 19% 4% -3% 8 Auto Dish Detergent 18% 4% 4% 9 Bleach/Ammonia 17% 4% 5% 10 Abrasive Cleaning Pads** 16% 4% 15% 11 Laundry Water Softeners 16% -18% 6% 12 Toilet Care 12% 4% 2% 13 Brooms, Brushes, Mops 11% 18% 1% 14 Fabric Softener** 11% 4% 5% 15 Batteries 10% 3% 2% 16 Hand Dish Detergent 10% 5% 4% 17 Household Cleaners** 9% 5% 6% 18 Disinfectant** 8% 26% 12% 19 Oven Cleaners 7% 5% -1% 20 Laundry Starch 7% -16% 0% 21 Carpet/Rug Cleaner 6% 6% -4% 22 Laundry Detergent 6% 1% 4% 23 Air Fresheners** 6% 1% 6% 24 Laundry Stain Remover** 5% 16% 6% 25 Fabric Fresheners 5% -5% -8% 26 Furniture Polish 5% 6% -4% 27 Waste Pipe Openers 4% 13% 2% 28 Floor Polish/Wax 2% -12% -2% 29 Insect Control** 2% -4% 5%

Methodology

What’s Hot around the Globe
Insights on Growth in Household Products
Executive News Report from ACNielsen Global Services
July 2006 34
Methodology Markets With ACNielsen analyzing retail purchases in nearly 100 markets around the world, this study focuses on 66 of those, spanning each region of the world. These 66 markets account for more than 90% of the world’s GDP and over 75% of the world’s population.
Europe Austria Belgium Switzerland Czech Republic Germany Denmark Spain Finland France Great Britain Hungary Ireland Italy Netherlands Norway Poland Portugal Sweden Slovakia
Asia Pacific Australia China Hong Kong Indonesia India Japan South Korea Sri Lanka Malaysia New Zealand Philippines Singapore Thailand Taiwan Vietnam
North America Canada United States
Emerging Markets United Arab Emirates Bulgaria Estonia Egypt Greece Croatia Israel Kazakhstan Lithuania Latvia Morocco Romania Russia Saudi Arabia Slovenia Tunisia Turkey South Africa
Latin America Argentina Brazil Chile Colombia Costa Rica Guatemala Honduras Mexico Nicaragua Panama El Salvador Uruguay

What’s Hot around the Globe
Insights on Growth in Household Products
Executive News Report from ACNielsen Global Services
July 2006 35
Developing Markets This study looked at developing markets across all regions in order to compare these markets with developed markets. For purposes of this study, we defined developing markets using the World Bank definition, which includes low-income and middle-income economies. This does not mean all these economies are growing or developing at a similar rate. The markets below are the ones considered “developing” for the purposes of this study:
Argentina Brazil Bulgaria Chile China Colombia Costa Rica Croatia Czech Republic Egypt El Salvador Estonia Guatemala Honduras Hungary India Indonesia Kazakhstan Latvia
Lithuania Malaysia Mexico Morocco Nicaragua Panama Philippines Poland Romania Russia Slovakia South Africa Sri Lanka Thailand Tunisia Turkey Uruguay Vietnam
What’s Hot around the Globe
Insights on Growth in Household Products
Executive News Report from ACNielsen Global Services
July 2006 36
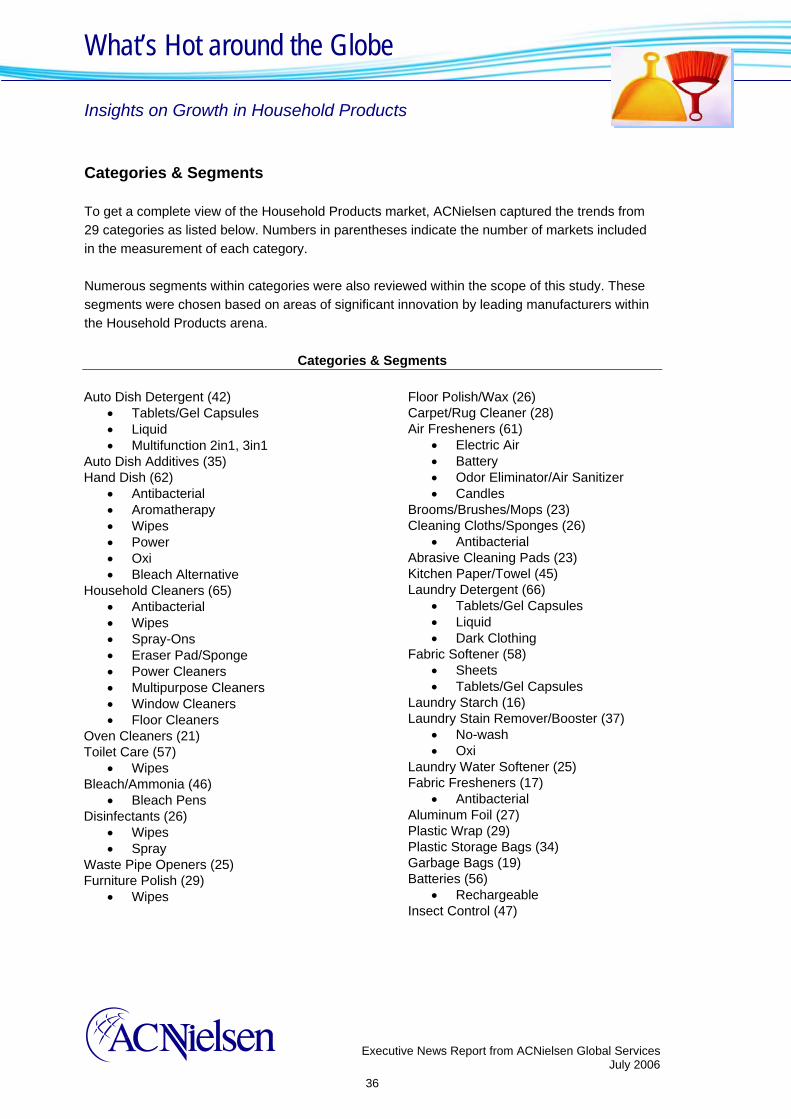
Categories & Segments To get a complete view of the Household Products market, ACNielsen captured the trends from 29 categories as listed below. Numbers in parentheses indicate the number of markets included in the measurement of each category. Numerous segments within categories were also reviewed within the scope of this study. These segments were chosen based on areas of significant innovation by leading manufacturers within the Household Products arena.
Categories & Segments Auto Dish Detergent (42)
• Tablets/Gel Capsules • Liquid • Multifunction 2in1, 3in1
Auto Dish Additives (35) Hand Dish (62)
• Antibacterial • Aromatherapy • Wipes • Power • Oxi • Bleach Alternative
Household Cleaners (65) • Antibacterial • Wipes • Spray-Ons • Eraser Pad/Sponge • Power Cleaners • Multipurpose Cleaners • Window Cleaners • Floor Cleaners
Oven Cleaners (21) Toilet Care (57)
• Wipes Bleach/Ammonia (46)
• Bleach Pens Disinfectants (26)
• Wipes • Spray
Waste Pipe Openers (25) Furniture Polish (29)
• Wipes
Floor Polish/Wax (26) Carpet/Rug Cleaner (28) Air Fresheners (61)
• Electric Air • Battery • Odor Eliminator/Air Sanitizer • Candles
Brooms/Brushes/Mops (23) Cleaning Cloths/Sponges (26)
• Antibacterial Abrasive Cleaning Pads (23) Kitchen Paper/Towel (45) Laundry Detergent (66)
• Tablets/Gel Capsules • Liquid • Dark Clothing
Fabric Softener (58) • Sheets • Tablets/Gel Capsules
Laundry Starch (16) Laundry Stain Remover/Booster (37)
• No-wash • Oxi
Laundry Water Softener (25) Fabric Fresheners (17)
• Antibacterial Aluminum Foil (27) Plastic Wrap (29) Plastic Storage Bags (34) Garbage Bags (19) Batteries (56)
• Rechargeable Insect Control (47)

What’s Hot around the Globe
Insights on Growth in Household Products
Executive News Report from ACNielsen Global Services
July 2006 37
Coverage As with our other studies, this report is based on purchasing information from grocery and mass merchandise retailers and generally excludes such channels as department stores and home improvement centers. In some markets, sales from convenience stores and pharmacies are also included. It is important to note that ACNielsen Homescan data has been included as the source for US Wal-Mart information. In addition, due to the fact that category coverage can differ significantly across markets, we have cited in our findings the actual number of markets included in this study for each category. Where products were segmented into different categories across markets, we have reconstructed the categories in order to have the most consistent view available. Time Period Information was collected for the years ending Dec 2004 and 2005.

What’s Hot around the Globe
Insights on Growth in Household Products
Executive News Report from ACNielsen Global Services
July 2006 38
Exchange Rate (per US$) To obtain a global perspective, global aggregations were created, converting local currency to US$ using a constant exchange rate across the two years.
Europe Euro 1.2500 Swiss Franc 0.8081 Czech Koruna 0.0411 Danish Krone 0.1678 British Pound 1.7508 Hungarian Forint 0.0049 Norwegian Krone 0.1543 Polish Zloty 0.2989 Swedish Krona 0.1389 Slovakia Koruna 0.0320 North America Canadian Dollar 0.8783 Asia Pacific Australian Dollar 0.7694 China Renminbi 0.1288 Hong Kong Dollar 0.1328 Indonesian Rupiah 0.0001 Indian Rupee 0.0225 Japanese Yen 0.0093 South Korean Won 0.0010 Sri Lanka Rupee 0.0098 Malaysian Ringgit 0.2750 New Zealand Dollar 0.7203 Philippines Peso 0.0176 Singapore Dollar 0.6150 Thai Baht 0.0245 Taiwan Dollar 0.0306 Vietnam Dong 0.0001 Arab Emirates 0.2651
Latin America Argentine Peso 0.3394 Brazil Real 0.4035 Chilean Peso 0.0017 Colombian Peso 0.0004 Mexican Peso 0.0908 Uruguay Peso 0.0400 Emerging Markets Bulgarian Lev 0.6296 Estonian Kroon 0.0799 Egyptian Pound 0.1688 Croatian Kuna 0.1683 Israeli Shekel 0.2270 Kazakhstan Tenge 0.0074 Lithuanian Lit 0.3620 Latvian Lat 1.7690 Moroccan Dirham 0.1131 Romanian Leu (new) 0.3500 Russian Ruble 0.0350 Saudi Riyal 0.2608 Slovenia Tolar 0.0052 Tunisian Dinar 0.7764 New Turkish Lira 0.7190 South African Rand 0.1563
Related Documents