Home-to- work mobility patterns in Spanish cities Third International Population Geographies Conference 19th-21th June 2006, Liverpool Dolores LÓPEZ, Carolina MONTORO and Juan J. PONS Department of Geography and Territorial Management University of Navarra Home-to-work mobility patterns in Spanish cities

Home-to-work mobility patterns in Spanish cities Third International Population Geographies Conference 19th-21th June 2006, Liverpool Dolores LÓPEZ, Carolina.
Dec 21, 2015
Welcome message from author
This document is posted to help you gain knowledge. Please leave a comment to let me know what you think about it! Share it to your friends and learn new things together.
Transcript

Home-to-work
mobility
patterns in
Spanish cities
Third International Population Geographies Conference19th-21th June 2006, Liverpool
Dolores LÓPEZ, Carolina MONTORO and Juan J. PONSDepartment of Geography and Territorial ManagementUniversity of Navarra
Home-to-work mobility patterns in Spanish cities

Home-to-work
mobility
patterns in
Spanish cities 1. Introduction: sources and analysed cities
2. Modal split in the daily home-to-work
mobility
2.1. Walking
2.2. Private transport
2.3. Public transport
3. Conclusions Con
tents

Home-to-work
mobility
patterns in
Spanish cities
1. Introduction

Home-to-work
mobility
patterns in
Spanish cities
Sources for the study of the home-to-work mobility
• Lack of public oficial sources for the whole of Spain till 2001 Population Census
Intr
od
uct
ion
Project: “The historical centers of Spanish cities. Comparative analysis of their characteristics and present-day situation”. Financial support provided by Ministry of Education and Sciences (Project reference: SEJ2004-07064).

Home-to-work
mobility
patterns in
Spanish cities
1. Population having no car
2. Population having no garage
3. Population making two or more journeys per day
4. Population taking less than 30 minutes per journey
5. Population working in the same city where it lives
6. Population going walking to the job
7. Population going by bicycle to the job
8. Population using private transport (car/motorbike) to go to the job
9. Population using public transport (bus, train, metro, or other
combinations of public transport) to go to the job
10. Population combining the public and the private transport
to go to the job
Vari
ab
les
(cen
sus
tract
)

Home-to-work
mobility
patterns in
Spanish cities
Cities analyzed
Intr
od
uct
ion

Home-to-work
mobility
patterns in
Spanish cities
SevillaPeople going
walking to the job (%)
Home-to-work
mobility
patterns in
Spanish cities
2. Modal Split in the daily home-to-work mobility
Home-to-work
mobility
patterns in
Spanish cities
2.1. Walking

Home-to-work
mobility
patterns in
Spanish cities
Walk
ing
Mad
rid
Barc
elo
na
Sevilla
P.
Mallorc
aTole
do
Pam
plo
na
Vale
ncia
Zara
goza
Cád
izC
uen
ca
Córd
ob
aS
an
Seb
asti
án
Jaen
Bu
rgos
Vit
ori
aG
ran
ad
aTarr
ag
on
aH
uelv
aB
ad
ajo
zH
uesca
Vallad
olid
León
Ou
ren
se
Sala
man
ca
Lu
go
median
0
10
20
30
40
50
60
70
%
Population going walking to the job in the HCC (%)

Home-to-work
mobility
patterns in
Spanish cities
Walk
ing
Total population
< 30 minutes
Without car2 o more journeys
Bicycle
Private transport
Public transport
Other transports
WALKING
(-0.623**)
(-0.580**)
(0.701**)
(-0.555**)
(-0.648**)
Home-to-work
mobility
patterns in
Spanish cities
Walk
ing
20 30 40 50 60
% people that go walking
35
40
45
50
Tw
o o
mo
re jo
urn
ey
s
•
•
•
•
•
•
••
•
•
• •
•
•
•
••
•• •••
•••
BA
B
BU
CA
CO
CU
GR
H
HU
J
LE LU
M
OU
PM
NA
SA
SSSE TTO
V
VA
VIZ
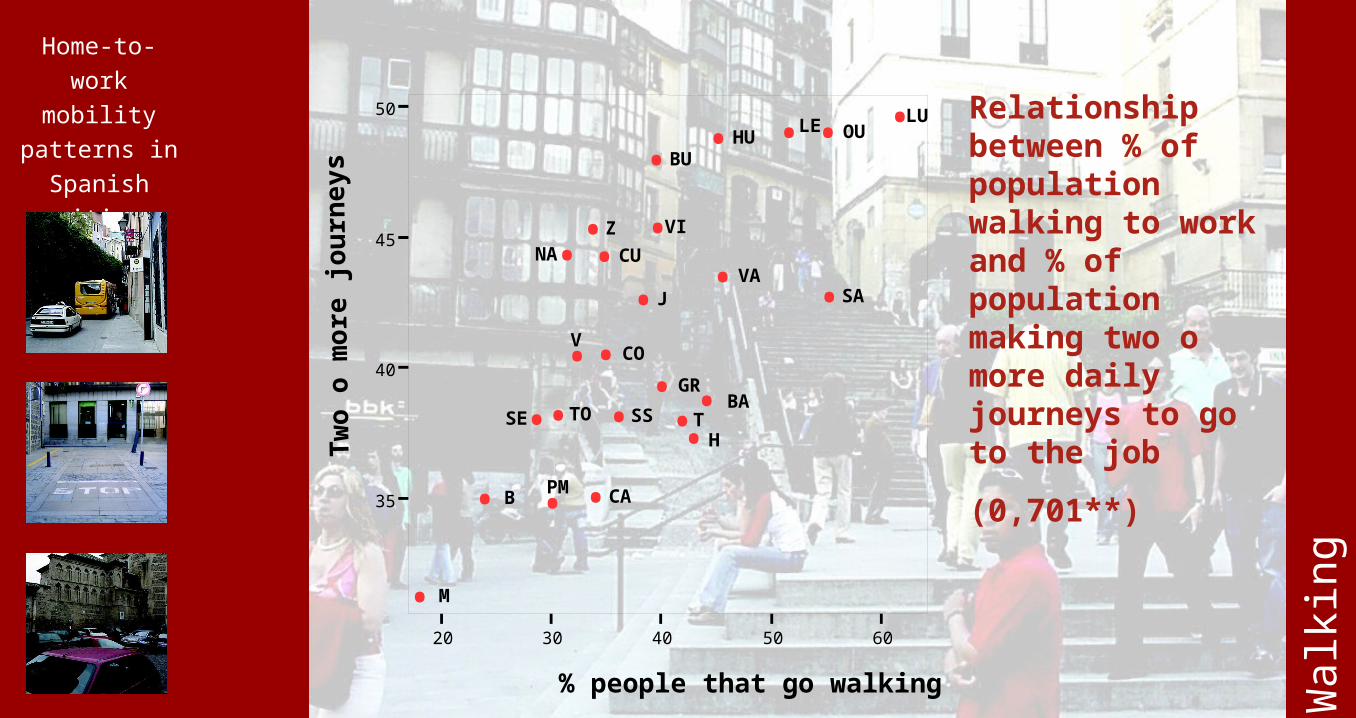
Relationship between % of population walking to work and % of population making two o more daily journeys to go to the job
(0,701**)

Home-to-work
mobility
patterns in
Spanish cities
Madrid León
Walk
ing

Home-to-work
mobility
patterns in
Spanish cities
People going walking to the job (%)
Walk
ing

Home-to-work
mobility
patterns in
Spanish cities
Differences between historical city centres and the rest of the city
Walk
ing

Home-to-work
mobility
patterns in
Spanish cities
2.2. Private transport

Home-to-work
mobility
patterns in
Spanish cities
Pri
vate
tra
nsp
ort
0
10
20
30
40
50
60
70
Mad
rid
Barc
elo
na
Cád
izZ
ara
goza
Lug
oS
an
Seb
ast
ián
Sala
man
caO
ure
nse
Valla
dolid
Gra
nad
aV
ale
nci
aLe
ón
med
ian
Tarr
ag
on
aPam
plo
na
Tole
do
Vit
ori
aB
urg
os
Hu
elv
aB
ad
ajo
zS
evill
aH
uesc
aC
órd
ob
aJa
en
Cu
en
caP.
Mallo
rca
%
Population using private transport to go to the job in the HCC

Home-to-work
mobility
patterns in
Spanish cities
Pri
vate
tra
nsp
ort
Total population
< 30 minutes
Without car2 o more journeys
Bicycle
Public transport
Other transports
PRIVATE TRANSPORT
(-0.567**)
(0.438*)
(-0.724**)
(-0.746**)
Walking

Home-to-work
mobility
patterns in
Spanish cities
Pri
vate
tra
nsp
ort
20 30 40 50
% people using private transport
20
30
40
50
60
% p
eo
ple
wit
ho
ut
car
•
•
•
•
• ••
•
•••
•
• •
•
•
•
•
•
••
•
••
BA
B
BU
CA
COCU
GR
H
HU JLELU
M
OU
PM
NA
SA
SS
SE
T
TO
V
VA
VI
Z
•
Relationship betweeen % of population having no car and % of people using private transport
(-0,724**)

Home-to-work
mobility
patterns in
Spanish cities
Barcelona Palma de Mallorca
Pri
vate
tra
nsp
ort

Home-to-work
mobility
patterns in
Spanish cities
People using private transport to go the job (%)
Home-to-work
mobility
patterns in
Spanish cities
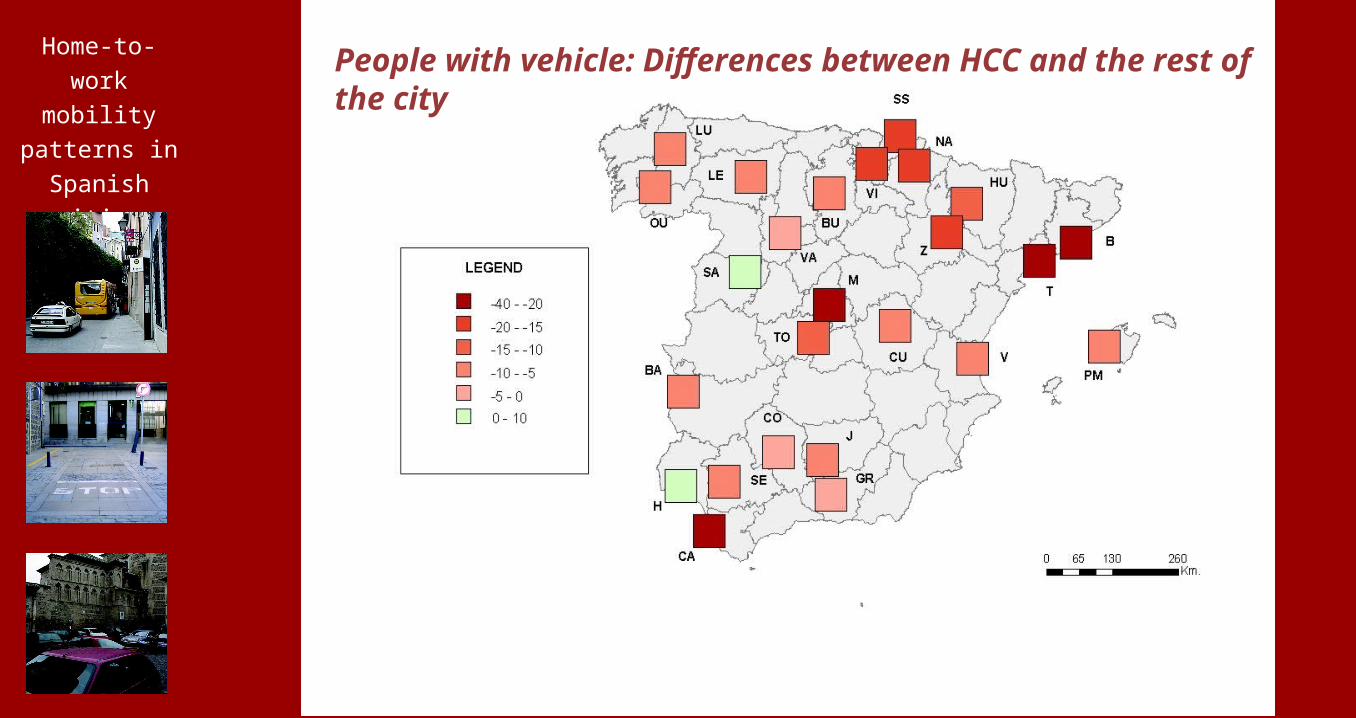
People with vehicle: Differences between HCC and the rest of the city

Home-to-work
mobility
patterns in
Spanish cities
2.3. Public transport

Home-to-work
mobility
patterns in
Spanish cities
Public
tra
nsp
ort
0
10
20
30
40
50
60
70
Hu
esc
aLu
go
Bad
ajo
zLe
ón
Ou
ren
seC
uen
caS
ala
man
caJa
en
Hu
elv
aC
órd
ob
aTole
do
Tarr
ag
on
am
ed
ian
Bu
rgos
Vit
ori
aP.
Mallo
rca
Valla
dolid
Gra
nad
aS
evill
aPam
plo
na
Vale
nci
aS
an
Seb
ast
ián
Cád
iz
Zara
goza
Barc
elo
na
Mad
rid
%
Population using public transport to go to the job in the HCC

Home-to-work
mobility
patterns in
Spanish cities
Public
tra
nsp
ort
Total population
< 30 minutes
Without car2 o more journeys
Bicycle
Private transport
Other transports
(0.813**)
(0.656**)
(-0.590**)
(0.839**)
(-0.746**)
PUBLIC TRANSPORT
Walking
(-0.445*)
(-0.729**)

Home-to-work
mobility
patterns in
Spanish cities
Public
tra
nsp
ort
0 40000 80000 120000
Total population
0
10
20
30
40
50
% P
eo
ple
us
ing
pu
blic
tra
ns
po
rt
•
•
•
•
••
••
•••
•
••
•
•
••
••
•
•
•
BA
B
BU
CA
COCU
GR
H
HU
J
LELU
M
OU
PM
NA
SA
SS
SE
T TO
V
VAVI
Z
•
•
Relationship between total population and % of population using public transport to go to the job
(0,813**)
Home-to-work
mobility
patterns in
Spanish cities
Public
tra
nsp
ort
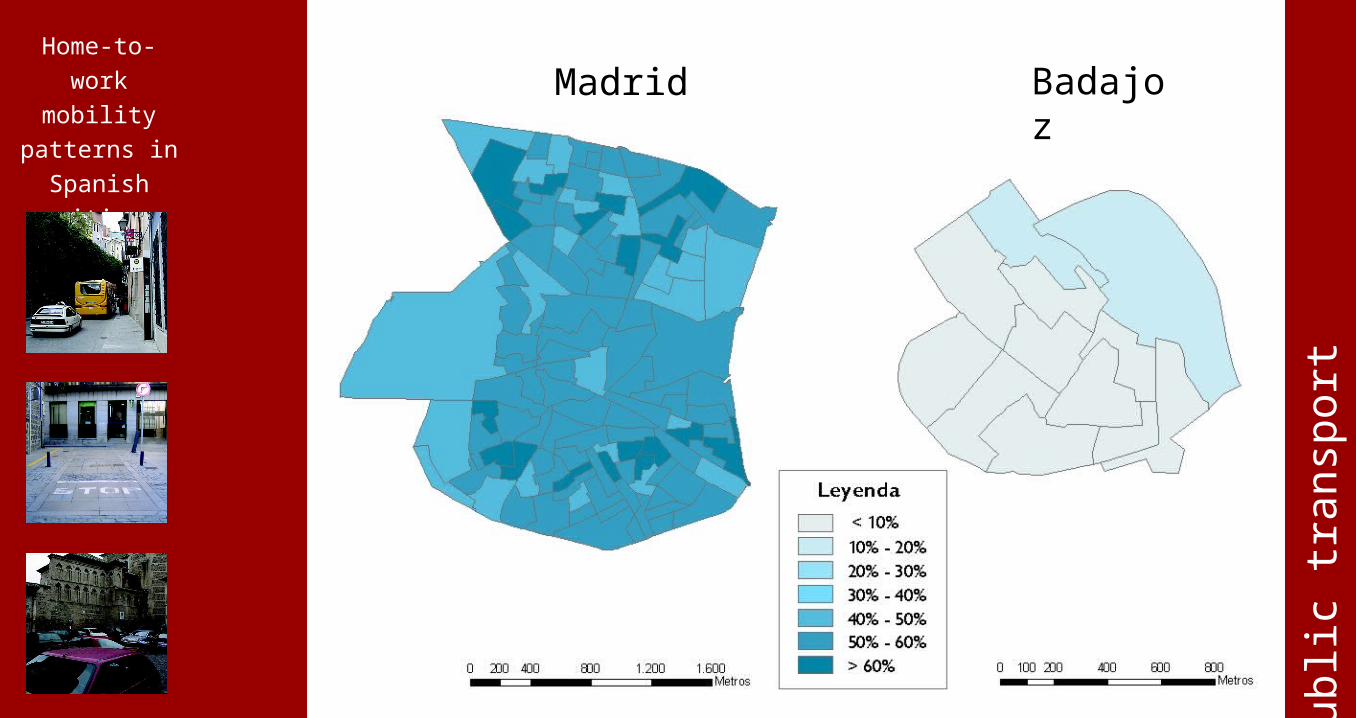
Madrid Badajoz

Home-to-work
mobility
patterns in
Spanish cities
People using public transport to go the job (%)
Public
tra
nsp
ort

Home-to-work
mobility
patterns in
Spanish cities
People using public transport to go the job (%)
Public
tra
nsp
ort

Home-to-work
mobility
patterns in
Spanish cities
People using public transport: Differences between historical city centres and the rest of the city
Public
tra
nsp
ort

Home-to-work
mobility
patterns in
Spanish cities
Bic
ycl
e0,0
0,5
1,0
1,5
2,0
2,5
Cu
en
caJa
en
Tarr
ag
on
aH
uelv
aLu
go
Mad
rid
Ou
ren
seTole
do
Sala
man
caB
urg
os
Bad
ajo
zC
ád
izm
ed
ian
Gra
nad
aLe
ón
Valla
dolid
Zara
goza
Córd
ob
aP.
Mallo
rca
Hu
esc
aB
arc
elo
na
Vale
nci
aPam
plo
na
Sevill
aS
an
Seb
ast
ián
Vit
ori
a
%
Population using bicycle to go to the job in the HCC

Home-to-work
mobility
patterns in
Spanish cities
Cities analyzes

Home-to-work
mobility
patterns in
Spanish cities
3. Conclusions

Home-to-work
mobility
patterns in
Spanish cities
Con
clu
sions
• The home-to-work mobility in the Spanish cities
analized shows the following patterns:
1. The predominant pattern in the city as a whole is
more important than the differences between the
historical city centres and the rest of the city.

Home-to-work
mobility
patterns in
Spanish cities
Differences between historical city centres and the rest of the city. Mean of the 25 capitals of province.
-20 -10 0 10 20
Private transport
Public transport
Others transports
Take less than 30 minutes
2 or more journeys
Bicycle
Working in the same town
Without vehicle
Without garage
Walking
sd 13,9
sd 8,9
sd 6,6
sd 5,6
sd 4,0

Home-to-work
mobility
patterns in
Spanish cities
Con
clu
sions
2. These differences show that the historical city
centres are places more suitable to go walking to work
and with more difficulties to use the private transport.
3. The distribution of the modal-split is the following: 1)
Private transport (40%); 2) walking (39,6%); 3) Public
transport (15% ), and 4) Bicycle and others
Home-to-work
mobility
patterns in
Spanish cities
Con
clu
siones
4. Conclusions show that go walking and the use of
private transport is related to a lower use of public
transport.
5. Go walking to the job is associated with a higher
frequency of journeys per day. The use of private
transport is strongly related to the availability of a car.
6. The total population is the more important variable in
the modal split patterns.

Home-to-work
mobility
patterns in
Spanish cities
Public transport< 30 minutes
Withour car
2 o more journeys
Bicycle
Private transport
Other transports
(-0.567**)
(0.595**)
(-0.649**)
(0.606**)TOTAL
POPULATION
Walking
(-0.416*)
(-0.623**)
(0.813**)

Home-to-work
mobility
patterns in
Spanish cities
Dolores LÓPEZ, Carolina MONTORO and Juan J. PONSDepartment of Geography and Territorial ManagementUniversity of Navarra
Thank you for your attention
Third International Population Geographies Conference19th-21th June 2006, Liverpool
Related Documents