D622–D631 Nucleic Acids Research, 2022, Vol. 50, Database issue Published online 19 November 2021 https://doi.org/10.1093/nar/gkab1062 HMDB 5.0: the Human Metabolome Database for 2022 David S. Wishart 1,2,3,4,* , AnChi Guo 1 , Eponine Oler 1 , Fei Wang 2 , Afia Anjum 2 , Harrison Peters 1 , Raynard Dizon 1 , Zinat Sayeeda 2 , Siyang Tian 1 , Brian L. Lee 1 , Mark Berjanskii 1 , Robert Mah 1 , Mai Yamamoto 1 , Juan Jovel 1 , Claudia Torres-Calzada 1 , Mickel Hiebert-Giesbrecht 1 , Vicki W. Lui 1 , Dorna Varshavi 1 , Dorsa Varshavi 1 , Dana Allen 1 , David Arndt 1 , Nitya Khetarpal 1 , Aadhavya Sivakumaran 1 , Karxena Harford 1 , Selena Sanford 1 , Kristen Yee 1 , Xuan Cao 1 , Zachary Budinski 1 , Jaanus Liigand 1 , Lun Zhang 1 , Jiamin Zheng 1 , Rupasri Mandal 1 , Naama Karu 5 , Maija Dambrova 6 , Helgi B. Schi ¨ oth 7,8 , Russell Greiner 2 and Vasuk Gautam 1 1 Department of Biological Sciences, University of Alberta, Edmonton, AB T6G 2E9, Canada, 2 Department of Computing Science, University of Alberta, Edmonton, AB T6G 2E8, Canada, 3 Department of Laboratory Medicine and Pathology, University of Alberta, Edmonton, AB T6G 2B7, Canada, 4 Faculty of Pharmacy and Pharmaceutical Sciences, University of Alberta, Edmonton, AB T6G 2H7, Canada, 5 Leiden Academic Centre for Drug Research LACDR/Analytical Biosciences, Leiden University, Leiden, Netherlands, 6 Laboratory of Pharmaceutical Pharmacology, Latvian Institute of Organic Synthesis, Riga, Latvia, 7 Section of Functional Pharmacology, Department of Neuroscience, Uppsala University, Uppsala, Sweden and 8 Institute for Translational Medicine and Biotechnology, Sechenov First Moscow State Medical University, Moscow, Russia Received September 15, 2021; Revised October 13, 2021; Editorial Decision October 14, 2021; Accepted October 19, 2021 ABSTRACT The Human Metabolome Database or HMDB (https: //hmdb.ca) has been providing comprehensive ref- erence information about human metabolites and their associated biological, physiological and chemi- cal properties since 2007. Over the past 15 years, the HMDB has grown and evolved significantly to meet the needs of the metabolomics community and re- spond to continuing changes in internet and comput- ing technology. This year’s update, HMDB 5.0, brings a number of important improvements and upgrades to the database. These should make the HMDB more useful and more appealing to a larger cross-section of users. In particular, these improvements include: (i) a significant increase in the number of metabo- lite entries (from 114 100 to 217 920 compounds); (ii) enhancements to the quality and depth of metabolite descriptions; (iii) the addition of new structure, spec- tral and pathway visualization tools; (iv) the inclusion of many new and much more accurately predicted spectral data sets, including predicted NMR spec- tra, more accurately predicted MS spectra, predicted retention indices and predicted collision cross sec- tion data and (v) enhancements to the HMDB’s search functions to facilitate better compound identification. Many other minor improvements and updates to the content, the interface, and general performance of the HMDB website have also been made. Overall, we believe these upgrades and updates should greatly enhance the HMDB’s ease of use and its potential ap- plications not only in human metabolomics but also in exposomics, lipidomics, nutritional science, bio- chemistry and clinical chemistry. INTRODUCTION The Human Metabolome Database (HMDB) is the world’s largest and most comprehensive, organism-specific metabolomic database. It contains richly annotated, care- fully cross-checked, extensively referenced information about all currently known human metabolites. This in- cludes information contained in HMDB’s ‘MetaboCard’ on their chemical structures, names or identifiers, detailed tex- tual descriptions, references, chemical taxonomy, biologi- cal roles, physiological concentrations, tissue/biofluid lo- cations, disease associations, genetic associations, chemi- cal and enzymatic reactions, metabolic pathways and refer- ential MS/MS (tandem mass spectrometry), GC–MS (gas chromatography mass spectrometry), and NMR (nuclear magnetic resonance) spectra. The HMDB supports a wide range of interactive web queries that allow metabolomic researchers to identify and annotate human (and other * To whom correspondence should be addressed. Tel: +1 780 492 8574; Email: [email protected] C The Author(s) 2021. Published by Oxford University Press on behalf of Nucleic Acids Research. This is an Open Access article distributed under the terms of the Creative Commons Attribution License (http://creativecommons.org/licenses/by/4.0/), which permits unrestricted reuse, distribution, and reproduction in any medium, provided the original work is properly cited. Downloaded from https://academic.oup.com/nar/article/50/D1/D622/6431815 by guest on 11 July 2022

Welcome message from author
This document is posted to help you gain knowledge. Please leave a comment to let me know what you think about it! Share it to your friends and learn new things together.
Transcript
D622–D631 Nucleic Acids Research, 2022, Vol. 50, Database issue Published online 19 November 2021https://doi.org/10.1093/nar/gkab1062
HMDB 5.0: the Human Metabolome Database for 2022David S. Wishart 1,2,3,4,*, AnChi Guo1, Eponine Oler1, Fei Wang2, Afia Anjum2,Harrison Peters1, Raynard Dizon1, Zinat Sayeeda2, Siyang Tian1, Brian L. Lee1,Mark Berjanskii1, Robert Mah1, Mai Yamamoto1, Juan Jovel1, Claudia Torres-Calzada1,Mickel Hiebert-Giesbrecht1, Vicki W. Lui1, Dorna Varshavi1, Dorsa Varshavi1, Dana Allen1,David Arndt1, Nitya Khetarpal1, Aadhavya Sivakumaran1, Karxena Harford1,Selena Sanford1, Kristen Yee1, Xuan Cao1, Zachary Budinski1, Jaanus Liigand1,Lun Zhang1, Jiamin Zheng1, Rupasri Mandal1, Naama Karu5, Maija Dambrova6,Helgi B. Schioth7,8, Russell Greiner2 and Vasuk Gautam1
1Department of Biological Sciences, University of Alberta, Edmonton, AB T6G 2E9, Canada, 2Department ofComputing Science, University of Alberta, Edmonton, AB T6G 2E8, Canada, 3Department of Laboratory Medicineand Pathology, University of Alberta, Edmonton, AB T6G 2B7, Canada, 4Faculty of Pharmacy and PharmaceuticalSciences, University of Alberta, Edmonton, AB T6G 2H7, Canada, 5Leiden Academic Centre for Drug ResearchLACDR/Analytical Biosciences, Leiden University, Leiden, Netherlands, 6Laboratory of PharmaceuticalPharmacology, Latvian Institute of Organic Synthesis, Riga, Latvia, 7Section of Functional Pharmacology,Department of Neuroscience, Uppsala University, Uppsala, Sweden and 8Institute for Translational Medicine andBiotechnology, Sechenov First Moscow State Medical University, Moscow, Russia
Received September 15, 2021; Revised October 13, 2021; Editorial Decision October 14, 2021; Accepted October 19, 2021
ABSTRACT
The Human Metabolome Database or HMDB (https://hmdb.ca) has been providing comprehensive ref-erence information about human metabolites andtheir associated biological, physiological and chemi-cal properties since 2007. Over the past 15 years, theHMDB has grown and evolved significantly to meetthe needs of the metabolomics community and re-spond to continuing changes in internet and comput-ing technology. This year’s update, HMDB 5.0, bringsa number of important improvements and upgradesto the database. These should make the HMDB moreuseful and more appealing to a larger cross-sectionof users. In particular, these improvements include:(i) a significant increase in the number of metabo-lite entries (from 114 100 to 217 920 compounds); (ii)enhancements to the quality and depth of metabolitedescriptions; (iii) the addition of new structure, spec-tral and pathway visualization tools; (iv) the inclusionof many new and much more accurately predictedspectral data sets, including predicted NMR spec-tra, more accurately predicted MS spectra, predictedretention indices and predicted collision cross sec-tion data and (v) enhancements to the HMDB’s searchfunctions to facilitate better compound identification.
Many other minor improvements and updates to thecontent, the interface, and general performance ofthe HMDB website have also been made. Overall, webelieve these upgrades and updates should greatlyenhance the HMDB’s ease of use and its potential ap-plications not only in human metabolomics but alsoin exposomics, lipidomics, nutritional science, bio-chemistry and clinical chemistry.
INTRODUCTION
The Human Metabolome Database (HMDB) is theworld’s largest and most comprehensive, organism-specificmetabolomic database. It contains richly annotated, care-fully cross-checked, extensively referenced informationabout all currently known human metabolites. This in-cludes information contained in HMDB’s ‘MetaboCard’ ontheir chemical structures, names or identifiers, detailed tex-tual descriptions, references, chemical taxonomy, biologi-cal roles, physiological concentrations, tissue/biofluid lo-cations, disease associations, genetic associations, chemi-cal and enzymatic reactions, metabolic pathways and refer-ential MS/MS (tandem mass spectrometry), GC–MS (gaschromatography mass spectrometry), and NMR (nuclearmagnetic resonance) spectra. The HMDB supports a widerange of interactive web queries that allow metabolomicresearchers to identify and annotate human (and other
*To whom correspondence should be addressed. Tel: +1 780 492 8574; Email: [email protected]
C© The Author(s) 2021. Published by Oxford University Press on behalf of Nucleic Acids Research.This is an Open Access article distributed under the terms of the Creative Commons Attribution License (http://creativecommons.org/licenses/by/4.0/), whichpermits unrestricted reuse, distribution, and reproduction in any medium, provided the original work is properly cited.
Dow
nloaded from https://academ
ic.oup.com/nar/article/50/D
1/D622/6431815 by guest on 11 July 2022
Nucleic Acids Research, 2022, Vol. 50, Database issue D623
mammalian) metabolomic data through text, structure,mass or spectral matching. Unlike general metabolism ormetabolic pathway databases such as KEGG (1), Reactome(2) and the Cyc databases (3) or general spectral databasessuch as the BioMagResBank (4), Metlin (5) or MassBank[https://massbank.eu/MassBank/], the HMDB is not sim-ply an archival database of compounds or spectra. Ratherit is a colorfully illustrated, extensively annotated online en-cyclopedia covering almost everything that is known abouthuman metabolites and human metabolism.
Since its first release in 2007 (6), the HMDB has gonethrough extensive development and improvement to meetthe changing needs of the metabolomics community. Thesechanges have also been driven to keep pace with newmetabolite discoveries and new insights in metabolism, tostay current with advancing metabolomic technologies, andto adapt to changes in modern web design and data deliv-ery technologies. Over the past 15 years the changes to theHMDB have been quite remarkable. The first release of theHMDB (HMDB 1.0) contained limited biological, phys-iological and physico-chemical data on just 2180 humanmetabolites (6). HMDB 2.0, which was released in 2009,included more spectral data and much more literature-derived physiological and biochemical data for 6408 humanmetabolites (7). HMDB 3.0, which appeared in 2013, con-tained a total of 40 153 human metabolites (8). This thirdrelease greatly expanded the HMDB’s spectral reference li-brary, added metabolic pathway data and modernized theHMDB user interface. HMDB 4.0, which was published in2018, contained at total of 114 100 compounds (9). This ver-sion massively increased the number of NMR, MS/MS andGC–MS reference spectra and the number of illustratedmetabolic pathways. It also added new data on metabolicreactions, pharmacometabolomic data, metabolite-SNP as-sociations and introduced the ClassyFire (10) chemical tax-onomy.
For this year’s release of HMDB (version 5.0), theHMDB curation team has implemented a number of verysignificant and noteworthy improvements to the database.In particular, the HMDB 5.0 now has 217 920 annotatedmetabolite entries, as well as another 1 581 537 unannotatedderivatized metabolite entries for GC–MS. As part of alarge-scale, multi-year database update, the HMDB 5.0 hasalso significantly improved quality and depth of metabo-lite descriptions, with thousands of metabolite descriptionsbeing manually or semi-manually rewritten, corrected andexpanded. The HMDB 5.0 now includes a new ChemicalFunctional Ontology (ChemFOnt) which provides a moremachine-readable route to extract metabolite functions andorigins. In addition, many new, far more powerful and farmore interactive structure, spectral and pathway visualiza-tion tools have been added to HMDB 5.0. Likewise, 9 445375 highly quality predicted spectral data sets and other ex-perimental ‘observables’ have been added to the database,including 312 980 predicted 1H and 13C NMR spectra, 1 752677 more predicted GC–MS spectra, 1 440 324 predictedLC–MS/MS spectra, 5 067 714 predicted retention indicesand 871 680 predicted collision cross section values. Fi-nally, significant enhancements to the HMDB’s search func-tions have been added to facilitate better and more accuratecompound identification. More details describing these im-
provements are given under the following five subsections:(i) New Metabolite Entries; (ii) Improved Metabolite De-scriptions; (iii) New Visualization Tools; (iv) New SpectralData and (v) Improved Search Functions.
NEW METABOLITE ENTRIES
One of the most significant challenges facing metabolomicsresearchers concerns the annotation or identification ofm/z features in MS spectra obtained from metabolomicsstudies. In many cases, the number of m/z features inuntargeted MS-based human metabolomics studies thatcan be confidently identified is typically <2% (11). Evenamong targeted metabolomics studies, it is rare to iden-tify >900 human metabolites (12), which is <1% of theknown human metabolome. This strongly suggests thatboth the metabolite coverage and the MS spectral coveragein the HMDB (and other databases) has been inadequate orincomplete.
To address these issues, a concerted effort was under-taken by the HMDB curation team to increase the HMDB’smetabolite coverage. From 2018 to 2020 a continuous scanof the literature as well as a more detailed historical reviewof published metabolomics and exposomics studies wasconducted. This led to the addition of another 1476 metabo-lites to the database. Beginning in 2021 a more focused ef-fort was undertaken to expand HMDB’s coverage of oxi-dized lipids (i.e. lipids with oxidized acyl chains) (13), addi-tional cardiolipins, exposome or environmental compoundsidentified in human blood (14), acylcarnitines and theircorresponding acylCoAs (15), as well as acylamides (16).We also included novel bile acid-amino-acid conjugates(17), food-derived compounds (https://foodb.ca), sulfatedmetabolites (18), other newly identified human metabolites,newly approved drugs and a number of microbially or gut-derived metabolites. These additions required careful re-view of dozens of papers and textbooks, of which only afew exemplar references are mentioned here. In total, 40142 new oxidized lipids, 52 783 new cardiolipins, 14 929blood exposome compounds, 2165 acylcarnitines and acyl-CoAs and 188 acylamides were added to the database. Inaddition, 65 bile acid amino-acid conjugates, 3168 food-derived compounds, 35 additional sulfated metabolites, 65newly approved drugs, 19 new microbially derived com-pounds and 9 novel, experimentally identified metaboliteswere also added to the database. In total, 113 568 new com-pounds were appended to HMDB 5.0. In addition, another9548 BioTransformer-predicted compounds as well as 323disproven or erroneous compounds along with several du-plicate entries were removed. As a result, HMDB 5.0 nowhas a total of 217 920 compounds. Over and above these an-notated metabolites, the HMDB also maintains an unanno-tated collection of 1 581 537 derivatized compounds whichcorrespond to TMS and TBDMS derivatized metabolitesthat could potentially be detectable via GC-MS methods.This derivatized compound collection is described in moredetail later.
All of the exposome compounds identified in humanblood, the bile amino-acid conjugates, the food-derivedcompounds, the sulfated metabolites, other newly identifiedhuman metabolites, newly approved drugs and microbially
Dow
nloaded from https://academ
ic.oup.com/nar/article/50/D
1/D622/6431815 by guest on 11 July 2022
D624 Nucleic Acids Research, 2022, Vol. 50, Database issue
or gut-derived metabolites are classified in the HMDB aseither ‘detected but not quantified’ or ‘detected and quanti-fied’ metabolites. This classification, which has been in placein the HMDB since 2013, simply means there is solid experi-mental evidence and literature data supporting the metabo-lite’s existence and/or quantification. On the other hand,the vast majority of the newly added lipids and lipid/acylderivatives, are classified in the HMDB as ‘expected butnot quantified’ compounds. This category, which has alsobeen in place since 2013, includes those metabolites thatare expected to exist based on biochemistry, enzymology orknown constituents (i.e. acyl chains) found in the humanbody. Evidence for their structure and existence is ascer-tained based on an extensive literature review by the HMDBcuration team, along with a detailed analysis of known con-stituents in human samples and putative identifications re-ported from human metabolomic studies of various bioflu-ids and tissues. In all cases, specific literature references areprovided to support the existence of these newly added com-pounds.
Each newly added metabolite in the HMDB 5.0 has gonethrough HMDB’s comprehensive data update process. Inparticular, every metabolite is given an accession numberand a variety of in-house programs and commercial soft-ware tools are run to collect, calculate, generate or predictdata covering up to 130 data fields for each compound’sMetaboCard. Many of the resulting data updates (or se-lected samples) are manually reviewed by members of thecuration team to ensure consistency and accuracy. Detailson the data sources, curation protocols, data harvesting anddescription-writing software (ChemoSummarizer and DataWrangler), prediction software, data management system,and quality assurance criteria for the HMDB have been de-scribed previously (8,9).
IMPROVED METABOLITE DESCRIPTIONS
A particular strength of the HMDB, and one of the mainreasons for its popularity within the metabolomics commu-nity, is its rich collection of metabolite descriptions. Everycompound in the HMDB has a detailed textual descriptionranging from 50 to 500 words that describes the compound,what it does or where it’s located in the body or in the cell. Inaddition, many metabolites in the HMDB have additionalinformation regarding their occurrence in biofluids or tis-sues, their normal/abnormal concentrations, their diseaseassociations, their MS and/or NMR spectra, their knownpathways, their external database hyperlinks and their as-sociated enzymes or transporters.
To update the HMDB 5.0, a concerted effort was madeto manually research, rewrite and remediate compounddescriptions for more than 800 well-known or disease-associated metabolites. This process required hundreds ofhours of intensive literature research and writing. In addi-tion, dozens of lesser-known metabolites with inadequateor incomplete descriptions were also manually researchedand re-written. For those HMDB compounds that weremodular in structure (i.e. lipids, bile acids and acyl deriva-tives), so-called ‘template descriptions’ were carefully writ-ten by hand and then computer programs were run to gen-erate >200, 000 individualized or customized compound
descriptions using these fill-in-the-blank templates. In ad-dition, HMDB’s ChemoSummarizer (a program that hasbeen used to auto-describe compounds in the HMDB since2017) was modified and upgraded to incorporate morechemical/biological data, to extract data from DrugBank(19) and MarkerDB (20) and to generate more informativedescriptions. Overall, these improvements to the quality andcoverage of HMDB’s descriptions should greatly enhancethe overall utility and reliability of the database.
In addition to these ‘human readable descriptions’, fur-ther development also continued with HMDB’s chemicalfunctional ontology, called ChemFOnt (9), which is dis-played under each MetaboCard’s ‘Ontology’ field. Chem-FOnt was first introduced in HMDB 4.0 as a hierar-chically structured ontology that was both OWL (WebOntology Language) and OBO (Open Biological Ontol-ogy) compliant. ChemFOnt was developed to help estab-lish a chemical/biochemical ontology for the metabolomicscommunity that could complement the better-knownGene Ontology or GO (21). GO is widely used in theproteomics/genomics community to assist with gene anno-tation and pathway analysis. The near-term goal for Chem-FOnt has been to help automate and extend metabolite de-scriptions within the HMDB. The second near-term goal isto make HMDB’s compound descriptions more fully ma-chine readable. The 2017 version of ChemFOnt coveredfour major functional categories (process, role, physiologi-cal effect and disposition) that were associated with 35 sub-categories and 3150 descriptors or definitions. For HMDB5.0, ChemFOnt has grown to include 247 subcategories,with a hierarchical structure of up to 6 nested categoriesand a total of 221 454 definitions. All categorical asser-tions or assignments in ChemFOnt have been restructuredto have clear provenance with either a database or a liter-ature reference. Furthermore, the quality and correctnessof the ChemFOnt entries have been greatly improved overwhat was initially presented in HMDB 4.0. Every metabo-lite entry in HMDB 5.0 now has a hierarchically structured,fully hyperlinked ChemFOnt table where every descriptordefinition can be accessed by mousing over the term of inter-est. Much more detailed disposition data about the origin(food, microbial, endogenous), originating species, biofluidand body site of many metabolites (especially food and mi-crobial metabolites) is now provided through ChemFOnt.The data within ChemFOnt is still evolving and growingon a daily basis. This is because functional data is beingcontinuously added to every HMDB entry through ongoing‘background’ data mining and natural language processingactivities. These background processes are being run andoverseen by the HMDB curation team. Over the next year itis expected that nearly every ChemFOnt entry will containsignificantly more human-readable and machine-readableinformation than what is available in standard HMDB com-pound descriptions.
In addition to these widespread improvements inHMDB’s compound descriptions, another major data up-date effort has been directed to expanding the amount ofexperimentally measured data in HMDB 5.0. This experi-mentally measured data includes more quantitative data onvitamin levels (normal and abnormal), extensive metabo-lite data on the human fecal metabolome (22), quantita-
Dow
nloaded from https://academ
ic.oup.com/nar/article/50/D
1/D622/6431815 by guest on 11 July 2022
Nucleic Acids Research, 2022, Vol. 50, Database issue D625
tive data on reference values for urinary metabolites in new-borns (23) and substantially more quantitative data on theNIST (National Institute of Standards) human serum ref-erence known as SRM-1950 (24). These updates are visi-ble under the ‘Normal/Abnormal Concentration’ field ineach MetaboCard. In total, more than 19 715 compoundconcentrations have been added, corrected or annotated.Likewise, significant numbers of experimental NMR andMS data for purified reference compounds have also beenadded. These include reference NMR spectra from ongo-ing activities within the Wishart laboratory (309 experimen-tal NMR spectra for 218 compounds) as well as 37 589 ex-perimental MS spectra made available from MassBank andother MS spectral providers. These updates are visible un-der the ‘Spectra’ field in each MetaboCard
NEW VISUALIZATION TOOLS
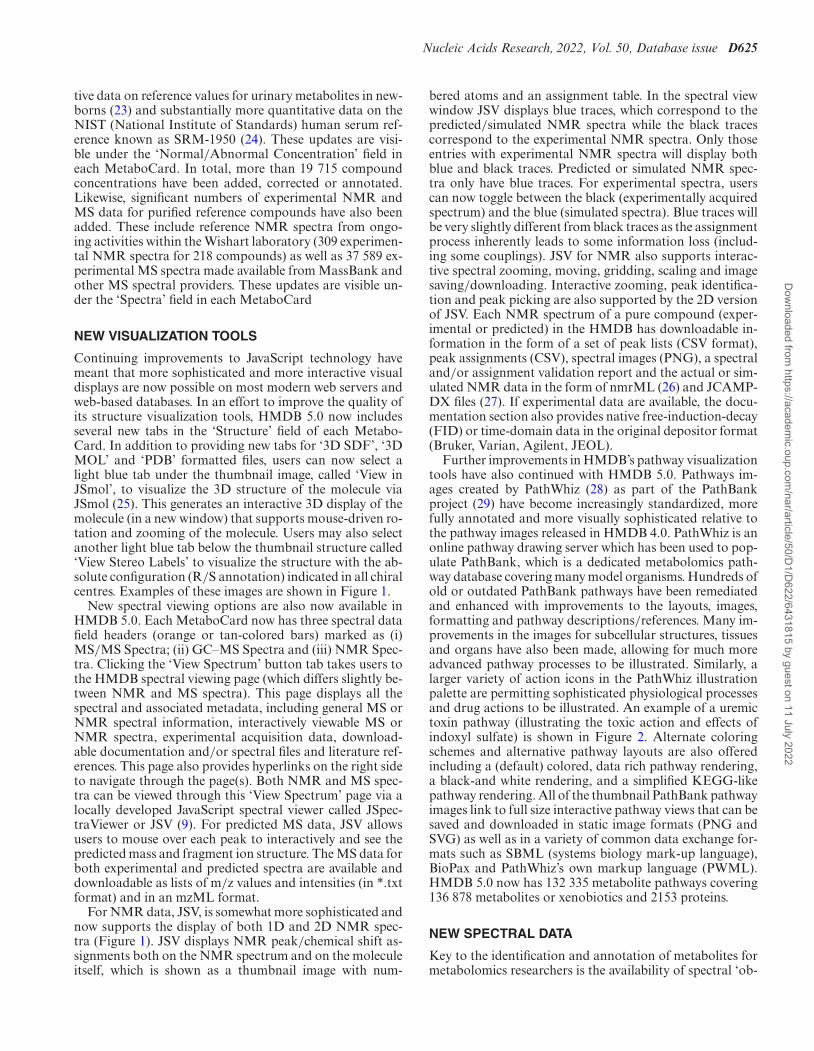
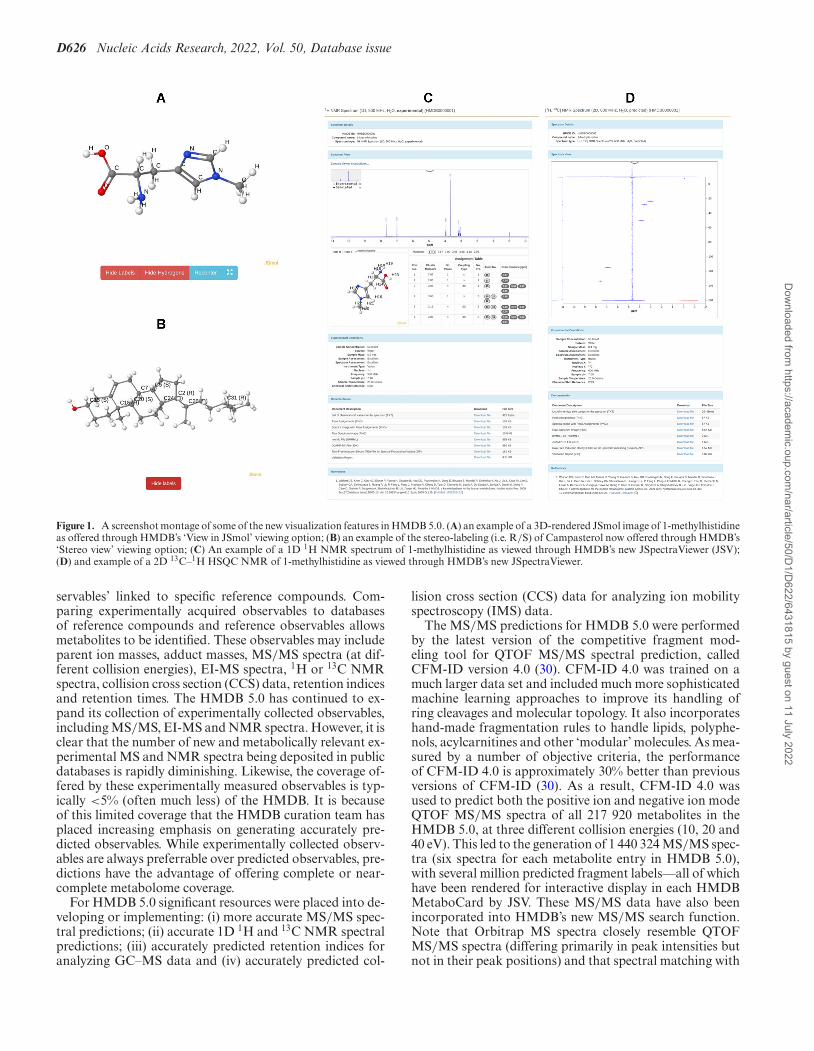
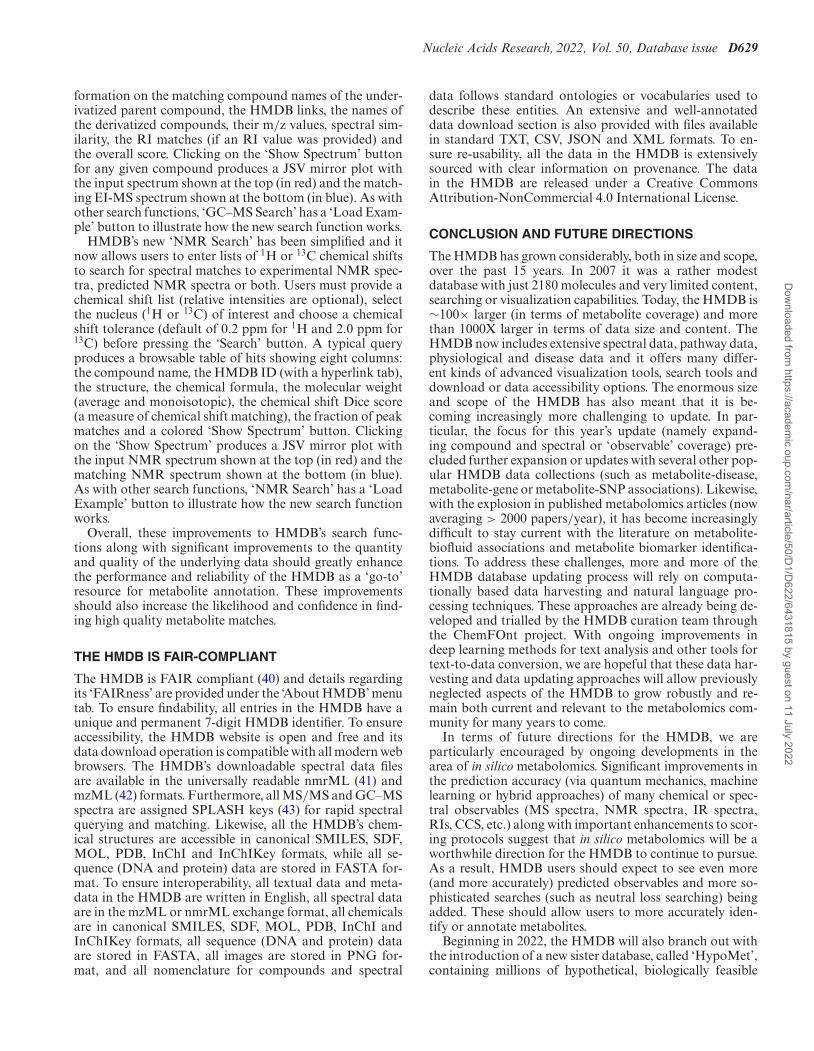
Continuing improvements to JavaScript technology havemeant that more sophisticated and more interactive visualdisplays are now possible on most modern web servers andweb-based databases. In an effort to improve the quality ofits structure visualization tools, HMDB 5.0 now includesseveral new tabs in the ‘Structure’ field of each Metabo-Card. In addition to providing new tabs for ‘3D SDF’, ‘3DMOL’ and ‘PDB’ formatted files, users can now select alight blue tab under the thumbnail image, called ‘View inJSmol’, to visualize the 3D structure of the molecule viaJSmol (25). This generates an interactive 3D display of themolecule (in a new window) that supports mouse-driven ro-tation and zooming of the molecule. Users may also selectanother light blue tab below the thumbnail structure called‘View Stereo Labels’ to visualize the structure with the ab-solute configuration (R/S annotation) indicated in all chiralcentres. Examples of these images are shown in Figure 1.
New spectral viewing options are also now available inHMDB 5.0. Each MetaboCard now has three spectral datafield headers (orange or tan-colored bars) marked as (i)MS/MS Spectra; (ii) GC–MS Spectra and (iii) NMR Spec-tra. Clicking the ‘View Spectrum’ button tab takes users tothe HMDB spectral viewing page (which differs slightly be-tween NMR and MS spectra). This page displays all thespectral and associated metadata, including general MS orNMR spectral information, interactively viewable MS orNMR spectra, experimental acquisition data, download-able documentation and/or spectral files and literature ref-erences. This page also provides hyperlinks on the right sideto navigate through the page(s). Both NMR and MS spec-tra can be viewed through this ‘View Spectrum’ page via alocally developed JavaScript spectral viewer called JSpec-traViewer or JSV (9). For predicted MS data, JSV allowsusers to mouse over each peak to interactively and see thepredicted mass and fragment ion structure. The MS data forboth experimental and predicted spectra are available anddownloadable as lists of m/z values and intensities (in *.txtformat) and in an mzML format.
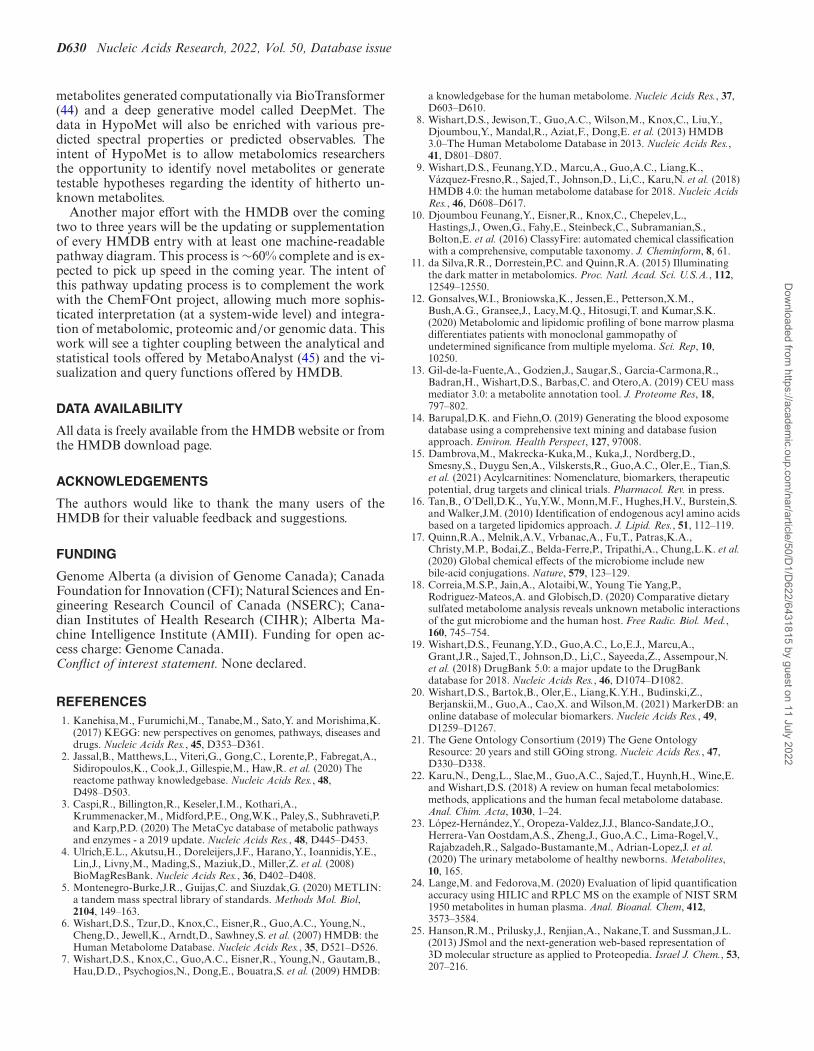
For NMR data, JSV, is somewhat more sophisticated andnow supports the display of both 1D and 2D NMR spec-tra (Figure 1). JSV displays NMR peak/chemical shift as-signments both on the NMR spectrum and on the moleculeitself, which is shown as a thumbnail image with num-
bered atoms and an assignment table. In the spectral viewwindow JSV displays blue traces, which correspond to thepredicted/simulated NMR spectra while the black tracescorrespond to the experimental NMR spectra. Only thoseentries with experimental NMR spectra will display bothblue and black traces. Predicted or simulated NMR spec-tra only have blue traces. For experimental spectra, userscan now toggle between the black (experimentally acquiredspectrum) and the blue (simulated spectra). Blue traces willbe very slightly different from black traces as the assignmentprocess inherently leads to some information loss (includ-ing some couplings). JSV for NMR also supports interac-tive spectral zooming, moving, gridding, scaling and imagesaving/downloading. Interactive zooming, peak identifica-tion and peak picking are also supported by the 2D versionof JSV. Each NMR spectrum of a pure compound (exper-imental or predicted) in the HMDB has downloadable in-formation in the form of a set of peak lists (CSV format),peak assignments (CSV), spectral images (PNG), a spectraland/or assignment validation report and the actual or sim-ulated NMR data in the form of nmrML (26) and JCAMP-DX files (27). If experimental data are available, the docu-mentation section also provides native free-induction-decay(FID) or time-domain data in the original depositor format(Bruker, Varian, Agilent, JEOL).
Further improvements in HMDB’s pathway visualizationtools have also continued with HMDB 5.0. Pathways im-ages created by PathWhiz (28) as part of the PathBankproject (29) have become increasingly standardized, morefully annotated and more visually sophisticated relative tothe pathway images released in HMDB 4.0. PathWhiz is anonline pathway drawing server which has been used to pop-ulate PathBank, which is a dedicated metabolomics path-way database covering many model organisms. Hundreds ofold or outdated PathBank pathways have been remediatedand enhanced with improvements to the layouts, images,formatting and pathway descriptions/references. Many im-provements in the images for subcellular structures, tissuesand organs have also been made, allowing for much moreadvanced pathway processes to be illustrated. Similarly, alarger variety of action icons in the PathWhiz illustrationpalette are permitting sophisticated physiological processesand drug actions to be illustrated. An example of a uremictoxin pathway (illustrating the toxic action and effects ofindoxyl sulfate) is shown in Figure 2. Alternate coloringschemes and alternative pathway layouts are also offeredincluding a (default) colored, data rich pathway rendering,a black-and white rendering, and a simplified KEGG-likepathway rendering. All of the thumbnail PathBank pathwayimages link to full size interactive pathway views that can besaved and downloaded in static image formats (PNG andSVG) as well as in a variety of common data exchange for-mats such as SBML (systems biology mark-up language),BioPax and PathWhiz’s own markup language (PWML).HMDB 5.0 now has 132 335 metabolite pathways covering136 878 metabolites or xenobiotics and 2153 proteins.
NEW SPECTRAL DATA
Key to the identification and annotation of metabolites formetabolomics researchers is the availability of spectral ‘ob-
Dow
nloaded from https://academ
ic.oup.com/nar/article/50/D
1/D622/6431815 by guest on 11 July 2022
D626 Nucleic Acids Research, 2022, Vol. 50, Database issue
Figure 1. A screenshot montage of some of the new visualization features in HMDB 5.0. (A) an example of a 3D-rendered JSmol image of 1-methylhistidineas offered through HMDB’s ‘View in JSmol’ viewing option; (B) an example of the stereo-labeling (i.e. R/S) of Campasterol now offered through HMDB’s‘Stereo view’ viewing option; (C) An example of a 1D 1H NMR spectrum of 1-methylhistidine as viewed through HMDB’s new JSpectraViewer (JSV);(D) and example of a 2D 13C–1H HSQC NMR of 1-methylhistidine as viewed through HMDB’s new JSpectraViewer.
servables’ linked to specific reference compounds. Com-paring experimentally acquired observables to databasesof reference compounds and reference observables allowsmetabolites to be identified. These observables may includeparent ion masses, adduct masses, MS/MS spectra (at dif-ferent collision energies), EI-MS spectra, 1H or 13C NMRspectra, collision cross section (CCS) data, retention indicesand retention times. The HMDB 5.0 has continued to ex-pand its collection of experimentally collected observables,including MS/MS, EI-MS and NMR spectra. However, it isclear that the number of new and metabolically relevant ex-perimental MS and NMR spectra being deposited in publicdatabases is rapidly diminishing. Likewise, the coverage of-fered by these experimentally measured observables is typ-ically <5% (often much less) of the HMDB. It is becauseof this limited coverage that the HMDB curation team hasplaced increasing emphasis on generating accurately pre-dicted observables. While experimentally collected observ-ables are always preferrable over predicted observables, pre-dictions have the advantage of offering complete or near-complete metabolome coverage.
For HMDB 5.0 significant resources were placed into de-veloping or implementing: (i) more accurate MS/MS spec-tral predictions; (ii) accurate 1D 1H and 13C NMR spectralpredictions; (iii) accurately predicted retention indices foranalyzing GC–MS data and (iv) accurately predicted col-
lision cross section (CCS) data for analyzing ion mobilityspectroscopy (IMS) data.
The MS/MS predictions for HMDB 5.0 were performedby the latest version of the competitive fragment mod-eling tool for QTOF MS/MS spectral prediction, calledCFM-ID version 4.0 (30). CFM-ID 4.0 was trained on amuch larger data set and included much more sophisticatedmachine learning approaches to improve its handling ofring cleavages and molecular topology. It also incorporateshand-made fragmentation rules to handle lipids, polyphe-nols, acylcarnitines and other ‘modular’ molecules. As mea-sured by a number of objective criteria, the performanceof CFM-ID 4.0 is approximately 30% better than previousversions of CFM-ID (30). As a result, CFM-ID 4.0 wasused to predict both the positive ion and negative ion modeQTOF MS/MS spectra of all 217 920 metabolites in theHMDB 5.0, at three different collision energies (10, 20 and40 eV). This led to the generation of 1 440 324 MS/MS spec-tra (six spectra for each metabolite entry in HMDB 5.0),with several million predicted fragment labels––all of whichhave been rendered for interactive display in each HMDBMetaboCard by JSV. These MS/MS data have also beenincorporated into HMDB’s new MS/MS search function.Note that Orbitrap MS spectra closely resemble QTOFMS/MS spectra (differing primarily in peak intensities butnot in their peak positions) and that spectral matching with
Dow
nloaded from https://academ
ic.oup.com/nar/article/50/D
1/D622/6431815 by guest on 11 July 2022

Nucleic Acids Research, 2022, Vol. 50, Database issue D627
Figure 2. An example of an HMDB pathway (generated via the online pathway drawing tool PathWhiz) describing the mode of action and mechanism offormation of the uremic toxin known as indoxyl sulfate. This illustrates the breadth of molecular, subcellular, cellular and organ/tissue renderings as wellas the breadth of physiological effect renderings that are now possible with PathWhiz and the PathBank pathways now linked to the HMDB. More than100 000 pathways are now linked to metabolites in HMDB 5.0.
CFM-ID predicted QTOF MS/MS spectra against Orbi-trap MS spectra often yields excellent results (30).
In addition to generating >1.4 million MS/MS spec-tral predictions to help improve MS-based compound iden-tification, the HMDB curation team also generated 312980 1H and 13C NMR spectral predictions to help withNMR-based compound identification. The number of ex-perimental NMR spectra available for metabolite identifica-tion in metabolomics has always been disappointingly low(<1000) and has increased only marginally in the past 10years. Given the very limited compound coverage of ref-erence metabolite NMR spectra, we decided to performchemical shift and NMR spectral predictions on all water-
soluble (predicted log P < 0 and –2 < log S < 0) metabo-lites in the HMDB. This threshold cutoff led to the selec-tion of 15 649 molecules from the HMDB. Recent advancesin NMR theory along with continuing innovations in com-puting techniques are allowing remarkably accurate NMRspectral simulations and NMR parameter predictions to bemade for many small molecules (31–33). In particular, itis now quite routine to predict not only 1H and 13C shiftsbut also 1H and 13C NMR spectra from chemical struc-tures with impressive accuracy (< 0.15 ppm RMSE for 1Hshifts and <1.5 ppm RMSE for 13C shifts). The chemicalshift predictors we employed use a combination of machinelearning techniques and HOSE-code methods that nearly
Dow
nloaded from https://academ
ic.oup.com/nar/article/50/D
1/D622/6431815 by guest on 11 July 2022

D628 Nucleic Acids Research, 2022, Vol. 50, Database issue
identical to the predictors available via NMRShiftDB (34).Empirically derived rules were used to predict first-order J-coupling constants and simple spin matrix calculations wereused to generate the predicted 1D 1H and 13C NMR spec-tra at 10 different spectrometer frequencies (100 MHz to1000 MHz for 1H and 25 MHz to 250 MHz for 13C). Thisled to the generation of 312 980 NMR spectra (20 spectrafor each water-soluble metabolite entry in HMDB 5.0)––allof which have been rendered for interactive display in eachHMDB MetaboCard by JSV. These NMR data have alsobeen incorporated into HMDB’s new ‘NMR Search’ func-tion, which is described later.
Retention indices (RI) are another useful set of observ-ables that can be used to identify molecules. RIs are es-sentially adjusted retention times used in gas chromatog-raphy that allow nearly universal comparisons of reten-tion times across GC platforms. RIs are closely related toa molecule’s boiling point and are much more reproduciblymeasured in GC than retention times in liquid chromatog-raphy. Tens of thousands of retention indices for thousandsof compounds (and their TMS or TBDMS derivatives) havebeen compiled in databases over the past 40 years. Exper-imentally measured retention indices can be used to helpgreatly narrow down possible candidates and are often usedto assist in the identification of compounds by GC–MS.Important developments have recently occurred in the ac-curate (<2% RMSE) prediction of GC-MS retention in-dices that make use of sophisticated deep learning meth-ods (35). The HMDB curation team adopted the same ma-chine learning methods described by Qu et al. (35) and ob-tained essentially the same RI performance that was re-ported. Using a cutoff mass of 900 daltons (the upper masslimit for most GC-MS instruments), a total of 57 648 com-pounds were selected from the HMDB as being ‘GC–MS’compatible. These compounds were then computationallyderivatized with TMS and TBDMS to generate 1 581 537derivatized structures. The RI predictor was then used topredict the retention indices for these 1.58 million deriva-tive structures across three standard types of GC columns(semi-standard non-polar, standard non-polar and stan-dard polar). This led to the generation of 4 744 611 pre-dicted column-specific retention indices––all of which havebeen entered in the ‘Predicted Spectral Properties’ subsec-tion (under the ‘Physical Properties’ field) of every eligibleHMDB MetaboCard. These retention indices, the corre-sponding metabolite derivative structures and the CFM-IDpredicted EI-MS spectra (36) for all 1 581 537 structureshave also been incorporated into HMDB’s new ‘GC–MSSearch’ function, which is described later.
The development of ion mobility spectroscopy (IMS) andthe appearance of tandem IMS-MS systems has led to agrowing interest in the metabolomics community in usingIMS as a constraint to help with metabolite identification.Like GC separations, IMS separations are highly repro-ducible and far more consistent or predictable than LC sep-arations. Furthermore, IMS retention values are related tothe average collision cross section (CCS) of the molecule,which can be accurately predicted based on a compound’s3D structure. For HMDB 5.0 we have used a number ofpublished CCS predictors, included MetCCS and Deep-CCS (37–39) to generate the CCS values for all HMDB
metabolites. Most of these CCS predictors report errorsof <3–4%. Using these predictors, a total of 871 680 pre-dicted CCS values have been added to the HMDB. All pre-dicted CCS values been entered in the ‘Predicted SpectralProperties’ subsection (under the ‘Physical Properties’ field)of every HMDB MetaboCard. These CCS values have alsobeen incorporated into HMDB’s new ‘LC–MS Search’ and‘LC–MS/MS Search’ functions, which are described later.
IMPROVED SEARCH FUNCTIONS
The addition of many new or newly predictable spectral ob-servables (CCS, RI, NMR chemical shifts, etc.) also neces-sitated a substantial upgrade to the spectral search func-tions for HMDB 5.0. Furthermore, improvements in ourspectral visualization program (JSV), also allowed us to un-dertake improvements in the graphical display of the spec-tral match output. Both the ‘LC–MS Search’ and ‘LC–MS/MS Search’ functions now support IMS data as an ad-ditional search constraint. Both have an option to input aCCS value with a default 5% tolerance. Users may chooseany one of three specific CCS predictors or an averagedvalue of all three CCS predictors. If no CCS input value isprovided, the search functions will still perform their regu-lar MS or MS/MS searches without the CCS constraint.Matched compounds for HMDB’s new ‘LC–MS Search’are ranked according to their m/z and CCS matches (usinga combined weight of 90% for delta m/z and 10% for deltaCCS). The output table from HMDB’s ‘LC–MS Search’provides a browsable list that contains information on thematching compound names, the HMDB links, their m/zvalues, the CCS matches (if a CCS value was provided) andthe overall score. In a similar manner, matched compoundsfor HMDB’s new ‘LC–MS/MS Search’ are ranked accord-ing to their spectral similarity and CCS matches. The out-put table from HMDB’s ‘LC–MS/MS Search’ provides abrowsable list that contains information on the matchingcompound names, the HMDB links, their m/z values, spec-tral similarity, CCS similarity (if a CCS value was provided)and the overall score. Clicking on the ‘Show Spectrum’ pro-duces a JSV mirror plot with the input spectrum shown atthe top (in red) and the matching MS/MS spectrum shownat the bottom (in blue). Both ‘LC–MS Search’ and ‘LC-MS/MS Search’ have a ‘Load Example’ button to illustratehow these new search functions work.
HMDB’s new ‘GC–MS Search’ has now been modified tosupport RI data as an additional search constraint. Usersmay input an RI value with a default 3% tolerance. If theRI option is chosen, users must also choose any one ofthree types of GC columns as the RI values are specific tothe column type (the default is the most popular column:semi-standard non-polar). Additionally, the type of chemi-cal derivatization(s) used must also be provided. Users havethe option to indicate no derivatization, TMS derivatiza-tion, TBDMS derivatization or combinations of the above.If no RI input value is provided, the GC-MS search func-tion will still perform its regular EI-MS-only search with-out the RI constraint. Matched compounds for HMDB’snew ‘GC–MS Search’ are ranked according to their spectralsimilarity and RI similarity. The output table from HMDB’s‘GC–MS Search’ provides a browsable list that contains in-
Dow
nloaded from https://academ
ic.oup.com/nar/article/50/D
1/D622/6431815 by guest on 11 July 2022
Nucleic Acids Research, 2022, Vol. 50, Database issue D629
formation on the matching compound names of the under-ivatized parent compound, the HMDB links, the names ofthe derivatized compounds, their m/z values, spectral sim-ilarity, the RI matches (if an RI value was provided) andthe overall score. Clicking on the ‘Show Spectrum’ buttonfor any given compound produces a JSV mirror plot withthe input spectrum shown at the top (in red) and the match-ing EI-MS spectrum shown at the bottom (in blue). As withother search functions, ‘GC–MS Search’ has a ‘Load Exam-ple’ button to illustrate how the new search function works.
HMDB’s new ‘NMR Search’ has been simplified and itnow allows users to enter lists of 1H or 13C chemical shiftsto search for spectral matches to experimental NMR spec-tra, predicted NMR spectra or both. Users must provide achemical shift list (relative intensities are optional), selectthe nucleus (1H or 13C) of interest and choose a chemicalshift tolerance (default of 0.2 ppm for 1H and 2.0 ppm for13C) before pressing the ‘Search’ button. A typical queryproduces a browsable table of hits showing eight columns:the compound name, the HMDB ID (with a hyperlink tab),the structure, the chemical formula, the molecular weight(average and monoisotopic), the chemical shift Dice score(a measure of chemical shift matching), the fraction of peakmatches and a colored ‘Show Spectrum’ button. Clickingon the ‘Show Spectrum’ produces a JSV mirror plot withthe input NMR spectrum shown at the top (in red) and thematching NMR spectrum shown at the bottom (in blue).As with other search functions, ‘NMR Search’ has a ‘LoadExample’ button to illustrate how the new search functionworks.
Overall, these improvements to HMDB’s search func-tions along with significant improvements to the quantityand quality of the underlying data should greatly enhancethe performance and reliability of the HMDB as a ‘go-to’resource for metabolite annotation. These improvementsshould also increase the likelihood and confidence in find-ing high quality metabolite matches.
THE HMDB IS FAIR-COMPLIANT
The HMDB is FAIR compliant (40) and details regardingits ‘FAIRness’ are provided under the ‘About HMDB’ menutab. To ensure findability, all entries in the HMDB have aunique and permanent 7-digit HMDB identifier. To ensureaccessibility, the HMDB website is open and free and itsdata download operation is compatible with all modern webbrowsers. The HMDB’s downloadable spectral data filesare available in the universally readable nmrML (41) andmzML (42) formats. Furthermore, all MS/MS and GC–MSspectra are assigned SPLASH keys (43) for rapid spectralquerying and matching. Likewise, all the HMDB’s chem-ical structures are accessible in canonical SMILES, SDF,MOL, PDB, InChI and InChIKey formats, while all se-quence (DNA and protein) data are stored in FASTA for-mat. To ensure interoperability, all textual data and meta-data in the HMDB are written in English, all spectral dataare in the mzML or nmrML exchange format, all chemicalsare in canonical SMILES, SDF, MOL, PDB, InChI andInChIKey formats, all sequence (DNA and protein) dataare stored in FASTA, all images are stored in PNG for-mat, and all nomenclature for compounds and spectral
data follows standard ontologies or vocabularies used todescribe these entities. An extensive and well-annotateddata download section is also provided with files availablein standard TXT, CSV, JSON and XML formats. To en-sure re-usability, all the data in the HMDB is extensivelysourced with clear information on provenance. The datain the HMDB are released under a Creative CommonsAttribution-NonCommercial 4.0 International License.
CONCLUSION AND FUTURE DIRECTIONS
The HMDB has grown considerably, both in size and scope,over the past 15 years. In 2007 it was a rather modestdatabase with just 2180 molecules and very limited content,searching or visualization capabilities. Today, the HMDB is∼100× larger (in terms of metabolite coverage) and morethan 1000X larger in terms of data size and content. TheHMDB now includes extensive spectral data, pathway data,physiological and disease data and it offers many differ-ent kinds of advanced visualization tools, search tools anddownload or data accessibility options. The enormous sizeand scope of the HMDB has also meant that it is be-coming increasingly more challenging to update. In par-ticular, the focus for this year’s update (namely expand-ing compound and spectral or ‘observable’ coverage) pre-cluded further expansion or updates with several other pop-ular HMDB data collections (such as metabolite-disease,metabolite-gene or metabolite-SNP associations). Likewise,with the explosion in published metabolomics articles (nowaveraging > 2000 papers/year), it has become increasinglydifficult to stay current with the literature on metabolite-biofluid associations and metabolite biomarker identifica-tions. To address these challenges, more and more of theHMDB database updating process will rely on computa-tionally based data harvesting and natural language pro-cessing techniques. These approaches are already being de-veloped and trialled by the HMDB curation team throughthe ChemFOnt project. With ongoing improvements indeep learning methods for text analysis and other tools fortext-to-data conversion, we are hopeful that these data har-vesting and data updating approaches will allow previouslyneglected aspects of the HMDB to grow robustly and re-main both current and relevant to the metabolomics com-munity for many years to come.
In terms of future directions for the HMDB, we areparticularly encouraged by ongoing developments in thearea of in silico metabolomics. Significant improvements inthe prediction accuracy (via quantum mechanics, machinelearning or hybrid approaches) of many chemical or spec-tral observables (MS spectra, NMR spectra, IR spectra,RIs, CCS, etc.) along with important enhancements to scor-ing protocols suggest that in silico metabolomics will be aworthwhile direction for the HMDB to continue to pursue.As a result, HMDB users should expect to see even more(and more accurately) predicted observables and more so-phisticated searches (such as neutral loss searching) beingadded. These should allow users to more accurately iden-tify or annotate metabolites.
Beginning in 2022, the HMDB will also branch out withthe introduction of a new sister database, called ‘HypoMet’,containing millions of hypothetical, biologically feasible
Dow
nloaded from https://academ
ic.oup.com/nar/article/50/D
1/D622/6431815 by guest on 11 July 2022
D630 Nucleic Acids Research, 2022, Vol. 50, Database issue
metabolites generated computationally via BioTransformer(44) and a deep generative model called DeepMet. Thedata in HypoMet will also be enriched with various pre-dicted spectral properties or predicted observables. Theintent of HypoMet is to allow metabolomics researchersthe opportunity to identify novel metabolites or generatetestable hypotheses regarding the identity of hitherto un-known metabolites.
Another major effort with the HMDB over the comingtwo to three years will be the updating or supplementationof every HMDB entry with at least one machine-readablepathway diagram. This process is ∼60% complete and is ex-pected to pick up speed in the coming year. The intent ofthis pathway updating process is to complement the workwith the ChemFOnt project, allowing much more sophis-ticated interpretation (at a system-wide level) and integra-tion of metabolomic, proteomic and/or genomic data. Thiswork will see a tighter coupling between the analytical andstatistical tools offered by MetaboAnalyst (45) and the vi-sualization and query functions offered by HMDB.
DATA AVAILABILITY
All data is freely available from the HMDB website or fromthe HMDB download page.
ACKNOWLEDGEMENTS
The authors would like to thank the many users of theHMDB for their valuable feedback and suggestions.
FUNDING
Genome Alberta (a division of Genome Canada); CanadaFoundation for Innovation (CFI); Natural Sciences and En-gineering Research Council of Canada (NSERC); Cana-dian Institutes of Health Research (CIHR); Alberta Ma-chine Intelligence Institute (AMII). Funding for open ac-cess charge: Genome Canada.Conflict of interest statement. None declared.
REFERENCES1. Kanehisa,M., Furumichi,M., Tanabe,M., Sato,Y. and Morishima,K.
(2017) KEGG: new perspectives on genomes, pathways, diseases anddrugs. Nucleic Acids Res., 45, D353–D361.
2. Jassal,B., Matthews,L., Viteri,G., Gong,C., Lorente,P., Fabregat,A.,Sidiropoulos,K., Cook,J., Gillespie,M., Haw,R. et al. (2020) Thereactome pathway knowledgebase. Nucleic Acids Res., 48,D498–D503.
3. Caspi,R., Billington,R., Keseler,I.M., Kothari,A.,Krummenacker,M., Midford,P.E., Ong,W.K., Paley,S., Subhraveti,P.and Karp,P.D. (2020) The MetaCyc database of metabolic pathwaysand enzymes - a 2019 update. Nucleic Acids Res., 48, D445–D453.
4. Ulrich,E.L., Akutsu,H., Doreleijers,J.F., Harano,Y., Ioannidis,Y.E.,Lin,J., Livny,M., Mading,S., Maziuk,D., Miller,Z. et al. (2008)BioMagResBank. Nucleic Acids Res., 36, D402–D408.
5. Montenegro-Burke,J.R., Guijas,C. and Siuzdak,G. (2020) METLIN:a tandem mass spectral library of standards. Methods Mol. Biol,2104, 149–163.
6. Wishart,D.S., Tzur,D., Knox,C., Eisner,R., Guo,A.C., Young,N.,Cheng,D., Jewell,K., Arndt,D., Sawhney,S. et al. (2007) HMDB: theHuman Metabolome Database. Nucleic Acids Res., 35, D521–D526.
7. Wishart,D.S., Knox,C., Guo,A.C., Eisner,R., Young,N., Gautam,B.,Hau,D.D., Psychogios,N., Dong,E., Bouatra,S. et al. (2009) HMDB:
a knowledgebase for the human metabolome. Nucleic Acids Res., 37,D603–D610.
8. Wishart,D.S., Jewison,T., Guo,A.C., Wilson,M., Knox,C., Liu,Y.,Djoumbou,Y., Mandal,R., Aziat,F., Dong,E. et al. (2013) HMDB3.0–The Human Metabolome Database in 2013. Nucleic Acids Res.,41, D801–D807.
9. Wishart,D.S., Feunang,Y.D., Marcu,A., Guo,A.C., Liang,K.,Vazquez-Fresno,R., Sajed,T., Johnson,D., Li,C., Karu,N. et al. (2018)HMDB 4.0: the human metabolome database for 2018. Nucleic AcidsRes., 46, D608–D617.
10. Djoumbou Feunang,Y., Eisner,R., Knox,C., Chepelev,L.,Hastings,J., Owen,G., Fahy,E., Steinbeck,C., Subramanian,S.,Bolton,E. et al. (2016) ClassyFire: automated chemical classificationwith a comprehensive, computable taxonomy. J. Cheminform, 8, 61.
11. da Silva,R.R., Dorrestein,P.C. and Quinn,R.A. (2015) Illuminatingthe dark matter in metabolomics. Proc. Natl. Acad. Sci. U.S.A., 112,12549–12550.
12. Gonsalves,W.I., Broniowska,K., Jessen,E., Petterson,X.M.,Bush,A.G., Gransee,J., Lacy,M.Q., Hitosugi,T. and Kumar,S.K.(2020) Metabolomic and lipidomic profiling of bone marrow plasmadifferentiates patients with monoclonal gammopathy ofundetermined significance from multiple myeloma. Sci. Rep, 10,10250.
13. Gil-de-la-Fuente,A., Godzien,J., Saugar,S., Garcia-Carmona,R.,Badran,H., Wishart,D.S., Barbas,C. and Otero,A. (2019) CEU massmediator 3.0: a metabolite annotation tool. J. Proteome Res, 18,797–802.
14. Barupal,D.K. and Fiehn,O. (2019) Generating the blood exposomedatabase using a comprehensive text mining and database fusionapproach. Environ. Health Perspect, 127, 97008.
15. Dambrova,M., Makrecka-Kuka,M., Kuka,J., Nordberg,D.,Smesny,S., Duygu Sen,A., Vilskersts,R., Guo,A.C., Oler,E., Tian,S.et al. (2021) Acylcarnitines: Nomenclature, biomarkers, therapeuticpotential, drug targets and clinical trials. Pharmacol. Rev. in press.
16. Tan,B., O’Dell,D.K., Yu,Y.W., Monn,M.F., Hughes,H.V., Burstein,S.and Walker,J.M. (2010) Identification of endogenous acyl amino acidsbased on a targeted lipidomics approach. J. Lipid. Res., 51, 112–119.
17. Quinn,R.A., Melnik,A.V., Vrbanac,A., Fu,T., Patras,K.A.,Christy,M.P., Bodai,Z., Belda-Ferre,P., Tripathi,A., Chung,L.K. et al.(2020) Global chemical effects of the microbiome include newbile-acid conjugations. Nature, 579, 123–129.
18. Correia,M.S.P., Jain,A., Alotaibi,W., Young Tie Yang,P.,Rodriguez-Mateos,A. and Globisch,D. (2020) Comparative dietarysulfated metabolome analysis reveals unknown metabolic interactionsof the gut microbiome and the human host. Free Radic. Biol. Med.,160, 745–754.
19. Wishart,D.S., Feunang,Y.D., Guo,A.C., Lo,E.J., Marcu,A.,Grant,J.R., Sajed,T., Johnson,D., Li,C., Sayeeda,Z., Assempour,N.et al. (2018) DrugBank 5.0: a major update to the DrugBankdatabase for 2018. Nucleic Acids Res., 46, D1074–D1082.
20. Wishart,D.S., Bartok,B., Oler,E., Liang,K.Y.H., Budinski,Z.,Berjanskii,M., Guo,A., Cao,X. and Wilson,M. (2021) MarkerDB: anonline database of molecular biomarkers. Nucleic Acids Res., 49,D1259–D1267.
21. The Gene Ontology Consortium (2019) The Gene OntologyResource: 20 years and still GOing strong. Nucleic Acids Res., 47,D330–D338.
22. Karu,N., Deng,L., Slae,M., Guo,A.C., Sajed,T., Huynh,H., Wine,E.and Wishart,D.S. (2018) A review on human fecal metabolomics:methods, applications and the human fecal metabolome database.Anal. Chim. Acta, 1030, 1–24.
23. Lopez-Hernandez,Y., Oropeza-Valdez,J.J., Blanco-Sandate,J.O.,Herrera-Van Oostdam,A.S., Zheng,J., Guo,A.C., Lima-Rogel,V.,Rajabzadeh,R., Salgado-Bustamante,M., Adrian-Lopez,J. et al.(2020) The urinary metabolome of healthy newborns. Metabolites,10, 165.
24. Lange,M. and Fedorova,M. (2020) Evaluation of lipid quantificationaccuracy using HILIC and RPLC MS on the example of NIST SRM1950 metabolites in human plasma. Anal. Bioanal. Chem, 412,3573–3584.
25. Hanson,R.M., Prilusky,J., Renjian,A., Nakane,T. and Sussman,J.L.(2013) JSmol and the next-generation web-based representation of3D molecular structure as applied to Proteopedia. Israel J. Chem., 53,207–216.
Dow
nloaded from https://academ
ic.oup.com/nar/article/50/D
1/D622/6431815 by guest on 11 July 2022

Nucleic Acids Research, 2022, Vol. 50, Database issue D631
26. Schober,D., Jacob,D., Wilson,M., Cruz,J.A., Marcu,A., Grant,J.R.,Moing,A., Deborde,C., de Figueiredo,L.F., Haug,K. et al. (2018)nmrML: a community supported open data standard for thedescription, storage, and exchange of NMR data. Anal. Chem, 90,649–656.
27. Davies,A.N. and Lampen,P. (1993) JCAMP-DX for NMR. Appl.Spectrosc, 47, 1093–1099.
28. Ramirez-Gaona,M., Marcu,A., Pon,A., Grant,J., Wu,A. andWishart,D.S. (2017) A web tool for generating high qualitymachine-readable biological pathways. J. Vis. Exp, 8, 54869.
29. Wishart,D.S., Li,C., Marcu,A., Badran,H., Pon,A., Budinski,Z.,Patron,J., Lipton,D., Cao,X., Oler,E. et al. (2020) PathBank: acomprehensive pathway database for model organisms. Nucleic AcidsRes., 48, D470–D478.
30. Wang,F., Liigand,J., Tian,S., Arndt,D., Greiner,R. and Wishart,D.S.(2021) CFM-ID 4.0: more accurate ESI-MS/MS spectral predictionand compound identification. Anal. Chem., 93, 11692–11700.
31. Hogben,H.J., Krzystyniak,M., Charnock,G.T., Hore,P.J. andKuprov,I. (2011) Spinach–a software library for simulation of spindynamics in large spin systems. J. Magn. Reson., 208, 179–194.
32. Aires-de-Sousa,J., Hemmer,M.C. and Gasteiger,J. (2002) Predictionof 1H NMR chemical shifts using neural networks. Anal. Chem., 74,80–90.
33. Unzueta,P.A., Greenwell,C.S. and Beran,G.J.O. (2021) Predictingdensity functional theory-quality nuclear magnetic resonancechemical shifts via delta-machine learning. J. Chem. Theory Comput,17, 826–840.
34. Steinbeck,C. and Kuhn,S. (2004) NMRShiftDB – compoundidentification and structure elucidation support through a freecommunity-built web database. Phytochemistry, 65, 2711–2717.
35. Qu,C., Schneider,B.I., Kearsley,A.J., Keyrouz,W. and Allison,T.C.(2021) Predicting kovats retention indices using graph neuralnetworks. J. Chromatogr. A., 1646, 462100.
36. Allen,F., Pon,A., Greiner,R. and Wishart,D.S. (2016) Computationalprediction of electron ionization mass spectra to assist in GC/MScompound identification. Anal. Chem, 88, 7689–7697.
37. Plante,P.L., Francovic-Fontaine,E., May,J.C., McLean,J.A.,Baker,E.S., Laviolette,F., Marchand,M. and Corbeil,J. (2019)Predicting ion mobility collision cross-sections using a deep neuralnetwork: DeepCCS. Anal. Chem, 91, 5191–5199.
38. Colby,S.M., Nunez,J.R., Hodas,N.O., Corley,C.D. and Renslow,R.R.(2020) Deep learning to generate in silico chemical property librariesand candidate molecules for small molecule identification in complexsamples. Anal. Chem, 92, 1720–1729.
39. Zhou,Z., Luo,M., Chen,X., Yin,Y., Xiong,X., Wang,R. and Zhu,Z.J.(2020) Ion mobility collision cross-section atlas for known andunknown metabolite annotation in untargeted metabolomics. Nat.Commun, 11, 4334.
40. Wilkinson,M. D., Dumontier,M., Aalbersberg,I.J.J., Appleton,G.,Axton,M., Baak,A., Blomberg,N., Boiten,J-W., da Silva Santos,L.B.,Bourne,P.E. et al. (2016). The FAIR guiding principles for scientificdata management and stewardship. Scientific Data, 3, 160018.
41. Schober,D., Jacob,D., Wilson,M., Cruz,J.A., Marcu,A., Grant,J.R.,Moing,A., Deborde,C., de Figueiredo,L.F., Haug,K. et al. (2018)nmrML: a community supported open data standard for thedescription, storage, and exchange of NMR data. Anal. Chem, 90,649–656.
42. Deutsch,E. (2008) mzML: a single, unifying data format for massspectrometer output. Proteomics, 8, 2776–2777.
43. Wohlgemuth,G., Mehta,S.S., Mejia,R.F., Neumann,S., Pedrosa,D.,Pluskal,T., Schymanski,E.L., Willighagen,E.L., Wilson,M.,Wishart,D.S. et al. (2016) SPLASH, a hashed identifier for massspectra. Nat. Biotechnol., 34, 1099–1101.
44. Djoumbou-Feunang,Y., Fiamoncini,J., Gil-de-la-Fuente,A.,Greiner,R., Manach,C. and Wishart,D.S. (2019) BioTransformer: acomprehensive computational tool for small molecule metabolismprediction and metabolite identification. J. Cheminform, 11, 2.
45. Chong,J., Wishart,D.S. and Xia,J. (2019) Using MetaboAnalyst 4.0for comprehensive and integrative metabolomics data analysis. Curr.Protoc. Bioinformatics, 68, e86.
Dow
nloaded from https://academ
ic.oup.com/nar/article/50/D
1/D622/6431815 by guest on 11 July 2022
Related Documents