Narrative Review The food metabolome: a window over dietary exposure 1–3 Augustin Scalbert, Lorraine Brennan, Claudine Manach, Cristina Andres-Lacueva, Lars O Dragsted, John Draper, Stephen M Rappaport, Justin JJ van der Hooft, and David S Wishart ABSTRACT The food metabolome is defined as the part of the human metabo- lome directly derived from the digestion and biotransformation of foods and their constituents. With .25,000 compounds known in various foods, the food metabolome is extremely complex, with a composition varying widely according to the diet. By its very nature it represents a considerable and still largely unexploited source of novel dietary biomarkers that could be used to measure dietary ex- posures with a high level of detail and precision. Most dietary bio- markers currently have been identified on the basis of our knowledge of food compositions by using hypothesis-driven approaches. However, the rapid development of metabolomics resulting from the develop- ment of highly sensitive modern analytic instruments, the availabil- ity of metabolite databases, and progress in (bio)informatics has made agnostic approaches more attractive as shown by the recent identification of novel biomarkers of intakes for fruit, vegetables, beverages, meats, or complex diets. Moreover, examples also show how the scrutiny of the food metabolome can lead to the discovery of bioactive molecules and dietary factors associated with diseases. However, researchers still face hurdles, which slow progress and need to be resolved to bring this emerging field of research to maturity. These limits were discussed during the First International Workshop on the Food Metabolome held in Glasgow. Key recommendations made during the workshop included more coordination of efforts; development of new databases, software tools, and chemical libraries for the food metabolome; and shared repositories of metabolomic data. Once achieved, major progress can be expected toward a better un- derstanding of the complex interactions between diet and human health. Am J Clin Nutr 2014;99:1286–308. INTRODUCTION The 2 major achievements of nutrition research in the 20th century were the discovery of essential nutrients and the eluci- dation of their role in key physiologic functions. Recommen- dations were defined to provide adequate intakes of these nutrients that led to reduction in risks of deficiency diseases, at least in high-income Western societies. The past 2 decades have seen a shift in nutrition research away from the prevention of deficiency diseases toward the prevention of chronic diseases and the elucidation of the role of nonessential food constituents on such diseases (1). This constitutes a considerable challenge for nutrition research in the 21st century, in particular because of the extreme variety of these bioactive constituents and the large diversity of biochemical targets and signaling and metabolic pathways they may interact with. Although classical hypothesis-driven approaches have been very successful in discovering essential nutrients, they are ill adapted to aid our understanding of the role of highly diverse nonessential compounds in foods. Data-driven approaches and “omics” technologies offer opportunities to explore the complex interactions between diet and the human organism. In particular, the measurement of hundreds or thousands of metabolites in metabolomic experiments now allows the characterization of in- dividual phenotypes with a level of precision never before achieved (2). Individuals or populations exposed to different environments, lifestyles, or diets can be distinguished and characteristic metabolic differences identified (3). A growing number of metabolomic studies have been pub- lished over the past 5 y in the field of nutrition (3–6). Metab- olomics was used to show the alteration of metabolic profiles on the consumption of specific nutrients, foods, or diets in small- scale intervention studies. Two different fractions of the human metabolome are influenced by the diet: the endogenous metab- olome and the food metabolome (Figure 1). The endogenous metabolome includes all metabolites from the host. Its variations show novel metabolic effects of the diet that may affect human health. The “food metabolome” has been defined as the sum of 1 Fromthe International Agency for Research on Cancer, Lyon, France (AS); University College Dublin, Dublin, Ireland (LB); the Institut National de la Recherche Agronomique, Clermont-Ferrand, France (CM); Clermont University, Clermont-Ferrand, France (CM); the University of Barcelona, Barcelona, Spain (CA-L); the University of Copenhagen, Frederiksberg, Denmark (LOD); Aberystwyth University, Aberystwyth, United Kingdom (JD); the University of California, Berkeley, CA (SMR); the University of Glasgow, Glasgow, United Kingdom (JJJvdH); and the University of Alberta, Edmonton, Canada (DSW). 2 Supported by the European Union (NutriTech FP7-KBBE-2011-5 grant 289511, EUROCAN FP7-KBBE-2010.2.4.1-2 grant 260791); the Danish Ministry of Science, Technology, and Innovation (for the UNIK Food, Fit- ness and Pharma Project); the French National Agency for Research (Phe- noMeNEp ANR-10-ALIA-007); the Medical Research Council (MR/ J010308/1); and the Spanish Ministerio de Economia y Competitividad (MINECO; project AGL2009-13906-C02-01) and by a Senior Visiting Sci- entist Award (to SMR) granted by the International Agency for Research on Cancer. 3 Address correspondence to A Scalbert, International Agency for Re- search on Cancer (IARC), Nutrition and Metabolism Section, Biomarkers Group, 150 Cours Albert Thomas, F-69372 Lyon Cedex 08, France. E-mail: [email protected]. Received September 19, 2013. Accepted for publication March 24, 2014. First published online April 23, 2014; doi: 10.3945/ajcn.113.076133. 1286 Am J Clin Nutr 2014;99:1286–308. Printed in USA. Ó 2014 American Society for Nutrition by guest on June 14, 2016 ajcn.nutrition.org Downloaded from 76133.DCSupplemental.html http://ajcn.nutrition.org/content/suppl/2014/05/13/ajcn.113.0 Supplemental Material can be found at:

Welcome message from author
This document is posted to help you gain knowledge. Please leave a comment to let me know what you think about it! Share it to your friends and learn new things together.
Transcript
Narrative Review
The food metabolome: a window over dietary exposure1–3
Augustin Scalbert, Lorraine Brennan, Claudine Manach, Cristina Andres-Lacueva, Lars O Dragsted, John Draper,Stephen M Rappaport, Justin JJ van der Hooft, and David S Wishart
ABSTRACTThe food metabolome is defined as the part of the human metabo-lome directly derived from the digestion and biotransformation offoods and their constituents. With .25,000 compounds known invarious foods, the food metabolome is extremely complex, with acomposition varying widely according to the diet. By its very natureit represents a considerable and still largely unexploited source ofnovel dietary biomarkers that could be used to measure dietary ex-posures with a high level of detail and precision. Most dietary bio-markers currently have been identified on the basis of our knowledgeof food compositions by using hypothesis-driven approaches. However,the rapid development of metabolomics resulting from the develop-ment of highly sensitive modern analytic instruments, the availabil-ity of metabolite databases, and progress in (bio)informatics hasmade agnostic approaches more attractive as shown by the recentidentification of novel biomarkers of intakes for fruit, vegetables,beverages, meats, or complex diets. Moreover, examples also showhow the scrutiny of the food metabolome can lead to the discoveryof bioactive molecules and dietary factors associated with diseases.However, researchers still face hurdles, which slow progress and needto be resolved to bring this emerging field of research to maturity.These limits were discussed during the First International Workshopon the Food Metabolome held in Glasgow. Key recommendationsmade during the workshop included more coordination of efforts;development of new databases, software tools, and chemical librariesfor the food metabolome; and shared repositories of metabolomic data.Once achieved, major progress can be expected toward a better un-derstanding of the complex interactions between diet and humanhealth. Am J Clin Nutr 2014;99:1286–308.
INTRODUCTION
The 2 major achievements of nutrition research in the 20thcentury were the discovery of essential nutrients and the eluci-dation of their role in key physiologic functions. Recommen-dations were defined to provide adequate intakes of thesenutrients that led to reduction in risks of deficiency diseases, atleast in high-income Western societies. The past 2 decades haveseen a shift in nutrition research away from the prevention ofdeficiency diseases toward the prevention of chronic diseases andthe elucidation of the role of nonessential food constituents onsuch diseases (1). This constitutes a considerable challenge fornutrition research in the 21st century, in particular because of theextreme variety of these bioactive constituents and the largediversity of biochemical targets and signaling and metabolicpathways they may interact with.
Although classical hypothesis-driven approaches have beenvery successful in discovering essential nutrients, they are illadapted to aid our understanding of the role of highly diversenonessential compounds in foods. Data-driven approaches and“omics” technologies offer opportunities to explore the complexinteractions between diet and the human organism. In particular,the measurement of hundreds or thousands of metabolites inmetabolomic experiments now allows the characterization of in-dividual phenotypes with a level of precision never before achieved(2). Individuals or populations exposed to different environments,lifestyles, or diets can be distinguished and characteristic metabolicdifferences identified (3).
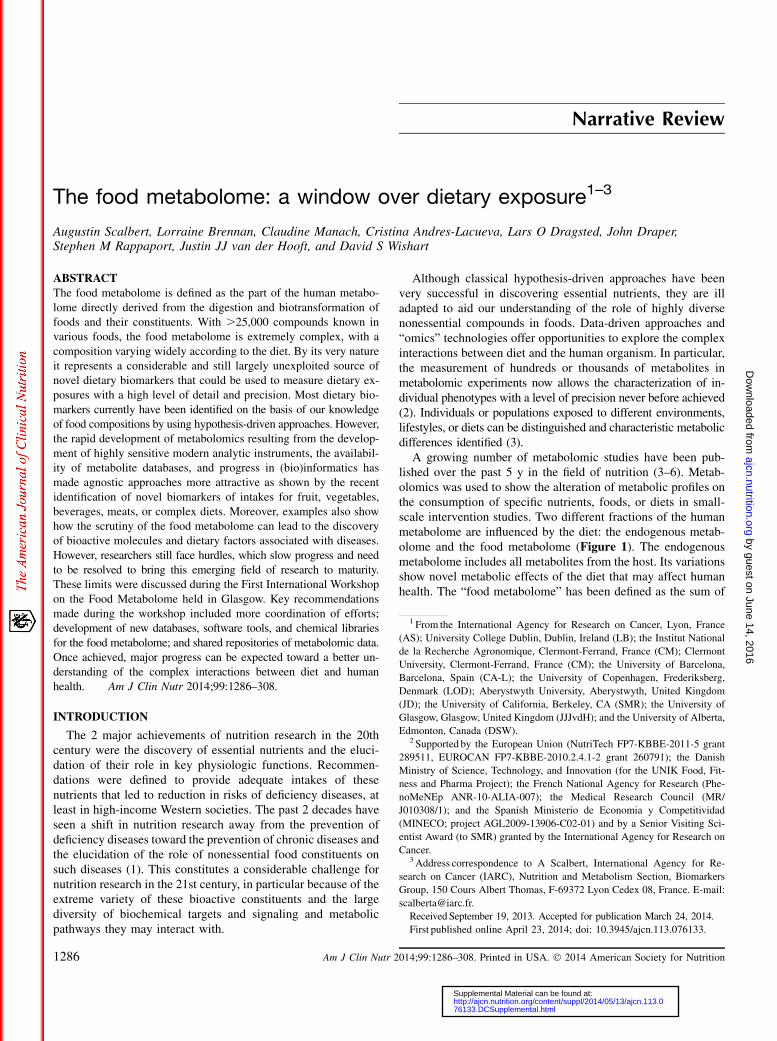
A growing number of metabolomic studies have been pub-lished over the past 5 y in the field of nutrition (3–6). Metab-olomics was used to show the alteration of metabolic profiles onthe consumption of specific nutrients, foods, or diets in small-scale intervention studies. Two different fractions of the humanmetabolome are influenced by the diet: the endogenous metab-olome and the food metabolome (Figure 1). The endogenousmetabolome includes all metabolites from the host. Its variationsshow novel metabolic effects of the diet that may affect humanhealth. The “food metabolome” has been defined as the sum of
1 From the International Agency for Research on Cancer, Lyon, France
(AS); University College Dublin, Dublin, Ireland (LB); the Institut National
de la Recherche Agronomique, Clermont-Ferrand, France (CM); Clermont
University, Clermont-Ferrand, France (CM); the University of Barcelona,
Barcelona, Spain (CA-L); the University of Copenhagen, Frederiksberg,
Denmark (LOD); Aberystwyth University, Aberystwyth, United Kingdom
(JD); the University of California, Berkeley, CA (SMR); the University of
Glasgow, Glasgow, United Kingdom (JJJvdH); and the University of Alberta,
Edmonton, Canada (DSW).2 Supported by the European Union (NutriTech FP7-KBBE-2011-5 grant
289511, EUROCAN FP7-KBBE-2010.2.4.1-2 grant 260791); the Danish
Ministry of Science, Technology, and Innovation (for the UNIK Food, Fit-
ness and Pharma Project); the French National Agency for Research (Phe-
noMeNEp ANR-10-ALIA-007); the Medical Research Council (MR/
J010308/1); and the Spanish Ministerio de Economia y Competitividad
(MINECO; project AGL2009-13906-C02-01) and by a Senior Visiting Sci-
entist Award (to SMR) granted by the International Agency for Research on
Cancer.3 Address correspondence to A Scalbert, International Agency for Re-
search on Cancer (IARC), Nutrition and Metabolism Section, Biomarkers
Group, 150 Cours Albert Thomas, F-69372 Lyon Cedex 08, France. E-mail:
ReceivedSeptember 19, 2013. Accepted for publication March 24, 2014.
First published online April 23, 2014; doi: 10.3945/ajcn.113.076133.
1286 Am J Clin Nutr 2014;99:1286–308. Printed in USA. � 2014 American Society for Nutrition
by guest on June 14, 2016ajcn.nutrition.org
Dow
nloaded from
76133.DCSupplemental.html http://ajcn.nutrition.org/content/suppl/2014/05/13/ajcn.113.0Supplemental Material can be found at:
all metabolites directly derived from the digestion of foods, theirabsorption in the gut, and biotransformation by the host tissuesand the microbiota as first proposed by one of the authors of thisreview in 2008 (7). Other authors have also proposed to definethe “food metabolome” as the whole set of food constituents inany foods (5, 8). A definition of the metabolome centered onbiological species is preferred here. Humans consume as manymetabolomes as there are biological species making up ourfoods—for example, the tomato or beef metabolomes. There-fore, the human metabolome contains fractions of these me-tabolomes, partly transformed after ingestion, which constitutethe human food metabolome.
The various foods consumed by humans contain .25,000compounds, most of them being further metabolized in the humanbody (9). The food metabolome is therefore highly complex andalso highly variable. This variability constitutes a unique andextremely rich source of information on the human diet that hasbarely been exploited. Detailed characterization of the foodmetabolome should permit accurate monitoring of dietary ex-posure and identification of foods that influence disease risks inclinical and epidemiologic studies. This review describes the cur-rent knowledge on the food metabolome and discusses oppor-tunities for nutrition research. It also makes recommendations tomove the field forward as discussed by the participants in theFirst International Workshop on the Food Metabolome (4–5June 2013, Glasgow, United Kingdom), which convened with 50experts from Europe and North America (Supplemental Table 1under “Supplemental data” in the online issue).
DIETARY BIOMARKERS IN THE PRE-OMICS ERA
Studies of connections between the diet or specific dietaryfactors and health status require accurate measurements of di-etary exposures. Such measurements can be used to evaluatecompliance in dietary intervention studies, to find associations
with disease outcomes, or to monitor dietary changes in pop-ulations. Dietary exposure has traditionally been measured withself-reported methods, namely dietary recalls or food-frequencyquestionnaires (10). However, a number of random and sys-tematic errors are inherent in such methods, including recallbias and difficulty in assessing portion sizes (11). The resultingmisclassification of subjects, especially when sorting themaccording to dietary intake, can influence observed associationsbetween dietary exposures and disease outcomes and underliesinconsistencies in published findings in the field of nutritionalepidemiology (12).
To address these shortcomings, intense efforts have been di-rected toward statistical techniques to correct measurement errorsas well as toward developing new dietary assessment instruments.The application of dietary biomarkers as more objective mea-sures of dietary exposure in nutritional epidemiology has beenparticularly significant (13). These biomarkers have been used asmeasures of nutritional status and of exposure to bioactivemolecules in foods, as surrogate indicators of food intake, and tovalidate measures of dietary intake (14). Biomarkers are alsouseful when little or no data exist on food composition, as is oftenthe case for bioactive molecules such as glucosinolates or foodcontaminants such as aflatoxins (15, 16).
Dietary biomarkers measured in population studies
Avariety of dietary biomarkers identified through the analysisof correlations with dietary intake have been measured in epi-demiologic studies. Information on these biomarkers has beensystematically collected in the novel Exposome-Explorer data-base (V Neveu, DS Wishart, and A Scalbert, unpublished data,2014); w100 biomarkers could be identified (SupplementalTable 2 under “Supplemental data” in the online issue). Thesebiomarkers have been measured in plasma or serum (caroten-oids, fatty acids, vitamins, polyphenols, food contaminants, and
FIGURE 1. The human metabolomes. sp., species.
THE FOOD METABOLOME: A WINDOW OVER DIETARY EXPOSURE 1287
by guest on June 14, 2016ajcn.nutrition.org
Dow
nloaded from
enzymes), red blood cells (fatty acids, carotenoids, and hemo-globin adducts), and to a lesser extent in urine (polyphenols,vitamins, inorganic compounds, and amino acids). Some ofthese biomarkers correspond to nutrients and bioactive compoundsand have been used to compare status or exposure. Some have beenused as surrogate biomarkers of food intake, as follows: poly-phenols, carotenoids, and vitamin C for fruit and vegetables (17,18); alkylresorcinols for whole-grain cereals (19, 20); isoflavonesfor soy (21); amino acids and fatty acids for meat (22, 23); fattyacids for dairy products and fish (22, 24); and polyphenols for teaand wine (18, 25) (Table 1). Dietary biomarkers not only includenatural food constituents but also certain food additives such asiodine in milk (26) or food contaminants such as polychlorinatedbiphenyls in fatty fish (27). These latter biomarkers are oftenspecific to certain populations who consume these additives orwhere consistent levels of contamination are observed.
Other biomarkers are directly derived from the digestion and gutabsorption of food constituents or are endogenous metabolites thathave been altered by exposure to specific nutrients. For instance,serotonin metabolism is altered by acute alcohol intake (28), theactivity of selenium-containing enzymes such as erythrocyteglutathione peroxidase depends on selenium intake, and ceramidesynthase is inhibited by exposure to themycotoxin fumonisins (29).
Pharmacokinetics and reliability of dietary biomarkers
Dietary biomarkers are not without their limitations. Theymaybe altered because of possible interactions with genetic factors,physiologic or health status (ie, age or obesity) (30), dietaryfactors such as fats for lipophilic biomarkers (31), and lifestylefactors such as alcohol intake or smoking (32). Their concen-trations also vary over time according to their pharmacokineticproperties. A higher intraindividual variability is expected forbiomarkers with a short half-life (20, 33). Intraindividual vari-ability leads to exposure measurement errors when the objectiveis to characterize habitual exposure in epidemiologic studies andsmall numbers of measurements are available across subjects.
Some of the biomarkers listed in Table 1 have half-lives that donot exceed 24 h [polyphenols, alkylresorcinols, and amino acids(34, 35)]. These biomarkers may thus be useful only in pop-ulations who regularly and frequently consume these dietarysources. Lipophilic markers (carotenoids, lipids) (36) or bio-markers associated with erythrocytes (folate, fatty acids) (29)have longer half-lives (week to month) because of the equilibriumof biomarkers between blood and fatty tissues, or because of theirintegration into erythrocytes. Some dietary compounds such asisothiocyanates and acrylamide also form adducts with bloodalbumin and hemoglobin (37, 38), with half-lives varying be-tween 3 and 8 wk, and may be used as longer-term biomarkers.Protein adducts with dietary compounds have received limitedattention thus far. Adductomics appears to be particularlypromising for the discovery of these adduct biomarkers (39, 40).
Biomarker sensitivity and specificity
Dietary biomarkers should have sufficient sensitivity to measureexposures within ranges commonly found in the populations ofinterest. Intervention studies are essential to address this questionand to evaluate the relation between exposure and biomarkerconcentrations (17, 41). Biomarkers such as vitamin C or selenium
in erythrocyte glutathione peroxidase show saturable effects andmay not be suitable for use at high levels of exposure (29, 42).Conversely, some biomarkers are present at concentrations too lowto be reliably detected at low levels of exposure. For example,some biomarkers of alcohol abuse were not appropriate to evaluatelow to moderate levels of alcohol consumption (43).
Specificity is another essential characteristic of biomarkers.Some biomarkers can be highly specific for a particular food (Table1). Proline betaine and lycopene are well-established biomarkersfor citrus fruit and tomato products, respectively (44, 45). Otherbiomarkersmay be common to several foods or characteristic of anentire food group. Vitamin C and a number of carotenoids andflavonoids are common to many fruit and vegetables. Vitamin C orthe sum of carotenoids or flavonoids have been used as genericbiomarkers for fruit and vegetable intake (18, 45).
Single biomarker or combinations of biomarkers
Traditionally, single biomarkers have been used to characterizecomplex dietary exposures such as consumption of a whole foodgroup or intake of a group of compounds with related biologicalactivities. Two examples show the limits of such global assays.Vitamin C used as a biomarker for fruit and vegetable intake ispresent in a large number of fruit and vegetables, but its contentvaries widely according to species, varieties, and food-processingmethods. It is also widely used as an additive and dietary sup-plement. The Folin assay, commonly used to estimate totalpolyphenols in foods (46), has also been applied to urine samplesto compare polyphenol intake (47), but such use may be in-appropriate because of the presence of interfering reducingmetabolites in such complex biological matrices (46).
In contrast to these global assays, analytic approaches based onthe estimation of combinations of dietary constituents may pro-vide more accurate measurements of dietary exposure. The ratiosof 2 alkylresorcinols characteristic of whole-grain wheat or ryewere found to be good indicators of the relative consumption ofthese cereals (20, 48). However, there are very few such examplesin which combinations of biomarkers were used to improve thespecificity of dietary exposure measurements. Metabolomicsconstitutes a comprehensive approach to identify new panels ofbiomarkers that are specific or common to particular foods or foodgroups, as shown recently for citrus fruit (49). This should greatlyimprove the assessment of exposure to classes of food bioactivecompounds, food groups, or dietary patterns.
THE FOOD METABOLOME IN THE OMICS ERA
Metabolomics can be described as the application of high-throughput analytic chemistry technologies [liquid chromatography–mass spectrometry (LC-MS)4, nuclear magnetic resonance
4Abbreviations used: dbNP, Nutritional Phenotype Database; ECMDB,
E. coli Metabolome Database; FDR, false discovery rate; FooDB, Food Com-
ponent Database; GC-MS, gas chromatography–mass spectrometry; HMDB,
Human Metabolome Database; LC-MS, liquid chromatography–mass spec-
trometry; MS, mass spectrometry; MSI, Metabolomics Standards Initiative;
MWAS, metabolome-wide association study; NMR, nuclear magnetic reso-
nance spectroscopy; PCA, principal components analysis; PLS-DA, partial
least-squares discriminant analysis; TMAO, trimethylamine oxide-N-oxide;
YMDB, Yeast Metabolome Database.
1288 SCALBERT ET AL
by guest on June 14, 2016ajcn.nutrition.org
Dow
nloaded from
spectroscopy (NMR), gas chromatography–mass spectrometry(GC-MS)] directed at characterizing the metabolome (ie, thesmall molecules associated with metabolism). Its developmentfollows that of genomics, transcriptomics, and proteomics. Al-though not as rapid in development or as high-throughput as itsomics cousins, metabolomics led a sea change in how smallmolecules could and should be analyzed. Rather than beinglimited to measuring only one or a few compounds at a time,new metabolomic technologies allowed researchers to measurehundreds or even thousands of metabolites at a time. This newlyfound capacity to measure so many chemicals at once led toa number of metabolomic projects, all launched in the mid-2000s, aimed at identifying the metabolomes of microbes (50),plants (51), and humans (52–54). These projects typically usedLC-MS, GC-MS, NMR, or a combination of all 3 techniquesto identify and/or quantify as many metabolites as possible incells, tissues, and biofluids of the organisms of interest. Thesecomprehensive metabolomic studies were also complementedby a number of much more specific metabolomic studies aimed
at characterizing the metabolic responses of humans to the in-take of various foods or food constituents such as soy (55), citrusfruit (44), nuts (56), meats (57), and tea (58).
The food metabolome as part of the human metabolome
It was through these early metabolome studies that scientistsrealized that the humanmetabolomewas not as small or as simpleas first imagined. In particular, noticeable differences in humanmetabolomes could be detected that appeared to depend stronglyon diet, sex, health status, genetics, kinetics, physiology, andage—with diet being most important (59–62). This dietary de-pendence was not unexpected, but it was not anticipated to be socomplicated. Unlike laboratory animals, humans are free-livingomnivores who, in fact, eat other metabolomes. Furthermore,humans are exposed to a huge variety of “chemical environ-ments” associated with the various foods we consume. Thus, thehuman metabolome is not just a single entity but consists ofseveral components (Figure 1), including the following: 1) the
TABLE 1
Biomarkers used as surrogate indicators of consumption of foods and food groups for which significant (r . 0.3) correlations have been reported1
Food category and food Biomarkers
Fruit
Apple Kaempferol, isorhamnetin, m-coumaric acid, phloretin
Orange Caffeic acid, hesperetin, proline betaine
Grapefruit Naringenin
Citrus fruit Ascorbic acid, b-cryptoxanthin, hesperetin, naringenin, proline betaine, vitamin A, zeaxanthin
Fruit (total) 4-O-Methylgallic acid, b-cryptoxanthin, carotenoids (mix), flavonoids (mix), gallic acid, hesperetin, isorhamnetin,
kaempferol, lutein, lycopene, naringenin, phloretin, vitamin A, vitamin C, zeaxanthin
Vegetables
Carrot a-Carotene
Tomato Carotenoids (mix), lycopene, lutein
Vegetables, leafy Ascorbic acid, b-carotene, carotenoids (mix)
Vegetables, root Ascorbic acid, a-carotene, b-carotene
Vegetables (total) Ascorbic acid, a-carotene, b-carotene, b-cryptoxanthin, carotenoids (mix), enterolactone, lutein, lycopene
Fruit and vegetables (total) a-Carotene, apigenin, ascorbic acid, b-carotene, b-cryptoxanthin, carotenoids (mix), eriodictyol, flavonoids (mix),
hesperetin, hippuric acid, lutein, lycopene, naringenin, phloretin, phytoene, zeaxanthin
Cereal products
Whole-grain rye 5-Heptadecylresorcinol, 5-pentacosylresorcinol, 5-tricosylresorcinol
Whole-grain wheat 5-Heneicosylresorcinol, 5-tricosylresorcinol, alkylresorcinols (mix)
Whole-grain cereals (total) 5-Heneicosylresorcinol, 3,5-dihydroxybenzoic acid, 3-(3,5-dihydroxyphenyl)-1-propanoic acid, 5-pentacosylresorcinol,
5-tricosylresorcinol, alkylresorcinols (mix)
Seeds
Soy products Daidzein, genistein, isoflavones (mix), O-desmethylangolensin
Meats
Meat 1-Hydroxypyrene glucuronide, 1-methylhistidine
Meat, beef Pentadecylic acid
Animal products (total) 1-Methylhistidine, 3-methylhistidine, margaric acid, pentadecylic acid, phytanic acid
Dairy products
Milk, dairy products Iodine, margaric acid, pentadecylic acid, phytanic acid
Fish
Fatty DHA, EPA, long-chain v-3 PUFAs, polychlorinated biphenyl toxic equivalents, pentachlorodibenzofuran,
polychlorinated biphenyl 126, polychlorinated biphenyl 153, v-3 PUFAs
Lean Long-chain v-3 PUFAs
Beverages (nonalcoholic)
Tea 4-O-Methylgallic acid, gallic acid, kaempferol
Coffee Chlorogenic acid
Beverages (alcoholic)
Wine 4-O-Methylgallic acid, caffeic acid, gallic acid, resveratrol metabolites
Beverages (alcoholic) (total) 5-Hydroxytryptophol/5-hydroxyindole-3-acetic acid, carbohydrate-deficient transferrin, ethyl glucuronide,
g-glutamyltransferase, aspartate aminotransferase, alanine aminotransferase
1Data were extracted from the Exposome-Explorer database (V Neveu, DS Wishart, and A Scalbert, unpublished data, 2014).
THE FOOD METABOLOME: A WINDOW OVER DIETARY EXPOSURE 1289
by guest on June 14, 2016ajcn.nutrition.org
Dow
nloaded from
endogenous metabolome (consisting of chemicals needed for, orexcreted from, cellular metabolism), 2) the food metabolome(consisting of essential and nonessential chemicals derived fromfoods after digestion and subsequent metabolism by the tissuesand the microbiota), 3) other xenobiotics derived from drugs,and 4) xenobiotics derived from environmental or workplacechemicals.
The exact size and composition of these different humanmetabolomes are difficult to ascertain. Minimally, the humanmetabolome contains 50,000 different detectable compounds (9,63), but as instrument sensitivity and separation technologiesimprove, this number is expected to increase. Up to 200,000different metabolites are estimated to occur in the plant kingdom,and combinations of several hundreds of secondary metabolitesgenerally characterize each edible plant (6, 64, 65). Furthermore,the composition often depends on the body compartment, tissue,or biofluid to which one refers. For instance, many food or drugconstituents that might be found in the mouth or stomach arechemically identical to the compounds isolated from the intactfood or drug. On the other hand, food constituents found in blood,urine, or other excreta are often metabolically transformed in theliver, kidney, or intestine to metabolites that are very differentfrom the parent compound. This adds greatly to the diversity ofthe food metabolome. However, in some cases, the parentcompounds are broken down to such an extent that their endproducts are actually identical to chemicals that the body pro-duces naturally. The importance of the gut microbiota in con-tributing metabolites to the human metabolome has also recentlyemerged (50, 66). Some microbial metabolites, typically vitamins,certain essential amino acids, and a few fatty acids, are specificmicrobial metabolites (w100 compounds in total are known atthis time). However, a large majority of the metabolites producedby the gut microbiota are derived from the biotransformation ofboth the endogenous metabolome and the food metabolome andare therefore an integral part of these 2 metabolomes. Thesemicrobial metabolites include short-chain fatty acids, secondarybile acids, protein and amino acid metabolites, as well as plantpolyphenol metabolites (67).
Metabolism of food constituents
Knowledge of the metabolism of food constituents is critical tounderstanding the origin of the biotransformed fraction of thefood metabolome. It is also essential if we wish to use foodmetabolites as nutritional biomarkers or as a means to monitorfood consumption. In this regard, it is useful to review how foodchemicals can be metabolized. Food constituents can be me-tabolized in 3 different ways: 1) they can be digested in themouth, stomach, and small intestine into simple nutrients thatcan be absorbed through the gut barrier; 2) they can be furthertransformed by host tissues, especially the liver and kidney;or 3) they can be processed by the gut microbiota in the largeintestine.
The first category of food constituents are intermediary me-tabolites formed by digestion of lipids, polysaccharides, andproteins. Most of these compounds are common to all livingorganisms and identical to human endogenous metabolites. Theycannot generally be used as dietary biomarkers because of theircommon identity and the impossibility to trace their dietaryorigin. The possible exceptions are the essential amino acids,
essential fatty acids along with most vitamins, and minerals,which cannot be produced by humans and must originate fromexternal dietary sources.
The second way that food constituents can be metabolized isthrough transformation by host tissues. Food compounds that arenot useful for basic metabolism or that do not correspond to fa-miliar endogenous metabolites are treated as “foreign” or asxenobiotics. Examples of exogenous food constituents includepolyphenols, alkaloids, carotenoids, chlorophylls, artificial colors,artificial flavors, natural volatiles for flavoring/aroma, and Mail-lard reaction products formed during cooking. The human bodymaintains a complex defense system consisting of dozens of en-zymes and membrane transporters to recognize these foreign andpotentially toxic chemicals and to neutralize them by rapid bio-transformation and/or elimination. Classically, the biotrans-formation process consists of 2 types of chemical reactions,phase I and phase II transformations, both of which occurprimarily in the liver, kidney, and intestine. Phase I trans-formations typically involve oxidation of compounds viacytochrome P450 enzymes as well as hydrolysis by variousdehydrogenases, esterases, and amidases. On the other hand,phase II transformations consist of chemical modificationssuch as methylation (by methyltransferases), sulfation (bysulfotransferases), acetylation (by N-acetyltransferases), glu-curonidation (by UDP-glucuronyltransferases), and amino acidconjugation (by glutathione or glycyl transferases). A recentmeta-analysis (68) of the metabolic fate of .1000 xenobioticsshowed that cytochrome P450 catalyzed oxidations (40%) andUDP-glucuronosyltransferase glucuronidations (14%) were themost common followed by reactions involving dehydrogenases(8%), hydrolases (7%), glutathione-S-transferases (6%), and sul-fatases (5%). In fact, there are .300 different empirical rules thatallow one to predict the fate of metabolites on the basis of theirchemical structure (69). Many of the metabolites derived from thebiotransformation of food components have not been well char-acterized. For polyphenols, .230 phase I/II metabolites havebeen identified and associated with the consumption of specificpolyphenol-containing foods (70). The yield of phase I/II reactionsare often very high (68, 71), and host-transformed metabolites re-tain many of the features of their parent compounds. Consequently,these exogenously derived metabolites can be quite useful as specificfood biomarkers.
The third way that food metabolites may be transformed isthrough microbial metabolism. Microbes have a very different setof enzymes from mammals, and given that there are .1000different species of microbes in the human gut (72) there is anenormous diversity of enzymatic processes that act on food-derived compounds. The gut microbiota is particularly adept atprocessing polyphenols to phenolic breakdown products. Forinstance, depending on the predominant microbiota, polyphe-nols can be transformed by ring cleavage to a variety of aromaticcompounds such as benzoate and various derivatives of hy-droxyphenylacetic and hydroxypropionic acids. These phenolicacids can be further conjugated to glycine as in hippurate. Thegut microbiota also processes indigestible carbohydratesthrough a variety of fermentative pathways yielding short-chainfatty acids such as butyric acid and propionic acid. Certainmicrobial metabolites can be useful as food biomarkers, al-though there is a complex relation between the food source, thepredominant gut microbial species, and the resulting food
1290 SCALBERT ET AL
by guest on June 14, 2016ajcn.nutrition.org
Dow
nloaded from
metabolites (73). Consequently, weaker correlations with in-takes of foods or of their constituents were observed for mi-crobial metabolites when compared with untransformed foodcompounds and host-transformed metabolites (41). This is mostprobably a result of the large variability of the microbiota acrosssubjects (74). As a result, microbial metabolites should betreated with some caution when used as food biomarkers.
Food metabolome and metabolite databases
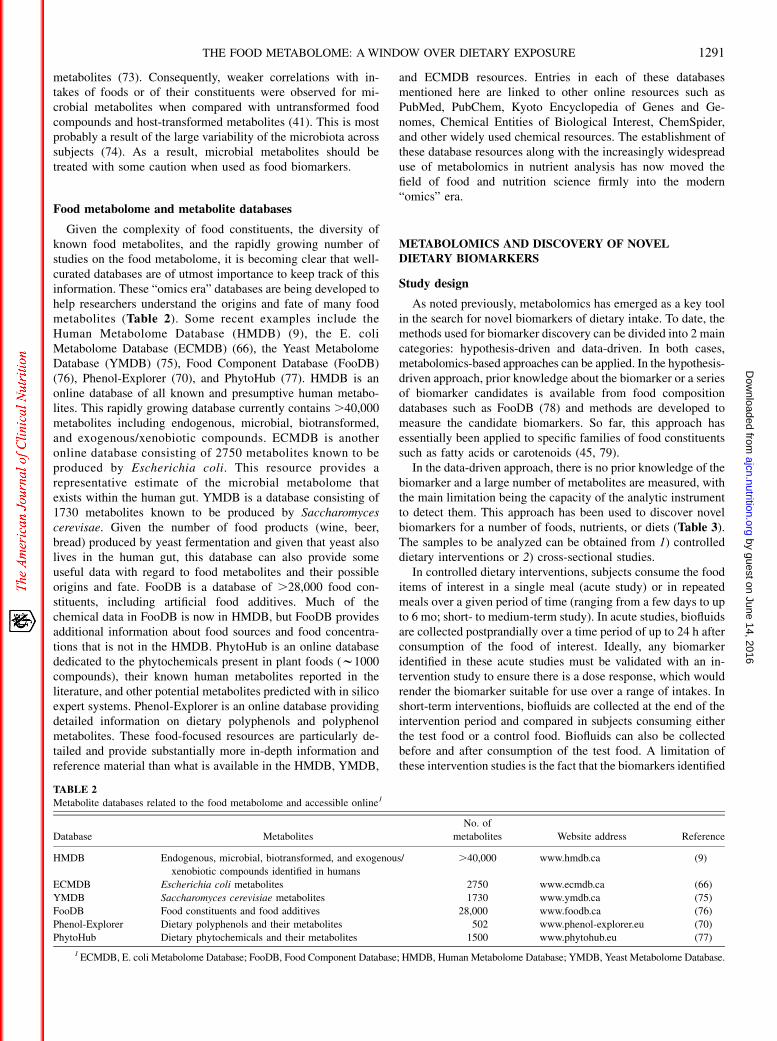
Given the complexity of food constituents, the diversity ofknown food metabolites, and the rapidly growing number ofstudies on the food metabolome, it is becoming clear that well-curated databases are of utmost importance to keep track of thisinformation. These “omics era” databases are being developed tohelp researchers understand the origins and fate of many foodmetabolites (Table 2). Some recent examples include theHuman Metabolome Database (HMDB) (9), the E. coliMetabolome Database (ECMDB) (66), the Yeast MetabolomeDatabase (YMDB) (75), Food Component Database (FooDB)(76), Phenol-Explorer (70), and PhytoHub (77). HMDB is anonline database of all known and presumptive human metabo-lites. This rapidly growing database currently contains .40,000metabolites including endogenous, microbial, biotransformed,and exogenous/xenobiotic compounds. ECMDB is anotheronline database consisting of 2750 metabolites known to beproduced by Escherichia coli. This resource provides arepresentative estimate of the microbial metabolome thatexists within the human gut. YMDB is a database consisting of1730 metabolites known to be produced by Saccharomycescerevisae. Given the number of food products (wine, beer,bread) produced by yeast fermentation and given that yeast alsolives in the human gut, this database can also provide someuseful data with regard to food metabolites and their possibleorigins and fate. FooDB is a database of .28,000 food con-stituents, including artificial food additives. Much of thechemical data in FooDB is now in HMDB, but FooDB providesadditional information about food sources and food concentra-tions that is not in the HMDB. PhytoHub is an online databasededicated to the phytochemicals present in plant foods (w1000compounds), their known human metabolites reported in theliterature, and other potential metabolites predicted with in silicoexpert systems. Phenol-Explorer is an online database providingdetailed information on dietary polyphenols and polyphenolmetabolites. These food-focused resources are particularly de-tailed and provide substantially more in-depth information andreference material than what is available in the HMDB, YMDB,
and ECMDB resources. Entries in each of these databasesmentioned here are linked to other online resources such asPubMed, PubChem, Kyoto Encyclopedia of Genes and Ge-nomes, Chemical Entities of Biological Interest, ChemSpider,and other widely used chemical resources. The establishment ofthese database resources along with the increasingly widespreaduse of metabolomics in nutrient analysis has now moved thefield of food and nutrition science firmly into the modern“omics” era.
METABOLOMICS AND DISCOVERY OF NOVELDIETARY BIOMARKERS
Study design
As noted previously, metabolomics has emerged as a key toolin the search for novel biomarkers of dietary intake. To date, themethods used for biomarker discovery can be divided into 2 maincategories: hypothesis-driven and data-driven. In both cases,metabolomics-based approaches can be applied. In the hypothesis-driven approach, prior knowledge about the biomarker or a seriesof biomarker candidates is available from food compositiondatabases such as FooDB (78) and methods are developed tomeasure the candidate biomarkers. So far, this approach hasessentially been applied to specific families of food constituentssuch as fatty acids or carotenoids (45, 79).
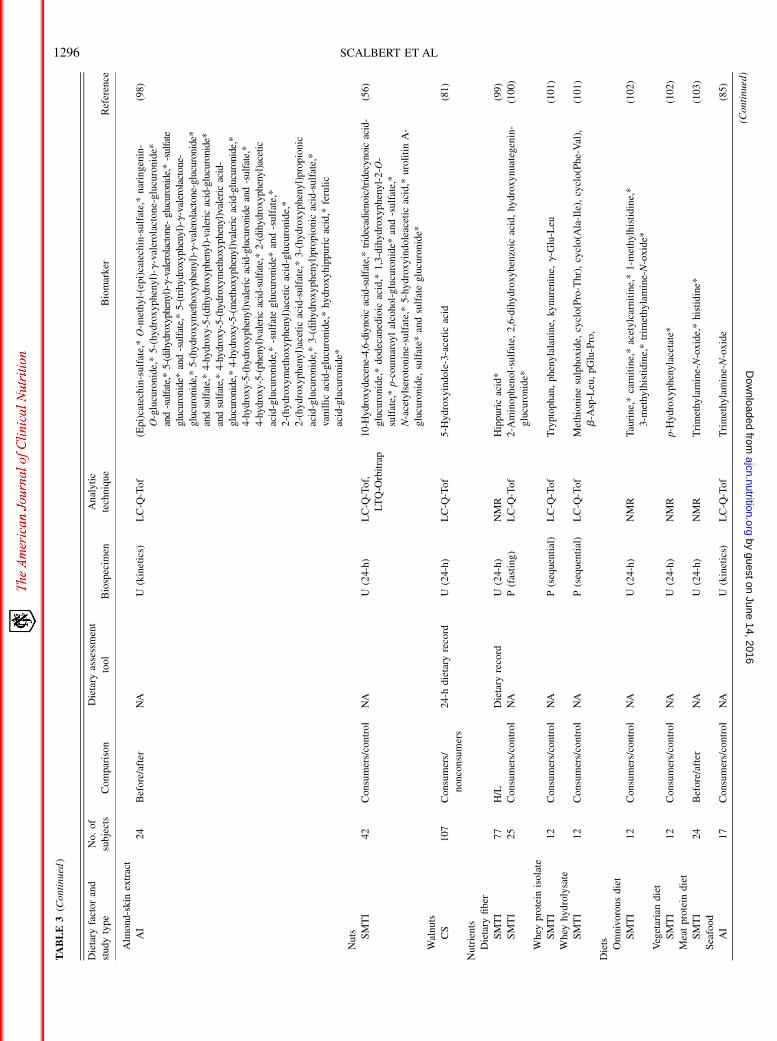
In the data-driven approach, there is no prior knowledge of thebiomarker and a large number of metabolites are measured, withthe main limitation being the capacity of the analytic instrumentto detect them. This approach has been used to discover novelbiomarkers for a number of foods, nutrients, or diets (Table 3).The samples to be analyzed can be obtained from 1) controlleddietary interventions or 2) cross-sectional studies.
In controlled dietary interventions, subjects consume the fooditems of interest in a single meal (acute study) or in repeatedmeals over a given period of time (ranging from a few days to upto 6 mo; short- to medium-term study). In acute studies, biofluidsare collected postprandially over a time period of up to 24 h afterconsumption of the food of interest. Ideally, any biomarkeridentified in these acute studies must be validated with an in-tervention study to ensure there is a dose response, which wouldrender the biomarker suitable for use over a range of intakes. Inshort-term interventions, biofluids are collected at the end of theintervention period and compared in subjects consuming eitherthe test food or a control food. Biofluids can also be collectedbefore and after consumption of the test food. A limitation ofthese intervention studies is the fact that the biomarkers identified
TABLE 2
Metabolite databases related to the food metabolome and accessible online1
Database Metabolites
No. of
metabolites Website address Reference
HMDB Endogenous, microbial, biotransformed, and exogenous/
xenobiotic compounds identified in humans
.40,000 www.hmdb.ca (9)
ECMDB Escherichia coli metabolites 2750 www.ecmdb.ca (66)
YMDB Saccharomyces cerevisiae metabolites 1730 www.ymdb.ca (75)
FooDB Food constituents and food additives 28,000 www.foodb.ca (76)
Phenol-Explorer Dietary polyphenols and their metabolites 502 www.phenol-explorer.eu (70)
PhytoHub Dietary phytochemicals and their metabolites 1500 www.phytohub.eu (77)
1ECMDB, E. coli Metabolome Database; FooDB, Food Component Database; HMDB, Human Metabolome Database; YMDB, Yeast Metabolome Database.
THE FOOD METABOLOME: A WINDOW OVER DIETARY EXPOSURE 1291
by guest on June 14, 2016ajcn.nutrition.org
Dow
nloaded from
may not be sufficiently specific for the test food in populationstudies, because regular diets may include other foods containingprecursors of the same biomarkers. For instance, in a cross-sectional analysis of a whole-diet intervention study it was onlypossible to verify 23% of potential biomarkers observed inprevious-meal studies (81).
Cross-sectional studies can therefore play an important role inbiomarker discovery. Low and high consumers are selected fromfood intake data collected by using food-frequency questionnaires,food diaries, or other dietary assessment tools. Comparison ofthese groups can lead to the identification of biomarkers that arereflective of habitual intake, provided that these biomarkers havea sufficient half-life in the organism or that the foods are regularlyconsumed. Although these and other studies have shown thepotential of cross-sectional studies, care needs to be taken becausemany of the foods consumed are highly correlated and there isa risk of identifying biomarkers that are not specific to the par-ticular food of interest unless their identity and specific occurrencein the considered foods are established. Notwithstanding, cross-sectional studies are excellent resources that are currently un-derused for dietary biomarker discovery.
Novel dietary biomarkers identified througha metabolomic approach
An extensive list of potential dietary biomarkers discovered bymetabolomics is presented in Table 3. Markers associated withthe consumption of foods, nutrients, or diets have been identified.Successful studies include the identification of proline betaine asa marker of citrus intake (49, 80). This marker was first identifiedin small-scale acute feeding studies and validated in free-livingsubjects in 2 independent studies (44, 80). It was confirmed ina cross-sectional study that used untargeted metabolomics (49)and played an important role in discriminating noncompliantindividuals in a dietary pattern study of Nordic compared withhabitual diets (106). In these same studies, screening of urinaryprofiles for predicted metabolites of citrus fruit also led to theidentification of some terpenoids and flavonoids as biomarkers ofcitrus food intake as well as of intake of citrus-flavored sweets.This shows well the importance of previous knowledge on foodcomposition and on metabolism of food constituents for anno-tating unknown discriminating ions in untargeted metabolomicstudies.
Trimethylamine oxide-N-oxide (TMAO) was found to bea putative biomarker for meat intake or for meat-containing dietsin several studies (102–104), but it has also been reported asa biomarker of fish intake by other authors (82, 107) and shownto be more responsive to intake of fish than meat (85). Severaldietary precursors of TMAO such as choline or carnitine havebeen described (108) and care should be paid when interpretingvariations in TMAO concentrations in populations.
The state of validation of biomarkers listed in Table 3 varieswidely. Proline betaine is a good example of a well-validatedcitrus fruit biomarker. Other biomarkers, particularly thoseidentified in controlled intervention studies, may prove to be lessrobust in populations because of the possible existence of a va-riety of precursors as seen for TMAO, or the occurrence of thesame precursor in various foods. Food-derived biomarkers suchas caffeic acid sulfate or methylepicatechin sulfate, which werefound to discriminate consumers of raspberries (82), may not be
that useful in epidemiologic studies because both their parentmetabolites (caffeic acid and epicatechin) have been described ina variety of foods of plant origin (70).
For this reason, it may be particularly advisable to look forcharacteristic dietary biomarkers directly in cross-sectionalstudies. However, the chances to identify robust biomarkers willrely both on the sensitivity of the analytic equipment used and onthe quality of the dietary data against whichmetabolic profiles arecorrelated. Both 24-h dietary recalls and food-frequency ques-tionnaires have been used, and new biomarkers for citrus fruitintake or coffee were successfully identified (49, 88) (Table 3).The use of food-frequency questionnaires may directly lead to theidentification of biomarkers of habitual dietary exposure, but thelower accuracy and lower number of foods documented may limittheir value for such discovery studies (105).
With the exception of 2 studies on dietary fiber andmilk proteindiet, all discovery studies were conducted on urine samples asopposed to blood samples (Table 3). The reason for this is partlytechnical because of the higher concentrations of food-derivedmetabolites in urine as compared with blood and because of thelack of interfering proteins. This contrasts with the preferred useof blood biospecimens to measure biomarkers of nutritional statusin epidemiologic studies. More metabolomic studies using bloodsamples should be carried out because of the more commonavailability of plasma or serum samples in biobanks. Also, li-pophilic biomarkers, which may be more stable over time (seePharmacokinetics and reliability of dietary biomarkers section),are more likely to be found in blood. Regression analyses of theconcentrations of 363 metabolites in plasma with a number ofdietary variables measured with a food-frequency questionnaireshowed the highest correlations with phospholipid concentra-tions (109). Furthermore, chain length and degree of saturationof fatty acids in glycerophosphatidylcholines were associatedwith intake of specific foods or nutrients such as fish and dietaryfiber.
It is important to point out that the identities of many of theproposed biomarkers in Table 3 (marked with an asterisk) havenot been fully validated with proper chemical standards becausethese standards are often not commercially available. In addition,no standard yet exists to report chemical identification of bio-markers in metabolomic studies (110). For this reason, it isoften difficult to evaluate the degree of confidence in biomarkeridentification.
Analysis of the food metabolome
Analyzing the food metabolome is a particularly challengingtask for 3 reasons. First, it comprises a much greater chemicaldiversity than any other part of the metabolome (see Food me-tabolome and metabolite databases section). A second feature ofthe food metabolome is the huge range of concentrations, frompicomolar or nanomolar concentrations for some contaminantsor phytochemical metabolites to millimolar concentrations fornutrients such as sugars. Third, many components of the foodmetabolome are unknown. Indeed, the metabolism for a largeproportion of nonnutrients in humans has never been studied andthe chemical structures of their circulating metabolites have notbeen identified. Until recently, the food metabolome was typi-cally analyzed through targeted methods optimized for specificcompounds or families of nutrients or nonnutrients, such as
1292 SCALBERT ET AL
by guest on June 14, 2016ajcn.nutrition.org
Dow
nloaded from
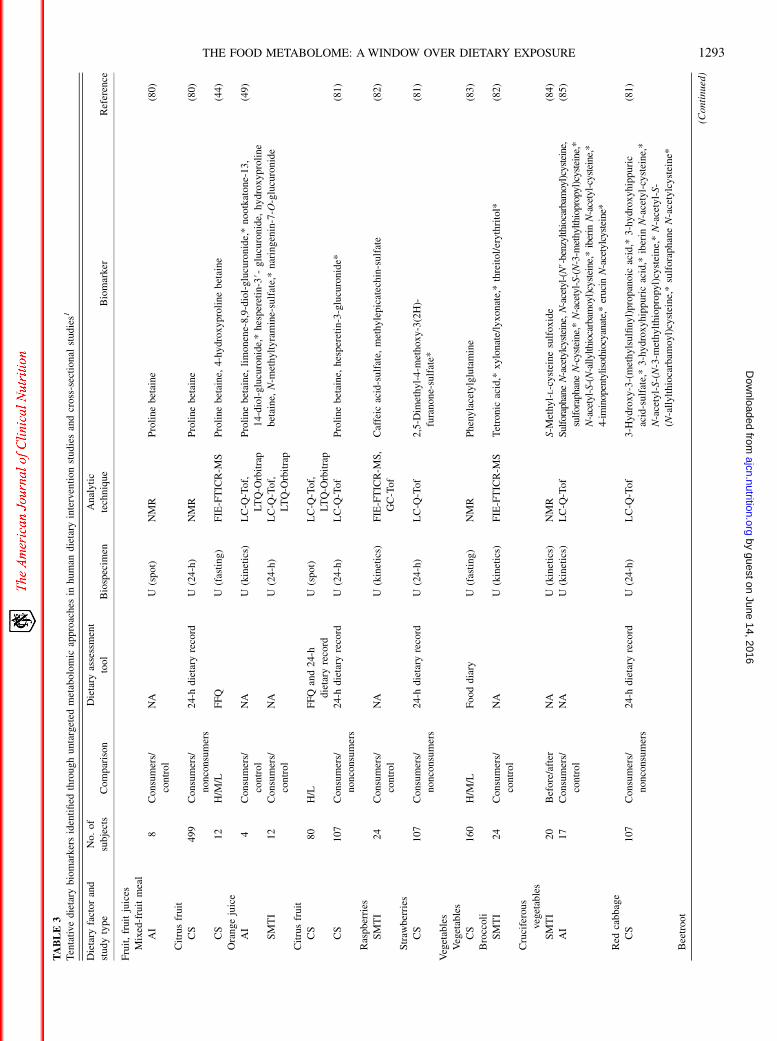
TABLE3
Tentative
dietary
biomarkers
identified
throughuntargeted
metabolomic
approaches
inhuman
dietary
interventionstudiesandcross-sectional
studies1
Dietary
factorand
studytype
No.of
subjects
Comparison
Dietary
assessment
tool
Biospecim
en
Analytic
technique
Biomarker
Reference
Fruit,fruitjuices
Mixed-fruitmeal
AI
8Consumers/
control
NA
U(spot)
NMR
Proline
betaine
(80)
Citrusfruit
CS
499
Consumers/
nonconsumers
24-h
dietary
record
U(24-h)
NMR
Proline
betaine
(80)
CS
12
H/M
/LFFQ
U(fasting)
FIE-FTICR-M
SProline
betaine,
4-hydroxyprolinebetaine
(44)
Orangejuice
AI
4Consumers/
control
NA
U(kinetics)
LC-Q
-Tof,
LTQ-O
rbitrap
Proline
betaine,
limonene-8,9-diol-glucuronide,*nootkatone-13,
14-diol-glucuronide,*hesperetin-3#-
glucuronide,
hydroxyproline
betaine,
N-m
ethyltyram
ine-sulfate,*naringenin-7-O
-glucuronide
(49)
SMTI
12
Consumers/
control
NA
U(24-h)
LC-Q
-Tof,
LTQ-O
rbitrap
Citrusfruit
CS
80
H/L
FFQ
and24-h
dietary
record
U(spot)
LC-Q
-Tof,
LTQ-O
rbitrap
CS
107
Consumers/
nonconsumers
24-h
dietary
record
U(24-h)
LC-Q
-Tof
Proline
betaine,
hesperetin-3-glucuronide*
(81)
Raspberries
SMTI
24
Consumers/
control
NA
U(kinetics)
FIE-FTICR-M
S,
GC-Tof
Caffeic
acid-sulfate,
methylepicatechin-sulfate
(82)
Straw
berries
CS
107
Consumers/
nonconsumers
24-h
dietary
record
U(24-h)
LC-Q
-Tof
2,5-D
imethyl-4-m
ethoxy-3(2H)-
furanone-sulfate*
(81)
Vegetables
Vegetables
CS
160
H/M
/LFooddiary
U(fasting)
NMR
Phenylacetylglutamine
(83)
Broccoli
SMTI
24
Consumers/
control
NA
U(kinetics)
FIE-FTICR-M
STetronic
acid,*
xylonate/lyxonate,*threitol/erythritol*
(82)
Cruciferous
vegetables
SMTI
20
Before/after
NA
U(kinetics)
NMR
S-M
ethyl-L-cysteinesulfoxide
(84)
AI
17
Consumers/
control
NA
U(kinetics)
LC-Q
-Tof
SulforaphaneN-acetylcysteine,N-acetyl-(N#-benzylthiocarbam
oyl)cysteine,
sulforaphane
N-cysteine,*N-acetyl-S-(N-3-m
ethylthiopropyl)cysteine,*
N-acetyl-S-(N-allylthiocarbam
oyl)cysteine,*
iberin
N-acetyl-cysteine,*
4-im
inopentylisothiocyanate,*erucin
N-acetylcysteine*
(85)
Red
cabbage
CS
107
Consumers/
nonconsumers
24-h
dietary
record
U(24-h)
LC-Q
-Tof
3-H
ydroxy-3-(methylsulfinyl)propanoic
acid,*
3-hydroxyhippuric
acid-sulfate,*3-hydroxyhippuricacid,*
iberin
N-acetyl-cysteine,*
N-acetyl-S-(N-3-m
ethylthiopropyl)cysteine,*N-acetyl-S-
(N-allylthiocarbam
oyl)cysteine,*sulforaphaneN-acetylcysteine*
(81)
Beetroot
(Continued)
THE FOOD METABOLOME: A WINDOW OVER DIETARY EXPOSURE 1293
by guest on June 14, 2016ajcn.nutrition.org
Dow
nloaded from
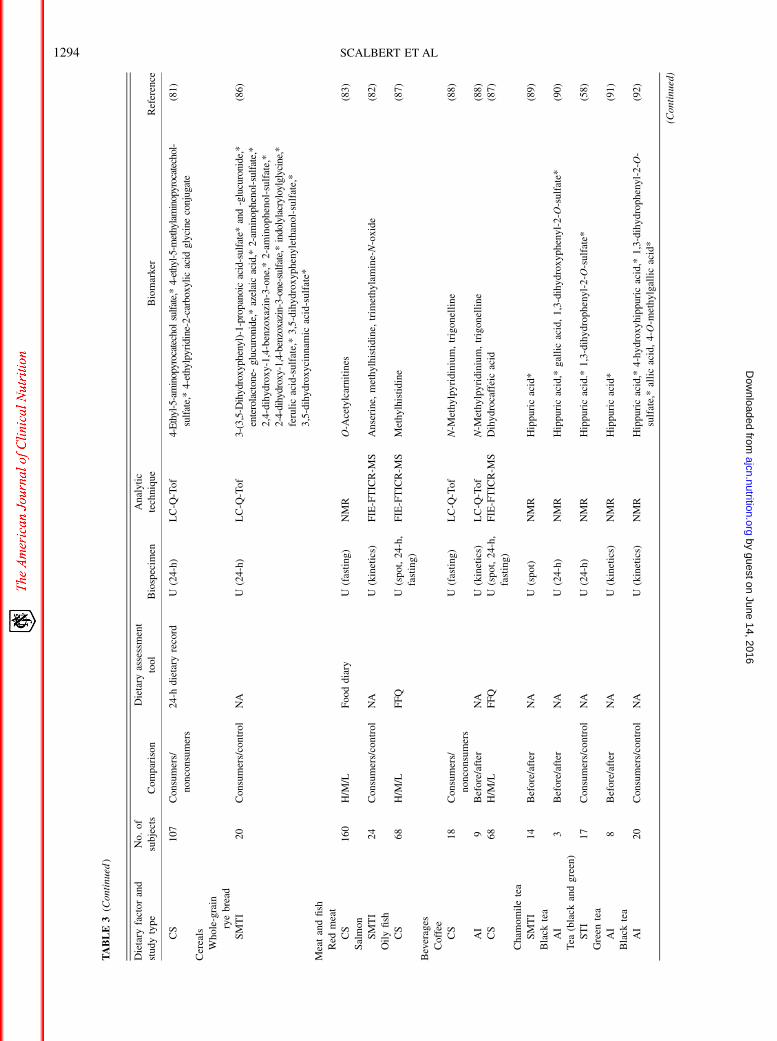
TABLE3(C
ontinued
)
Dietary
factorand
studytype
No.of
subjects
Com
parison
Dietary
assessment
tool
Biospecim
en
Analytic
technique
Biomarker
Reference
CS
107
Consumers/
nonconsumers
24-h
dietary
record
U(24-h)
LC-Q
-Tof
4-Ethyl-5-aminopyrocatecholsulfate,*4-ethyl-5-methylaminopyrocatechol-
sulfate,*4-ethylpyridine-2-carboxylic
acid
glycineconjugate
(81)
Cereals
Whole-grain
ryebread
SMTI
20
Consumers/control
NA
U(24-h)
LC-Q
-Tof
3-(3,5-D
ihydroxyphenyl)-1-propanoicacid-sulfate*and-glucuronide,*
enterolactone-
glucuronide,*azelaicacid,*
2-am
inophenol-sulfate,*
2,4-dihydroxy-1,4-benzoxazin-3-one,*2-aminophenol-sulfate,*
2-4-dihydroxy-1,4-benzoxazin-3-one-sulfate,*
indolylacryloylglycine,*
ferulicacid-sulfate,*3,5-dihydroxyphenylethanol-sulfate,*
3,5-dihydroxycinnamic
acid-sulfate*
(86)
Meatandfish
Red
meat
CS
160
H/M
/LFooddiary
U(fasting)
NMR
O-A
cetylcarnitines
(83)
Salmon
SMTI
24
Consumers/control
NA
U(kinetics)
FIE-FTICR-M
SAnserine,methylhistidine,
trim
ethylamine-N-oxide
(82)
Oilyfish
CS
68
H/M
/LFFQ
U(spot,24-h,
fasting)
FIE-FTICR-M
SMethylhistidine
(87)
Beverages
Coffee
CS
18
Consumers/
nonconsumers
U(fasting)
LC-Q
-Tof
N-M
ethylpyridinium,trigonelline
(88)
AI
9Before/after
NA
U(kinetics)
LC-Q
-Tof
N-M
ethylpyridinium,trigonelline
(88)
CS
68
H/M
/LFFQ
U(spot,24-h,
fasting)
FIE-FTICR-M
SDihydrocaffeicacid
(87)
Chamomiletea
SMTI
14
Before/after
NA
U(spot)
NMR
Hippuricacid*
(89)
Black
tea
AI
3Before/after
NA
U(24-h)
NMR
Hippuricacid,*
gallicacid,1,3-dihydroxyphenyl-2-O
-sulfate*
(90)
Tea
(black
andgreen)
STI
17
Consumers/control
NA
U(24-h)
NMR
Hippuricacid.*
1,3-dihydrophenyl-2-O
-sulfate*
(58)
Green
tea
AI
8Before/after
NA
U(kinetics)
NMR
Hippuricacid*
(91)
Black
tea
AI
20
Consumers/control
NA
U(kinetics)
NMR
Hippuricacid,*
4-hydroxyhippuricacid,*
1,3-dihydrophenyl-2-O
-
sulfate,*allicacid,4-O
-methylgallicacid*
(92)
(Continued)
1294 SCALBERT ET AL
by guest on June 14, 2016ajcn.nutrition.org
Dow
nloaded from
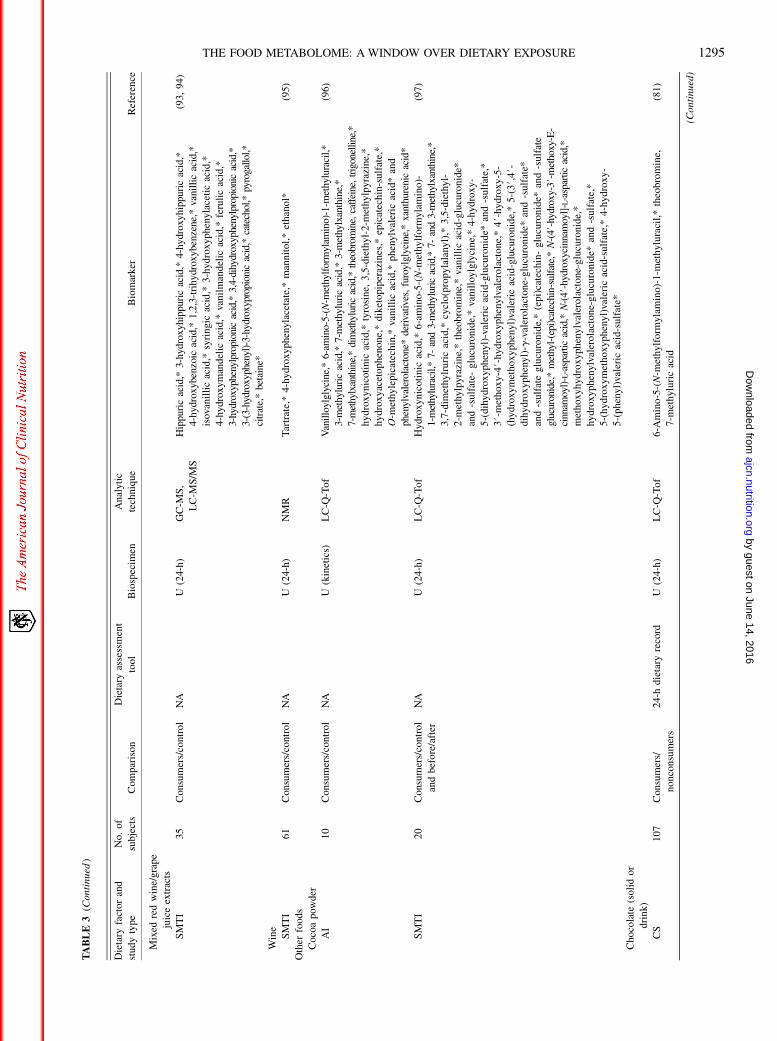
TABLE3(C
ontinued
)
Dietary
factorand
studytype
No.of
subjects
Com
parison
Dietary
assessment
tool
Biospecim
en
Analytic
technique
Biomarker
Reference
Mixed
redwine/grape
juiceextracts
SMTI
35
Consumers/control
NA
U(24-h)
GC-M
S,
LC-M
S/M
S
Hippuricacid,*
3-hydroxyhippuricacid,*
4-hydroxyhippuricacid,*
4-hydroxybenzoic
acid,*
1,2,3-trihydroxybenzene,*vanillic
acid,*
isovanillicacid,*
syringic
acid,*
3-hydroxyphenylaceticacid,*
4-hydroxymandelic
acid,*
vanilmandelic
acid,*
ferulicacid,*
3-hydroxyphenylpropionicacid,*
3,4-dihydroxyphenylpropionicacid,*
3-(3-hydroxyphenyl)-3-hydroxypropionicacid,*
catechol,*
pyrogallol,*
citrate,*betaine*
(93,94)
Wine
SMTI
61
Consumers/control
NA
U(24-h)
NMR
Tartrate,*4-hydroxyphenylacetate,*
mannitol,*ethanol*
(95)
Other
foods
Cocoapow
der
AI
10
Consumers/control
NA
U(kinetics)
LC-Q
-Tof
Vanilloylglycine,*6-am
ino-5-(N-m
ethylformylam
ino)-1-m
ethyluracil,*
3-methyluricacid,*
7-methyluricacid,*
3-methylxanthine,*
7-methylxanthine,*dimethyluricacid,*theobrom
ine,caffeine,trigonelline,*
hydroxynicotinic
acid,*
tyrosine,
3,5-diethyl-2-m
ethylpyrazine,*
hydroxyacetophenone,*diketopiperazines,*
epicatechin-sulfate,*
O-m
ethylepicatechin,*
vanillicacid,*
phenylvaleric
acid*and
phenylvalerolactone*
derivatives,furoylglycine,*xanthurenicacid*
(96)
SMTI
20
Consumers/control
andbefore/after
NA
U(24-h)
LC-Q
-Tof
Hydroxynicotinic
acid,*
6-amino-5-(N-m
ethylform
ylam
ino)-
1-methyluracil,*
7-and3-methyluricacid,*
7-and3-methylxanthine,*
3,7-dim
ethylruricacid,*
cyclo(propylalanyl),*
3,5-diethyl-
2-m
ethylpyrazine,*theobromine,*vanillicacid-glucuronide*
and-sulfate-
glucuronide,*vanilloylglycine,*4-hydroxy-
5-(dihydroxyphenyl)-valeric
acid-glucuronide*
and-sulfate,*
3#-methoxy-4#-hydroxyphenylvalerolactone,*
4#-hydroxy-5-
(hydroxymethoxyphenyl)valericacid-glucuronide,*5-(3#,4#-
dihydroxyphenyl)-g-valerolactone-glucuronide*
and-sulfate*
and-sulfateglucuronide,*(epi)catechin-glucuronide*
and-sulfate
glucuronide,*methyl-(epi)catechin-sulfate,*N-(4#-hydroxy-3#-methoxy-E-
cinnam
oyl)- L-aspartic
acid,*
N-(4#-hydroxycinnam
oyl]-L-aspartic
acid,*
methoxyhydroxyphenylvalerolactone-glucuronide,*
hydroxyphenylvalerolactone-glucuronide*
and-sulfate,*
5-(hydroxymethoxyphenyl)valericacid-sulfate,*4-hydroxy-
5-(phenyl)valericacid-sulfate*
(97)
Chocolate
(solidor
drink)
CS
107
Consumers/
nonconsumers
24-h
dietary
record
U(24-h)
LC-Q
-Tof
6-A
mino-5-(N-m
ethylform
ylamino)-1-m
ethyluracil,*theobromine,
7-m
ethyluricacid
(81)
(Continued)
THE FOOD METABOLOME: A WINDOW OVER DIETARY EXPOSURE 1295
by guest on June 14, 2016ajcn.nutrition.org
Dow
nloaded from
TABLE
3(Continued
)
Dietary
factorand
studytype
No.of
subjects
Comparison
Dietary
assessment
tool
Biospecim
en
Analytic
technique
Biomarker
Reference
Alm
ond-skin
extract
AI
24
Before/after
NA
U(kinetics)
LC-Q
-Tof
(Epi)catechin-sulfate,*O-m
ethyl-(epi)catechin-sulfate,*naringenin-
O-glucuronide,*5-(hydroxyphenyl)-g-valerolactone-glucuronide*
and-sulfate,*
5-(dihydroxyphenyl)-g-valerolactone-glucuronide,*-sulfate
glucuronide*
and-sulfate,*
5-(trihydroxyphenyl)-g-valerolactone-
glucuronide,*5-(hydroxymethoxyphenyl)-g-valerolactone-glucuronide*
andsulfate,*4-hydroxy-5-(dihydroxyphenyl)-valericacid-glucuronide*
andsulfate,*4-hydroxy-5-(hydroxymethoxyphenyl)valeric
acid-
glucuronide,*4-hydroxy-5-(m
ethoxyphenyl)valeric
acid-glucuronide,*
4-hydroxy-5-(hydroxyphenyl)valeric
acid-glucuronide
and-sulfate,*
4-hydroxy-5-(phenyl)valericacid-sulfate,*
2-(dihydroxyphenyl)acetic
acid-glucuronide,*-sulfateglucuronide*
and-sulfate,*
2-(hydroxymethoxyphenyl)acetic
acid-glucuronide,*
2-(hydroxyphenyl)acetic
acid-sulfate,*3-(hydroxyphenyl)propionic
acid-glucuronide,*3-(dihydroxyphenyl)propionic
acid-sulfate,*
vanillicacid-glucuronide,*hydroxyhippuricacid,*
ferulic
acid-glucuronide*
(98)
Nuts SMTI
42
Consumers/control
NA
U(24-h)
LC-Q
-Tof,
LTQ-O
rbitrap
10-H
ydroxydecene-4,6-diynoic
acid-sulfate,*
tridecadienoic/tridecynoic
acid-
glucuronide,*dodecanedioic
acid,*
1,3-dihydroxyphenyl-2-O
-
sulfate,*p-coumaroylalcohol-glucuronide*
and-sulfate,*
N-acetylserotonine-sulfate,*5-hydroxyindoleaceticacid,*
urolitinA-
glucuronide,
sulfate*
andsulfateglucuronide*
(56)
Walnuts
CS
107
Consumers/
nonconsumers
24-h
dietary
record
U(24-h)
LC-Q
-Tof
5-H
ydroxyindole-3-aceticacid
(81)
Nutrients
Dietary
fiber
SMTI
77
H/L
Dietary
record
U(24-h)
NMR
Hippuricacid*
(99)
SMTI
25
Consumers/control
NA
P(fasting)
LC-Q
-Tof
2-A
minophenol-sulfate,
2,6-dihydroxybenzoic
acid,hydroxynuategenin-
glucuronide*
(100)
Whey
protein
isolate
SMTI
12
Consumers/control
NA
P(sequential)
LC-Q
-Tof
Tryptophan,phenylalanine,
kynurenine,
g-G
lu-Leu
(101)
Whey
hydrolysate
SMTI
12
Consumers/control
NA
P(sequential)
LC-Q
-Tof
Methioninesulphoxide,
cyclo(Pro-Thr),cyclo(A
la-Ile),cyclo(Phe-Val),
b-A
sp-Leu,pGlu-Pro,
(101)
Diets Omnivorousdiet
SMTI
12
Consumers/control
NA
U(24-h)
NMR
Taurine,*carnitine,*acetylcarnitine,*1-m
ethylhistidine,*
3-m
ethylhistidine,*trim
ethylamine-N-oxide*
(102)
Vegetariandiet
SMTI
12
Consumers/control
NA
U(24-h)
NMR
p-H
ydroxyphenylacetate*
(102)
Meatprotein
diet
SMTI
24
Before/after
NA
U(24-h)
NMR
Trimethylamine-N-oxide,*histidine*
(103)
Seafood
AI
17
Consumers/control
NA
U(kinetics)
LC-Q
-Tof
Trimethylamine-N-oxide
(85)
(Continued)
1296 SCALBERT ET AL
by guest on June 14, 2016ajcn.nutrition.org
Dow
nloaded from
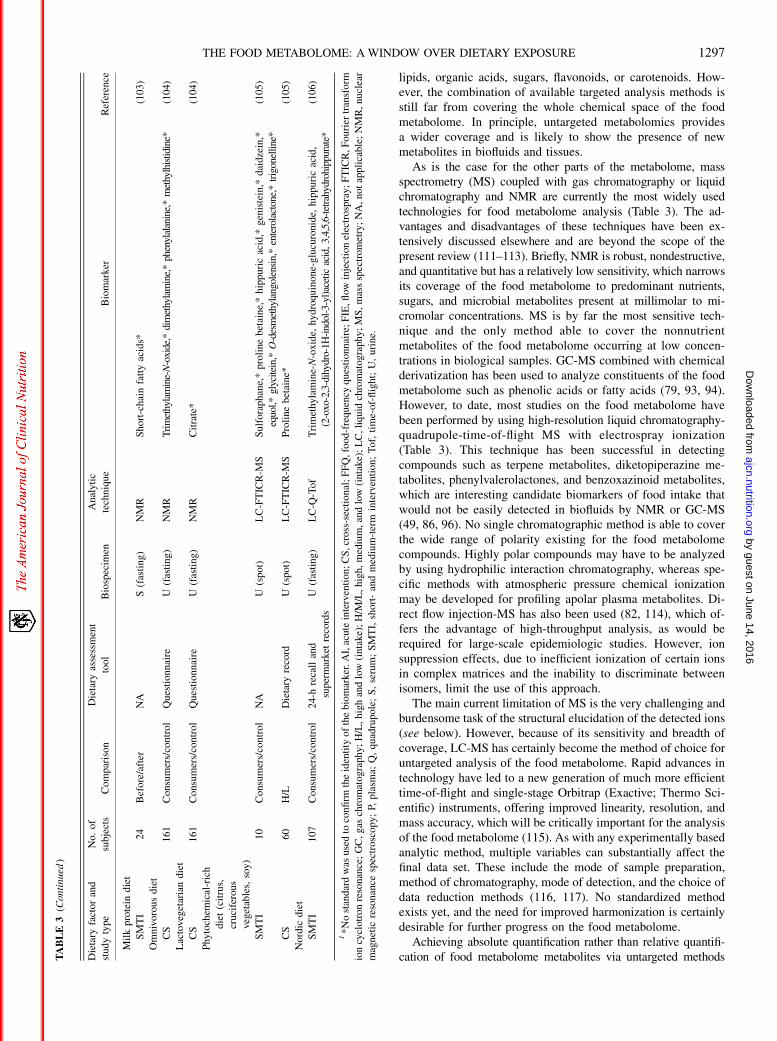
lipids, organic acids, sugars, flavonoids, or carotenoids. How-ever, the combination of available targeted analysis methods isstill far from covering the whole chemical space of the foodmetabolome. In principle, untargeted metabolomics providesa wider coverage and is likely to show the presence of newmetabolites in biofluids and tissues.
As is the case for the other parts of the metabolome, massspectrometry (MS) coupled with gas chromatography or liquidchromatography and NMR are currently the most widely usedtechnologies for food metabolome analysis (Table 3). The ad-vantages and disadvantages of these techniques have been ex-tensively discussed elsewhere and are beyond the scope of thepresent review (111–113). Briefly, NMR is robust, nondestructive,and quantitative but has a relatively low sensitivity, which narrowsits coverage of the food metabolome to predominant nutrients,sugars, and microbial metabolites present at millimolar to mi-cromolar concentrations. MS is by far the most sensitive tech-nique and the only method able to cover the nonnutrientmetabolites of the food metabolome occurring at low concen-trations in biological samples. GC-MS combined with chemicalderivatization has been used to analyze constituents of the foodmetabolome such as phenolic acids or fatty acids (79, 93, 94).However, to date, most studies on the food metabolome havebeen performed by using high-resolution liquid chromatography-quadrupole-time-of-flight MS with electrospray ionization(Table 3). This technique has been successful in detectingcompounds such as terpene metabolites, diketopiperazine me-tabolites, phenylvalerolactones, and benzoxazinoid metabolites,which are interesting candidate biomarkers of food intake thatwould not be easily detected in biofluids by NMR or GC-MS(49, 86, 96). No single chromatographic method is able to coverthe wide range of polarity existing for the food metabolomecompounds. Highly polar compounds may have to be analyzedby using hydrophilic interaction chromatography, whereas spe-cific methods with atmospheric pressure chemical ionizationmay be developed for profiling apolar plasma metabolites. Di-rect flow injection-MS has also been used (82, 114), which of-fers the advantage of high-throughput analysis, as would berequired for large-scale epidemiologic studies. However, ionsuppression effects, due to inefficient ionization of certain ionsin complex matrices and the inability to discriminate betweenisomers, limit the use of this approach.
The main current limitation of MS is the very challenging andburdensome task of the structural elucidation of the detected ions(see below). However, because of its sensitivity and breadth ofcoverage, LC-MS has certainly become the method of choice foruntargeted analysis of the food metabolome. Rapid advances intechnology have led to a new generation of much more efficienttime-of-flight and single-stage Orbitrap (Exactive; Thermo Sci-entific) instruments, offering improved linearity, resolution, andmass accuracy, which will be critically important for the analysisof the food metabolome (115). As with any experimentally basedanalytic method, multiple variables can substantially affect thefinal data set. These include the mode of sample preparation,method of chromatography, mode of detection, and the choice ofdata reduction methods (116, 117). No standardized methodexists yet, and the need for improved harmonization is certainlydesirable for further progress on the food metabolome.
Achieving absolute quantification rather than relative quantifi-cation of food metabolome metabolites via untargeted methodsT
ABLE
3(C
ontinued
)
Dietary
factorand
studytype
No.of
subjects
Comparison
Dietary
assessment
tool
Biospecim
en
Analytic
technique
Biomarker
Reference
Milkprotein
diet
SMTI
24
Before/after
NA
S(fasting)
NMR
Short-chainfattyacids*
(103)
Omnivorousdiet
CS
161
Consumers/control
Questionnaire
U(fasting)
NMR
Trimethylamine-N-oxide,*dimethylamine,*phenylalanine,*methylhistidine*
(104)
Lactovegetariandiet
CS
161
Consumers/control
Questionnaire
U(fasting)
NMR
Citrate*
(104)
Phytochem
ical-rich
diet(citrus,
cruciferous
vegetables,soy)
SMTI
10
Consumers/control
NA
U(spot)
LC-FTICR-M
SSulforaphane,*prolinebetaine,*hippuricacid,*
genistein,*
daidzein,*
equol,*
glycitein,*
O-desmethylangolensin,*enterolactone,*trigonelline*
(105)
CS
60
H/L
Dietary
record
U(spot)
LC-FTICR-M
SProline
betaine*
(105)
Nordic
diet
SMTI
107
Consumers/control
24-h
recalland
supermarket
records
U(fasting)
LC-Q
-Tof
Trimethylamine-N-oxide,
hydroquinone-glucuronide,
hippuricacid,
(2-oxo-2,3-dihydro-1H-indol-3-yl)aceticacid,3,4,5,6-tetrahydrohippurate*
(106)
1*Nostandardwas
usedto
confirm
theidentity
ofthebiomarker.AI,acuteintervention;CS,cross-sectional;FFQ,food-frequency
questionnaire;FIE,fl
owinjectionelectrospray;FTICR,F
ourier
transform
ioncyclotronresonance;GC,gas
chromatography;H/L,highandlow(intake);H/M
/L,high,medium,andlow(intake);LC,liquid
chromatography;MS,massspectrometry;NA,notapplicable;NMR,nuclear
magnetic
resonance
spectroscopy;
P,plasm
a;Q,quadrupole;S,serum;SMTI,short-andmedium-term
intervention;Tof,time-of-flight;U,urine.
THE FOOD METABOLOME: A WINDOW OVER DIETARY EXPOSURE 1297
by guest on June 14, 2016ajcn.nutrition.org
Dow
nloaded from
remains a continuing challenge. It is essentially impossible to usestandards or isotopically labeled references to quantify the thou-sands of compounds in the food metabolome. New approaches arebeing developed with isotope labeling and multiple reactionmonitoring–based profiling for families of compounds sharingdistinctive chemical functionalities (118). Labeled reagents tar-geted at these functionalities or particular multiple reactionmonitoring transitions could be used to specifically measure se-lected fractions of the food metabolome such as amines, phenols,glucuronides, or mercapturic acid derivatives. These advances mayallow researchers to target larger areas of the food metabolomechemical space with the use of standardized quantitative methods.
Analysis of metabolomic data
The metabolic profile of raw data generated by the spectro-metric analysis of biological samples can be analyzed in severalsteps (119, 120). These include data preprocessing, data align-ment, data normalization, and signal correction followed by theanalysis through various statistical methods. There are a numberof different software tools available for these tasks; most vendorshave their proprietary software but highly efficient freewareprograms, Web servers, or add-on softwares exist. For NMR, anexample is the Interval Correlation Optimized shift algorithmproduced for Matlab (121), and for LC-MS data alignmentfreeware such as XCMS (122), MZmine (119, 123), and Met-Align (124) are widely used.
The preprocessing step is software dependent and typicallyincludes data reduction methods such as centroiding of massspectra or analog-to-digital conversion of NMR, infrared, or UV/visible spectra. Preprocessing also includes translation of dataformats and data export. The next step is data alignment. It iscrucial to align the different sample profiles, which do not matchexactly because of small variations in retention times, masses, orchemical shifts. All available software tools differ in their peakpicking algorithms. There is only a 50–70% overlap between thepeaks detected by different packages from the same raw data set,even with similar settings (125). Additional markers may beobserved by using additional softwares or simply by alteringsoftware settings. Another major difference between packages isthe presence or absence of so-called gap filling, a routine torevisit the raw data for any peak that has not been detected ina sample when it was found in others. The lack of a gap-fillingalgorithm creates major problems for normalization and forstatistical analysis. An ideal food intake marker would havea zero value in control samples from volunteers who did notconsume the food; in this case, the gap-filling routine helps toestimate the background noise in the peak area.
The output from the peak detection and data alignment steps istypically a matrix of samples and features with the intensity as thevalues within the matrix structure. A feature here denotes anydistinct peak in the data set, regardless of whether it representsa known, unknown, or even an artifact ion. In LC-MS profiling,the features are characterized by a retention time and a mass (m/z)value. Such a feature may be a compound’s parent ion, but justas frequently it represents an adduct ion or a fragment froma compound. In NMR and in most other digitized spectral data thesingle features are part of spectral shapes that usually have localmaxima and minima. For both kinds of data the fine structure of thedata contains additional information that is useful for identifying
compounds and structures in the samples and is therefore partic-ularly important for characterizing the food metabolome.
Metabolic profiling data may be analyzed by using univariate ormultivariate statistical methods. Statistical analysis of untargetedmetabolomic data is often an initial step in the biomarker discoveryprocess that should not be confused with hypothesis testing, be-cause there is no a priori hypothesis. In dietary intervention studieswith single foods, the contrast observed for a good biomarker can belarge, sometimes even infinite, making it possible to work robustlywith small sample sets and discriminate potential intake biomarkersfrom more subtle changes in endogenous metabolites (126). Incross-sectional studies this large contrast seldom applies, but ap-proximate dose-response relations from food-frequency question-naires may help in the identification of food intake biomarkers.
Multivariate analysis is most commonly used for explorativeanalysis of metabolic profiling data (127). As opposed to uni-variate analysis, multivariate analysis can be performed in anunsupervised manner (ie, without including information on groupassignment for the analysis). This provides an objective as-sessment of the principal patterns in the data set (eg, intake or nointake of a specific food component or diet). Unsupervisedanalysis such as principal components analysis (PCA) shouldalways be the starting point for explorative multivariate analysisto ascertain that there is an overall segregation into a food-relatedpattern. The features associated with any pattern can be shown bythe loadings in a PCA plot; however, PCA is generally not wellsuited to identify the most prominent part of the pattern. SparsePCA overcomes this limitation (128, 129). Clustering methodsare also widely used for subdividing and ordering a data set intogroups of data with a high degree of similarity. Hierarchicalclustering generates a dendrogram in which neighboring samplesshare the greatest similarity and neighboring features are thosemost closely related. This provides useful biological informationand unsupervised groupings of the data set (130).
Supervised multivariate analysis is commonly the next step inmany data analysis methods but has a strong tendency to overfitthe data. Even random data will usually segregate and showa “marker pattern” after supervised analysis (131). Carefulvalidation with the use of techniques such as permutation testingand cross-validation is therefore always necessary. There area large number of supervised methods (120, 127), with the mostcommonly used analysis for comparing 2 groups being partialleast-squares discriminant analysis (PLS-DA) (132) or one of itsseveral variants. In complex nutritional studies it may be usefulto combine ANOVA separations of factors with PLS-DA (133,134) or use multilevel PLS-DA to reduce the influence of in-terindividual variation (135). Some multivariate methods such asPLS are mainly used to fit the data to a continuous variable. Thisis useful to explore the relation of any features in the profilingdata set with an external variable (eg, intake of a specific foodbased on a questionnaire or any biological outcome marker)(121). In addition, for these prediction models very carefulvalidation is required and their global ability to predict a specificfood intake has to be assessed in separate studies.
Univariate analysis is supervised—that is, a hypothesis re-garding a difference between groups is implicit. Any markeridentified by this approach should therefore also be in-dependently validated in a separate study. For univariate analysisused in exploration of new food intake biomarkers it is impor-tant to set a reasonable threshold for false discovery rates
1298 SCALBERT ET AL
by guest on June 14, 2016ajcn.nutrition.org
Dow
nloaded from
(FDRs) (136, 137). In explorative science there is no fixed rulefor the acceptability level of the FDR, and any level from 5% to50% may be useful, depending on further data analysis steps.If no additional data analysis is planned as, for instance, inmetabolome-wide association studies (MWASs), the FDR shouldgenerally be selected in the lower end of this range. If theunivariate data step is used for selection of features that will beanalyzed further (eg, by multivatiate models), it may be moreappropriate to use a higher FDR. In any case, the markers foundmust be validated in subsequent independent studies.
Overall, the field of metabolomics is rich with data analysisoptions, and the challenge in the future will be to optimally applythese to food metabolomic studies. Useful resources exist to helpin selecting and using in the most rigorous way appropriate toolsfor data analysis in a particular project (138).
Metabolite identification
Metabolite identification in metabolomic studies relies on thecomparison of generated spectra with those in curated metabolitedatabases. However, the vast majority of the food metabolomecomponents are not yet represented in these databases, whichmakes the elucidation of their structure difficult. As previouslydescribed, the identification of candidate dietary biomarkers iscomplicated by the fact that the majority of food compounds aretreated as xenobiotics by the human body in phase I and phase IIreactions or undergo fermentation in the colon by the gutmicrobiota (139). Despite some increase in their availability overthe past few years, these highly diverse metabolites are largelyabsent from most databases. One exception is Phenol-Explorer,which gives a comprehensive overview of the human and animalmetabolites formed from polyphenols (70).
NMR spectroscopy and MS are the 2 essential tools for elu-cidation of the structure of unknown metabolites in metabolomicstudies (140, 141). Metabolites such as S-methyl-L-cysteinesulfoxide or proline betaine as biomarkers of cruciferous vege-tables or citrus fruit, respectively, could be identified in NMRstudies on the basis of their characteristic chemical shifts (Table3) (80, 84). More markers of food intake have been identified inMS-based metabolomic studies on the basis of their accuratemass and mass fragmentation spectra (142–144).
A number of commercial and “in house” software tools havebeen developed recently and used to recognize and identifyfragments and adducts derived from one food metabolite (97,114, 145). These tools are particularly useful to identify phaseII conjugates, common constituents of the food metabolome,which show characteristic neutral losses (eg, 79.957 amu forsulfate conjugates and 176.032 amu for glucuronides) (44, 114,140). Customized in-house databases on the most likely phase Iand phase II metabolites have also been developed based on insilico prediction with expert systems such as Meteor (49, 146–148). An important challenge for the future will be the de-velopment of a coordinated international effort to extend existingand develop novel software tools and databases allowing the more“intelligent” prediction of the metabolic fate of food constituents.
Spectral databases for the food metabolome
Despite the many initiatives to make spectral data setsavailable to the scientific community, the publicly accessible
existing spectral data are still scattered over numerousWeb-based(searchable) databases, printed tables in scientific journals, Excelfiles in supporting information, and scientific books (140, 149,150). As described earlier, the major online chemical resources(typified by PubChem, Kyoto Encyclopedia of Genes and Ge-nomes, and ChemSpider) contain limited information on humanmetabolites derived from food compounds. Although they are notspecific to the food metabolome, these resources are useful formetabolite identification because fragmentation data or NMRsignals of known metabolites can be compared with the unknownquery to gain structural information. The most comprehensiveand best-curated chemical (commercial) database is currentlySciFinder, which includes many food metabolome compoundscollected from the literature (151). Recently, a large number offood compounds have been added to the HMDB, which makessearches on the basis of their accurate masses possible (9);however, to date it contains few mass fragmentation spectrauseful for food metabolite identification.
The robust and reproducible fragmentation patterns and re-tention times of volatile metabolites in GC-MS have successfullybeen used to set up metabolomic workflows that search forpossible candidate metabolites in the National Institutes ofStandards and Technology library or in-house libraries (152).Recently, similar approaches have been proposed for LC-MS–and NMR-based metabolomic data sets. Spectral databasescontain fragmentation spectra obtained in different experimentalconditions (eg, several collision energies and different massspectrometers) to facilitate direct comparison with experimentaldata (141). Also, the number of metabolite spectra in Chem-spider and HMDB is increasing. Even though not specific to thefood metabolome, these resources are particularly useful formetabolite identification because fragmentation data or NMRsignals of known metabolites can give structural hints for theunknown query.
Software tools for annotation of the food metabolome
Software tools such as MetFrag, MyCompoundID, MetiTree,and Mass Frontier can handle metabolite fragmentation data andpermit library searches for potential candidates using in silicofragmentation predictions of metabolites or comparisons topreviously fragmented metabolites or standards (146, 153–155).MetFusion combines knowledge from spectral databases such asMassBank with the multitude of candidates generated by frag-menters such as MetFrag (156).
Software tools have also been developed that integrate me-tabolite annotation directly within the processing pipeline of LC-MS data (157). For example, CAMERA is a pipeline for theannotation and analysis of LC-MS data in cooperation withXCMS (158, 159). Online MS/MS fragmentation, UV spectra,and estimates of partition coefficients based on retention timehave been used to further investigate metabolite structures (157,160, 161). The MagMA software package recently launched isable to read multistage tandemmass spectral data to add potentialcandidates based on in silico–predicted fragmentation (162). Inparticular, the use of accurate fragmentation mass data as inputcan enhance the metabolite identification process by selectingthe most likely candidates on the basis of similarities in frag-mentation pathways and their readily assigned elemental for-mula with the unknown query metabolite as exemplified by
THE FOOD METABOLOME: A WINDOW OVER DIETARY EXPOSURE 1299
by guest on June 14, 2016ajcn.nutrition.org
Dow
nloaded from
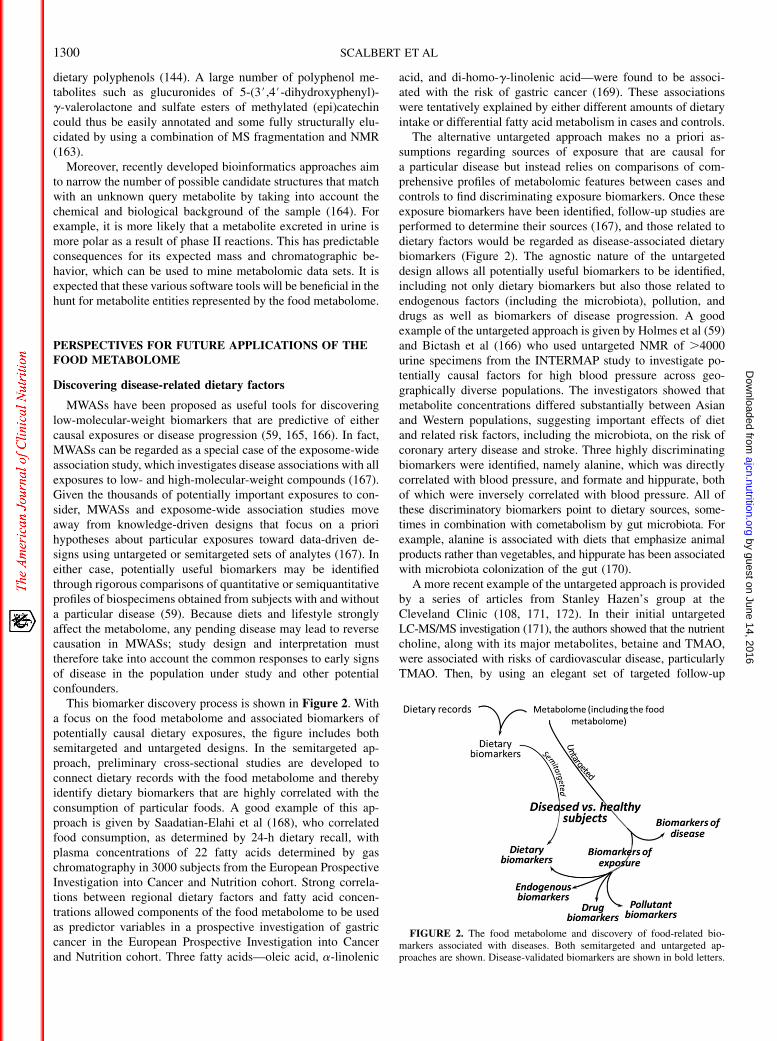
dietary polyphenols (144). A large number of polyphenol me-tabolites such as glucuronides of 5-(3#,4#-dihydroxyphenyl)-g-valerolactone and sulfate esters of methylated (epi)catechincould thus be easily annotated and some fully structurally elu-cidated by using a combination of MS fragmentation and NMR(163).
Moreover, recently developed bioinformatics approaches aimto narrow the number of possible candidate structures that matchwith an unknown query metabolite by taking into account thechemical and biological background of the sample (164). Forexample, it is more likely that a metabolite excreted in urine ismore polar as a result of phase II reactions. This has predictableconsequences for its expected mass and chromatographic be-havior, which can be used to mine metabolomic data sets. It isexpected that these various software tools will be beneficial in thehunt for metabolite entities represented by the food metabolome.
PERSPECTIVES FOR FUTURE APPLICATIONS OF THEFOOD METABOLOME
Discovering disease-related dietary factors
MWASs have been proposed as useful tools for discoveringlow-molecular-weight biomarkers that are predictive of eithercausal exposures or disease progression (59, 165, 166). In fact,MWASs can be regarded as a special case of the exposome-wideassociation study, which investigates disease associations with allexposures to low- and high-molecular-weight compounds (167).Given the thousands of potentially important exposures to con-sider, MWASs and exposome-wide association studies moveaway from knowledge-driven designs that focus on a priorihypotheses about particular exposures toward data-driven de-signs using untargeted or semitargeted sets of analytes (167). Ineither case, potentially useful biomarkers may be identifiedthrough rigorous comparisons of quantitative or semiquantitativeprofiles of biospecimens obtained from subjects with and withouta particular disease (59). Because diets and lifestyle stronglyaffect the metabolome, any pending disease may lead to reversecausation in MWASs; study design and interpretation musttherefore take into account the common responses to early signsof disease in the population under study and other potentialconfounders.
This biomarker discovery process is shown in Figure 2. Witha focus on the food metabolome and associated biomarkers ofpotentially causal dietary exposures, the figure includes bothsemitargeted and untargeted designs. In the semitargeted ap-proach, preliminary cross-sectional studies are developed toconnect dietary records with the food metabolome and therebyidentify dietary biomarkers that are highly correlated with theconsumption of particular foods. A good example of this ap-proach is given by Saadatian-Elahi et al (168), who correlatedfood consumption, as determined by 24-h dietary recall, withplasma concentrations of 22 fatty acids determined by gaschromatography in 3000 subjects from the European ProspectiveInvestigation into Cancer and Nutrition cohort. Strong correla-tions between regional dietary factors and fatty acid concen-trations allowed components of the food metabolome to be usedas predictor variables in a prospective investigation of gastriccancer in the European Prospective Investigation into Cancerand Nutrition cohort. Three fatty acids—oleic acid, a-linolenic
acid, and di-homo-g-linolenic acid—were found to be associ-ated with the risk of gastric cancer (169). These associationswere tentatively explained by either different amounts of dietaryintake or differential fatty acid metabolism in cases and controls.
The alternative untargeted approach makes no a priori as-sumptions regarding sources of exposure that are causal fora particular disease but instead relies on comparisons of com-prehensive profiles of metabolomic features between cases andcontrols to find discriminating exposure biomarkers. Once theseexposure biomarkers have been identified, follow-up studies areperformed to determine their sources (167), and those related todietary factors would be regarded as disease-associated dietarybiomarkers (Figure 2). The agnostic nature of the untargeteddesign allows all potentially useful biomarkers to be identified,including not only dietary biomarkers but also those related toendogenous factors (including the microbiota), pollution, anddrugs as well as biomarkers of disease progression. A goodexample of the untargeted approach is given by Holmes et al (59)and Bictash et al (166) who used untargeted NMR of .4000urine specimens from the INTERMAP study to investigate po-tentially causal factors for high blood pressure across geo-graphically diverse populations. The investigators showed thatmetabolite concentrations differed substantially between Asianand Western populations, suggesting important effects of dietand related risk factors, including the microbiota, on the risk ofcoronary artery disease and stroke. Three highly discriminatingbiomarkers were identified, namely alanine, which was directlycorrelated with blood pressure, and formate and hippurate, bothof which were inversely correlated with blood pressure. All ofthese discriminatory biomarkers point to dietary sources, some-times in combination with cometabolism by gut microbiota. Forexample, alanine is associated with diets that emphasize animalproducts rather than vegetables, and hippurate has been associatedwith microbiota colonization of the gut (170).
A more recent example of the untargeted approach is providedby a series of articles from Stanley Hazen’s group at theCleveland Clinic (108, 171, 172). In their initial untargetedLC-MS/MS investigation (171), the authors showed that the nutrientcholine, along with its major metabolites, betaine and TMAO,were associated with risks of cardiovascular disease, particularlyTMAO. Then, by using an elegant set of targeted follow-up
FIGURE 2. The food metabolome and discovery of food-related bio-markers associated with diseases. Both semitargeted and untargeted ap-proaches are shown. Disease-validated biomarkers are shown in bold letters.
1300 SCALBERT ET AL
by guest on June 14, 2016ajcn.nutrition.org
Dow
nloaded from
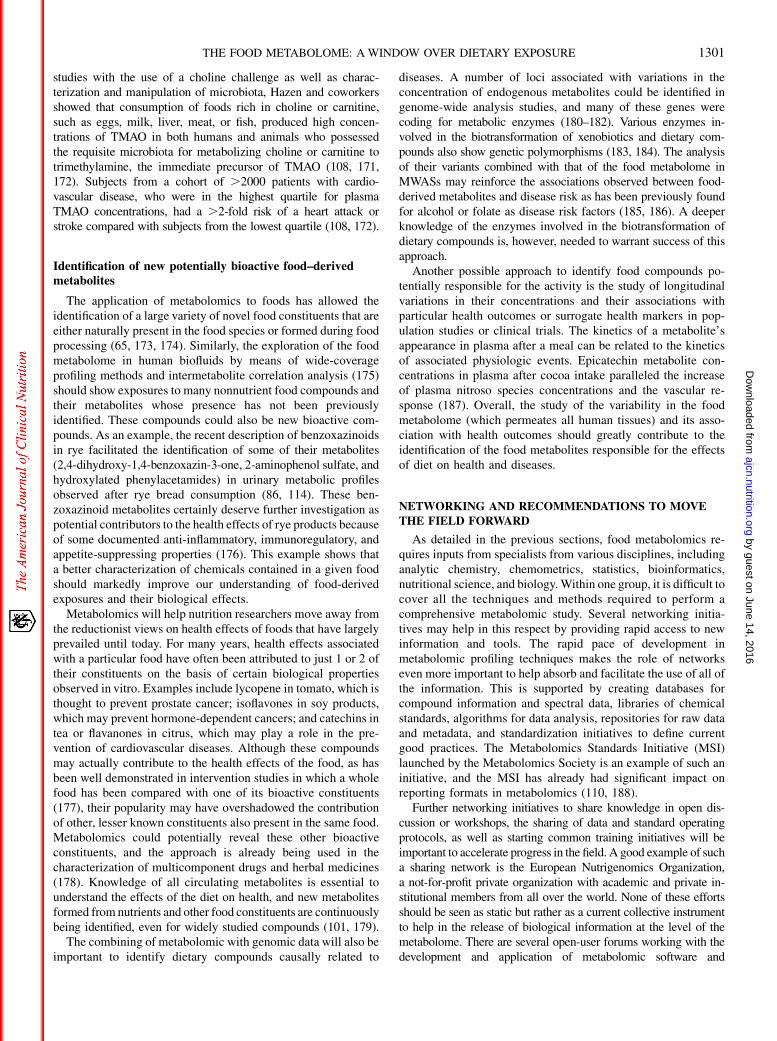
studies with the use of a choline challenge as well as charac-terization and manipulation of microbiota, Hazen and coworkersshowed that consumption of foods rich in choline or carnitine,such as eggs, milk, liver, meat, or fish, produced high concen-trations of TMAO in both humans and animals who possessedthe requisite microbiota for metabolizing choline or carnitine totrimethylamine, the immediate precursor of TMAO (108, 171,172). Subjects from a cohort of .2000 patients with cardio-vascular disease, who were in the highest quartile for plasmaTMAO concentrations, had a .2-fold risk of a heart attack orstroke compared with subjects from the lowest quartile (108, 172).
Identification of new potentially bioactive food–derivedmetabolites
The application of metabolomics to foods has allowed theidentification of a large variety of novel food constituents that areeither naturally present in the food species or formed during foodprocessing (65, 173, 174). Similarly, the exploration of the foodmetabolome in human biofluids by means of wide-coverageprofiling methods and intermetabolite correlation analysis (175)should show exposures to many nonnutrient food compounds andtheir metabolites whose presence has not been previouslyidentified. These compounds could also be new bioactive com-pounds. As an example, the recent description of benzoxazinoidsin rye facilitated the identification of some of their metabolites(2,4-dihydroxy-1,4-benzoxazin-3-one, 2-aminophenol sulfate, andhydroxylated phenylacetamides) in urinary metabolic profilesobserved after rye bread consumption (86, 114). These ben-zoxazinoid metabolites certainly deserve further investigation aspotential contributors to the health effects of rye products becauseof some documented anti-inflammatory, immunoregulatory, andappetite-suppressing properties (176). This example shows thata better characterization of chemicals contained in a given foodshould markedly improve our understanding of food-derivedexposures and their biological effects.
Metabolomics will help nutrition researchers move away fromthe reductionist views on health effects of foods that have largelyprevailed until today. For many years, health effects associatedwith a particular food have often been attributed to just 1 or 2 oftheir constituents on the basis of certain biological propertiesobserved in vitro. Examples include lycopene in tomato, which isthought to prevent prostate cancer; isoflavones in soy products,which may prevent hormone-dependent cancers; and catechins intea or flavanones in citrus, which may play a role in the pre-vention of cardiovascular diseases. Although these compoundsmay actually contribute to the health effects of the food, as hasbeen well demonstrated in intervention studies in which a wholefood has been compared with one of its bioactive constituents(177), their popularity may have overshadowed the contributionof other, lesser known constituents also present in the same food.Metabolomics could potentially reveal these other bioactiveconstituents, and the approach is already being used in thecharacterization of multicomponent drugs and herbal medicines(178). Knowledge of all circulating metabolites is essential tounderstand the effects of the diet on health, and new metabolitesformed from nutrients and other food constituents are continuouslybeing identified, even for widely studied compounds (101, 179).
The combining of metabolomic with genomic data will also beimportant to identify dietary compounds causally related to
diseases. A number of loci associated with variations in theconcentration of endogenous metabolites could be identified ingenome-wide analysis studies, and many of these genes werecoding for metabolic enzymes (180–182). Various enzymes in-volved in the biotransformation of xenobiotics and dietary com-pounds also show genetic polymorphisms (183, 184). The analysisof their variants combined with that of the food metabolome inMWASs may reinforce the associations observed between food-derived metabolites and disease risk as has been previously foundfor alcohol or folate as disease risk factors (185, 186). A deeperknowledge of the enzymes involved in the biotransformation ofdietary compounds is, however, needed to warrant success of thisapproach.
Another possible approach to identify food compounds po-tentially responsible for the activity is the study of longitudinalvariations in their concentrations and their associations withparticular health outcomes or surrogate health markers in pop-ulation studies or clinical trials. The kinetics of a metabolite’sappearance in plasma after a meal can be related to the kineticsof associated physiologic events. Epicatechin metabolite con-centrations in plasma after cocoa intake paralleled the increaseof plasma nitroso species concentrations and the vascular re-sponse (187). Overall, the study of the variability in the foodmetabolome (which permeates all human tissues) and its asso-ciation with health outcomes should greatly contribute to theidentification of the food metabolites responsible for the effectsof diet on health and diseases.
NETWORKING AND RECOMMENDATIONS TO MOVETHE FIELD FORWARD
As detailed in the previous sections, food metabolomics re-quires inputs from specialists from various disciplines, includinganalytic chemistry, chemometrics, statistics, bioinformatics,nutritional science, and biology.Within one group, it is difficult tocover all the techniques and methods required to perform acomprehensive metabolomic study. Several networking initia-tives may help in this respect by providing rapid access to newinformation and tools. The rapid pace of development inmetabolomic profiling techniques makes the role of networkseven more important to help absorb and facilitate the use of all ofthe information. This is supported by creating databases forcompound information and spectral data, libraries of chemicalstandards, algorithms for data analysis, repositories for raw dataand metadata, and standardization initiatives to define currentgood practices. The Metabolomics Standards Initiative (MSI)launched by the Metabolomics Society is an example of such aninitiative, and the MSI has already had significant impact onreporting formats in metabolomics (110, 188).
Further networking initiatives to share knowledge in open dis-cussion or workshops, the sharing of data and standard operatingprotocols, as well as starting common training initiatives will beimportant to accelerate progress in the field. A good example of sucha sharing network is the European Nutrigenomics Organization,a not-for-profit private organization with academic and private in-stitutional members from all over the world. None of these effortsshould be seen as static but rather as a current collective instrumentto help in the release of biological information at the level of themetabolome. There are several open-user forums working with thedevelopment and application of metabolomic software and
THE FOOD METABOLOME: A WINDOW OVER DIETARY EXPOSURE 1301
by guest on June 14, 2016ajcn.nutrition.org
Dow
nloaded from
standards in general, such as the MSI working groups (189), theMetabolomics Forum (190), and several others, but none of theserelate specifically to the food metabolome. The First InternationalWorkshop on the Food Metabolome was a first occasion for allresearchers active in the field to meet and make propositions forfuture research. These propositions are summarized here.
Coordination of dietary studies
The food metabolome is exceedingly complex because it en-compasses metabolites derived from as many metabolomes as thereare edible species. Therefore, a particularly focused communityeffort is necessary to reach our ultimate goal of full coverage for allfoods and all food metabolites. A large number of studies withdifferent designs will be necessary to validate each dietary marker.For example, many studies have been conducted with oranges(Table 3), but a broad coverage of all citrus and many other fruit aswell as kinetic studies have been necessary to interpret prolinebetaine as a short-term marker of citrus that is dominated by orangeand orange juice intake (80). Similar work is needed and could bea shared effort for many other food groups, including cruciferousand apiaceous vegetables, pomes, cheeses, meats, fish, and others.
A large concerted action or open-project network would beneeded to help prioritize needs for novel markers and focus on areasin which drugs have largely failed and where diet and nutritionshow promise to prevent or cure diseases.More discussion is clearlyneeded between laboratory scientists, nutritionists, and epidemi-ologists to address this question in a rational way. Such a networkmight share information on current research plans to avoid re-dundancy, share known as well as unidentified markers related tospecific foods, or even form a shared workflow pipeline for dietarystudies, data analysis, and metabolite identification. In addition, theconstitution of a database describing resources of high-qualityhuman samples collected in various dietary intervention studiesdeveloped for other purposes would also be extremely useful. Thisinformation is partly accessible in a database such as ClinicalTrials.gov (191), but no indication is given on the availability of bio-specimens. These samples would prove very useful for biomarkervalidation purposes and would save a lot of effort and moneyotherwise needed to replicate such clinical studies. An example ofa local, but open, sample repository for experimental studies in-cluding nutrition is the CUBE biobank, which covers samples froma single university (www.cube.ku.dk). An umbrella of such localrepositories could be one possible way forward to improve reuse ofsamples for biomarker validation studies.
Software tools
A comprehensive set of software tools has been developed andshared to help the scientific community that covers every step indata processing and analysis. Most of these are not specific to thefood metabolome analysis (see Analysis of metabolomic dataand Software tools for annotation of the food metabolome sec-tions). However, for the identification of food-derived metabo-lites, additional software developments are needed, particularlyfor in silico prediction of the metabolism of compounds found infoods. Some commercial software exists for the pharmaceuticalarea (192, 193) and covers many phase I and II reactions. How-ever, many compounds in foods have structures that are un-common in pharmaceuticals. Food constituents may be degradedby specialized enzymes and may also be extensively metabolized
by the gut microbiota, so these metabolic pathways need to becovered as well. This work will require a large community effortto develop software to predict structures from all possible me-tabolites from any food compound, including their conjugates;such a tool could be further combined with software that performsin silico fragmentation to predict daughter ions and additionalprediction tools for predicting physicochemical properties such aspolarity and hence retention time. Prediction of absorption, dis-tribution, and excretion of the food compounds and of their me-tabolites would be an additional area that would help the foodmetabolome community. Systematic in silico–predicted metabo-lites could also be stored in food metabolome databases.
Databases
The human metabolome database has recently expanded toinclude compounds found in common foods because these are, atleast initially before metabolism, also present within the humanbody (9). Databases specific for the food metabolome are stilllargely missing apart from Phenol-Explorer, a database on allknown polyphenol metabolites (70). The development of similardatabases for other classes of food compounds will likely requirea coordinated effort from many researchers active in variousfields. These databases should provide spectral data for the food-derived metabolites in each class and any information useful fortheir identification. When not available, in silico–predicted massfragmentation spectra could be calculated and also stored, as isdone in SciFinder (151). The same databases could additionallyallow metabolites to be linked with their food precursors, as wellas with their possible dietary sources (70). The involvement offood scientists will be essential to provide this information.
Study repositories with processed metabolomic data
To shape consensus and create openness in the evolving field ofmetabolomics, it is important to share data and information onfood metabolome studies, as is done in many other biomedicalfields (194–196). Indeed, for many funding agencies, this isbecoming a key condition of funding. One such initiative is theMetabolights database, which aims to shape a fully open-access,shared database for metabolomic studies (197). Raw and pro-cessed data and metadata can be uploaded and curated beforedeposition into the Metabolights core database, which thenmakes the information accessible through the Internet. A similarongoing but conceptually broader initiative is the NutritionalPhenotype Database (dbNP) (198), initiated by the Nu-trigenomics Organization. The dbNP can hold data from severalomics platforms, including metabolomics, together with studymetadata in a searchable format. It is open access and builds onprivate accounts for uploading and analyzing data with thepossibility of open sharing when data can be released for others.Both dbNP and Metabolights provide several online softwaretools to help in data curation and analysis.
The storage of searchable, annotated, raw analytic data fileswith well-documented dietary metadata from human interventionor cross-sectional studies will facilitate the comparison of raw orpreprocessed data with previously obtained spectral data of food-derived metabolites. Such a repository that contains all unknownsdetected in previous food metabolome studies would be a pre-cious aid to identify the most robust dietary biomarkers. The
1302 SCALBERT ET AL
by guest on June 14, 2016ajcn.nutrition.org
Dow
nloaded from
format of raw analytic data concerning the food metabolome aswell as that of the dietary metadata will have to be defined.
Food metabolome reference library
The definitive identification of biomarkers is often hamperedby the lack of available chemical standards. The large majority ofthe components of the food metabolome are not commerciallyavailable. The development of a resource to synthesize anddistribute chemical standards should be a priority. The de-velopment of a shared or federated resource of chemical stan-dards for dietary metabolites will allow researchers to confirm orvalidate compound identifications. Food scientists and naturalproduct chemists who have isolated from various foods andrelated products or synthesized these chemicals should be as-sociated with this effort. Biotransformation routes (enzymes,microorganisms) could also be better exploited particularly tosynthesize conjugated metabolites.
Standardization initiatives
The MSI, initiated by the Metabolomics Society, has alreadyissued several reference articles on good practice for metab-olomic research. The MSI is broad and includes activities byseveral working groups covering many aspects of metabolomics(189). However, there is no current standardization initiative forthe food metabolome, and the current article is launched asa starting signal for such an initiative to share tools, information,and data sets to help encourage a community-driven advancementof research on the food metabolome.
One of the most needed initiatives is a strategy with associatedtools for the validation of food intake biomarkers. In particular,a reference database could integrate all potential markers that canbe included into targeted multimetabolite methods; each markerlisted could be graded indicating the level of validation: for ex-ample, “0” for a newly discovered putative biomarker, “1” fora biomarker with analytic validation including kinetics in thesample type of interest, “2” for a biomarker also validated in acontrolled dietary intervention studies as well as in cross-sectionalstudies, and “3” for a biomarker also confirmed to be in ac-cordance with other markers for the same food or foods.
Training
Finally, education and training in the food metabolome alsorepresent an effort that needs to be shared at all levels, fromcreating the basic training texts to specialized courses at severalacademic levels. Several training workshops on metabolomicsand nutrition were supported by the Nutrigenomics Organization(112). However, more sustained and focused support is needed tobring the field of food metabolome research to maturity.
CONCLUSIONS
Recent analyses of the food metabolome with modern analyticand bioinformatic tools have shown the considerable extent ofinformation on dietary exposure contained in human biospeci-mens. Some proof-of-principle studies have established thefeasibility of metabolomic approaches to identify novel dietarybiomarkers and suggest that these approaches could greatlyexpand the field of molecular nutritional epidemiology and
contribute to future progress in nutrition research. Propositionsmade here to define common objectives and priorities, optimizestudy designs, develop databases and software tools, and promotesharing of data and resources should contribute to bringing thisemerging field to maturity. A dialogue between nutritionists,epidemiologists, analysts, chemometricians, statisticians, andbioinformaticians has just begun. It will be essential to buildmultidisciplinary projects and make sure that the design of futurestudies is defined and optimized to answer to nutritionists’ andepidemiologists’ most urgent needs for biomarkers. Majorprogress in assessing complex dietary exposures at the indi-vidual level is expected from these biomarkers. They should alsosignificantly contribute to a better understanding of the complexinteractions between diet and human health.
We thank Mazda Jenab (International Agency for Research on Cancer,
Lyon) for helpful comments on the manuscript. We also thank all of the par-
ticipants in the First International Workshop on the Food Metabolome for
their active participation in the discussions from which many of the recom-
mendations presented in this article were derived.
The authors’ responsibilities were as follows—AS, CM, JD, and LB:
contributed to the conception and design of the manuscript; and AS provided
extensive feedback concerning all versions of the manuscript and had pri-
mary responsibility for final content. All of the authors contributed to the
writing of separate sections of the manuscript and reviewed and edited all
versions of the manuscript. All of the authors read and approved the final
manuscript. None of the authors had a conflict of interest.
REFERENCES1. Doets EL, de Wit LS, Dhonukshe-Rutten RAM, Cavelaars A, Raats
MM, Timotijevic L, Brzozowska A, Wijnhoven TMA, Pavlovic M,Totland TH, et al. Current micronutrient recommendations in Europe:towards understanding their differences and similarities. Eur J Nutr2008;47:17–40.
2. Dunn WB, Broadhurst DI, Atherton HJ, Goodacre R, Griffin JL.Systems level studies of mammalian metabolomes: the roles of massspectrometry and nuclear magnetic resonance spectroscopy. ChemSoc Rev 2011;40:387–426.
3. Wild CP, Scalbert A, Herceg Z. Measuring the exposome: a powerfulbasis for evaluating environmental exposures and cancer risk. EnvironMol Mutagen 2013;54:480–99.
4. Rezzi S, Ramadan Z, Fay LB, Kochhar S. Nutritional metabonomics:applications and perspectives. J Proteome Res 2007;6:513–25.
5. Wishart DS. Metabolomics: applications to food science and nutritionresearch. Trends Food Sci Technol 2008;19:482–93.
6. Manach C, Hubert J, Llorach R, Scalbert A. The complex links be-tween dietary phytochemicals and human health deciphered by me-tabolomics. Mol Nutr Food Res 2009;53:1303–15.
7. Fardet A, Llorach R, Orsoni A, Martin JF, Pujos-Guyot E, Lapierre C,Scalbert A. Metabolomics provide new insights on the metabolism ofdietary phytochemicals in rats. J Nutr 2008;138:1282–7.
8. Cevallos-Cevallos JM, Reyes-De-Corcuera JI, Etxeberria E, DanylukMD, Rodrick GE. Metabolomic analysis in food science: a review.Trends Food Sci Technol 2009;20:557–66.
9. Wishart DS, Jewison T, Guo AC, Wilson M, Knox C, Liu Y,Djoumbou Y, Mandal R, Aziat F, Dong E, et al. HMDB 3.0—theHuman Metabolome Database in 2013. Nucleic Acids Res 2013;41(Database issue):D801–7.
10. Rutishauser IHE. Dietary intake measurements. Public Health Nutr2005;8:1100–7.
11. Bingham S, Luben R, Welch A, Tasevska N, Wareham N, Khaw KT.Epidemiologic assessment of sugars consumption using biomarkers:comparisons of obese and nonobese individuals in the EuropeanProspective Investigation of Cancer Norfolk. Cancer Epidemiol Bio-markers Prev 2007;16:1651–4.
12. Marshall JR, Chen Z. Diet and health risk: risk patterns and disease-specific associations. Am J Clin Nutr 1999;69:1351S–6S.
THE FOOD METABOLOME: A WINDOW OVER DIETARY EXPOSURE 1303
by guest on June 14, 2016ajcn.nutrition.org
Dow
nloaded from
13. Jenab M, Slimani N, Bictash M, Ferrari P, Bingham SA. Biomarkersin nutritional epidemiology: applications, needs and new horizons.Hum Genet 2009;125:507–25.
14. Potischman N, Freudenheim JL. Biomarkers of nutritional exposureand nutritional status: an overview. J Nutr 2003;133(suppl):873S–4S.
15. London SJ, Yuan JM, Chung FL, Gao YT, Coetzee GA, Ross RK, YuMC. Isothiocyanates, glutathione S-transferase M1 and T1 poly-morphisms, and lung-cancer risk: a prospective study of men inShanghai, China. Lancet 2000;356:724–9.
16. Kensler TW, Roebuck BD, Wogan GN, Groopman JD. Aflatoxin:a 50-year odyssey of mechanistic and translational toxicology. Tox-icol Sci 2011;120:S28–48.
17. Baldrick FR, Woodside JV, Elborn JS, Young IS, McKinley MC.Biomarkers of fruit and vegetable intake in human interventionstudies: a systematic review. Crit Rev Food Sci Nutr 2011;51:795–815.
18. Mennen LI, Sapinho D, Ito H, Galan P, Hercberg S, Scalbert A.Urinary flavonoids and phenolic acids as biomarkers of intake forpolyphenol-rich foods. Br J Nutr 2006;96:191–8.
19. Ross AB, Bourgeois A, Macharia HN, Kochhar S, Jebb SA, BrownleeIA, Seal CJ. Plasma alkylresorcinols as a biomarker of whole-grainfood consumption in a large population: results from the WHOLE-heart Intervention Study. Am J Clin Nutr 2012;95:204–11.
20. Andersson A, Marklund M, Diana M, Landberg R. Plasma alkylre-sorcinol concentrations correlate with whole grain wheat and rye in-take and show moderate reproducibility over a 2-to 3-month period infree-living Swedish adults. J Nutr 2011;141:1712–8.
21. Verkasalo PK, Appleby PN, Allen NE, Davey G, Adlercreutz H, KeyTJ. Soya intake and plasma concentrations of daidzein and genistein:validity of dietary assessment among eighty British women (Oxfordarm of the European Prospective Investigation into Cancer and Nu-trition). Br J Nutr 2001;86:415–21.
22. Allen NE, Grace PB, Ginn A, Travis RC, Roddam AW, Appleby PN,Key T. Phytanic acid: measurement of plasma concentrations bygas-liquid chromatography-mass spectrometry analysis and associ-ations with diet and other plasma fatty acids. Br J Nutr 2008;99:653–9.
23. Myint T, Fraser GE, Lindsted KD, Knutsen SF, Hubbard RW, BennettHW. Urinary 1-methylhistidine is a marker of meat consumption inblack and in white California Seventh-day Adventists. Am J Epi-demiol 2000;152:752–5.
24. Arsenault LN, Matthan N, Scott TM, Dallal G, Lichtenstein AH,Folstein MF, Rosenberg I, Tucker KL. Validity of estimated dietaryeicosapentaenoic acid and docosahexaenoic acid intakes determinedby interviewer-administered food frequency questionnaire amongolder adults with mild-to-moderate cognitive impairment or dementia.Am J Epidemiol 2009;170:95–103.
25. Hodgson JM, Chan SY, Puddey IB, Devine A, Wattanapenpaiboon N,Wahlqvist ML, Lukito W, Burke V, Ward NC, Prince RL, et al.Phenolic acid metabolites as biomarkers for tea- and coffee-derivedpolyphenol exposure in human subjects. Br J Nutr 2004;91:301–6.
26. Brantsaeter AL, Haugen M, Julshamn K, Alexander J, Meltzer HM.Evaluation of urinary iodine excretion as a biomarker for intake ofmilk and dairy products in pregnant women in the Norwegian Motherand Child Cohort Study (MoBa). Eur J Clin Nutr 2009;63:347–54.
27. Turunen AW, Mannisto S, Kiviranta H, Marniemi J, Jula A, Tiittanen P,Suominen-Taipale L, Vartiainen T, Verkasalo PK. Dioxins, polychlori-nated biphenyls, methyl mercury and omega-3 polyunsaturated fatty acidsas biomarkers of fish consumption. Eur J Clin Nutr 2010;64:313–23.
28. Kroke A, Klipstein-Grobusch K, Hoffmann K, Terbeck I, Boeing H,Helander A. Comparison of self-reported alcohol intake withthe urinary excretion of 5-hydroxytryptophol: 5-hydroxyindole-3-acetic acid, a biomarker of recent alcohol intake. Br J Nutr 2001;85:621–7.
29. Crews H, Alink G, Andersen R, Braesco V, Holst B, Maiani G,Ovesen L, Scotter M, Solfrizzo M, van den Berg R, et al. A criticalassessment of some biomarker approaches linked with dietary intake.Br J Nutr 2001;86(suppl 1):S5–35.
30. Vioque J, Weinbrenner T, Asensio L, Castello A, Young IS, FletcherA. Plasma concentrations of carotenoids and vitamin C are bettercorrelated with dietary intake in normal weight than overweight andobese elderly subjects. Br J Nutr 2007;97:977–86.
31. Brown MJ, Ferruzzi MG, Nguyen ML, Cooper DA, Eldridge AL,Schwartz SJ, White WS. Carotenoid bioavailability is higher from saladsingested with full-fat than with fat-reduced salad dressings as measuredwith electrochemical detection. Am J Clin Nutr 2004;80:396–403.
32. Albanes D, Virtamo J, Taylor PR, Rautalahti M, Pietinen P, HeinonenOP. Effects of supplemental beta-carotene, cigarette smoking, and al-cohol consumption on serum carotenoids in the Alpha-Tocopherol, Beta-Carotene Cancer Prevention Study. Am J Clin Nutr 1997;66:366–72.
33. Zamora-Ros R, Touillaud M, Rothwell JA, Romieu I, Scalbert A.Measuring exposure to the polyphenol metabolome in epidemiolog-ical studies: current tools, applications and their limits. Am J ClinNutr (in press).
34. Manach C, Williamson G, Morand C, Scalbert A, Remesy C. Bio-availability and bioefficacy of polyphenols in humans. I. Review of 97bioavailability studies. Am J Clin Nutr 2005;81:230S–42S.
35. Soderholm PP, Koskela AH, Lundin JE, Tikkanen MJ, AdlercreutzHC. Plasma pharmacokinetics of alkylresorcinol metabolites: newcandidate biomarkers for whole-grain rye and wheat intake. Am JClin Nutr 2009;90:1167–71.
36. Burri BJ, Neidlinger TR, Clifford AJ. Serum carotenoid depletionfollows first-order kinetics in healthy adult women fed naturally lowcarotenoid diets. J Nutr 2001;131:2096–100.
37. Kumar A, Vineis P, Sacerdote C, Fiorini L, Sabbioni G. De-termination of new biomarkers to monitor the dietary consumption ofisothiocyanates. Biomarkers 2010;15:739–45.
38. Outzen M, Egeberg R, Dragsted L, Christensen J, Olesen PT, FrandsenH, Overvad K, Tjonneland A, Olsen A. Dietary determinants for Hb-acrylamide and Hb-glycidamide adducts in Danish non-smokingwomen. Br J Nutr 2011;105:1381–7.
39. Grigoryan H, Li H, Iavarone AT, Williams ER, Rappaport SM. Cys34adducts of reactive oxygen species in human serum albumin. ChemRes Toxicol 2012;25:1633–42.
40. Rappaport SM, Li H, Grigoryan H, Funk WE, Williams ER. Ad-ductomics: characterizing exposures to reactive electrophiles. ToxicolLett 2012;213:83–90.
41. Perez-Jimenez J, Hubert J, Ashton K, Hooper L, Cassidy A, ManachC, Williamson G, Scalbert A. Urinary metabolites as biomarkers ofpolyphenol intake in humans—a systematic review. Am J Clin Nutr2010;92:801–9.
42. Levine M, Conry-Cantilena C, Wang Y, Welch RW, Washko PW,Dhariwal KR, Park JB, Lazarev A, Graumlich JF, King J, et al. VitaminC pharmacokinetics in healthy volunteers: evidence for a recommendeddietary allowance. Proc Natl Acad Sci USA 1996;93:3704–9.
43. Pirro V, Valente V, Oliveri P, De Bernardis A, Salomone A, VincentiM. Chemometric evaluation of nine alcohol biomarkers in a largepopulation of clinically-classified subjects: pre-eminence of ethylglucuronide concentration in hair for confirmatory classification. AnalBioanal Chem 2011;401:2153–64.
44. Lloyd AJ, Beckmann M, Fave G, Mathers JC, Draper J. Proline be-taine and its biotransformation products in fasting urine samples arepotential biomarkers of habitual citrus fruit consumption. Br J Nutr2011;106:812–24.
45. Al-Delaimy WK, Ferrari P, Slimani N, Pala V, Johansson I, Nilsson S,Mattisson I, Wirfalt E, Galasso R, Palli D, et al. Plasma carotenoids asbiomarkers of intake of fruits and vegetables: individual-level corre-lations in the European Prospective Investigation into Cancer andNutrition (EPIC). Eur J Clin Nutr 2005;59:1387–96.
46. Scalbert A, Manach C, Morand C, Remesy C, Jimenez L. Dietarypolyphenols and the prevention of diseases. Crit Rev Food Sci Nutr2005;45:287–306.
47. Medina-Remon A, Zamora-Ros R, Rotches-Ribalta M, Andres-LacuevaC, Martınez-Gonzalez MA, Covas MI, Corella D, Salas-Salvado J,Gomez-Gracia E, Ruiz-Gutierrez V, et al. Total polyphenol excretionand blood pressure in subjects at high cardiovascular risk. Nutr MetabCardiovasc Dis 2011;21:323–31.
48. Ross AB, Shepherd MJ, Schupphaus M, Sinclair V, Alfaro B,Kamal-Eldin A, Aman P. Alkylresorcinols in cereals and cerealproducts. J Agric Food Chem 2003;51:4111–8.
49. Pujos-Guillot E, Hubert J, Martin J-F, Lyan B, Quintana M, Claude S,Chabanas B, Rothwell JA, Bennetau-Pelissero C, Scalbert A, et al.Mass spectrometry-based metabolomics for the discovery of bio-markers of fruit and vegetable intake: citrus fruit as a case study.J Proteome Res 2013;12:1645–59.
1304 SCALBERT ET AL
by guest on June 14, 2016ajcn.nutrition.org
Dow
nloaded from
50. van der Werf MJ, Overkamp KM, Muilwijk B, Coulier L, HankemeierT. Microbial metabolomics: toward a platform with full metabolomecoverage. Anal Biochem 2007;370:17–25.
51. Bais P, Moon SM, He K, Leitao R, Dreher K, Walk T, Sucaet Y,Barkan L, Wohlgemuth G, Roth MR, et al. PlantMetabolomics.org:a web portal for plant metabolomics experiments. Plant Physiol 2010;152:1807–16.
52. Wishart DS. Human Metabolome Database: completing the ’humanparts list’. Pharmacogenomics 2007;8:683–6.
53. Takeda I, Stretch C, Barnaby P, Bhatnager K, Rankin K, Fu H, WeljieA, Jha N, Slupsky C. Understanding the human salivary metabolome.NMR Biomed 2009;22:577–84.
54. Psychogios N, Hau DD, Peng J, Guo AC, Mandal R, Bouatra S,Sinelnikov I, Krishnamurthy R, Eisner R, Gautam B, et al. The humanserum metabolome. PLoS ONE 2011;6:e16957.
55. Solanky KS, Bailey NJ, Beckwith-Hall BM, Bingham S, Davis A,Holmes E, Nicholson JK, Cassidy A. Biofluid 1H NMR-based me-tabonomic techniques in nutrition research—metabolic effects of di-etary isoflavones in humans. J Nutr Biochem 2005;16:236–44.
56. Tulipani S, Llorach R, Jauregui O, Lopez-Uriarte P, Garcia-Aloy M,Bullo M, Salas-Salvado J, Andres-Lacueva C. Metabolomics unveilsurinary changes in subjects with metabolic syndrome following12-week nut consumption. J Proteome Res 2011;10:5047–58.
57. Cross AJ, Major JM, Sinha R. Urinary biomarkers of meat con-sumption. Cancer Epidemiol Biomarkers Prev 2011;20:1107–11.
58. Van Dorsten FA, Daykin CA, Mulder TPJ, Van Duynhoven JPM.Metabonomics approach to determine metabolic differences betweengreen tea and black tea consumption. J Agric Food Chem 2006;54:6929–38.
59. Holmes E, Loo RL, Stamler J, Bictash M, Yap IKS, Chan Q, Ebbels T,De Iorio M, Brown IJ, Veselkov KA, et al. Human metabolic phe-notype diversity and its association with diet and blood pressure.Nature 2008;453:396–400.
60. Slupsky CM, Rankin KN, Wagner J, Fu H, Chang D, Weljie AM,Saude EJ, Lix B, Adamko DJ, Shah S, et al. Investigations of theeffects of gender, diurnal variation, and age in human urinary me-tabolomic profiles. Anal Chem 2007;79:6995–7004.
61. Krug S, Kastenmueller G, Stueckler F, Rist MJ, Skurk T, Sailer M,Raffler J, Roemisch-Margl W, Adamski J, Prehn C, et al. The dynamicrange of the human metabolome revealed by challenges. FASEB J2012;26:2607–19.
62. Heinzmann SS, Merrifield CA, Rezzi S, Kochhar S, Lindon JC,Holmes E, Nicholson JK. Stability and robustness of human meta-bolic phenotypes in response to sequential food challenges. J Pro-teome Res 2012;11:643–55.
63. Smith CA, O’Maille G, Want EJ, Qin C, Trauger SA, Brandon TR,Custodio DE, Abagyan R, Siuzdak G. METLIN—a metabolite massspectral database. Ther Drug Monit 2005;27:747–51.
64. Fiehn O. Metabolomics—the link between genotypes and phenotypes.Plant Mol Biol 2002;48:155–71.
65. Iijima Y, Nakamura Y, Ogata Y, Tanaka K, Sakurai N, Suda K, SuzukiT, Suzuki H, Okazaki K, Kitayama M, et al. Metabolite annotations basedon the integration of mass spectral information. Plant J 2008;54:949–62.
66. Guo AC, Jewison T, Wilson M, Liu Y, Knox C, Djoumbou Y, Lo P,Mandal R, Krishnamurthy R, Wishart DS. ECMDB: the E-coli Me-tabolome Database. Nucleic Acids Res 2013;41:D625–30.
67. Nicholson JK, Holmes E, Kinross J, Burcelin R, Gibson G, Jia W,Pettersson S. Host-gut microbiota metabolic interactions. Science2012;336:1262–7.
68. Testa B, Pedretti A, Vistoli G. Foundation review: reactions and en-zymes in the metabolism of drugs and other xenobiotics. Drug DiscovToday 2012;17:549–60.
69. Langowski J, Long A. Computer systems for the prediction of xe-nobiotic metabolism. Adv Drug Deliv Rev 2002;54:407–15.
70. Rothwell JR, Urpi-Sarda M, Boto-Ordonez M, Knox C, Llorach R,Eisner R, Cruz J, Neveu V, Wishart D, Manach C, et al. Phenol-Explorer2.0: a major update of the Phenol-Explorer database integrating dataon polyphenol metabolism and pharmacokinetics in humans and ex-perimental animals. Database 2012;2012:bas031.
71. Silberberg M, Morand C, Mathevon T, Besson C, Manach C, ScalbertA, Remesy C. The bioavailability of polyphenols is highly governedby the capacity of the intestine and of the liver to secrete conjugatedmetabolites. Eur J Nutr 2006;45:88–96.
72. Peris-Bondia F, Latorre A, Artacho A, Moya A, D’Auria G. Theactive human gut microbiota differs from the total microbiota. PLoSONE 2011;6:e22448.
73. Moco S, Martin F-P, Rezzi S. A metabolomics view on gut micro-biome modulation by polyphenol-rich foods. J Proteome Res 2012;11:4781–90.
74. Arumugam M, Raes J, Pelletier E, Le Paslier D, Yamada T, MendeDR, Fernandes GR, Tap J, Bruls T, Batto J-M, et al. Enterotypes of thehuman gut microbiome. Nature 2011;473:174–80.
75. Jewison T, Knox C, Neveu V, Djoumbou Y, Guo AC, Lee J, Liu P,Mandal R, Krishnamurthy R, Sinelnikov I, et al. YMDB: the YeastMetabolome Database. Nucleic Acids Res 2012;40:D815–20.
76. Wishart DS. Systems biology resource arising from the Human Me-tabolome Project. In: Suhre K, ed. Genetics meets metabolomics.New York, NY: Springer, 2012:157–75.
77. Institut National de la Recherche Agronomique. PhytoHub. Availablefrom: www.phytohub.eu (cited 3 September 2013).
78. University of Alberta. FooDB: the food component database. Avail-able from: http://www.foodb.ca/ (cited 3 September 2013).
79. Chajes V, Biessy C, Byrnes G, Deharveng G, Saadatian-Elahi M,Jenab M, Peeters PHM, Ocke M, Bueno-de-Mesquita HB, JohanssonI, et al. Ecological-level associations between highly processed foodintakes and plasma phospholipid elaidic acid concentrations: resultsfrom a cross-sectional study within the European Prospective In-vestigation into Cancer and Nutrition (EPIC). Nutr Cancer 2011;63:1235–50.
80. Heinzmann SS, Brown IJ, Chan Q, Bictash M, Dumas M-E, KochharS, Stamler J, Holmes E, Elliott P, Nicholson JK. Metabolic profilingstrategy for discovery of nutritional biomarkers: proline betaine asa marker of citrus consumption. Am J Clin Nutr 2010;92:436–43.
81. Andersen MB, Kristensen M, Manach C, Pujos-Guillot E, PoulsenSK, Larsen TM, Astrup A, Dragsted L. Discovery and validation ofurinary exposure markers for different plant foods by untargetedmetabolomics. Anal Bioanal Chem 2014;406:1829–44.
82. Lloyd AJ, Fave G, Beckmann M, Lin W, Tailliart K, Xie L, MathersJC, Draper J. Use of mass spectrometry fingerprinting to identifyurinary metabolites after consumption of specific foods. Am J ClinNutr 2011;94:981–91.
83. O’Sullivan A, Gibney MJ, Brennan L. Dietary intake patterns arereflected in metabolomic profiles: potential role in dietary assessmentstudies. Am J Clin Nutr 2011;93:314–21.
84. Edmands WMB, Beckonert OP, Stella C, Campbell A, Lake BG,Lindon JC, Holmes E, Gooderham NJ. Identification of human uri-nary biomarkers of cruciferous vegetable consumption by metabo-nomic profiling. J Proteome Res 2011;10:4513–21.
85. Andersen M-B, Reinbach H, Rinnan A, Barri T, Mithril C, DragstedL. Discovery of exposure markers in urine for Brassica-containingmeals served with different protein sources by UPLC-qTOF-MS un-targeted metabolomics. Metabolomics 2013;9:984–97.
86. Bondia-Pons I, Barri T, Hanhineva K, Juntunen K, Dragsted LO,Mykkanen H, Poutanen K. UPLC-QTOF/MS metabolic profiling un-veils urinary changes in humans after a whole grain rye versus refinedwheat bread intervention. Mol Nutr Food Res 2013;57:412–22.
87. Lloyd AJ, Beckmann M, Haldar S, Seal C, Brandt K, Draper J. Data-driven strategy for the discovery of potential urinary biomarkers ofhabitual dietary exposure. Am J Clin Nutr 2013;97:377–89.
88. Lang R, Wahl A, Stark T, Hofmann T. Urinary N-methylpyridiniumand trigonelline as candidate dietary biomarkers of coffee consump-tion. Mol Nutr Food Res 2011;55:1613–23.
89. Wang Y, Tang H, Nicholson JK, Hylands PJ, Sampson J, Holmes E. Ametabonomic strategy for the detection of the metabolic effects ofchamomile (Matricaria recutita L.) ingestion. J Agric Food Chem2005;53:191–6.
90. Daykin CA, Van Duynhoven JP, Groenewegen A, Dachtler M, VanAmelsvoort JM, Mulder TP. Nuclear magnetic resonance spectro-scopic based studies of the metabolism of black tea polyphenols inhumans. J Agric Food Chem 2005;53:1428–34.
91. Law WS, Huang PY, Ong ES, Ong CN, Li SF, Pasikanti KK, ChanEC. Metabonomics investigation of human urine after ingestion ofgreen tea with gas chromatography/mass spectrometry, liquid chro-matography/mass spectrometry and (1)H NMR spectroscopy. RapidCommun Mass Spectrom 2008;22:2436–46.
92. van Velzen EJ, Westerhuis JA, van Duynhoven JP, van Dorsten FA,Grun CH, Jacobs DM, Duchateau GS, Vis DJ, Smilde AK.
THE FOOD METABOLOME: A WINDOW OVER DIETARY EXPOSURE 1305
by guest on June 14, 2016ajcn.nutrition.org
Dow
nloaded from
Phenotyping tea consumers by nutrikinetic analysis of polyphenolicend-metabolites. J Proteome Res 2009;8:3317–30.
93. van Dorsten FA, Grun CH, van Velzen EJJ, Jacobs DM, Draijer R, vanDuynhoven JPM. The metabolic fate of red wine and grape juicepolyphenols in humans assessed by metabolomics. Mol Nutr FoodRes 2010;54:897–908.
94. Jacobs DM, Fuhrmann JC, van Dorsten FA, Rein D, Peters S, vanVelzen EJJ, Hollebrands B, Draijer R, van Duynhoven J, Garczarek U.Impact of short-term intake of red wine and grape polyphenol extracton the human metabolome. J Agric Food Chem 2012;60:3078–85.
95. Vazquez-Fresno R, Llorach R, Alcaro F, Rodriguez MA, Vinaixa M,Chiva-Blanch G, Estruch R, Correig X, Andres-Lacueva C. 1H-NMR-based metabolomic analysis of the effect of moderate wine con-sumption on subjects with cardiovascular risk factors. Electrophoresis2012;33:2345–54.
96. Llorach R, Urpi-Sarda M, Jauregui O, Monagas M, Andres-LacuevaC. An LC-MS-based metabolomics approach for exploring urinarymetabolome modifications after cocoa consumption. J Proteome Res2009;8:5060–8.
97. Llorach R, Urpi-Sarda M, Tulipani S, Garcia-Aloy M, Monagas M,Andres-Lacueva C. Metabolomic fingerprint in patients at high risk ofcardiovascular disease by cocoa intervention. Mol Nutr Food Res2013;57:962–73.
98. Llorach R, Garrido I, Monagas MA, Urpi-Sarda M, Tulipani S,Bartolome BA, Andres-Lacueva C. Metabolomics study of human uri-nary metabolome modifications after intake of almond (Prunus dulcis(Mill.) D.A. Webb) skin polyphenols. J Proteome Res 2010;9:5859–67.
99. Rasmussen LG, Winning H, Savorani F, Ritz C, Engelsen SB, AstrupA, Larsen TM, Dragsted LO. Assessment of dietary exposure relatedto dietary GI and fibre intake in a nutritional metabolomic study ofhuman urine. Genes Nutr 2012;7:281–93.
100. Johansson-Persson A, Barri T, Ulmius M, Onning G, Dragsted LO.LC-QTOF/MS metabolomic profiles in human plasma after a 5-weekhigh dietary fiber intake. Anal Bioanal Chem 2013;405:4799–809.
101. Stanstrup J, Rasmussen J, Ritz C, Holmer-Jensen J, Hermansen K,Dragsted L. Intakes of whey protein hydrolysate and whole wheyproteins are discriminated by LC-MS metabolomics. Metabolomics2013;Nov 17 (Epub ahead of print; DOI 10.1007/s11306-013-0607-9).
102. Stella C, Beckwith-Hall B, Cloarec O, Holmes E, Lindon JC, PowellJ, van der Ouderaa F, Bingham S, Cross AJ, Nicholson JK. Suscep-tibility of human metabolic phenotypes to dietary modulation.J Proteome Res 2006;5:2780–8.
103. Bertram HC, Hoppe C, Petersen BO, Duus JO, Molgaard C,Michaelsen KF. An NMR-based metabonomic investigation on effectsof milk and meat protein diets given to 8-year-old boys. Br J Nutr2007;97:758–63.
104. Xu J, Yang S, Cai S, Dong J, Li X, Chen Z. Identification of bio-chemical changes in lactovegetarian urine using 1H NMR spectros-copy and pattern recognition. Anal Bioanal Chem 2010;396:1451–63.
105. May DH, Navarro SL, Ruczinski I, Hogan J, Ogata Y, Schwarz Y,Levy L, Holzman T, McIntosh MW, Lampe JW. Metabolomic pro-filing of urine: response to a randomised, controlled feeding study ofselect fruits and vegetables, and application to an observational study.Br J Nutr 2013;110:1760–70.
106. Andersen MB, Rinnan A, Manach C, Poulsen SK, Pujos-Guillot E,Larsen TM, Astrup A, Dragsted LO. Untargeted metabolomics asa screening tool for estimating compliance to a dietary pattern.J Proteome Res 2014;13:1405–18.
107. Svensson BG, Akesson B, Nilsson A, Paulsson K. Urinary excretionof methylamines in men with varying intake of fish from the BalticSea. J Toxicol Environ Health 1994;41:411–20.
108. Koeth RA, Wang Z, Levison BS, Buffa JA, Org E, Sheehy BT, BrittEB, Fu X, Wu Y, Li L, et al. Intestinal microbiota metabolism ofl-carnitine, a nutrient in red meat, promotes atherosclerosis. Nat Med2013;19:576–85.
109. Altmaier E, Kastenmuller G, Romisch-Margl W, Thorand B, WeinbergerKM, Illig T, Adamski J, Doring A, Suhre K. Questionnaire-based self-reported nutrition habits associate with serum metabolism as revealed byquantitative targeted metabolomics. Eur J Epidemiol 2011;26:145–56.
110. Sumner LW, Amberg A, Barrett D, Beale M, Beger R, Daykin C, FanT, Fiehn O, Goodacre R, Griffin J, et al. Proposed minimum reportingstandards for chemical analysis. Metabolomics 2007;3:211–21.
111. Theodoridis G, Gika HG, Wilson ID. LC-MS-based methodology forglobal metabolite profiling in metabonomics/metabolomics. TrendsAnalyt Chem 2008;27:251–60.
112. Scalbert A, Brennan L, Fiehn O, Hankemeier T, Kristal BS,van Ommen B, Pujos-Guyot E, Verheij E, Wishart D, Wopereis S.Mass-spectrometry-based metabolomics: limitations and recommen-dations for future progress with particular focus on nutrition research.Metabolomics 2009;5:435–58.
113. Issaq HJ, Van QN, Waybright TJ, Muschik GM, Veenstra TD. Ana-lytical and statistical approaches to metabolomics research. J Sep Sci2009;32:2183–99.
114. Beckmann M, Lloyd AJ, Haldar S, Seal C, Brandt K, Draper J.Hydroxylated phenylacetamides derived from bioactive benzox-azinoids are bioavailable in humans after habitual consumption ofwhole grain sourdough rye bread. Mol Nutr Food Res 2013;57:1859–73.
115. He X, Kozak M, Nimkar S. Ultra-sensitive measurements of11-nor-delta(9)-tetrahydrocannabinol-9-carboxylic acid in oral fluidby microflow liquid chromatography-tandem mass spectrometry us-ing a benchtop quadrupole/Orbitrap mass spectrometer. Anal Chem2012;84:7643–7.
116. Barri T, Holmer-Jensen J, Hermansen K, Dragsted LO. Metabolicfingerprinting of high-fat plasma samples processed by centrifuga-tion- and filtration-based protein precipitation delineates significantdifferences in metabolite information coverage. Anal Chim Acta2012;718:47–57.
117. Gika HG, Theodoridis GA, Earll M, Snyder RW, Sumner SJ, WilsonID. Does the mass spectrometer define the marker? A comparison ofglobal metabolite profiling data generated simultaneously via UPLC-MS on two different mass spectrometers. Anal Chem 2010;82:8226–34.
118. Guo B, Chen B, Liu AM, Zhu WT, Yao SZ. Liquid chromatography-mass spectrometric multiple reaction monitoring-based strategies forexpanding targeted profiling towards quantitative metabolomics. CurrDrug Metab 2012;13:1226–43.
119. Katajamaa M, Oresic M. Data processing for mass spectrometry-based metabolomics. J Chromatogr A 2007;1158:318–28.
120. Sugimoto M, Kawakami M, Robert M, Soga T, Tomita M. bio-informatics tools for mass spectroscopy-based metabolomic dataprocessing and analysis. Current Bioinformatics 2012;7:96–108.
121. Savorani F, Kristensen M, Larsen FH, Astrup A, Engelsen SB. Highthroughput prediction of chylomicron triglycerides in human plasmaby nuclear magnetic resonance and chemometrics. Nutr Metab (Lond)2010;7:43.
122. Smith CA, Want EJ, O’Maille G, Abagyan R, Siuzdak G. XCMS:processing mass spectrometry data for metabolite profiling usingnonlinear peak alignment, matching, and identification. Anal Chem2006;78:779–87.
123. Pluskal T, Castillo S, Villar-Briones A, Oresic M. MZmine 2: Mod-ular framework for processing, visualizing, and analyzing massspectrometry-based molecular profile data. BMC Bioinformatics2010;11:395.
124. Lommen A, Kools HJ. MetAlign 3.0: performance enhancement byefficient use of advances in computer hardware. Metabolomics 2012;8:719–26.
125. Gurdeniz G, Kristensen M, Skov T, Dragsted LO. The effect of LC-MS data preprocessing methods on the selection of plasma bio-markers in fed vs. fasted rats. Metabolites 2012;2:77–99.
126. Kristensen M, Engelsen SB, Dragsted LO. LC-MS metabolomics top-down approach reveals new exposure and effect biomarkers of appleand apple-pectin intake. Metabolomics 2012;8:64–73.
127. Worley B, Halouska S, Powers R. Utilities for quantifying separationin PCA/PLS-DA scores plots. Anal Biochem 2013;433:102–4.
128. Acar E, Gurdeniz G, Rasmussen MA, Rago D, Dragsted LO, Bro R.Coupled matrix factorization with sparse factors to identify potentialbiomarkers in metabolomics. Int J Knowledge Discov Bioinformatics2012;3:1–22.
129. Gurdeniz G, Hansen L, Rasmussen M, Acar E, Olsen A, ChristensenJ, Barri T, Tjønneland A, Dragsted L. Patterns of time since last mealrevealed by sparse PCA in an observational LC-MS based metab-olomics study. Metabolomics 2013;9:1073–81.
130. Hanhineva K, Barri T, Kolehmainen M, Pekkinen J, Pihlajamaki J,Vesterbacka A, Solano-Aguilar G, Mykkanen H, Dragsted LO, UrbanJF Jr, et al. Comparative nontargeted profiling of metabolic changes in
1306 SCALBERT ET AL
by guest on June 14, 2016ajcn.nutrition.org
Dow
nloaded from
tissues and biofluids in high-fat diet-fed Ossabaw pig. J Proteome Res2013;12:3980–92.
131. Kjeldahl K, Bro R. Some common misunderstandings in chemo-metrics. J Chemometr 2010;24:558–64.
132. Wold S, Martens H, Wold H, Ruhe A, Kagstrøm B, eds. The multi-variate calibration problem in chemistry solved by the PLS methods.In: Ruhe A, Kagstrøm B, eds. Proceedings of the Conference onMatrix Pencils, Lecture Notes in Mathematics. Heidelberg, Germany:Springer Verlag, 1983:286–93.
133. Smilde AK, Jansen JJ, Hoefsloot HCJ, Lamers R, van der Greef J,Timmerman ME. ANOVA-simultaneous component analysis (AS-CA): a new tool for analyzing designed metabolomics data. Bio-informatics 2005;21:3043–8.
134. Rago D, Mette K, Gurdeniz G, Marini F, Poulsen M, Dragsted L. ALC-MS metabolomics approach to investigate the effect of raw appleintake in the rat plasma metabolome. Metabolomics 2013;9:1202–15.
135. van Velzen EJJ, Westerhuis JA, van Duynhoven JPM, van Dorsten FA,Hoefsloot HCJ, Jacobs DM, Smit S, Draijer R, Kroner CI, SmildeAK. Multilevel data analysis of a crossover designed human nutri-tional intervention study. J Proteome Res 2008;7:4483–91.
136. Hochberg Y, Benjamini Y. More powerful procedures for multiplesignificance testing. Stat Med 1990;9:811–8.
137. Benjamini Y, Heller R, Yekutieli D. Selective inference in complexresearch. Philos Trans A Math Phys Eng Sci 2009;367:4255–71.
138. Xia J, Broadhurst D, Wilson M, Wishart D. Translational biomarkerdiscovery in clinical metabolomics: an introductory tutorial. Metab-olomics 2013;9:280–99.
139. Del Rio D, Rodriguez-Mateos A, Spencer JPE, Tognolini M, BorgesG, Crozier A. Dietary (poly)phenolics in human health: structures,bioavailability, and evidence of protective effects against chronicdiseases. Antioxid Redox Signal 2013;18:1818–92.
140. van der Hooft JJJ, Vos RCH, Ridder L, Vervoort J, Bino RJ. Structuralelucidation of low abundant metabolites in complex sample matrices.Metabolomics 2013;9:1009–18.
141. Wishart DS. Advances in metabolite identification. Bioanalysis 2011;3:1769–82.
142. Draper J, Enot DP, Parker D, Beckmann M, Snowdon S, Lin W,Zubair H. Metabolite signal identification in accurate mass metab-olomics data with MZedDB, an interactive m/z annotation tool uti-lising predicted ionisation behaviour ’rules’. BMC Bioinformatics2009;10:227.
143. Draper J, Lloyd A, Goodacre R, Beckmann M. Flow infusion electro-spray ionisation mass spectrometry for high throughput, non-targetedmetabolite fingerprinting: a review. Metabolomics 2013;9:4–29.
144. van der Hooft JJJ, Vervoort J, Bino RJ, Beekwilder J, de Vos RCH.Polyphenol identification based on systematic and robust high-resolutionaccurate mass spectrometry fragmentation. Anal Chem 2011;83:409–16.
145. Tikunov YM, Laptenok S, Hall RD, Bovy A, de Vos RCH. MSClust:a tool for unsupervised mass spectra extraction of chromatography-massspectrometry ion-wise aligned data. Metabolomics 2012;8:714–8.
146. Li L, Li R, Zhou J, Zuniga A, Stanislaus AE, Wu Y, Huan T, Zheng J,Shi Y, Wishart DS, et al. MyCompoundID: using an evidence-basedmetabolome library for metabolite identification. Anal Chem 2013;85:3401–8.
147. Gong P, Cui N, Wu L, Liang Y, Hao K, Xu X, Tang W, Wang G, HaoH. Chemicalome and metabolome matching approach to elucidatingbiological metabolic networks of complex mixtures. Anal Chem2012;84:2995–3002.
148. Menikarachchi LC, Hill DW, Hamdalla MA, Mandoiu II, Grant DF. Insilico enzymatic synthesis of a 400,000 compound biochemical databasefor non-targeted metabolomics. J Chem Inf Model 2013;53:2483–92.
149. Tohge T, Fernie AR. Web-based resources for mass-spectrometry-based metabolomics: a user’s guide. Phytochemistry 2009;70:450–6.
150. Scalbert A, Andres-Lacueva C, Arita M, Kroon P, Manach C, Urpi-SardaM, Wishart D. Databases on food phytochemicals and their healthpromoting effects. J Agric Food Chem 2011;59:4331–48.
151. American Chemical Society. SciFinder. Available from: https://scifinder.cas.org (cited 3 September 2013).
152. National Institutes of Standards and Technology. NIST 11 EPA/NIHMass Spectral Database and Search Program (NIST11/NIST08).Available from: http://www.chemsw.com/Software-and-Solutions/Laboratory-Software/NIST-Mass-Spectral-Database/NIST-EPA-NIH-Mass-Spectral-Database.aspx (cited 3 September 2013).
153. Wolf S, Schmidt S, Muller-Hannemann M, Neumann S. In silicofragmentation for computer assisted identification of metabolite massspectra. BMC Bioinformatics 2010;11:148.
154. Rojas-Cherto M, Peironcely JE, Kasper PT, van der Hooft JJJ, De VosRCH, Vreeken RJ, Hankemeier T, Reijmers T. Metabolite identifi-cation using automated comparison of high resolution MSn spectraltrees. Anal Chem 2012;84:5524–34.
155. HighChem. Mass Frontier. Available from: http://www.highchem.com/index.php/massfrontier (cited 3 September 2013).
156. Gerlich M, Neumann S. MetFusion: integration of compound iden-tification strategies. J Mass Spectrom 2013;48:291–8.
157. Stanstrup J, Gerlich M, Dragsted LO, Neumann S. Metabolite pro-filing and beyond: approaches for the rapid processing and annotationof human blood serum mass spectrometry data. Anal Bioanal Chem2013;405:5037–48.
158. Kuhl C, Tautenhahn R, Bottcher C, Larson TR, Neumann S. CAM-ERA: an integrated strategy for compound spectra extraction andannotation of liquid chromatography/mass spectrometry data sets.Anal Chem 2012;84:283–9.
159. Leibniz Institute of Plant Biochemistry. CAMERA annotation of LC/MS data. Available from: http://msbi.ipb-halle.de/msbi/CAMERA(cited 3 September 2013).
160. Matsuda F, Nakabayashi R, Sawada Y, Suzuki M, Hirai MY, KanayaS, Saito K. Mass spectra-based framework for automated structuralelucidation of metabolome data to explore phytochemical diversity.Front Plant Sci 2011;2:40.
161. Stalmach A, Mullen W, Barron D, Uchida K, Yokota T, Cavin C,Steiling H, Williamson G, Crozier A. Metabolite profiling of hy-droxycinnamate derivatives in plasma and urine after the ingestion ofcoffee by humans: identification of biomarkers of coffee consump-tion. Drug Metab Dispos 2009;37:1749–58.
162. Ridder L, van der Hooft JJJ, Verhoeven S, De Vos RCH, Bino RJ,Vervoort J. Automatic chemical structure annotation of an LC-MSnbased metabolic profile from green tea. Anal Chem 2013;85:6033–40.
163. van der Hooft JJJ, de Vos RCH, Mihaleva V, Bino RJ, Ridder L, deRoo N, Jacobs DM, van Duynhoven JPM, Vervoort J. structuralelucidation and quantification of phenolic conjugates present in hu-man urine after tea intake. Anal Chem 2012;84:7263–71.
164. Kirchmair J, Howlett A, Peironcely JE, Murrell DS, Williamson MJ,Adams SE, Hankemeier T, van Buren L, Duchateau G, Klaffke W,et al. How do metabolites differ from their parent molecules and howare they excreted? J Chem Inf Model 2013;53:354–67.
165. Nicholson JK, Holmes E, Elliott P. The Metabolome-Wide Associa-tion Study: a new look at human disease risk factors. J Proteome Res2008;7:3637–8.
166. Bictash M, Ebbels TM, Chan Q, Loo RL, Yap IKS, Brown IJ, de IorioM, Daviglus ML, Holmes E, Stamler J, et al. Opening up the “blackbox”: metabolic phenotyping and metabolome-wide associationstudies in epidemiology. J Clin Epidemiol 2010;63:970–9.
167. Rappaport SM. Biomarkers intersect with the exposome. Biomarkers2012;17:483–9.
168. Saadatian-Elahi M, Slimani N, Chajes V, Jenab M, Goudable J, BiessyC, Ferrari P, Byrnes G, Autier P, Peeters PHM, et al. Plasma phospho-lipid fatty acid profiles and their association with food intakes: resultsfrom a cross-sectional study within the European Prospective In-vestigation into Cancer and Nutrition. Am J Clin Nutr 2009;89:331–46.
169. Chajes V, Jenab M, Romieu I, Ferrari P, Dahm CC, Overvad K,Egeberg R, Tjonneland A, Clavel-Chapelon F, Boutron-Ruault M-C,et al. Plasma phospholipid fatty acid concentrations and risk of gastricadenocarcinomas in the European Prospective Investigation intoCancer and Nutrition (EPIC-EURGAST). Am J Clin Nutr 2011;94:1304–13.
170. Nicholson JK, Holmes E, Wilson ID. Gut microorganisms, mamma-lian metabolism and personalized health care. Nat Rev Microbiol2005;3:431–8.
171. Wang Z, Klipfell E, Bennett BJ, Koeth R, Levison BS, DuGar B,Feldstein AE, Britt EB, Xiaoming F, Yoon-Mi C, et al. Gut florametabolism of phosphatidylcholine promotes cardiovascular disease.Nature 2011;472:57–63.
172. Tang WHW, Wang Z, Levison BS, Koeth RA, Britt EB, Fu X, Wu Y,Hazen SL. Intestinal microbial metabolism of phosphatidylcholineand cardiovascular risk. N Engl J Med 2013;368:1575–84.
173. Lee SM, Kwon GY, Kim K-O, Kim Y-S. Metabolomic approach fordetermination of key volatile compounds related to beef flavor in
THE FOOD METABOLOME: A WINDOW OVER DIETARY EXPOSURE 1307
by guest on June 14, 2016ajcn.nutrition.org
Dow
nloaded from
glutathione-Maillard reaction products. Anal Chim Acta 2011;703:204–11.
174. Mena P, Calani L, Dall’Asta C, Galaverna G, Garcia-Viguera C, BruniR, Crozier A, Del Rio D. Rapid and comprehensive evaluation of(poly)phenolic compounds in pomegranate (Punica granatum L.)juice by UHPLC-MSn. Molecules 2012;17:14821–40.
175. Moco S, Forshed J, De Vos RCH, Bino RJ, Vervoort J. Intra- andinter-metabolite correlation spectroscopy of tomato metabolomicsdata obtained by liquid chromatography-mass spectrometry and nu-clear magnetic resonance. Metabolomics 2008;4:202–15.
176. Adhikari KB, Laursen BB, Laerke HN, Fomsgaard IS. bioactivebenzoxazinoids in rye bread are absorbed and metabolized in pigs.J Agric Food Chem 2012;60:2497–506.
177. Morand C, Dubray C, Milenkovic D, Lioger D, Martin JF, Scalbert A,Mazur A. Hesperidin contributes to the vascular protective effects oforange juice: a randomized crossover study in healthy volunteers. AmJ Clin Nutr 2011;93:73–80.
178. Lan K, Xie G, Jia W. Towards polypharmacokinetics: pharmacoki-netics of multicomponent drugs and herbal medicines using a metab-olomics approach. Evid Based Complement Alternat Med 2013;2013:819147.
179. Johnson CH, Slanar O, Krausz KW, Kang DW, Patterson AD,Kim J-H, Luecke H, Gonzalez FJ, Idle JR. Novel metabolites androles for alpha-tocopherol in humans and mice discovered by massspectrometry-based metabolomics. Am J Clin Nutr 2012;96:818–30.
180. Suhre K, Shin S-Y, Petersen A-K, Mohney RP, Meredith D, WaegeleB, Altmaier E, Deloukas P, Erdmann J, Grundberg E, et al. Humanmetabolic individuality in biomedical and pharmaceutical research.Nature 2011;477:54–60.
181. Illig T, Gieger C, Zhai GJ, Romisch-Margl W, Wang-Sattler R, Prehn C,Altmaier E, Kastenmuller G, Kato BS, Mewes HW, et al. A genome-wide perspective of genetic variation in human metabolism. Nat Genet2010;42:137–41.
182. Kettunen J, Tukiainen T, Sarin A-P, Ortega-Alonso A, Tikkanen E,Lyytikainen L-P, Kangas AJ, Soininen P, Wuertz P, Silander K, et al.Genome-wide association study identifies multiple loci influencinghuman serum metabolite levels. Nat Genet 2012;44:269–76.
183. Lampe JW. Interindividual differences in response to plant-baseddiets: implications for cancer risk. Am J Clin Nutr 2009;89:1553S–7S.
184. Reszka E, Wasowicz W, Gromadzinska J. Genetic polymorphism ofxenobiotic metabolising enzymes, diet and cancer susceptibility. Br JNutr 2006;96:609–19.
185. Willett WC. Balancing life-style and genomics research for diseaseprevention. Science 2002;296:695–8.
186. Smith GD, Ebrahim S. ’Mendelian randomization’: can genetic epi-demiology contribute to understanding environmental determinants ofdisease? Int J Epidemiol 2003;32:1–22.
187. Schroeter H, Heiss C, Balzer J, Kleinbongard P, Keen CL, HollenbergNK, Sies H, Kwik-Uribe C, Schmitz HH, Kelm M. (-)-Epicatechinmediates beneficial effects of flavanol-rich cocoa on vascular functionin humans. Proc Natl Acad Sci USA 2006;103:1024–9.
188. Fiehn O, Robertson D, Griffin J, van der Werf M, Nikolau B, MorrisonN, Sumner L, Goodacre R, Hardy N, Taylor C, et al. The MetabolomicsStandards Initiative (MSI). Metabolomics 2007;3:175–8.
189. Metabolomics Standards Initiative. Homepage. Available from: http://msi-workgroups.sourceforge.net/ (cited 3 September 2013).
190. Metabolomics Forum. Homepage. Available from: http://metabolomics-forum.com (cited 3 September 2013).
191. NIH. ClinicalTrials.gov. Available from: www.ClinicalTrials.gov (cited3 September 2013).
192. T’Jollyn H, Boussery K, Mortishire-Smith RJ, Coe K, De Boeck B, VanBocxlaer JF, Mannens G. Evaluation of three state-of-the-art metaboliteprediction software packages (Meteor, MetaSite, and StarDrop) throughindependent and synergistic use. Drug Metab Dispos 2011;39:2066–75.
193. Piechota P, Cronin MTD, Hewitt M, Madden JC. pragmatic ap-proaches to using computational methods to predict xenobiotic me-tabolism. J Chem Inf Model 2013;53:1282–93.
194. Benson DA, Cavanaugh M, Clark K, Karsch-Mizrachi I, Lipman DJ,Ostell J, Sayers EW. GenBank. Nucleic Acids Res 2013;41:D36–42.
195. Barrett T, Wilhite SE, Ledoux P, Evangelista C, Kim IF, TomashevskyM, Marshall KA, Phillippy KH, Sherman PM, Holko M, et al. NCBIGEO: archive for functional genomics data sets—update. NucleicAcids Res 2013;41:D991–5.
196. Riffle M, Eng JK. Proteomics data repositories. Proteomics 2009;9:4653–63.
197. Haug K, Salek RM, Conesa P, Hastings J, de Matos P, Rijnbeek M,Mahendraker T, Williams M, Neumann S, Rocca-Serra P, et al.MetaboLights—an open-access general-purpose repository for me-tabolomics studies and associated meta-data. Nucleic Acids Res 2013;41:D781–6.
198. van Ommen B, Bouwman J, Dragsted LO, Drevon CA, Elliott R, deGroot P, Kaput J, Mathers JC, Muller M, Pepping F, et al. Challengesof molecular nutrition research 6: the nutritional phenotype databaseto store, share and evaluate nutritional systems biology studies. GenesNutr 2010;5:189–203.
1308 SCALBERT ET AL
by guest on June 14, 2016ajcn.nutrition.org
Dow
nloaded from
Related Documents