HIV in the United Kingdom: 2013 Report Published November 2013: data to end December 2012

Welcome message from author
This document is posted to help you gain knowledge. Please leave a comment to let me know what you think about it! Share it to your friends and learn new things together.
Transcript

HIV in the United Kingdom: 2013 Report
Published November 2013: data to end December 2012

HIV in the United Kingdom: 2013 Report
2
About Public Health England Public Health England’s mission is to protect and improve the nation’s health and to
address inequalities through working with national and local government, the NHS,
industry and the voluntary and community sector. PHE is an operationally autonomous
executive agency of the Department of Health.
Public Health England
133-155 Waterloo Road
Wellington House
London SE1 8UG
Tel: 020 7654 8000
http://www.gov.uk/phe
Twitter: @PHE_uk
Authorship: Adamma Aghaizu, Alison Brown, Anthony Nardone, O.Noel Gill and
Valerie Delpech. The HIV and AIDS Reporting Team, HIV and STI Department, Centre
for Infectious Disease Surveillance and Control, Health Protection Directorate
Other contributors: (in alphabetical order) Paul Birrell, Cuong Chau, Glenn Codere,
Stefano Conti, Nick Cooper, Sara Croxford, Alan Darbin, Daniela DeAngelis, Sarika
Desai, Vicky Gilbart, Rishi Gupta, Vivian Hope, Gwenda Hughes, Neil Irvine, Meaghan
Kall, Peter Kirwan, Sam Lattimore, Louise Logan, Janice Morgan, Gary Murphy,
Fortune Ncube, Venkata Polavarapu, Anne Presanis, Rajani Raghu, Brian Rice,
Graeme Rooney, Daniel Thomas, Pat Tookey, Lesley Wallace, Melvina Woode Owusu,
Zheng Yin, National Survey of Sexual Attitudes and Lifestyles and the UK Collaborative
Group on HIV Drug Resistance.
For queries relating to this document, please contact the HIV and AIDS Reporting Team
at [email protected] .
Front cover designed by Valentina D’Efilippo
Suggested citation: Aghaizu A, Brown AE, Nardone A, Gill ON, Delpech VC &
contributors. HIV in the United Kingdom 2013 Report: data to end 2012. November
2013. Public Health England, London.
© Crown copyright 2013
You may re-use this information (excluding logos) free of charge in any format or
medium, under the terms of the Open Government Licence v2.0. To view this licence,
visit OGL or email [email protected]. Where we have identified any third
party copyright information you will need to obtain permission from the copyright holders
concerned. You can download this publication from www.gov.uk/phe
Published November 2013; PHE publications gateway number: 2013256

HIV in the United Kingdom: 2013 Report
3
Contents
About Public Health England, authorship, suggested citation 2
Contents 3
Key findings 4
Number of people living with HIV 7
New HIV diagnoses, recent infection and incidence 8
Men who have sex with men 9 Heterosexual men and women 11
People who inject drugs and other groups 12
Late diagnoses, AIDS and deaths 13
HIV testing 16
Antenatal screening 18
HIV screening in sexual health services 18 Unlinked anonymous testing in sexual health clinics 18 HIV screening in blood donors 18
HIV and STI co-infections 19
HIV and TB co-infections 19
Quality of HIV care 20
Number of people accessing HIV care 20
Linkage to care within a year of diagnosis 20 Retention in HIV care 21 Treatment coverage 22
Impact of treatment on HIV prevention in the UK 22
HIV and health inequality 24

HIV in the United Kingdom: 2013 Report
4
Key findings
An estimated 98,400 (93,500-104,300) people were living with HIV in the UK in 2012. The overall prevalence was 1.5 per 1,000 population (1.0 in women and 2.1 in men). An estimated 21,900 people living with HIV were unaware of their infection in 2012. There were 490 deaths among people with an HIV infection in 2012, a continuation of the decline since the introduction of antiretroviral therapy (ART). Those diagnosed with HIV late (CD4 count <350 cells/mm3) continued to have a ten-fold increased risk of death in the first year of diagnosis compared to those diagnosed early. People living with HIV can expect a near normal life span and better clinical outcomes if they are diagnosed promptly. Earlier treatment must be combined with a substantial increase in the frequency of HIV testing among groups most affected. Between 2011 and 2012 there was a small decline in the proportion of people unaware of their HIV infection (25 per cent to 22 per cent), and this needs to be accelerated. Recent national and international treatment guidelines recommend early treatment to prevent onward transmission. ‘Treatment as prevention’ is unlikely to be sufficient to reduce HIV transmission in the UK since it is estimated that two-thirds of HIV positive people with detectable viral loads are unaware of their infection.
Men who have sex with men (MSM)
MSM remain the group most affected by HIV with 47 per 1,000 living with the infection. This is equivalent to an estimated 41,000 (37,300-46,000) MSM living with HIV in 2012, of whom 7,300 (18%; 3,700-12,300) were unaware of their infection (18%). Over the past decade, an estimated 2,400 (1,600-4,100) MSM acquired HIV infection each year. New diagnoses among MSM continued to rise and reached an all time high of 3,250 in 2012. This reflects both on-going high levels of HIV transmission and an increase in HIV testing.
Heterosexual men and women
Black-African men and women were the second largest group affected by HIV with 38 per 1,000 living with the infection (26 per 1,000 in men and 51 per 1,000 in women). Of the 31,800 (29,700-34,600) black-African men and women living with HIV, 23% remained unaware of their infection in 2012. Over the past five years, an estimated 1,000 black-African men and women probably acquired HIV in the UK annually.

HIV in the United Kingdom: 2013 Report
5
HIV testing
The proportion of people diagnosed late has declined over the past decade from 58% (3,150) in 2003 to 47% (2,990) in 2012. Among MSM, the proportion of late diagnoses reduced from 42% to 34%, but the number of late diagnoses rose from 900 to 1,100. Among heterosexuals, the proportion diagnosed late reduced from 65% to 58% with the absolute number halving from 3,180 to 1,620. Almost half of MSM newly diagnosed with HIV between 2010 and 2012 had their diagnosis made at their first HIV test at that sexual health clinic, an indicator that many MSM who require an HIV test have yet to seek one. The number of HIV tests performed in sexual health services in England increased to 900,000 in 2012. However, significant improvements in test coverage are necessary since 29% (361,370/1,263,980) of clinic attendees did not have a test. Overall, 64 of 326 (20%) local authorities across England had a diagnosed HIV prevalence of ≥ 2 per 1,000 population aged 15-59 years, the threshold for expansion of testing policies beyond the routine. Eighteen of the 20 local authorities with the highest prevalence were in London. Further efforts are needed to commission expanded HIV testing in these areas.
Co-infection with other sexually transmitted infections
In 2012, 29% of MSM newly diagnosed with HIV had a concurrent acute STI (chlamydia, gonorrhoea and/or syphilis), compared to 11% of heterosexual men and 9% of women.
Quality of HIV care
A total of 77,610 people (770 children and 76,840 adults) received HIV care in 2012, a 5% increase on the previous year. This is more than double the number of people accessing care a decade ago (35,970). One in four adults living with diagnosed HIV were aged 50 years and over. Nearly all (97%) 6,360 people newly diagnosed in 2012 were linked to HIV care within three months of diagnosis. Integration into care was prompt across all population groups regardless of age, sex, ethnicity, sexual orientation and area of residence. In 2012, the annual retention rate and treatment coverage among all persons seen for HIV care were high at 95% and 85%, respectively. In England, key clinical indicators are monitored locally through the HIV Clinical Dashboard to maintain high standards of HIV care. (http://www.specialisedservices.nhs.uk/info/specialised-services-quality-dashboards).

HIV in the United Kingdom: 2013 Report
6
HIV testing and safer sexual behaviour to reduce risk:
1. Early diagnosis of HIV enables better treatment outcomes and reduces
the risk of onward transmission. Have an HIV test if you think you may
have been at risk. Get tested regularly for HIV if you are one of those
most-at-risk:
a. Men who have sex with men are advised to have an
HIV and STI screen at least annually, and every three
months if having unprotected sex with new or casual
partners.
b. Black-African men and women are advised to have an
HIV test and a regular HIV and STI screen if having
unprotected sex with new or casual partners.
2. Always use a condom correctly and consistently, and until all partners
have had a sexual health screen.
3. Reduce the number of sexual partners and avoid overlapping sexual
relationships.
4. Unprotected sex with partners believed to be of the same HIV status
(serosorting) is unsafe. For the HIV positive, there is a high risk of
acquiring other STIs and hepatitis. For the HIV negative, there is a high
risk of HIV transmission (a fifth of HIV positive MSM are unaware of
their infection) as well as of acquiring STIs and hepatitis.
How to get an HIV test:
1. Ask your GP for an HIV test – nowadays there is no need for lengthy
discussion about the test, it just involves having blood taken, or even a
finger prick.
2. Go to an open access sexual health clinic (some clinics in large cities
are offering ‘fast-track’ HIV testing) or go to a community testing site
(http://www.aidsmap.com/hiv-test-finder).
3. Ask online for a self-sampling kit (http://www.tht.org.uk/sexual-
health/HIV-STIs/HIV-AIDS/HIV-postal-test).

HIV in the United Kingdom: 2013 Report
7
Number of people living with HIV
The introduction of effective antiretroviral therapy (ART) in 1995 transformed HIV from a fatal infection to a chronic, manageable life-long condition. Over the last decade, the number of people living with HIV has risen year-on-year due to the ageing cohort of diagnosed people, and the continued high number of new infections. In the UK, the epidemic is largely concentrated among men who have sex with men (MSM) and black-African heterosexual men and women. In 2012, there was an estimated 98,400 (95% credible interval 93,500-104,300) people living with HIV infection. Approximately one in five (21,900, 22% (18-27%)) were unaware of their infection (Figure 1, Appendix 1). The prevalence of HIV in 2012 was estimated to be 1.5 per 1,000 (1.5-1.6) population of all ages, 2.1 per 1,000 (1.9–2.2) in men and 1.0 per 1,000 (0.99-1.1) in women. An estimated 41,000 (37,300-46,000) MSM were living with HIV in 2012, of whom 7,300 (3,700-12,300) were unaware of their infection (18%). Assuming that 3.4% of the adult male population are MSM [1], the overall prevalence of HIV in this population was one in 20 (47 per 1,000). This was higher in London with nearly one in 12 (80 per 1,000) living with HIV compared to one in 34 (29 per 1,000) elsewhere in the UK.
Figure 1: Estimated number of people living with HIV (both diagnosed* and undiagnosed): UK, 2012
*Estimated numbers diagnosed differ slightly from the observed numbers diagnosed and accessing care as they are
generated using Bayesian modelling techniques.

HIV in the United Kingdom: 2013 Report
8
An estimated 53,000 (50,000-56,400) heterosexual men and women were living with HIV, of whom 11,100 (10,200-12,400) were African-born men and 20,700 (19,500-22,200) were African-born women. Based on data from England and Wales, HIV prevalence in the UK was 26 per 1,000 among black-African men and 51 per 1,000 among black-African women. The effectiveness of the UK antenatal screening programme has resulted in lower rates of undiagnosed infection among heterosexual women. A higher proportion of heterosexual men were undiagnosed with one in three heterosexual men (30%, 24-37%) compared to one in four (24%, 21%- 28%) heterosexual women. An estimated 2,200 (2,000–2,500) people who inject drugs (PWID) were living with HIV in the UK, of whom 300 (200-600) were undiagnosed. The prevalence of HIV among this population was 13 per 1,000 (95% C.I. 9.4 to 17 per 1,000) in England, Wales and Northern Ireland in 2012 [2]. Among people who injected drugs for the first time in the preceding three years, HIV prevalence was 10 per 1,000 (95% C.I. 2.9 to 27 per 1,000) in 2012. This is similar to the prevalence found in 2011, indicating transmission is on-going, albeit at a low level. In 2011, the estimated HIV prevalence in pregnant women in England was 2.2 per 1,000; again this was highest in London with 3.5 per 1,000. HIV prevalence was highest among sub-Saharan African-born pregnant women with 23 per 1,000. This compares to an HIV prevalence of 0.5 per 1,000 among UK-born pregnant women.
New HIV diagnoses, recent infection and incidence
In 2012, 6,360 people (4,560 men and 1,800 women) were newly diagnosed with HIV in the UK, a slight increase on 6,220 diagnoses in 2011. Like the previous year, this is an estimated new HIV diagnosis rate of 1.0 per 10,000 populationa (1.5 per 10,000 men and 0.57 per 10,000 women) (Appendices 2, 3 and 4). While overall trends show a decline in new HIV diagnoses since 2005 (7,930) (Figure 2), this is largely due to a decrease in the number of diagnoses reported among heterosexuals born in countries with high HIV prevalence. The number of new diagnoses among persons born in Africa declined from 42% in 2008 to 29% in 2012.
Overall, 14% (390/2,880) had a recent infection (in the previous six months) at diagnosis in England, Wales and Northern Ireland (Appendix 5).b
a Calculated using 2012 mid-year population estimates from ONS.
b The Recent Infection Testing Algorithm (RITA) incorporates results from an HIV antibody assay modified for the determination
of HIV avidity as well as clinical biomarkers (CD4 cell count, antiretroviral therapy and AIDS at diagnosis) to distinguish recently
acquired from long-standing HIV infection. In 2012, 48% of new HIV diagnoses in England, Wales and Northern Ireland were
tested for recent infection. (Appendix 5)

HIV in the United Kingdom: 2013 Report
9
Men who have sex with men
There has been a steady increase in the number of new HIV diagnoses among MSM. This number surpassed the number of new diagnoses among heterosexuals in 2011. After adjusting for missing exposure data, diagnoses among MSM accounted for 3,250 (51%) of new diagnoses in 2012, the highest number ever reported. London had the highest number of new diagnoses (1,450), followed by the PHE regions North of England (470), South of England (410) and the Midlands and East of England (370). Scotland, Wales and Northern Ireland had 140, 50 and 60 diagnoses in 2012 respectively.c The median age at diagnosis among MSM was 34 years, and one in nine MSM were diagnosed at the age of 50 years or over. New diagnoses figures are difficult to interpret in isolation. The rise in diagnoses among MSM may be explained by both an increase in HIV testing and on-going high rates of transmission. The number of MSM that had an HIV test in sexual health services in England increased by 13% from 64,270 in 2011 to 72,710 in 2012, while in London the increase was 19% (from 28,640 in 2011 to 33,980, in 2012). However, estimations of HIV incidence using a back-calculation analysis [3] indicate that HIV transmission among MSM remained high with 2,300-2,500 new infections annually and 7,200 MSM undiagnosed in 2012, with little change over the last decade (Figure 3). The large majority of new infections stem from MSM unaware of their infection [4]. In 2012, new diagnoses among MSM increased by 10% from 2,960 in 2011 and in London, by 14% from 1,400 in 2011 to 1,600 in 2012 (Figure 4). The proportion of new diagnoses that were probably recently acquired infections among MSM in England, Wales and Northern Ireland in 2012 was 19% (Appendix 5); in London this was 22%.
c Regional data not adjusted for missing risk information.
Figure 2: Annual new HIV and AIDS diagnoses and deaths: UK, 1981-2012

HIV in the United Kingdom: 2013 Report
10
Figure 3: Back-calculation estimate of HIV incidence and prevalence of undiagnosed HIV infection among MSM: UK, 2003-2012
Figure 4: Geographical trends of new HIV diagnoses among MSM: UK, 2003-2012

HIV in the United Kingdom: 2013 Report
11
Heterosexual men and women
People who acquired their infection through heterosexual contact were the second largest group of people newly diagnosed with HIV in 2012. After adjusting for missing risk information, they accounted for 2,880 (45%) of new HIV diagnoses. Over the last decade, the number of new diagnoses among heterosexuals declined in England, especially in London. In 2012, numbers were highest in London (1,020; 35%) followed by the PHE regions Midlands and the East of England (590) and the North (400) and South of England (370).d In Scotland, Wales and Northern Ireland, the numbers of new diagnoses acquired heterosexually were lower, with 110, 50 and 40, respectively (Figure 5). In 2012, a higher number of heterosexual women (1,530) than men (1,050) were newly diagnosed with HIV. The median age of diagnosis was 39 years overall; 42 years among men and 37 years among women. The proportion of new diagnoses that were recently acquired HIV infections was 6% (30/440) among heterosexual men and 8% (50/640) among women.
d Regional data not adjused for missing risk information.
Figure 5: Geographical trends of new HIV diagnoses among heterosexuals: UK,
2003-2012

HIV in the United Kingdom: 2013 Report
12
A method to assign probable country of infection using information on CD4 decline rates suggests approximately half (52%, 1,560/2,990 in 2011) of all infections among heterosexuals were probably acquired in the UK and that this proportion has increased over recent years, up from 27% (1,100/4,090) in 2002 (Figure 6). [5] Conversly, the number of infections acquired abroad has more than halved, with 1,320 in 2011 compared to 2,990 in 2002. This has resulted in an overall decrease in the number of diagnoses among heterosexuals over the past decade. Approximately half of heterosexuals born abroad (48%) acquired their infection in the UK. This highlights the need for further prevention efforts for those born abroad, particularly in sub-Saharan African countries.
People who inject drugs and other groups
The number of infections acquired through injecting drug use and through other routes has remained low (Figure 7). After adjusting for missing data, 120 new HIV diagnoses in 2012 were infections acquired through injecting drug use and 110 through other means such as mother-to-child transmission and through exposure to contaminated blood products abroad. In 2012, 52% of new diagnoses among people who inject drugs were among people born abroad.
Figure 6: New HIV diagnoses among heterosexuals by probable country of infection: UK, 2002-20111

HIV in the United Kingdom: 2013 Report
13
Late diagnoses, AIDS and deaths Late diagnosis is the most important predictor of morbidity and one-year mortality among people with HIV infection. Over the last decade, 81% of the 2,000 AIDS-related deaths in England and Wales were attributable to late diagnosis [6]. A number of national HIV testing guidelines, including expanded testing initiatives, have been introduced to tackle late diagnosis [7-9] and it is a key indicator of the Public Health Outcomes Framework.
A late diagnosis is defined as having a CD4 count ˂350 cells/mm3 within three months of diagnosis; ˂350 cells/mm3 is the threshold at which ART should begin. In 2012, 47% of new diagnoses (2,990) were diagnosed late (CD4 data were available for 75% of diagnoses). Twenty-eight percent (1,770) were severely immunocompromised at diagnosis having a CD4 count ˂200 cells/mm3. Late diagnosis was highest among heterosexuals, with two-thirds of men (65%; 750/1,160) and over half of women 57% (860/1,730) diagnosed late (Figure 8, Appendix 8). In 2012, the lowest proportion of late diagnosis was among MSM, with 34% (1,110/3,250) diagnosed late. This is a result of more frequent testing among MSM. A higher proportion of older adults, aged 50 years and over, were diagnosed late compared to adults aged under 50 (63% vs. 44%). The proportion of late diagnosis was particularly high among black-African and black-Carribean heterosexual men (both 66%) followed by white heterosexual men (47%). Among women, the proportion diagnosed late was highest among black-African (61%), followed by black-Caribbean (47%) and white (44%) women.
Late diagnosis varied geographically, with highest rates observed in the Midlands and the East of England (58%) followed by the North of England (50%), the South of England (49%) and London (43%).
Figure 7. New HIV diagnoses* among people who inject drugs by country of birth:
UK, 2003-2012

HIV in the United Kingdom: 2013 Report
14
Over the last decade, the proportion of people diagnosed late has declined significantly, from 58% (4,300/7,710) in 2003 to 47% (2,990/6,360) in 2012 (p<0.0001 for trend), and across all exposure groups (Figure 9). This decline was steeper among MSM, with 42% (920/2,180) in 2003 compared to 34% in 2012; however the number of late diagnoses rose (from 900 to 1,100). Among heterosexuals the proportion diagnosed late reduced from 65% to 58% with the number halving from 3,180 to 1,610.
Figure 9: Trends in late diagnosis* by exposure group: UK, 2003-2012
Figure 8: Late diagnosis*: proportion of adults diagnosed with a CD4 count <350 cells/mm3: UK, 2012

HIV in the United Kingdom: 2013 Report
15
The number of deaths and AIDS diagnoses has steadily declined over the past decade, with the latter decreasing from 1,030 in 2003 to 390 in 2012, the vast majority were among people presenting late. The most common AIDS-defining illnesses among the 1,470 diagnoses reported between 2010 and 2012 were: Pneumocystis jirovecii pneumonia (33%; 590), Mycobacterium tuberculosis (TB) (15%; 280), Kaposi’s sarcoma (7%; 130) and oesophageal candidiasis (9%; 160). In 2012, there were 490 deaths among people diagnosed with HIV (370 men and 120 women) (Appendix 3); over half (55%; 270) were aged 50 years or older. All-cause mortality among people with HIV aged 15-59 years in England and Wales between 2002 and 2012 declined from 15 per 1,000 in 2002 to 4.5 per 1,000 in 2012 (Figure 10). This compares to a mortality rate of 1.5 per 1,000 in the general population in 2012. Mortality rates were higher among men (4.9 per 1,000 ) compared to women (3.8 per 1,000); in the general population, this was 1.8 per 1,000 and 1.2 per 1,000, respectively for the same year. Mortality rates were similar among MSM and heterosexuals diagnosed with HIV in 2012, with 3.4 per 1,000 among MSM and 3.5 per 1,000 among heterosexuals. People diagnosed with HIV who injected drugs had the highest rates of death, with 18.4 per 1,000; this compares to 2.0 per 1,000 among people who inject drugs who are not infected with HIV, based on data from 2008. [6] While AIDS-related mortality has declined from 11 per 1,000 in 1999 to 2.6 per 1,000 in 2008 (p<0.001) [6], 43% (1,990/4,600) of deaths among HIV-diagnosed adults were AIDS-related in 2012. Late presenters continued to have high rates of morbidity and mortality in the era of ART; there was a ten-fold increase in the risk of death within the first year of diagnosis, compared to those diagnosed with a CD4 count ˃350 cells/mm3 (Figure 11) [10]. One-year mortality is particularly marked for people aged 50 years and over at diagnosis, where more than one in 10 diagnosed late died within a year. [11]
Figure 10: Trends in all-cause mortality rates among people diagnosed with HIV: England
and Wales, 2002-2012

HIV in the United Kingdom: 2013 Report
16
HIV testing
UK national guidelines recommend expanding HIV testing beyond specialised sexual health services to people admitted to a general hospital ward and new registrants to general practice in areas with a diagnosed HIV prevalence of ≥2 per 1,000 population aged 15-59 years [12]. In 2012, 64 of 326 (20%) local authorities (LAs) had a diagnosed prevalence above this threshold. All but one of the 33 London LAs had a prevalence above this threshold. Outside London, the five LAs with the highest prevalence, and above ≥2 per 1,000, were: Brighton and Hove, Salford, Manchester, Blackpool and Luton (Figure 12). (See Appendix 9 for full listing.)
Figure 11: One-year mortality among adults newly diagnosed with HIV by CD4 count at diagnosis: UK, 2010

HIV in the United Kingdom: 2013 Report
17
A synthesis of data from eight testing pilot projects undertaken in hospital services and general practices across England demonstrated that the offer and recommendation of a routine HIV test was feasible and acceptable to both patients and staff. [13] In June 2012, an audit was undertaken among 40 sexual health commissioners for areas with higher diagnosed HIV prevalence. Findings indicate that 31% (11/35) had commissioned HIV testing for some new patient registrations in general practice, but only 14% (5/35) had commissioned routine HIV testing as part of general medical admissions to hospitals. [14] Community surveys of MSM have shown an increase in the percentage of people who have had an HIV test since the early 2000s. In 2011, 58% (640/1,110) reported having had an HIV test in the last year, an increase from 48% in 2006 (840/1,760) [15;16]. However, 8% of MSM reported never having tested. The uptake of testing among black-African men and women has remained low. [17]
Figure 12: Prevalence of diagnosed HIV infection by region of residence among population aged 15-59 years: UK, 2012

HIV in the United Kingdom: 2013 Report
18
Antenatal screening
In 2012, 675,800 pregnant women were screened for HIV in England, comprising an uptake rate of 98%. Of these, 0.19% (1,310/675,800) were positive and one in 2,500 (0.04%) were newly diagnosed. Of all children born to HIV-infected women in the UK between 2005 and 2011, an estimated 2% became infected with HIV. However, the transmission rate of HIV among children born to women with diagnosed HIV infection was under 1%. [18]
HIV screening in sexual health services
HIV testing continued to increase in 2012, with 902,610 HIV tests performed in sexual health services in England. Overall, 71% (902,610/1,263,980) of attendees were tested; a higher proportion of MSM (84%; 72,710/86,360) were tested compared to heterosexual men (76%; 355,460/469,450) and women (67%; 454,930/677,620) (Appendix 10). The number of MSM having an HIV test in the UK increased by 13%, from 64,270 in 2011 to 72,710 in 2012, while in London the increase was 19% (from 28,640 to 34,000). Among heterosexuals, the number of tests rose by 6%, from 815,450 in 2011 to 863,820 in 2012, with a 12% increase in London from 230,040 to 256,650.
Not all sexual health clinic attendees were offered or accepted an HIV test at every visit; in 2012, of the 1,568,010 episodes of care among people not previously diagnosed with HIV, only 79% (1,238,340) included the offer of an HIV test. Nearly one in five people (19%, 234,510) declined a test (Appendix 11). A higher proportion of heterosexual men (83%) compared to women (78%) were tested, with uptake highest among MSM (94%). Between 2010 and 2012, 49% of MSM newly diagnosed were diagnosed at their first HIV test at that clinic, an indication that many MSM who require an HIV test have yet to seek one.
Unlinked anonymous testing in sexual health clinics
A new unlinked anonymous survey of undiagnosed HIV infection among sexual health clinic attendees is currently under implementation. This survey involves the collection of urine specimens and demographic data from men who declined an HIV test at their attendance and were not known to be positive. In 2012, leftover urine samples from 3,142 men attending 19 sexual health clinics were tested anonymously for HIV. Of those, 25 (0.8%) were HIV positive. These samples were tested for the presence of antiretrovirals, of which nine (36%) tested positive, indicating that the patient knew their status and chose not to disclose it at that visit. Excluding these patients, the prevalence of undiagnosed infection was 0.51% (16/3,133) among men not having an HIV test and therefore leaving the clinic undiagnosed. The highest prevalence of undiagnosed HIV infection was observed among MSM, whom among 3.6% not having an HIV test had an undiagnosed infection.
HIV screening in blood donors
Since 1985, all blood donors have been screened for HIV infection to prevent onward transmission. There has been no known case of HIV acquisition through blood transfusion in the UK since 2002. In the UK in 2012, 15 donors tested positive for HIV infection at screening,
HIV in the United Kingdom: 2013 Report
19
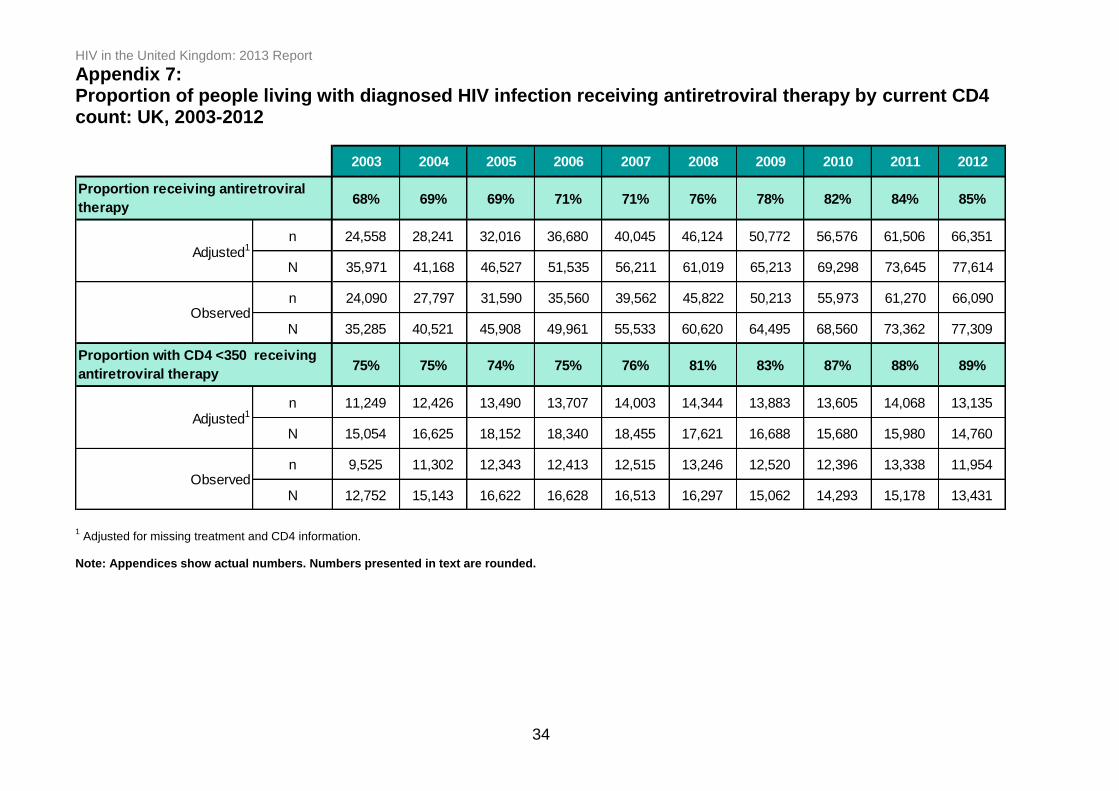
representing 0.6 detected infections per 100,000 donations. The majority of infections were detected among men (11/15) and were probably infected through heterosexual transmission (8/12). The majority were among repeat donors, most of whom had probably acquired their HIV infection within the previous three years (8/15). [19]
HIV and STI co-infections
People with HIV who have an STI are more likely to transmit HIV during sex. [20] Data from sexual health services show that, of the 4,220 people newly diagnosed with HIV in a sexual health clinic in England in 2012, nearly one in five (19%, n=810) were diagnosed with a concurrent acute STI (chlamydia, gonorrhoea and syphilis). This was highest among MSM, with 29% (600/2,070) having a concurrent STI, compared to 11% (110/940) among heterosexual men and 9% (90/1,080) among heterosexual women. Acute STIs are more common among HIV-diagnosed MSM. In 2012, a total of 28,000 acute STIs were diagnosed among MSM attending sexual health services across England and, of these, 4,000 (14%) were among HIV-diagnosed men. This represents a rate of 13% for the 30,000 MSM living with diagnosed HIV, compared to a rate of 5% among MSM with a negative or unknown HIV status (2,400/470,000).
HIV and TB co-infections
In 2011, 300 people (equivalent to 4 per 1,000) living with HIV were diagnosed with tuberculosis (TB) in England, Wales and Northern Ireland, estimated through the linkage of national HIV and TB datasets. TB incidence rates are highest among people living with HIV born in a country with high prevalence of both infections, those diagnosed late and those not on treatment. The incidence of TB among people living with HIV in 2010 was 10.9 per 1,000 among black-African heterosexuals compared to 3.1 per 1,000 among white heterosexuals.[21] Among people with HIV, TB incidence rates remained substantially higher than among the general population (0.14 per 1,000 population). These data highlight the importance of the universal offer of an HIV test to all patients diagnosed with TB and screening for TB among people living with HIV. TB is one of the most common AIDS-defining illnesses in the UK and HIV testing should therefore be part of the routine workup tests for TB patients. The British HIV Association (BHIVA) also recommends latent TB infection (LTBI) testing for patients with HIV and a low CD4 count, or if they come from a sub-Saharan African country, where co-infections are more common. There are current plans to strengthen the coordination and quality of local LTBI screening pilots among migrants from high TB incidence countries. The LTBI screening algorithm includes an HIV test to aid interpretation if patients are also from a high HIV prevalence country.[22]

HIV in the United Kingdom: 2013 Report
20
Quality of HIV care Number of people accessing HIV care
In April 2013, the reconfiguration of the NHS in England led to changes in the commissioning of HIV services. HIV prevention and HIV treatment and care services are now commissioned separately by local authorities and NHS England respectively. Clinical Reference Groups, which include a range of HIV specialists, inform and specify treatment and care service needs.
In 2012, there were 77,610 people living with diagnosed HIV infection who received care in the UK (52,060 men and 25,550 women) (Appendix 6). This is a 5% increase from 73,650 people accessing HIV-related care the previous year and more than double the number a decade ago up from 35,970 in 2003 (Figure 13). This rise is due to a combination of on-going transmission and improvement in survival [23;24], but is also reduced by a small number of people who have left the UK or not been linked to HIV care. The increase in the number of new diagnoses among older people (500 diagnoses among people aged 50 years and over in 2003 compared to 990 in 2012), and an ageing cohort has led to a disproportionate rise in the number of people accessing HIV-related care aged 50 and over. In 2012, one in four adults (19,120/76,840) who were accessing care were aged 50 and over, compared to one in eight (4,360/35,210) in 2003.
Linkage to care within a year of diagnosis
The BHIVA Standard of Care guidelines (2012) indicate that all patients should have a baseline test, including a CD4 count within two weeks of diagnosis with HIV.[25] In 2011, 76% and 88% of adults newly diagnosed with HIV had a CD4 count performed within two weeks and one
Figure 13: Trends in people diagnosed with HIV accessing care by age group: UK, 2003–2012

HIV in the United Kingdom: 2013 Report
21
Figure 14: Link to care: proportion of adults with a CD4 count within 1 and 3 months of diagnosis: UK, 2011*
Figure 15: Retention in care: proportion of adults in care in 2011 seen for care the following year: UK, 2012
month of diagnosis, respectively. [10] Almost all (97%) had a CD4 count within three months. Linkage into care was high and rapid across all age groups, ethnicities, exposure categories, sex and geographies. (Figure 14).
Retention in HIV care
The 12 month retention rate of all 72,840 adults seen for HIV care in 2011 was 95%. This did not vary greatly by age, sex, ethnicity, exposure group or region (Figure 15).

HIV in the United Kingdom: 2013 Report
22
Figure 16: Treatment guidelines: proportion of adults with CD4<350 cells/mm3 receiving ART: UK, 2012
Treatment coverage
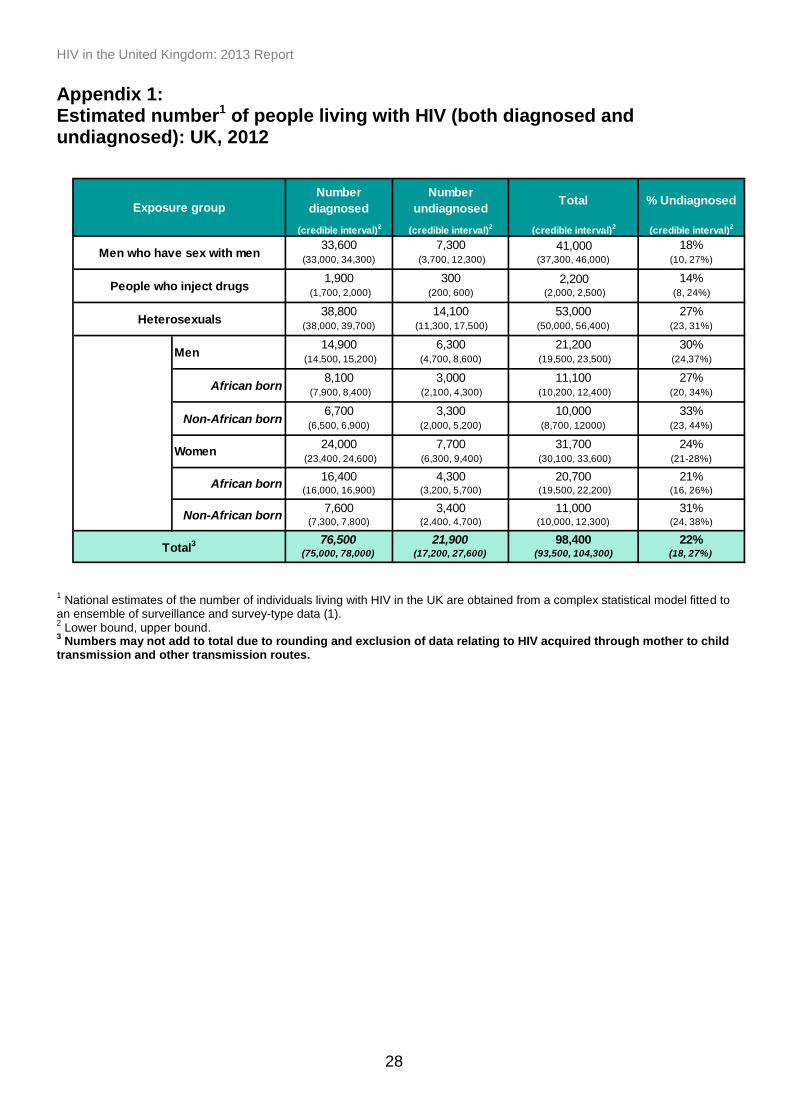
The BHIVA treatment guidelines (2008) recommend ART should start when a person with HIV has a CD4 count <350 cells/mm3.[26] In 2012, 89% of patients with a CD4 count <350 cells/mm3 were receiving treatment (Appendix 7); the majority of the 11% of patients not on treatment were diagnosed recently and had not yet had the opportunity to start treatment. [10] There was variation in treatment coverage by age, with higher coverage rates among older people; 81% among people aged 15-24 years compared to 96% among people aged 50 years and over (Figure 16).
Impact of treatment on HIV prevention in the UK
Patients treated successfully so that their viral load is undetectable (<50 copies/mL) can almost eliminate their risk of passing on infection through sexual contact. [27] To reduce HIV transmission through “treatment as prevention”, the World Health Organisation produced HIV treatment guidelines in 2013 which recommend that ART begins when CD4 counts reach <500 cells/mm3
[28] and in 2012, BHIVA treatment guidelines were updated to consider ART for all HIV patients, in response to the demonstration of the prevention effect of treatment. [29] In the UK, free and accessible HIV treatment and care has resulted in large-scale treatment coverage: in 2012, 67% of the entire HIV population (diagnosed and undiagnosed) were treated compared to 85% among the diagnosed population. It was estimated that 48% (40,800/96,000) of the entire HIV population had an undetectable viral load in 2011. [30] Despite this, “treatment as prevention” is unlikely to be sufficient to reduce HIV transmission in the UK. Using MSM as an example, while the proportion of all HIV-positive MSM who had viral loads >1,500 copies/mL decreased from 47% in 2006 to 35% in 2010 [31], HIV incidence remained steady during this period [4]. It is estimated that if diagnosed and untreated patients with CD4 counts <500 cells/mm3
were treated, the proportion of the HIV population with detectable viral loads could have decreased from 42% (40,800) to 38% (36,500). In contrast,

HIV in the United Kingdom: 2013 Report
23
halving the undiagnosed population from 22,600 to 11,300 could have led to a decrease in the proportion of MSM living with HIV with detectable viral load from 42% to 28% (27,000). This demonstrates that “treatment as prevention” is unlikely to reduce HIV transmission, unless it is combined with very frequent HIV testing alongside primary prevention programmes.
Trends in drug resistance In the UK, the prevalence of transmitted HIV drug resistance (evidence of one or more mutations associated with ART resistance among treatment naïve people) declined from 12.8% in 2002 to 7.9% in 2008, followed by a slight increase to 8.2% in 2010 (Figure 17). This suggests that the decline in transmitted drug resistant HIVinfections has stabilised over recent years and emphasises the importance of continued resistance testing for all those newly diagnosed. In 2010, levels of transmitted drug resistance was highest among MSM (9.8%), followed by heterosexual women (6.5%) and heterosexual men (6.2%).
Figure 17: Proportion of ART naïve HIV-diagnosed people with evidence of transmitted drug resistance (any class) by exposure: UK, 2002-2010

HIV in the United Kingdom: 2013 Report
24
HIV and health inequality
In 2012, the prevalence of HIV was approximately 30 times higher for MSM and black-African men and women compared to the general population in England. Individual, societal and structural factors such as sexual behaviours, infections acquired abroad [5], migration and HIV-related stigma and discrimination contribute to this disparity [32]. The wider social determinants of health must be addressed to tackle inequalities in the risk of HIV acquisition and onward transmission. [33] Further, once diagnosed and on treatment, living with HIV can impact on an individual’s ability to work and their employment opportunities, and lead to financial difficulties [34] and social challenges such as residential status. [35] HIV prevalence is highest in the most deprived areas in England; this is particularly evident in London, where diagnosed HIV prevalence is as high as 7.0 per 1,000 in the most deprived areas and less than 2.4 per 1,000 in the least deprived areas (Figure 18). Health inequalities are also apparent through the higher rates of late diagnoses observed among older people and black ethnic groups; the latter of which can be partially explained by the high proportion who acquired infections abroad. Importantly, once in care, the indicators used to measure access to and the quality of care suggest there are few inequalities in HIV care (Figures 14-16). Analysis of comprehensive surveillance data indicate little difference between population groups linked into care within three months of diagnosis, or retained in care in the year following diagnosis. There was slight variation in treatment coverage by age, with lower coverage rates among people aged 15-24 years compared to those aged 50 years and over.
Figure 18: Prevalence of diagnosed HIV infection among adults aged 15-59 years by deprivation residential area of England: 2012

HIV in the United Kingdom: 2013 Report
25
References
1. Presanis AM, Gill ON, Chadborn TR, Hill C, Hope V, Logan L, Rice BD, Delpech VC, Ades AE, De Angelis D. Insights into the rise in HIV infections, 2001 to 2008: a Bayesian synthesis of prevalence evidence. AIDS 2010 Nov 27;24(18):2849-58.
2. Centre for Infectious Disease Surveillance and Control, Public Health England. Unlinked anonymous HIV and viral hepatitis monitoring among PWID: 2013 report
3. Birrell PJ, Gill ON, Delpech VC, Brown AE, Desai S, Chadborn TR, Rice BD, De Angelis D.
Trends in HIV incidence in men who have sex with men in England and Wales 2001-10: a nationwide population study. Lancet Infect Dis. 2013 Apr; 13(4):313-8.
4. Phillips AN, Cambiano V, Nakagawa F, Brown AE, Lampe F, Rodger A, Miners A, Elford A, Hart
G, Johnson AM, Lundgren J, Delpech VC. Increased HIV incidence in Men Who Have Sex with Men Despite High Levels of ART-Induced Viral Supression: Analysis of an Extensively Documented Epidemic.
5. Rice BD, Elford J, Yin Z, Delpech VC. A new method to assign country of HIV infection among
heterosexuals born abroad and diagnosed with HIV. AIDS 2012 Sep 24;26(15):1961-6.
6. Simmons RD, Ciancio BC, Kall MM, Rice BD and Delpech VC. Ten-year mortality trends among persons diagnosed with HIV infection in England and Wales in the era of antiretroviral therapy: AIDS remains a silent killer. HIV Med 2013 Nov; 14(10):596-694
7. BHIVA guidelines for HIV testing. Available at http://www.bhiva.org/HIVTesting2008.aspx
(accessed 17 June 2013)
8. National Institute for Health and Clinical Excellence.2011. Increasing the uptake of HIV testing among men who have sex with men. NICE public health guidance 34. Available at http://www.nice.org.uk/guidance/PH34 (accessed 17 June 2013).
9. National Institute for Health and Clinical Excellence.2011. Increasing the uptake of HIV testing
among black Africans in England. NICE public health guidance 33. Available at http://www.nice.org.uk/guidaance/PH33 (accessed 17 June 2013).
10. Delpech V, Brown AE, Croxford S, Chau C, Polavarapu V, Cooper N, Rooney G, Yin Z. Quality of
care in the United Kingdom: key indicators for the first 12 months from HIV diagnosis. HIV Med. 2013 Oct;14 Suppl 3:19-24
11. Davis DH, Smith R, Brown A, Rice B, Yin Z, Delpech V. Early diagnosis and treatment of HIV
infection: magnitude of benefit on short-term mortality is greatest in older adults. Age Ageing 2013; 42: 520–526
12. British HIV Association, British Association for Sexual Health and HIV, British Infection Society. UK Guidelines for HIV Testing 2008. London: British HIV association; 2008.
13. Health Protection Agency. Time to Test for HIV: Review of expanded HIV testing in healthcare and
community services in England. London: Health Protection Agency; 2011
14. Hartney T, Kennedy I, Crook P, Nardone A. Expanded HIV testing in high-prevalence areas in England: results of a 2012 audit of sexual health commissioners. 2013 HIV Medicine. doi:10.1111/hiv.12099.
15. Aghaizu A, Copas A, Nardone T, Hart G, Johnson A, Mercey D. Gay Men’s Sexual Health Survey
London 2011. Public Health England and University College London; 2013 (unpublished).
16. Wilkinson A, Dodds J, Copas A, Jones V, Mercey D. Sexual health survey of gay men. London: UCL Centre for Sexual Health and HIV Research; 2006.

HIV in the United Kingdom: 2013 Report
26
17. Hickson F, Owuor J, Weatherburn P, Reid D, Hammond G and Jessup K. Bass Line 2008-09: assessing the sexual HIV prevention needs of African people in England. Project Report. Sigma Research. 2009.
18. Tookey P. Obstetric and paediatric HIV surveillance data from the UK and Ireland. NSHPC 2013.
MRC Centre of Epidemiology for Child health, UCL institute of Child Health London. Available from: URL www.ucl.ac.uk/nshpc
19. Safe Supplies: Completing the Picture. Annual Review from the NHS Blood and Transplant/Public Health England Epidemiology Unit, 2012. London, September 2013
20. Fleming DT. Wasserheit JN. From edpiemiological synergy to public health poice and practice:
the contribution of other sexually transmitted diseases to sexual transmission of HIV infection. Sex Transm Infect 1999 Feb;75(1):3-17.
21. Rice BD, Yin Z, Elford J, Yin Z, Abubakar I, Delpech VC. Decreasing incidence of tuberculosis
among heterosexuals living with diagnosed HIV in England and Wales. AIDS.2013 Apr 24; 27(7):1151-7.
22. Tuberculosis.Clinical diagnosis and management of tuberculosis, and measures for its prevention
and control. NICE clinical guideline 117. March 2011
23. Nakagawa F, Lodwick RK, Smith CJ, Smith R, Cambiano V, Lingren JD, Delpech VC Phillips AN. Projected life expectancy of people with HIV according to timing of diagnosis. AIDS 2012 Jan 28; 26(3):335-43.
24. Smith RD, Delpech VC, Brown AE, Rice BD. HIV transmission and high rates of late diagnoses
among adults aged 50 and over. AIDS 2010 Aug 24;24(13):2109-15.
25. British HIV Association. Standards of care for people living with HIV in 2012. London: British HIV Association; 2012.
26. Gazzard BG, British HIV. Association Guidelines for the treatment of HIV-1-infected adults with
antiretroviral therapy 2008. HIV Med 2008; 9: 563–608.
27. Cohen MS, Chen YQ, McCauley M et al. Prevention of HIV-1 infection with early antiretroviral therapy. N Eng J Med 2011; 365: 493-505.
28. World Health Organisation. Consolidated guidelines on the use of antiretroviral drugs for treating
and prevention HIV infection. June 2013.
29. Williams I British HIV Association guidelines for the treatment of HIV-1-positive adults with antiretroviral therapy 2012 HIV Medicine 2012; 13:1–85
30. Brown AE, Nardone A, Delpech VC. WHO “Treatment as Prevention” guidelines are unlikely to
decrease HIV transmission in the UK unless undiagnosed HIV infections are reduced AIDS 2013 in press
31. Brown AE, Gill ON, Delpech VC (2013). HIV treatment as prevention among men who have sex
with men in the UK: is transmission controlled by universal access to HIV treatment and care? HIV medicine 2013;14: 563-70.
32. Fakoya I, Reynolds R, Caswell G, Shiripinda I. Barriers to HIV testing for migrant black Africans in
Western Europe. HIV Med 2008 Jul;9Suppl 2:23-5.
33. Kessel A, Wilson J, Abubakar I, Watson J, Pebody R, Zambon M, Amirthalinggam G, Kitching A, Ramsey M, Hughes G, Delpech VC, Savage E, Desai S, Bloomer E, Goldblatt P. CMO Annual Report Volume 2: Health inequalities and infectious diseases. London: Department of Health; 2012.

HIV in the United Kingdom: 2013 Report
27
34. Weatherburn P, Keogh P, Reid D, Dodds C, Bourne A, Owuor J, Hammond G, Jessup K. What do you need? 2007-2008 Findings from a national survey of people with diagnosed HIV. London: Sigma Research; 2009.
35. Ibrahim F, Anderson J, Bukutu C, Elford J. Social and economic hardship among people living
with HIV in London. HIV Med 2008 Oct; 9 (8):616-24.
HIV in the United Kingdom: 2013 Report
28
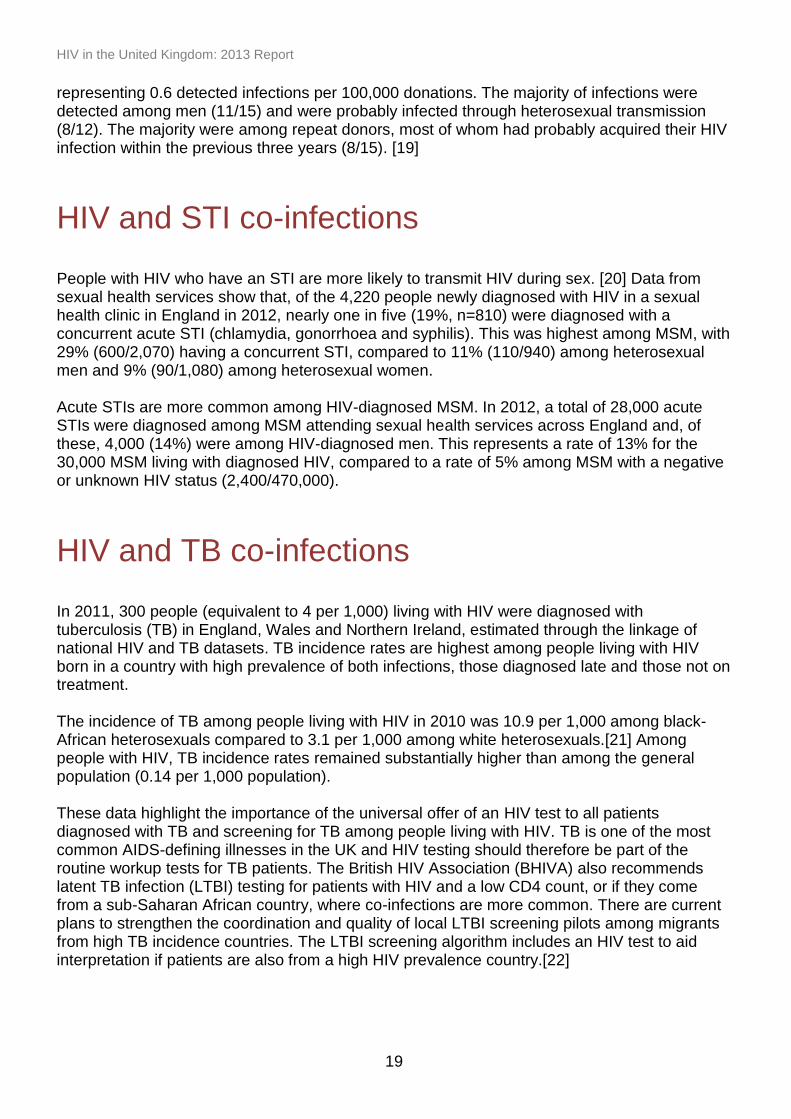
Appendix 1: Estimated number1 of people living with HIV (both diagnosed and undiagnosed): UK, 2012
Appendix 1:
Estimated number1 of people living with HIV (both diagnosed and undiagnosed): United Kingdom, 2012
Number
diagnosed
Number
undiagnosedTotal % Undiagnosed
(credible interval)2
(credible interval)2
(credible interval)2
(credible interval)2
33,600 7,300 41,000 18%(33,000, 34,300) (3,700, 12,300) (37,300, 46,000) (10, 27%)
1,900 300 2,200 14% (1,700, 2,000) (200, 600) (2,000, 2,500) (8, 24%)
38,800 14,100 53,000 27%(38,000, 39,700) (11,300, 17,500) (50,000, 56,400) (23, 31%)
14,900 6,300 21,200 30% (14,500, 15,200) (4,700, 8,600) (19,500, 23,500) (24,37%)
8,100 3,000 11,100 27% (7,900, 8,400) (2,100, 4,300) (10,200, 12,400) (20, 34%) 6,700 3,300 10,000 33%(6,500, 6,900) (2,000, 5,200) (8,700, 12000) (23, 44%)
24,000 7,700 31,700 24% (23,400, 24,600) (6,300, 9,400) (30,100, 33,600) (21-28%) 16,400 4,300 20,700 21%(16,000, 16,900) (3,200, 5,700) (19,500, 22,200) (16, 26%)
7,600 3,400 11,000 31%(7,300, 7,800) (2,400, 4,700) (10,000, 12,300) (24, 38%)
76,500 21,900 98,400 22%(75,000, 78,000) (17,200, 27,600) (93,500, 104,300) (18, 27%)
2 Lower bound, upper bound
Exposure group
3 Numbers may not add to total due to rounding and exclusion of data relating to HIV acquired through mother to child transmission and blood contact.
1 National estimates of the number of individuals living with HIV in the UK are obtained from a complex statistical model fitted to an ensemble of
surveillance and survey-type prevalence is available (1).
Women
Men who have sex with men
People who inject drugs
Total3
Heterosexuals
Non-African born
African born
Non-African born
Men
African born
1 National estimates of the number of individuals living with HIV in the UK are obtained from a complex statistical model fitted to
an ensemble of surveillance and survey-type data (1). 2 Lower bound, upper bound.
3 Numbers may not add to total due to rounding and exclusion of data relating to HIV acquired through mother to child
transmission and other transmission routes.

HIV in the United Kingdom: 2013 Report
Appendix 2: Adjusted number of HIV diagnoses by year of diagnosis and probable exposure group: UK, 2003-2012
2003 2004 2005 2006 2007 2008 2009 2010 2011 2012
Adjusted 2,180 2,480 2,680 2,670 2,900 2,810 2,850 2,850 2,960 3,250
Observed 2,145 2,446 2,644 2,616 2,834 2,657 2,655 2,691 2,781 2,964
Adjusted 4,850 4,940 4,870 4,450 4,140 4,130 3,490 3,210 2,980 2,880
Observed 4,783 4,880 4,808 4,362 4,034 3,942 3,286 2,992 2,779 2,581
Adjusted 170 160 190 200 180 190 170 160 140 120
Observed 167 155 186 196 177 176 154 148 132 111
Adjusted 210 210 180 190 170 140 170 150 140 110
Observed 203 197 176 182 164 140 160 142 129 103
Not Reported Observed 110 108 114 142 179 358 421 389 398 605
Total 7,408 7,786 7,928 7,498 7,388 7,273 6,676 6,362 6,219 6,364
Probable exposure category 1
Sex between men
Heterosexual
contact
Injecting drug use
Other exposure
categories
1 Data are adjusted for exposure group not reported.
2 Based on probable country of infection among those UK-born and estimates of CD4 decline in those born abroad.
Note: Appendices show actual numbers. Numbers presented in text are rounded.

HIV in the United Kingdom: 2013 Report
30
Appendix 3: Annual new HIV and AIDS diagnoses and deaths by year of diagnosis or death: UK, 1980-2012
1997 or
earlier1998 1999 2000 2001 2002 2003 2004 2005 2006 2007 2008 2009 2010 2011 2012
Cumulative
total 1,2,3
Men 30,389 2,149 2,263 2,550 3,169 3,676 4,111 4,497 4,676 4,514 4,716 4,619 4,476 4,321 4,431 4,559 89,116
Women 5,673 788 1,031 1,451 2,020 2,705 3,297 3,289 3,252 2,984 2,672 2,654 2,200 2,041 1,788 1,805 39,650
36,097 2,938 3,296 4,001 5,190 6,381 7,408 7,786 7,928 7,498 7,388 7,273 6,676 6,362 6,219 6,364 128,805
Men 14,030 619 584 627 531 637 582 598 614 525 552 512 441 434 286 269 21,841
Women 1,804 202 204 262 262 359 452 420 355 357 286 315 208 225 125 121 5,957
15,834 821 788 889 793 996 1,034 1,018 969 882 838 827 649 659 411 390 27,798
Men 11,636 416 391 388 359 417 400 339 441 414 426 456 426 530 401 367 17,807
Women 1,280 97 79 97 119 106 164 149 147 149 170 154 163 175 137 121 3,307
12,919 513 470 485 478 523 564 488 588 563 596 610 589 705 538 488 21,117Total3
Report type and sex
HIV diagnoses
First AIDS diagnoses
Deaths2
Total1
Total
Will include some records for the same individuals which are unmatchable because of differences in the information supplied. Numbers will rise as further reports are received, particularly for recent years. 1 Includes 39 HIV diagnoses of individuals with sex not reported (the majority of which are in earlier years).
2 Includes all reported deaths (all cause) in HIV diagnosed individuals.
3 Includes 3 death reports of individuals with sex not reported.
Note: Appendices show actual numbers. Numbers presented in text are rounded.

HIV in the United Kingdom: 2013 Report
31
Appendix 4: New HIV diagnoses by country and PHE region of diagnosis: UK, 1980-2012
1997 or
earlier1998 1999 2000 2001 2002 2003 2004 2005 2006 2007 2008 2009 2010 2011 2012 Total
ENGLAND
North of England 3,792 312 351 400 678 883 1,163 1,291 1,406 1,250 1,221 1,232 1,122 1,024 1,031 1,004 18,160
Midlands and East of England 2,811 288 323 488 763 1,238 1,435 1,562 1,518 1,520 1,417 1,320 1,226 1,197 1,093 1,121 19,320
London 21,704 1,796 2,057 2,380 2,815 3,012 3,273 3,271 3,253 3,115 3,024 3,039 2,839 2,730 2,615 2,832 63,755
South of England 2,377 194 217 274 426 563 685 673 744 694 695 678 605 527 562 543 10,457
ENGLAND (Total) 32,421 2,724 3,081 3,774 4,922 6,043 6,983 7,269 7,405 6,983 6,794 6,709 6,152 5,840 5,674 5,846 118,620
Wales 539 34 35 47 64 81 107 105 112 159 174 143 141 151 168 125 2,185
Northern Ireland 173 9 18 18 20 27 36 63 58 57 60 90 67 84 81 95 956
Scotland 2,812 163 161 161 171 219 272 345 348 287 353 325 309 283 286 287 6,782
Channel Islands and Isle of Man 52 7 0 1 5 8 4 4 4 9 7 5 4 4 8 6 128
UK Total1 36,097 2,938 3,296 4,001 5,190 6,381 7,408 7,786 7,928 7,498 7,388 7,273 6,676 6,362 6,219 6,364 128,805
Country and PHE region of
diagnosis
Will include some records for the same individuals which are unmatchable because of differences in the information supplied. Numbers will rise as further reports are received, particularly for recent years. 1 Includes 51 cases where region is not known.
Note: Appendices show actual numbers. Numbers presented in text are rounded.

HIV in the United Kingdom: 2013 Report
32
Appendix 5: Number and proportion of recently acquired infections at diagnosis (ascertained through the Recent Infection Testing Algorithm) by exposure and age group: England, Wales and Northern Ireland, 2012
15-24 25-34 35-49 50+ Total
Recent infections 55 137 80 19 291
Number RITA tested 249 572 540 155 1,516
% 22% 24% 15% 12% 19%
95% CI 17.1-27.8 20.5-27.7 11.9-18.1 7.5-18.5 17.2-21.3
Recent infections 3 6 12 7 28
Number RITA tested 23 87 220 109 439
% 13% 7% 5% 6% 6%
95% CI 2.8-33.6 2.6-14.4 2.8-9.3 2.6-12.8 4.3-9.1
Recent infections 12 20 10 7 49
Number RITA tested 70 203 281 88 642
% 17% 10% 4% 8% 8%
95% CI 9.2-28.0 6.1-14.8 1.7-6.4 3.3-15.7 5.7-10.0
Recent infections 15 27 24 14 80
Number RITA tested 94 297 522 204 1,117
% 16% 9% 5% 7% 7%
95% CI 9.2-25.0 6.1-13.0 3.0-6.8 3.8-11.2 5.7-8.8
Recent infections 70 174 111 38 393
Number RITA tested 363 947 1,170 402 2,882
% 19% 18% 9% 9% 14%
95% CI 15.4-23.7 16.0-21.0 7.9-11.3 6.8-12.7 12.4-14.9
Total
MSM
Heterosexual men
Heterosexual women
All Heterosexuals
1 Overall, 48% of new HIV diagnoses had a test for recent infection and this was similar across exposure groups.
Note: Appendices show actual numbers. Numbers presented in text are rounded.

HIV in the United Kingdom: 2013 Report
33
Appendix 6: Number of people living with diagnosed HIV infection by gender and age group seen for care: UK, 2003-2012
Gender1 Age group1 2003 2004 2005 2006 2007 2008 2009 2010 2011 2012
<15 375 419 469 456 469 470 440 404 372 365
15-24 682 745 889 1,044 1,106 1,165 1,216 1,307 1,431 1,535
25-34 6,006 6,330 6,560 6,834 7,097 7,367 7,535 7,697 7,927 8,328
35-49 13,764 15,683 17,596 19,497 21,227 22,764 24,200 25,179 26,227 26,895
>50 3,708 4,425 5,156 5,983 7,080 8,286 9,651 11,347 13,073 14,938
Total 24,535 27,602 30,670 33,814 36,979 40,052 43,042 45,934 49,030 52,061
<15 382 411 452 473 503 493 450 447 433 410
15-24 910 1,077 1,209 1,232 1,198 1,190 1,150 1,118 1,051 981
25-34 4,635 5,293 5,899 6,341 6,446 6,514 6,337 6,012 5,795 5,431
35-49 4,842 5,921 7,205 8,335 9,493 10,786 11,843 12,883 13,868 14,546
>50 653 860 1,088 1,339 1,592 1,984 2,391 2,904 3,468 4,185
Total 11,422 13,562 15,853 17,720 19,232 20,967 22,171 23,364 24,615 25,553
35,971 41,168 46,527 51,535 56,211 61,019 65,213 69,298 73,645 77,614
Men
Women
UK Total
1 Missing information is exluded, with the exception of the UK total.
Note: Appendices show actual numbers. Numbers presented in text are rounded.
HIV in the United Kingdom: 2013 Report
34
Appendix 7: Proportion of people living with diagnosed HIV infection receiving antiretroviral therapy by current CD4 count: UK, 2003-2012
2003 2004 2005 2006 2007 2008 2009 2010 2011 2012
68% 69% 69% 71% 71% 76% 78% 82% 84% 85%
n 24,558 28,241 32,016 36,680 40,045 46,124 50,772 56,576 61,506 66,351
N 35,971 41,168 46,527 51,535 56,211 61,019 65,213 69,298 73,645 77,614
n 24,090 27,797 31,590 35,560 39,562 45,822 50,213 55,973 61,270 66,090
N 35,285 40,521 45,908 49,961 55,533 60,620 64,495 68,560 73,362 77,309
75% 75% 74% 75% 76% 81% 83% 87% 88% 89%
n 11,249 12,426 13,490 13,707 14,003 14,344 13,883 13,605 14,068 13,135
N 15,054 16,625 18,152 18,340 18,455 17,621 16,688 15,680 15,980 14,760
n 9,525 11,302 12,343 12,413 12,515 13,246 12,520 12,396 13,338 11,954
N 12,752 15,143 16,622 16,628 16,513 16,297 15,062 14,293 15,178 13,431
Adjusted1
Observed
Adjusted1
Observed
Proportion receiving antiretroviral
therapy
Proportion with CD4 <350 receiving
antiretroviral therapy
1 Adjusted for missing treatment and CD4 information.
Note: Appendices show actual numbers. Numbers presented in text are rounded.

HIV in the United Kingdom: 2013 Report
35
Appendix 8: Proportion of newly HIV diagnosed people diagnosed late (CD4<350/mm3 within three months of diagnosis) by exposure group: UK, 2003-2012
2003 2004 2005 2006 2007 2008 2009 2010 2011 2012
%<350 42% 43% 42% 42% 40% 42% 40% 38% 36% 34%
Adjusted <350 1 916/2,180 1,065/2,480 1,126/2,680 1,122/2,670 1,160/2,900 1,181/2,810 1,140/2,850 1,083/2,850 1,066/2,960 1,105/3,250
Observed <350 2 704/1,679 835/1,933 898/2,136 937/2,360 937/2,360 940/2,213 931/2,324 920/2,390 885/2,489 821/2,392
%<350 70% 69% 70% 67% 68% 67% 67% 63% 67% 65%
Adjusted <350 1 1,200/1,714 1,249/1,810 1,230/1,756 1,088/1,623 1,097/1,612 1,068/1,594 956/1,427 818/1,297 871/1,300 751/1,155
Observed <350 2 874/1,243 928/1,354 951/1,351 816/1,224 795/1,176 786/1,172 733/1,095 669/1,056 692/1,037 557/860
%<350 63% 62% 62% 64% 60% 61% 60% 57% 58% 57%
Adjusted <350 1 1,975/3,134 1,942/3,131 1,932/3,116 1,806/2,821 1,514/2,523 1,549/2,538 1,240/2,066 1,087/1,907 975/1,680 864/1,728
Observed <350 2 1,478/2,337 1,501/2,422 1,494/2,422 1,354/2,100 1,084/1,817 1,147/1,892 991/1,657 867/1,510 758/1,311 671/1,181
%<350 51% 61% 54% 52% 61% 47% 50% 49% 53% 64%
Adjusted <350 1 87/170 98/160 103/190 104/200 110/180 90/190 85/170 79/160 75/140 77/120
Observed <350 2 56/109 63/103 68/125 73/140 73/119 61/130 59/118 59/120 51/97 49/77
%<350 58% 57% 57% 56% 53% 54% 52% 50% 49% 47%
Adjusted <350 1 4,297/7,408 4,438/7,786 4,519/7,928 4,199/7,498 3,916/7,388 3,928/7,273 3,472/6,676 3,181/6,362 3,048/6,219 2,991/6,364
Observed <350 2 3,154/5,428 3,358/5,856 3,457/6,100 3,146/5,574 2,962/5,575 3,071/5,647 2,850/5,467 2,623/5,270 2,514/5,167 2,243/4,745
Overall
Exposure group
MSM
Heterosexual
men
Heterosexual
women
People who
inject drugs
1 Adjusted for missing exposure information and missing CD4 counts.
2 New diagnoses are matched to the CD4 surveillance scheme and 82% had a CD4 cell count available within 14 days prior to and 91 days after diagnosis date.
Note: Appendices show actual numbers. Numbers presented in text are rounded.

HIV in the United Kingdom: 2013 Report
Appendix 9: Prevalence of diagnosed HIV infection ≥ 2 per 1,000 population (aged 15-59 years) by local authority: London, 2012
Number living with
diagnosed HIV infection
Estimated resident
population in 1,000s1
Diagnosed HIV
prevalence per 1,000
(aged 15-59) (aged 15-59) (aged 15-59)
London
Lambeth 3,232 224.6 14.39
Southwark 2,554 209.9 12.17
Kensington and Chelsea 958 104.4 9.18
City of London 48 5.4 8.89
Westminster 1,373 156.5 8.77
Islington 1,295 153.4 8.44
Camden 1,304 155.5 8.39
Lewisham 1,509 190.0 7.94
Hackney 1,374 177.4 7.75
Hammersmith and Fulham 990 128.0 7.73
Haringey 1,154 177.1 6.52
Newham 1,398 216.3 6.46
Tower Hamlets 1,193 191.0 6.25
Barking and Dagenham 668 116.6 5.73
Greenwich 950 169.7 5.60
Croydon 1,168 230.2 5.07
Wandsworth 1,094 220.1 4.97
Waltham Forest 817 172.8 4.73
Enfield 814 196.5 4.14
Brent 827 208.0 3.98
Merton 511 131.8 3.88
Hounslow 611 169.8 3.60
Ealing 704 222.4 3.17
Barnet 660 225.8 2.92
Redbridge 485 177.3 2.74
Hillingdon 460 177.3 2.59
Bexley 333 138.7 2.40
Sutton 285 118.8 2.40
Bromley 439 184.8 2.38
Richmond upon Thames 275 116.5 2.36
Harrow 321 150.1 2.14
Local Authority
1 Office for National Statistics

HIV in the United Kingdom: 2013 Report
Prevalence of diagnosed HIV infection ≥ 2 per 1,000 population (aged 15-59 years) by local authority: England (Outside London), 2012
Residents receiving
HIV-related care
Estimated resident
population in 1,000s1
Diagnosed HIV
prevalence per 1,000
(aged 15-59) (aged 15-59) (aged 15-59)
Outside London
Brighton and Hove 1,434 185.0 7.75
Manchester 1,983 350.1 5.66
Salford 663 148.0 4.48
Luton 541 128.2 4.22
Blackpool 290 81.5 3.56
Leicester 757 213.1 3.55
Slough 306 90.6 3.38
Reading 324 103.2 3.14
Northampton 402 132.2 3.04
Crawley 206 68.0 3.03
Coventry 608 200.7 3.03
Bournemouth 335 116.2 2.88
Watford 165 58.1 2.84
Southend-on-Sea 287 101.8 2.82
Nottingham 576 207.2 2.78
Milton Keynes 422 156.3 2.70
Harlow 123 49.8 2.47
Wolverhampton 369 150.0 2.46
Oxford 255 105.0 2.43
Worthing 142 59.3 2.39
Birmingham 1,542 666.2 2.31
Lewes 120 52.5 2.29
Leeds 1,048 475.2 2.21
Eastbourne 119 54.7 2.18
Stevenage 112 52.3 2.14
Woking 127 59.5 2.13
Adur 72 33.9 2.12
Corby 81 38.7 2.09
Norwich 181 87.1 2.08
Sandwell 376 185.5 2.03
Bedford 191 94.4 2.02
Hastings 107 52.9 2.02
Local Authority
1 Office for National Statistics

HIV in the United Kingdom: 2013 Report
38
Appendix 10: HIV testing coverage by gender, male sexual orientation, and age group: England, 2012
Age group
<15 637 487 357 76 56
15-19 57,953 52,202 42,711 90 74
20-24 131,386 119,645 101,280 91 77
25-34 161,948 146,008 125,618 90 78
35-44 67,198 58,927 49,920 88 74
45-64 45,737 38,816 32,712 85 72
65+ 4,566 3,462 2,849 76 62
Total2 469,448 419,565 355,463 89 76
<15 68 58 51 85 75
15-19 6,141 5,640 5,304 92 86
20-24 17,049 15,711 14,993 92 88
25-34 30,888 27,964 26,730 91 87
35-44 17,991 15,634 14,669 87 82
45-64 12,865 10,723 9,930 83 77
65+ 1,345 1,118 1,024 83 76
Total2 86,356 76,856 72,706 89 84
<15 770 575 432 75 56
15-19 67,872 60,580 50,392 89 74
20-24 156,148 141,313 121,583 90 78
25-34 202,830 181,459 159,068 89 78
35-44 89,976 77,840 67,488 87 75
45-64 62,097 51,685 44,527 83 72
65+ 6,287 4,765 4,028 76 64
Total2 586,217 518,364 447,601 88 76
<15 5,548 4,090 2,733 74 49
15-19 149,538 124,866 94,185 84 63
20-24 197,832 169,729 138,834 86 70
25-34 201,202 167,850 139,849 83 70
35-44 78,080 63,024 51,345 81 66
45-64 42,726 33,283 26,935 78 63
65+ 2,257 1,197 917 53 41
Total2 677,620 564,273 454,926 83 67
<15 6,318 4,665 3,165 74 50
15-19 217,432 185,463 144,589 85 66
20-24 354,014 311,064 260,435 88 74
25-34 404,080 349,345 298,947 86 74
35-44 168,075 140,879 118,846 84 71
45-64 104,836 84,977 71,470 81 68
65+ 8,544 5,962 4,945 70 58
Total2 1,263,977 1,082,738 902,609 86 71
Women
Total
Gender
Men
Hete
rosexu
al
MS
M
(by sexual
orientation)
All
HIV testing
GUM
attendees1Offered Tested Offered % Coverage %
1Includes people where any of the following variables were not known: ethnicity, sexual orientation, sex, area of residence.
2 Totals include where age is not known.
Note: Appendices show actual numbers. Numbers presented in text are rounded

HIV in the United Kingdom: 2013 Report
39
Appendix 11:
HIV test uptake by gender, male sexual orientation, and age group: England, 2012
Age group
<15 765 554 399 72 72
15-19 71,239 60,241 47,801 85 79
20-24 157,708 134,694 110,948 85 82
25-34 190,886 160,768 135,338 84 84
35-44 79,754 64,005 53,189 80 83
45-64 55,476 41,921 34,757 76 83
65+ 5,861 3,742 3,025 64 81
Total2 561,718 465,945 385,474 83 83
<15 97 69 60 71 87
15-19 8,733 7,157 6,653 82 93
20-24 23,839 19,933 18,816 84 94
25-34 43,122 35,687 33,799 83 95
35-44 25,055 19,601 18,192 78 93
45-64 18,022 13,072 11,955 73 91
65+ 1,941 1,339 1,216 69 91
Total2 120,821 96,868 90,698 80 94
<15 940 658 487 70 74
15-19 84,456 70,511 57,124 83 81
20-24 190,455 161,178 135,554 85 84
25-34 245,373 204,528 176,311 83 86
35-44 110,474 87,177 74,508 79 85
45-64 77,696 57,281 48,702 74 85
65+ 8,293 5,285 4,408 64 83
Total2 717,978 586,780 497,182 82 85
<15 7,920 5,221 3,289 66 63
15-19 199,271 152,188 109,354 76 72
20-24 247,082 196,820 155,396 80 79
25-34 244,404 189,463 153,198 78 81
35-44 95,046 69,882 55,421 74 79
45-64 52,597 36,338 28,800 69 79
65+ 3,030 1,278 964 42 75
Total2 849,885 651,453 506,559 77 78
<15 8,860 5,879 3,776 66 64
15-19 283,751 222,716 166,490 78 75
20-24 437,572 358,021 290,968 82 81
25-34 489,825 394,027 329,539 80 84
35-44 205,542 157,076 129,944 76 83
45-64 130,306 93,628 77,510 72 83
65+ 11,323 6,563 5,372 58 82
Total2 1,568,009 1,238,337 1,003,825 79 81
All
Men
(by sexual
orientation)
Total
New GUM
episode1
Women
HIV testing
Uptake %
Hete
rosexu
al
MS
M
GenderOffered Tested Offered %
1 Defined as a visit to an STI clinic including all subsequent STI attendances during the following six weeks.
Note: Appendices show actual numbers. Numbers presented in text are rounded.
Related Documents