MORRISON INSTITUTE FOR PUBLIC POLICY HITS AND MISSES: FAST GROWTH IN METROPOLITAN PHOENIX MORRISON INSTITUTE FOR PUBLIC POLICY SEPTEMBER YEAR TWO THOUSAND

Welcome message from author
This document is posted to help you gain knowledge. Please leave a comment to let me know what you think about it! Share it to your friends and learn new things together.
Transcript

MORRISON INSTITUTE FOR PUBLIC POLICY
H I T S A N D M I S S E S :FA S T G R O W T H I N M E T R O P O L I TA N P H O E N I X
MORRISON INSTITUTE FOR PUBLIC POLICY SEPTEMBER YEAR TWO THOUSAND
This document is copyrighted ©2000 by the Arizona Board of Regents for and on behalf of Arizona State University and its Morrison Institute for Public Policy.
FUNDERSAPS
Blue Cross and Blue Shield of Arizona
City of Chandler
City of Glendale
City of Mesa
City of Peoria
City of Phoenix
City of Scottsdale
City of Tempe
East Valley Partnership
Greater Phoenix Chamber of Commerce
Greater Phoenix Economic Council
Greater Phoenix Leadership
Maricopa County
Motorola, Inc.
Salt River Project
StarDust Foundation
Scottsdale Chamber of Commerce/Scottsdale Partnership
WESTMARC
ADVISORSJulie Alvarado, Motorola
John Benton, Benton-Robb Development
Steven Betts, Gallagher & Kennedy
Jerry Bisgrove, StarDust Companies
Richard Bowers, City of Scottsdale
Gary Brown, City of Tempe
Wayne Brown, Mayor, City of Mesa
Jay Butler, College of Business, Arizona State University
Sam Campana, Mayor, City of Scottsdale
Frank Fairbanks, City of Phoenix
Joanie Flatt, East Valley Partnership
Ed Fox, APS
Grady Gammage, Jr., Gammage & Burnham
Neil Giuliano, Mayor, City of Tempe
Terry Goddard, U.S. Department of Housing & Urban Development
Andrew Gordon, Coppersmith & Gordon, PLC
Phil Gordon, City Council Member, City of Phoenix
Lloyd Harrell, City of Chandler
Timothy Hogan, Center for Business Research,Arizona State University
John Keegan, Mayor, City of Peoria
Michael Kelly, City of Phoenix
Paul Koehler, Peoria Unified School District
Diane McCarthy, WESTMARC
Sharon Megdal, MegEcon Consulting
Chris Mulholland, Scottsdale Chamber of Commerce
Margaret Mullen, Urban Realty Partners
John Ogden, SunCor Development Company
Kevin Olson, Steptoe & Johnson
A. J. Pfister, School of Public Affairs, Arizona State University
Charles Redman, Center for Environmental Studies,Arizona State University
Skip Rimsza, Mayor, City of Phoenix
Mark Schnepf, Mayor, Town of Queen Creek
Elaine Scruggs, Mayor, City of Glendale
Tom Simplot, BRS Group
Frederick Steiner, School of Planning and Landscape Architecture, Arizona State University
Martin Vanacour, City of Glendale
Rick Weddle, Greater Phoenix Economic Council
Mike Welborn, Bank One Arizona
Keven Ann Willey, The Arizona Republic
REVIEW CADRERichard Bowers, City Manager, City of Scottsdale
R. Thomas Browning, Executive Director, Greater Phoenix Leadership
Robert Bulla, President, Executive Division, Blue Cross and Blue Shield of Arizona
John DeGrove, Director, Joint Center for Environmental & Urban Problems, Florida Atlantic University
Frank Fairbanks, City Manager, City of Phoenix
Ed Fox, Vice President, Environmental, Health, Safety & New Technology Ventures, APS
Grady Gammage, Jr., Attorney, Gammage & Burnham
Terry Goddard, State Coordinator, U.S. Departmentof Housing & Urban Development
John Hall, Professor, School of Public Affairs, Arizona State University
Lloyd Harrell, City Manager, City of Chandler
Edward W. Hill, Professor, Maxine Goodman LevinCollege of Urban Affairs, Cleveland State University
Linda Hollis, Senior Research Associate, Solimar Research Group
Jim Holway, Assistant Director, Arizona Department of Water Resources
Bruce Katz, Director and Senior Fellow, Center on Urban and Metropolitan Policy, The Brookings Institution
Robert Lang, Director, Urban and MetropolitanResearch, The Fannie Mae Foundation
Diane McCarthy, President, WESTMARC
Frank Mizner, Planning Director, City of Mesa
Rolf Pendall, Assistant Professor, City and Regional Planning, Cornell University
A. J. Pfister, Distinguished Research Fellow, Arizona State University
Luther Propst, Executive Director, Sonoran Institute
Charles Redman, Director, Center for EnvironmentalStudies, Arizona State University
Judy Richardson, First Vice President, School Finance Consulting Services, Peacock, Hislop, Staley & Given, Inc.
Ethan Seltzer, Director, Institute of PortlandMetropolitan Studies, Portland State University
Frederick Steiner, Director, School of Planning:Landscape Architecture, Arizona State University
Martin Vanacour, City Manager, City of Glendale
Rick Weddle, President,Greater Phoenix Economic Council
AcknowledgmentsMany people and organizations contributed to the preparation of this report. The work of scores of people and thesupport provided by public- and private-sector organizations are acknowledged gratefully. Nevertheless, the viewsexpressed here remain solely those of Morrison Institute for Public Policy. Any errors of fact or interpretation arethe responsibility of Morrison Institute. The Institute specifically thanks the following people and organizations.

Morrison Institute for Public Policy
School of Public Affairs | College of Public Programs | Arizona State University
P.O. Box 874405, Tempe Arizona 85287-4405 Voice (480) 965-4525 Fax (480) 965-9219 http://www.asu.edu/copp/morrison
Mary Jo WaitsAssociate Director
Morrison Institute for Public Policy
Rebecca L. GauSenior Research Analyst
Morrison Institute for Public Policy
Mark MuroSenior Research Analyst
Morrison Institute for Public Policy
Tina ValdecanasSenior Research Analyst
Morrison Institute for Public Policy
Tom R. RexResearch Manager, Center for Business Research
Arizona State University
Leonard G. BowerEconomist
Elizabeth BurnsProfessor, Department of Geography
Arizona State University
Lisa DeLorenzoAssistant Professor, School of Public Affairs
Arizona State University
William FultonPresident
Solimar Research Group
Patricia GoberProfessor, Department of Geography Arizona State University
John HallProfessor, School of Public Affairs Arizona State University
Alicia HarrisonResearch Associate Solimar Research Group
Kent Hill Assistant Research Professional Department of Economics Arizona State University
Glen KrutzAssistant Professor, Department of Political Science Arizona State University
Scott SmithSupport Systems Analyst Information Technology Research Support Lab –GIS Services, Arizona State University
Jamie Goodwin-White, Graduate Assistant Morrison Institute for Public Policy
Christina Kinnear, Graduate Assistant Morrison Institute for Public Policy
Laura Valenzuela, Graduate Assistant Morrison Institute for Public Policy
SEPTEMBER 2000
Research Team:
With Assistance From:
Rob Melnick, Morrison Institute for Public PolicyKaren Heard, Chalk Design
Nancy Welch, The Insight GroupCherylene Schick, Morrison Institute for Public Policy
H I T S A N D M I S S E S :FA S T G R O W T H I N M E T R O P O L I TA N P H O E N I X

Hits and Misses: Fast Growth in Metropolitan Phoenix is the first productof a comprehensive effort to describe and analyze the region’s growth. TheBrookings Institution Center on Urban and Metropolitan Policy inWashington, D.C. presented the opportunity for this project to MorrisonInstitute for Public Policy.
The Brookings Institution has been engaging leading local scholars tostudy the role of government policies in growth and development patternsin various metropolitan areas in recent years. As part of this urban agenda,the Brookings Center invited Morrison Institute to prepare a case study ofthe Phoenix region to supplement reports on the other five cities alreadyinvolved in the national research. Soon thereafter, Morrison Institute invit-ed a number of metropolitan Phoenix cities, businesses and civic alliancesto provide financial support for this new investigation. The supportingorganizations were eager to obtain fresh, quality information about growthin the area at a time of increasing anxiety about the topic. They also saw thebenefit of showcasing metropolitan Phoenix’ sometimes surprising storywithin Brookings’ larger set of case studies.
The formal Phoenix case study will appear next year as a chapter in aBrookings Institution book with national distribution. However, the press-ing public debate about growth issues in metropolitan Phoenix obliged
Morrison Institute to make its findings available locally now. This detaileddocument offers significant data and discussion not included in the formalBrookings case study. It also features a finer-grained local focus for localaudiences. Morrison Institute hopes the analyses and recommendations willfoster a better understanding of the dynamics at work in this region andsupport wise decisions in the future.
Some readers will wonder why Hits and Misses does not take a specificstand on the growth management measures on the November 2000 ballot.The two measures represent a key moment in both Phoenix’ and the state’sgrowth history, so this report’s silence on the proposals may seem peculiar.However, in keeping with this study’s purpose to identify the causes ofgrowth patterns, the Morrison Institute team chose to pass over discussionof particular ballot items in favor of offering fresh data and new options forthinking about the challenges and opportunities of rapid growth. Such anapproach sacrifices topicality in favor of a potentially longer-lasting effecton the region’s future.
The story of growth in metropolitan Phoenix is a complicated, oftensurprising, tale. There is much to be proud of in the region. Yet there is alsomuch to worry about, and much that needs to be done. Hits and Misses willhave been successful if it becomes a catalyst for getting started.
A NOTE ABOUT DATAAny study of this kind depends on accumulating a comprehensive and up-to-date body of research that can inform regional policy making. Fortunately, many cities in the region as well asthe Maricopa Association of Governments (MAG), the Central Arizona-Phoenix Long-Term Ecological Research Project at Arizona State University, the state of Arizona and the federal governmentmaintain large bodies of useful data on the region’s job market, population, land-use and transportation trends. However, assembling a comprehensive statistical picture of the region remainsproblematic. Differences in collection efforts among metropolitan Phoenix cities and agencies make the assembly of consistent, city-by-city databases difficult. Hard figures do not exist fornumerous topics. Or, relevant numbers date back a number of years. The U.S. Bureau of the Census most detailed statistics covering small geographic divisions, for example, date to either the1990 census or the MAG 1995 special census, precluding more up-to-date accountings. Clearly this lack of timely data creates difficulties when speaking of a fast-changing region such asmetropolitan Phoenix. Nevertheless, Morrison Institute remains confident the trends it highlights here hold for the region.
Preface
1MORRISON INSTITUTE FOR PUBLIC POLICY
Table of ContentsEXECUTIVE SUMMARY . . . . . . . . . . . . . . . . . . . . . . . . . . . . . . . . . . . . . . . . . . . . . . . . . . . . . . . . . . . . . . . . . . . . . . . . . . . . . . . .2
INTRODUCTION . . . . . . . . . . . . . . . . . . . . . . . . . . . . . . . . . . . . . . . . . . . . . . . . . . . . . . . . . . . . . . . . . . . . . . . . . . . . . . . . . . . . .5
THE SHAPE OF FAST GROWTH . . . . . . . . . . . . . . . . . . . . . . . . . . . . . . . . . . . . . . . . . . . . . . . . . . . . . . . . . . . . . . . . . . . . . . . . . .7Population is Booming . . . . . . . . . . . . . . . . . . . . . . . . . . . . . . . . . . . . . . . . . . . . . . . . . . . . . . . . . . . . . . . . . . . . . . . . . . . . . . . . . . .8Metropolitan Phoenix is Becoming Denser . . . . . . . . . . . . . . . . . . . . . . . . . . . . . . . . . . . . . . . . . . . . . . . . . . . . . . . . . . . . . . . . . . .10Employment Remains Concentrated . . . . . . . . . . . . . . . . . . . . . . . . . . . . . . . . . . . . . . . . . . . . . . . . . . . . . . . . . . . . . . . . . . . . . . . .12Road Building is Accelerating . . . . . . . . . . . . . . . . . . . . . . . . . . . . . . . . . . . . . . . . . . . . . . . . . . . . . . . . . . . . . . . . . . . . . . . . . . . . .14The Fringe is Exploding . . . . . . . . . . . . . . . . . . . . . . . . . . . . . . . . . . . . . . . . . . . . . . . . . . . . . . . . . . . . . . . . . . . . . . . . . . . . . . . . . .16The Phoenix Region is Using a Lot of Land . . . . . . . . . . . . . . . . . . . . . . . . . . . . . . . . . . . . . . . . . . . . . . . . . . . . . . . . . . . . . . . . . .18The City of Phoenix’ Resources are Balanced Compared to Its Largest Suburbs . . . . . . . . . . . . . . . . . . . . . . . . . . . . . . . . . . . . .20The Region is Becoming More Diverse . . . . . . . . . . . . . . . . . . . . . . . . . . . . . . . . . . . . . . . . . . . . . . . . . . . . . . . . . . . . . . . . . . . . . .22Schools are Divided . . . . . . . . . . . . . . . . . . . . . . . . . . . . . . . . . . . . . . . . . . . . . . . . . . . . . . . . . . . . . . . . . . . . . . . . . . . . . . . . . . . . .24Aggressive Annexation is a Metropolitan Phoenix Tradition . . . . . . . . . . . . . . . . . . . . . . . . . . . . . . . . . . . . . . . . . . . . . . . . . . . . .26
WHAT’S BEHIND THE TRENDS . . . . . . . . . . . . . . . . . . . . . . . . . . . . . . . . . . . . . . . . . . . . . . . . . . . . . . . . . . . . . . . . . . . . . . . . .29Timing and National Trends . . . . . . . . . . . . . . . . . . . . . . . . . . . . . . . . . . . . . . . . . . . . . . . . . . . . . . . . . . . . . . . . . . . . . . . . . . . . . .29
Coming of Age in the Auto Era . . . . . . . . . . . . . . . . . . . . . . . . . . . . . . . . . . . . . . . . . . . . . . . . . . . . . . . . . . . . . . . . . . . . . . . . . . . . . . .29The Advent of Air Conditioning . . . . . . . . . . . . . . . . . . . . . . . . . . . . . . . . . . . . . . . . . . . . . . . . . . . . . . . . . . . . . . . . . . . . . . . . . . . . . . .29
Local Circumstances . . . . . . . . . . . . . . . . . . . . . . . . . . . . . . . . . . . . . . . . . . . . . . . . . . . . . . . . . . . . . . . . . . . . . . . . . . . . . . . . . . . .29Topography and Climate . . . . . . . . . . . . . . . . . . . . . . . . . . . . . . . . . . . . . . . . . . . . . . . . . . . . . . . . . . . . . . . . . . . . . . . . . . . . . . . . . . . . .29The Real Estate Crash . . . . . . . . . . . . . . . . . . . . . . . . . . . . . . . . . . . . . . . . . . . . . . . . . . . . . . . . . . . . . . . . . . . . . . . . . . . . . . . . . . . . . . .29Government Land Ownership . . . . . . . . . . . . . . . . . . . . . . . . . . . . . . . . . . . . . . . . . . . . . . . . . . . . . . . . . . . . . . . . . . . . . . . . . . . . . . . . .29
Policies and Effects . . . . . . . . . . . . . . . . . . . . . . . . . . . . . . . . . . . . . . . . . . . . . . . . . . . . . . . . . . . . . . . . . . . . . . . . . . . . . . . . . . . . .29Water, Land and Transportation Choices . . . . . . . . . . . . . . . . . . . . . . . . . . . . . . . . . . . . . . . . . . . . . . . . . . . . . . . . . . . . . . . . . . . . . . . .30
Securing Water . . . . . . . . . . . . . . . . . . . . . . . . . . . . . . . . . . . . . . . . . . . . . . . . . . . . . . . . . . . . . . . . . . . . . . . . . . . . . . . . . . . . . . . . .30Holding onto Land . . . . . . . . . . . . . . . . . . . . . . . . . . . . . . . . . . . . . . . . . . . . . . . . . . . . . . . . . . . . . . . . . . . . . . . . . . . . . . . . . . . . . .30Delaying the Freeways . . . . . . . . . . . . . . . . . . . . . . . . . . . . . . . . . . . . . . . . . . . . . . . . . . . . . . . . . . . . . . . . . . . . . . . . . . . . . . . . . . .32What this Means . . . . . . . . . . . . . . . . . . . . . . . . . . . . . . . . . . . . . . . . . . . . . . . . . . . . . . . . . . . . . . . . . . . . . . . . . . . . . . . . . . . . . . . .32
Growth Management Efforts . . . . . . . . . . . . . . . . . . . . . . . . . . . . . . . . . . . . . . . . . . . . . . . . . . . . . . . . . . . . . . . . . . . . . . . . . . . . . . . . .33Paying for Growth . . . . . . . . . . . . . . . . . . . . . . . . . . . . . . . . . . . . . . . . . . . . . . . . . . . . . . . . . . . . . . . . . . . . . . . . . . . . . . . . . . . . . . .34Keeping the Center Vital . . . . . . . . . . . . . . . . . . . . . . . . . . . . . . . . . . . . . . . . . . . . . . . . . . . . . . . . . . . . . . . . . . . . . . . . . . . . . . . . . .34Protecting Open Space . . . . . . . . . . . . . . . . . . . . . . . . . . . . . . . . . . . . . . . . . . . . . . . . . . . . . . . . . . . . . . . . . . . . . . . . . . . . . . . . . . .36What this Means . . . . . . . . . . . . . . . . . . . . . . . . . . . . . . . . . . . . . . . . . . . . . . . . . . . . . . . . . . . . . . . . . . . . . . . . . . . . . . . . . . . . . . . .36
Governance . . . . . . . . . . . . . . . . . . . . . . . . . . . . . . . . . . . . . . . . . . . . . . . . . . . . . . . . . . . . . . . . . . . . . . . . . . . . . . . . . . . . . . . . . . . . . . .37Western Values . . . . . . . . . . . . . . . . . . . . . . . . . . . . . . . . . . . . . . . . . . . . . . . . . . . . . . . . . . . . . . . . . . . . . . . . . . . . . . . . . . . . . . . . .37Strong Cities . . . . . . . . . . . . . . . . . . . . . . . . . . . . . . . . . . . . . . . . . . . . . . . . . . . . . . . . . . . . . . . . . . . . . . . . . . . . . . . . . . . . . . . . . . .37Weak Regional Entities . . . . . . . . . . . . . . . . . . . . . . . . . . . . . . . . . . . . . . . . . . . . . . . . . . . . . . . . . . . . . . . . . . . . . . . . . . . . . . . . . . .37Polarized Civic Agendas . . . . . . . . . . . . . . . . . . . . . . . . . . . . . . . . . . . . . . . . . . . . . . . . . . . . . . . . . . . . . . . . . . . . . . . . . . . . . . . . . .37Spotty State Leadership . . . . . . . . . . . . . . . . . . . . . . . . . . . . . . . . . . . . . . . . . . . . . . . . . . . . . . . . . . . . . . . . . . . . . . . . . . . . . . . . . .38What this Means . . . . . . . . . . . . . . . . . . . . . . . . . . . . . . . . . . . . . . . . . . . . . . . . . . . . . . . . . . . . . . . . . . . . . . . . . . . . . . . . . . . . . . . .38
WHAT TO DO . . . . . . . . . . . . . . . . . . . . . . . . . . . . . . . . . . . . . . . . . . . . . . . . . . . . . . . . . . . . . . . . . . . . . . . . . . . . . . . . . . . . . .40Understand the Full Range of Issues . . . . . . . . . . . . . . . . . . . . . . . . . . . . . . . . . . . . . . . . . . . . . . . . . . . . . . . . . . . . . . . . . . . . . . .40Overcome Near Catch-22’s . . . . . . . . . . . . . . . . . . . . . . . . . . . . . . . . . . . . . . . . . . . . . . . . . . . . . . . . . . . . . . . . . . . . . . . . . . . . . . .40Be Alert to Upcoming Trends . . . . . . . . . . . . . . . . . . . . . . . . . . . . . . . . . . . . . . . . . . . . . . . . . . . . . . . . . . . . . . . . . . . . . . . . . . . . .42
THE FUTURE AT A GLANCE . . . . . . . . . . . . . . . . . . . . . . . . . . . . . . . . . . . . . . . . . . . . . . . . . . . . . . . . . . . . . . . . . . . . . . . . . . .43
Notes and Methodology . . . . . . . . . . . . . . . . . . . . . . . . . . . . . . . . . . . . . . . . . . . . . . . . . . . . . . . . . . . . . . . . . . . . . . . . . . . . . . . . . . . .44
Appendix . . . . . . . . . . . . . . . . . . . . . . . . . . . . . . . . . . . . . . . . . . . . . . . . . . . . . . . . . . . . . . . . . . . . . . . . . . . . . . . . . . . . . . . . . . . . . . . .46

2 HITS AND MISSES: Fast Growth in Metropol i tan Phoenix
Phoenix is often viewed as the quintessential Sunbelt metropolis: young,fast-growing, auto-centered, and sprawling. While some facets of the stereo-type are accurate, the complete picture of metropolitan Phoenix is morecomplex. In some notable ways, metropolitan Phoenix’ story is one of success.For example, compared to other urban regions, the Phoenix metropolitanarea is fairly compact with relative equity between its core city and its suburbs.Prospectively, however, the challenges are great. The desert landscape ischanging and some educational and economic divides are obvious, plus themechanisms available to cope with problems may be insufficient to handlemany rapidly-evolving situations.
Hits and Misses is based on a wide-ranging set of projects undertakenby scholars at Morrison Institute for Public Policy (School of Public Affairs,Arizona State University) during the past year. Overall, this research providesan updated and expanded view of regional growth and development trendsand the pressures that will challenge the region’s residents and policy makersin the future.
This has been a complicated inquiry, given the tangle of events, trendsand circumstances that affect and shape any region. Still, two things standout about metropolitan Phoenix’ growth experience.
1) Metropolitan Phoenix has grown differently from other urban regionsand in ways that defy conventional wisdom.
• Density is increasing. Given residents’ dependence on cars, mostpeople would not expect the Phoenix region to be showing increasesin population density from its core to its edges. But it is – making it one of only a handful of large areas in the country to do so.Population grew 263 percent between 1960 and 1990, while theurbanized area expanded 199 percent during the same period. By contrast, metropolitan Chicago gained 4 percent in population whileurban land area increased 47 percent. Metropolitan Atlanta consumednearly twice as much land as metropolitan Phoenix to accommodateapproximately the same number of people.
• The region’s center is holding. Employment remains concentrated inthe metropolitan Phoenix core, unlike in many other urban regions. Jobsin the area’s center account for 32 percent of the region’s employment.In addition, both population and employment rose in the heart of themetropolitan area in the 1990s, although the rate of expansion was lessrobust than in other parts of the region. Still, these healthy signs belie the“hollowing out” that has plagued many other regions.
• The region’s core city and its major suburbs are quite balanced. Inkeeping with the vitality of its center, metropolitan Phoenix is alsofortunate to retain a measure of balance among its major cities. Theabsence of glaring disparities between the center and the next largestcities – at least in terms of housing values, jobs and retail activity –stands in contrast to other metropolitan areas and bodes well for thefuture of the core and the entire region.
• People and businesses keep coming. To stay the same in today’sworld usually means going backward. Metropolitan Phoenix still is
experiencing phenomenal growth with nearly 700,000 new residents(31 percent more) and approximately 500,000 more jobs in just lessthan 10 years. Between 1997-1998 alone, approximately 1,300 newbusiness establishments were counted in metropolitan Phoenix. Theregion now ranks 13th in high-tech jobs.
2) Metropolitan Phoenix faces extraordinary challenges because of localcircumstances and the effects of past public policy decisions.
• Residential development is moving outward very swiftly. Overall in the last five years, the urban edge has advanced nearly one-half mileper year. In the southeast, the fringe pushed out an average of three-fourths of a mile each year. The region’s heaviest home building isnow occurring in a ring some 18 to 21 miles from downtown Phoenix.It is fair to ask: How far out will the ring of development need to bepushed to accommodate the 1.6 million additional residents projectedin the region by 2020?
• Metropolitan Phoenix is using up its agricultural and desert land.Calculations from aerial photographs show that between 1975 and1995 some 40 percent of all agricultural land and 32 percent of allundeveloped desert land was lost to urbanization. The vivid SonoranDesert is what makes metropolitan Phoenix unique and gives it a special character. Losing huge tracts of land threatens the region withthe loss of its most famous lifestyle and environmental asset.
• A regional divide exists by race, poverty and schools. For years, thesections north and northeast of downtown Phoenix, includingScottsdale, have been affluent areas with attractive housing, goodschools, and enviable amenities. Also for years, poor whites and low-income minorities have been concentrated in neighborhoods in the central and southern portions of the city of Phoenix. Thedemographic divide plays out in schools as well, with few poor andminority students in high-achieving school districts.
• The region’s rapid growth disturbs the majority of residents. Since itsinception three years ago, the Morrison Institute quality of life surveyhas documented the breadth and depth of residents’ discontent withgrowth. In 1999, 80 percent of residents said they were “concerned” or“very concerned” with the region’s growth. Most dramatically, nearlyhalf reported that they would leave Phoenix tomorrow if they could.Two-thirds added that the region was doing a “poor” or “fair” job ofpreserving the desert and open space.
THE RESPONSE: THREE STRATEGIC RECOMMENDATIONSAs the region’s leaders and residents decide what to do next, actions in threestrategic areas seem imperative.
First, the Phoenix region needs to understand the full range of issues thatshape its growth and development patterns. The region’s emerging divisions,transportation challenges, loss of desert lands, and the many other growth
Executive Summary
H I T S A N D M I S S E S :FA S T G R O W T H I N M E T R O P O L I TA N P H O E N I X

3MORRISON INSTITUTE FOR PUBLIC POLICY
issues that threaten metropolitan Phoenix’ quality of life are inextricablylinked and cut across jurisdictional boundaries.
The smartest regions today have embraced the “four E’s” of a strongeconomy, healthy environment, social equity and civic engagement as aframework for analyzing problems and building regional advantages. Theyrecognize that everything is connected.
Metropolitan Phoenix’ leaders can disregard the relationships amongthe region’s education, social, economic and environmental challenges andhope for the best. But they would do better if together they “connected thedots” among the issues and created new partnerships capable of respondingto growth’s problems and paradoxes.
Second, the Phoenix region must overcome the near “Catch-22s” thatare rooted in its history. These Catch-22s will not succumb to old ideas or bigideas borrowed from a Seattle or a Denver. Bold, innovative policy decisions,based on the region’s circumstances, will be needed. The Catch-22s include:
• Looming transportation and land use conundrums. In contrast to other regions, highway building in metropolitan Phoenix has supported the region’s central area. The present round of suburb-to-suburb freeway extensions, however, could create problems. By makingjobs and homes away from the center more accessible, the presence offreeways will intensify land consumption on the fringe. But shouldemployment remain concentrated in the cores and home buildingcontinue to move outward, commute times could worsen. The chal-lenge to unraveling this Catch-22 will be finding transportation andland-use initiatives that create dispersed mixed-use clusters of greaterresidential and employment density that do not detract from thevitality of downtown Phoenix, the region’s signature core.
• State trust land questions. Large tracts of state-owned trust land nearthe urban fringe constitute an irreplaceable asset for the region’s qualityof life. This land could serve as a growth boundary that provides a vastreservoir of open space. However, the state constitution requires thatthese lands be managed to maximize revenues for Arizona’s educa-tional needs. The mandate bars wholesale conservation of the landsand increases the likelihood of future land sales to developers. Thechallenge for the region will be to amend the Arizona constitution andstate enabling act to allow for trust land to be dedicated to open spacewhile maintaining the ability to fund schools.
• Growth agendas in the smaller cities. Eighteen less-populous citieson the urban fringe now control nearly as much land as the city ofPhoenix and the five largest suburbs combined. These areas also lagbehind the region in open space protection and use of growth man-agement tools. This means that the municipalities in the region leastequipped to deal with the effects of fast growth will soon be makingdecisions with enormous implications for the entire region. The chal-lenge will be to bring a regional perspective to the planning efforts ofall cities while respecting the region’s tradition of local control.
• Fixing the schools of the core. The region has reason to worry aboutthe education of children in central Phoenix and the southwest portionof the region. Individual economic success correlates particularly witheducation attainment (the number of years of school completed). Theweak schools of the center present a powerful impetus for decentral-ization. Schools with high proportions of low-income, minority orunderachieving students may influence where people and businesseschoose to locate. This increases the viability of the fringe at the expenseof the core. Ironically, though, the region and its cities possess limitedauthority to address the unique problems of schools. The challengewill be encouraging more effective collaboration between school districts and city leaders and including education issues in both fringegrowth management and core revitalization strategies.
• Conflicting views on sprawl and density. Residents of metropolitanPhoenix decry sprawl, but they also dislike density. Unfortunately, con-trolling one usually means encouraging the other. To confront thisCatch-22, regional leaders and residents will need to find an acceptableway to promote greater density with “quality” development that fostersconvenience, diversity, transit options and access to open spaces. Oneapproach will be to re-evaluate traditional zoning ordinances with theirrigid and segregated land uses and consider new rules that fosteracceptable combinations of residential and commercial uses.
• Regional authority dilemma. Although valuable, especially as the 18 less-populous communities become a stronger force in the regionaldynamics, city-to-city coordination will only go so far. However, thecreation of a binding regional authority has been rejected so often thatimplementation of such a concept appears unrealistic for metropolitanPhoenix. The challenge will be to reap the benefits of regional “gover-nance”without having to adopt a formal “regional government”structure.
• An on and off relationship with Washington. The region historicallyhas benefitted from federal assistance with water and public worksprojects that have sustained a growing population. In recent years,state leadership – executive and congressional – has disdained federalhelp with similar projects, believing that the state should be moreindependent from Washington. This stance handicaps the region’sability to finance major growth management initiatives, such as lightrail or open space acquisition, that neither the state nor any singlemunicipality can afford on its own. The challenge will be to get backto a long-term regional agenda so compelling that it would beunthinkable for any elected official not to support it.
• Tensions that surround state support of metropolitan Phoenix. Intoday’s economy metropolitan regions are increasingly overtakingstates as the drivers of growth. The situation in Arizona is no exception; the metropolitan Phoenix region currently accounts for 70percent of the state’s total personal income and is responsible for over70 percent of new job growth. Thus, ensuring a viable metropolitanPhoenix should be a top priority of state government. However, othercommunities across Arizona have needs that also must be addressed atthe state level. The challenge will be to support the Phoenix region ina way that does not neglect the needs of other localities, but acceptsthat prosperity brought forth by a strong regional driver benefits thestate as a whole.
• Water’s changing role. Although the region has ample water for itscurrent population, water management will be more important giventhat there are no potential projects on the scale of the Central ArizonaProject to increase the future supply of water. As such, water manage-ment will be increasingly related to growth management, as waterbecomes an invaluable regulator by influencing where homes andbusinesses may locate. However, discussions on water managementand growth management currently take place in entirely separatespheres. The challenge will be to bring together the water mavens andthe urban planners to come to an understanding of how water policiescould be used to manage growth.
This report’s final suggestion is for the region to be alert to the demo-graphic, technological and cultural trends that are shaping the next metropolitan era. New faces, a new economy, and a new geography ofamenities may be as profound a determinant of the size, shape and prospectsof cities and their surroundings in the coming years as the post-war suburbanboom was. How a region chooses to take what it has and put it into playamid these emerging trends will determine the region’s competitiveness andhow it will grow.
4 HITS AND MISSES: Fast Growth in Metropol i tan Phoenix
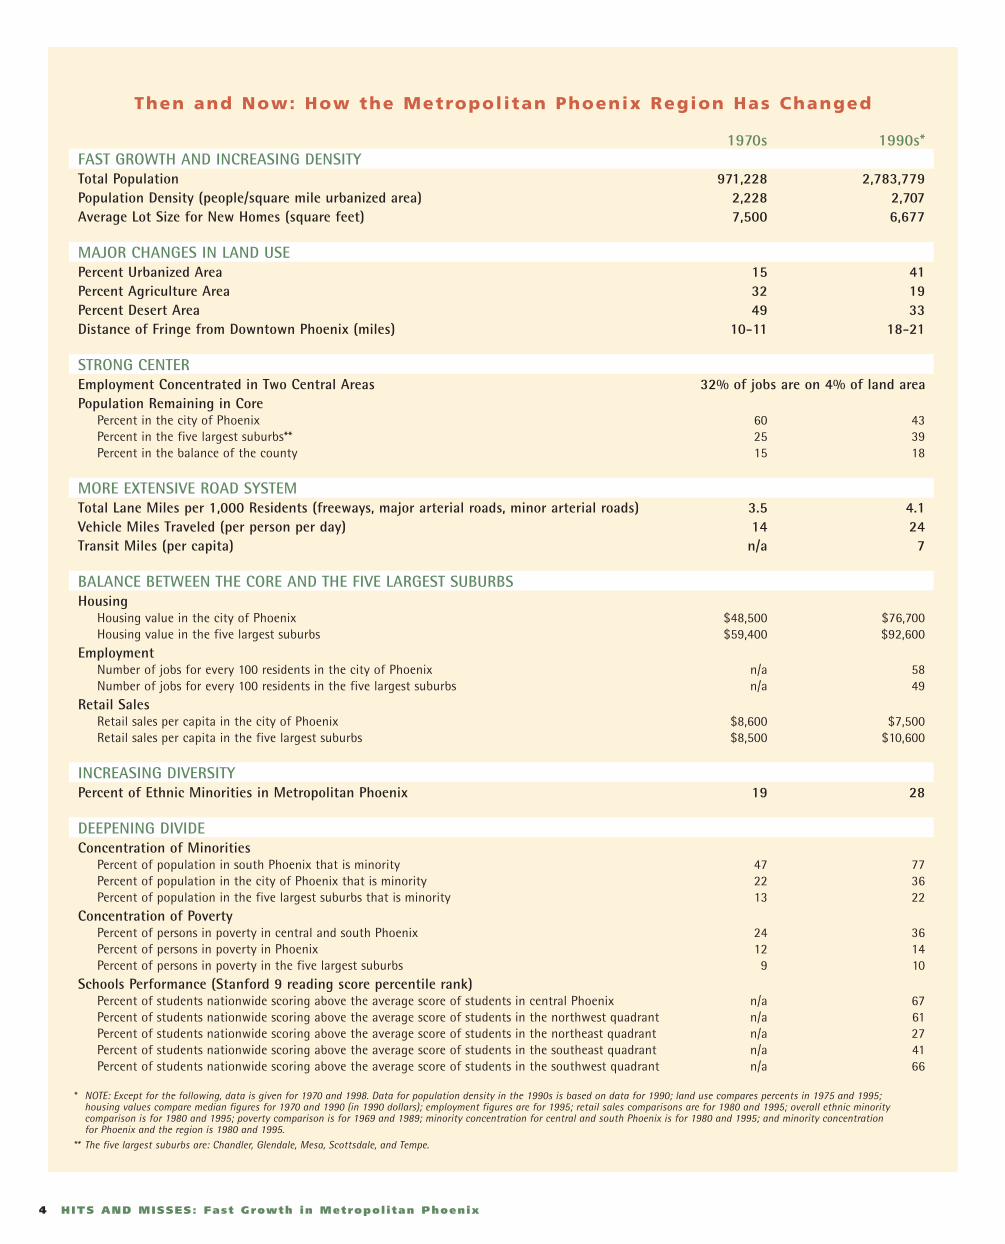
Then and Now: How the Metropolitan Phoenix Region Has Changed
1970s 1990s*FAST GROWTH AND INCREASING DENSITYTotal Population 971,228 2,783,779Population Density (people/square mile urbanized area) 2,228 2,707Average Lot Size for New Homes (square feet) 7,500 6,677
MAJOR CHANGES IN LAND USEPercent Urbanized Area 15 41Percent Agriculture Area 32 19Percent Desert Area 49 33Distance of Fringe from Downtown Phoenix (miles) 10-11 18-21
STRONG CENTEREmployment Concentrated in Two Central Areas 32% of jobs are on 4% of land areaPopulation Remaining in Core
Percent in the city of Phoenix 60 43Percent in the five largest suburbs** 25 39Percent in the balance of the county 15 18
MORE EXTENSIVE ROAD SYSTEMTotal Lane Miles per 1,000 Residents (freeways, major arterial roads, minor arterial roads) 3.5 4.1Vehicle Miles Traveled (per person per day) 14 24Transit Miles (per capita) n/a 7
BALANCE BETWEEN THE CORE AND THE FIVE LARGEST SUBURBSHousing
Housing value in the city of Phoenix $48,500 $76,700Housing value in the five largest suburbs $59,400 $92,600
EmploymentNumber of jobs for every 100 residents in the city of Phoenix n/a 58Number of jobs for every 100 residents in the five largest suburbs n/a 49
Retail SalesRetail sales per capita in the city of Phoenix $8,600 $7,500Retail sales per capita in the five largest suburbs $8,500 $10,600
INCREASING DIVERSITYPercent of Ethnic Minorities in Metropolitan Phoenix 19 28
DEEPENING DIVIDEConcentration of Minorities
Percent of population in south Phoenix that is minority 47 77Percent of population in the city of Phoenix that is minority 22 36Percent of population in the five largest suburbs that is minority 13 22
Concentration of PovertyPercent of persons in poverty in central and south Phoenix 24 36Percent of persons in poverty in Phoenix 12 14Percent of persons in poverty in the five largest suburbs 9 10
Schools Performance (Stanford 9 reading score percentile rank)Percent of students nationwide scoring above the average score of students in central Phoenix n/a 67Percent of students nationwide scoring above the average score of students in the northwest quadrant n/a 61Percent of students nationwide scoring above the average score of students in the northeast quadrant n/a 27Percent of students nationwide scoring above the average score of students in the southeast quadrant n/a 41Percent of students nationwide scoring above the average score of students in the southwest quadrant n/a 66
* NOTE: Except for the following, data is given for 1970 and 1998. Data for population density in the 1990s is based on data for 1990; land use compares percents in 1975 and 1995; housing values compare median figures for 1970 and 1990 (in 1990 dollars); employment figures are for 1995; retail sales comparisons are for 1980 and 1995; overall ethnic minority comparison is for 1980 and 1995; poverty comparison is for 1969 and 1989; minority concentration for central and south Phoenix is for 1980 and 1995; and minority concentration for Phoenix and the region is 1980 and 1995.
** The five largest suburbs are: Chandler, Glendale, Mesa, Scottsdale, and Tempe.
5MORRISON INSTITUTE FOR PUBLIC POLICY
Cities are the ultimate embodiments of their times, and metropolitanPhoenix is no exception.
Nothing has determined the shape and tenor of metropolitan Phoenix’development more than the fact that it has taken place almost entirely in thepost-World War II era of cars. The Phoenix region, in a word, has grown inthe largely suburban, horizontal way it has because that is how virtually allcities grew during the past 50 years. The strengths and problems of thePhoenix region are in that sense very much of their time.
Yet now a new time is beginning to shape metropolitan Phoenix and thechoices open to it. This era is the era of the Internet and the new economy.So the region that came of age in the auto era is now sensing that new valuesand new ways of living are going to rearrange the metropolitan fabric asthoroughly as the suburban boom did.
Laptop gypsies with blue hair writing code at the Starbuck’s; “yuppieseniors” wired for semi-retirement; new immigrants and smaller firms: Allthese are coming, and they will influence the layout and priorities of metro-politan Phoenix as surely as did all those Chevy-driving defense workers ofthe 1950s. Yet how, precisely, the newcomers will do this, and to what degree,
remains a riddle. Moreover, it remains unclear how the region that rose toprominence by mass production will adapt its form to the new era of clus-tering, networks and “quality of place.” Change is everywhere. The world ischanging; cities are changing; and so are the possible solutions to the problemsfaced by metropolitan areas.
This report, in order to help make sense for policy makers and the public of this extraordinarily dynamic moment, endeavors to detail thetrends that are now shaping metropolitan Phoenix. Along the way, it identifiesthe side effects of rapid growth that threaten the region’s future. And it pondershow the region may ensure it prevails as a competitive, high-quality regionin its next era.
Yes, cities embody their times, but that does not mean they need be confined to the forms and problems of just one era. A new time is alwayscoming, and the trick for metropolitan Phoenix is to begin adapting creatively – and quickly – to the new imperatives of region building.Fortunately, as the following pages make clear, the region begins this evolutionfrom a position of surprising strength.
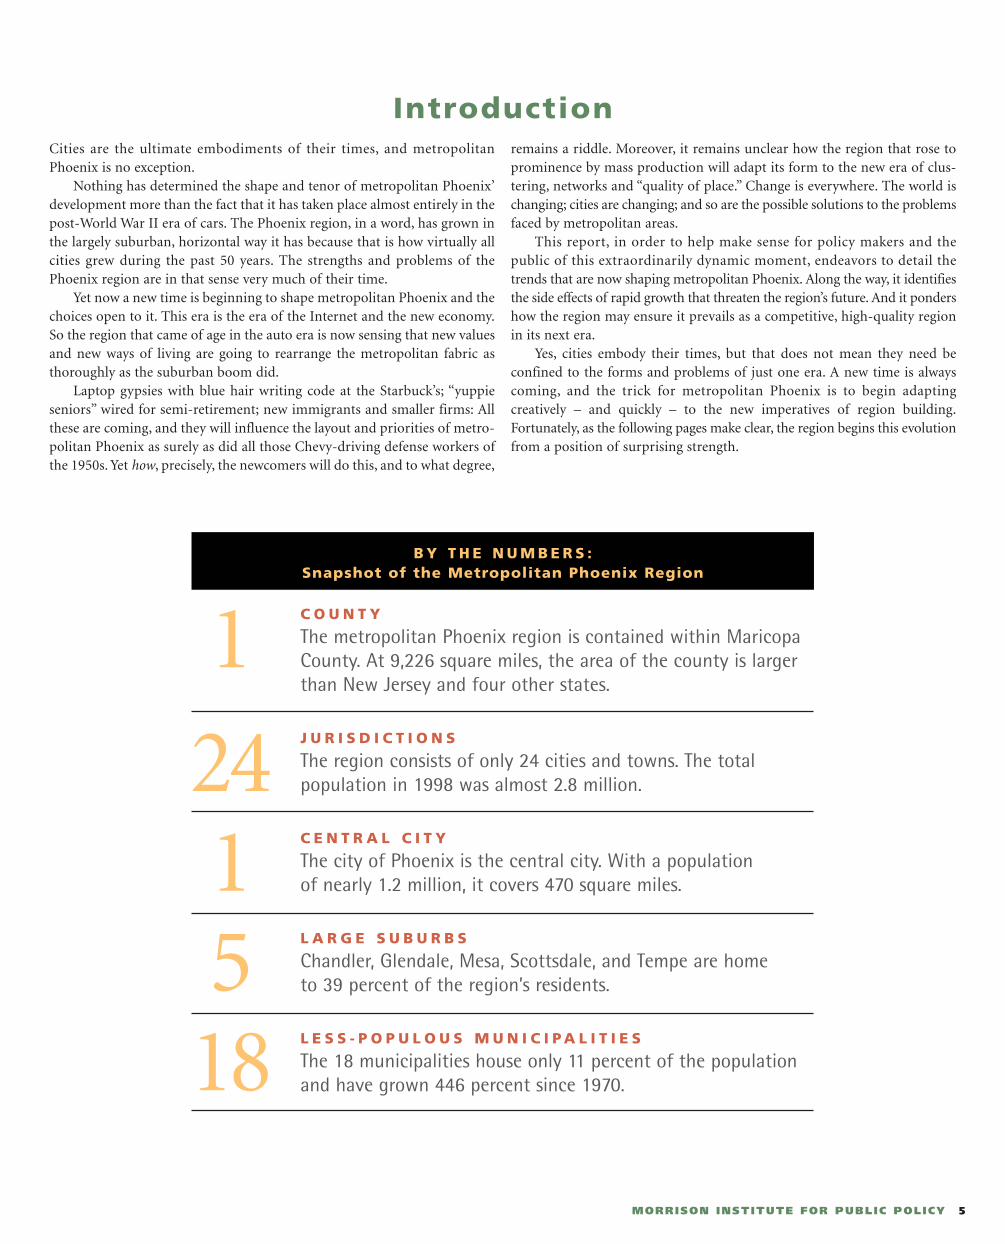
B Y T H E N U M B E R S :Snapshot of the Metropolitan Phoenix Region
C O U N T Y
The metropolitan Phoenix region is contained within MaricopaCounty. At 9,226 square miles, the area of the county is largerthan New Jersey and four other states.
J U R I S D I C T I O N S
The region consists of only 24 cities and towns. The total population in 1998 was almost 2.8 million.
C E N T R A L C I T Y
The city of Phoenix is the central city. With a population of nearly 1.2 million, it covers 470 square miles.
L A R G E S U B U R B S
Chandler, Glendale, Mesa, Scottsdale, and Tempe are home to 39 percent of the region’s residents.
L E S S - P O P U L O U S M U N I C I P A L I T I E S
The 18 municipalities house only 11 percent of the populationand have grown 446 percent since 1970.
Introduction
1
241518
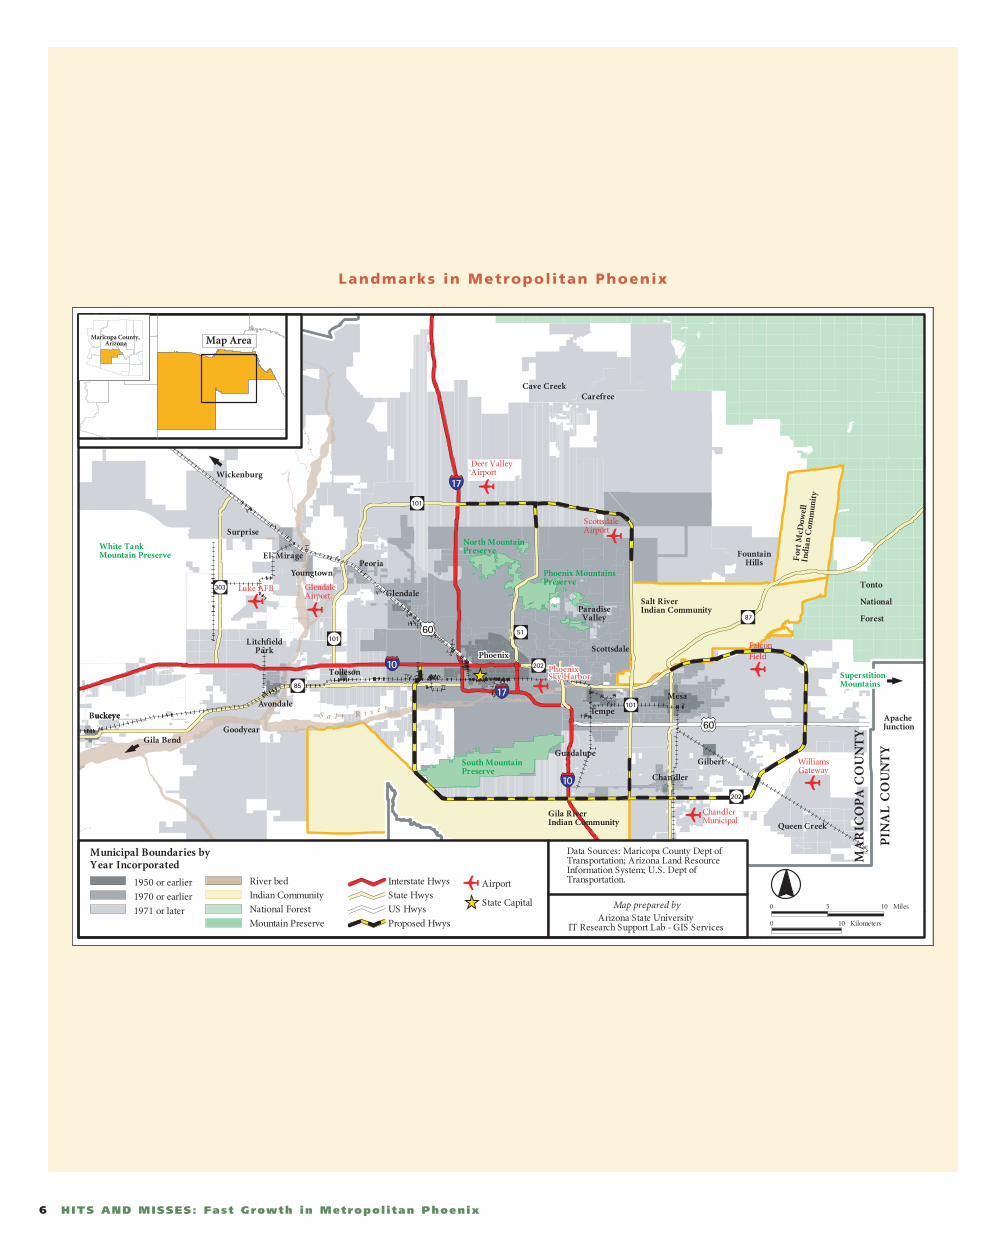
6 HITS AND MISSES: Fast Growth in Metropol i tan Phoenix
WilliamsGateway
LitchfieldPark
ApacheJunction
FountainHills
Salt RiverIndian CommunityParadise
Valley
Peoria
Guadalupe
Mesa
Chan dler
Gilbert
Queen Creek
Glendale
Surprise
Goodyear
uckeyeAvondale
El Mirage
Youngtown
Scottsdale
Tempe
Carefree
Tolleson
Cave Creek
For
t M
cDow
ell
Ind i
an C
omm
uni t
y
Luke AFB
FalconField
ScottsdaleAirport
Deer ValleyAirport
North MountainPreserve
Phoenix MountainsPreserve
South MountainPreserve
S a l t R i v e r
GlendaleAirport
SuperstitionMountains
Tonto
National
Forest
White TankMountain Preserve
ChandlerMunicipal
MA
RIC
OP
A C
OU
NT
Y
PIN
AL
CO
UN
TY
Buckeye
Gila Bend
Wickenburg
Gila RiverIndian Community
Interstate Hwys
Proposed Hwys
State Hwys
US Hwys 0 5 10 Miles
0 10 Kilometers
1950 or earlier
1970 or earlier
1971 or laterMap prepared by
Arizona State UniversityIT Research Support Lab - GIS Services
Data Sources: Maricopa County Dept ofTransportation; Arizona Land ResourceInformation System; U.S. Dept of Transportation.
Municipal Boundaries byYear Incorporated
National Forest
Indian Community
River bed
Mountain Preserve
Airport
State Capital
Map Area
303
101
101
85
10
10
17
17
60
60
202
51
202
101
87
Maricopa County, Arizona
Phoenix
Landmarks in Metropolitan Phoenix
7MORRISON INSTITUTE FOR PUBLIC POLICY
The Shape of Fast Growth
Growth affects every dimension of the region’s identity, including its population, employment,transportation arrangements, land-use patterns and social landscape. This section tells whatchanges are unfolding and what those trends might mean for the Phoenix region.
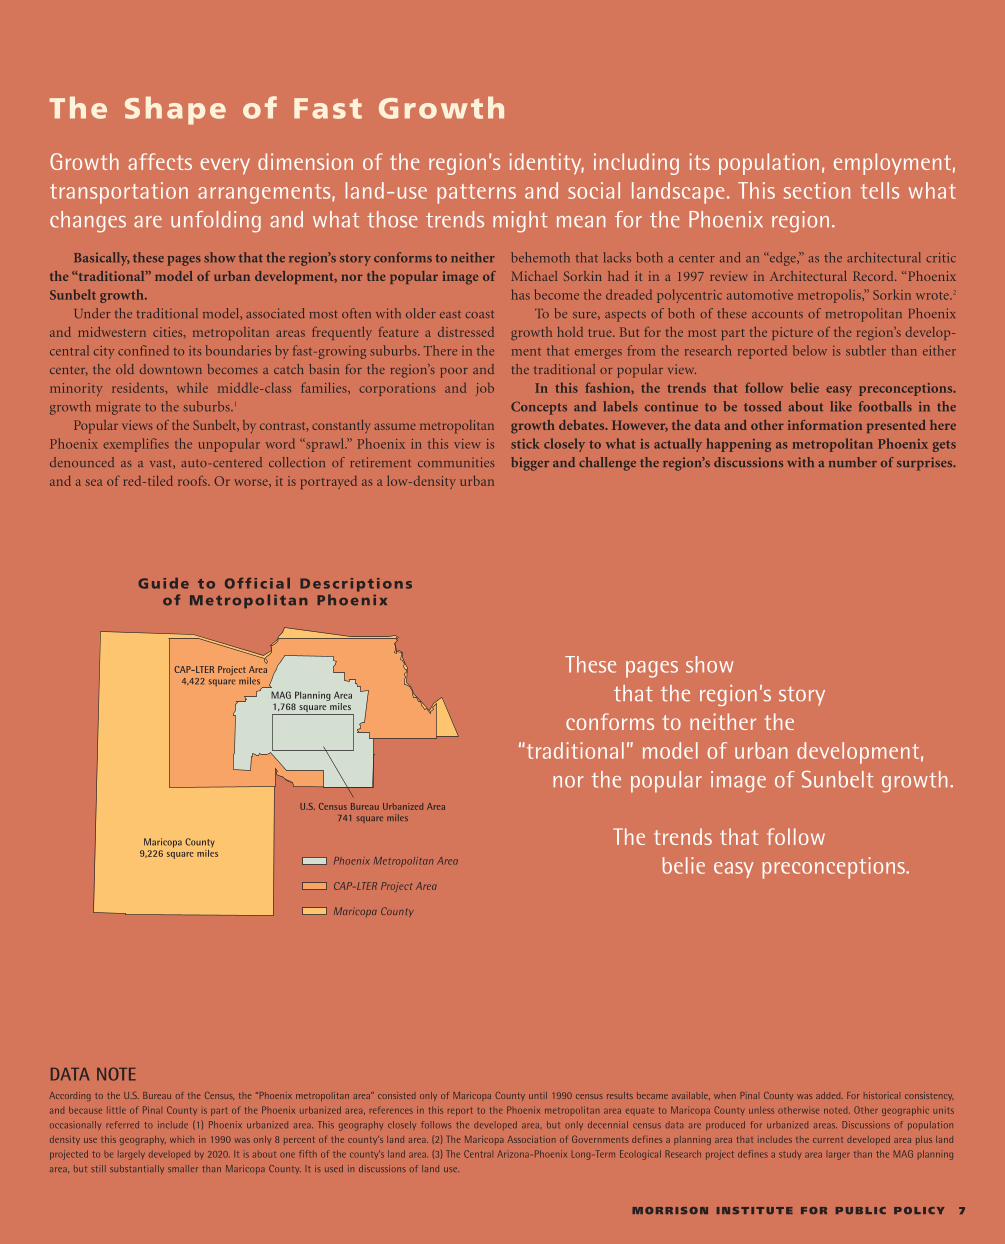
Guide to Offic ial Descriptions of Metropolitan Phoenix
DATA NOTEAccording to the U.S. Bureau of the Census, the “Phoenix metropolitan area” consisted only of Maricopa County until 1990 census results became available, when Pinal County was added. For historical consistency,and because little of Pinal County is part of the Phoenix urbanized area, references in this report to the Phoenix metropolitan area equate to Maricopa County unless otherwise noted. Other geographic unitsoccasionally referred to include (1) Phoenix urbanized area. This geography closely follows the developed area, but only decennial census data are produced for urbanized areas. Discussions of population density use this geography, which in 1990 was only 8 percent of the county’s land area. (2) The Maricopa Association of Governments defines a planning area that includes the current developed area plus landprojected to be largely developed by 2020. It is about one fifth of the county’s land area. (3) The Central Arizona-Phoenix Long-Term Ecological Research project defines a study area larger than the MAG planningarea, but still substantially smaller than Maricopa County. It is used in discussions of land use.
CAP-LTER Project Area4,422 square miles
MAG Planning Area1,768 square miles
Maricopa County9,226 square miles
U.S. Census Bureau Urbanized Area741 square miles
Phoenix Metropolitan Area
CAP-LTER Project Area
Maricopa County
Basically, these pages show that the region’s story conforms to neitherthe “traditional” model of urban development, nor the popular image ofSunbelt growth.
Under the traditional model, associated most often with older east coastand midwestern cities, metropolitan areas frequently feature a distressedcentral city confined to its boundaries by fast-growing suburbs. There in thecenter, the old downtown becomes a catch basin for the region’s poor andminority residents, while middle-class families, corporations and jobgrowth migrate to the suburbs.1
Popular views of the Sunbelt, by contrast, constantly assume metropolitanPhoenix exemplifies the unpopular word “sprawl.” Phoenix in this view isdenounced as a vast, auto-centered collection of retirement communitiesand a sea of red-tiled roofs. Or worse, it is portrayed as a low-density urban
behemoth that lacks both a center and an “edge,” as the architectural criticMichael Sorkin had it in a 1997 review in Architectural Record. “Phoenixhas become the dreaded polycentric automotive metropolis,” Sorkin wrote.2
To be sure, aspects of both of these accounts of metropolitan Phoenixgrowth hold true. But for the most part the picture of the region’s develop-ment that emerges from the research reported below is subtler than eitherthe traditional or popular view.
In this fashion, the trends that follow belie easy preconceptions.Concepts and labels continue to be tossed about like footballs in thegrowth debates. However, the data and other information presented herestick closely to what is actually happening as metropolitan Phoenix getsbigger and challenge the region’s discussions with a number of surprises.
These pages show that the region’s story
conforms to neither the “traditional” model of urban development,
nor the popular image of Sunbelt growth.
The trends that follow belie easy preconceptions.

8 HITS AND MISSES: Fast Growth in Metropol i tan Phoenix
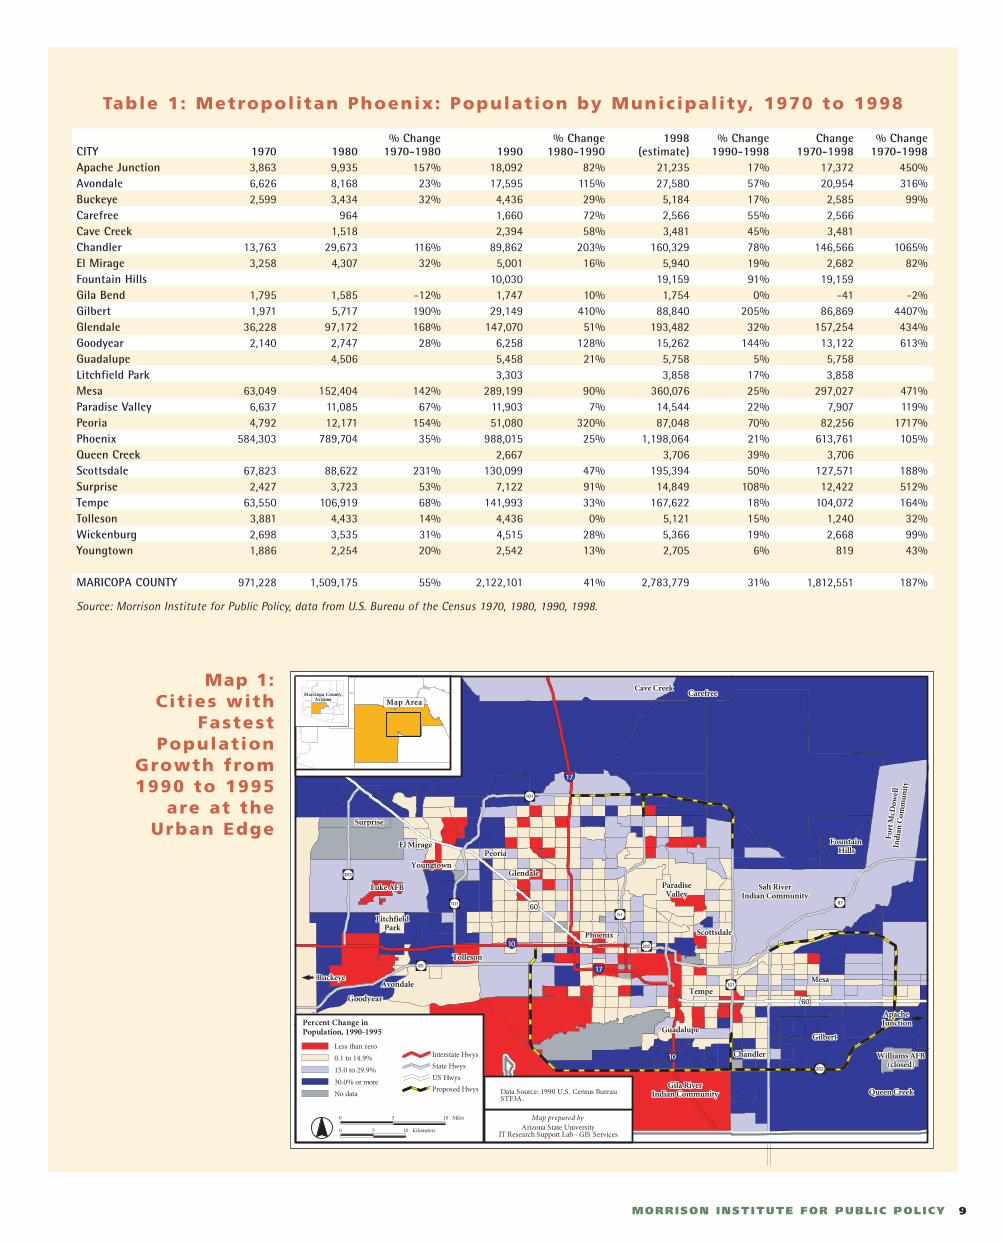
Population is Booming
TREND: Growth driven by vast in-migration is occurring almost everywhere in metropolitan Phoenix – even near the core. But the most dramatic gains are at the outer edges of the current urbanized area.
Metropolitan Phoenix grew faster than anyother large metropolitan region between 1970and 1998.* From just 1990 to 1998, the region’s
population increased 31 percent thanks in large
part to the arrival of an average of 57,000 new
residents a year.** Among the 25 largest metro-
politan areas in the nation only Atlanta grew
similarly (27 percent) during the 1990s.
About one-third of the region’s populationgrowth between 1990 and 1998 occurred in thecity of Phoenix. Another fifth went to cities close
to the core – Tempe, Scottsdale and Glendale.
Tempe grew by 18 percent, Phoenix by 21
percent, Glendale by 32 percent, and Scottsdale
by 50 percent (see Table 1). The city of Phoenix
added 210,000 residents from 1990 to 1998.
Tempe, Scottsdale and Glendale together added
137,000 residents.
At the same time, 8 out of the 24 cities in the
Phoenix metropolitan area experienced a popu-
lation increase of more than 50 percent from
1990 to 1998. Cities with the fastest population
growth are at the urban edge. Avondale, Carefree,
Chandler, Fountain Hills, Gilbert, Goodyear,
Peoria and Surprise all extend along the metro-
politan area’s outer ring. Map 1 shows these areas
in light blue and dark blue. The cities with over
50 percent growth accounted for about 200,000
new residents to the region during the 1990s.
The city of Phoenix’ share of the regional
population dropped from 60 percent in 1970 to
43 percent in 1998 (see Figure 1).
The growth rate in the southern and central
portions of the city of Phoenix trailed the
numbers recorded elsewhere in the region.
South and central Phoenix (indicated in red on
Map 1) added only about 15,000 people (9 per-
cent) between 1990 and 1995. The metropolitan
area’s largest pockets of population decline were
also in these areas.
WHAT THIS MEANS Explosive population growth has enriched met-
ropolitan Phoenix’ talent pool and enlarged its
local markets, but it is also challenging the
region’s infrastructure and natural resources,
particularly in the areas of the metropolitan
fringe. More traffic, longer commutes, air pollu-
tion, and crowded schools all result from the
region’s phenomenal influx of drivers and home
buyers. Local governments may be capable of
only minimal planning and may struggle to
provide basic services. Communities that are
relatively small and inexperienced, or where
growth outpaces the rate at which tax rolls and
census counts can be updated to ensure various
revenue flows, have been the hardest hit. Hence,
the potential for regional problems is great.That the city of Phoenix and other “inner-
ring” cities are still growing at a rate relativelyclose to the regional average suggests theregion’s center is not “emptying out” as it is inmany other metropolitan areas. Between 1970and 1999, for example, the city of Atlanta’s population decreased 14 percent compared tothe region’s increase of 114 percent.3 The city ofPhoenix’ growth rate was 105 percent between1970 and 1998, while the region gained 187 percent.However, slower growth in south and centralPhoenix points to an emerging problem. Pocketsof population decreases – caused primarily bythe demolition of housing units – cluster in anarea close to the region’s core.
Over the last 30 years, an average of 127 new residents moved to the Phoenix region every day.
Figure 1: Metropolitan Phoenix’ Population Grew by 187 Percent, adding 1.8 Mil l ion People from 1970 to 1998
0
200,000
400,000
600,000
800,000
1,000,000
1,200,000
POPU
LATI
ON
1970 1980 1990 1998
Phoenix Five Large Suburbs* All Other Suburbs
* Large Suburbs refer to Chandler, Glendale, Mesa, Scottsdale and Tempe. Source: Morrison Institute for Public Policy, data from U.S. Bureau of the Census.
* Metropolitan Phoenix means Maricopa County, except where otherwise noted. See the Data Note for details on geographic areas.
** 1998 data reflect population estimates from the U.S. Bureauof the Census which were released March 2000.
9MORRISON INSTITUTE FOR PUBLIC POLICY
Interstate Hwys
Proposed Hwys
State Hwys
US Hwys
0 5 10 Miles
0 5 10 Kilometers
Map prepared byArizona State University
IT Research Support Lab - GIS Services
Less than zero
0.1 to 14.9%
15.0 to 29.9%
30.0% or more
No data
Percent Change inPopulation, 1990-1995
Data Source: 1990 U.S. Census BureauSTF3A.
Map AreaMaricopa County,
Arizona
303
85
101
10
60
101
17
202
51
17
60
101
202
87
10
Goodyear
Table 1: Metropolitan Phoenix: Population by Municipal ity, 1970 to 1998
% Change % Change 1998 % Change Change % ChangeCITY 1970 1980 1970-1980 1990 1980-1990 (estimate) 1990-1998 1970-1998 1970-1998Apache Junction 3,863 9,935 157% 18,092 82% 21,235 17% 17,372 450%Avondale 6,626 8,168 23% 17,595 115% 27,580 57% 20,954 316%Buckeye 2,599 3,434 32% 4,436 29% 5,184 17% 2,585 99%Carefree 964 1,660 72% 2,566 55% 2,566 Cave Creek 1,518 2,394 58% 3,481 45% 3,481 Chandler 13,763 29,673 116% 89,862 203% 160,329 78% 146,566 1065%El Mirage 3,258 4,307 32% 5,001 16% 5,940 19% 2,682 82%Fountain Hills 10,030 19,159 91% 19,159 Gila Bend 1,795 1,585 -12% 1,747 10% 1,754 0% -41 -2%Gilbert 1,971 5,717 190% 29,149 410% 88,840 205% 86,869 4407%Glendale 36,228 97,172 168% 147,070 51% 193,482 32% 157,254 434%Goodyear 2,140 2,747 28% 6,258 128% 15,262 144% 13,122 613%Guadalupe 4,506 5,458 21% 5,758 5% 5,758 Litchfield Park 3,303 3,858 17% 3,858 Mesa 63,049 152,404 142% 289,199 90% 360,076 25% 297,027 471%Paradise Valley 6,637 11,085 67% 11,903 7% 14,544 22% 7,907 119%Peoria 4,792 12,171 154% 51,080 320% 87,048 70% 82,256 1717%Phoenix 584,303 789,704 35% 988,015 25% 1,198,064 21% 613,761 105%Queen Creek 2,667 3,706 39% 3,706 Scottsdale 67,823 88,622 231% 130,099 47% 195,394 50% 127,571 188%Surprise 2,427 3,723 53% 7,122 91% 14,849 108% 12,422 512%Tempe 63,550 106,919 68% 141,993 33% 167,622 18% 104,072 164%Tolleson 3,881 4,433 14% 4,436 0% 5,121 15% 1,240 32%Wickenburg 2,698 3,535 31% 4,515 28% 5,366 19% 2,668 99%Youngtown 1,886 2,254 20% 2,542 13% 2,705 6% 819 43%
MARICOPA COUNTY 971,228 1,509,175 55% 2,122,101 41% 2,783,779 31% 1,812,551 187%
Source: Morrison Institute for Public Policy, data from U.S. Bureau of the Census 1970, 1980, 1990, 1998.
Map 1:Cit ies with
FastestPopulation
Growth from 1990 to 1995
are at the Urban Edge
10 HITS AND MISSES: Fast Growth in Metropol i tan Phoenix
Metropolitan Phoenix is Becoming Denser
TREND: The Phoenix urbanized area is consuming land at a less rapid pace than its population is growing. Its increasing population density contrasts with declining densities in most of the nation’s urbanized areas.
Very large population increases are driving
the rapid expansion of the urbanized area in
metropolitan Phoenix. Between 1960 and 1990,
the urbanized land area grew 199 percent, while
population increased 263 percent. The Phoenix
region is one of only a handful of large metro-
politan areas (including Dallas and Los Angeles)
that consumed land at a slower rate than popu-
lation increased, as Figures 2 and 3 show. By
contrast, the Atlanta region consumed nearly
twice as much land as the Phoenix region
(almost 900 square miles compared with about
500) to accommodate approximately the same
level of population growth.
The Phoenix urbanized area’s population
density has been rising, according to the U.S.
Bureau of the Census. Between 1960 and 1990,
density rose 22 percent to 2,707 people per square
mile. Densities went up 23 percent in the 1980s
after holding steady in the 1960s and 1970s.
Other information, including comparisons of
1990 and 1995 census data and dropping housing
vacancy rates suggest density climbed even a little
more in the 1990s (see Map A in Appendix).
Density increases appear to stem from
increased construction of multi-family dwellings,
decreases in average lot size and considerable
“in-fill” construction. At the simplest level, pop-
ulation density is a function of occupied housing
density (units per square mile) and average
household size. An analysis of housing types and
sizes suggests that favorable tax rules in the 1980s
led to the construction of an unusually high
proportion of multifamily housing units. Also,
high interest rates at that time limited residents’
ability to purchase single-family houses. During
the 1980s, much of the single-family and multi-
family housing construction happened on parcels
that initially had been skipped over. At the same
time, median lot sizes in metropolitan Phoenix
dropped from 7,828 square feet in 1980 (about
one-sixth of an acre) to 7,200 square feet in 2000.
The region is being built at quite even
densities and lot sizes, even at the fringe. With
few exceptions, most new neighborhoods in metro-
politan Phoenix continue to be built at densities
similar to the county average, rather than at the
much lower densities common in some regions.
This is true even in the prime new-home
construction ring which now circles metropolitan
Phoenix about 18 to 21 miles from downtown
Phoenix. The median lot size generally does not
vary too much from city to city. Most of the cities
have been within 10 percent of the county average,
although each quadrant of the region has some
areas with larger and smaller lot sizes. Carefree
and Paradise Valley are the major exceptions with
median lot sizes of more than one acre. Lot sizes
were more than 10 percent above the county
average in Sun City West, Fountain Hills, and
Queen Creek. Avondale has had the smallest
median lot size (see Table A in Appendix).
Central Phoenix has also noted density
increases. During the 1970s and 1980s, population
density decreased within a three-mile radius of
central Phoenix, much as it did near many urban
cores in the United States. However between 1990
and 1995, densities increased in the center even
though there had been little residential construction
in the area. The turnaround is due mostly to a
sharp decline in housing vacancy rates and an
increase in household size, largely related to the
center’s growing Hispanic population. In addition,
a growing number of people lived in “group
quarters,” such as prisons and homeless shelters,
thereby increasing densities.
WHAT THIS MEANS The Phoenix region, contrary to its sprawling,
low-density image, is actually growing fairly
compactly. Starting from a low base, popula-
tion density increased to a point where it was
only about 10 percent less than the national
median for large urban areas (2,975 persons per
square mile) in 1990. Moreover, unlike areas
such as Atlanta, Denver or San Diego, the region
is consuming land at a slower rate than it is
adding people. Such trends mean that the
region’s land consumption, commute times,
decentralization and toll on the desert are less
than they might have been given the area’s
phenomenal population growth.
Population growth is probably inevitable as
long as the Phoenix region remains an attrac-
tive place to live and work. But density is not
inevitable. As Washington Post columnist Neal
Peirce recently told San Diego’s leaders, “Density
doesn’t just appear like sprouts; it needs careful
planning and permission.”4 Moreover, the key
question ought not to be whether or not the region
creates more density, but how. Merely squeezing
more homes onto smaller lots in segregated
housing developments is not the optimal strategy
for compact development – though that is part
of the picture. The region is likely to find huge
land savings in the future by following through
determinedly with current policies for in-fill
development, transit-focused development zones,
mixed use (and accompanying revisions to zoning
ordinances) or other such vital centers with com-
binations of places to live and work.
Between 1960 and 1990, Phoenix’ urbanized area grew 199 percent, while population increased 263 percent.
Phoenix is one of only a handful of large metropolitan areas that consumed land at a slower rate than its population grew.

11MORRISON INSTITUTE FOR PUBLIC POLICY
Figure 2: Phoenix and Seven Other Large Urbanized Areas Consumed Land at a Slower Rate than Population Growth Over 30 Years
(percent change from 1960 to 1990)
Figure 3: Phoenix and Seven Other Large Urbanized Areas Show a DensityIncrease Over 30 Years (percent change in density from 1960 to 1990)
-50%
0%
50%
100%
150%
200%
250%
300%
350%
400%
Phoe
nix
Atla
nta
Balt
imor
e
Bost
on
Chic
ago
Cinc
inna
ti
Clev
elan
d
Dal
las
/Ft
Wor
th
Den
ver
Det
roit
Ft L
aude
rdal
e /
Hol
lyw
ood
Hou
ston
Kans
as C
ity
Los
Ange
les
Mia
mi
Milw
auke
e
Min
neap
olis
/St
Pau
l
New
Orle
ans
New
Yor
k
Phila
delp
hia
Pitt
sbur
gh
Port
land
Rive
rsid
e /
San
Bern
ardi
no
Sacr
amen
to
St L
ouis
San
Anto
nio
San
Die
go
San
Fran
cisc
o /
Oak
land
San
Jose
Seat
tle
Tam
pa /
St P
eter
sbur
g
Was
hing
ton
DC
PERC
ENT
CHA
NG
E
Note: Urbanized Areas with population over one million in 1990. Does not include Norfolk-Virginia Beach.Source: Morrison Institute for Public Policy, data from U.S. Bureau of the Census.
Population Percent Change
Land Area Percent Change
-60%
-30%
-20%
-10%
0%
20%
30%
40%
50%
60%
Phoe
nix
Atla
nta
Balt
imor
e
Bost
on
Chic
ago
Cinc
inna
ti
Clev
elan
d
Dal
las
/Ft
Wor
th
Den
ver
Det
roit
Ft L
aude
rdal
e /
Hol
lyw
ood
Hou
ston
Kans
as C
ity
Los
Ange
les
Mia
mi
Milw
auke
e
Min
neap
olis
/St
Pau
l
New
Orle
ans
New
Yor
k
Phila
delp
hia
Pitt
sbur
gh
Port
land
Rive
rsid
e /
San
Bern
ardi
no
Sacr
amen
to
St L
ouis
San
Anto
nio
San
Die
go
San
Fran
cisc
o /
Oak
land
San
Jose
Seat
tle
Tam
pa /
St P
eter
sbur
g
Was
hing
ton
DC
PERC
ENT
CHA
NG
E
Note: Urbanized Areas with population over one million in 1990; density is population per square mile. Does not include Norfolk-Virginia Beach.Source: Morrison Institute for Public Policy, data from U.S. Bureau of the Census.
Percent Change in Density
10%
-50%
-40%
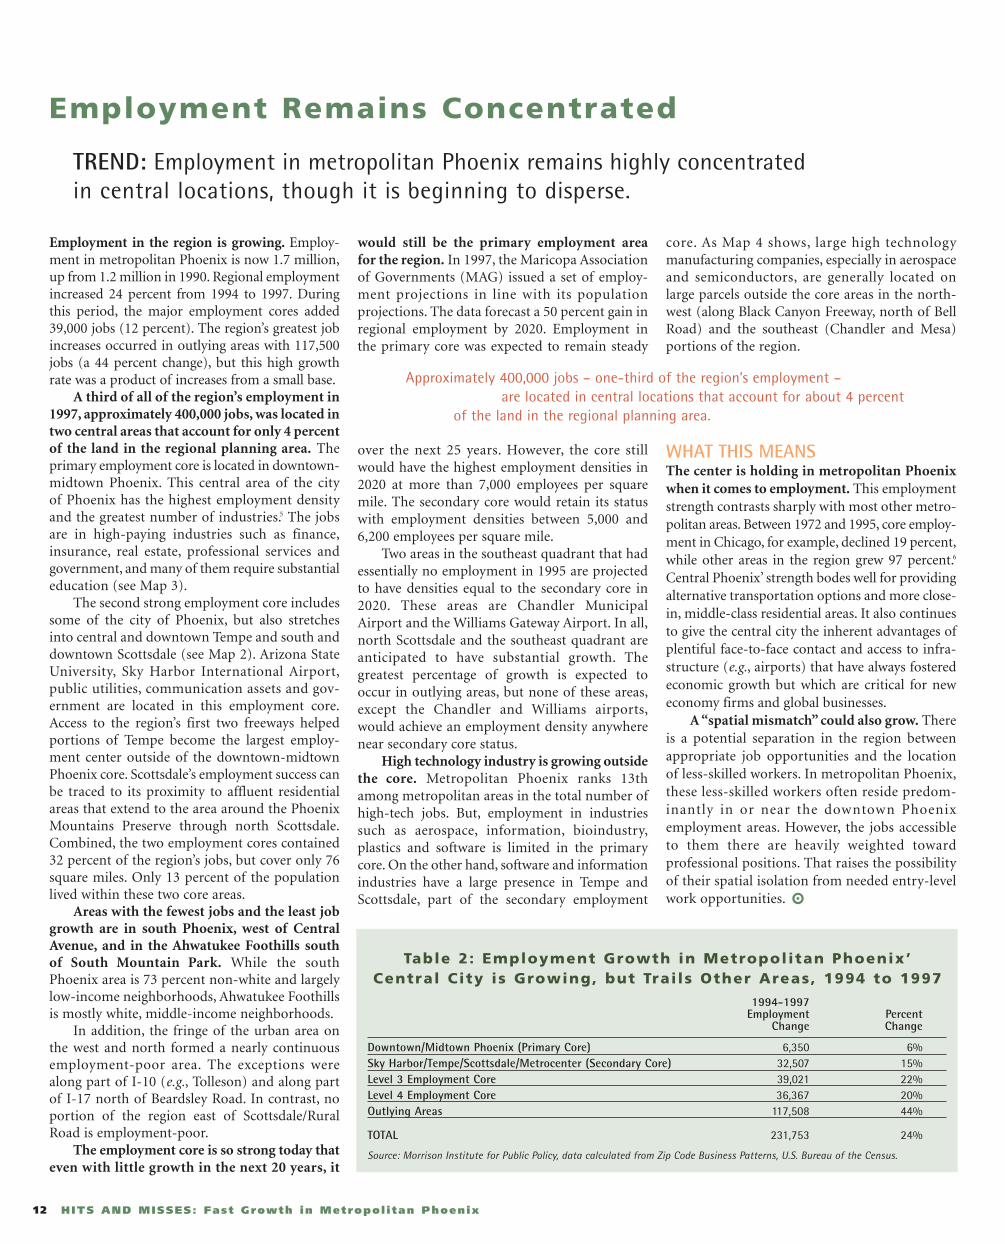
Employment in the region is growing. Employ-ment in metropolitan Phoenix is now 1.7 million,up from 1.2 million in 1990. Regional employmentincreased 24 percent from 1994 to 1997. Duringthis period, the major employment cores added39,000 jobs (12 percent). The region’s greatest jobincreases occurred in outlying areas with 117,500jobs (a 44 percent change), but this high growthrate was a product of increases from a small base.
A third of all of the region’s employment in1997, approximately 400,000 jobs, was located intwo central areas that account for only 4 percentof the land in the regional planning area. Theprimary employment core is located in downtown-midtown Phoenix. This central area of the city of Phoenix has the highest employment densityand the greatest number of industries.5 The jobsare in high-paying industries such as finance,insurance, real estate, professional services andgovernment, and many of them require substantialeducation (see Map 3).
The second strong employment core includessome of the city of Phoenix, but also stretchesinto central and downtown Tempe and south anddowntown Scottsdale (see Map 2). Arizona StateUniversity, Sky Harbor International Airport,public utilities, communication assets and gov-ernment are located in this employment core.Access to the region’s first two freeways helpedportions of Tempe become the largest employ-ment center outside of the downtown-midtownPhoenix core. Scottsdale’s employment success canbe traced to its proximity to affluent residentialareas that extend to the area around the PhoenixMountains Preserve through north Scottsdale.Combined, the two employment cores contained32 percent of the region’s jobs, but cover only 76square miles. Only 13 percent of the populationlived within these two core areas.
Areas with the fewest jobs and the least jobgrowth are in south Phoenix, west of CentralAvenue, and in the Ahwatukee Foothills southof South Mountain Park. While the southPhoenix area is 73 percent non-white and largelylow-income neighborhoods, Ahwatukee Foothillsis mostly white, middle-income neighborhoods.
In addition, the fringe of the urban area onthe west and north formed a nearly continuousemployment-poor area. The exceptions werealong part of I-10 (e.g., Tolleson) and along partof I-17 north of Beardsley Road. In contrast, noportion of the region east of Scottsdale/RuralRoad is employment-poor.
The employment core is so strong today thateven with little growth in the next 20 years, it
would still be the primary employment area for the region. In 1997, the Maricopa Associationof Governments (MAG) issued a set of employ-ment projections in line with its population projections. The data forecast a 50 percent gain inregional employment by 2020. Employment inthe primary core was expected to remain steady
over the next 25 years. However, the core stillwould have the highest employment densities in2020 at more than 7,000 employees per squaremile. The secondary core would retain its statuswith employment densities between 5,000 and6,200 employees per square mile.
Two areas in the southeast quadrant that hadessentially no employment in 1995 are projectedto have densities equal to the secondary core in2020. These areas are Chandler MunicipalAirport and the Williams Gateway Airport. In all,north Scottsdale and the southeast quadrant areanticipated to have substantial growth. Thegreatest percentage of growth is expected tooccur in outlying areas, but none of these areas,except the Chandler and Williams airports,would achieve an employment density anywherenear secondary core status.
High technology industry is growing outsidethe core. Metropolitan Phoenix ranks 13thamong metropolitan areas in the total number ofhigh-tech jobs. But, employment in industriessuch as aerospace, information, bioindustry,plastics and software is limited in the primarycore. On the other hand, software and informationindustries have a large presence in Tempe andScottsdale, part of the secondary employment
core. As Map 4 shows, large high technologymanufacturing companies, especially in aerospaceand semiconductors, are generally located onlarge parcels outside the core areas in the north-west (along Black Canyon Freeway, north of BellRoad) and the southeast (Chandler and Mesa)portions of the region.
WHAT THIS MEANS The center is holding in metropolitan Phoenixwhen it comes to employment. This employmentstrength contrasts sharply with most other metro-politan areas. Between 1972 and 1995, core employ-ment in Chicago, for example, declined 19 percent,while other areas in the region grew 97 percent.6
Central Phoenix’ strength bodes well for providingalternative transportation options and more close-in, middle-class residential areas. It also continuesto give the central city the inherent advantages ofplentiful face-to-face contact and access to infra-structure (e.g., airports) that have always fosteredeconomic growth but which are critical for neweconomy firms and global businesses.
A “spatial mismatch” could also grow. Thereis a potential separation in the region betweenappropriate job opportunities and the locationof less-skilled workers. In metropolitan Phoenix,these less-skilled workers often reside predom-inantly in or near the downtown Phoenixemployment areas. However, the jobs accessibleto them there are heavily weighted toward professional positions. That raises the possibilityof their spatial isolation from needed entry-levelwork opportunities.
12 HITS AND MISSES: Fast Growth in Metropol i tan Phoenix
Employment Remains Concentrated
TREND: Employment in metropolitan Phoenix remains highly concentrated in central locations, though it is beginning to disperse.
Approximately 400,000 jobs – one-third of the region’s employment – are located in central locations that account for about 4 percent
of the land in the regional planning area.
Table 2: Employment Growth in Metropolitan Phoenix’Central City is Growing, but Trai ls Other Areas, 1994 to 1997
1994-1997Employment Percent
Change Change
Downtown/Midtown Phoenix (Primary Core) 6,350 6%Sky Harbor/Tempe/Scottsdale/Metrocenter (Secondary Core) 32,507 15%Level 3 Employment Core 39,021 22%Level 4 Employment Core 36,367 20%Outlying Areas 117,508 44%
TOTAL 231,753 24%
Source: Morrison Institute for Public Policy, data calculated from Zip Code Business Patterns, U.S. Bureau of the Census.

13MORRISON INSTITUTE FOR PUBLIC POLICY
METROPOLITAN PHOENIX EMPLOYMENT CORES:
Primary Core (Level 1)Downtown PhoenixMidtown Phoenix
Secondary Core (Level 2)East Phoenix, I-10 to Van Buren StreetCentral TempeDowntown and west TempeDowntown and south ScottsdaleMetrocenter area of Phoenix
Level 3 CoreUptown PhoenixBiltmore/Squaw Peak Area of PhoenixEast Phoenix, Thomas Road
to Camelback RoadSouthwest MesaSoutheast PhoenixWest Central Phoenix, Van Buren Street
to Grand Avenue
Level 4 CoreDowntown GlendaleWest Central Phoenix, Grand Avenue
to Northern AvenueNorth Scottsdale, McCormick RanchNorth Scottsdale, Airport AreaNorthwest MesaCentral MesaSouth TempeSouth Central PhoenixDurango Area of PhoenixEast Phoenix, Van Buren Street
to Thomas Road
Williams AFB(closed)
ApacheJ unction
FountainHills
Salt RiverIndian Community
ParadiseValley
Peoria
Phoenix
Guadalupe
Mesa
Chandler
Gilbert
Queen Creek
Glendale
Surprise
Goodyear
Buckeye Avondale
El Mirage
Youngtown
Scottsdale
Tempe
Carefree
Tolleson
Cave Creek
Gila RiverIndian Community
For
t M
cDow
e ll
Ind
ian
Com
mu
nity
7
Luke AFB
LitchfieldPark
Gila RiverIndian Community
Interstate Hwys
Proposed Hwys
State Hwys
US Hwys
0 5 10 Miles
0 5 10 KilometersMap prepared by
Arizona State UniversityIT Research Support Lab - GIS Services
Data Source: Maricopa Association ofGovernments (MAG), 1995.
Map Area
Downtown/MidtownPhoenix EmploymentCore (Primary Core)
Sky Harbor/Tempe/Scottsdale/Metrocenter/Employment Core(Secondary Core)
Level 3 EmploymentCore
Level 4 EmploymentCore
Maricopa County,Arizona
303
85
101
10
60
101
17
202
51
17
60
101
202
87
10
Gila RiverIndian Community
Williams AFB(closed)
ApacheJunction
FountainHills
v ru
ParadiseValley
Peoria
Phoenix Guadalupe
Mesa
Chandler Gilbert
Queen Creek
Glendale
Surprise
Goodyear
Buckeye Avondale
El Mirage
Youngtown
Scottsdale
Tempe
Carefree
Tolleson
Cave Creek
Luke AFB
C M
S C WR F S
S
R
CC T WR F S
C
F SC W R R F S
R
R F S
T R F S
M
C T W RF S GC M T W C M S
C M T WR F S G
C M TW S G
M
C M T W R F S
M R S
MTW
C R S G
RC M T W G C M T WR F S
C W RF S
CM W
R
M W GM
LitchfieldPark
C M
C WR F S
C
C
F SC W R R F S
R
R F S
T R F S
MM T R
F S
C T W RF S GC M T W C M S
C M TW S G
M
C M T W R F S
M R SC M TW G
C R S G
C M T W
RC M T W G C M T WR F S
C W RF S
CM W
R
M W GM
F0 5 10 Miles
0 5 10 Kilometers
Interstate Hwys
Proposed Hwys
State Hwys
US Hwys
Employment in MajorIndustries
Map prepared byArizona State University
IT Research Support Lab - GIS Services
Data Source: Maricopa Association ofGovernments (MAG), 1995.
C:
M:
T:
W:
R:
Manufacturing
Transportation,Communications,and Public Utilities
Wholesale Trade
Retail Trade
Construction
S: Services
Finance, Insurance, andReal Estate
F:
G: Public Administration
Map Area
Downtown/MidtownPhoenix EmploymentCore (Primary Core)
Sky Harbor/Tempe/Scottsdale/Metrocenter/Employment Core(Secondary Core)
Level 3 EmploymentCore
Level 4 EmploymentCore
Maricopa County,Arizona
Salt Ri eIndian Comm nity
For
t M
cDow
e ll
Ind
ian
Com
mu
nity
303
85
101
10
60
101
17
202
51
17
60
101
202
87
10
Map 3: Major Industry is Located in the Primary and Secondary
Employment Cores
Williams AFB(closed)
ApacheJ unction
FountainHills
Salt RiverIndian CommunityParadise
Valley
Peoria
Phoenix
Guadalupe
Mesa
ChandlerGilbert
Queen Creek
Glendale
Surprise
Goodyear
Buckeye Avondale
El Mirage
Youngtown
Scottsdale
Tempe
Carefree
Tolleson
Cave Creek
For
t M
cDow
e ll
Ind
ian
Com
mu
nity
7
Luke AFB
A
S
AB
I
P
PI
I A I
I
LitchfieldPark
A
AS I
SS
S
S
AI SB II
AI P B I
I S
PI
I A I
I
Gila RiverIndian Community
Interstate Hwys
Proposed Hwys
State Hwys
US Hwys
High TechnologyEmployment
A:
I:
S:
P:
B:
Information
Software
Plastics and AdvancedComposite Materials
Bioindustry
Aerospace
Map prepared byArizona State University
IT Research Support Lab - GIS Services
Data Source: Maricopa Association ofGovernments (MAG), 1995.
Downtown/MidtownPhoenix EmploymentCore (Primary Core)
Sky Harbor/Tempe/Scottsdale/Metrocenter/Employment Core(Secondary Core)
Level 3 EmploymentCore
Level 4 EmploymentCore
0 5 10 Miles
0 5 10 Kilometers
Map AreaMaricopa County,
Arizona
303
85
101
10
60
101
17
202
51
17
60
101
202
87
10
Map 4: High Technology Industry is Located
Outside the Primary Core
Map 2: Metropolitan Phoenix Employment is Highly Concentrated
To learn what’s behind the employment patterns, see Figure A and Table B in the Appendix.
14 HITS AND MISSES: Fast Growth in Metropol i tan Phoenix
Road Building is Accelerating
TREND: Metropolitan Phoenix’ recent transportation spending has focused overwhelmingly on highways. Access to the urban core has been improved, but alternative forms of transportation have been neglected.
Metropolitan Phoenix is striving now to com-plete a freeway system that was begun in 1957,but expanded little between 1970 and 1985.At that time, local resistance to routing,federal funding, and high costs slowed con-struction. Consequently, as noted by the TexasTransportation Institute, only 290 lane miles oflimited-access highways were available in 1985,none of which came together as a beltway.7 Todayas a result, metropolitan Phoenix makes do witha less-extensive limited-access road network thanmost regions its size. This belatedness also hasmade the region rely inordinately on arterialstreets. In fact, the region is only now buildingbeltways around the urban area about 10 to 20miles from downtown Phoenix (see Map 5).
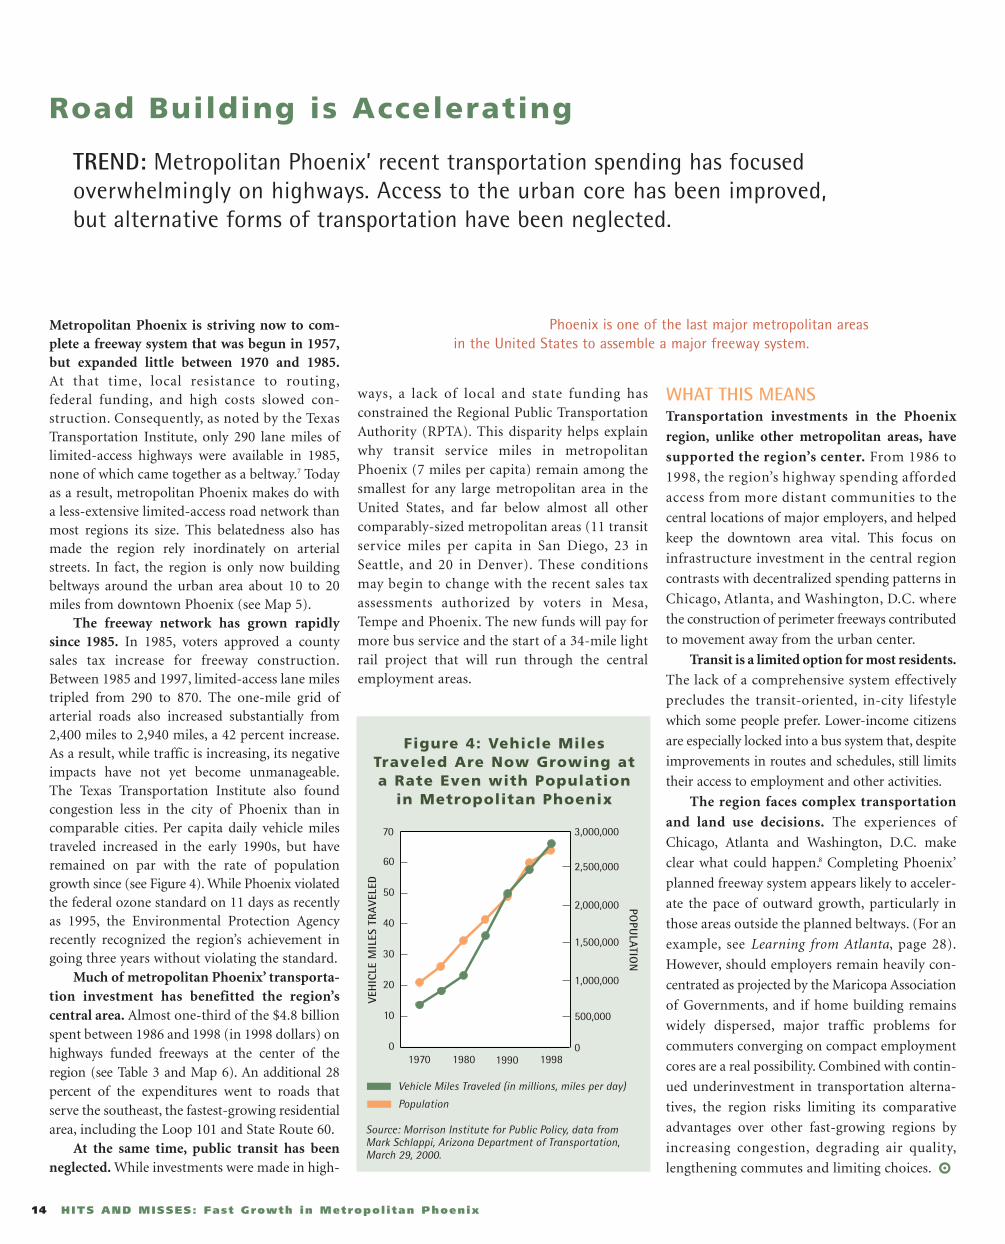
The freeway network has grown rapidlysince 1985. In 1985, voters approved a countysales tax increase for freeway construction.Between 1985 and 1997, limited-access lane milestripled from 290 to 870. The one-mile grid ofarterial roads also increased substantially from2,400 miles to 2,940 miles, a 42 percent increase.As a result, while traffic is increasing, its negativeimpacts have not yet become unmanageable.The Texas Transportation Institute also foundcongestion less in the city of Phoenix than incomparable cities. Per capita daily vehicle milestraveled increased in the early 1990s, but haveremained on par with the rate of populationgrowth since (see Figure 4). While Phoenix violatedthe federal ozone standard on 11 days as recentlyas 1995, the Environmental Protection Agencyrecently recognized the region’s achievement ingoing three years without violating the standard.
Much of metropolitan Phoenix’ transporta-tion investment has benefitted the region’s central area. Almost one-third of the $4.8 billionspent between 1986 and 1998 (in 1998 dollars) onhighways funded freeways at the center of theregion (see Table 3 and Map 6). An additional 28percent of the expenditures went to roads thatserve the southeast, the fastest-growing residentialarea, including the Loop 101 and State Route 60.
At the same time, public transit has beenneglected. While investments were made in high-
ways, a lack of local and state funding has constrained the Regional Public TransportationAuthority (RPTA). This disparity helps explainwhy transit service miles in metropolitanPhoenix (7 miles per capita) remain among thesmallest for any large metropolitan area in theUnited States, and far below almost all othercomparably-sized metropolitan areas (11 transitservice miles per capita in San Diego, 23 inSeattle, and 20 in Denver). These conditionsmay begin to change with the recent sales taxassessments authorized by voters in Mesa,Tempe and Phoenix. The new funds will pay formore bus service and the start of a 34-mile lightrail project that will run through the centralemployment areas.
WHAT THIS MEANS Transportation investments in the Phoenix
region, unlike other metropolitan areas, have
supported the region’s center. From 1986 to
1998, the region’s highway spending afforded
access from more distant communities to the
central locations of major employers, and helped
keep the downtown area vital. This focus on
infrastructure investment in the central region
contrasts with decentralized spending patterns in
Chicago, Atlanta, and Washington, D.C. where
the construction of perimeter freeways contributed
to movement away from the urban center.
Transit is a limited option for most residents.
The lack of a comprehensive system effectively
precludes the transit-oriented, in-city lifestyle
which some people prefer. Lower-income citizens
are especially locked into a bus system that, despite
improvements in routes and schedules, still limits
their access to employment and other activities.
The region faces complex transportation
and land use decisions. The experiences of
Chicago, Atlanta and Washington, D.C. make
clear what could happen.8 Completing Phoenix’
planned freeway system appears likely to acceler-
ate the pace of outward growth, particularly in
those areas outside the planned beltways. (For an
example, see Learning from Atlanta, page 28).
However, should employers remain heavily con-
centrated as projected by the Maricopa Association
of Governments, and if home building remains
widely dispersed, major traffic problems for
commuters converging on compact employment
cores are a real possibility. Combined with contin-
ued underinvestment in transportation alterna-
tives, the region risks limiting its comparative
advantages over other fast-growing regions by
increasing congestion, degrading air quality,
lengthening commutes and limiting choices.
Figure 4: Vehicle Miles Traveled Are Now Growing at a Rate Even with Population
in Metropolitan Phoenix
Vehicle Miles Traveled (in millions, miles per day)
Population
Source: Morrison Institute for Public Policy, data from Mark Schlappi, Arizona Department of Transportation, March 29, 2000.
0
10
20
30
40
50
60
70
VEH
ICLE
MIL
ES T
RAVE
LED
0
500,000
1,000,000
1,500,000
2,000,000
2,500,000
POPU
LATIO
N
3,000,000
1970 1980 1990 1998
Phoenix is one of the last major metropolitan areas in the United States to assemble a major freeway system.
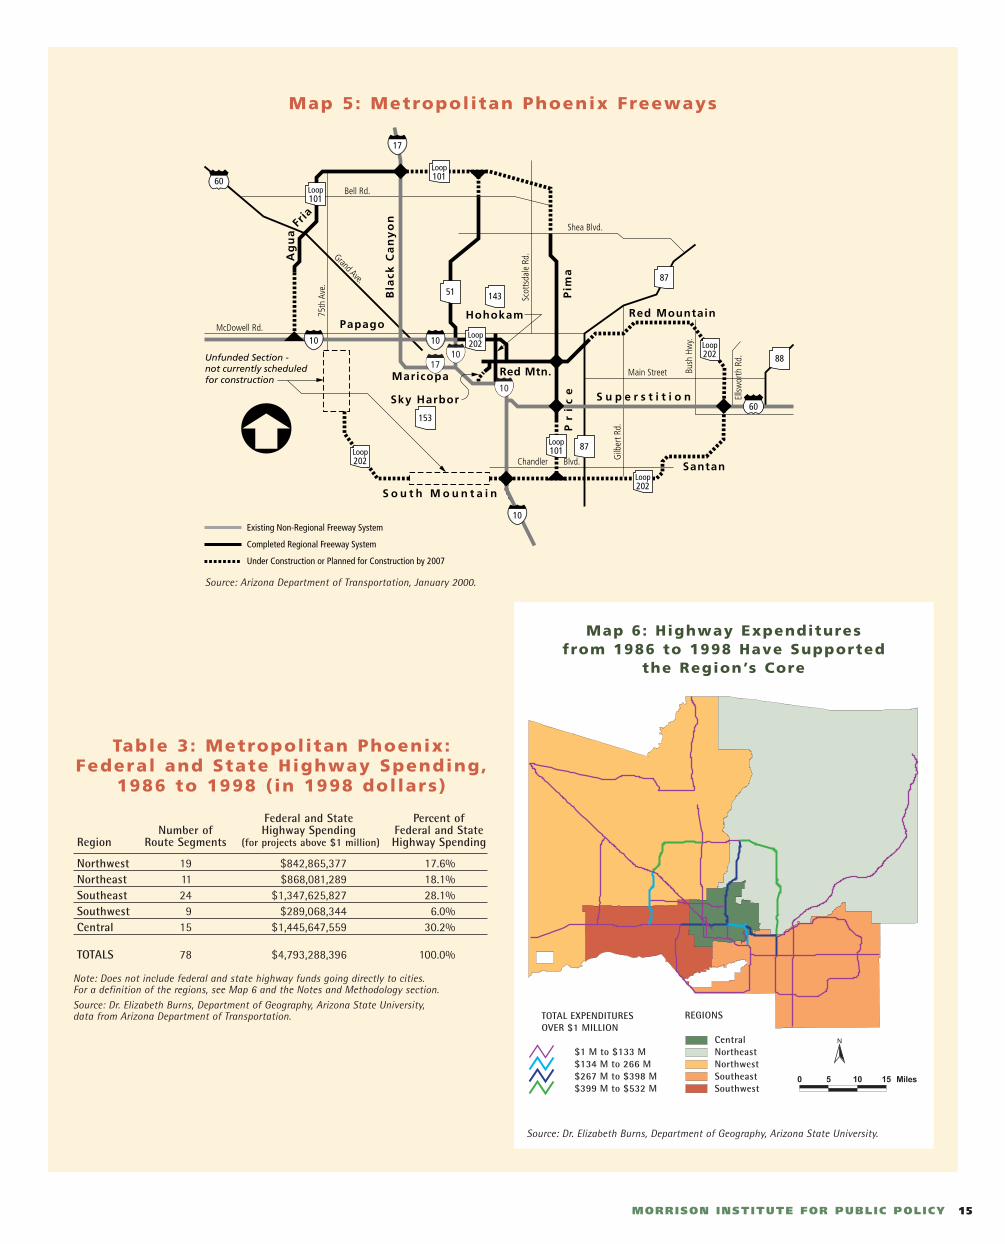
15MORRISON INSTITUTE FOR PUBLIC POLICY
S o u t h M o u n t a i n
Santan
Red MountainPapago
Pim
aP
ri
ce
Maricopa
Sky Harbor
Hohokam
Bla
ck C
an
yo
nS u p e r s t i t i o n
Red Mtn.
McDowell Rd.
Bell Rd.
Shea Blvd.
Main Street
Chandler Blvd.
Scot
tsda
le R
d.
75th
Ave
.
Gilb
ert R
d.
Bush
Hw
y.
Ellsw
orth
Rd.
Fria
Ag
ua
Unfunded Section -not currently scheduledfor construction
Grand Ave.
Existing Non-Regional Freeway System
Completed Regional Freeway System
Under Construction or Planned for Construction by 2007
Loop101
Loop101
51
Loop202
Loop202
Loop202
Loop202
Loop101 87
88
87
153
143
10 10
17
10
60
60
TOTAL EXPENDITURES OVER $1 MILLION
$1 M to $133 M $134 M to 266 M $267 M to $398 M $399 M to $532 M
REGIONS
Central Northeast Northwest Southeast Southwest
Map 5: Metropolitan Phoenix Freeways
Map 6: Highway Expenditures from 1986 to 1998 Have Supported
the Region’s Core
Table 3: Metropolitan Phoenix:Federal and State Highway Spending,
1986 to 1998 ( in 1998 dol lars)
Federal and State Percent ofNumber of Highway Spending Federal and State
Region Route Segments (for projects above $1 million) Highway Spending
Northwest 19 $842,865,377 17.6%Northeast 11 $868,081,289 18.1%Southeast 24 $1,347,625,827 28.1%Southwest 9 $289,068,344 6.0%Central 15 $1,445,647,559 30.2%
TOTALS 78 $4,793,288,396 100.0%
Note: Does not include federal and state highway funds going directly to cities.For a definition of the regions, see Map 6 and the Notes and Methodology section. Source: Dr. Elizabeth Burns, Department of Geography, Arizona State University, data from Arizona Department of Transportation.
Source: Dr. Elizabeth Burns, Department of Geography, Arizona State University.
Source: Arizona Department of Transportation, January 2000.

16 HITS AND MISSES: Fast Growth in Metropol i tan Phoenix
The Fringe is Exploding
TREND: During the 1990s, most new home construction took place about 18 to 21 milesfrom downtown Phoenix. Both local movers and new arrivals are going to the fringe.
Metropolitan Phoenix’ residential constructionis moving outward swiftly. Currently, homes are going up most quickly in a ring far fromdowntown Phoenix (see Figure 5). From 1993 to1998, the urban edge has moved outward nearlyone-half mile per year. But in the southeast quadrant, the rate has been faster approachingthree-fourths of a mile a year. With the exception ofthe southwest quadrant which absorbed only aboutthree percent of new residential development,new construction has been quite evenly distrib-uted geographically (see Figure 5 and Table 4).
A close look at the data suggests that devel-opment across the region during the 1990s hasfollowed a three-step pattern. Construction in theearly 1990s took place within a zone approxi-mately 12-18 miles from downtown Phoenixthat left a band of bypassed developmentbetween the initial urban fringe and the newedge. This was followed by in-fill constructionalong with further development of the outerzone. Finally, construction was expanded fromthe outer zone to extend the ring of developmenteven further to the current 21-mile distance.9
Local residents are moving to the newfringe neighborhoods. People moving from onepart of metropolitan Phoenix to another represent
a solid majority of new residents on the urbanedge, according to Morrison Institute survey datagathered in September 1999*. Almost 60 percentof new residents at the urban periphery (18 milesor more from downtown Phoenix) came fromanother metropolitan address, rather than fromout of town. New arrivals also choose homes atthe fringe, but they comprise a smaller share ofthese residents.
For every local mover who came closer in,two moved farther out. Recent movers went out-ward an average of nearly five miles. In otherwords, they left a home about 10 miles fromdowntown Phoenix for one 15 miles out. Themain destinations of outward movers were thenorth, northeast and southeast edges. Meanwhile,a third of metropolitan Phoenix movers movedinward an average of two-and-a-half miles. Theserelocations, however, cannot be construed as a“back-to-the-central-core” movement becausetheir destinations were generally suburban sectionsof northeast Phoenix and older areas of Scottsdale.
Persons over 55 years of age represent almostone-third of new urban fringe residents. Theseresidents tend to congregate in the numerous age-segregated retirement communities located alongthe northwest and eastern edges of the urban area(see Map 7). These senior migrants are likely toarrive at the edge directly from outside the region.
Migrants to the fringe have higher incomesthan their more centrally-located counterparts.About two-thirds of recent edge migrants reportedhousehold incomes above $50,000, compared toone-half of movers to more central locations.This contradicts the notion that affordable housingis the primary motivation for moving outward.Fringe migrants tended to favor “newness” morethan proximity to work, quality schools, transitor established neighborhoods. They also felt asurprisingly strong sense of community andbelonging in their new neighborhoods.
Though employment is dispersing at aslower rate than population, three employmentsubcenters are developing near the urbanfringe. The areas around the Scottsdale Airport,Scottsdale Ranch, and along the Black CanyonFreeway north of Greenway Road at this timeprobably include 10,000 jobs each.
WHAT THIS MEANS The fast pace of outward expansion highlightsthe importance of setting out strategies early to accommodate fast residential growth and toprotect resources and open space. The tendencyof residential housing development to extend to the outer limits first and then focus on in-fillconstruction leaves planners less time to preparefor growth on the fringe. Moreover, given thatdevelopment is taking place across jurisdictions,the land-use plans of one city will intersect with– and perhaps contradict – the land-use policiesof another.
Extremely fast growth at the fringe strainsthe capacity of outlying communities. Fringeareas are struggling to provide new schools,services and infrastructure, while preservingopen space and protecting the environment.Many of these communities were essentially ruraluntil very recently, but now they must contendwith growth rates of 40 percent or more. Newpeople require new services, water lines and sewerconnections. But, many places, because they areessentially “bedroom communities,” lack theresources and expertise to extend their systemsacross larger, more-populous service areas. Forexample, school districts as diverse as Avondale,Mesa, Peoria, Queen Creek, Glendale, and DeerValley are worrying about hiring teachers toaccommodate sudden pulses of new students.These pressures motivated Apache Junction toadopt a school impact fee on new residentialdevelopment. Glendale recently adopted an ordinance which requires developers to show thatschool capacity exists before the city will approvetheir projects.
The large numbers of seniors and affluenthouseholds in the fringe areas may complicatecommunity decision making. Well-off house-holds and senior citizens can be a boon to theirnew hometowns. However, these populationscould also compound the challenges facingthese municipalities. Retirees require differentservices than young families. That they areattracted more by new homes and health carefacilities than by accessibility to work andschools can pose challenges for communitiesseeking to provide a full range of transportation,recreation, and education services.
Map 7: Metropolitan PhoenixRetirement Communities
are Located on the Region’s Fr inge
Source: Dr. Patricia Gober, Department of Geography, Arizona State University.
Between 1993 and 1998, new residential development moved outward by an average of nearly half a mile each year.
* The survey respondents which were plotted on the street maps to identify their new location overrepresented affluenthomeowners and underrepresented low-income renters.
10 1112
13
0 5 10 Mi
N
1 2
3
4
RetirementCommunities
IncorporatedAreas
Freeways
5
6 78
14
9
11121314
Arizona SkiesSuperstition CountryThe ResortSun Lakes
6789
10
Conquistador VillageApache WellsDreamland VillaLeisure WorldFountain of the Sun
12345
Sun City GrandeSun City WestYoungtownSun CityRio Verde
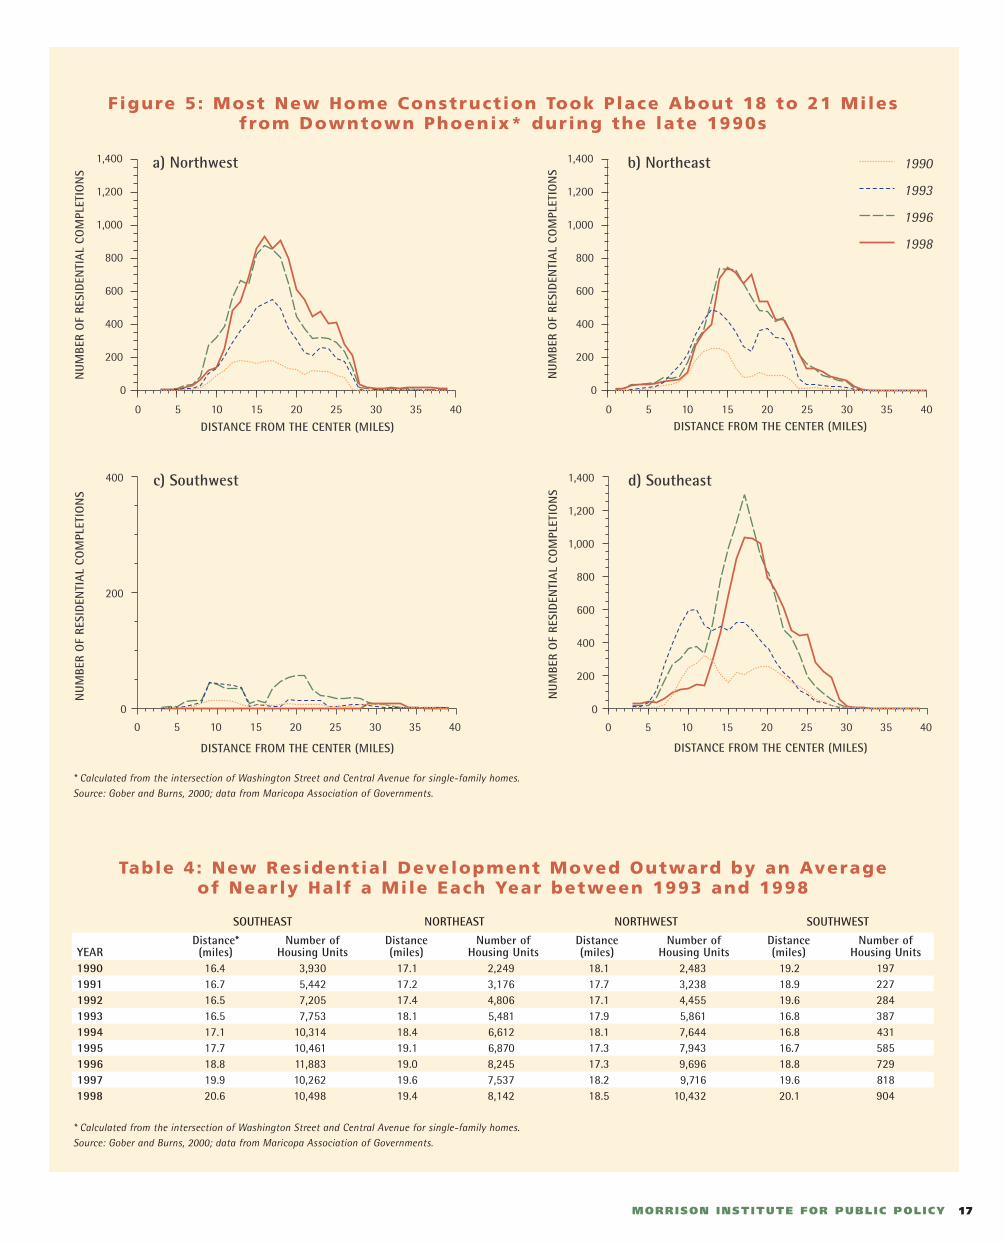
17MORRISON INSTITUTE FOR PUBLIC POLICY
0
200
400
0 5 10 15 20 25 30 35 40
c) Southwest
0
200
400
600
800
1,000
1,200
1,400
0 5 10 15 20 25 30 35 40
d) Southeast
DISTANCE FROM THE CENTER (MILES)
0
200
400
600
800
1,000
1,200
1,400
0 5 10 15 20 25 30 35 40
a) Northwest
0
200
400
600
800
1,000
1,200
1,400
0 5 10 15 20 25 30 35 40
b) Northeast 1990
1993
1996
1998
NU
MBE
R O
F RE
SID
ENTI
AL
COM
PLET
ION
S
DISTANCE FROM THE CENTER (MILES)
NU
MBE
R O
F RE
SID
ENTI
AL
COM
PLET
ION
S
DISTANCE FROM THE CENTER (MILES)
NU
MBE
R O
F RE
SID
ENTI
AL
COM
PLET
ION
S
DISTANCE FROM THE CENTER (MILES)
NU
MBE
R O
F RE
SID
ENTI
AL
COM
PLET
ION
S
Figure 5: Most New Home Construction Took Place About 18 to 21 Miles from Downtown Phoenix* during the late 1990s
* Calculated from the intersection of Washington Street and Central Avenue for single-family homes.Source: Gober and Burns, 2000; data from Maricopa Association of Governments.
Table 4: New Residential Development Moved Outward by an Average of Nearly Half a Mile Each Year between 1993 and 1998
SOUTHEAST NORTHEAST NORTHWEST SOUTHWEST
Distance* Number of Distance Number of Distance Number of Distance Number ofYEAR (miles) Housing Units (miles) Housing Units (miles) Housing Units (miles) Housing Units1990 16.4 3,930 17.1 2,249 18.1 2,483 19.2 1971991 16.7 5,442 17.2 3,176 17.7 3,238 18.9 2271992 16.5 7,205 17.4 4,806 17.1 4,455 19.6 2841993 16.5 7,753 18.1 5,481 17.9 5,861 16.8 3871994 17.1 10,314 18.4 6,612 18.1 7,644 16.8 4311995 17.7 10,461 19.1 6,870 17.3 7,943 16.7 5851996 18.8 11,883 19.0 8,245 17.3 9,696 18.8 7291997 19.9 10,262 19.6 7,537 18.2 9,716 19.6 8181998 20.6 10,498 19.4 8,142 18.5 10,432 20.1 904
* Calculated from the intersection of Washington Street and Central Avenue for single-family homes.Source: Gober and Burns, 2000; data from Maricopa Association of Governments.
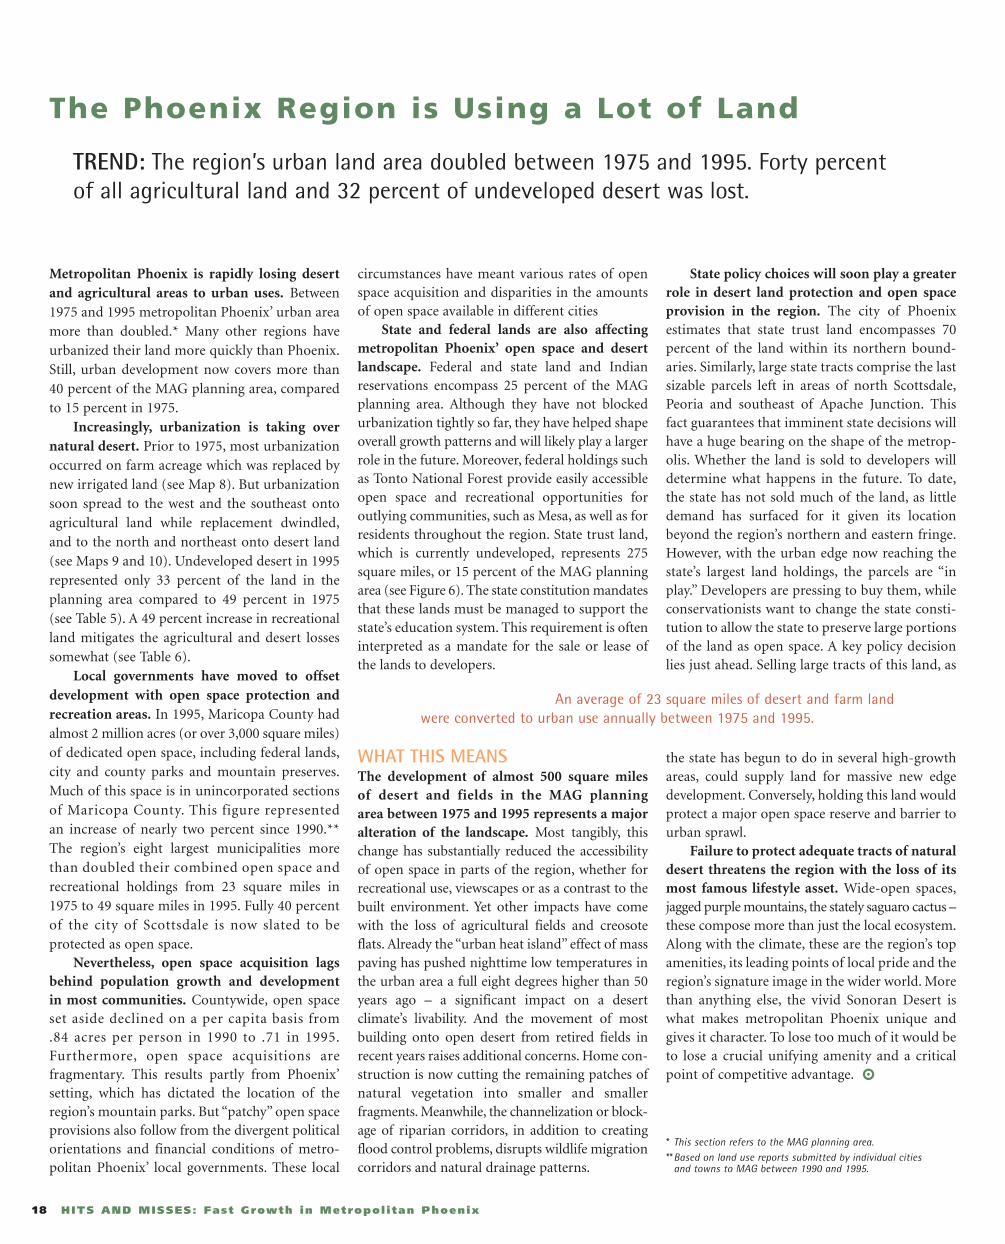
18 HITS AND MISSES: Fast Growth in Metropol i tan Phoenix
The Phoenix Region is Using a Lot of Land
TREND: The region’s urban land area doubled between 1975 and 1995. Forty percent of all agricultural land and 32 percent of undeveloped desert was lost.
Metropolitan Phoenix is rapidly losing desertand agricultural areas to urban uses. Between1975 and 1995 metropolitan Phoenix’ urban areamore than doubled.* Many other regions haveurbanized their land more quickly than Phoenix.Still, urban development now covers more than40 percent of the MAG planning area, comparedto 15 percent in 1975.
Increasingly, urbanization is taking overnatural desert. Prior to 1975, most urbanizationoccurred on farm acreage which was replaced bynew irrigated land (see Map 8). But urbanizationsoon spread to the west and the southeast ontoagricultural land while replacement dwindled,and to the north and northeast onto desert land(see Maps 9 and 10). Undeveloped desert in 1995represented only 33 percent of the land in theplanning area compared to 49 percent in 1975(see Table 5). A 49 percent increase in recreationalland mitigates the agricultural and desert lossessomewhat (see Table 6).
Local governments have moved to offsetdevelopment with open space protection andrecreation areas. In 1995, Maricopa County hadalmost 2 million acres (or over 3,000 square miles)of dedicated open space, including federal lands,city and county parks and mountain preserves.Much of this space is in unincorporated sectionsof Maricopa County. This figure represented an increase of nearly two percent since 1990.**The region’s eight largest municipalities morethan doubled their combined open space andrecreational holdings from 23 square miles in1975 to 49 square miles in 1995. Fully 40 percentof the city of Scottsdale is now slated to be protected as open space.
Nevertheless, open space acquisition lagsbehind population growth and development in most communities. Countywide, open spaceset aside declined on a per capita basis from .84 acres per person in 1990 to .71 in 1995.Furthermore, open space acquisitions are fragmentary. This results partly from Phoenix’setting, which has dictated the location of theregion’s mountain parks. But “patchy” open spaceprovisions also follow from the divergent politicalorientations and financial conditions of metro-politan Phoenix’ local governments. These local
circumstances have meant various rates of openspace acquisition and disparities in the amountsof open space available in different cities
State and federal lands are also affecting metropolitan Phoenix’ open space and desertlandscape. Federal and state land and Indianreservations encompass 25 percent of the MAGplanning area. Although they have not blockedurbanization tightly so far, they have helped shapeoverall growth patterns and will likely play a largerrole in the future. Moreover, federal holdings suchas Tonto National Forest provide easily accessibleopen space and recreational opportunities foroutlying communities, such as Mesa, as well as forresidents throughout the region. State trust land,which is currently undeveloped, represents 275square miles, or 15 percent of the MAG planningarea (see Figure 6). The state constitution mandatesthat these lands must be managed to support thestate’s education system. This requirement is ofteninterpreted as a mandate for the sale or lease ofthe lands to developers.
WHAT THIS MEANS The development of almost 500 square miles of desert and fields in the MAG planning area between 1975 and 1995 represents a majoralteration of the landscape. Most tangibly, thischange has substantially reduced the accessibilityof open space in parts of the region, whether forrecreational use, viewscapes or as a contrast to thebuilt environment. Yet other impacts have comewith the loss of agricultural fields and creosoteflats. Already the “urban heat island” effect of masspaving has pushed nighttime low temperatures inthe urban area a full eight degrees higher than 50years ago – a significant impact on a desert climate’s livability. And the movement of mostbuilding onto open desert from retired fields inrecent years raises additional concerns. Home con-struction is now cutting the remaining patches ofnatural vegetation into smaller and smaller fragments. Meanwhile, the channelization or block-age of riparian corridors, in addition to creatingflood control problems, disrupts wildlife migrationcorridors and natural drainage patterns.
State policy choices will soon play a greaterrole in desert land protection and open spaceprovision in the region. The city of Phoenix estimates that state trust land encompasses 70percent of the land within its northern bound-aries. Similarly, large state tracts comprise the lastsizable parcels left in areas of north Scottsdale,Peoria and southeast of Apache Junction. Thisfact guarantees that imminent state decisions willhave a huge bearing on the shape of the metrop-olis. Whether the land is sold to developers willdetermine what happens in the future. To date,the state has not sold much of the land, as littledemand has surfaced for it given its locationbeyond the region’s northern and eastern fringe.However, with the urban edge now reaching thestate’s largest land holdings, the parcels are “inplay.” Developers are pressing to buy them, whileconservationists want to change the state consti-tution to allow the state to preserve large portionsof the land as open space. A key policy decisionlies just ahead. Selling large tracts of this land, as
the state has begun to do in several high-growthareas, could supply land for massive new edgedevelopment. Conversely, holding this land wouldprotect a major open space reserve and barrier tourban sprawl.
Failure to protect adequate tracts of naturaldesert threatens the region with the loss of itsmost famous lifestyle asset. Wide-open spaces,jagged purple mountains, the stately saguaro cactus –these compose more than just the local ecosystem.Along with the climate, these are the region’s topamenities, its leading points of local pride and theregion’s signature image in the wider world. Morethan anything else, the vivid Sonoran Desert iswhat makes metropolitan Phoenix unique andgives it character. To lose too much of it would beto lose a crucial unifying amenity and a criticalpoint of competitive advantage.
An average of 23 square miles of desert and farm land were converted to urban use annually between 1975 and 1995.
* This section refers to the MAG planning area.**Based on land use reports submitted by individual cities
and towns to MAG between 1990 and 1995.
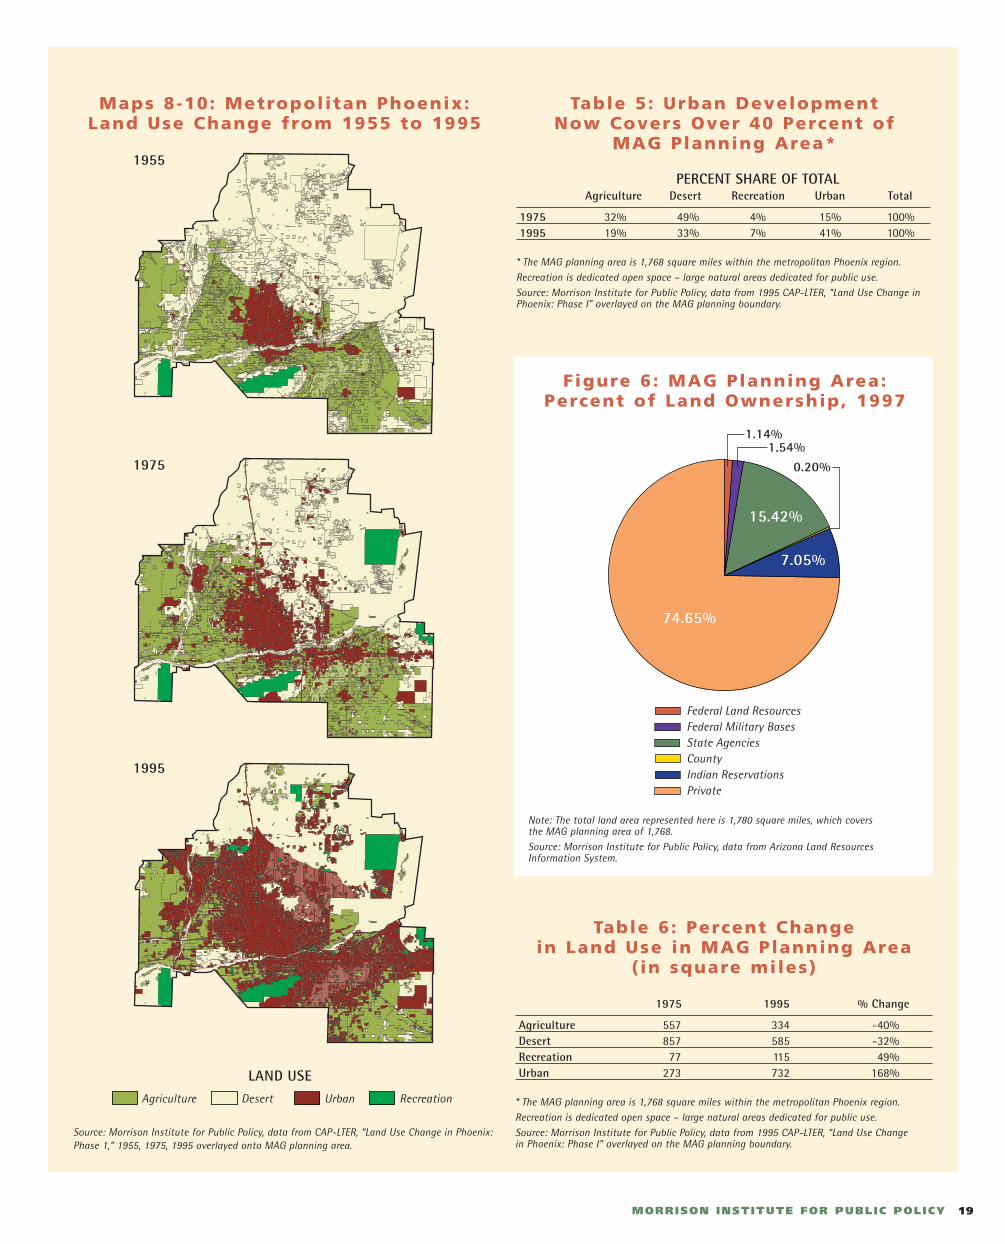
19MORRISON INSTITUTE FOR PUBLIC POLICY
Table 5: Urban Development Now Covers Over 40 Percent of
MAG Planning Area*
PERCENT SHARE OF TOTAL Agriculture Desert Recreation Urban Total
1975 32% 49% 4% 15% 100% 1995 19% 33% 7% 41% 100%
* The MAG planning area is 1,768 square miles within the metropolitan Phoenix region.Recreation is dedicated open space – large natural areas dedicated for public use. Source: Morrison Institute for Public Policy, data from 1995 CAP-LTER, “Land Use Change inPhoenix: Phase I” overlayed on the MAG planning boundary.
Table 6: Percent Change in Land Use in MAG Planning Area
( in square miles)
1975 1995 % Change
Agriculture 557 334 -40%Desert 857 585 -32%Recreation 77 115 49%Urban 273 732 168%
* The MAG planning area is 1,768 square miles within the metropolitan Phoenix region.Recreation is dedicated open space – large natural areas dedicated for public use. Source: Morrison Institute for Public Policy, data from 1995 CAP-LTER, “Land Use Change in Phoenix: Phase I” overlayed on the MAG planning boundary.
Maps 8-10: Metropolitan Phoenix:Land Use Change from 1955 to 1995
Source: Morrison Institute for Public Policy, data from CAP-LTER, “Land Use Change in Phoenix:Phase 1,” 1955, 1975, 1995 overlayed onto MAG planning area.
Figure 6: MAG Planning Area:Percent of Land Ownership, 1997
Note: The total land area represented here is 1,780 square miles, which covers the MAG planning area of 1,768.Source: Morrison Institute for Public Policy, data from Arizona Land ResourcesInformation System.
74.65%
7.05%
15.42%
1.54%1.14%
0.20%
Federal Land ResourcesFederal Military BasesState AgenciesCountyIndian ReservationsPrivate
Agriculture Desert Urban Recreation
LAND USE
1955
1975
1995
20 HITS AND MISSES: Fast Growth in Metropol i tan Phoenix
The City of Phoenix’ Resources are BalancedCompared to Its Largest Suburbs
TREND: Unlike in many regions, the city of Phoenix exhibits relatively balanced distribution of housing values, jobs and retail sales compared to its five large suburbs.
The region’s central city and its major suburbs
display relatively even distributions of housing,
jobs and retail sales. This balance likely results
from the fact that the city of Phoenix contains a
mix of established central areas, old and new
suburbs and recent fringe development. The city
of Phoenix has more jobs than the per capita
regional average. Retail sales and housing values
are somewhat below the regional average. These
figures suggest that the city of Phoenix, unlike
many core cities of metropolitan areas, has
maintained a broad revenue base to pay for
services to residents.
Retail figures are used as one indicator of
municipal fiscal capacity (see Table 7). Sales tax
collections account for about 62 percent of local
tax revenues in the region, compared to 27 percent
nationwide. Six of the most populous cities in
the region obtain at least 70 percent of their local
tax revenue from sales activity. In contrast, the
property tax is the primary source of local rev-
enues nationally. Housing values are an indicator
of property tax collections, which account for
32 percent of local tax revenues in the region
(compared to 53 percent nationally).
Among the five populous suburbs, the
measures of housing values, jobs and retail sales
vary widely. Tempe and Scottsdale are the
region’s leaders in all three measures (see Figure
7). Scottsdale’s per capita retail sales figure is
almost twice that in the region and its housing
value was 37 percent higher.* Tempe has attracted
almost 80 percent more jobs than the regional
average. Tempe and Scottsdale are part of the
region’s secondary employment core.
Smaller, outlying communities tend to have
fewer resources. In nearly all of these municipal-
ities, the per capita retail sales and jobs per capita
figures are below the regional average. Housing
values in some communities on the east side of
the region are well above the metropolitan average.
(see Figure 8).
WHAT THIS MEANS Metropolitan Phoenix fortunately does not
have the city-suburb resource disparities with
which many regions struggle. Many urban
regions in the United States suffer from gross
disparities in the distribution of people, jobs, and
economic and social resources between their core
cities and their suburbs. Frequently, the cores and
inner suburbs are caught in a downward spiral of
poverty, crime, housing decline, job shortages
and revenue shortfalls, made worse by the flight
of middle-income families and many employers
to more prosperous suburbs.10 Metropolitan
Phoenix does not fit this model since no glaring
deficiency in resources separates the core city –
Phoenix – from its five largest suburbs.
The stability of sales tax collections is a
legitimate concern. Unlike urban regions in the
northeast and midwest, metropolitan Phoenix
cities rely heavily on sales tax revenue and rela-
tively little on property tax collections. Property
tax is limited by Arizona law. Conversely, sales
tax collections can be set at the discretion of each
city. Such a reliance on sales tax revenue raises
policy issues for the future. The most familiar
concern centers on the variability of sales tax
collections, which tend to stagnate in economic
recessions. But there are three other worries.
For one, the state is beginning to boost sales
taxes for its own needs. The governor and the
state legislature put a proposal on the November
2000 ballot to raise the state sales tax from 5.0 to
5.6 percent. The additional $445 million a year
would be used for education. Public acceptance
of sales tax increases may quickly “hit the wall.”
That could limit cities’ ability to raise taxes fur-
ther for key urban services. Most large cities in
the Phoenix region have recently increased their
sales tax rates for a variety of special purposes.
For example, Tempe and Phoenix approved an
increase to fund more transit, and Scottsdale raised
its rate for the purchase of land for preservation.
Mesa voted to fund a performing arts center and
transit among other civic improvements in a
quality-of-life measure.
Another concern is E-commerce (Internet
sales) which currently escapes local taxation. This
too could restrict municipal revenue growth. An
assessment by the League of Arizona Cities and
Towns suggests that Internet sales growth could
cost Arizona cities $102 million by 2003. In this
scenario, the eight largest Phoenix area cities
would lose about 10 percent of current total sales
tax collections. This would be a serious threat to
Phoenix’ metropolitan balance.
In addition, a sales tax that exempts most
services will, over time, fall behind growth as an
increasing percentage of spending shifts away
from taxable goods to untaxed services.
The city of Phoenix has 15 percent more jobs per capita than the regional average.
* The bed and use tax was excluded from this study because varying definitions limited comparisons.
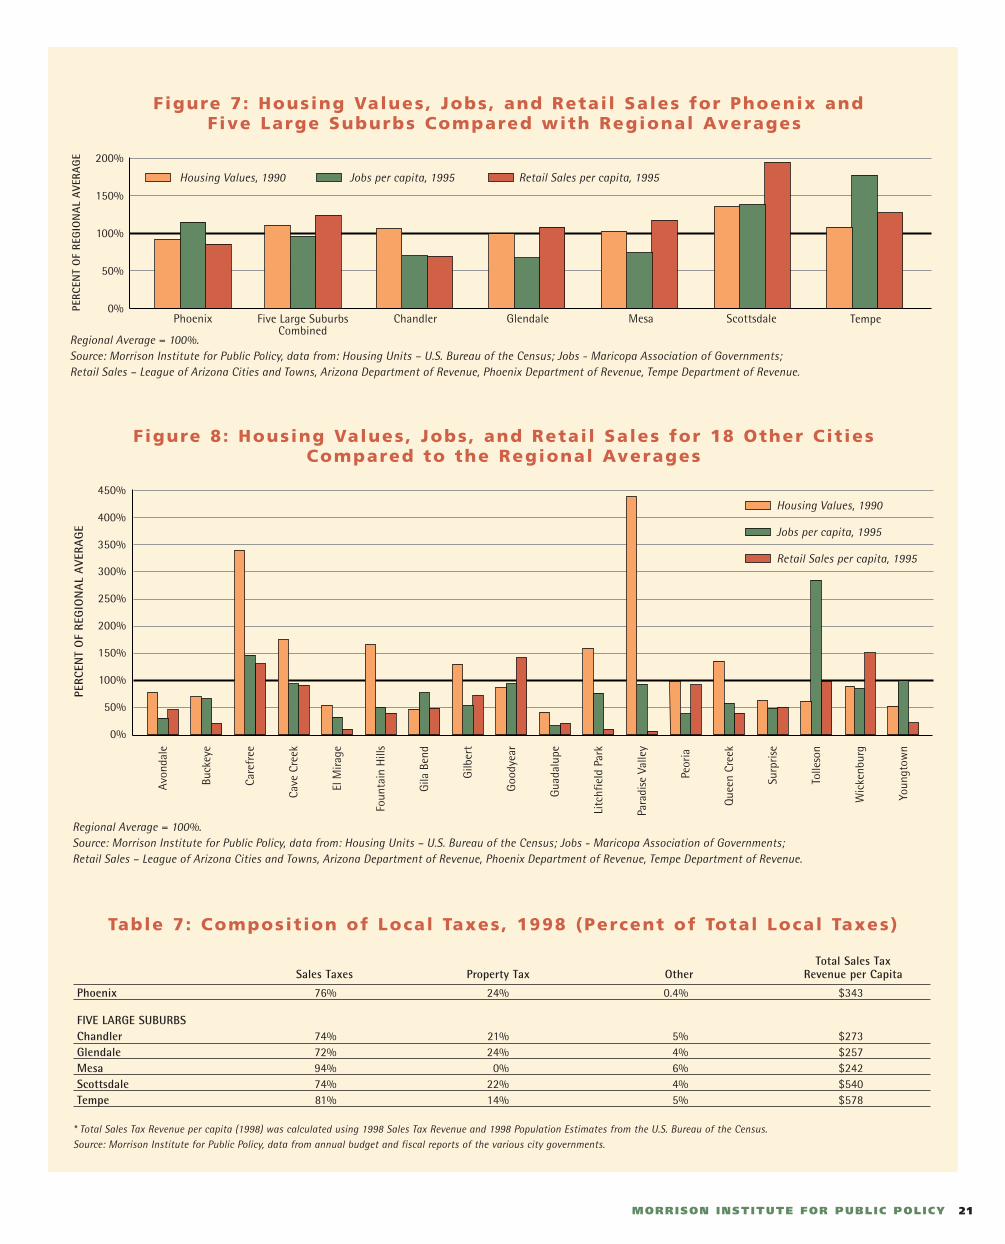
21MORRISON INSTITUTE FOR PUBLIC POLICY
Figure 7: Housing Values, Jobs, and Retai l Sales for Phoenix and Five Large Suburbs Compared with Regional Averages
Figure 8: Housing Values, Jobs, and Retai l Sales for 18 Other Cit ies Compared to the Regional Averages
Table 7: Composit ion of Local Taxes, 1998 (Percent of Total Local Taxes)
Total Sales Tax Sales Taxes Property Tax Other Revenue per Capita
Phoenix 76% 24% 0.4% $343
FIVE LARGE SUBURBSChandler 74% 21% 5% $273Glendale 72% 24% 4% $257Mesa 94% 0% 6% $242Scottsdale 74% 22% 4% $540Tempe 81% 14% 5% $578
* Total Sales Tax Revenue per capita (1998) was calculated using 1998 Sales Tax Revenue and 1998 Population Estimates from the U.S. Bureau of the Census.Source: Morrison Institute for Public Policy, data from annual budget and fiscal reports of the various city governments.
0%
50%
100%
150%
200%
250%
300%
PERC
ENT
OF
REG
ION
AL
AVE
RAG
E
Avon
dale
Buck
eye
Care
free
Cave
Cre
ek
El M
irage
Foun
tain
Hill
s
Gila
Ben
d
Gilb
ert
Goo
dyea
r
Gua
dalu
pe
Litc
hfie
ld P
ark
Para
dise
Val
ley
Peor
ia
Que
en C
reek
Surp
rise
Tolle
son
Wic
kenb
urg
Youn
gtow
n
Regional Average = 100%.Source: Morrison Institute for Public Policy, data from: Housing Units – U.S. Bureau of the Census; Jobs - Maricopa Association of Governments; Retail Sales – League of Arizona Cities and Towns, Arizona Department of Revenue, Phoenix Department of Revenue, Tempe Department of Revenue.
Housing Values, 1990
Jobs per capita, 1995
Retail Sales per capita, 1995350%
400%
450%
Regional Average = 100%.Source: Morrison Institute for Public Policy, data from: Housing Units – U.S. Bureau of the Census; Jobs - Maricopa Association of Governments; Retail Sales – League of Arizona Cities and Towns, Arizona Department of Revenue, Phoenix Department of Revenue, Tempe Department of Revenue.
0%
50%
100%
150%
200%
PERC
ENT
OF
REG
ION
AL
AVE
RAG
E
Chandler Glendale MesaPhoenix Scottsdale Tempe
Housing Values, 1990 Jobs per capita, 1995 Retail Sales per capita, 1995
Five Large SuburbsCombined
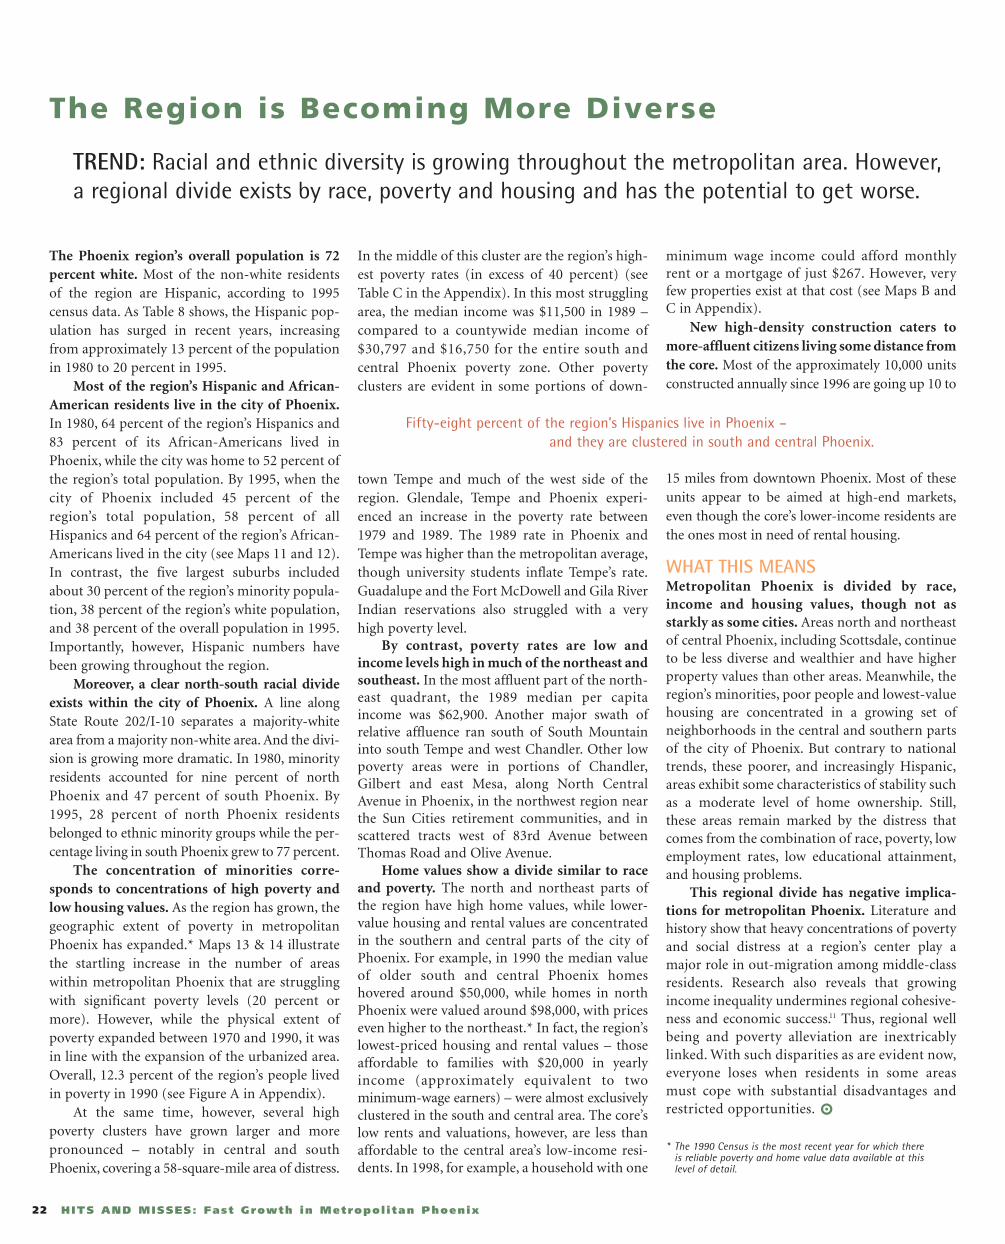
22 HITS AND MISSES: Fast Growth in Metropol i tan Phoenix
The Phoenix region’s overall population is 72percent white. Most of the non-white residentsof the region are Hispanic, according to 1995 census data. As Table 8 shows, the Hispanic pop-ulation has surged in recent years, increasingfrom approximately 13 percent of the populationin 1980 to 20 percent in 1995.
Most of the region’s Hispanic and African-American residents live in the city of Phoenix.In 1980, 64 percent of the region’s Hispanics and83 percent of its African-Americans lived inPhoenix, while the city was home to 52 percent ofthe region’s total population. By 1995, when thecity of Phoenix included 45 percent of theregion’s total population, 58 percent of allHispanics and 64 percent of the region’s African-Americans lived in the city (see Maps 11 and 12).In contrast, the five largest suburbs includedabout 30 percent of the region’s minority popula-tion, 38 percent of the region’s white population,and 38 percent of the overall population in 1995.Importantly, however, Hispanic numbers havebeen growing throughout the region.
Moreover, a clear north-south racial divideexists within the city of Phoenix. A line alongState Route 202/I-10 separates a majority-whitearea from a majority non-white area. And the divi-sion is growing more dramatic. In 1980, minorityresidents accounted for nine percent of northPhoenix and 47 percent of south Phoenix. By1995, 28 percent of north Phoenix residentsbelonged to ethnic minority groups while the per-centage living in south Phoenix grew to 77 percent.
The concentration of minorities corre-sponds to concentrations of high poverty andlow housing values. As the region has grown, thegeographic extent of poverty in metropolitanPhoenix has expanded.* Maps 13 & 14 illustratethe startling increase in the number of areaswithin metropolitan Phoenix that are strugglingwith significant poverty levels (20 percent ormore). However, while the physical extent ofpoverty expanded between 1970 and 1990, it wasin line with the expansion of the urbanized area.Overall, 12.3 percent of the region’s people livedin poverty in 1990 (see Figure A in Appendix).
At the same time, however, several highpoverty clusters have grown larger and more pronounced – notably in central and southPhoenix, covering a 58-square-mile area of distress.
In the middle of this cluster are the region’s high-est poverty rates (in excess of 40 percent) (seeTable C in the Appendix). In this most strugglingarea, the median income was $11,500 in 1989 –compared to a countywide median income of$30,797 and $16,750 for the entire south and central Phoenix poverty zone. Other povertyclusters are evident in some portions of down-
town Tempe and much of the west side of theregion. Glendale, Tempe and Phoenix experi-enced an increase in the poverty rate between1979 and 1989. The 1989 rate in Phoenix andTempe was higher than the metropolitan average,though university students inflate Tempe’s rate.Guadalupe and the Fort McDowell and Gila RiverIndian reservations also struggled with a veryhigh poverty level.
By contrast, poverty rates are low andincome levels high in much of the northeast andsoutheast. In the most affluent part of the north-east quadrant, the 1989 median per capitaincome was $62,900. Another major swath ofrelative affluence ran south of South Mountaininto south Tempe and west Chandler. Other lowpoverty areas were in portions of Chandler,Gilbert and east Mesa, along North CentralAvenue in Phoenix, in the northwest region nearthe Sun Cities retirement communities, and inscattered tracts west of 83rd Avenue betweenThomas Road and Olive Avenue.
Home values show a divide similar to raceand poverty. The north and northeast parts ofthe region have high home values, while lower-value housing and rental values are concentratedin the southern and central parts of the city ofPhoenix. For example, in 1990 the median valueof older south and central Phoenix homes hovered around $50,000, while homes in northPhoenix were valued around $98,000, with priceseven higher to the northeast.* In fact, the region’slowest-priced housing and rental values – thoseaffordable to families with $20,000 in yearlyincome (approximately equivalent to two minimum-wage earners) – were almost exclusivelyclustered in the south and central area. The core’slow rents and valuations, however, are less thanaffordable to the central area’s low-income resi-dents. In 1998, for example, a household with one
minimum wage income could afford monthlyrent or a mortgage of just $267. However, veryfew properties exist at that cost (see Maps B andC in Appendix).
New high-density construction caters tomore-affluent citizens living some distance fromthe core. Most of the approximately 10,000 unitsconstructed annually since 1996 are going up 10 to
15 miles from downtown Phoenix. Most of theseunits appear to be aimed at high-end markets,even though the core’s lower-income residents arethe ones most in need of rental housing.
WHAT THIS MEANS Metropolitan Phoenix is divided by race,income and housing values, though not asstarkly as some cities. Areas north and northeastof central Phoenix, including Scottsdale, continueto be less diverse and wealthier and have higherproperty values than other areas. Meanwhile, theregion’s minorities, poor people and lowest-valuehousing are concentrated in a growing set ofneighborhoods in the central and southern partsof the city of Phoenix. But contrary to nationaltrends, these poorer, and increasingly Hispanic,areas exhibit some characteristics of stability suchas a moderate level of home ownership. Still,these areas remain marked by the distress thatcomes from the combination of race, poverty, lowemployment rates, low educational attainment,and housing problems.
This regional divide has negative implica-tions for metropolitan Phoenix. Literature andhistory show that heavy concentrations of povertyand social distress at a region’s center play amajor role in out-migration among middle-classresidents. Research also reveals that growingincome inequality undermines regional cohesive-ness and economic success.11 Thus, regional wellbeing and poverty alleviation are inextricablylinked. With such disparities as are evident now,everyone loses when residents in some areas must cope with substantial disadvantages andrestricted opportunities.
The Region is Becoming More Diverse
TREND: Racial and ethnic diversity is growing throughout the metropolitan area. However,a regional divide exists by race, poverty and housing and has the potential to get worse.
Fifty-eight percent of the region’s Hispanics live in Phoenix –and they are clustered in south and central Phoenix.
* The 1990 Census is the most recent year for which there is reliable poverty and home value data available at this level of detail.
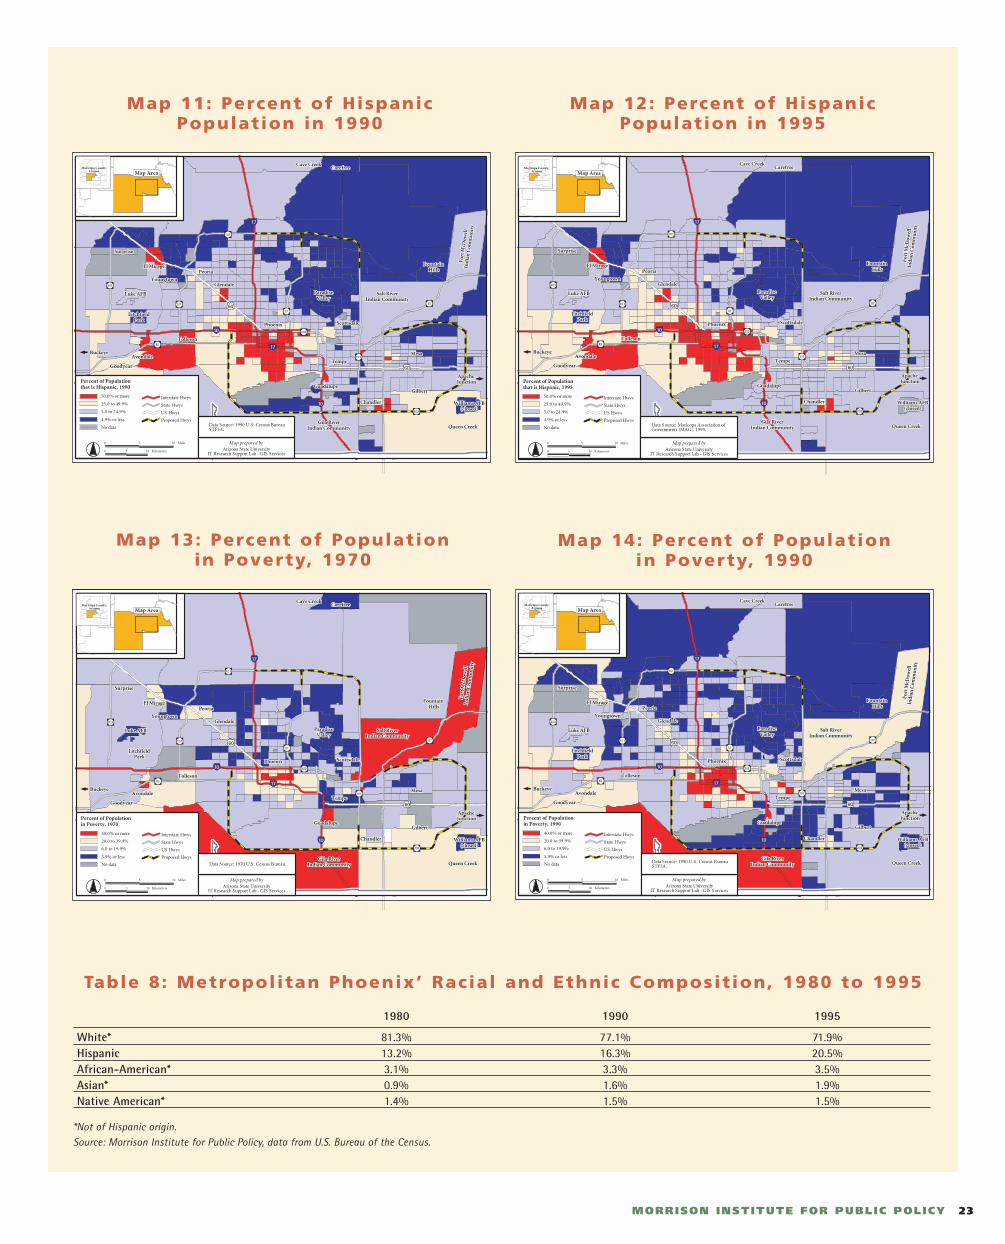
23MORRISON INSTITUTE FOR PUBLIC POLICY
Map prepared byArizona State University
IT Research Support Lab - GIS Services
Data Source: 1990 U.S. Census BureauSTF3A.
Interstate Hwys
Proposed Hwys
State Hwys
US Hwys
0 5 10 Miles
0 5 10 Kilometers
4.9% or less
5.0 to 24.9%
25.0 to 49.9%
50.0% or more
No data
Percent of Populationthat is Hispanic, 1990
Map Area
303
85
101
10
60
101
17
202
51
17
60
101
202
87
10
Goodyear
Maricopa County,Arizona
Map prepared byArizona State University
IT Research Support Lab - GIS Services
Data Source: Maricopa Association ofGovernments (MAG), 1995.
Interstate Hwys
Proposed Hwys
State Hwys
US Hwys
0 5 10 Miles
0 5 10 Kilometers
Percent of Populationthat is Hispanic, 1995
,
No data
50.0% or more
25.0 to 49.9%
5.0 to 24.9%
4.9% or less
Map AreaMaricopa County
Arizona
303
85
101
10
60
101
17
202
51
17
60
101
202
87
10
Goodyear
Map 11: Percent of HispanicPopulation in 1990
Map 12: Percent of Hispanic Population in 1995
Table 8: Metropolitan Phoenix’ Racial and Ethnic Composit ion, 1980 to 1995
1980 1990 1995
White* 81.3% 77.1% 71.9%Hispanic 13.2% 16.3% 20.5%African-American* 3.1% 3.3% 3.5%Asian* 0.9% 1.6% 1.9%Native American* 1.4% 1.5% 1.5%
*Not of Hispanic origin.Source: Morrison Institute for Public Policy, data from U.S. Bureau of the Census.
Interstate Hwys
Proposed Hwys
State Hwys
US Hwys
0 5 10 Miles
0 5 10 Kilometers
5.9% or less
6.0 to 19.9%
20.0 to 39.9%
40.0% or more
No data
Percent of Populationin Poverty, 1970
Map prepared byArizona State University
IT Research Support Lab - GIS Services
Data Source: 1970 U.S. Census Bureau.
Map AreaMaricopa County,
Arizona
303
85
101
10
60
101
17
202
51
17
60
101
202
87
10
Goodyear
Interstate Hwys
Proposed Hwys
State Hwys
US Hwys
0 5 10 Miles
0 5 10 Kilometers
Percent of Populationin Poverty, 1990
Map prepared byArizona State University
IT Research Support Lab - GIS Services
Data Source: 1990 U.S. Census BureauSTF3A.
No data
40.0% or more
20.0 to 39.9%
6.0 to 19.9%
5.9% or less
Map Area
303
85
101
10
60
101
17
202
51
17
60
101
202
87
10
Maricopa County,Arizona
Goodyear
Map 13: Percent of Population in Poverty, 1970
Map 14: Percent of Population in Poverty, 1990
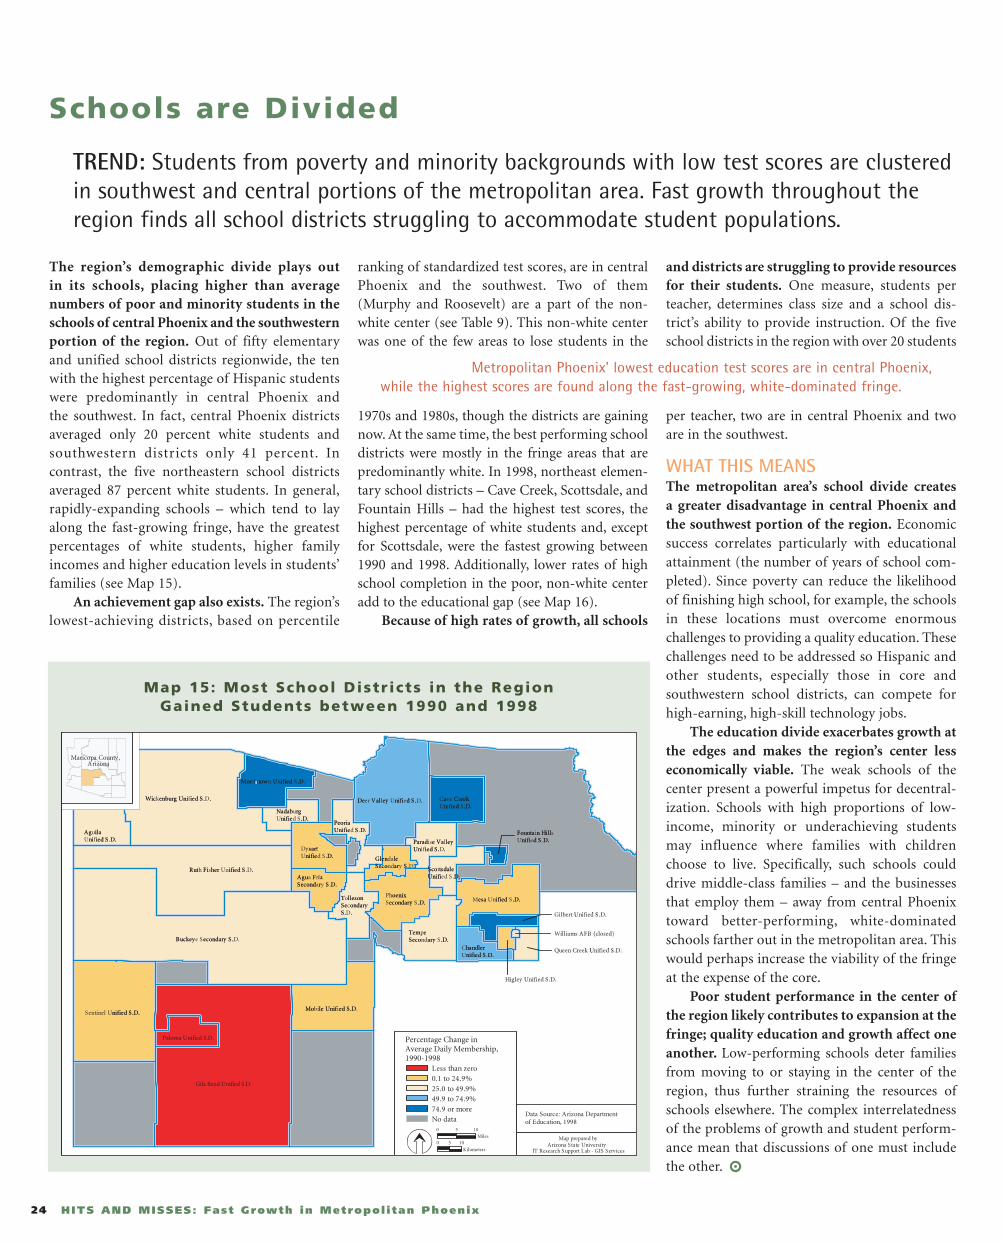
The region’s demographic divide plays out in its schools, placing higher than averagenumbers of poor and minority students in theschools of central Phoenix and the southwesternportion of the region. Out of fifty elementaryand unified school districts regionwide, the tenwith the highest percentage of Hispanic studentswere predominantly in central Phoenix and the southwest. In fact, central Phoenix districtsaveraged only 20 percent white students andsouthwestern districts only 41 percent. In contrast, the five northeastern school districtsaveraged 87 percent white students. In general,rapidly-expanding schools – which tend to layalong the fast-growing fringe, have the greatestpercentages of white students, higher familyincomes and higher education levels in students’families (see Map 15).
An achievement gap also exists. The region’slowest-achieving districts, based on percentile
ranking of standardized test scores, are in centralPhoenix and the southwest. Two of them(Murphy and Roosevelt) are a part of the non-white center (see Table 9). This non-white centerwas one of the few areas to lose students in the
1970s and 1980s, though the districts are gainingnow. At the same time, the best performing schooldistricts were mostly in the fringe areas that arepredominantly white. In 1998, northeast elemen-tary school districts – Cave Creek, Scottsdale, andFountain Hills – had the highest test scores, thehighest percentage of white students and, exceptfor Scottsdale, were the fastest growing between1990 and 1998. Additionally, lower rates of highschool completion in the poor, non-white centeradd to the educational gap (see Map 16).
Because of high rates of growth, all schools
and districts are struggling to provide resourcesfor their students. One measure, students perteacher, determines class size and a school dis-trict’s ability to provide instruction. Of the fiveschool districts in the region with over 20 students
per teacher, two are in central Phoenix and twoare in the southwest.
WHAT THIS MEANS The metropolitan area’s school divide creates a greater disadvantage in central Phoenix andthe southwest portion of the region. Economicsuccess correlates particularly with educationalattainment (the number of years of school com-pleted). Since poverty can reduce the likelihoodof finishing high school, for example, the schoolsin these locations must overcome enormous challenges to providing a quality education. Thesechallenges need to be addressed so Hispanic andother students, especially those in core andsouthwestern school districts, can compete forhigh-earning, high-skill technology jobs.
The education divide exacerbates growth atthe edges and makes the region’s center less economically viable. The weak schools of thecenter present a powerful impetus for decentral-ization. Schools with high proportions of low-income, minority or underachieving studentsmay influence where families with childrenchoose to live. Specifically, such schools coulddrive middle-class families – and the businessesthat employ them – away from central Phoenixtoward better-performing, white-dominatedschools farther out in the metropolitan area. Thiswould perhaps increase the viability of the fringeat the expense of the core.
Poor student performance in the center ofthe region likely contributes to expansion at thefringe; quality education and growth affect oneanother. Low-performing schools deter familiesfrom moving to or staying in the center of theregion, thus further straining the resources ofschools elsewhere. The complex interrelatednessof the problems of growth and student perform-ance mean that discussions of one must includethe other.
24 HITS AND MISSES: Fast Growth in Metropol i tan Phoenix
Schools are Divided
TREND: Students from poverty and minority backgrounds with low test scores are clusteredin southwest and central portions of the metropolitan area. Fast growth throughout theregion finds all school districts struggling to accommodate student populations.
Metropolitan Phoenix’ lowest education test scores are in central Phoenix, while the highest scores are found along the fast-growing, white-dominated fringe.
GlendaleSecondary S .D.Glen leSeco ar S . .
Higley Unified S.D.Higley Unified S.D.
Williams AFB (closed)Williams AFB (closed)
Fountain HillsUnified S .D.Founta n Hill
nifi d S D.
Queen Creek Unified S.D.Queen Creek Unified S.D.
Gilbert Unified S.D.Gilbert Unified S.D.
NadaburgUnified S .D.Nadab rg
nifie .D.
Paradise ValleyUnified S .D.Parad e Va leyUn ied S . .
ChandlerUnified S .D.
handlernified S D.
Agua FriaSecondary S .D.Agu F iaSecond r S D.
ScottsdaleUnified S .D.Sco tsdaleUnifi D.
TollesonSecondaryS.D.
T llesonSe ondaryS. .
PeoriaUnified S .D.PeoriaUnifie S D.
Cave CreekUnified S .D.
a C eekn fied .D.
DysartUnified S .D.
sartnifie .D.
Morristown Unified S .D.Mor i tow U ified .D
TempeSecondary S .D.Tem eSeco ary .D.
PhoenixSecondary S .D.
oenixecondary .D. Mesa Unified S .D.esa ified .D.
Mobile Unified S.D.Mo le Unif ed S.D
AguilaUnified S .D.Ag ila
ni ied S D.
Deer Valley Unified S .D.De Val ey nifi d S . .
Ruth Fisher Unified S .D.Rut Fi her ified S .
Sentinel Unified S .D. nified S .D.
Wickenburg Unified S .D.Wic enburg Uni ied S . .
Buckeye Secondary S .D.Buckey econdary S .
0 5 10
Miles
Less than zero0.1 to 24.9%25.0 to 49.9%49.9 to 74.9%74.9 or moreNo data
Percentage Change in Average Daily Membership, 1990-1998
0 5 10
Kilometers
Data Source: Arizona Departmentof Education, 1998
Map prepared byArizona State University
IT Research Support Lab - GIS Services
Maricopa County,Arizona
Paloma Unified S.D.
Gila Bend Unified S.D.
Map 15: Most School Distr icts in the Region Gained Students between 1990 and 1998
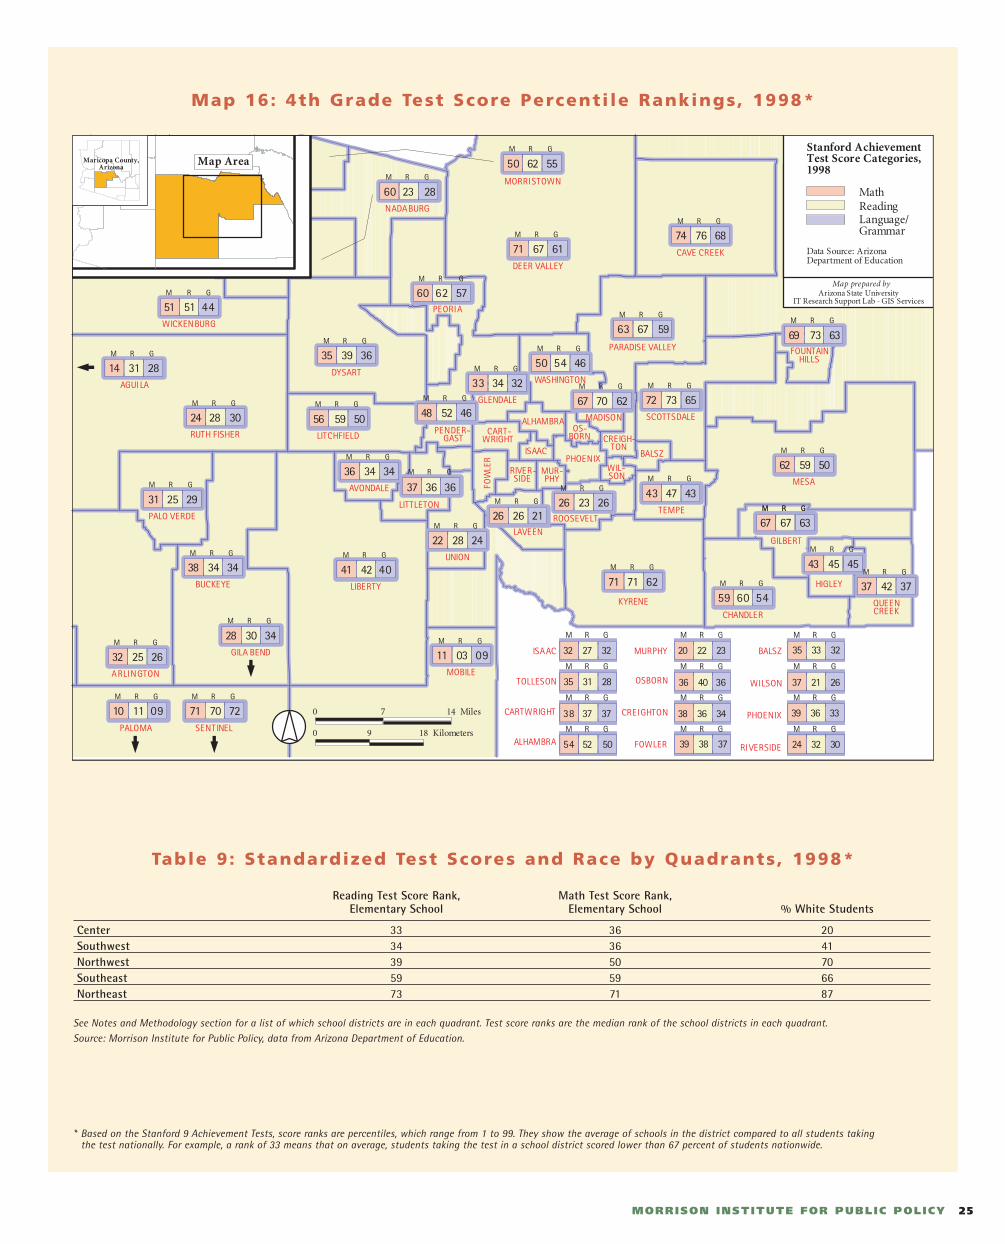
25MORRISON INSTITUTE FOR PUBLIC POLICY
Map 16: 4th Grade Test Score Percenti le Rankings, 1998*
Table 9: Standardized Test Scores and Race by Quadrants, 1998*
Reading Test Score Rank, Math Test Score Rank, Elementary School Elementary School % White Students
Center 33 36 20Southwest 34 36 41Northwest 39 50 70Southeast 59 59 66Northeast 73 71 87
See Notes and Methodology section for a list of which school districts are in each quadrant. Test score ranks are the median rank of the school districts in each quadrant.Source: Morrison Institute for Public Policy, data from Arizona Department of Education.
* Based on the Stanford 9 Achievement Tests, score ranks are percentiles, which range from 1 to 99. They show the average of schools in the district compared to all students taking the test nationally. For example, a rank of 33 means that on average, students taking the test in a school district scored lower than 67 percent of students nationwide.
CAVE CREEK
R GM
74 76 68
R GM
59 60 54
GILA BEND
R GM
28 30 34
MESA
R GM
62 59 50
NADABURG
R GM
60 23 28
PEORIA
QUEENCREEK
RUTH FISHER
SCOTTSDALE
SENTINEL
R GM
71 70 72
DEER VALLEY
R GM
71 67 61
R GM
51 51 44
ARLINGTON
R GM
32 25 26
AVONDALE
BUCKEYE
R GM
38 34 34
GLENDALE
R GM
33 34 32
LIBERTY
R GM
41 42 40
LITCHFIELD
R GM
56 59 50
PALO VERDE ROOSEVELTTEMPE
UNION
R GM
22 28 24
WASHINGTON
R GM
50 54 46
R GM
50 62 55
R GM
36 34 34
R GM
35 39 36
R GM
71 71 62
R GM
26 26 21LAVEEN
R GM
69 73 63
MOBILE
R GM
11 03 09
R GM
14 31 28
R GM
67 67 63
R GM
43 45 45
R GM
67 67 63
R GM
60 62 57
R GM
37 42 37
R GM
24 28 30
R GM
72 73 65
R GM
31 25 29R GM
26 23 26
R GM
43 47 43
R GM
63 67 59
WIL-SON
RIVER-SIDE
OS-BORN
MUR-PHY
ISAAC
FOW
LER
CREIGH-TON
CART-WRIGHT
BALSZ
ALHAMBRA
PHOENIX
PALOMA
R GM
10 11 09
R GM
PENDER-GAST
48 52 46
LITTLETON
37 36 36R GM
MADISON
R GM
67 70 62
WICKENBURG
AGUILADYSART
KYRENE
GILBERT
HIGLEY
CHANDLER
FOUNTAINHILLS
PARADISE VALLEY
MORRISTOWN
0 9 18 Kilometers
0 7 14 Miles
R GM
R GM
R GM
R GM
35 33 32
39 36 33
24 32 30
37 21 26
BALSZ
WILSON
PHOENIX
RIVERSIDE
R GM
R GM
R GM
R GM
38 36 34
39 38 37
20 22 23
36 40 36
FOWLER
CREIGHTON
OSBORN
MURPHY
R GM
R GM
R GM
R GM
54 52 50
38 37 37
32 27 32
35 31 28
ISAAC
TOLLESON
CARTWRIGHT
ALHAMBRA
MathReadingLanguage/Grammar
Stanford AchievementTest Score Categories,1998
Data Source: ArizonaDepartment of Education
Map prepared byArizona State University
IT Research Support Lab - GIS Services
Map AreaMaricopa County,Arizona
26 HITS AND MISSES: Fast Growth in Metropol i tan Phoenix
Aggressive Annexation is a Metropolitan Phoenix Tradition
TREND: Metropolitan Phoenix cities have a history of annexing to capture new revenue and desirable locations and to facilitate planning.
Aggressive annexation by cities has been a
distinctive feature of metropolitan Phoenix
growth since 1970. Since then, the city of
Phoenix has added 230 square miles to its
territory. Such geographic expansion makes the
city of Phoenix a classic “elastic city,” in urban
observer and former Albuquerque mayor David
Rusk’s terms, since it has been able to push its
boundaries outward and thus compete for new
residential and commercial projects.12 The larger
suburbs also have annexed heavily. In fact, while
the city of Phoenix set the pace for annexation
before 1970, Scottsdale, Glendale, Mesa and
Chandler, moved to the fore in the 1970s (see
Figure 9). Only land-locked Tempe, among the
five populous suburbs, did not annex large tracts
of land during that time. Combined, the five
suburbs added some 329 square miles.
More recently, the action on annexation has
shifted outwards. Since 1980, the region’s
municipalities with less than 100,000 population
each have annexed land even more aggressively
than their more established neighbors. By 1998,
these cities and towns encompassed some 667
square miles, compared to Phoenix’ 470 square
miles and the five large suburbs’ 449 square miles.
Since the 1960s, Arizona law has discour-
aged new municipalities from forming close to
existing ones. Territories within three miles of a
city or town that has less than 5,000 people, or
within six miles of a city or town that has 5,000 or
more, cannot form a separate municipality unless
the existing city formally agrees. This may
encourage these territories to solicit annexation
in order to get services, since they cannot incor-
porate on their own.
Cities say they pursue annexation to gain
more control over the development of new
territory in their vicinity. Controlling the quality
and cost impacts of growth in nearby unincorpo-
rated areas was rated the most important reason
for annexations in Morrison Institute’s survey of
cities’ growth management techniques. The second
most important reason cited by the cities was
developers’ threats to build in the county where
there are fewer land use and zoning regulations.
Other important motivations included obtaining
additional sales and property tax revenue and
water resources.
WHAT THIS MEANS Widespread annexation makes the Phoenix
metropolitan area different. In more traditional
regions, smaller existing towns or bodies of water
have often hemmed in the core city, preventing it
from gaining control of lands with attractive
growth potential. In metropolitan Phoenix, how-
ever, that has not happened. Few geographic or
political boundaries have kept the city of Phoenix
or its major satellites from absorbing large
amounts of desirable new land. The central cities’
activism in this area has influenced the region’s
growth patterns in several ways.
Annexation by the city of Phoenix has
helped prevent gross disparities from arising
between the regional core and its largest
suburbs. By extending its boundaries, the city of
Phoenix has been able to compete with the
surrounding cities for desirable populations, jobs,
residential development and retail activity. This
has promoted “balance” in the region; as a result of
its annexations, the city of Phoenix contains not
just old central core areas and old suburbs, but new
suburban areas and recent fringe development. The
same goes for the populous suburbs as a group. By
expanding aggressively they gained shares of the
newest development and population growth.
Annexation has helped to keep the political
map simple. Large-scale annexation has brought
large amounts of unincorporated land under
established government, which is potentially an
advantage for more orderly development in the
region. But it also has kept at a minimum the
number of municipalities that exist in the region.
Although one of the largest metropolitan areas in
the United States, the region consists of only 24
relatively large cities and towns – the city of
Phoenix which contains almost 45 percent of the
region’s population and nearly 30 percent of its
land area, plus 23 other municipalities (see Figure
10). This political map stands in stark contrast to
a metropolitan region such as Chicago (with 265
municipalities) or Los Angeles (with approximately
180). Both these effects – annexing unincorporated
land and a simple political map – may well have
promoted more orderly development in the
region by reducing the number of possibilities for
excessive fragmentation that can lead to land-use
mismanagement.
Now that the region’s less-populous,
farther-out towns control so much land, the
future of the region increasingly depends on
some new players. Their responses to rapid growth
can either undermine or encourage compact devel-
opment patterns and quality of life in both cities
and suburbs. Their involvement in regional coop-
eration and their access to tools and resources
become important issues.
The 18 less-populous municipalities contain 38 percent of the land in the regional planning area.

27MORRISON INSTITUTE FOR PUBLIC POLICY
Figure 9: Land Annexation Trends in Metropolitan Phoenix from 1919 to 2000
Figure 10: In the Metropolitan Region,* the 18 Less-Populous Municipal it iesControl 38 Percent of the Region’s Land Area
* “Metropolitan Region” here refers to the MAG planning area of 1,768 square miles. ** Does not include any portion of Apache Junction, which encompassed only 150 people and one-tenth of a square mile in the MAG planning area in 1995.Source: Morrison Institute for Public Policy, data from 1998 population estimates, U.S. Bureau of the Census; 1998 city land is square miles within city limits, from the League of Arizona Cities and Towns.
0
50
100
150
200
250
300
350
SQU
ARE
MIL
ES A
NN
EXED
Pre 1919 1920-1949 1950-1959 1960-1969 1970-1979 1980-1989 1990-2000
Phoenix
Five Large Suburbs
Other Jurisdictions
Note: Five Large Suburbs are Chandler, Glendale, Mesa, Scottsdale and Tempe. Other Jurisdictions are the remaining incorporated cities in Maricopa County.Source: Morrison Institute for Public Policy, data from Maricopa Association of Governments.
27%
25%
10%
38%
43%
39%
11%
7%
Phoenix Five Large Suburbs Other 18 Jurisdictions** Remainder (Unincorporated County)
PERCENT OF THE POPULATION PERCENT OF THE LAND
28 HITS AND MISSES: Fast Growth in Metropol i tan Phoenix
Taken together, the trends in population, density, employment, education,
transportation, and land-use tell a compelling story about the current state
of metropolitan Phoenix.
In some important ways, metropolitan Phoenix’ growth is a success story.
• Density is increasing, albeit from a very low point.
• The center is not “hollowing out.”
• And in keeping with the vitality of the center, the region retains a
measure of “balance” between its core city – Phoenix – and its largest
suburbs: Scottsdale, Glendale, Mesa, Tempe and Chandler.
Metropolitan Phoenix, in short, has grown at a phenomenal pace without
succumbing to the center-city disinvestment and deep social and economic
divides that often accompany metropolitan growth and development pat-
terns. To that extent, the region confounds large parts of the traditional
model of urban development and the Sunbelt stereotype. Unlike in older
east coast cities, the region’s center is holding, city-suburb disparities are
relatively few and the innermost municipalities have been able to widen
their boundaries, capture suburban growth and prosper. Likewise, the
region defies its Sunbelt reputation because it boasts a job-rich core, brims
with young people and has grown relatively compactly.
At the same time, fast growth has left some negative imprints on the
urban form and the social landscape.
• Serious environmental, open space and air quality problems have
resulted from the region’s fast growth.
• The sharpening segregation of many of the region’s poor and
minority residents in the region’s heart isolates those populations,
keeps families with resources out and can drive business develop-
ment to the fringe.
• Many residents are dissatisfied and discontent with the growth
situation in metropolitan Phoenix.
Each of these impacts unfortunately confirms an aspect of the conventional
wisdom. Popular criticism of Sunbelt growth consistently dwells on its envi-
ronmental costs. Diagnoses of traditional regions’ ills dwell on the social
divides that can accompany urban development patterns. And both analyses
warn of the social and quality of life anxieties provoked by imbalanced growth.
In this respect, cause for concern runs through the story of metropolitan
Phoenix’ growth. According to the data, the region may not hold any special
immunity from the traffic congestion, environmental endangerment and
social inequity that now plague traditional cities like Washington, D.C. as
well as Sunbelt regions like Atlanta.
The potential for complications challenges metropolitan Phoenix to
think carefully as it considers, as this study will next, why it has grown the
way it has, and how it might respond to the dynamics now unfolding.
Summing Up the Trends
Learning from Atlanta
The rise of metropolitan Atlanta, a region not unlike metropolitan Phoenix, is a cautionary tale. Atlanta resembles metropolitan Phoenix in that it cameof age almost entirely during the postwar auto age with its shift of population toward low-density suburbs. The Atlanta region also stands out as a Sunbeltsuccess, having added 650,000 people and 350,000 jobs since 1990. With its strong cluster of Fortune 500 and high-tech corporate headquarters, Atlanta’sabove average per capita income presages growing regional affluence in the future. Less desirable, through, is the accumulation of negative impacts that has come with Atlanta’s development. Some 30 years of unabated freeway building and inner-city school decline have led to vast, unbalanced andlow-density growth and major problems.
Atlanta began the construction of its more than 360 miles of highways in 1946. Since 1970, this aggressive infrastructure campaign has attracted newbusinesses to a major transportation hub, but it has also enabled residential and commercial development to advance farther and farther from the citycenter. At the same time, the concentration of low-income African-American residents and failing schools in the city of Atlanta and its inner southernsuburbs has exacerbated the decentralization of the region and sharpened its divides. Seventy percent of metropolitan Atlanta’s massive population growthsince 1990 has occurred north of the region’s core in far-flung, majority-white suburbs. Almost three-fourths of the region’s job growth has occurred inthe northern part of the region. And low-income minority residents remain trapped in a segregated, job-thin core far from the job-rich northern suburbs.
These imbalances have caused serious traffic, environmental and social distress. The average per capita driving distance in Atlanta is now the highest ofany city at nearly 35 miles a day. The average driver spent 68 hours in traffic delays in 1997. Congestion cost the region more than $2 billion a yearin delays and extra fuel costs. Air pollution has become so serious that the region was at one time denied federal transportation funding, and morethan 200,000 acres of trees are endangered. Finally, a serious “spatial divide” in Atlanta, combined with the region’s neglect of mass transit, keepsmany African-American workers isolated from the region’s greatest concentrations of jobs and affluence.
Atlanta’s experience, then, can serve as a warning for metropolitan Phoenix.
Source: Morrison Institute for Public Policy, data from Moving Beyond Sprawl: The Challenge for Metropolitan Atlanta. The Brookings Institution Center on Urban and Metropolitan Policy, 1999.
29MORRISON INSTITUTE FOR PUBLIC POLICY
What’s Behind the Trends
Metropolitan Phoenix is where it is today – with its good and bad points – because of its specialattributes, national factors, and local choices. Patterns common to most post-war metropolitanareas, including auto dependence and the rise of the suburbs, have made a difference here as
they have everywhere. But because the Phoenix region is so new (having
developed largely since 1970), it may have been affected by these patterns
more than other places. The following sections discuss some of the reasons
why metropolitan Phoenix is the way it is.
Timing and National Trends
COMING OF AGE IN THE AUTO ERANothing is more important to metropolitan Phoenix’ growth than the fact
that it has taken place mostly in the automobile era. As late as 1940, this
region was a modest provincial hub with 120,000 residents. The transfor-
mation to an urban region of almost 3 million took place almost entirely
after World War II when cars meant freedom and new work and lifestyle
choices. Metropolitan Phoenix expanded as an assemblage of dispersed
suburbs because of its time and place.
THE ADVENT OF AIR CONDITIONINGWillis Carrier, the inventor of air conditioning, helped set the stage for
metropolitan Phoenix’ rapid growth. In 1957, the Federal Housing
Administration agreed to accept central air conditioning as part of its
mortgages. The conquest of the desert’s summer heat made metropolitan
Phoenix an attractive Sunbelt destination and gave housing and business a
green light to expand as never before.
Local Circumstances
TOPOGRAPHY AND CLIMATEPhoenix’ striking setting and pleasant climate have attracted new residents
and businesses, and helped determine its form. The region’s mountains and
flood plains have fostered the spread of development and shaped it some-
what. The Salt River Valley offers few natural barriers to outward growth.
Large rugged mountains just beyond the northern fringe offer some limits
to the region’s future growth, though few such obstacles exist in the south
and west. Phoenix’ mild winters and low humidity have made the region a
leading western destination for lifestyle seekers and retirees.
THE REAL ESTATE CRASHThe real estate crash of the late 1980s and the national recession about the
same time also influenced Phoenix’ current form. The “bust” just over a
decade ago slowed decentralization and encouraged several years of more
cautious in-fill development at a time of phenomenal population growth.
Not surprisingly, metropolitan Phoenix’ growth industry was affected
significantly by the tight financial markets created by the virtual collapse of
savings and loan institutions by 1990. Banks in Arizona lost more money in
the first half of 1989 than those in any other state.
As a result, development moderated in the early 1990s. Home construc-
tion slowed. Where development occurred, developers took fewer risks in
site selection and turned their attention inward. The average distance from
downtown Phoenix of new home construction barely increased from 16.4
miles in 1990 to 16.5 miles in 1993. Only after the local and national
economies rebounded did attention refocus on outer areas. Today, the
frontier lies more than 20 miles away from downtown Phoenix, but the 1989
crash may still be affecting fringe expansion. Lenders, according to John
Ogden, CEO of Phoenix-based SunCor Development Company, keep a far
tighter hold on development financing now than during the 1980s.
GOVERNMENT LAND OWNERSHIPA vast amount of public land in the Phoenix region is another important
local characteristic. Together the federal and state governments and three
Indian reservations control a quarter of all land in the MAG planning area,
and about two-thirds of the entire county. Public lands have so far played a
modest role in determining how the region grew, but their importance will
grow in the future as the urbanized area abuts them.
Development patterns have already been shaped to the east and south
by the Salt River Pima-Maricopa Indian Community, the Fort McDowell
Indian Community and the Gila River Indian Community. Federal holdings
and the Indian reservations form a de facto growth boundary for parts of
metropolitan Phoenix (see Map 18). A more variable factor is the 275 square
miles owned by the state of Arizona in the regional planning area and
mandated by the state constitution to be managed to generate the maximum
financial benefit for Arizona’s schools.
Polic ies and EffectsSpecific state and local policy choices have influenced how and how fast the
region has developed in the last 30 years. What follows, then, examines the
state and local policy decisions – wise and otherwise – that have determined
the way the region has changed, and begins to suggest areas for future
decision making.
30 HITS AND MISSES: Fast Growth in Metropol i tan Phoenix
Water, Land and Transportation Choices
TREND: State policy choices on water, state lands and transportation in the 1980s facilitated fast growth, but also presented some limits.
SECURING WATEREarly, bold federal and state efforts made watera facilitator of regional growth. Without a reliable water supply, Phoenix would never havedeveloped into a large metropolitan region. Inthe early years of the 20th century, Phoenix-areagovernment and business leaders persuaded thefederal government to construct massive damsand water delivery systems. Among these projectswere the Salt River Project (SRP). Since 1986, theCentral Arizona Project (CAP), a 365-mile longsystem of aqueducts, tunnels, pumping plantsand pipelines, has provided water to Phoenix.Through the SRP and CAP, metropolitan Phoenixcan access as much as 1.7 million acre feet peryear of surface water. By some estimates, this isenough water to support a population at leastdouble the region’s current number.
The Groundwater Management Act (GMA)of 1980 further supported expansion by supplementing dam- and canal-building withconservation. Brokered by then-governor BruceBabbitt, the act was named by the FordFoundation as one of the nation’s ten most inno-vative programs in state and local government in1986. With the act, the state of Arizona movedaggressively to administer its substantial, butfinite, water supplies and control groundwaterpumping. Specifically, the GMA limits ground-water pumping in the Phoenix region and, until1998, required developers to verify that projectshad a 100-year water supply that would not fur-ther deplete the aquifer. These requirementsresponded to several negative environmentalimpacts of metropolitan Phoenix’ expansion(such as land subsidence due to groundwaterpumping) as they rationalized more growth byimposing a semblance of order on the waterscene. The indiscriminate proliferation of newhomes was replaced by a managed process inwhich subdivisions were forced to refrain fromunrestrained groundwater use and usually had toconnect to existing water infrastructure.
The GMA likely has limited the region’s
spread somewhat. New development can proceed
more easily in cities like Tempe, Phoenix or
Scottsdale, which have access to CAP water.
Conversely, the GMA presents hurdles to devel-
opment in areas such as Cave Creek or Carefree
that are more distant from CAP and lack sufficient
groundwater supplies. In these communities, the
cost of building infrastructure to deliver CAP
water appears to discourage rapid construction.
In the western part of the region, community
leaders have enough water but are struggling with
the cost of a treatment plant.
Other shaping impacts of the water law
could be broader. The need to connect to
centralized water supplies discourages “wildcat”
building, and fewer urban dwellers in Phoenix
use wells and septic systems than in most other
metropolitan areas. Also, the need to use existing
water and sewer infrastructure provides developers
and local governments with considerable incentive
to use land efficiently. This situation likely has
contributed to the region’s relatively compact form.
Whether the current water regime does any
more to shape the metropolitan area remains a
subject of debate. The GMA does not prohibit
“leapfrog” development. It only makes developers
financially responsible for securing long-term
water supplies. The Del Webb Corporation,
accordingly, has managed to proceed with its
planned community of Anthem, miles beyond the
existing northern urban fringe, by purchasing
water from tribal interests. Many developments
approved since the GMA have fulfilled their
obligations by joining a regional “groundwater
replenishment district,” securing groundwater
rights and paying what amounts to a mitigation
fee, even if replenishable water supplies are
unavailable nearby. Still, metropolitan Phoenix’
water regime appears to favor more compact
development.
HOLDING ONTO LANDThe restrained pace of the state of Arizona’ssales of its school trust land has also fosteredcompactness, at least thus far. The state consti-tution requires that the trust lands, part of the 11million acres Arizona gained at statehood fromthe federal government, be managed to maximizetheir benefit to the state’s schools. This requirementhas always raised the possibility of these lands’sale or lease to developers. However, analysis ofState Land Department records suggests thatsuch transactions have had only a minor influenceon the region’s physical form. Many states sold offtheir trust lands for short-term gain decades ago.By contrast, Arizona retains more than 90 percentof its original grant, including the vast majorityof the acres it controls near the Phoenix urban-ized area. Relatively few parcels have been sold todevelopers; a fact that owes largely to decadesduring which the Land Department focused ongenerating revenue primarily from livestock grazing and mineral fees in rural areas.
The Urban Land Management Act of 1981also has limited sales of state trust land fordevelopment. Another accomplishment of theBabbitt years, this law anticipated the approachof the urban edge to state lands and sought tosupervise the state’s participation in the realestate business. The act gave the State LandDepartment new authority to plan, zone andmerchandise lands within or near the metropo-lis’ urban areas. It directed the Land Departmentto encourage “appropriate” development and“in-fill,” and to discourage “urban sprawl” and“leapfrog” building. To date, the State LandDepartment has sold off just 7,446 acres of landnear all of the state’s cities.13 The net effect is thatthe state now retains a reservoir of more than200,000 acres of vacant land around metropoli-tan Phoenix, much of it just to the north of thecurrent urban fringe. This legacy offers theregion an important resource for open spacepreservation or other growth management projects (see Map 17).

31MORRISON INSTITUTE FOR PUBLIC POLICY
Map 17: State Trust Land
Gila RiverIndian Community
LitchfieldPark
ApacheJunction
FountainHills
ParadiseValley
Peoria
Phoenix
Guadalupe
Mesa
Chandler
Gilbert
Queen Creek
Glendale
Surprise
Goodyear
Avondale
El Mirage
Youngtown
Scottsdale
Tempe
Carefree
Tolleson
Cave Creek
Tonto
National
Forest
MA
RIC
OP
A C
OU
NT
Y
Buckeye
Interstate Hwys
Proposed Hwys
State Hwys
US Hwys
State Trust Land
Incorporated Areas
0 5 10 Miles
0 10 Kilometers
Map prepared byArizona State University
IT Research Support Lab - GIS Services
Data Sources: Maricopa County Dept ofTransportation; Arizona Land ResourceInformation System.
Map AreaMaricopa County,Arizona
Salt RiverIndian Community
For
t M
cDow
ell
Ind i
an C
omm
uni t
y
303
101
85
10
60
101
17
51
202
101
10
60
87
202
17
PIN
AL
CO
UN
TY
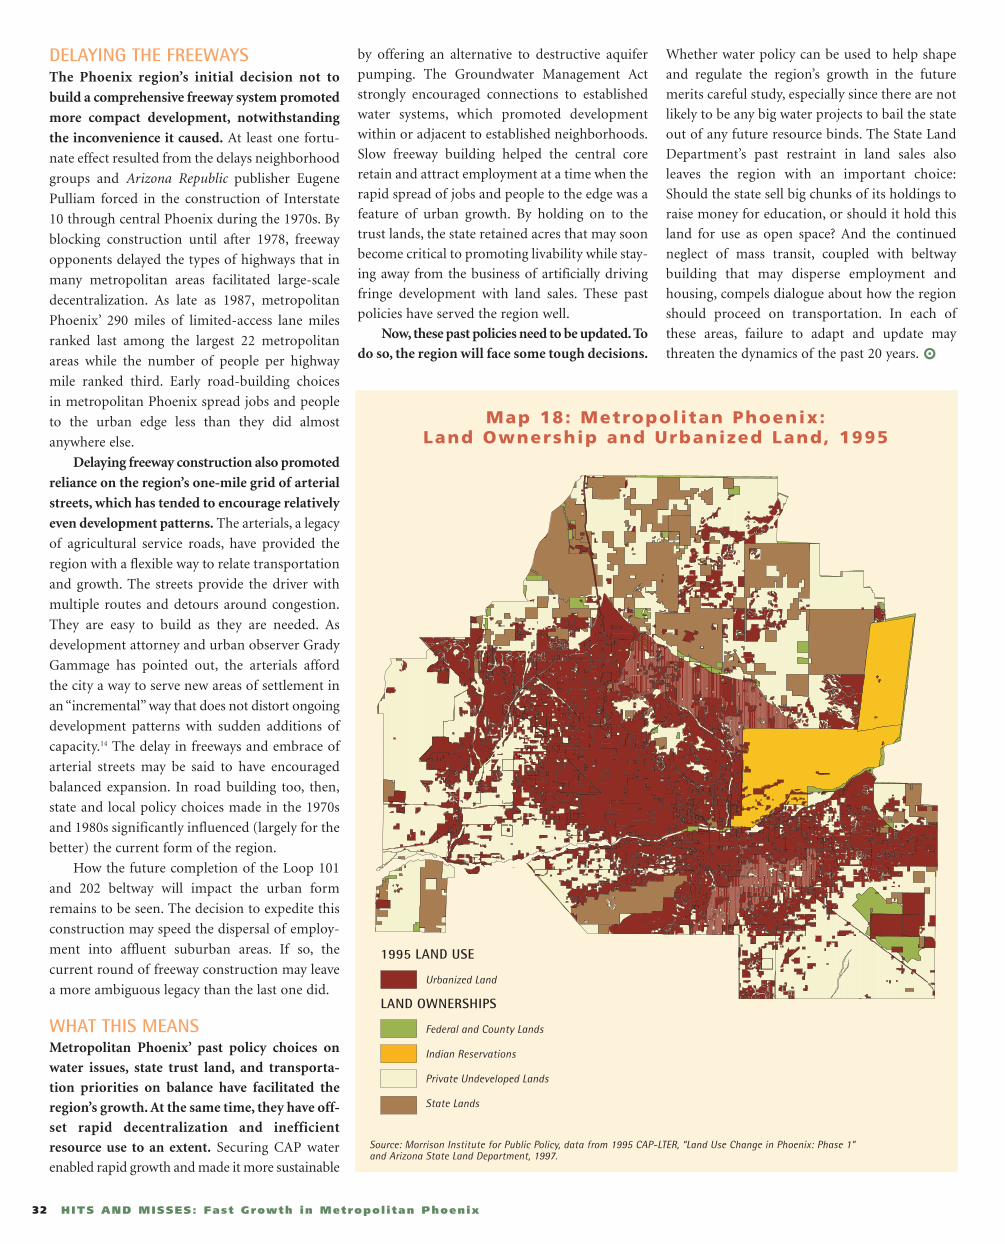
32 HITS AND MISSES: Fast Growth in Metropol i tan Phoenix
DELAYING THE FREEWAYS The Phoenix region’s initial decision not to
build a comprehensive freeway system promoted
more compact development, notwithstanding
the inconvenience it caused. At least one fortu-
nate effect resulted from the delays neighborhood
groups and Arizona Republic publisher Eugene
Pulliam forced in the construction of Interstate
10 through central Phoenix during the 1970s. By
blocking construction until after 1978, freeway
opponents delayed the types of highways that in
many metropolitan areas facilitated large-scale
decentralization. As late as 1987, metropolitan
Phoenix’ 290 miles of limited-access lane miles
ranked last among the largest 22 metropolitan
areas while the number of people per highway
mile ranked third. Early road-building choices
in metropolitan Phoenix spread jobs and people
to the urban edge less than they did almost
anywhere else.
Delaying freeway construction also promoted
reliance on the region’s one-mile grid of arterial
streets, which has tended to encourage relatively
even development patterns. The arterials, a legacy
of agricultural service roads, have provided the
region with a flexible way to relate transportation
and growth. The streets provide the driver with
multiple routes and detours around congestion.
They are easy to build as they are needed. As
development attorney and urban observer Grady
Gammage has pointed out, the arterials afford
the city a way to serve new areas of settlement in
an “incremental” way that does not distort ongoing
development patterns with sudden additions of
capacity.14 The delay in freeways and embrace of
arterial streets may be said to have encouraged
balanced expansion. In road building too, then,
state and local policy choices made in the 1970s
and 1980s significantly influenced (largely for the
better) the current form of the region.
How the future completion of the Loop 101
and 202 beltway will impact the urban form
remains to be seen. The decision to expedite this
construction may speed the dispersal of employ-
ment into affluent suburban areas. If so, the
current round of freeway construction may leave
a more ambiguous legacy than the last one did.
WHAT THIS MEANSMetropolitan Phoenix’ past policy choices on
water issues, state trust land, and transporta-
tion priorities on balance have facilitated the
region’s growth. At the same time, they have off-
set rapid decentralization and inefficient
resource use to an extent. Securing CAP water
enabled rapid growth and made it more sustainable
by offering an alternative to destructive aquifer
pumping. The Groundwater Management Act
strongly encouraged connections to established
water systems, which promoted development
within or adjacent to established neighborhoods.
Slow freeway building helped the central core
retain and attract employment at a time when the
rapid spread of jobs and people to the edge was a
feature of urban growth. By holding on to the
trust lands, the state retained acres that may soon
become critical to promoting livability while stay-
ing away from the business of artificially driving
fringe development with land sales. These past
policies have served the region well.
Now, these past policies need to be updated. To
do so, the region will face some tough decisions.
Whether water policy can be used to help shape
and regulate the region’s growth in the future
merits careful study, especially since there are not
likely to be any big water projects to bail the state
out of any future resource binds. The State Land
Department’s past restraint in land sales also
leaves the region with an important choice:
Should the state sell big chunks of its holdings to
raise money for education, or should it hold this
land for use as open space? And the continued
neglect of mass transit, coupled with beltway
building that may disperse employment and
housing, compels dialogue about how the region
should proceed on transportation. In each of
these areas, failure to adapt and update may
threaten the dynamics of the past 20 years.
1995 LAND USE
Urbanized Land
LAND OWNERSHIPS
Federal and County Lands
Indian Reservations
Private Undeveloped Lands
State Lands
Map 18: Metropolitan Phoenix: Land Ownership and Urbanized Land, 1995
Source: Morrison Institute for Public Policy, data from 1995 CAP-LTER, “Land Use Change in Phoenix: Phase 1” and Arizona State Land Department, 1997.

33MORRISON INSTITUTE FOR PUBLIC POLICY
Growth Management Efforts
TREND: Though they are late in coming and uncoordinated, more efforts to managegrowth are underway in the region than is commonly thought.
Local government growth management pro-grams are fairly widespread in the Phoenixregion and more prevalent than conventionalwisdom would predict. Morrison Institute sur-veyed the 25 cities and towns (including ApacheJunction) in the metropolitan area and MaricopaCounty to better understand the nature and levelof local growth management efforts. The countyand 18 municipalities responded. In developingthe questionnaire, the Institute used the LincolnInstitute of Land Policy’s description of a system-atic growth management framework, including:
• Strategies to discourage sprawl and encouragecompact urban development, in-fill andrevitalization of blighted or troubled areas
• Provision of infrastructure (roads,schools, water service, parks) at the timeof development
• Urban design requirements that aim at aesthetically pleasant urban areas, mixeduses and environmentally friendly places
• Policies and programs that protect sensitivelands, rural areas and open spaces
• Policies and programs to assure thataffordable housing is a major componentof new development
• Growth management boundaries
Morrison Institute’s survey revealed surprising
activities in the 19 responding communities (see
Table 10).
• Only one municipality – Litchfield Park –
employs none of the possible tools.
• Fifteen of the 19 jurisdictions utilize impact
fees to help pay for the costs of new growth.
• Fourteen have mandatory downtown urban
design guidelines.
• Twelve cities maintain an adequate public
facilities ordinance.
• Eight provide revenue for open space.
• Seven cities provide direct incentives for
in-fill development.
Taken together, this array of approaches points to
the emergence of a “Phoenix style” of growth
management practiced which focuses on requir-
ing new development to “pay for itself” rather
than on restricting it.
Rules for “adequate public facilities” in 12
cities suggest the relative newness of the present
commitment to growth management. Just four of
11 jurisdictions surveyed in a 1994 study reported
that they had adopted such ordinances.15
Though numerous, the growth management
practices cannot be characterized as universal or
uniform. The Morrison Institute survey shows
that several smaller towns have as many manage-
ment tools in place as the larger cities. For example,
Queen Creek, a small community on the region’s
southeastern edge, employs every strategy used
by Phoenix, Mesa and Scottsdale. Still, smaller
jurisdictions generally have fewer growth man-
agement tools than their larger counterparts.
Contrast Goodyear and Surprise (one and two
tools respectively) with Phoenix and Scottsdale
(six and five tools). In this regard the smaller
jurisdictions often appear to be welcoming
growth without hesitation. Another contrast
appears when east and west cities are compared.
East Valley fringe towns and cities wield more
restrictive growth management tools than their
counterparts in the West Valley. In the east,
Apache Junction, Queen Creek, Mesa and
Chandler indicated on average five management
instruments. To the west, Glendale, Goodyear,
Litchfield Park, Surprise and Peoria have an
average of two tools.
Table 10: Prevalence of Growth Management Tools by CityAdequate Public Downtown Urban Revenue for Limits on
CITY Impact Fees Infill Incentives Facilities Ordinance Design Guidelines Open Space Urban Limit Line* Population GrowthApache Junction Yes Yes No Yes No No NoCarefree No No Yes Yes Yes No NoCave Creek Yes No No Yes No No NoChandler Yes Yes Yes Yes Yes No NoCounty No No No No Yes No NoFountain Hills No No No Yes No No NoGilbert Yes No Yes Yes No No NoGlendale Yes Yes Yes Yes No Yes NoGoodyear Yes No Yes No No No NoLitchfield Park No No No No No No NoMesa Yes No Yes Yes Yes Yes NoPeoria Yes No Yes Yes No No NoPhoenix Yes Yes Yes Yes Yes Yes NoQueen Creek Yes Yes Yes Yes Yes Yes NoScottsdale Yes No Yes Yes Yes Yes NoSurprise Yes No No No No No NoTempe Yes Yes Yes Yes No No NoTolleson Yes Yes Yes Yes Yes No NoYoungtown Yes No No No No No NoNo. Employing (out of 19) 15 7 12 14 8 5 0Percentage 79% 37% 63% 74% 42% 26% 0%
* Examples of “urban limit lines” are urban service area boundaries (lines beyond which public services will not be extended) and greenbelts of dedicated open space around cities designed to limit growth there.Source: Morrison Institute for Public Policy Growth Management Survey, 2000.
34 HITS AND MISSES: Fast Growth in Metropol i tan Phoenix
PAYING FOR GROWTHImpact fees constitute the region’s leading
growth management response. The Morrison
Institute survey shows 15 of the region’s juris-
dictions have established impact fees to recoup
the costs of infrastructure and public amenities.
Cities vary widely in their use of the fees, as
Figure 11 and Tables 11 illustrate. Most often the
assessments are used to fund water and sewer
service. Still, little uniformity characterizes their
use. Chandler, Glendale and Peoria charge
developers for such projects as parks, police
and road construction. Mesa assesses builders of
single-family homes $159 per home for cultural
programs, and Apache Junction charges $1,368
per home to support its schools (though the fee
is facing a legal challenge).
The amount charged by the region’s towns
varies widely. The fees charged ranged from
$1,800 per single-family house in Tempe to
$13,000 in parts of Peoria. Also, the Institute
survey reveals a staged array of impact fees
within the region that clearly responds to
regional growth patterns.
Peoria and Phoenix (the Ahwatukee area)
clearly outpace the other jurisdictions in total
impact fees assessed. However, the breakdown
between the amounts charged by categories for
these two cities varies. Peoria charges most of its
fees for two categories – roads/transportation
and water systems. Phoenix’ Ahwatukee impact
fees break out more subtly, and one of the larger
categories is parks. Glendale and Scottsdale sit on
a second level of sorts but well above the others.
Mesa and Tempe charge the lowest amounts
(Carefree does not charge impact fees). Tempe
only assesses fees in two areas, water and sewers
(similar to but much lower than Scottsdale).
The cities and towns were asked to estimate
the percentage of public facilities costs covered by
fees. More specifically, they picked ranges of costs
for streets, traffic lights, sewers, water, parks,
public safety and libraries covered by fees.
Respondents replied that impact fees typically
balance the majority of costs.
Impact fees often are higher at the fringe
and much less in the core of cities. This is both a
way to pay for new growth and a de facto in-fill
strategy because it is less expensive in such a scenario
to develop a subdivision in a vacant area that
already has sewer and water. Cities using varying
impact fees include Peoria, Phoenix, Scottsdale
and Surprise. Table 11 illustrates how some cities
charge different impact fees for different loca-
tions within their boundary. In addition to these
differences, there are areas of some cities (e.g.
Phoenix) where no impact fees are charged at all.
The region’s diverse impact fees turn out to
constitute a surprisingly well-ordered system.
Though levied independently by an increasing
number of the region’s cities, the fees together
make up a tiered regime that generally exacts
more from fringe-area developers than central-
area ones.Whether this array of fees really promotes
regional compactness, however, remainsunclear. Recent research concluded that metro-politan areas that rely on impact fees rather thantax revenue to finance new public infrastructureare more likely to develop in a compact manner.16
However, the Morrison Institute analysis did notdetect a clear trend in this regard. Suffice it to saythat the uncoordinated assessment of impact feesin metropolitan Phoenix – largely out of fiscal self-interest – raises the possibility of an orderlydiscouragement of extreme sprawl.
KEEPING THE CENTER VITALEfforts to revitalize central areas and promotein-fill represent another noteworthy growthmanagement response in metropolitan Phoenix.Seven of the 19 responding jurisdictions have specific in-fill programs. Peoria, Phoenix, Scottsdaleand Surprise zone their impact fees to constitute ade facto in-fill program by charging more at theirurban fringe than at their cores. And several of theregion’s cities are also now following Phoenix’ andTempe’s efforts over the last decade to boost theirdowntowns (see Table 10).
The cities of Phoenix and Tempe mountedearly, sustained and ambitious campaigns toenhance their downtowns. City of Phoenixreports show that the city took its first majorsteps toward downtown redevelopment in 1971.Since the 1980s, almost $2 billion of public andprivate funds have been invested in downtownprojects such as a new city hall, Arizona ScienceCenter, America West Arena and Bank One
A Tale of Two Cores
The full list of reasons for metropolitan Phoenix’ relatively strong center can be debated. But akey factor remains the extraordinary lengths to which Phoenix and Tempe have gone to avoidthe hollowing out and disinvestment many other cities face.
Phoenix began boosting its center in the 1970s. In the 1980s, Mayor Terry Goddard refocusedthe city’s work on the core, declaring in his 1986 “State of the City and Budget” message that“the downtown is going up.” Plans, to be supported with over $300 million in public funds, weredrawn up for a third hotel, a sports complex, a new city hall and a science museum. In 1988,Goddard and the City Council initiated a special excise tax earmarked for downtown facilities,and steered a large percentage of a bond election toward central-city cultural projects.Eventually, America West Arena resulted, along with major new office and retail constructionspurred by city tax incentives. By the late 1990s the Arizona Science Center, Bank One Ballpark,the Arizona Center retail project and other facilities had given Phoenix a lively downtown oriented toward sports, entertainment and government.
The result is that downtown Phoenix, with the densest concentration of employment in theregion, has become a more interesting, connected place. Approximately 9 million people attendevents downtown each year. A half-dozen housing projects may double downtown’s populationfrom 6,000 to 12,000 within a few years. And a 1998 survey found that half of metropolitanPhoenix’ residents had dined downtown in the previous 12 months, compared with only 31 percent in 1997 and 23 percent in 1994.
Another strong effort has played out successfully in Tempe. Land-locked Tempe could have lostground to newer suburbs. But like Phoenix, Tempe turned to downtown revitalization as a wayto remain prosperous.
In the 1980s, the city began rejuvenating its downtown area adjacent to Arizona StateUniversity. Over time this campaign has fostered an increasingly dense concentration of restau-rants, condominiums, retail, entertainment and high-tech business activity. In addition, the cityhas created a town lake in the dry Salt River bed and turned it into a regional recreationalamenity and local economic magnet. The result of Tempe’s efforts has been the creation ofanother strong urban center in metropolitan Phoenix, one that offers a “pedestrian-dominated”environment and an appealing location for recreation and business activity. More recently, thecity is focusing on becoming a “Technology Oasis” by building the downtown area into a hublargely for software and other cutting-edge industrial clusters.

35MORRISON INSTITUTE FOR PUBLIC POLICY
Figure 11: Cit ies with High Population Growth Have Moderate Impact Fees
Table 11: Single-Family Impact Fees by City and Category*
Area C: Approx. Zone A: Area A: Deer Valley Rd Area F: Ahwatukee Old/Central Southern- Outside
Facility Southern Area** to Jomax Road Far Northwest Estrella Foothills North Gateway Area South Zone North Zone most Tip Zone A
Roads 362 4,052 4,052 1,972 2,912 3,871 0 0 0 0 0
Sewer 1094 1,612 2,320 1,769 2,161 2,425 0 1,916 2,236 764 2,449
Water System 3,152 3,152 3,152 930 1,112 3,364 0 1,770 1,770 1,871 3,344
Water Resource 0 473 473 0 0 0 0 824 824 914 1,056
Parks 1,506 1,506 1,506 1,133 2,550 1,999 0 590 590 0 0
Cultural 0 0 0 0 0 0 0 604 604 0 0
Public Safety 350 350 350 105 315 170 0 445 445 0 0
Libraries 281 281 281 187 359 263 0 162 162 0 0
Schools 0 0 0 0 0 0 0 0 0 0 0
General Gov. 546 546 546 0 0 0 0 354 354 0 0
Public Works 0 0 0 0 0 0 0 524 524 0 0
Other+ 608 608 608 608 365 314 0 0 0 0 0
TOTAL 7,899 12,580 13,288 6,704 9,774 12,406 0 7,189 7,509 3,549 6,849
Apache Fountain LitchfieldFacility Junction Carefree Cave Creek Chandler Hills Gilbert Glendale Goodyear Park Mesa Queen Creek Tempe Tolleson Youngtown
Roads 270 0 250 1,455 0 86 542 148 0 0 0 0 644 0
Sewer 0 0 1,635 1,091 0 2,314 2,003 1,134 0 920 2,679 930 2,938 0
Water System 0 0 0 1,312 0 1,111 1,367 1,200 0 901 0 875 3,052 0
Water Resource 0 0 0 373 0 235 0 1,755 0 0 0 0 0 0
Parks 366 0 300 174 0 705 1,094 0 0 559 3,229 0 0 100
Cultural 0 0 0 0 0 0 0 57 0 159 0 0 0 0
Public Safety 118 0 0 309 0 174 600 334 0 212 185 0 634 142
Libraries 199 0 0 52 0 0 452 0 0 322 616 0 0 50
Schools 1,368 0 0 0 0 0 0 0 0 0 0 0 0 0
General Gov. 53 0 760 231 0 178 660 118 0 0 600 0 161 100
Public Works 0 0 0 0 0 0 0 150 0 0 0 0 201 0
Other+ 0 0 0 197 0 0 264 0 0 0 0 0 00
TOTAL 2,374 0 2,945 5,194 0 0 7,309 4,896 0 3,073 7,309 1,805 7,630 392
* Total dollar amount per single-family dwelling unit. ** Area A of Peoria extends from Northern Avenue to Bell Road. *** Assumed Density of 2-4 dwelling units per acre for Scottsdale.+ Reclaimed water fee for Chandler; sanitation fee for Glendale; meter price and solid waste container costs for Peoria; equipment repair facilities and solid waste container for Phoenix.Source: Morrison Institute for Public Policy Growth Management Survey, 2000.
0% 50% 100% 150% 200% 250%HIGH POPULATION
GROWTH
0
3,000
6,000
9,000
12,000
HIGH IMPACT FEES
15,000
IMPA
CT F
EES
(IN
DO
LLA
RS, F
OR
SIN
GLE
FA
MIL
Y H
OM
ES)
* Rate from 1990 to 1998.Source: Morrison Institute for Public Policy Gowth Management Survey, 2000.
POPULATION GROWTH*
Peoria (Area F)
Phoenix (North Gateway)
Scottsdale (Outside Zone A)Queen Creek
Glendale
Tolleson
Chandler
Cave CreekMesa
Apache JunctionTempe
YoungtownLitchfield Park Carefree Fountain Hills
Surprise (North Zone)
Goodyear Gilbert
P E O R I A P H O E N I X S U R P R I S E S C O T T S D A L E * * *

36 HITS AND MISSES: Fast Growth in Metropol i tan Phoenix
Ballpark. A structured impact fee system places aheavier burden on development in fringe areas soas to free up funds to support downtown andexisting neighborhoods. Fee waivers of up to$2,200 are designed to encourage in-fill. Tempehas focused on creating a diverse, mixed-use“vital center” of the sort valued by the people-centered companies of the new economy. Bothcities are now devoting sales tax revenues to alight rail system to connect the Chris Town area,downtown Phoenix, and Sky Harbor Inter-national Airport to Tempe and Mesa.
Though it is hard to quantify, it stands toreason that efforts to boost downtown Phoenixand Tempe have helped the region retain astrong center and minimized decentralization.Such investments have clearly fostered the con-tinued concentration of business activity withinthe region’s center. In doing so, they have helpedprevent the central-area disinvestment that has“hollowed out” other cities. Beyond that, thesecities’ significant efforts to provide amenitieswithin their cores have likely offset some of theconditions pushing middle-class families awayfrom region’s center. Downtown revitalizationcontinues to be an important strategy for growthmanagement in metropolitan Phoenix.
PROTECTING OPEN SPACE Open space protection is a strategy of increasingimportance in the region. This growth responsegoes back a long way. In addition to the 16,500-acre purchase that became South Mountain Parkin 1924, the city of Phoenix has made major landacquisitions in every decade since the 1950s. Inkeeping with that, city of Phoenix voters in 1973,1979, 1984 and 1988 approved bond issues to purchase 9,700 acres to establish the PhoenixMountains Preserve. Altogether, the city ofPhoenix has doubled the size of its parks systemsince 1964 through the addition of 17,000 acres,more than any other city except San Diego.
Over the same time frame, virtually all of the region’s jurisdictions have set aside considerable amounts of open space. Dedicatedopen space owned by the six largest municipalities
doubled from 23 square miles in 1975 to 47square miles in 1995. Mesa, Fountain Hills andGlendale approved major park bond issues, whileChandler and Peoria used impact fee revenue toexpand their park systems. In addition, QueenCreek implemented a development impact feethat mandates at least 20 acres of parkland oropen space per 1,000 residents. These efforts havekept vacant or parkland in key areas within theurban form of metropolitan Phoenix.
Scottsdale and Phoenix have been movingbeyond preserving “breathing spaces” withinthe urbanized area toward the creation of majorgreenbelts. For its McDowell Sonoran Preserve,for example, Scottsdale plans to acquire approxi-mately 57 square miles in the McDowellMountains. This will ultimately create a preservesignificantly larger than Boulder, Colorado’sfamous “ring of mountains” system. Phoenixplans to purchase about 21,500 acres, or 33square miles, of natural desert north of the CAPcanal. These efforts are funded by municipal salestaxes, and both are designed to offset fast growthtoward the urban fringe. Together, the programsaim to create a regionally significant open spacebelt that will limit the region’s outward expansionalong its north edge.
For all this activity, though, open spaceacquisition does not appear to be keeping pacewith population growth. The amount of dedi-cated open space available on a per capita basiscounty wide declined between 1990 and 1995.Also, much of the new open space acquisitionappears to be piecemeal. This spottiness resultspartly from the differing political orientationsand financial conditions of the region’s cities. Butit also owes something to Phoenix’ typographywhich naturally determines where the region’smountain parks will be. The resulting irregulardistribution of parklands means that cities farfrom the area’s mountain preserves (such asGlendale and Chandler) may be significantlyunder served with open space compared to thosecontaining mountains.
Protecting open space and desert land is aconcern among local residents. Two-thirds of
the respondents to Morrison Institute’s 1999quality-of-life survey said that the region is doinga “poor” or “fair” job of preserving the desert.And when the Institute asked more broadly aboutthe region’s growth, those surveyed expresseddeep anxiety about the changes taking placearound them. Most dramatically, 80 percent ofmetropolitan Phoenix residents said they were“concerned” or “very concerned” about theregion’s growth. These figures were in line withthe nearly 75 percent who have said in each ofthe past three years’ surveys that the region’s population is growing “too fast.” In 1999, nearlyhalf of the respondents indicated they wouldleave the region tomorrow if they could becauseof “too many people.”17
WHAT THIS MEANSContrary to conventional wisdom, the Phoenixmetropolitan area does practice growth man-agement. A regional or state-level regime does notexert strong management across the urban area,but many local governments employ an array ofgrowth management approaches. Significanttracts of desert are being protected as open spacewithin and near the built-up area. Urban cores areundergoing revitalization. And financial assess-ments are recouping sizable portions of the coststo cities of new development.
But, questions persist about the effectivenessof this local, largely uncoordinated response tothe regionwide challenges of fast growth. Thespontaneous rise of a robust, tiered array ofimpact fees suggests that important policies canbe implemented without the establishment of aformal institutional framework. Yet the rate atwhich residential development is moving outward raises concerns about the adequacy of metropolitan Phoenix’ current city-basedapproach. Likewise, the spottiness of the cities’open space initiatives suggests the need for coop-erative planning on this and other issues. Forexample, the lack of a central authority to planopen space acquisitions in the metropolitan areamakes the creation of a comprehensive, widelyaccessible and equitable system of desert pre-serves unlikely.
Conundrum: Metropolitan Phoenix Residents Do Not Connect Density with “Smart Growth”
When asked: “Is this idea ‘smart growth’ or not?”, residents said: YES NO DON’T KNOW
Provide things like roads, schools and parks at the time of development 91% 6% 3%Work on revitalizing older communities 88% 8% 4%Protect rural areas, sensitive lands, and open spaces 88% 8% 4%Build communities with a mix of housing, shopping, and schools in close proximity 87% 10% 4%Focus new growth in areas that already have some development 78% 15% 7%Create urban growth boundaries 73% 17% 10%Widen roads and freeways 79% 16% 5%Provide more public transportation 86% 9% 5%Build communities that are taller and more dense instead of wider and more spread-out 38% 53% 9%Protect private property rights 84% 9% 7%
1999 survey, n=1,020. Totals may not add up to 100% due to rounding; Responses were weighted to correct for a sampling bias.Source: Morrison Institute for Public Policy, data from Quality of Life Survey, Morrison Institute for Public Policy and The Arizona Republic, 1999.
37MORRISON INSTITUTE FOR PUBLIC POLICY
WESTERN VALUESA “frontier spirit” continues to shape the region.
Political scientist David Berman points out that
metropolitan Phoenix’ prevailing political culture
has for decades revolved around three “frontier”
watchwords – individual rights, a pro-growth
view of economic development and a focus on
local power and control.18 These “western” values
have clearly played out in every aspect of the
region’s growth story.
A pervasive mistrust of big government has
resisted limitations on personal autonomy,
particularly with regard to private property
rights. Likewise, a presumption that the area’s
prosperity depends on development dictates an
ethos of constant growth promotion that has
frequently discounted residents’ and others’
concerns about the pace of expansion. Thus, while
the region boasts a successful public-private eco-
nomic development organization – the Greater
Phoenix Economic Council – it lacks an equivalent
organization to address environmental concerns,
land-use patterns and transportation issues.
Finally, the intense localism of the area’s political
culture has helped to make citizens and leaders
mistrustful of major regional initiatives. Two
cases in point are the public’s resistance to free-
way expansions in the 1970s, and the region’s lack
of action on MAG’s “Desert Spaces” proposal.
STRONG CITIESCities and city-based localism predominate.
Cities bulk large in the governance of metropolitan
Phoenix. Phoenix, Mesa, Scottsdale, Glendale,
Tempe and Chandler are sizable cities with signif-
icant fiscal and managerial capacity. Moreover,
metropolitan Phoenix cities possess “home rule
charters” that guarantee them unusually robust
powers. This state of affairs has seen individual
cities achieve much in terms of planning, tax-
collection and downtown development. But it has
also made it difficult for localities to align their
agendas to solve problems affecting the whole
region. Differing political orientations and finan-
cial conditions, for instance, have clearly delayed
the now-nascent framing of a light rail system.
And open space acquisition has been fragmented.
At the same time, though, the relatively
small number of cities in the region and the
sheer size of the city of Phoenix have helped to
reduce the fragmentation that can lead to gross
land-use mismanagement. Thanks to the
region’s history of annexation, the political map
has not seen myriad small suburbs incorporating
into separate cities, as has occurred in California,
Chicago, St. Louis and elsewhere. Rather, a small
number of local governments have aggressively
used annexation to increase their population and
their land area. As a result, one of the largest
metropolitan areas in the United States remains a
collection of one county and only 24 relatively
large cities and towns (see Map 19). Moreover, 82
percent of the region’s population (approximate-
ly 2.3 million people) lives in the six largest
municipalities. This stands in sharp contrast to
metropolitan Chicago’s 265 municipalities or Los
Angeles’ approximately 180 entities. It gives met-
ropolitan Phoenix a potential advantage in its
problem solving in the future.
Equally helpful is the city of Phoenix’ size.
With 470 square miles in the city of Phoenix, much
of the region “lives by the same rules.” Even better,
those rules appear to be good ones. Phoenix
consistently wins high marks for its management
skills, innovations and problem solving. Over the
years, the city has received a number of presti-
gious awards, including the Bertelsmann world
prize for city management and Governing
Magazine’s top grade for urban management.
WEAK REGIONAL ENTITIESMaricopa County and the Maricopa Association
of Governments (MAG) lack strong authority.
Only this year did the Growing Smarter Plus
legislative package give counties the same power
as cities to impose impact fees, and provide
restrictions on further city annexations.
Moreover, voters have consistently rejected
expanding Maricopa County’s powers, most
recently in 1996 when they turned down a pro-
posed “home rule” charter for the county much
like those of major cities in the region.
MAG has helped since the 1970s to promote
uniformity in planning and programming of
various activities, especially as required for various
federal transportation and other programs. Still,
the association lacks the power to enforce deci-
sions. Even MAG’s ability to produce voluntary
approaches to regional problems has been limited.
Recent efforts to craft a vision for the year 2025
have not been successfully incorporated into the
region’s culture or governance.
Another conspicuously weak entity is the
Regional Public Transportation Authority (RPTA).
Fifteen years after its creation the authority
remains hobbled by funding constraints. These
leave RPTA ill-equipped to adequately address the
region’s transportation needs, let alone manage
growth as similar authorities in other cities do.
POLARIZED CIVIC AGENDASThe region’s civic culture also remains frac-
tious. Discord did not end with the bitter fight
against freeways in the 1970s. In recent years, the
lack of a regional consensus on a number of
growth-related issues has generated new polariza-
tion and litigation. Action on air quality issues
in the 1990s, for example, came only under the
pressure of lawsuits brought by the Arizona
Center for Law in the Public Interest.
Dissatisfaction with legislative responses to
growth pressures has resulted in the placement of
a Sierra Club-sponsored initiative requiring cities
to create urban growth boundaries on the
November 2000 state ballot. Meanwhile, a court
challenge embroiled a rival legislative proposition
Governance
TREND: The region’s governance is one of strong cities, weak regional entities, polarized civic agendas and spotty state leadership.

to dedicate a portion of the state’s land near cities
to open space. This measure is strongly opposed
by various environmental groups, including
The Nature Conservancy and Tucson’s Sonoran
Institute. This coalition wants the state to set aside
far more trust land, and it plans to bring its own
citizens’ initiative to the ballot in 2002. In short,
metropolitan Phoenix’ political culture has hardly
been conducive to the broad-based consensus
building likely to drive effective responses to the
regional impacts of rapid growth.
SPOTTY STATE LEADERSHIPThe state of Arizona has provided inconsistent
leadership in the metropolitan area. The
Groundwater Management Act and the Urban
Lands Act of the early 1980s underscore the
potential for creative regional problem solving by
the governor and the Legislature. However for
most of the 1990s, the state was essentially a non-
player on growth issues. Recently, responses have
emerged under the threat of citizens’ action, but
these have been of mixed quality. State require-
ments for cleaner gasoline and Maricopa
County’s vehicle emissions inspection program
have been clear wins for the region. Likewise, the
state moved in 1998 to require comprehensive
land-use and zoning ordinances of local govern-
ments. However, this reform has been compromised
by the lack of a state agency to monitor compliance.
More significant may be the Arizona Preserve
Initiative (API), passed by the Arizona Legislature
in the spring of 1996. API is designed to encourage
the preservation of select parcels of state trust
land in and around urban areas like Phoenix as
open space. Under the original legislation, only
trust land within three miles of municipalities
larger than 10,000 persons could be reclassified
for conservation sales or leases, and no public
funding was available to support the program.
However, amendments were enacted to the API in
1997, 1998 and 1999 that expanded the applicable
area in Maricopa County an additional ten miles
beyond the 1996 boundaries and added land
adjacent to the San Tan Mountains to the eligible
areas. Equally important, Proposition 303, passed
by the voters in November 1998 as part of
Governor Jane Dee Hull’s Growing Smarter pro-
gram, required that $20 million be appropriated
annually for eleven years, beginning July 1, 2000,
primarily for the purchase or lease of state lands
classified for conservation, or for the purchase of
development rights on the land. This money sig-
nificantly forwards the open space cause. It allows
cities, counties and certain nonprofit organizations
like land trusts to apply to Arizona State Parks for
matching grants to acquire or lease trust land.
All these initiatives are important, but they
cannot be said to constitute a strong or compre-
hensive approach to the issues raised by fast
growth across the region. In the state land conser-
vation program, only a small portion of the
region’s sensitive lands are eligible for protection.
Little grant money is available through a compli-
cated process of fees, hearings and studies. It
remains to be seen whether the region’s fringe cities
will comply with statewide planning requirements
and what the state will do if they do not.
WHAT THIS MEANSMetropolitan Phoenix’ decentralized gov-
ernance may not be up to the challenge of
addressing the region’s lengthening list of
growth complications. In particular, the lack of
any robust coordinating authority at the regional
level in metropolitan Phoenix leaves it without
much ability to craft and enact responses to issues
that cut across boundaries, whether it be traffic,
open space or urban form. Little interaction now
occurs between the public and private sectors
on growth issues. The state of Arizona has taken
few steps to promote regional thinking or local
collaboration on agendas such as light rail. And
the continued refusal of voters to entrust either
MAG or Maricopa County with any kind of binding
managerial power, especially, suggests that the
region urgently needs to seek out alternative
mechanisms for achieving collaborative planning
and cooperative action. However, the moment is
far from bleak. Many regions across the U.S. are
now experimenting with new forms of regional
cooperation; these efforts provide plenty of
intriguing ideas for the Phoenix region to consider.
One way or another, though, an individualistic
metropolis needs to find ways to act as a region
on numerous issues facing its cities.
38 HITS AND MISSES: Fast Growth in Metropol i tan Phoenix
LitchfieldPark
Williams AFB(closed)
ApacheJunction
FountainHills
ParadiseValley
Peoria
Phoenix
Guadalupe
Chandler
Queen Creek
Glendale
Surprise
GoodyearBuckeye Avondale
El Mirage
Youngtown
Scottsdale
Tempe
Carefree
Tolleson
Cave Creek
Luke AFB
Gilbert
Mesa
Gila Bend
Wickenburg
Gila RiverIndian Community
Interstate Hwys
Proposed Hwys
State Hwys
US Hwys
0 5 10 Miles
0 5 10 Kilometers
UnincorporatedAreas
Map prepared byArizona State University
IT Research Support Lab - GIS Services
Data Source: 1990 U.S. Census BureauSTF3A.
Map AreaMaricopa County,
Arizona
Salt RiverIndian Community
For
t M
cDow
e ll
Ind
ian
Com
mu
nity
303
85
101
10
60
101
17
202
51
17
60
101
202
87
10
Map 19: Metropolitan Phoenix: Jurisdict ional Boundaries, 1997

39MORRISON INSTITUTE FOR PUBLIC POLICY
Taken together, this report draws a number of conclusions from the multiple
research projects on the Phoenix region.
Part I suggested metropolitan Phoenix’ extraordinary growth is
defying a number of conventional expectations, even as it shows signs of
succumbing to familiar pitfalls. Contrary to expectation, the urban area
is gaining in density and the central city is remaining robust, despite a
proliferation of residential development at the region’s fringe. Also, the
metropolitan area does not yet display the kind of gross imbalance of invest-
ment and fiscal capacity between its core city and its largest suburbs that
plague many urban areas. At the same time, cause for worry centers on the
region’s social and racial divide, and the serious environmental impacts of
converting the desert to subdivisions. These problems are interconnected.
Poor schools and concentrations of low-income and minority residents
in the center of the region tend to push families and businesses out and
drive fringe development. Fringe development makes open space less acces-
sible, leads to long commutes, and worsens air pollution.
This section, in looking behind these trends, identified several factors
of timing, local conditions and regional policy that have conditioned
metropolitan Phoenix’ growth. Timing dictated much about how Phoenix
grew. In a word, the region grew as a horizontal collection of auto-oriented
central city-suburbs because that is how most new American metropolitan
areas developed during the post-World War II suburban era.
Similarly, the region’s setting and climate – its specific circumstances –
attracted and accommodated vast inflows of new residents. Once air
conditioning became widespread, few natural barriers impeded the metropolis’
geometric expansion across the Salt River Valley. Significant state, federal
and tribal land holdings have blocked expansion in just a few places though
these tracts could soon become major delimiters of the urban form as the
urbanized area begins to abut them.
Finally, particular policy choices have influenced how the region
developed. Widespread annexation has limited the imbalances among the
region’s major cities by giving them shares of new development to comple-
ment their older areas. The Salt River Project and the Central Arizona
Project, combined with restrictions on the use of groundwater, have
facilitated growth while discouraging leapfrog development. And in like
fashion, the region’s late start on freeway building has promoted more
compact development than might have occurred. Conversely, the intense
localism of the region’s political culture has delayed mass transit and
precluded regionalized efforts to manage growth and protect open space.
Current freeway building and the imminent disposal of much state-owned
land also appear poised to change the region’s future growth and
development patterns.
The bottom line: Metropolitan Phoenix has grown in ways unlike, and
like, other regions of its type.
Considered together, these crosscurrents challenge Phoenix to think
carefully now for two reasons.
First, the strong role timing has played in metropolitan Phoenix’ rise
raises the possibility that the region’s relative health thus far owes mainly to
its extreme youth. To be sure, a number of particular local twists of topog-
raphy, land ownership, water policy and massive annexation have made the
Phoenix region different than many. Yet, for all that, metropolitan Phoenix’
resemblance to cities that have grown since 1970 suggest it may not be so
much different as younger than other more troubled cities. And that raises a
vexing question: Is it just a matter of time before metropolitan Phoenix
grows into a highly decentralized set of suburbs encircling a poverty-
impacted, physically decaying downtown?
Otherwise, the region faces the future at a moment when many
“givens” about what matters in region building have been changed by
the age of knowledge. The new economy is altering much about the way
companies, people, cities and governments operate. Most crucially, this new
order, so important to metropolitan Phoenix’ future, values quality of life
more than the old economy – because it depends on people more than the
old one. People – particularly skilled workers and entrepreneurs – gravitate
to places that combine compelling career opportunities and a desirable
lifestyle. Regions, therefore, must now compete on quality just as companies
do. This ups the ante as the region weighs its present condition and
considers its future.
Metropolitan Phoenix’ economic competitiveness now depends on
successfully managing its past and current growth trends so as to avoid
becoming a region of haves and have nots and to prevail as a lifestyle Mecca
for the knowledge workers of the new economy. And yet, the problems on
display in Atlanta, Washington, D.C. and Denver may be inseparable from
the maturity toward which Phoenix is moving.
If that is so, the region should think hard about how to avoid the pitfalls
of maturity while seeking its benefits. More than likely, such planning –
as the next section of this report suggests – will require important and
potentially controversial policy choices.
Summing It Up
40 HITS AND MISSES: Fast Growth in Metropol i tan Phoenix
First, the Phoenix region needs to understand the full range of
issues that shape its growth and development patterns. The region’s
emerging divisions, transportation challenges, loss of desert lands, and the
many other growth issues that threaten metropolitan Phoenix’ quality of
life are inextricably linked. The challenges cut across jurisdictional bound-
aries. Yet the practice of this state has been to approach the region’s growth
problems piecemeal.
This Arizona-style disconnect is best illustrated by the current collection
of high-level state planning and policy commissions that are now, or recently
have been, deliberating in isolation on five critical aspects of growth:
growth management itself, the new economy, water, transportation and air
quality. There is little evidence thus far that these dialogues will be con-
nected into a comprehensive, coordinated response to the overarching issue
of growth management.
By contrast, the smartest regions today have embraced the “four E’s” of
a strong economy, healthy environment, social equity and civic engagement
as an integrative framework for analyzing problems and building regional
advantages. These metropolitan areas recognize that the times and the
terms by which regions compete in the world are changing and their
responses relate to the powerful forces of migration, competition,
globalization and technology.
They notice that “clusters” of businesses and the talented people they
depend on are increasingly attracted to vital, livable places. They see that
“livability” has become a rallying cry for companies and their workers who
want clean environments, open space and an end to excessive sprawl. And
they recognize that everything is connected.
Metropolitan Phoenix’ leaders can continue to disregard the relationships
among the region’s education, social, economic and environmental
challenges and hope for the best. But they would do better if together they
“connected the dots” among the issues and created new partnerships capable
of responding to growth’s problems and paradoxes.
Second, the Phoenix region must overcome a number of near
“Catch-22s” that are rooted in its history. As the region continues to grow,
a number of trends – both positive and negative – have the potential to
confront the region with a series of dilemmas. For example:
• Looming transportation and land use conundrums. In contrast to
other regions, highway building in metropolitan Phoenix has
supported the region’s central area. The present round of suburb-to-
suburb freeway extensions, however, could create problems. By making
jobs and homes away from the center more accessible, the presence of
freeways will intensify land consumption on the fringe. But should
employment remain concentrated in the cores and home building
continue to move outward, commute times could worsen. The chal-
lenge to unraveling this Catch-22 will be finding transportation and
land-use initiatives that create dispersed mixed-use clusters of greater
residential and employment density, that do not detract from the
vitality of downtown Phoenix, the region’s signature core.
• State trust land questions. Large tracts of state-owned trust land near
the urban fringe constitute an irreplaceable asset for the region’s quality
of life. This land could serve as a growth boundary that provides a vast
reservoir of open space. However, the state constitution requires that
these lands be managed to maximize revenues for Arizona’s educa-
tional needs. The mandate bars wholesale conservation of the lands
and increases the likelihood of future land sales to developers. The
challenge for the region will be to amend the Arizona constitution and
state enabling act to allow for trust land to be dedicated to open space
while maintaining the ability to fund schools.
• Growth agendas in the smaller cities. Eighteen less-populous cities
on the urban fringe now control nearly as much land as the city of
Phoenix and the five largest suburbs combined. These areas also lag
behind the region in open-space protection and use of growth
management tools. This means that the municipalities in the region
least equipped to deal with the effects of fast growth will soon be
making decisions with enormous implications for the entire region.
The challenge will be to bring a regional perspective to the planning
efforts of all cities while respecting the region’s tradition of local control.
• Fixing the schools of the core. The region has reason to worry about
the education of children in central Phoenix and the southwest
portion of the region. Individual economic success correlates particularly
with education attainment (the number of years of school completed).
The weak schools of the center present a powerful impetus for decen-
tralization. Schools with high proportions of low-income, minority or
underachieving students may influence where people and businesses
choose to locate. This increases the viability of the fringe at the expense
of the core. Ironically, though, the region and its cities possess limited
authority to address the unique problems of schools. The challenge
will be encouraging more effective collaboration between school
districts and city leaders and including education issues in both fringe
growth management and core revitalization strategies.
• Conflicting views on sprawl and density. Residents of metropolitan
Phoenix decry sprawl, but they also dislike density. Unfortunately,
controlling one usually means encouraging the other. To confront this
Catch-22, regional leaders and residents will need to find an acceptable
way to promote greater density with “quality” development that fosters
convenience, diversity, transit options and access to open spaces. One
approach will be to re-evaluate traditional zoning ordinances with their
rigid and segregated land uses and consider new rules that foster
acceptable combinations of residential and commercial uses.
What to Do
Phoenix came into its own during the automobile era, but the region’s next chapter will be written in the age of knowledge. As the region’s leaders and residents decide what to do, actionsin three strategic areas seem imperative.
41MORRISON INSTITUTE FOR PUBLIC POLICY
• Regional authority dilemma. Although valuable, especially as the 18
less-populous communities become a stronger force in the regional
dynamics, city-to-city coordination will only go so far. However, the
creation of a binding regional authority has been rejected so often that
implementation of such a concept appears unrealistic for metropolitan
Phoenix. The challenge will be to reap the benefits of regional “gover-
nance”without having to adopt a formal “regional government” structure.
• An on and off relationship with Washington. The region historically
has benefitted from federal assistance with water and public works
projects that have sustained a growing population. In recent years,
state leadership – executive and congressional – has disdained federal
help with similar projects, believing that the state should be more
independent from Washington. This stance handicaps the region’s
ability to finance major growth management initiatives, such as light
rail or open space acquisition, that neither the state nor any single
municipality can afford on its own. The challenge will be to get back
to a long-term regional agenda so compelling that it would be
unthinkable for any elected official not to support it.
• Tensions that surround state support of metropolitan Phoenix. In
today’s economy metropolitan regions are increasingly overtaking
states as the drivers of growth. The situation in Arizona is no excep-
tion; the metropolitan Phoenix region currently accounts for 70
percent of the state’s total personal income and is responsible for over
70 percent of new job growth. Thus, ensuring a viable metropolitan
Phoenix should be a top priority of state government. However, other
communities across Arizona have needs that also must be addressed
at the state level. The challenge will be to support the Phoenix region
in a way that does not neglect the needs of other localities, but accepts
that prosperity brought forth by a strong regional driver benefits the
state as a whole.
• Water’s changing role. Although the region has ample water for its
current population, water management will be more important given
that there are no potential projects on the scale of the Central Arizona
Project to increase the future supply of water. As such, water manage-
ment will be increasingly related to growth management, as water
becomes an invaluable regulator by influencing where homes and
businesses may locate. However, discussions on water management
and growth management currently take place in entirely separate
spheres. The challenge will be to bring together the water mavens and
the urban planners to come to an understanding of how water
policies could be used to manage growth.
These near Catch-22s will not succumb to old ideas. Bold, innovative
policy decisions will be needed. It is unfortunate that the state’s past knack
for bold and integrated policy making has been noticeably absent in recent
years. Nowhere in sight, for example, is the kind of problem solving with
which, in the early 1980s, the state of Arizona prepared for growth by enacting
its celebrated Groundwater Management Act and Urban Lands Act. Each of
these laws brought the outlines of comprehensive, regionalized policy to the
management of a key resource stressed by growth. And each has stood the
state and the region in good stead.
The challenge for metropolitan Phoenix is also to reinvigorate its past
tradition of far-sighted, large-scale action now. This does not mean simply
replicating the big ideas of a Seattle or a Denver. It requires the region’s key
stakeholders to think deeply and creatively about local causes, conditions
and future trends and to take action.
Each economic era has evolved its own regional form. What is next?
ECONOMY GEOGRAPHYAgricultural (1700-1880) Towns, Villages, Farms
Industrial (1880-1950) Central City
Service (1950-1980) City-Suburbs
Information (1980- ) ??
Source: Collaborative Economics, 1997.
The Future at a Glance…
42 HITS AND MISSES: Fast Growth in Metropol i tan Phoenix
This report’s final suggestion for the region is for it to focus on demographic, technological and cultural trends that are shaping the nextmetropolitan era. New faces, a new economy, and a new geography ofamenities may be as profound a determinant of the size, shape andprospects of cities and their surroundings in the coming years as the post-war suburban boom was. This means decision makers will need to considerdifferent, new trends as they prepare for future growth. Table 12 shows someof the trends to prepare for.
If it is true that “demographics are destiny,” two dramatic changes inthe make up of the American population will affect the shape of metro-politan regions’ character in the future: the aging of America’s babyboomers and its increasing population of immigrants. What the boomersbuy and where they retire will have significant implications for urban andsuburban growth dynamics. The Milken Institute projects that the gains inthe elderly population over the next 25 years will result in major migrationsby retired people to high-amenity areas such as the south and mountainwest. Within these areas, the more affluent “yuppie” elderly will tend tolocate on the periphery while less wealthy seniors likely will remain in theirhome cities and reside closer to the core.19
The increasing numbers of immigrants coming to America arealready creating new urban dynamics. For example, the most recentinfluxes of residents from Asia and Latin America exhibit different settle-ment tendencies from their predecessors from Europe early in the 20th century. Rather than assimilating whole-heartedly into American culture,immigration laws have encouraged the groups to cluster near family members.This congregation is creating a new force in metropolitan areas,especially in a handful of central cities.20
The baby boomers’ gradual transition out of the workforce will createa talent shortage. After the baby boom’s huge bulge in births from 1946 to1964, population growth fell off sharply in the mid-1960s and did notrebound until the baby “boomlet” began in the late 1970’s. This boom-and-bust pattern has created big swings in supply and demand in everythingfrom schools and jobs to housing. For employers the next swing will put apremium on young, well-educated, creative talent. In-migration will supplysome of this talent; increased productivity will take up some of the slack.But, fundamentally, communities that attract talent will attract employers.
New economy firms are already reshaping the economic landscapeand built environment. If current trends hold, the company of the futurewill be small. For example, only 11 companies in Silicon Valley have morethan 10,000 employees; the average size for software firms is 27 people. Thatalone dictates vast differences in where companies can locate within the city,and what sort of construction suits them. Although improved infrastructureand communications technology are encouraging the spread of jobs andpeople to the urban edge, big cities like Phoenix can prevail because theymove ideas, engender face-to-face interaction, facilitate specialization,support lots of stores and parks and diversity. They also provide accessibility,and an already built-up, rich infrastructure – both of which are critical toregional competitiveness.
And the new generation of workers is beginning to define a new wayto work and live. Where workers in the industrial era went to a factory to make things more efficiently, new economy workers can work from anywhere to apply their knowledge to do things better. Increasingly, theymaintain a 24-hour-a-day, 7-day-a-week schedule. Because the time frame
in which they must accomplish tasks is highly abbreviated, the new workersvalue just-in-time amenities, user-friendly transit connections, accessiblediversions that blend seamlessly with work. Whether it is cappuccino or amovie, they want it when they want it and they want it to be good.Downtowns and diversified city neighborhoods that cater to their 24 hour-schedule are in; sterile suburban campuses are out. Growth management,access to greenspace and the “mixed-use” clustering advocated by NewUrbanist designers are positives; “sprawl,” traffic congestion and poor schoolsystems are big turn-offs.
Finally, one of the strongest implications of the current change is thatplace still matters – but for different reasons.21 Technological advancesmake it possible for people and companies to locate anywhere. Just as thedawn of the automobile supported the spread of suburbs, the age of thecomputer will likewise shape the character of metropolitan regions. Workersin the new economy appreciate physical attributes such as geography or climate, as well as intangible aspects such as quality of place. Although suchworkers could technically work from anywhere, they tend to choose placesthat allow them to balance both economic opportunity (jobs) and lifestyle(amenities). In so choosing, the new workers value fundamentals like connectivity and access, but also less quantifiable assets like a sense of place;vital centers where they can interact with peers and draw upon one another’screative energy; or a thriving cultural scene.
How metropolitan Phoenix chooses to take what it has and put it intoplay amid these emerging trends will determine the region’s competitive-ness and how it will grow. For example, if present migration trends continue,the region can expect to see even greater concentrations of Hispanic popu-lations around the core. Likewise, the region can expect to see continuedclustering of older residents along the outer edge as more retirees settle in age-segregated communities. Talented workers are now becoming thedriving force behind business site selections. Each group will demand different amenities and services from their communities.
Because of these trends, metropolitan Phoenix will likely have tochange many things about how it competes for prosperity in the next eraof growth. Rail lines (rather than lane miles) may become crucial. Mixed-use and “clustering” may need to become the region’s watchwords rather thanlow-density spreads. And downtown revitalization campaigns may need tochange strategy to focus on small firms and knowledge workers who wantamenities around the clock, individualistic residences and quality schoolsclose by rather than on luring suburban residents to come to the city onweekends to watch professional sports events or attend the theater.
Finally, one thing is certain: The regional imperative is growingstronger. Cities are no longer islands. As groups of cities here and elsewherehave grown into metropolitan areas, the resulting region has become the onlymeaningful unit, the ultimate nexus of activity. Everything now connects.Every decision and policy of one jurisdiction affects those of all the others.Each jurisdiction within the region is reliant on the others to maintain itsstrength and the overall region’s health. The effects of poorly planned growthmanagement in one jurisdiction will affect the quality of life in the others.The problem of one locality turns out to be everybody’s problem.
Let metropolitan Phoenix become one of the first communities in the nation to craft truly innovative, forward looking and regionwide solutions to everyone’s problem and opportunity – changing metropolitandevelopment patterns.
New Faces, New Economy and New Geography Will Shape Future Metropolitan Areas
43MORRISON INSTITUTE FOR PUBLIC POLICY
TA B L E 1 2 : T H E F U T U R E AT A G L A N C E
NEW FACES: New groups are changing the way things are done.
YUPPIE BABY-BOOMERSWhat they buy (e.g., smaller homes) and where they retire will have significant implications for urban and suburban growth dynamics.The gains in elderly over the next 25 years are projected to result in retirement migration to high amenity areas of the mountain westand south. Within metropolitan areas the better-off and healthy “yuppie elderly” will tend to locate on the periphery, and the more dis-advantaged segments of the older population will reside closer in.
DIFFERENT MELTING POTThe second important demographic player will be the new immigrants, who began arriving in the mid-1960’s. These new immigrantsappear to be unlike their European predecessors. Past European immigrants felt acculturation was necessary in order to succeed eco-nomically and socially. However, today’s ethnic minority immigrants are attempting to maintain their cultural identities and statisticsshow a clustering of new immigrants into a handful of metropolitan areas – Phoenix is one of them.
TALENT SHORTAGEAfter the baby boom’s huge bulge in births, from 1946 to 1964, the population increases due to natural increase fell off sharply in themid-1960’s and did not rebound until the baby “boomlet” began in the late 1970’s. This boom-and-bust pattern has created big swingsin supply and demand in everything from schools and jobs to housing. But fundamentally, it means a shortage of talent, such thatemployers are going to pay a premium for the young well-educated, creative talent critical to their success in the new economy.
NEW ECONOMY: Technology advances mean new challenges for regions.
SMALL IS “IN”Small, fast growing firms are reshaping the landscape and that means the large “vertical cities” (New York, Chicago) are losing groundto the more mid-sized horizontal cities (San Jose, San Diego). Only 11 companies in Silicon Valley have more than 10,000 employees.Where does everyone else work? Hint: the average size software firm is 27 people.
PLACES TO NETWORKLarge urban areas are particularly exciting centers for people and firms who want to be innovators and need to stay on the cutting edge.They will come to the city-center to reap the benefits of the creative milieu and mixing of ideas. Contrary to some early predictions fora lessening in social relationships as a result of more communication via computers and the Internet, today’s urban center is largely sus-tained by interaction between specific groups who seek out and find each other, uniquely within the urban core.
24/7The new generation of knowledge workers’ life styles fit no earlier pattern in history. They maintain a 24-hour-a-day/7-day-a-weekschedule. Because the timeframe in which they must accomplish tasks is highly abbreviated, they value “just-in-time” amenities. Whetherit is cappuccino or a movie, they want it when they want it and they want it to be good. Downtowns or funky city neighborhoods thatcater to their 24 hour schedule are in. They would not be caught dead in a sterile suburban campus!
NEW GEOGRAPHY: Place still matters – but for different reasons.
QUALITY OF PLACEUnlike the previous era when companies located near highways, railroads, and waterways to facilitate transportation of their goods,technology has made it possible for many to locate their businesses or work from anywhere. But such flexibility has not decreased theimportance of place. As competition to attract talent has become more fierce, the premium placed on a region’s quality of life has like-wise increased. Geographic and cultural amenities matter. Cities with devastated cores, poor weather, and a relative lack of culturalattractions are disadvantaged in the new economy.
REGIONAL IMPERATIVECities are no longer islands. As groups of cities have grown into metropolitan areas, the resulting regions are becoming the nexus ofactivity. As such, each jurisdiction within that region is reliant on the others to maintain the region’s health. The effects of poorlyplanned growth management in one jurisdiction will affect the quality of life in the others. This is another argument for greater region-al cooperation.
Source: Morrison Institute for Public Policy; Milken Institute; Collaborative Economics; Joel Kotkin.
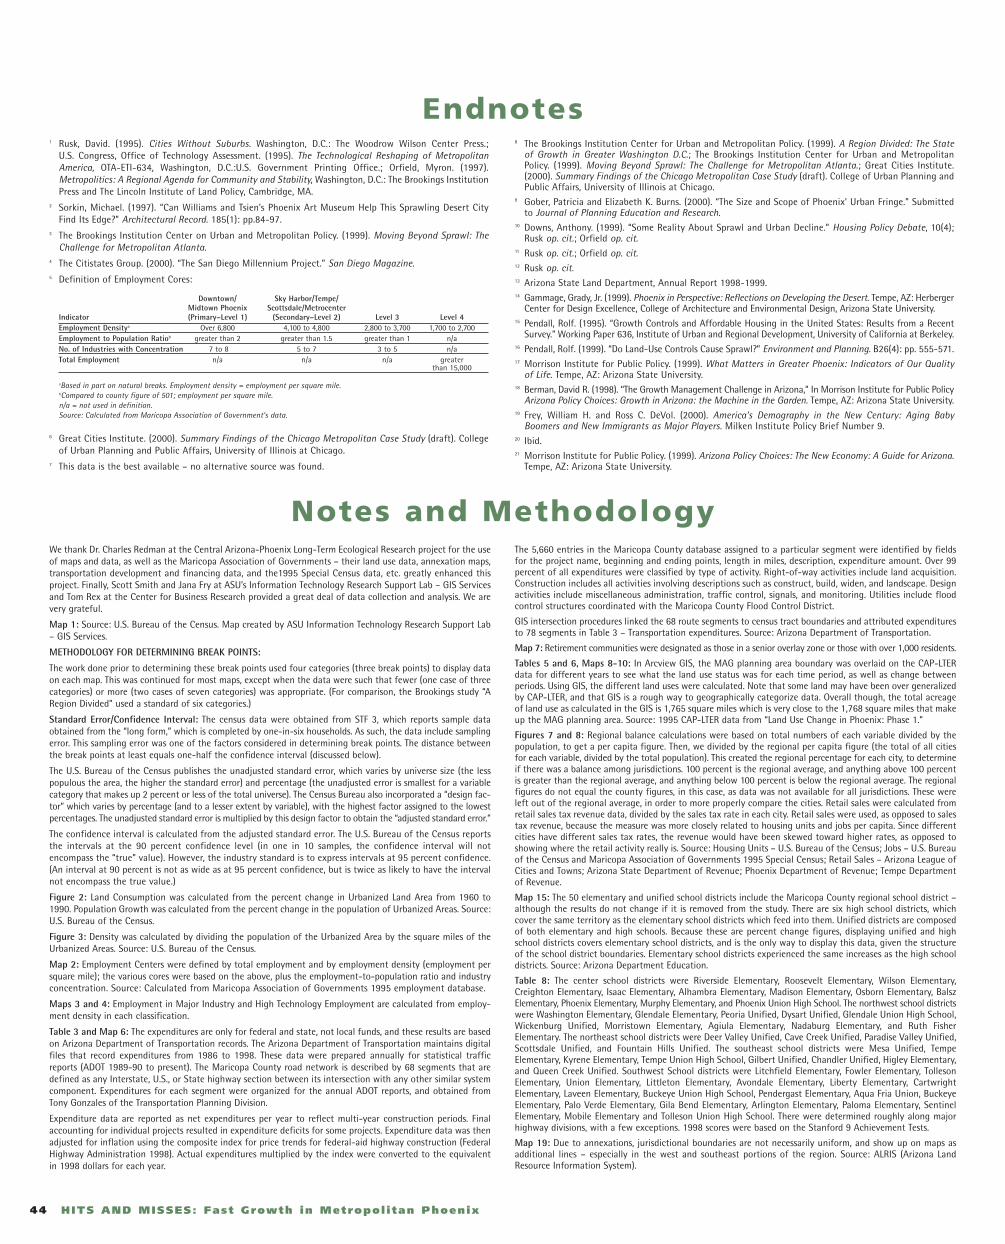
44 HITS AND MISSES: Fast Growth in Metropol i tan Phoenix
We thank Dr. Charles Redman at the Central Arizona-Phoenix Long-Term Ecological Research project for the useof maps and data, as well as the Maricopa Association of Governments – their land use data, annexation maps,transportation development and financing data, and the1995 Special Census data, etc. greatly enhanced thisproject. Finally, Scott Smith and Jana Fry at ASU’s Information Technology Research Support Lab – GIS Servicesand Tom Rex at the Center for Business Research provided a great deal of data collection and analysis. We arevery grateful.
Map 1: Source: U.S. Bureau of the Census. Map created by ASU Information Technology Research Support Lab– GIS Services.
METHODOLOGY FOR DETERMINING BREAK POINTS:
The work done prior to determining these break points used four categories (three break points) to display dataon each map. This was continued for most maps, except when the data were such that fewer (one case of threecategories) or more (two cases of seven categories) was appropriate. (For comparison, the Brookings study “ARegion Divided” used a standard of six categories.)
Standard Error/Confidence Interval: The census data were obtained from STF 3, which reports sample dataobtained from the “long form,” which is completed by one-in-six households. As such, the data include samplingerror. This sampling error was one of the factors considered in determining break points. The distance betweenthe break points at least equals one-half the confidence interval (discussed below).
The U.S. Bureau of the Census publishes the unadjusted standard error, which varies by universe size (the lesspopulous the area, the higher the standard error) and percentage (the unadjusted error is smallest for a variablecategory that makes up 2 percent or less of the total universe). The Census Bureau also incorporated a “design fac-tor” which varies by percentage (and to a lesser extent by variable), with the highest factor assigned to the lowestpercentages. The unadjusted standard error is multiplied by this design factor to obtain the “adjusted standard error.”
The confidence interval is calculated from the adjusted standard error. The U.S. Bureau of the Census reportsthe intervals at the 90 percent confidence level (in one in 10 samples, the confidence interval will notencompass the “true” value). However, the industry standard is to express intervals at 95 percent confidence.(An interval at 90 percent is not as wide as at 95 percent confidence, but is twice as likely to have the intervalnot encompass the true value.)
Figure 2: Land Consumption was calculated from the percent change in Urbanized Land Area from 1960 to1990. Population Growth was calculated from the percent change in the population of Urbanized Areas. Source:U.S. Bureau of the Census.
Figure 3: Density was calculated by dividing the population of the Urbanized Area by the square miles of theUrbanized Areas. Source: U.S. Bureau of the Census.
Map 2: Employment Centers were defined by total employment and by employment density (employment persquare mile); the various cores were based on the above, plus the employment-to-population ratio and industryconcentration. Source: Calculated from Maricopa Association of Governments 1995 employment database.
Maps 3 and 4: Employment in Major Industry and High Technology Employment are calculated from employ-ment density in each classification.
Table 3 and Map 6: The expenditures are only for federal and state, not local funds, and these results are basedon Arizona Department of Transportation records. The Arizona Department of Transportation maintains digitalfiles that record expenditures from 1986 to 1998. These data were prepared annually for statistical trafficreports (ADOT 1989-90 to present). The Maricopa County road network is described by 68 segments that aredefined as any Interstate, U.S., or State highway section between its intersection with any other similar systemcomponent. Expenditures for each segment were organized for the annual ADOT reports, and obtained fromTony Gonzales of the Transportation Planning Division.
Expenditure data are reported as net expenditures per year to reflect multi-year construction periods. Finalaccounting for individual projects resulted in expenditure deficits for some projects. Expenditure data was thenadjusted for inflation using the composite index for price trends for federal-aid highway construction (FederalHighway Administration 1998). Actual expenditures multiplied by the index were converted to the equivalentin 1998 dollars for each year.
The 5,660 entries in the Maricopa County database assigned to a particular segment were identified by fieldsfor the project name, beginning and ending points, length in miles, description, expenditure amount. Over 99percent of all expenditures were classified by type of activity. Right-of-way activities include land acquisition.Construction includes all activities involving descriptions such as construct, build, widen, and landscape. Designactivities include miscellaneous administration, traffic control, signals, and monitoring. Utilities include floodcontrol structures coordinated with the Maricopa County Flood Control District.
GIS intersection procedures linked the 68 route segments to census tract boundaries and attributed expendituresto 78 segments in Table 3 – Transportation expenditures. Source: Arizona Department of Transportation.
Map 7: Retirement communities were designated as those in a senior overlay zone or those with over 1,000 residents.
Tables 5 and 6, Maps 8-10: In Arcview GIS, the MAG planning area boundary was overlaid on the CAP-LTERdata for different years to see what the land use status was for each time period, as well as change betweenperiods. Using GIS, the different land uses were calculated. Note that some land may have been over generalizedby CAP-LTER, and that GIS is a rough way to geographically categorize data. Overall though, the total acreageof land use as calculated in the GIS is 1,765 square miles which is very close to the 1,768 square miles that makeup the MAG planning area. Source: 1995 CAP-LTER data from “Land Use Change in Phoenix: Phase 1.”
Figures 7 and 8: Regional balance calculations were based on total numbers of each variable divided by thepopulation, to get a per capita figure. Then, we divided by the regional per capita figure (the total of all citiesfor each variable, divided by the total population). This created the regional percentage for each city, to determineif there was a balance among jurisdictions. 100 percent is the regional average, and anything above 100 percentis greater than the regional average, and anything below 100 percent is below the regional average. The regionalfigures do not equal the county figures, in this case, as data was not available for all jurisdictions. These wereleft out of the regional average, in order to more properly compare the cities. Retail sales were calculated fromretail sales tax revenue data, divided by the sales tax rate in each city. Retail sales were used, as opposed to salestax revenue, because the measure was more closely related to housing units and jobs per capita. Since differentcities have different sales tax rates, the revenue would have been skewed toward higher rates, as opposed toshowing where the retail activity really is. Source: Housing Units – U.S. Bureau of the Census; Jobs – U.S. Bureauof the Census and Maricopa Association of Governments 1995 Special Census; Retail Sales – Arizona League ofCities and Towns; Arizona State Department of Revenue; Phoenix Department of Revenue; Tempe Departmentof Revenue.
Map 15: The 50 elementary and unified school districts include the Maricopa County regional school district –although the results do not change if it is removed from the study. There are six high school districts, whichcover the same territory as the elementary school districts which feed into them. Unified districts are composedof both elementary and high schools. Because these are percent change figures, displaying unified and highschool districts covers elementary school districts, and is the only way to display this data, given the structureof the school district boundaries. Elementary school districts experienced the same increases as the high schooldistricts. Source: Arizona Department Education.
Table 8: The center school districts were Riverside Elementary, Roosevelt Elementary, Wilson Elementary,Creighton Elementary, Isaac Elementary, Alhambra Elementary, Madison Elementary, Osborn Elementary, BalszElementary, Phoenix Elementary, Murphy Elementary, and Phoenix Union High School. The northwest school districtswere Washington Elementary, Glendale Elementary, Peoria Unified, Dysart Unified, Glendale Union High School,Wickenburg Unified, Morristown Elementary, Agiula Elementary, Nadaburg Elementary, and Ruth FisherElementary. The northeast school districts were Deer Valley Unified, Cave Creek Unified, Paradise Valley Unified,Scottsdale Unified, and Fountain Hills Unified. The southeast school districts were Mesa Unified, TempeElementary, Kyrene Elementary, Tempe Union High School, Gilbert Unified, Chandler Unified, Higley Elementary,and Queen Creek Unified. Southwest School districts were Litchfield Elementary, Fowler Elementary, TollesonElementary, Union Elementary, Littleton Elementary, Avondale Elementary, Liberty Elementary, CartwrightElementary, Laveen Elementary, Buckeye Union High School, Pendergast Elementary, Aqua Fria Union, BuckeyeElementary, Palo Verde Elementary, Gila Bend Elementary, Arlington Elementary, Paloma Elementary, SentinelElementary, Mobile Elementary and Tolleson Union High School. There were determined roughly along majorhighway divisions, with a few exceptions. 1998 scores were based on the Stanford 9 Achievement Tests.
Map 19: Due to annexations, jurisdictional boundaries are not necessarily uniform, and show up on maps asadditional lines – especially in the west and southeast portions of the region. Source: ALRIS (Arizona LandResource Information System).
Notes and Methodology
1 Rusk, David. (1995). Cities Without Suburbs. Washington, D.C.: The Woodrow Wilson Center Press.; U.S. Congress, Office of Technology Assessment. (1995). The Technological Reshaping of MetropolitanAmerica, OTA-ETI-634, Washington, D.C.:U.S. Government Printing Office.; Orfield, Myron. (1997).Metropolitics: A Regional Agenda for Community and Stability, Washington, D.C.: The Brookings InstitutionPress and The Lincoln Institute of Land Policy, Cambridge, MA.
2 Sorkin, Michael. (1997). “Can Williams and Tsien’s Phoenix Art Museum Help This Sprawling Desert CityFind Its Edge?” Architectural Record. 185(1): pp.84-97.
3 The Brookings Institution Center on Urban and Metropolitan Policy. (1999). Moving Beyond Sprawl: TheChallenge for Metropolitan Atlanta.
4 The Citistates Group. (2000). “The San Diego Millennium Project.” San Diego Magazine.5 Definition of Employment Cores:
Downtown/ Sky Harbor/Tempe/Midtown Phoenix Scottsdale/Metrocenter
Indicator (Primary–Level 1) (Secondary–Level 2) Level 3 Level 4Employment Densitya Over 6,800 4,100 to 4,800 2,800 to 3,700 1,700 to 2,700Employment to Population Ratiob greater than 2 greater than 1.5 greater than 1 n/aNo. of Industries with Concentration 7 to 8 5 to 7 3 to 5 n/aTotal Employment n/a n/a n/a greater
than 15,000
aBased in part on natural breaks. Employment density = employment per square mile.bCompared to county figure of 501; employment per square mile.n/a = not used in definition. Source: Calculated from Maricopa Association of Government’s data.
6 Great Cities Institute. (2000). Summary Findings of the Chicago Metropolitan Case Study (draft). Collegeof Urban Planning and Public Affairs, University of Illinois at Chicago.
7 This data is the best available – no alternative source was found.
8 The Brookings Institution Center for Urban and Metropolitan Policy. (1999). A Region Divided: The Stateof Growth in Greater Washington D.C.; The Brookings Institution Center for Urban and MetropolitanPolicy. (1999). Moving Beyond Sprawl: The Challenge for Metropolitan Atlanta.; Great Cities Institute.(2000). Summary Findings of the Chicago Metropolitan Case Study (draft). College of Urban Planning andPublic Affairs, University of Illinois at Chicago.
9 Gober, Patricia and Elizabeth K. Burns. (2000). “The Size and Scope of Phoenix’ Urban Fringe.” Submittedto Journal of Planning Education and Research.
10 Downs, Anthony. (1999). “Some Reality About Sprawl and Urban Decline.” Housing Policy Debate, 10(4);Rusk op. cit.; Orfield op. cit.
11 Rusk op. cit.; Orfield op. cit.12 Rusk op. cit.13 Arizona State Land Department, Annual Report 1998-1999.14 Gammage, Grady, Jr. (1999). Phoenix in Perspective: Reflections on Developing the Desert. Tempe, AZ: Herberger
Center for Design Excellence, College of Architecture and Environmental Design, Arizona State University.15 Pendall, Rolf. (1995). “Growth Controls and Affordable Housing in the United States: Results from a Recent
Survey.” Working Paper 636, Institute of Urban and Regional Development, University of California at Berkeley.16 Pendall, Rolf. (1999). “Do Land-Use Controls Cause Sprawl?” Environment and Planning. B26(4): pp. 555-571.17 Morrison Institute for Public Policy. (1999). What Matters in Greater Phoenix: Indicators of Our Quality
of Life. Tempe, AZ: Arizona State University.18 Berman, David R. (1998). “The Growth Management Challenge in Arizona,” In Morrison Institute for Public Policy
Arizona Policy Choices: Growth in Arizona: the Machine in the Garden. Tempe, AZ: Arizona State University.19 Frey, William H. and Ross C. DeVol. (2000). America’s Demography in the New Century: Aging Baby
Boomers and New Immigrants as Major Players. Milken Institute Policy Brief Number 9.20 Ibid.21 Morrison Institute for Public Policy. (1999). Arizona Policy Choices: The New Economy: A Guide for Arizona.
Tempe, AZ: Arizona State University.
Endnotes
45MORRISON INSTITUTE FOR PUBLIC POLICY
RESEARCH PAPERS:Leonard G. Bower, Economist
• Fiscal Matters in Phoenix Metro AreaCities: Revenues, Capacity, and Zoning
• Arizona Sales Tax in Maricopa CountyCities: Structure, Rates, and Yields
Elizabeth Burns, Professor, ASU Department of Geography
• Transportation Trends, Urban FreewayExpenditures, and Spatial Disparities in Metropolitan Phoenix
Patricia Gober, Professor, ASU Department of Geography
• Public Policy Ramifications of ElderlyMigration and Age Segregation inMetropolitan Phoenix
• Phoenix: A City of Migrants
Kent Hill, Assistant Research Professional, ASU Department of Economics
• Determinants of (Per Capita) FederalFunds Received by Metro Areas: A County-Level Analysis
• Housing-Related Tax Benefits in thePhoenix Metropolitan Area in 1990
Glen Krutz, Assistant Professor, ASU Department of Political Science
• City Growth Management Strategies in Greater Phoenix
Tom R. Rex, Research Manager, ASU Center for Business Research
• Employment in Metropolitan Phoenix• Development of Metropolitan Phoenix:
Historical, Current and Future Trends• Population Density in Metropolitan
Phoenix• Population Demographics in
Metropolitan Phoenix• Housing in Metropolitan Phoenix
BRIEFING PAPERS:William Fulton and Alicia Harrison,Solimar Research Group
• Land Use and Metropolitan Form
Rebecca L. Gau, Senior Research Analyst, Morrison Institute for Public Policy
• Housing Affordability in MetropolitanPhoenix
• Race and Ethnicity in MetropolitanPhoenix
• Education Trends in MetropolitanPhoenix
Glen Krutz, Assistant Professor, ASU Department of Political Science
• Explaining Intergovernmental FundingFlows to Cities in Maricopa County
• Local and Regional Governance Structure
Mark Muro, Senior Research Analyst, Morrison Institute for Public Policy
• The State Lands and Growth• Open Space and Growth• Water and Growth
Tina Valdecanas, Senior Research Analyst, Morrison Institute for Public Policy
• Maricopa County Communities• Migration in Metropolitan Phoenix• Underlying Factors in Phoenix’ Growth
Mary Jo Waits, Associate Director, Morrison Institute for Public Policy
• Growth at the Fringe• Downtown Revitalization Efforts
BIBLIOGRAPHY:
The Brookings Institution Center on Urban andMetropolitan Policy. (1999). A Region Divided:The State of Growth in Greater Washington, D.C.
The Brookings Institution Center on Urban andMetropolitan Policy. (1999). Moving BeyondSprawl: the Challenge for Metropolitan Atlanta.
The Citistates Group. (2000). “The San DiegoMillennium Project.” San Diego Magazine.
Downs, Anthony. (1999). “Some Realities aboutSprawl and Urban Decline.” Housing PolicyDebate, 10, (4).
Frey, William H. and Ross C. DeVol. (March 8, 2000). America’s Demography in the New Century: Aging Baby Boomers and New Immigrants as Major Players.Milken Institute Policy Brief, # 9.
Gammage, Grady, Jr. (1999). Phoenix inPerspective: Reflections on Developing theDesert. Herberger Center for Design Excellence,College of Architecture and EnvironmentalDesign, Arizona State University.
Gober, Patricia and Elizabeth K. Burns. (2000).“The Size and Shape of Phoenix’s UrbanFringe.” Submitted to Journal of PlanningEducation and Research.
Great Cities Institute. (2000). SummaryFindings of the Chicago Metropolitan CaseStudy (draft). College of Urban Planning andPublic Affairs, University of Illinois at Chicago.
Kotkin, Joel. (2000). “Kotkin’s Law: A Region’sEconomic Success is Dependent on its Qualityof Life,” 20 Metro Investment Report.
Morrison Institute for Public Policy. (1998).Arizona Policy Choices, Growth in Arizona: The Machine in the Garden, Tempe, AZ: Arizona State University.
Morrison Institute for Public Policy. (1999).Arizona Policy Choices: The New Economy: A Guide for Arizona. Tempe, AZ: Arizona State University.
Orfield, Myron. (1997). Metropolitics: A Regional Agenda for Community andStability, Washington, D.C.: BrookingsInstitution Press and The Lincoln Institute of Land Policy, Cambridge, MA.
Pendall, Rolf. (1995). “Growth Controls andAffordable Housing in the United States:Results from a Recent Survey.” Working Paper 636, Institute of Urban and RegionalDevelopment, University of California at Berkeley
Pendall, Rolf. (1999). “Do Land-Use ControlsCause Sprawl?” Environment and PlanningB 26(4): pp. 555-571.
Rusk, David (1995). Cities Without Suburbs.Washington, D.C.: The Woodrow Wilson Center Press.
U.S. Congress, Office of Technology Assessment. (1995). The TechnologicalReshaping of Metropolitan America,OTA-ETI-634, Washington, D.C.:U.S. Government Printing Office.
U.S. Department of Housing and UrbanDevelopment. (2000). The State of the Cities2000: Megaforces Shaping the Future of theNation's Cities.
Papers Prepared for Hits and Misses: Fast Growth in Metropolitan Phoenix
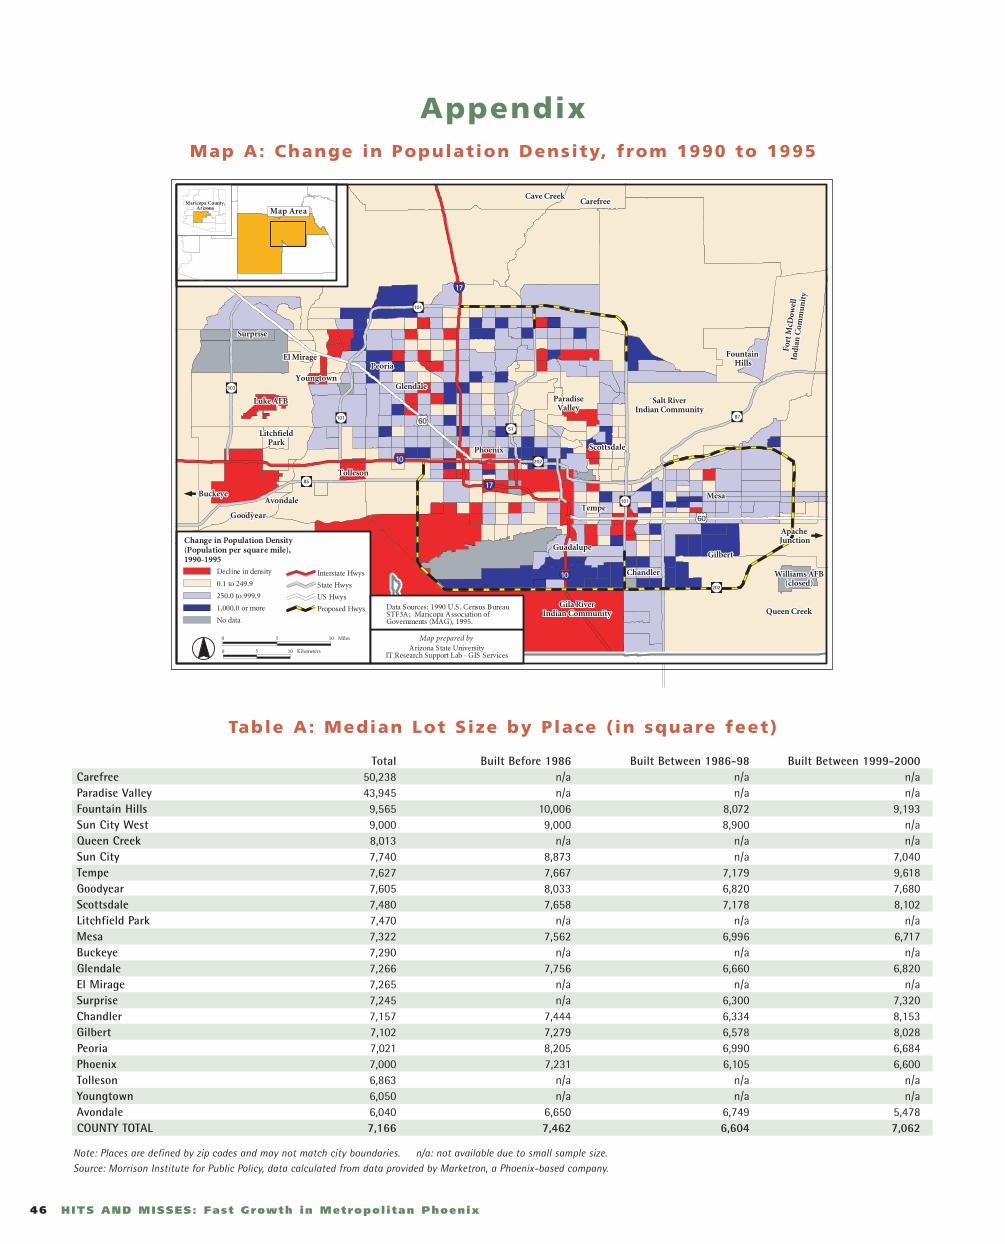
46 HITS AND MISSES: Fast Growth in Metropol i tan Phoenix
Appendix
Table A: Median Lot Size by Place ( in square feet)
Total Built Before 1986 Built Between 1986-98 Built Between 1999-2000Carefree 50,238 n/a n/a n/aParadise Valley 43,945 n/a n/a n/aFountain Hills 9,565 10,006 8,072 9,193Sun City West 9,000 9,000 8,900 n/aQueen Creek 8,013 n/a n/a n/aSun City 7,740 8,873 n/a 7,040Tempe 7,627 7,667 7,179 9,618Goodyear 7,605 8,033 6,820 7,680Scottsdale 7,480 7,658 7,178 8,102Litchfield Park 7,470 n/a n/a n/aMesa 7,322 7,562 6,996 6,717Buckeye 7,290 n/a n/a n/aGlendale 7,266 7,756 6,660 6,820El Mirage 7,265 n/a n/a n/aSurprise 7,245 n/a 6,300 7,320Chandler 7,157 7,444 6,334 8,153Gilbert 7,102 7,279 6,578 8,028Peoria 7,021 8,205 6,990 6,684Phoenix 7,000 7,231 6,105 6,600Tolleson 6,863 n/a n/a n/aYoungtown 6,050 n/a n/a n/aAvondale 6,040 6,650 6,749 5,478COUNTY TOTAL 7,166 7,462 6,604 7,062
Note: Places are defined by zip codes and may not match city boundaries. n/a: not available due to small sample size.Source: Morrison Institute for Public Policy, data calculated from data provided by Marketron, a Phoenix-based company.
Map A: Change in Population Density, from 1990 to 1995
Map prepared byArizona State University
IT Research Support Lab - GIS Services
Data Sources: 1990 U.S. Census BureauSTF3A; Maricopa Association ofGovernments (MAG), 1995.
Interstate Hwys
Proposed Hwys
State Hwys
US Hwys
0 5 10 Miles
0 5 10 Kilometers
Decline in density
0.1 to 249.9
250.0 to 999.9
1,000.0 or more
No data
Change in Population Density(Population per square mile), 1990-1995
Map AreaMaricopa County,
Arizona
303
85
101
10
60
101
17
202
51
17
60
101
202
87
10
Goodyear

47MORRISON INSTITUTE FOR PUBLIC POLICY
Figure B: Percent of Persons in Poverty in Metropolitan Phoenix, Eight Largest Cit ies , 1979 and 1989*
2%
1979 1989
* The latest data available.Source: Morrison Institute for Public Policy, data from U.S. Bureau of the Census.
Maricopa County
Tempe
Phoenix
Glendale
Chandler
Mesa
Peoria
Scottsdale
Gilbert
0% 4% 6% 8% 10% 12% 14% 16%
PERCENT OF PERSONS IN POVERTY
10.5%
10.9%
11.1%
9%
13%
8.5%
11.2%
5.6%
9.5%
12.3%
13.6%
14.2%
11.5%
9.7%
9.5%
7.9%
5.9%
6.2%
Table B:
2 Miles: Both population and employment are low because of the Salt River and the flightpath west of Sky Harbor.
3 Miles: Population is very low because of th Salt River and Sky Harbor Airport. The adverseeffect on employment, however, is offset by the Grand Avenue employment sub-center, the East Washington/Airport subcenter, and the county's Durango complex.
4, 5 and 6 Miles: Both population and employment are near trend as no significant abnormalitiesexist.
7 and 8 Miles: Both population and employment are below trend because of the considerable landarea in parks and mountain preserves: South Mountain, Papago Park, and the edgeof the Phoenix Mountains preserve.
9 and 10 Miles: ASU has a positive effect on employment and population, offsetting the lessenedeffect of the parks and preserves.
11 Miles: Until 11 miles out, at least one employment subcenter has been present. Employmentis below trend because of the absence of any subcenter.
12 and 13 Miles: The Gila River and Salt River Indian Reservations considerably reduce populationand employment, though the effect on employment is somewhat muted, probablydue to a combination of minor factors.
14 and 15 Miles: While the reservations continue to exert a depressing effect, the SuperstitionFreeway and Downtown Mesa subcenters offset this for both population andemployment.Employment Density Population Density
Employment to Population Ratio
0
14,000
NU
MBE
R O
F PE
OPL
E PE
R SQ
UA
RE M
ILE
0
0.5
1
1.5
2
2.5
EMPLO
YMEN
T TO PO
PULA
TION
RATIO
3
2
DISTANCE FROM DOWNTOWN PHOENIX IN MILES
4,000
6,000
10,000
12,000
8,000
2,000
3 2524232221201 4 5 6 7 8 9 10 11 12 13 14 15 16 17 18 19
Population Density and Employment Density Vary with Distance from Downtown Phoenix
Figure A:
Note: Distance is measured from Washington Street and Central Avenue; Employment to Population Ratio = Employment Density divided by Population Density. Employment data based on place of work. Source: Morrison Institute for Public Policy, data from Maricopa Association of Governments.

48 HITS AND MISSES: Fast Growth in Metropol i tan Phoenix
Table D: Population by Race and Ethnicityin Metropolitan Phoenix, 1980 to 1995
Percent Hispanic andTotal Population White Population* Hispanic Population** African-American Population* African-American
CITY 1980 1990 1995 1980 1990 1995 1980 1990 1995 1980 1990 1995 1980 1990 1995
Apache Junction 9,935 18,092 19,666 9,492 16,847 354 1,066 8 20 4% 6%
Avondale 8,168 17,595 22,771 3,738 6,864 8,994 3,758 8,287 12,252 514 685 927 52% 51% 58%
Buckeye 3,434 4,436 4,857 2,440 3,296 2,773 660 1,391 1,820 258 166 172 27% 35% 41%
Carefree 964 1,660 2,286 2,199 45 3 0% 2%
Cave Creek 1,518 2,394 3,076 2,771 2,759 151 288 – 2 0% 6% 9%
Chandler 29,673 89,862 132,360 21,968 69,826 96,976 6,094 15,473 25,609 845 2,326 3,611 23% 20% 22%
El Mirage 4,307 5,001 5,741 639 917 921 3,441 3,952 4,598 221 80 136 85% 81% 82%
Fountain Hills 10,030 14,146 2,713 9,481 13,478 25 314 376 – 103 72 4% 3%
Gila Bend 1,585 1,747 1,724 4,725 670 869 33 0% 0% 52%
Gilbert 5,717 29,149 59,338 2,291 24,753 49,366 945 3,329 6,669 – 418 1,092 17% 13% 13%
Glendale 97,172 147,070 182,615 81,051 117,180 131,223 12,450 22,162 36,093 1,911 4,252 7,658 15% 18% 24%
Goodyear 2,747 6,258 9,250 2,291 4,032 6,103 249 1,550 2,271 155 431 593 15% 32% 31%
Guadalupe 4,506 5,458 5,369 8 67 59 3,793 3,950 3,961 – 7 36 84% 72% 74%
Litchfield Park 3,303 3,739 3,428 3,159 3,345 173 85 182 – 23 21 3% 5%
Mesa 152,404 289,199 338,117 134,317 245,696 266,769 13,890 30,549 52,273 1,834 5,117 7,675 10% 12% 18%
Paradise Valley 11,085 11,903 12,448 10,870 11,211 11,778 177 286 315 13 10 81 2% 2% 3%
Peoria 12,171 51,080 74,565 8,403 41,038 59,181 3,377 7,693 11,686 90 942 1,698 28% 17% 18%
Phoenix 789,704 988,015 1,149,417 616,649 707,500 741,453 116,875 194,118 303,084 36,912 49,717 56,992 19% 25% 31%
Queen Creek 2,667 3,072 1,528 1,844 891 1,084 21 87 34% 38%
Scottsdale 88,622 130,099 168,176 84,104 120,667 152,501 2,918 6,265 9,771 231 101 1,505 4% 5% 7%
Surprise 3,723 7,122 10,737 1,003 2,871 5,544 2,651 4,093 4,938 64 119 143 73% 59% 47%
Tempe 106,919 141,993 153,821 93,974 114,700 115,207 8,851 14,994 22,577 1,605 4,424 5,009 10% 14% 18%
Tolleson 4,433 4,436 4,261 1,332 1,037 828 3,025 3,393 3,329 55 4 16 69% 77% 79%
Wickenburg 3,535 4,515 4,765 3,377 4,165 4,190 122 261 490 – 13 15 3% 6% 11%
Youngtown 2,254 2,542 2,694 2,356 2,500 160 151 17 18 0% 7% 6%
MARICOPA COUNTY*** 1,509,175 2,122,101 2,551,765 1,226,362 1,641,319 1,834,847 199,517 340,117 522,487 46,747 71,896 88,923 16% 19% 24%
* Not of Hispanic origin.** Hispanic origin of any race.*** Apache Junction is not included in Maricopa County; the Census race and ethnicity calculations are based on a sample rather than 100% count for 1980 and 1990.Source: Morrison Institute for Public Policy, data from U.S. Bureau of the Census, 1980 and 1990; Maricopa Association of Governments, 1995 Special Census, except for Apache Junction whose1995 Total Population data comes from Census Bureau estimates released June, 1999. 1995 race and ethnicity data is only available for the part of Apache Junction that is in Maricopa County,and therefore is not comparable to the other cities on the table.
Table C: Location of High and Extreme Poverty Clusters in Metropolitan Phoenix, 1989
Number of High Poverty Number of Extreme Poverty Median Percentage Point Change Median Percentage Point ChangeCensus Tracts* Census Tracts** in Poverty Rate, 1969-1979 in Poverty Rate, 1979-1989
Salt River to McDowell 8 15 4 11South of the River 11 3 5 12East Van Buren 3 3 6Northwest 8 4 15Northeast 4 3 11
Total for Central-South Phoenix 34 18 3 9
Downtown Chandler 3 n/a n/aMesa 4 n/a 5Downtown Tempe 3 2 10 8Guadalupe 0 1 -10 -1North Phoenix 3 1 12Downtown Glendale 4 3 11El Mirage - Surprise 4 1 -1 -1Avondale - Goodyear 7 -2 2Western Maricopa County 3 -10 6Indian Reservations 1 1 -26 16TOTAL 66 23
* High Poverty is defined as between 20% and 39% of residents living in households earning less than the poverty level.** Extreme Poverty is defined as at least 40% of residents living in households earning less than the poverty level.Source: Morrison Institute for Public Policy, data from U.S. Bureau of the Census.
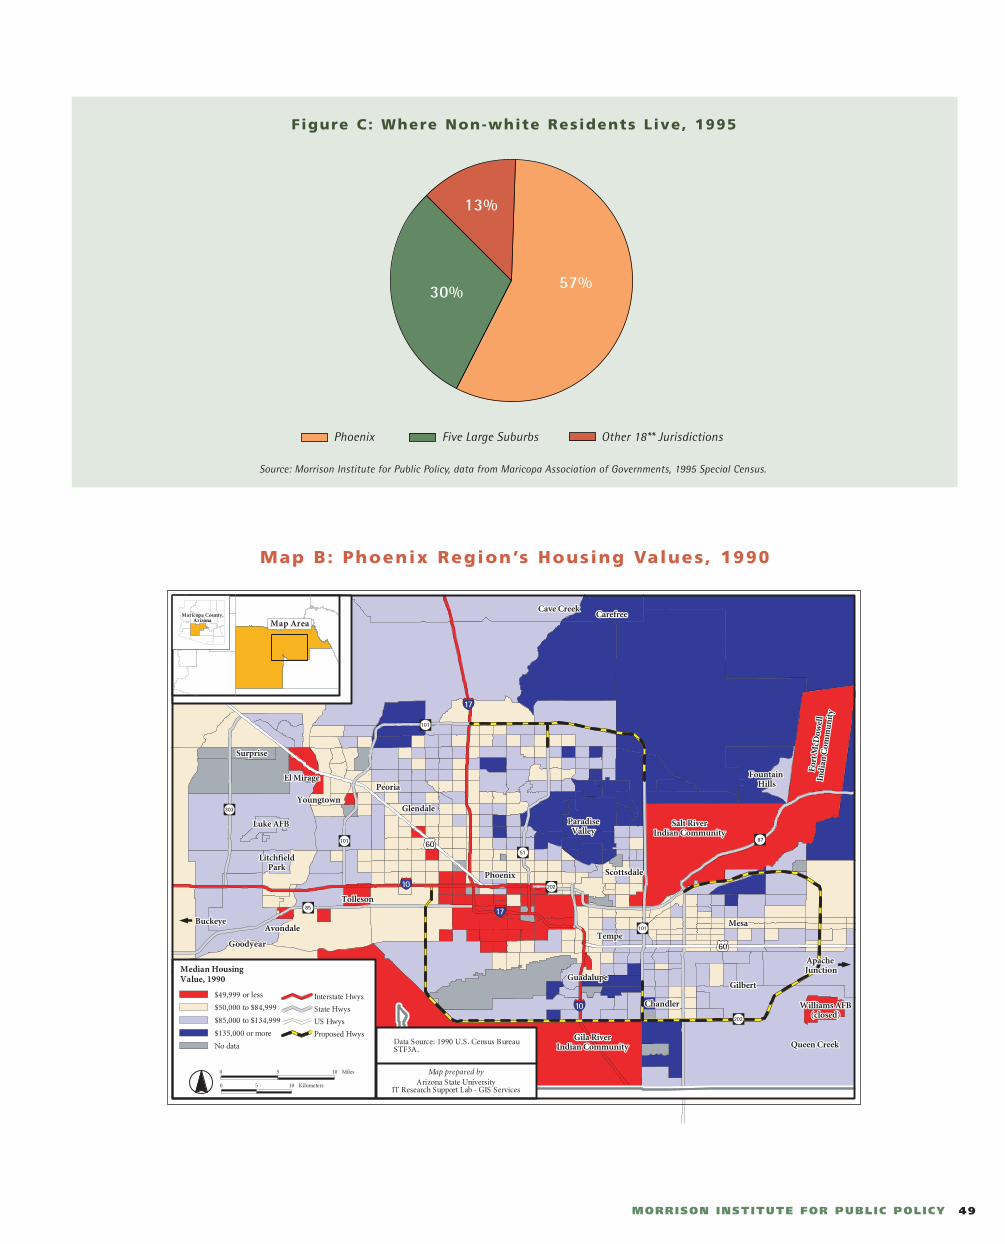
Interstate Hwys
Proposed Hwys
State Hwys
US Hwys
0 5 10 Miles
0 5 10 Kilometers
Map prepared byArizona State University
IT Research Support Lab - GIS Services
Data Source: 1990 U.S. Census BureauSTF3A.
$49,999 or less
$50,000 to $84,999
$85,000 to $134,999
$135,000 or more
No data
Median HousingValue, 1990
Map Area
303
85
101
10
60
101
17
202
51
17
60
101
202
87
10
Maricopa County,Arizona
Goodyear
Map B: Phoenix Region’s Housing Values, 1990
49MORRISON INSTITUTE FOR PUBLIC POLICY
Figure C: Where Non-white Residents Live, 1995
Source: Morrison Institute for Public Policy, data from Maricopa Association of Governments, 1995 Special Census.
Phoenix Five Large Suburbs Other 18** Jurisdictions
57%30%
13%
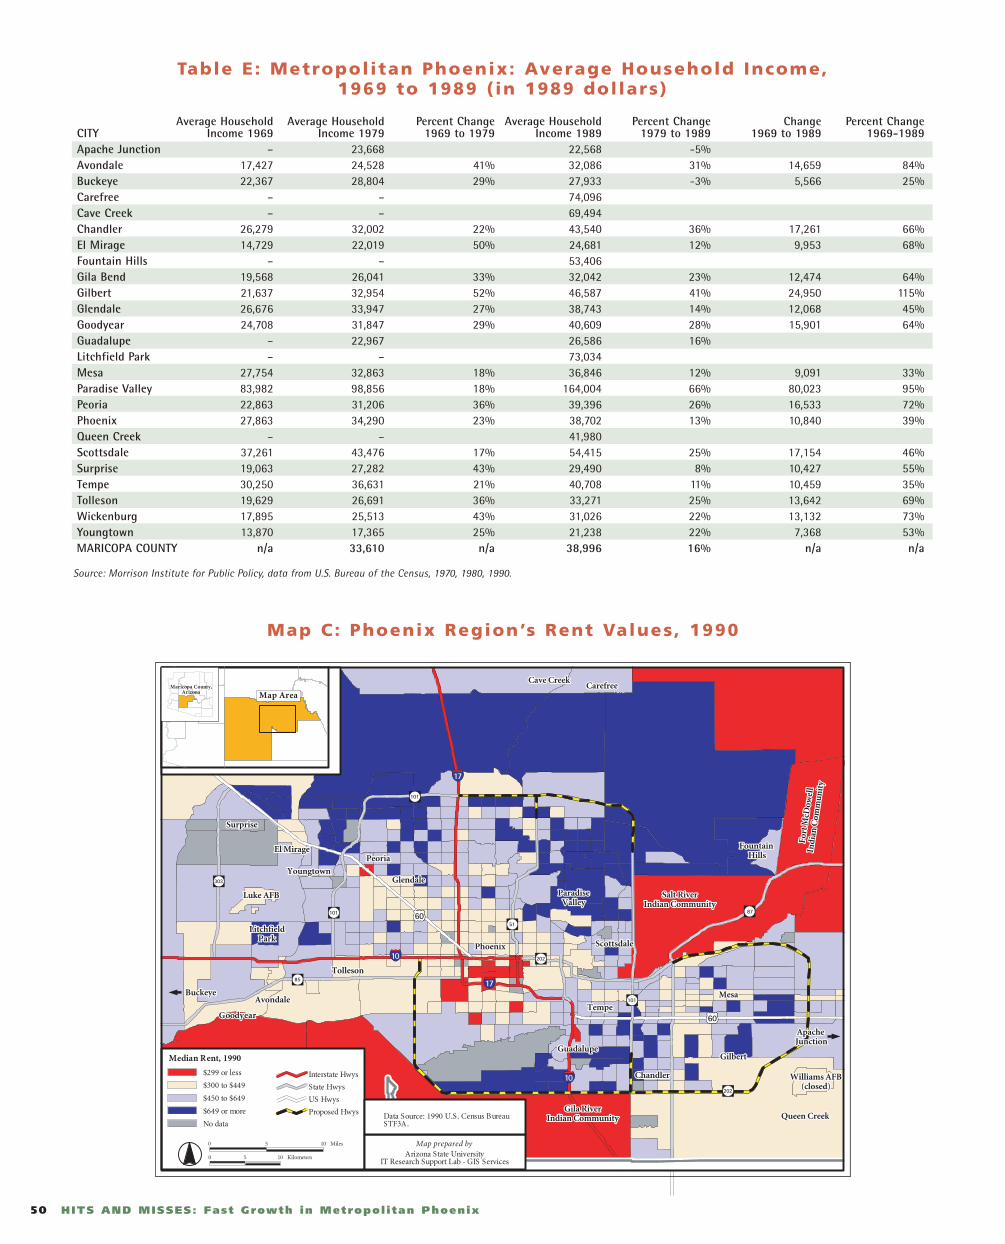
50 HITS AND MISSES: Fast Growth in Metropol i tan Phoenix
Map C: Phoenix Region’s Rent Values, 1990
Interstate Hwys
Proposed Hwys
State Hwys
US Hwys
0 5 10 Miles
0 5 10 Kilometers
Map prepared byArizona State University
IT Research Support Lab - GIS Services
$299 or less
$300 to $449
$450 to $649
$649 or more
No data
Median Rent, 1990
Data Source: 1990 U.S. Census BureauSTF3A.
Map AreaMaricopa County,
Arizona
303
85
101
10
60
101
17
202
51
17
60
101
202
87
10
Goodyear
Table E: Metropolitan Phoenix: Average Household Income, 1969 to 1989 ( in 1989 dol lars)
Average Household Average Household Percent Change Average Household Percent Change Change Percent ChangeCITY Income 1969 Income 1979 1969 to 1979 Income 1989 1979 to 1989 1969 to 1989 1969-1989Apache Junction – 23,668 22,568 -5%Avondale 17,427 24,528 41% 32,086 31% 14,659 84%Buckeye 22,367 28,804 29% 27,933 -3% 5,566 25%Carefree – – 74,096Cave Creek – – 69,494Chandler 26,279 32,002 22% 43,540 36% 17,261 66%El Mirage 14,729 22,019 50% 24,681 12% 9,953 68%Fountain Hills – – 53,406Gila Bend 19,568 26,041 33% 32,042 23% 12,474 64%Gilbert 21,637 32,954 52% 46,587 41% 24,950 115%Glendale 26,676 33,947 27% 38,743 14% 12,068 45%Goodyear 24,708 31,847 29% 40,609 28% 15,901 64%Guadalupe – 22,967 26,586 16%Litchfield Park – – 73,034 Mesa 27,754 32,863 18% 36,846 12% 9,091 33%Paradise Valley 83,982 98,856 18% 164,004 66% 80,023 95%Peoria 22,863 31,206 36% 39,396 26% 16,533 72%Phoenix 27,863 34,290 23% 38,702 13% 10,840 39%Queen Creek – – 41,980Scottsdale 37,261 43,476 17% 54,415 25% 17,154 46%Surprise 19,063 27,282 43% 29,490 8% 10,427 55%Tempe 30,250 36,631 21% 40,708 11% 10,459 35%Tolleson 19,629 26,691 36% 33,271 25% 13,642 69%Wickenburg 17,895 25,513 43% 31,026 22% 13,132 73%Youngtown 13,870 17,365 25% 21,238 22% 7,368 53%MARICOPA COUNTY n/a 33,610 n/a 38,996 16% n/a n/a
Source: Morrison Institute for Public Policy, data from U.S. Bureau of the Census, 1970, 1980, 1990.
The Honorable Betsey BaylessSecretary of StateState of Arizona
Mr. Drew BrownManaging Director and President
DMB Associates, Inc.
Mr. Robert BullaPresident and CEO
Blue Cross & Blue Shield of Arizona
Mr. Jon CampbellPresident and CEOWells Fargo Bank
Dr. Jeffrey ChapmanDirector
School of Public Affairs, ASU
Mr. Jack DeBolskeFormer Executive Director
Arizona League of Cities and Towns
Mr. Mark DeMicheleChief Executive Officer
Urban Realty Partners, LLC
Dr. Catherine EdenDirector
Arizona Department of Health Services
Mr. Ed FoxVice President, Environmental, Health,
Safety, and New Technology Ventures, APS
Mr. Grady GammageAttorney
Gammage & Burnham
Mr. Chris HerstamGovernment Relations Director
Lewis and Roca
The Honorable Jane Dee HullGovernor
State of Arizona
Mr. Alfredo GutierrezPresident
Jamieson and Gutierrez
Mr. Rick LavisExecutive Vice President
Arizona Cotton Growers Association
Ms. Cathy McKeeCorporate Vice President of Strategic
Business Services, Motorola SSTG
Mr. Richard MorrisonAttorney
Salmon, Lewis, & Weldon
Ms. Kathryn Munro
Mr. John OppedahlPublisher & CEO
Phoenix Newspapers, Inc.
Mr. Allan PriceVice President
Institutional Advancement, ASU
Mr. Gary Richardson
Dr. Anne SchneiderDean
College of Public Programs, ASU
Mr. Dick SilvermanGeneral ManagerSalt River Project
Dr. Martin VanacourCity Manager
City of Glendale
Morrison Institute for Public Policy conducts research which informs, advises, and assists Arizonans. A part of the Schoolof Public Affairs (College of Public Programs) at Arizona State University, the Institute is a bridge between the universityand the community. Through a variety of publications and forums, Morrison Institute shares research results with and providesservices to public officials, private sector leaders, and community members who shape public policy. A non-partisan advisoryboard of leading Arizona business people, scholars, public officials, and public policy experts assists Morrison Institute withits work. Morrison Institute was established in 1981 through a grant from Marvin and June Morrison of Gilbert, Arizonaand is supported by private and public funds and contract research.
Morrison Inst itute for Publ ic Pol icyBoard of Advisors

Morrison Institute for Public Policy
School of Public Affairs | College of Public Programs | Arizona State University
P.O. Box 874405, Tempe Arizona 85287-4405 Voice (480) 965-4525 Fax (480) 965-9219 http://www.asu.edu/copp/morrison
Related Documents