Historic range of variability in geomorphic processes as a context for restoration: Rocky Mountain National Park, Colorado, USA Zan Rubin, * Sara L. Rathburn, Ellen Wohl and Dennis L. Harry Department of Geosciences, Colorado State University, Fort Collins, CO, USA Received 12 May 2011; Revised 4 October 2011; Accepted 10 October 2011 *Correspondence to: Zan Rubin, University of California, Berkeley, Ca, USA. E-mail: [email protected] ABSTRACT: Evaluation of historic range of variability (HRV) is an effective tool for determining baseline conditions and providing context to researchers and land managers seeking to understand and enhance ecological function. Incorporating HRV into restoration planning acknowledges the dynamic quality of landscapes by allowing variability and disturbance at reasonable levels and permitting riverine landscapes to adapt to the physical processes of their watersheds. HRV analysis therefore represents a practical (though under-utilized) method for quantifying process-based restoration goals. We investigated HRV of aggradational processes in the subalpine Lulu City wetland in Rocky Mountain National Park to understand the impacts of two centuries of altered land use and to guide restoration planning following a human-caused debris flow in 2003 that deposited up to 1m of sand and gravel in the wetland. Historic aerial photograph interpretation, ground penetrating radar surveys, and trenching, coring, and radiocarbon dating of valley-bottom sediments were used to map sediment deposits, quantify aggradation rates, and identify processes (in-channel and overbank fluvial deposition, direct hillslope input, beaver pond filling, peat accumulation) creating alluvial fill within the wetland. Results indicate (i) the Lulu City wetland has been aggrading for several millennia, (ii) the aggradation rate of the past one to two centuries is approximately six times higher than long-term pre-settlement averages, (iii) during geomorphically active periods, short-term aggradation rates during the pre-settlement period were probably much higher than the long-term average rate, and (iv) the processes of aggradation during the last two centuries are the same as historic processes of aggradation. Understanding the HRVof aggradation rates and processes can constrain management and restoration scenarios by quantifying the range of disturbance from which a landscape can recover without active restoration. Copyright © 2011 John Wiley & Sons, Ltd. KEYWORDS: historic range of variability; restoration; aggradation; debris flow; Colorado River Introduction The physical and biological forms and processes of landscapes vary spatially and temporally and are increasingly altered by human activities. Historic range of variability (HRV) has been investigated as a potential tool for envisioning baseline condi- tions and providing context to researchers and land managers seeking to understand, enhance, or preserve ecological integrity (Landres et al., 1999; Keane et al., 2009). HRV is defined herein as the magnitude, frequency, and/or duration of specific processes such as fire or debris flows prior to intensive human impacts. Understanding HRV facilitates ‘process-based’ restoration, a con- ceptual framework supported by a growing number of restoration practitioners and scholars (Wohl et al., 2005; Kondolf et al., 2006), that seeks to re-establish the functions and trajectory of watershed processes and the habitat structure and variation to which native species are adapted. Process-based restoration is a pragmatic way of targeting the varied (and commonly unknown) habitat needs of all native species by recovering the physical functions that successfully supported these species. Incorporating HRV into restoration planning acknowledges the dynamic quality of landscapes by accommodating and managing for variability and disturbance within the range of historic levels and thus allows riverine landscapes to create desired habitats through adaptation to the physical processes of their watersheds. The dis- cussion herein follows the broad definition of disturbance offered by Pickett and White (1985) and Lake (2000), as an event when disrupting forces are applied to habitat space occupied by a pop- ulation, community, or ecosystem. Our interest is not specifically in how disturbances such as floods or debris flows relate to non- disturbance conditions, but in how the magnitude and frequency of a disturbance regime may change with human alteration. Disturbances are important processes that drive habitat het- erogeneity and encourage species diversity by accommodating both colonizing and resident species at the scale of the dis- turbed site and also at a larger landscape scale that includes undisturbed patches (Connell, 1978; Reice et al., 1990). Com- monly, post-disturbance colonization is rapid, with most riverine studies showing recovery of species richness and abun- dance within 3 years except in instances of persistent alteration to physical habitat (Yount and Niemi, 1990; Detenbeck et al., 1992). Illustrating the regenerative aspects of disturbance, maximum species richness has been found in the first two decades following a flood (Friedman et al., 1996). EARTH SURFACE PROCESSES AND LANDFORMS Earth Surf. Process. Landforms 37, 209–222 (2012) Copyright © 2011 John Wiley & Sons, Ltd. Published online 21 November 2011 in Wiley Online Library (wileyonlinelibrary.com) DOI: 10.1002/esp.2249

Welcome message from author
This document is posted to help you gain knowledge. Please leave a comment to let me know what you think about it! Share it to your friends and learn new things together.
Transcript
EARTH SURFACE PROCESSES AND LANDFORMSEarth Surf. Process. Landforms 37, 209–222 (2012)Copyright © 2011 John Wiley & Sons, Ltd.Published online 21 November 2011 in Wiley Online Library(wileyonlinelibrary.com) DOI: 10.1002/esp.2249
Historic range of variability in geomorphicprocesses as a context for restoration: RockyMountain National Park, Colorado, USAZan Rubin,* Sara L. Rathburn, Ellen Wohl and Dennis L. HarryDepartment of Geosciences, Colorado State University, Fort Collins, CO, USA
Received 12 May 2011; Revised 4 October 2011; Accepted 10 October 2011
*Correspondence to: Zan Rubin, University of California, Berkeley, Ca, USA. E-mail: [email protected]
ABSTRACT: Evaluation of historic range of variability (HRV) is an effective tool for determining baseline conditions and providingcontext to researchers and land managers seeking to understand and enhance ecological function. Incorporating HRV into restorationplanning acknowledges the dynamic quality of landscapes by allowing variability and disturbance at reasonable levels and permittingriverine landscapes to adapt to the physical processes of their watersheds. HRV analysis therefore represents a practical (thoughunder-utilized) method for quantifying process-based restoration goals. We investigated HRV of aggradational processes in thesubalpine Lulu City wetland in Rocky Mountain National Park to understand the impacts of two centuries of altered land useand to guide restoration planning following a human-caused debris flow in 2003 that deposited up to 1m of sand and gravel in thewetland. Historic aerial photograph interpretation, ground penetrating radar surveys, and trenching, coring, and radiocarbon datingof valley-bottom sediments were used to map sediment deposits, quantify aggradation rates, and identify processes (in-channel andoverbank fluvial deposition, direct hillslope input, beaver pond filling, peat accumulation) creating alluvial fill within the wetland.Results indicate (i) the Lulu City wetland has been aggrading for several millennia, (ii) the aggradation rate of the past one to twocenturies is approximately six times higher than long-term pre-settlement averages, (iii) during geomorphically active periods, short-termaggradation rates during the pre-settlement period were probably much higher than the long-term average rate, and (iv) the processes ofaggradation during the last two centuries are the same as historic processes of aggradation. Understanding the HRVof aggradation ratesand processes can constrain management and restoration scenarios by quantifying the range of disturbance from which a landscape canrecover without active restoration. Copyright © 2011 John Wiley & Sons, Ltd.
KEYWORDS: historic range of variability; restoration; aggradation; debris flow; Colorado River
Introduction
The physical and biological forms and processes of landscapesvary spatially and temporally and are increasingly altered byhuman activities. Historic range of variability (HRV) has beeninvestigated as a potential tool for envisioning baseline condi-tions and providing context to researchers and land managersseeking to understand, enhance, or preserve ecological integrity(Landres et al., 1999; Keane et al., 2009). HRV is defined herein asthe magnitude, frequency, and/or duration of specific processessuch as fire or debris flows prior to intensive human impacts.Understanding HRV facilitates ‘process-based’ restoration, a con-ceptual framework supported by a growing number of restorationpractitioners and scholars (Wohl et al., 2005; Kondolf et al.,2006), that seeks to re-establish the functions and trajectory ofwatershed processes and the habitat structure and variation towhich native species are adapted. Process-based restoration is apragmatic way of targeting the varied (and commonly unknown)habitat needs of all native species by recovering the physicalfunctions that successfully supported these species. IncorporatingHRV into restoration planning acknowledges the dynamic qualityof landscapes by accommodating and managing for variability
and disturbance within the range of historic levels and thusallows riverine landscapes to create desired habitats throughadaptation to the physical processes of their watersheds. The dis-cussion herein follows the broad definition of disturbance offeredby Pickett and White (1985) and Lake (2000), as an event whendisrupting forces are applied to habitat space occupied by a pop-ulation, community, or ecosystem. Our interest is not specificallyin how disturbances such as floods or debris flows relate to non-disturbance conditions, but in how the magnitude and frequencyof a disturbance regime may change with human alteration.
Disturbances are important processes that drive habitat het-erogeneity and encourage species diversity by accommodatingboth colonizing and resident species at the scale of the dis-turbed site and also at a larger landscape scale that includesundisturbed patches (Connell, 1978; Reice et al., 1990). Com-monly, post-disturbance colonization is rapid, with mostriverine studies showing recovery of species richness and abun-dance within 3 years except in instances of persistent alterationto physical habitat (Yount and Niemi, 1990; Detenbeck et al.,1992). Illustrating the regenerative aspects of disturbance,maximum species richness has been found in the first twodecades following a flood (Friedman et al., 1996).
210 Z. RUBIN ET AL.
Process-based restoration relies upon understanding whatthe natural forms and functions of a watershed were and canbe, given imposed climatological, ecological, geological, andland-use constraints. Failure to appropriately assess HRV of asystem, or to appropriately define contemporary physicaldynamics, has resulted in several well documented restorationfailures such as Uvas Creek in California, USA, where restora-tion activities attempted to impose a meandering planform ina location where watershed history suggested a system thatwas historically braided in response to disturbance (Kondolf,2006). Innumerable other restoration projects have not achievedany broad ecological benefit because restoration attempted toimpose forms that were inappropriate or unsustainable givenpresent climate, land-use, and watershed conditions (Wohlet al., 2005). Process-based restoration is particularly impor-tant for watersheds such as the one discussed in this paper,which is subject to relatively frequent intense disturbancesin the form of debris flows. As in the Uvas Creek example,attempts to ‘permanently’ impose a form that represents onlyone variant of a continually changing process-form continuumare unlikely to succeed.HRV in river systems can be (1) extrapolated from theoretical
or empirical models (either conceptual or quantitative) ofprocess–form interactions in general, (2) based on historicalrecords from the study site, or (3) extrapolated from nearby, lessimpacted, reference sites. Because no single method compre-hensively describes historical conditions, a combination ofapproaches should be used when possible. Aerial photos,discharge and sediment gage records, specific gage analysis,surveys, and dating modern deposits with dendrochronologyare the most common methods to provide a historical contextfor restoration (Soar and Thorne, 2000; Watson et al., 2007).Typically, the aforementioned methods are capable of catego-rizing impacts to channel form and process for a time-scale onthe order of 101 years. Given the short time-periods coveredby ‘historical’ investigations, restoration targets commonlyseek to emulate pre-disturbance or reference forms. However,periods that are long enough to include several major dis-turbance events, typically 102 to 103 years, are probably nec-essary to categorize the dynamic nature of landscapes (Turner
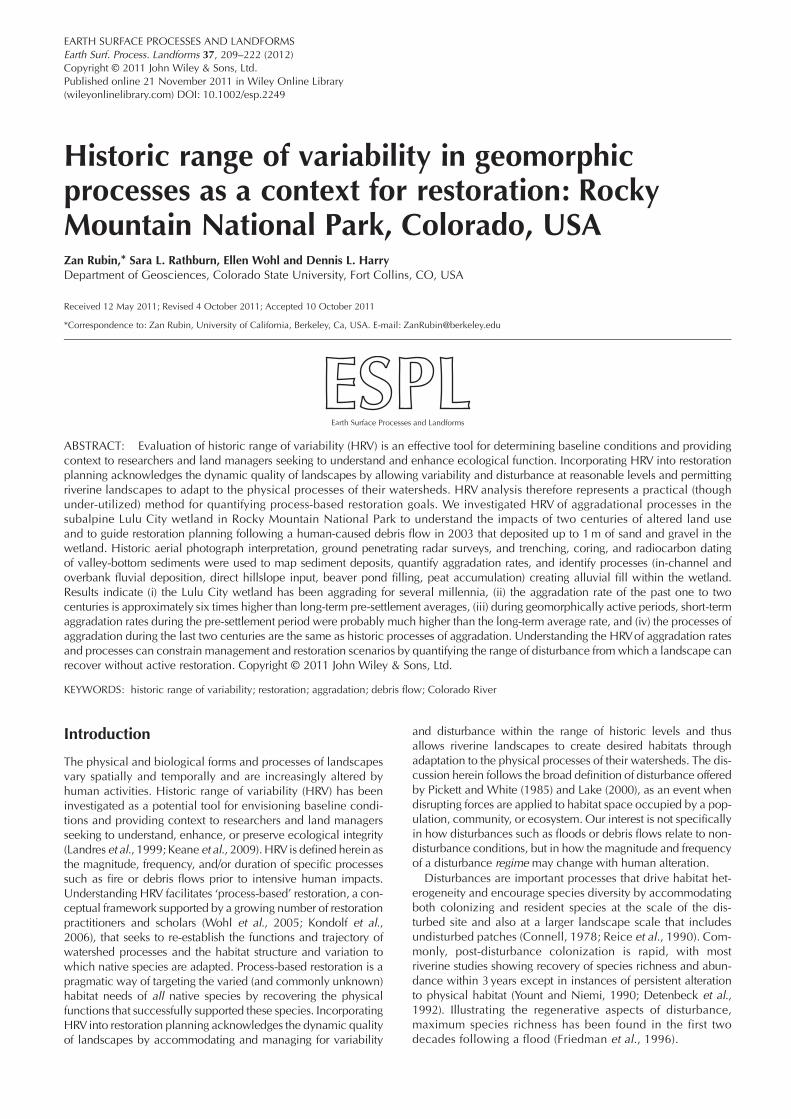
Figure 1. The project area is the upper Colorado River in Northern Coloradoindicate direction of water flow. Tributaries that flow into the Colorado Riverpointing white arrow).
Copyright © 2011 John Wiley & Sons, Ltd.
et al., 1993). By acknowledging a range of historic forms andprocesses, we gain insight into the potential for passive resto-ration, and when active restoration can be applied effectively.
This research investigated the HRV of a subalpine valley byanalyzing stratigraphic records to quantify aggradation ratesand processes of sediment delivery before and after Europeansettlement of the region in the mid-19th century. To investigateHRVover a time scale of 102 to 103 years, we conducted anal-ysis of aerial photography, ground penetrating radar surveys,radiocarbon dating, and sediment descriptions via trenchingand coring. In May 2003, a breach in the Grand Ditch initiateda debris flow in Rocky Mountain National Park that transported~36,000m3 of sediment into the Upper Colorado River anddeposited up to 1m of sediment in the Lulu City wetland.Material deposited in the wetland was derived from both thehillslope and from eroded valley-bottom sediments. The NationalPark Service plans to restore channels, riparian areas, andwetlands impacted by the debris flow. Understanding HRVof disturbance regimes provides context for the 2003 debrisflow and restoration of the Lulu City wetland. Results wereused to assess the usefulness of active restoration.
Study Area
The study area is the headwaters of the Colorado River on thewest side of Rocky Mountain National Park, with particular fo-cus on the Lulu City wetland and the ~29km2 upstream(Figure 1). The elevation of the watershed ranges from ~2830mat the Lulu City wetland, to 3944m at Mount Richthofen. Thewatershed is bounded by the Never Summer Mountains on thewest, La Poudre Pass on the Continental Divide to the north,and the Front Range of the Rocky Mountains to the east. TheNever Summer Mountains consist primarily of Oligocene granite,and the Front Range is primarily Proterozoic biotite schist withsome Oligocene rhyolitic flows and tuff (Braddock and Cole,1990). Debris flows occur in the area as a result of steep slopesalong the main valley and are particularly prevalent in weath-ered zones of hydrothermally altered bedrock (Sanford, 2010).A debris fan from the eastern valley wall forms a constriction
on the west side of Rocky Mountain National Park, USA. White arrowsare diverted out of the basin to the north by the Grand Ditch (northward
Earth Surf. Process. Landforms, Vol. 37, 209–222 (2012)
211HISTORIC RANGE OF VARIABILITY AS A CONTEXT FOR RESTORATION
along the Colorado River valley, and may be the origin of theLulu City wetland (Figure 1).Pleistocene glaciers in the Colorado River Valley extended
south ~24 km from the Continental Divide to Grand Lake(Meierding, 1980) and thus completely covered the study area.Although little work has been done in the upper Colorado Rivervalley to define the chronology of glacial retreat, RichardMadole (US Geological Survey, pers. comm., 2009) suggestsan estimated age of 14 000 yr BP as the end of valley glaciationthroughout the Front Range in Northern Colorado.Holocene climate records have been reconstructed in the
Rockies through correlations with pollen (primarily sagebrush,grasses, birch, willow, spruce, fir, and pine). Post-glacial warm-ing occurred from ~14 000–11 000yr BP (Doerner, 2007). TheYounger Dryas cooling interrupted the warming from ~11000–10 000 yr BP, causing glaciers to advance and tree lineto shift downward by as much as 120m (Short, 1985; Doerner,2007). The middle Holocene Altithermal was categorized bywarmer and wetter conditions ~9000–4500yr BP (Elias, 1985;Fall, 1985, 1997). During the Neoglacial, cooler and drierconditions persisted from ~4000 to 2000 yr BP causinganother small-scale advance of alpine glaciers (Fall, 1997).The last 2000 years have been generally similar to themodern climate (Vierling, 1998). The Medieval Optimum(~1050–750 yr BP) is not identified in local climate recon-structions, but has been documented in North America andglobally as a warm period.The Colorado River at the Lulu City wetland is a 3rd-order
stream (Strahler, 1952). Channel slope in the wetland is~0.9%, while the Colorado River upstream has a slope of2–3% and pool–riffle sequences. Tributaries such as Lulu Creekare typically step-pool channels with slopes as high as 20%.Snowmelt dominates the annual hydrograph, with peaks typi-cally occurring in late May and early June. Over 80% of annualrunoff occurs during the melt period from May through July(Woods, 2000). Annual precipitation is estimated at 110 cm(Capesius and Stephens, 2010), with ~84% as snow at thenearby Lake Irene SNOTEL station (CO05J10S, elevation3260m) (Westbrook et al., 2006).Vegetation in wide portions of the valley bottom along the
upper Colorado River is a mix of riparian shrublands dominatedby willow (Salix monticola, S. geyeriana, S. drummondiana), drymeadows with Deschampsia cespitosa and Calamagrostiscanadensis, and peat-accumulating fens dominated bywillow (Salix planifolia) and Carex aquatilis. Hillslope vege-tation is dominated by Engelmann spruce (Picea engelmannii),lodgepole pine (Pinus contorta), and subalpine fir (Abieslasiocarpa) (Woods, 2000; Westbrook et al., 2006). Willowcommunities throughout Rocky Mountain National Parkhave been in drastic decline in recent decades, probably aresult of multiple stressors including browsing pressurefrom increased moose and elk populations (Hess, 1993;Kaczynski et al., 2010).
History of human impacts
The Grand Ditch water diversion (Figure 1) was constructed instages from 1890–1936 (Woods, 2000) to divert tributary runofffrom the Colorado basin over the Continental Divide to theCache la Poudre watershed. The diversion affects the ColoradoRiver by reducing flow volumes, shortening the duration ofelevated flows, and increasing fluctuations in discharge (Woods,2000; Rubin, 2010). Although the Grand Ditch captures runofffrom approximately the upper 50% of the watershed, peak runoffexceeds Grand Ditch capacity in most years, and peak flows onthe Colorado River are thus reduced by less than 50%.
Copyright © 2011 John Wiley & Sons, Ltd.
Receding limb flows driven by late-season snowmelt at highaltitude areas are almost completely captured by the GrandDitch, severely shortening and reducing the recession (Woods,2000; Rubin, 2010). The flow reduction changes sediment trans-port capacity and lowers the water table, which impact riparianplant communities (Woods and Cooper, 2005), benthic inverte-brate abundance (Clayton and Westbrook, 2008), and beaverthat are dependent on willow and other riparian vegetation.
The most visible effect of the Grand Ditch is the repeatedoccurrence of breaches or failures, and subsequent debris flowsthat increase sediment loads down Lulu Creek and adjacentchannels. Aerial photos dating back to 1937 show evidenceof Grand Ditch-initiated debris flows and gully erosion as wellas debris-flow deposits in the Lulu City wetland (Rathburnand Rubin, 2009) which suggest an elevated sediment anddisturbance regime that has persisted for at least 70 years. Inthe Lulu City wetland, the Ditch-related sediment inputschanged the meandering single thread channel (visible inthe 1937 air photo) to a bifurcated zone of deposition at thehead of the wetland. The most recent debris flow in 2003deposited up to ~1m of sand and gravel in the wetland.The investigation of HRV seeks to evaluate whether similarsediment inputs and planform changes occurred prior to the19th century.
Human impacts to the upper Colorado River basin follow apattern similar to many parts of the central Rocky Mountainsincluding water diversion, mining, beaver trapping, and vari-able affects on fire regime such as ignition and suppression(Wohl, 2001). Development of the ‘Lulu City’ mining town justupstream of the wetland occurred during the 1880 s. Lulu City,now a 1 hour walk from the nearest road, reached a populationof several hundred people during its brief existence (Buchholtz,1983). In addition to disrupting valley-bottom sediments forplacer mining, and associated downstream increases in sedi-ment yield, inhabitants of mining areas started fires and createdlocalized deforestation that probably destabilized hillslopesand increased sediment yields (Wohl, 2001).
When beaver are present along a river, their dams slow floodpeaks, increase the extent of overbank flooding and groundwaterrecharge (Westbrook et al., 2006) and retain sediment (Butler andMalanson, 2005; Westbrook et al., 2010). Beaver present in thevicinity of Lulu City were probably removed within the decadesimmediately preceding the existence of Lulu City (Wohl, 2001);any beaver colonizing the area following initial trapping in the1820 s were probably decimated during the brief occupancy ofLulu City. Beaver populations subsequently began to recover,but during the late 20th century a drastic decline in beaverpopulations throughout Rocky Mountain National Park reducedan estimated Colorado River Valley population from 600 beaversin 1940 to 5% of that amount (0 in the Lulu City wetland oranywhere upstream of the Colorado River Trailhead) by1999 (Packard, 1947; Mitchell et al., 1999). Some, if not most,of this decline may be associated with increasing elk andmoose populations and heavy grazing pressure (Hess, 1993)that reduce or eliminate woody riparian plants on whichbeaver, elk and moose feed, and which influence stream bankstability, overbank roughness, and sediment transport in channelsand overbank environments. Beaver populations prior toEuropean settlement and trapping were probably evenhigher than the 1940 levels, although specific estimates forthe Colorado River are not available (Seton, 1953; Wohl,2001; Westbrook et al., 2006). In aerial photos of Lulu Citywetland no new beaver-dammed ponds appear after 1969,although the resolution is poor in the earlier photos and theponds that are present may be several decades older than1969. The combined effect from two centuries of alterationhas probably been to increase sediment yields to the valley
Earth Surf. Process. Landforms, Vol. 37, 209–222 (2012)
212 Z. RUBIN ET AL.
bottom and to alter the manner in which sediment is trans-ported or retained by reducing flow volumes, removingbeaver, and altering valley-bottom vegetation.
Methods
Multiple methods were used to map sediment deposits, quantifyaggradation rates, and identify processes (in-channel and over-bank fluvial deposition, direct hillslope input, beaver pond filling,peat accumulation) creating alluvial fill within the Lulu Citywetland. Analyses included historic aerial photograph interpreta-tion, ground penetrating radar (GPR) surveys, and trenching,coring, and radiocarbon dating of valley-bottom sediment.
Aerial photo analysis
Aerial photographs of the Lulu City wetland were analyzed forevidence of debris flows, channel planform changes, channelmigration, and beaver ponds. The wetland area was definedas non-forested valley bottom, the extent of which has notchanged substantially since 1937. Imagery from 1937 (1: 23000), 1953 (1: 63 360), 1969 (1: 15 840), 1987 (1: 15 840),2001 (1: 4000), 2004 (digital image, resolution = 15 cm), and2009 (resolution =1m) cover the entire study area. The 1937and 1953 images are black and white while later images arein color. Photos were scanned, imported into ArcGIS v9.3,and rectified. Debris-flow deposits, channel locations, beaverponds, and vegetation changes in the wetland were interpretedby comparison with contemporary examples; i.e. modern bea-ver ponds and debris-flow deposits were identified in the fieldand in recent imagery, and similar features were recognizedin historical imagery. In the wetland, unvegetated alluvium isidentified as debris-flow deposits because in the low-gradientwetland, distinguished from fluvial deposits which are typicallythin deposits of fine sediment and unlikely to bury or removevegetation. Channel migration was assessed by tracing channelcenterlines in each image wherever dominant channels werepresent. Beaver ponds were identified from ponded water orbroad, unvegetated sections of channel upstream of a cross-channel obstruction (beaver dam). Temporal and spatial variationin vegetation was not distinguished because of the resolution ofthe aerial photos, although establishment of trees is discernableand noted. The short growing season at high elevation and theinherent obstacles to aerial photo interpretation suggest that treeswould probably have to be a decade or more in age before beingrecognized in photos.
Ground penetrating radar (GPR)
GPR has proven to be an efficient, non-invasive, and effectivemethod of imaging sedimentary deposits in a number of envir-onments including internal structures in sediment (Hugenholtzet al., 2007), peatlands (Jol, 2009), alluvial fill (Hickin et al.,2007), and wetlands (Bristow and Jol, 2003; Jol, 2009). GPRis a method in which a high-frequency electromagnetic pulseis transmitted into the ground and partially reflected back tothe surface from interfaces where there are changes in theelectromagnetic properties (dielectric permittivity) of the sub-surface materials. These reflections may identify contactsbetween deposits of different grain size, mineralogy, watercontent, organic content, and bedrock (Davis and Annan, 1989).A trial survey was conducted at the study site to test different
frequencies. Frequencies of 50, 100, and 200MHz were tested,with depths of penetration of approximately 8, 4, and 2m,
Copyright © 2011 John Wiley & Sons, Ltd.
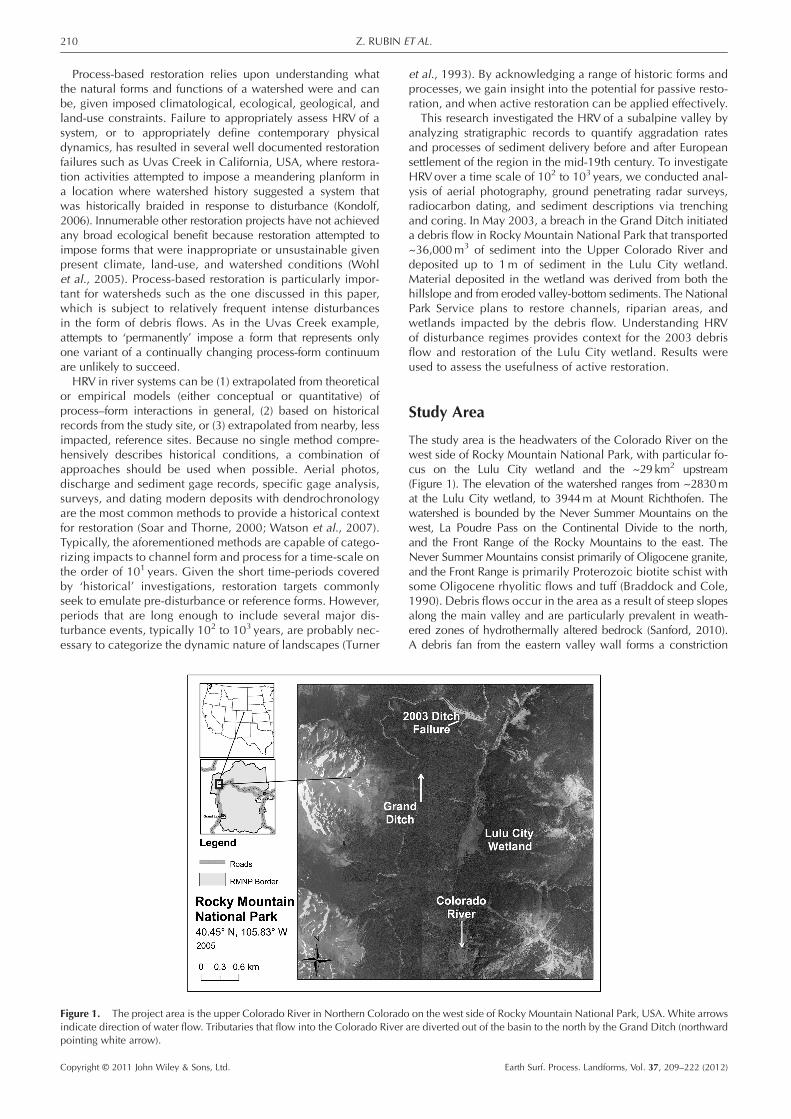
respectively. The 100MHz antennas were selected for thecomprehensive survey of the wetland, providing a balance ofpenetration and vertical resolution. The comprehensive reflec-tion-type survey in step mode was conducted during July2009 using a Sensors and Software PulseEkko 100 GPR system.Seven cross-sectional (perpendicular to the valley axis) trans-ects (identified as XS0, XS1, . . ., XS6) and two longitudinal(parallel to the valley axis) transects (identified as Long W andLong E) were surveyed with the 100MHz antennas (Figure 2).Three cross-sections (XS0, XS1, XS2), and the portion of LongW between XS0 and XS2 were further surveyed with the200MHz antennas to provide higher resolution of the near-surface deposits. In sum, ~3km of GPR surveys were conducted.
Antennas were oriented parallel to the direction of motionalong transects and spaced 1m apart, with a 25 cm spacingbetween radar traces along the profile. Common midpoint(CMP) surveys were conducted on cross-sections XS2 andXS4 (Figure 2) to measure radar velocities. Both CMP surveysyielded average radar velocities of ~0.05m/ns. This velocityis consistent with established rates for wet sand (Baker et al.,2007), a widespread sediment in the Lulu City wetland. A topo-graphic survey was conducted along the GPR transects using aTOP-CON Total Station. Points were surveyed at a spacing of~5m across the low gradient wetland, with additional pointssurveyed at breaks in slope. A topographic correction wasapplied to GPR transects so that reflections throughout thewetland were referenced to a fixed datum.
GPR penetration depths averaged ~4m, with a range from2–6m. Penetration was shallowest in coarse substrate (e.g.cross-sections XS0 and XS6) and deepest in fine deposits (e.g.XS3) (Figure 2). In general, GPR penetration depth is similarto the maximum depths reached with hand augers and thedepths of the oldest radiocarbon samples. Thus, GPR surveysgenerally represent the last 4000years; GPR interpretation wasverified laterally and vertically by auger cores and excavator pits.
GPR reflection patterns were initially interpreted using aradar facies analysis (Beres and Haeni, 1991) in which packagesof reflections were identified in the GPR data based on the spatialcontinuity, configuration, amplitude, and frequency of the re-flections. Those packages were traced and compared with soildescriptions from the cores and pits. The interpretation of radarimages was then iteratively adjusted as needed so that the catego-rization of radar-facies was in agreement with soil observations. Inmost cases, the resolution of the GPR did not allow individualbeds to be distinguished. An approach was therefore taken tobroadly categorize depositional regimes. Depositional environ-ments were grouped into higher energy (debris flow, overbank,and in-channel fluvial) and lower energy (peat, beaver pond fill,and overbank) process regimes. Overbank deposits are includedin both low-energy and high-energy divisions. This was necessarybecause overbank deposits are interbedded throughout bothregimes. Thus, low-energy deposits are regimes that fluctuatedbetween peat, pond accumulation, and received overbank depos-its, whereas the high-energy division received coarse (gravel andlarger) fluvial and colluvial deposits, but also received finer over-bank deposition. This division proved useful for the broad charac-terization of aggradational processes over thousands of years.
Sediment descriptions and inferred aggradationalprocesses
Sediment descriptions from 15 hand-augered and 19 excavator-dug soil pits were used to verify GPR interpretation and quantifydepositional processes (Figure 2). Hand-augered holes were dugwith an 8.3 cm diameter, bucket-type auger. The maximumdepth was 3.5m, and depths typically ranged from 1–3m. The
Earth Surf. Process. Landforms, Vol. 37, 209–222 (2012)
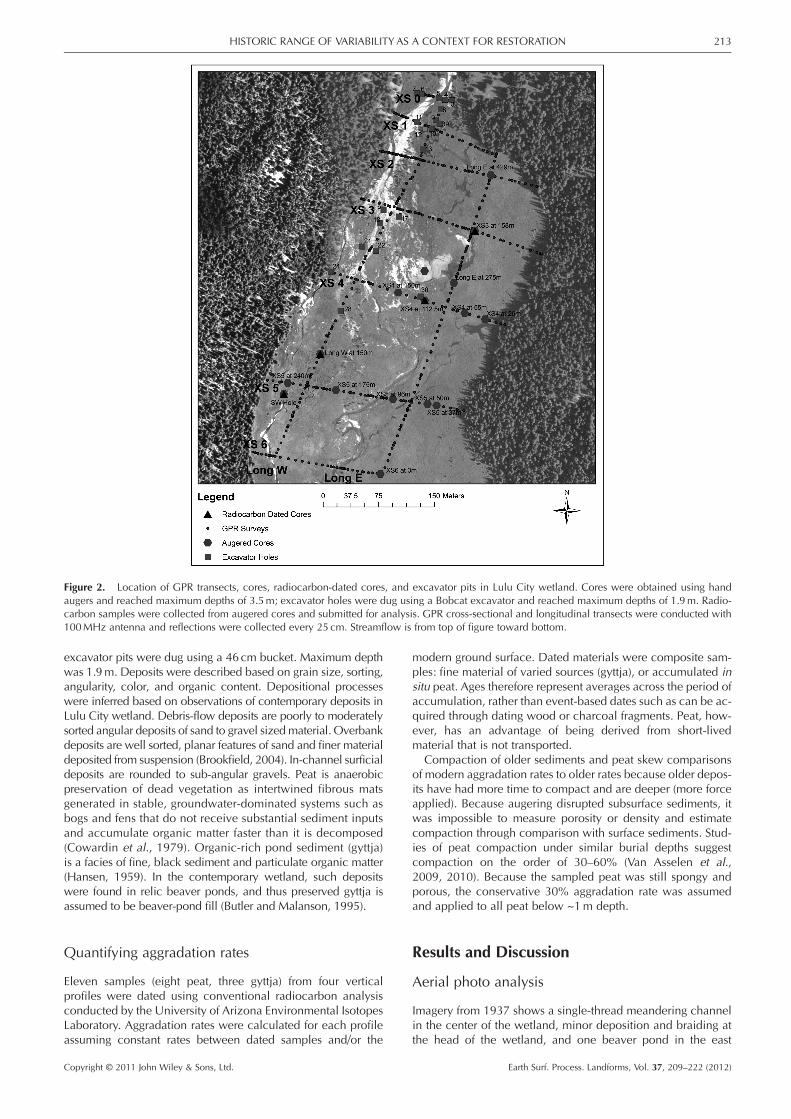
Figure 2. Location of GPR transects, cores, radiocarbon-dated cores, and excavator pits in Lulu City wetland. Cores were obtained using handaugers and reached maximum depths of 3.5m; excavator holes were dug using a Bobcat excavator and reached maximum depths of 1.9m. Radio-carbon samples were collected from augered cores and submitted for analysis. GPR cross-sectional and longitudinal transects were conducted with100MHz antenna and reflections were collected every 25 cm. Streamflow is from top of figure toward bottom.
213HISTORIC RANGE OF VARIABILITY AS A CONTEXT FOR RESTORATION
excavator pits were dug using a 46cm bucket. Maximum depthwas 1.9m. Deposits were described based on grain size, sorting,angularity, color, and organic content. Depositional processeswere inferred based on observations of contemporary deposits inLulu City wetland. Debris-flow deposits are poorly to moderatelysorted angular deposits of sand to gravel sizedmaterial. Overbankdeposits are well sorted, planar features of sand and finer materialdeposited from suspension (Brookfield, 2004). In-channel surficialdeposits are rounded to sub-angular gravels. Peat is anaerobicpreservation of dead vegetation as intertwined fibrous matsgenerated in stable, groundwater-dominated systems such asbogs and fens that do not receive substantial sediment inputsand accumulate organic matter faster than it is decomposed(Cowardin et al., 1979). Organic-rich pond sediment (gyttja)is a facies of fine, black sediment and particulate organic matter(Hansen, 1959). In the contemporary wetland, such depositswere found in relic beaver ponds, and thus preserved gyttja isassumed to be beaver-pond fill (Butler and Malanson, 1995).
Quantifying aggradation rates
Eleven samples (eight peat, three gyttja) from four verticalprofiles were dated using conventional radiocarbon analysisconducted by the University of Arizona Environmental IsotopesLaboratory. Aggradation rates were calculated for each profileassuming constant rates between dated samples and/or the
Copyright © 2011 John Wiley & Sons, Ltd.
modern ground surface. Dated materials were composite sam-ples: fine material of varied sources (gyttja), or accumulated insitu peat. Ages therefore represent averages across the period ofaccumulation, rather than event-based dates such as can be ac-quired through dating wood or charcoal fragments. Peat, how-ever, has an advantage of being derived from short-livedmaterial that is not transported.
Compaction of older sediments and peat skew comparisonsof modern aggradation rates to older rates because older depos-its have had more time to compact and are deeper (more forceapplied). Because augering disrupted subsurface sediments, itwas impossible to measure porosity or density and estimatecompaction through comparison with surface sediments. Stud-ies of peat compaction under similar burial depths suggestcompaction on the order of 30–60% (Van Asselen et al.,2009, 2010). Because the sampled peat was still spongy andporous, the conservative 30% aggradation rate was assumedand applied to all peat below ~1m depth.
Results and Discussion
Aerial photo analysis
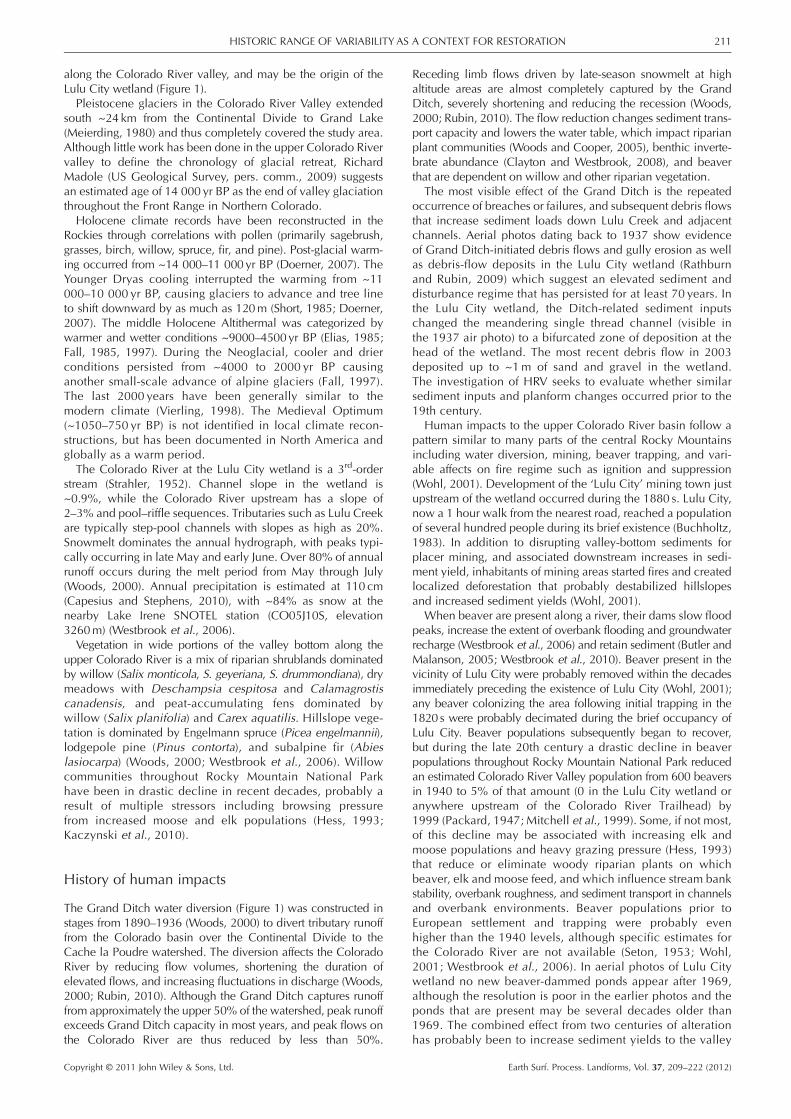
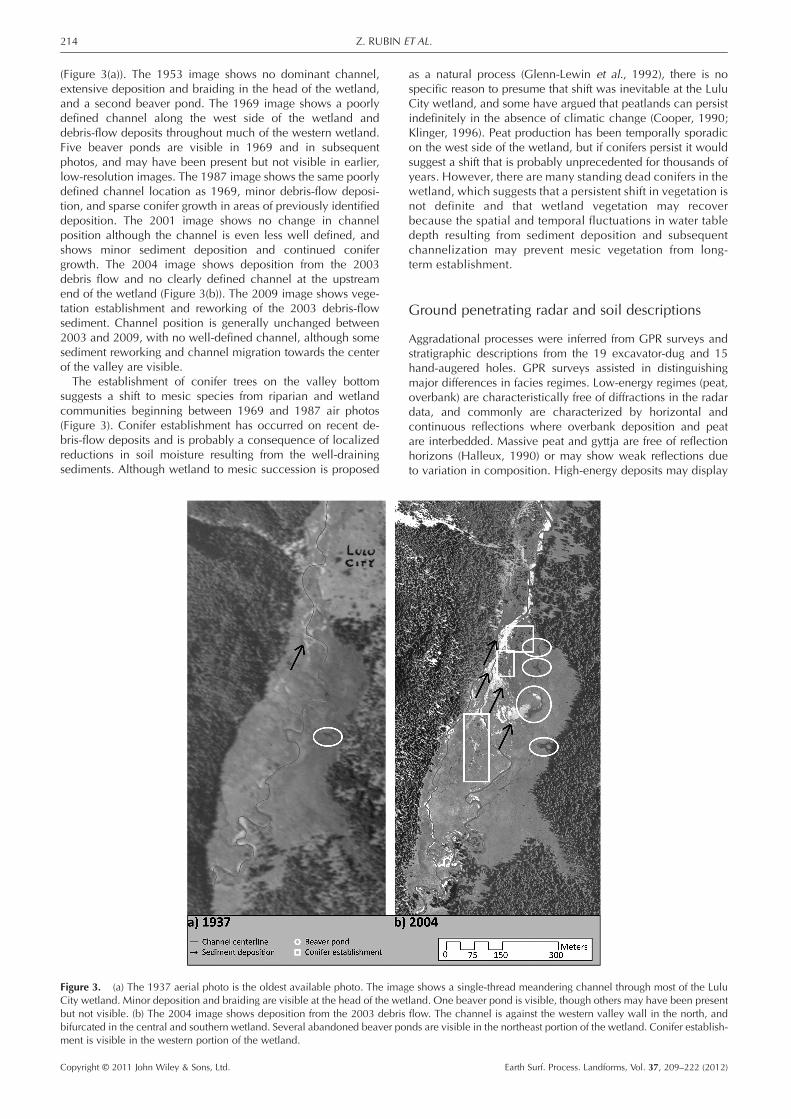
Imagery from 1937 shows a single-thread meandering channelin the center of the wetland, minor deposition and braiding atthe head of the wetland, and one beaver pond in the east
Earth Surf. Process. Landforms, Vol. 37, 209–222 (2012)
214 Z. RUBIN ET AL.
(Figure 3(a)). The 1953 image shows no dominant channel,extensive deposition and braiding in the head of the wetland,and a second beaver pond. The 1969 image shows a poorlydefined channel along the west side of the wetland anddebris-flow deposits throughout much of the western wetland.Five beaver ponds are visible in 1969 and in subsequentphotos, and may have been present but not visible in earlier,low-resolution images. The 1987 image shows the same poorlydefined channel location as 1969, minor debris-flow deposi-tion, and sparse conifer growth in areas of previously identifieddeposition. The 2001 image shows no change in channelposition although the channel is even less well defined, andshows minor sediment deposition and continued conifergrowth. The 2004 image shows deposition from the 2003debris flow and no clearly defined channel at the upstreamend of the wetland (Figure 3(b)). The 2009 image shows vege-tation establishment and reworking of the 2003 debris-flowsediment. Channel position is generally unchanged between2003 and 2009, with no well-defined channel, although somesediment reworking and channel migration towards the centerof the valley are visible.The establishment of conifer trees on the valley bottom
suggests a shift to mesic species from riparian and wetlandcommunities beginning between 1969 and 1987 air photos(Figure 3). Conifer establishment has occurred on recent de-bris-flow deposits and is probably a consequence of localizedreductions in soil moisture resulting from the well-drainingsediments. Although wetland to mesic succession is proposed
Figure 3. (a) The 1937 aerial photo is the oldest available photo. The imagCity wetland. Minor deposition and braiding are visible at the head of the webut not visible. (b) The 2004 image shows deposition from the 2003 debrisbifurcated in the central and southern wetland. Several abandoned beaver poment is visible in the western portion of the wetland.
Copyright © 2011 John Wiley & Sons, Ltd.
as a natural process (Glenn-Lewin et al., 1992), there is nospecific reason to presume that shift was inevitable at the LuluCity wetland, and some have argued that peatlands can persistindefinitely in the absence of climatic change (Cooper, 1990;Klinger, 1996). Peat production has been temporally sporadicon the west side of the wetland, but if conifers persist it wouldsuggest a shift that is probably unprecedented for thousands ofyears. However, there are many standing dead conifers in thewetland, which suggests that a persistent shift in vegetation isnot definite and that wetland vegetation may recoverbecause the spatial and temporal fluctuations in water tabledepth resulting from sediment deposition and subsequentchannelization may prevent mesic vegetation from long-term establishment.
Ground penetrating radar and soil descriptions
Aggradational processes were inferred from GPR surveys andstratigraphic descriptions from the 19 excavator-dug and 15hand-augered holes. GPR surveys assisted in distinguishingmajor differences in facies regimes. Low-energy regimes (peat,overbank) are characteristically free of diffractions in the radardata, and commonly are characterized by horizontal andcontinuous reflections where overbank deposition and peatare interbedded. Massive peat and gyttja are free of reflectionhorizons (Halleux, 1990) or may show weak reflections dueto variation in composition. High-energy deposits may display
e shows a single-thread meandering channel through most of the Lulutland. One beaver pond is visible, though others may have been presentflow. The channel is against the western valley wall in the north, andnds are visible in the northeast portion of the wetland. Conifer establish-
Earth Surf. Process. Landforms, Vol. 37, 209–222 (2012)
215HISTORIC RANGE OF VARIABILITY AS A CONTEXT FOR RESTORATION
diffractions from cobbles or larger material (Clement andMurray, 2007) and are more likely to demonstrate fluvialreworking that prevents horizontally continuous reflections. Insome cases, reflections from debris-flow deposits were freefrom the diffractions caused by large clasts and thus appearedsimilar to low-energy overbank deposits. The similarity ofdebris-flow and overbank deposits is probably a result of sortingand fining that occurs as debris flows move down valley andbehave progressively more like fluvial processes (Nakamuraet al., 2000). In cases where subdivisions within the low- orhigh-energy categories were possible, we noted gyttja, peat,and coarse (cobble or boulder) sediment deposits.Distinct differences are apparent between deposits on the
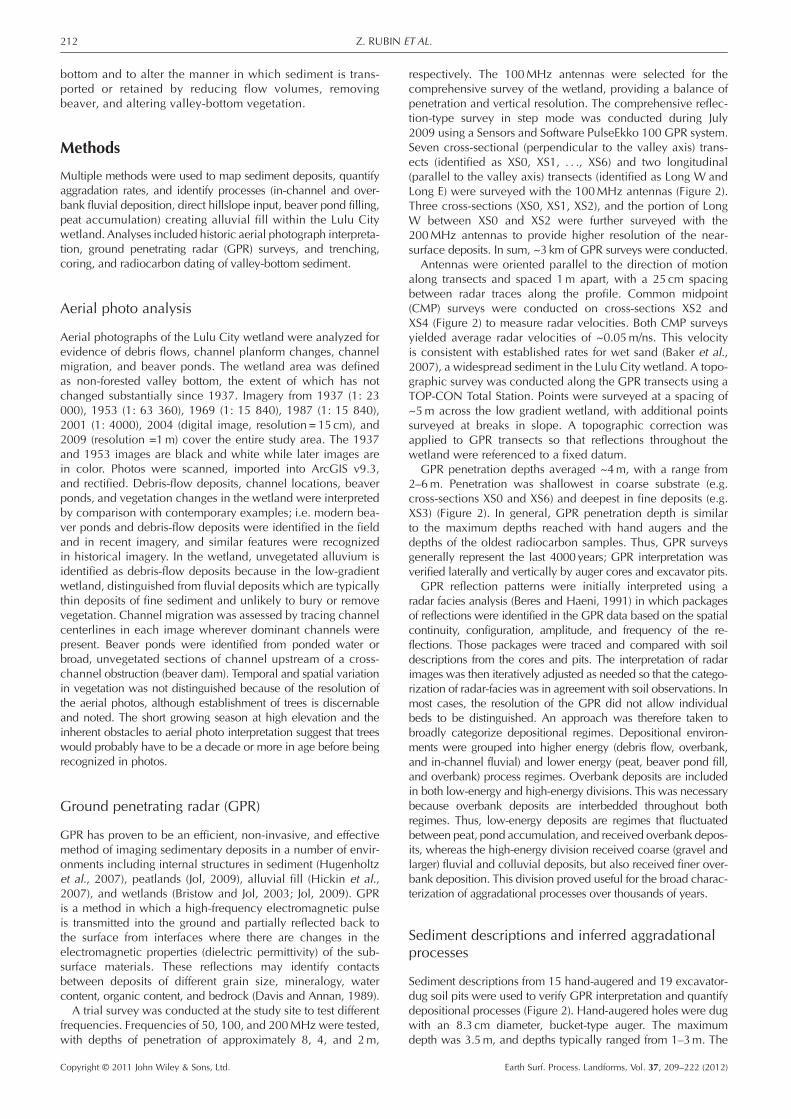
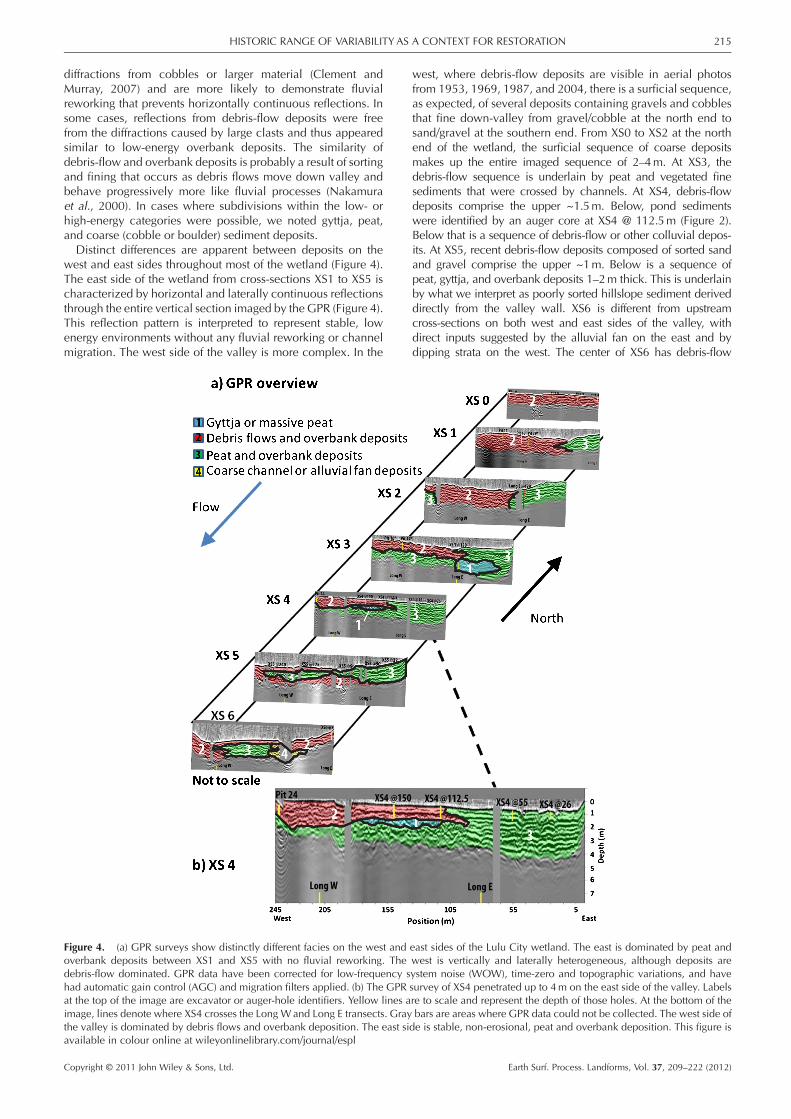
west and east sides throughout most of the wetland (Figure 4).The east side of the wetland from cross-sections XS1 to XS5 ischaracterized by horizontal and laterally continuous reflectionsthrough the entire vertical section imaged by the GPR (Figure 4).This reflection pattern is interpreted to represent stable, lowenergy environments without any fluvial reworking or channelmigration. The west side of the valley is more complex. In the
Figure 4. (a) GPR surveys show distinctly different facies on the west andoverbank deposits between XS1 and XS5 with no fluvial reworking. Thedebris-flow dominated. GPR data have been corrected for low-frequency shad automatic gain control (AGC) and migration filters applied. (b) The GPRat the top of the image are excavator or auger-hole identifiers. Yellow lines aimage, lines denote where XS4 crosses the Long Wand Long E transects. Graythe valley is dominated by debris flows and overbank deposition. The east siavailable in colour online at wileyonlinelibrary.com/journal/espl
Copyright © 2011 John Wiley & Sons, Ltd.
west, where debris-flow deposits are visible in aerial photosfrom 1953, 1969, 1987, and 2004, there is a surficial sequence,as expected, of several deposits containing gravels and cobblesthat fine down-valley from gravel/cobble at the north end tosand/gravel at the southern end. From XS0 to XS2 at the northend of the wetland, the surficial sequence of coarse depositsmakes up the entire imaged sequence of 2–4m. At XS3, thedebris-flow sequence is underlain by peat and vegetated finesediments that were crossed by channels. At XS4, debris-flowdeposits comprise the upper ~1.5m. Below, pond sedimentswere identified by an auger core at XS4 @ 112.5m (Figure 2).Below that is a sequence of debris-flow or other colluvial depos-its. At XS5, recent debris-flow deposits composed of sorted sandand gravel comprise the upper ~1m. Below is a sequence ofpeat, gyttja, and overbank deposits 1–2m thick. This is underlainby what we interpret as poorly sorted hillslope sediment deriveddirectly from the valley wall. XS6 is different from upstreamcross-sections on both west and east sides of the valley, withdirect inputs suggested by the alluvial fan on the east and bydipping strata on the west. The center of XS6 has debris-flow
east sides of the Lulu City wetland. The east is dominated by peat andwest is vertically and laterally heterogeneous, although deposits areystem noise (WOW), time-zero and topographic variations, and havesurvey of XS4 penetrated up to 4m on the east side of the valley. Labelsre to scale and represent the depth of those holes. At the bottom of thebars are areas where GPR data could not be collected. The west side ofde is stable, non-erosional, peat and overbank deposition. This figure is
Earth Surf. Process. Landforms, Vol. 37, 209–222 (2012)
216 Z. RUBIN ET AL.
deposits on the surface, underlain by peat and overbank depositsto the west of center, and coarse deposits to the east that may befan deposits from the east or coarse channel-lag deposits.In summary, the west side of the wetland is vertically and
laterally heterogeneous with down-valley fining, although coarsedeposits in the southwest suggest direct colluvial inputs in theform of debris flows, landslides, or avalanches. Finer-grained soilsand peat were present below the surficial series of coarse depos-its, although coarse deposits are identified below that, demon-strating that high-energy fluvial and colluvial inputs occurredprior to intensive human alteration. The east side of the wetlandhas been consistently dominated by peat and overbank depo-sition throughout the entire imaged and sampled sequence.Debris-flow deposits are identified in the northeast and southeastcorners of the valley from tributaries that enter the valley from theeast. Interpretation of GPR relied heavily upon verification fromauger and excavator holes. Interpretation of strata distant fromor deeper than holes has a potential for greater error than depositsnear augered or excavated holes. Nonetheless, the distribution ofaugered and excavated holes provided good spatial coverage forinterpreting the aggradational history of the valley up to the GPRand sampling depth limitations (~3.5m).
Timeline of aggradation
Recent aggradational processes on both sides of the wetlandare within the range of pre-settlement processes. Owing to
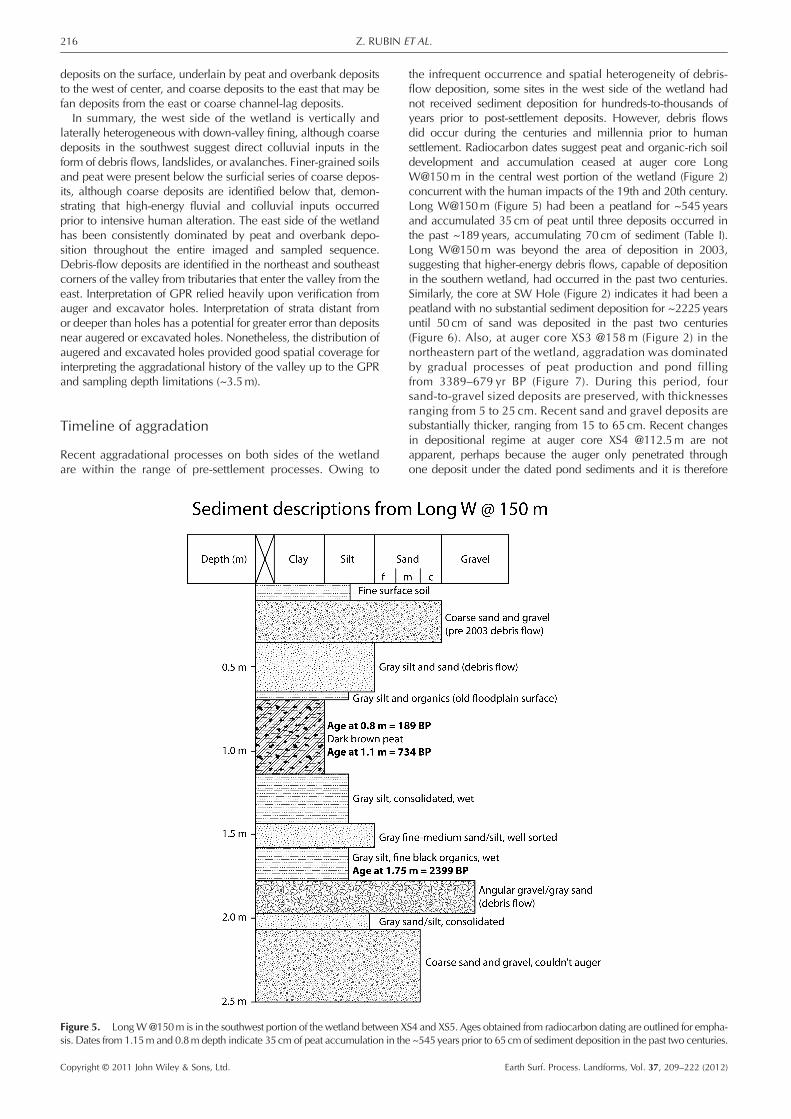
Figure 5. LongW@150m is in the southwest portion of the wetland between Xsis. Dates from 1.15m and 0.8m depth indicate 35cm of peat accumulation in th
Copyright © 2011 John Wiley & Sons, Ltd.
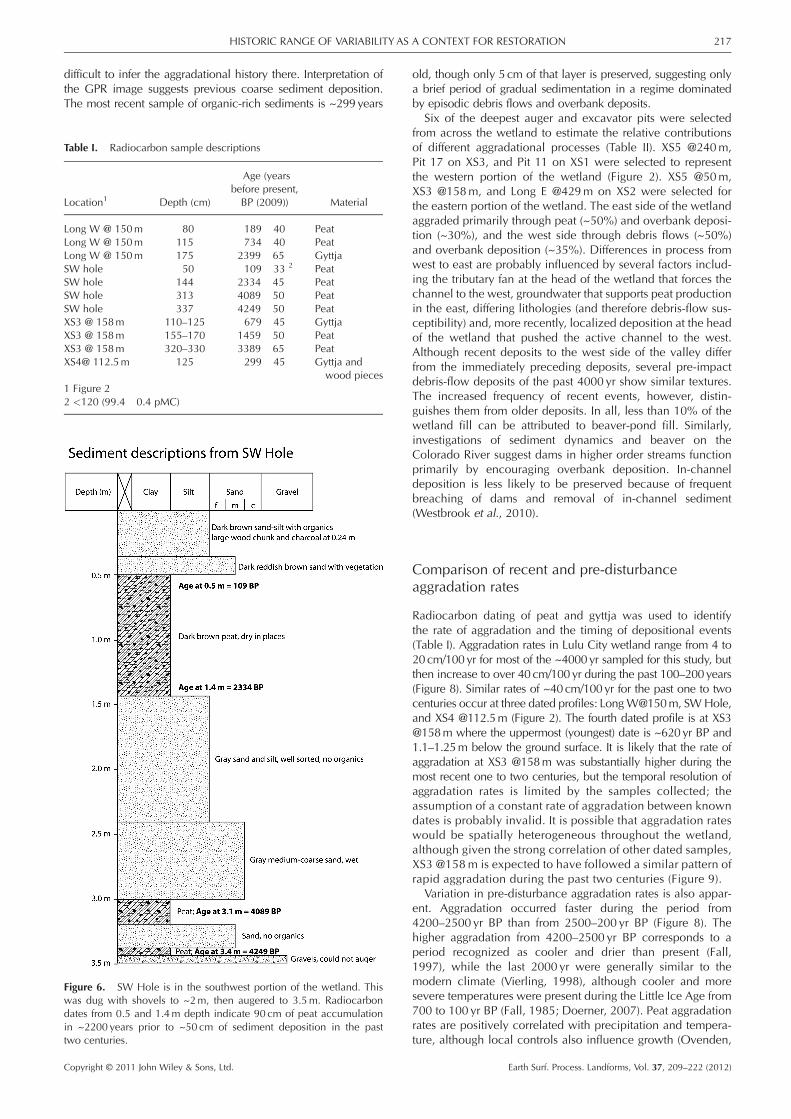
the infrequent occurrence and spatial heterogeneity of debris-flow deposition, some sites in the west side of the wetland hadnot received sediment deposition for hundreds-to-thousands ofyears prior to post-settlement deposits. However, debris flowsdid occur during the centuries and millennia prior to humansettlement. Radiocarbon dates suggest peat and organic-rich soildevelopment and accumulation ceased at auger core LongW@150m in the central west portion of the wetland (Figure 2)concurrent with the human impacts of the 19th and 20th century.Long W@150m (Figure 5) had been a peatland for ~545yearsand accumulated 35cm of peat until three deposits occurred inthe past ~189years, accumulating 70cm of sediment (Table I).Long W@150m was beyond the area of deposition in 2003,suggesting that higher-energy debris flows, capable of depositionin the southern wetland, had occurred in the past two centuries.Similarly, the core at SW Hole (Figure 2) indicates it had been apeatland with no substantial sediment deposition for ~2225yearsuntil 50cm of sand was deposited in the past two centuries(Figure 6). Also, at auger core XS3 @158m (Figure 2) in thenortheastern part of the wetland, aggradation was dominatedby gradual processes of peat production and pond fillingfrom 3389–679 yr BP (Figure 7). During this period, foursand-to-gravel sized deposits are preserved, with thicknessesranging from 5 to 25 cm. Recent sand and gravel deposits aresubstantially thicker, ranging from 15 to 65cm. Recent changesin depositional regime at auger core XS4 @112.5m are notapparent, perhaps because the auger only penetrated throughone deposit under the dated pond sediments and it is therefore
S4 and XS5. Ages obtained from radiocarbon dating are outlined for empha-e ~545years prior to 65cm of sediment deposition in the past two centuries.
Earth Surf. Process. Landforms, Vol. 37, 209–222 (2012)
217HISTORIC RANGE OF VARIABILITY AS A CONTEXT FOR RESTORATION
difficult to infer the aggradational history there. Interpretation ofthe GPR image suggests previous coarse sediment deposition.The most recent sample of organic-rich sediments is ~299years
Table I. Radiocarbon sample descriptions
Location1 Depth (cm)
Age (yearsbefore present,BP (2009)) Material
Long W @ 150m 80 189�40 PeatLong W @ 150m 115 734�40 PeatLong W @ 150m 175 2399�65 GyttjaSW hole 50 109�33 2 PeatSW hole 144 2334�45 PeatSW hole 313 4089�50 PeatSW hole 337 4249�50 PeatXS3 @ 158m 110–125 679�45 GyttjaXS3 @ 158m 155–170 1459�50 PeatXS3 @ 158m 320–330 3389�65 PeatXS4@ 112.5m 125 299�45 Gyttja and
wood pieces1 Figure 22 <120 (99.4 �0.4 pMC)
Figure 6. SW Hole is in the southwest portion of the wetland. Thiswas dug with shovels to ~2m, then augered to 3.5m. Radiocarbondates from 0.5 and 1.4m depth indicate 90 cm of peat accumulationin ~2200 years prior to ~50 cm of sediment deposition in the pasttwo centuries.
Copyright © 2011 John Wiley & Sons, Ltd.
old, though only 5cm of that layer is preserved, suggesting onlya brief period of gradual sedimentation in a regime dominatedby episodic debris flows and overbank deposits.
Six of the deepest auger and excavator pits were selectedfrom across the wetland to estimate the relative contributionsof different aggradational processes (Table II). XS5 @240m,Pit 17 on XS3, and Pit 11 on XS1 were selected to representthe western portion of the wetland (Figure 2). XS5 @50m,XS3 @158m, and Long E @429m on XS2 were selected forthe eastern portion of the wetland. The east side of the wetlandaggraded primarily through peat (~50%) and overbank deposi-tion (~30%), and the west side through debris flows (~50%)and overbank deposition (~35%). Differences in process fromwest to east are probably influenced by several factors includ-ing the tributary fan at the head of the wetland that forces thechannel to the west, groundwater that supports peat productionin the east, differing lithologies (and therefore debris-flow sus-ceptibility) and, more recently, localized deposition at the headof the wetland that pushed the active channel to the west.Although recent deposits to the west side of the valley differfrom the immediately preceding deposits, several pre-impactdebris-flow deposits of the past 4000 yr show similar textures.The increased frequency of recent events, however, distin-guishes them from older deposits. In all, less than 10% of thewetland fill can be attributed to beaver-pond fill. Similarly,investigations of sediment dynamics and beaver on theColorado River suggest dams in higher order streams functionprimarily by encouraging overbank deposition. In-channeldeposition is less likely to be preserved because of frequentbreaching of dams and removal of in-channel sediment(Westbrook et al., 2010).
Comparison of recent and pre-disturbanceaggradation rates
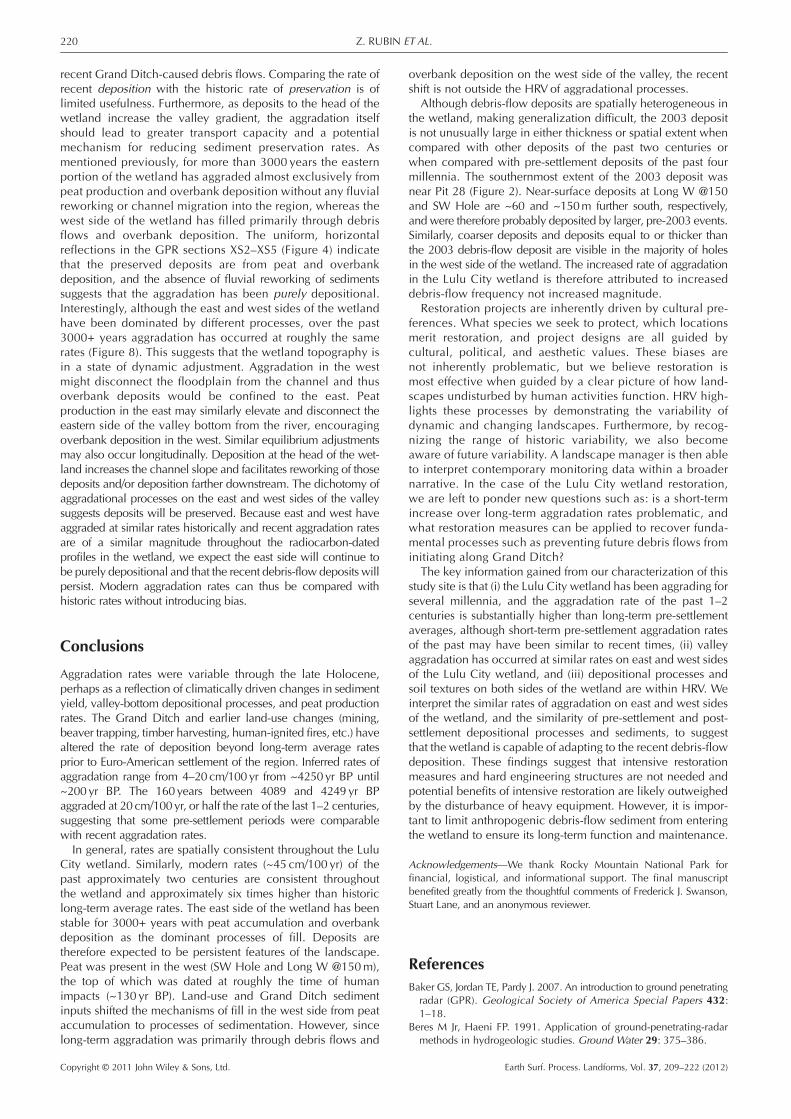
Radiocarbon dating of peat and gyttja was used to identifythe rate of aggradation and the timing of depositional events(Table I). Aggradation rates in Lulu City wetland range from 4 to20cm/100yr for most of the ~4000yr sampled for this study, butthen increase to over 40cm/100yr during the past 100–200years(Figure 8). Similar rates of ~40cm/100yr for the past one to twocenturies occur at three dated profiles: LongW@150m, SWHole,and XS4 @112.5m (Figure 2). The fourth dated profile is at XS3@158m where the uppermost (youngest) date is ~620yr BP and1.1–1.25m below the ground surface. It is likely that the rate ofaggradation at XS3 @158m was substantially higher during themost recent one to two centuries, but the temporal resolution ofaggradation rates is limited by the samples collected; theassumption of a constant rate of aggradation between knowndates is probably invalid. It is possible that aggradation rateswould be spatially heterogeneous throughout the wetland,although given the strong correlation of other dated samples,XS3 @158m is expected to have followed a similar pattern ofrapid aggradation during the past two centuries (Figure 9).
Variation in pre-disturbance aggradation rates is also appar-ent. Aggradation occurred faster during the period from4200–2500 yr BP than from 2500–200 yr BP (Figure 8). Thehigher aggradation from 4200–2500 yr BP corresponds to aperiod recognized as cooler and drier than present (Fall,1997), while the last 2000 yr were generally similar to themodern climate (Vierling, 1998), although cooler and moresevere temperatures were present during the Little Ice Age from700 to 100 yr BP (Fall, 1985; Doerner, 2007). Peat aggradationrates are positively correlated with precipitation and tempera-ture, although local controls also influence growth (Ovenden,
Earth Surf. Process. Landforms, Vol. 37, 209–222 (2012)
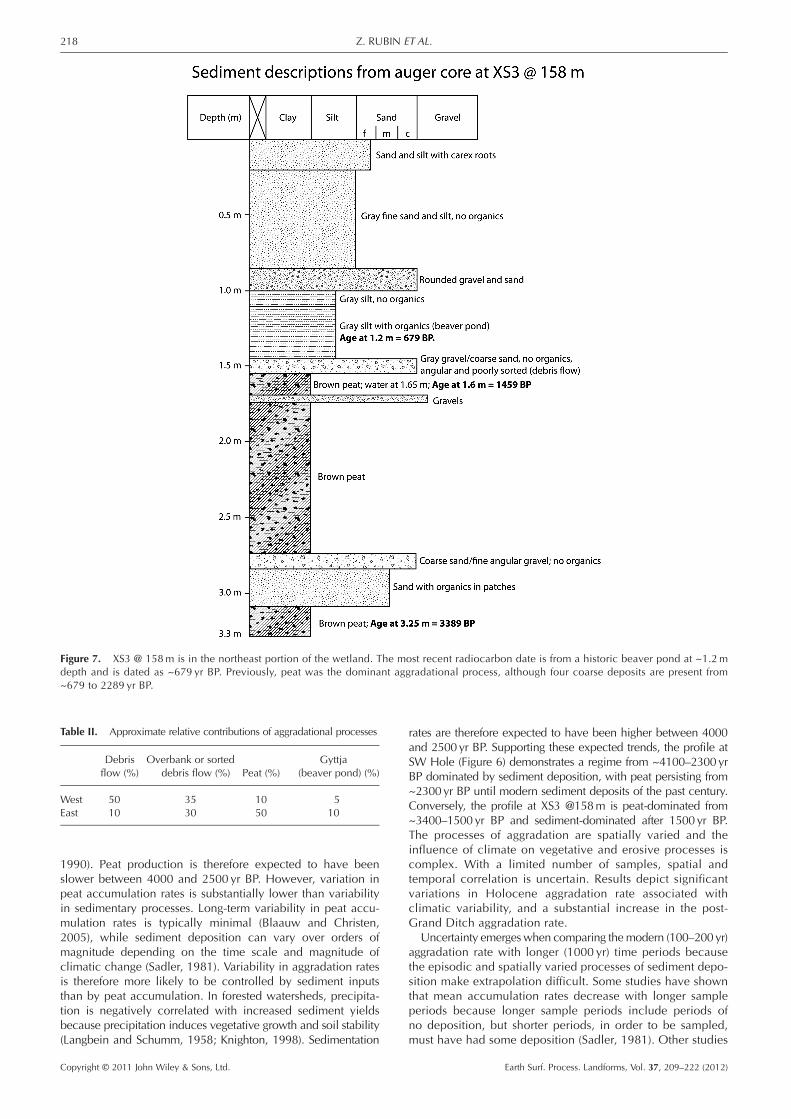
Figure 7. XS3 @ 158m is in the northeast portion of the wetland. The most recent radiocarbon date is from a historic beaver pond at ~1.2mdepth and is dated as ~679 yr BP. Previously, peat was the dominant aggradational process, although four coarse deposits are present from~679 to 2289 yr BP.
Table II. Approximate relative contributions of aggradational processes
Debrisflow (%)
Overbank or sorteddebris flow (%) Peat (%)
Gyttja(beaver pond) (%)
West 50 35 10 5East 10 30 50 10
218 Z. RUBIN ET AL.
1990). Peat production is therefore expected to have beenslower between 4000 and 2500 yr BP. However, variation inpeat accumulation rates is substantially lower than variabilityin sedimentary processes. Long-term variability in peat accu-mulation rates is typically minimal (Blaauw and Christen,2005), while sediment deposition can vary over orders ofmagnitude depending on the time scale and magnitude ofclimatic change (Sadler, 1981). Variability in aggradation ratesis therefore more likely to be controlled by sediment inputsthan by peat accumulation. In forested watersheds, precipita-tion is negatively correlated with increased sediment yieldsbecause precipitation induces vegetative growth and soil stability(Langbein and Schumm, 1958; Knighton, 1998). Sedimentation
Copyright © 2011 John Wiley & Sons, Ltd.
rates are therefore expected to have been higher between 4000and 2500yr BP. Supporting these expected trends, the profile atSW Hole (Figure 6) demonstrates a regime from ~4100–2300yrBP dominated by sediment deposition, with peat persisting from~2300yr BP until modern sediment deposits of the past century.Conversely, the profile at XS3 @158m is peat-dominated from~3400–1500yr BP and sediment-dominated after 1500yr BP.The processes of aggradation are spatially varied and theinfluence of climate on vegetative and erosive processes iscomplex. With a limited number of samples, spatial andtemporal correlation is uncertain. Results depict significantvariations in Holocene aggradation rate associated withclimatic variability, and a substantial increase in the post-Grand Ditch aggradation rate.
Uncertainty emerges when comparing themodern (100–200yr)aggradation rate with longer (1000 yr) time periods becausethe episodic and spatially varied processes of sediment depo-sition make extrapolation difficult. Some studies have shownthat mean accumulation rates decrease with longer sampleperiods because longer sample periods include periods ofno deposition, but shorter periods, in order to be sampled,must have had some deposition (Sadler, 1981). Other studies
Earth Surf. Process. Landforms, Vol. 37, 209–222 (2012)
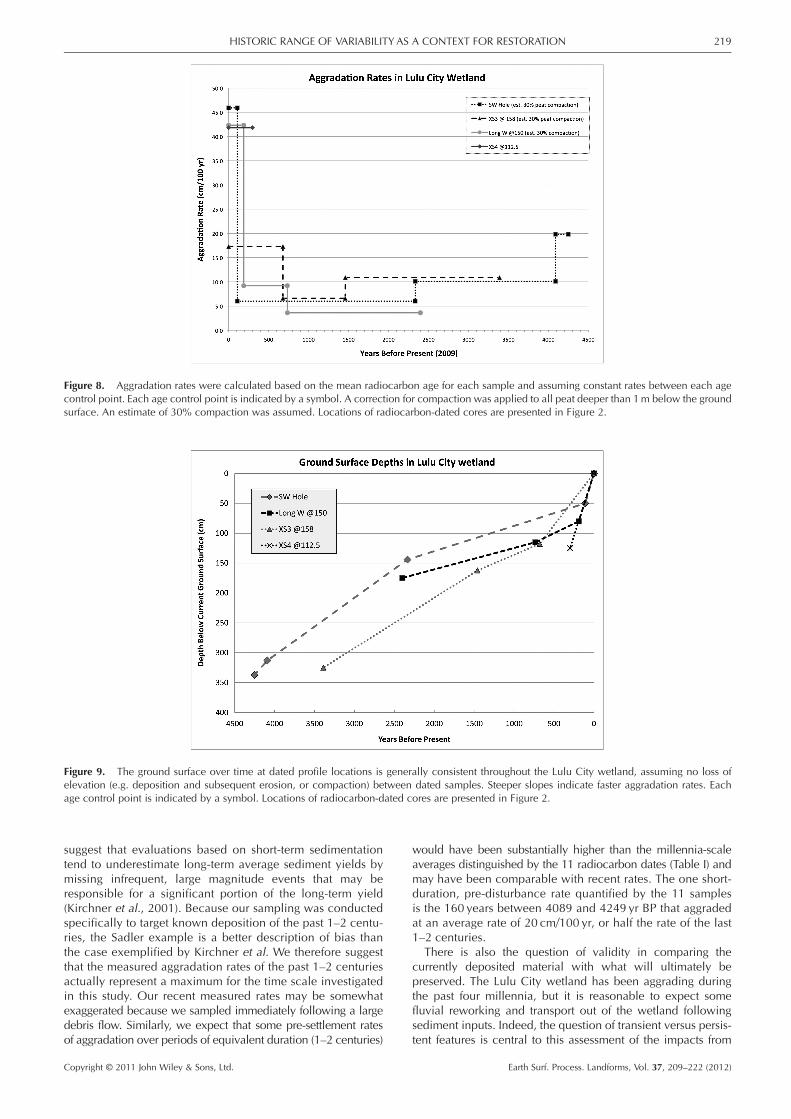
Figure 8. Aggradation rates were calculated based on the mean radiocarbon age for each sample and assuming constant rates between each agecontrol point. Each age control point is indicated by a symbol. A correction for compaction was applied to all peat deeper than 1m below the groundsurface. An estimate of 30% compaction was assumed. Locations of radiocarbon-dated cores are presented in Figure 2.
Figure 9. The ground surface over time at dated profile locations is generally consistent throughout the Lulu City wetland, assuming no loss ofelevation (e.g. deposition and subsequent erosion, or compaction) between dated samples. Steeper slopes indicate faster aggradation rates. Eachage control point is indicated by a symbol. Locations of radiocarbon-dated cores are presented in Figure 2.
219HISTORIC RANGE OF VARIABILITY AS A CONTEXT FOR RESTORATION
suggest that evaluations based on short-term sedimentationtend to underestimate long-term average sediment yields bymissing infrequent, large magnitude events that may beresponsible for a significant portion of the long-term yield(Kirchner et al., 2001). Because our sampling was conductedspecifically to target known deposition of the past 1–2 centu-ries, the Sadler example is a better description of bias thanthe case exemplified by Kirchner et al. We therefore suggestthat the measured aggradation rates of the past 1–2 centuriesactually represent a maximum for the time scale investigatedin this study. Our recent measured rates may be somewhatexaggerated because we sampled immediately following a largedebris flow. Similarly, we expect that some pre-settlement ratesof aggradation over periods of equivalent duration (1–2 centuries)
Copyright © 2011 John Wiley & Sons, Ltd.
would have been substantially higher than the millennia-scaleaverages distinguished by the 11 radiocarbon dates (Table I) andmay have been comparable with recent rates. The one short-duration, pre-disturbance rate quantified by the 11 samplesis the 160 years between 4089 and 4249 yr BP that aggradedat an average rate of 20 cm/100 yr, or half the rate of the last1–2 centuries.
There is also the question of validity in comparing thecurrently deposited material with what will ultimately bepreserved. The Lulu City wetland has been aggrading duringthe past four millennia, but it is reasonable to expect somefluvial reworking and transport out of the wetland followingsediment inputs. Indeed, the question of transient versus persis-tent features is central to this assessment of the impacts from
Earth Surf. Process. Landforms, Vol. 37, 209–222 (2012)
220 Z. RUBIN ET AL.
recent Grand Ditch-caused debris flows. Comparing the rate ofrecent deposition with the historic rate of preservation is oflimited usefulness. Furthermore, as deposits to the head of thewetland increase the valley gradient, the aggradation itselfshould lead to greater transport capacity and a potentialmechanism for reducing sediment preservation rates. Asmentioned previously, for more than 3000 years the easternportion of the wetland has aggraded almost exclusively frompeat production and overbank deposition without any fluvialreworking or channel migration into the region, whereas thewest side of the wetland has filled primarily through debrisflows and overbank deposition. The uniform, horizontalreflections in the GPR sections XS2–XS5 (Figure 4) indicatethat the preserved deposits are from peat and overbankdeposition, and the absence of fluvial reworking of sedimentssuggests that the aggradation has been purely depositional.Interestingly, although the east and west sides of the wetlandhave been dominated by different processes, over the past3000+ years aggradation has occurred at roughly the samerates (Figure 8). This suggests that the wetland topography isin a state of dynamic adjustment. Aggradation in the westmight disconnect the floodplain from the channel and thusoverbank deposits would be confined to the east. Peatproduction in the east may similarly elevate and disconnect theeastern side of the valley bottom from the river, encouragingoverbank deposition in the west. Similar equilibrium adjustmentsmay also occur longitudinally. Deposition at the head of the wet-land increases the channel slope and facilitates reworking of thosedeposits and/or deposition farther downstream. The dichotomy ofaggradational processes on the east and west sides of the valleysuggests deposits will be preserved. Because east and west haveaggraded at similar rates historically and recent aggradation ratesare of a similar magnitude throughout the radiocarbon-datedprofiles in the wetland, we expect the east side will continue tobe purely depositional and that the recent debris-flow deposits willpersist. Modern aggradation rates can thus be compared withhistoric rates without introducing bias.
Conclusions
Aggradation rates were variable through the late Holocene,perhaps as a reflection of climatically driven changes in sedimentyield, valley-bottom depositional processes, and peat productionrates. The Grand Ditch and earlier land-use changes (mining,beaver trapping, timber harvesting, human-ignited fires, etc.) havealtered the rate of deposition beyond long-term average ratesprior to Euro-American settlement of the region. Inferred rates ofaggradation range from 4–20cm/100yr from ~4250yr BP until~200yr BP. The 160years between 4089 and 4249yr BPaggraded at 20cm/100yr, or half the rate of the last 1–2 centuries,suggesting that some pre-settlement periods were comparablewith recent aggradation rates.In general, rates are spatially consistent throughout the Lulu
City wetland. Similarly, modern rates (~45 cm/100 yr) of thepast approximately two centuries are consistent throughoutthe wetland and approximately six times higher than historiclong-term average rates. The east side of the wetland has beenstable for 3000+ years with peat accumulation and overbankdeposition as the dominant processes of fill. Deposits aretherefore expected to be persistent features of the landscape.Peat was present in the west (SW Hole and Long W @150m),the top of which was dated at roughly the time of humanimpacts (~130 yr BP). Land-use and Grand Ditch sedimentinputs shifted the mechanisms of fill in the west side from peataccumulation to processes of sedimentation. However, sincelong-term aggradation was primarily through debris flows and
Copyright © 2011 John Wiley & Sons, Ltd.
overbank deposition on the west side of the valley, the recentshift is not outside the HRVof aggradational processes.
Although debris-flow deposits are spatially heterogeneous inthe wetland, making generalization difficult, the 2003 depositis not unusually large in either thickness or spatial extent whencompared with other deposits of the past two centuries orwhen compared with pre-settlement deposits of the past fourmillennia. The southernmost extent of the 2003 deposit wasnear Pit 28 (Figure 2). Near-surface deposits at Long W @150and SW Hole are ~60 and ~150m further south, respectively,and were therefore probably deposited by larger, pre-2003 events.Similarly, coarser deposits and deposits equal to or thicker thanthe 2003 debris-flow deposit are visible in the majority of holesin the west side of the wetland. The increased rate of aggradationin the Lulu City wetland is therefore attributed to increaseddebris-flow frequency not increased magnitude.
Restoration projects are inherently driven by cultural pre-ferences. What species we seek to protect, which locationsmerit restoration, and project designs are all guided bycultural, political, and aesthetic values. These biases arenot inherently problematic, but we believe restoration ismost effective when guided by a clear picture of how land-scapes undisturbed by human activities function. HRV high-lights these processes by demonstrating the variability ofdynamic and changing landscapes. Furthermore, by recog-nizing the range of historic variability, we also becomeaware of future variability. A landscape manager is then ableto interpret contemporary monitoring data within a broadernarrative. In the case of the Lulu City wetland restoration,we are left to ponder new questions such as: is a short-termincrease over long-term aggradation rates problematic, andwhat restoration measures can be applied to recover funda-mental processes such as preventing future debris flows frominitiating along Grand Ditch?
The key information gained from our characterization of thisstudy site is that (i) the Lulu City wetland has been aggrading forseveral millennia, and the aggradation rate of the past 1–2centuries is substantially higher than long-term pre-settlementaverages, although short-term pre-settlement aggradation ratesof the past may have been similar to recent times, (ii) valleyaggradation has occurred at similar rates on east and west sidesof the Lulu City wetland, and (iii) depositional processes andsoil textures on both sides of the wetland are within HRV. Weinterpret the similar rates of aggradation on east and west sidesof the wetland, and the similarity of pre-settlement and post-settlement depositional processes and sediments, to suggestthat the wetland is capable of adapting to the recent debris-flowdeposition. These findings suggest that intensive restorationmeasures and hard engineering structures are not needed andpotential benefits of intensive restoration are likely outweighedby the disturbance of heavy equipment. However, it is impor-tant to limit anthropogenic debris-flow sediment from enteringthe wetland to ensure its long-term function and maintenance.
Acknowledgements—We thank Rocky Mountain National Park forfinancial, logistical, and informational support. The final manuscriptbenefited greatly from the thoughtful comments of Frederick J. Swanson,Stuart Lane, and an anonymous reviewer.
ReferencesBaker GS, Jordan TE, Pardy J. 2007. An introduction to ground penetratingradar (GPR). Geological Society of America Special Papers 432:1–18.
Beres M Jr, Haeni FP. 1991. Application of ground-penetrating-radarmethods in hydrogeologic studies. Ground Water 29: 375–386.
Earth Surf. Process. Landforms, Vol. 37, 209–222 (2012)
221HISTORIC RANGE OF VARIABILITY AS A CONTEXT FOR RESTORATION
Blaauw M, Christen JA. 2005. Radiocarbon peat chronologies andenvironmental change. Applied Statistics 54: 805–816.
Braddock WA, Cole JC. 1990. Geologic Map of Rocky MountainNational Park and Vicinity, Colorado. USGeological Survey: Reston, VA.
Bristow CS, Jol HM. 2003. Ground Penetrating Radar in Sediments.Geological Society: London.
Brookfield ME. 2004. Principles of Stratigraphy. Blackwell: Malden,MA.
Buchholtz CW. 1983. Rocky Mountain National Park: a History.University Press of Colorado: Boulder.
Butler DR, Malanson GP. 1995. Sedimentation rates and patterns inbeaver ponds in a mountain environment. Geomorphology 13:255–269.
Butler D, Malanson GP. 2005. The geomorphic influences of beaverdams and failures of beaver dams. Geomorphology 71: 48–60.
Capesius JP, Stephens VC. 2010. Regional regression equations forestimation of natural streamflow statistics in Colorado. ScientificInvestigations Report 2009�5136U, US Geological Survey.
Clayton JA, Westbrook CJ. 2008. The effect of the grand ditch on theabundance of benthic invertebrates in the Colorado River, RockyMountain National Park. River Research and Applications 24:975–987.
Clement WP, Murray CJ. 2007. GPR imaging of clastic dikes at theHanford Site, Hanford, Washington. Geological Society of AmericaSpecial Papers 432: 169–181.
Connell JH. 1978. Diversity in tropical rain forests and coral reefs. Sci-ence 199: 1302–1310.
Cooper DJ. 1990. Ecology of wetlands in Big Meadows, Rocky Moun-tain National Park, Colorado US Fish and Wildlife Service BiologicalReport 90(15).
Cowardin LM, Carter V, Golet FC, LaRoe ET. 1979. Classification ofWetlands and Deepwater Habitats of the United States. US Departmentof the Interior/Fish and Wildlife Service: Washington, DC.
Davis JL, Annan AP. 1989. Ground-penetrating radar for high-resolutionmapping of soil and rock stratigraphy. Geophysical Prospecting 37:531–551.
Detenbeck NE, DeVore PW, Niemi GJ, Lima A. 1992. Recovery oftemperate-stream fish communities from disturbance: a review ofcase studies and synthesis of theory. Environmental Management16: 33–53.
Doerner JP. 2007. Late quaternary prehistoric environments of thecolorado front range. In Frontiers in Colorado Paleoindian Archaeology:from the Dent Site to the Rocky Mountains, Brunswig RH, Pitblado BL(eds). University Press of Colorado: Boulder.
Elias SA. 1985. Paleoenvironmental interpretations of Holocene insectfossil assemblages from four high-altitude sites in the Front Range,Colorado, USA. Arctic and Alpine Research 17: 31–48.
Fall PL. 1985. Holocene dynamics of the subalpine forest in centralColorado. In Late Quaternary Vegetation and Climates of theAmerican Southwest, Jacobs BF, Fall PL, Davis OK (eds). AmericanAssociation of Stratigraphic Palynolologists Foundation: Houston.
Fall PL. 1997. Timberline fluctuations and late Quaternary paleocli-mates in the Southern Rocky Mountains, Colorado. Bulletin of theGeological Society of America 109: 1306–1320.
Friedman JM, Osterkamp WR, Lewis Jr WM. 1996. Channel narrowingand vegetation development following a Great Plains flood. Ecology77: 2167–2181.
Glenn-Lewin DC, Peet RK, Veblen TT. 1992. Plant Succession: Theoryand Prediction. Chapman & Hall: London.
Halleux L. 1990. Ground penetrating radar applied to the study of peatbogs and moors. Annales de la Societ� G�ologique de Belgique113: 115–123.
Hansen K. 1959. The terms gyttja and dy. Hydrobiologia 13: 309–315.Hess K. 1993. Rocky Times in Rocky Mountain National Park anUnnatural History. University Press of Colorado: Niwot, CO.
Hickin AS, Bobrowsky PT, Paulen RC, Best M. 2007. Imaging fluvialarchitecture within a paleovalley fill using ground penetrating radar,Maple Creek, Guyana. GSA Special Papers 432: 133–153.
Hugenholtz CH, Moorman BJ, Wolfe SA. 2007. Ground penetratingradar (GPR) imaging of the internal structure of an active parabolicsand dune. GSA Special Papers 432: 35–45.
Jol HM. 2009. Ground Penetrating Radar: Theory and Applications.Elsevier Science: Amsterdam.
Copyright © 2011 John Wiley & Sons, Ltd.
Kaczynski KM, Cooper DJ, Jacobi WR. 2010. Willow decline in RockyMountain National Park: examining the interactions of drought,ungulate browsing, sapsuckers and fungus. From: Front Range StudentEcology Symposium Conference Proceedings, Fort Collins, CO.
Keane RE, Hessburg PF, Landres PB, Swanson FJ. 2009. The use ofhistorical range and variability (HRV) in landscape management.Forest Ecology and Management 258: 1025–1037.
Kirchner JW, Finkel RC, Riebe CS, Granger DE, Clayton JL, King JG,Megahan WF. 2001. Mountain erosion over 10 yr, 10 k.y., and10m.y. time scales. Geology 29: 591–594.
Klinger LF. 1996. The myth of the classic hydrosere model of bogsuccession. Arctic and Alpine Research 28: 1–9.
Knighton D. 1998. Fluvial Forms and Processes. Arnold: London.Kondolf GM. 2006. River restoration and meanders. Ecology andSociety 11: 42.
Kondolf GM, Boulton AJ, O’Daniel S, Poole GC, Rachel FJ, Stanley EH,Wohl E, Bang A, Carlstrom J, Cristoni C, Huber H, Koljonen S, LouhiP, Nakamura K. 2006. Process-based ecological river restoration:visualizing three-dimensional connectivity and dynamic vectors torecover lost linkages. Ecology and Society 11: [online] URL: http://www.ecologyandsociety.org/vol11/iss2/art5/.
Lake PS. 2000. Disturbance, patchiness, and diversity in streams.Journal of the North American Benthological Society 19: 573–592.
Landres PB, Morgan P, Swanson FJ. 1999. Overview of the use ofnatural variability concepts in managing ecological systems.Ecological Applications 9: 1179–1188.
LangbeinWB, Schumm SA. 1958. Yield of sediment in relation to meanannual precipitation. American Geophysical Union Transactions 39:1076–1084.
Meierding TC. 1980. Glaciation of the Upper Colorado River Basin. InGeoecology of the Colorado Front Range: a Study of Alpine andSubalpine Environments, Ives JD (ed). Westview Press: Boulder.
Mitchell D, Tjomehoj J, Baker BW. 1999. Beaver populations andpossible limiting factors in Rocky Mountain National Park. USGeological Survey Report: Reston, VA.
Nakamura F, Swanson F, Wondzell S. 2000. Disturbance regimes ofstream and riparian systems - a disturbance-cascade perspective.Hydrological Process 14: 2849–2860.
Ovenden L. 1990. Peat accumulation in northern wetlands.QuaternaryResearch 33: 377–386.
Packard FM. 1947. A Survey of the beaver population of RockyMountain National Park, Colorado. Journal of Mammalogy 28:219–227.
Pickett STA, White PS. 1985. The Ecology of Natural Disturbance andPatch Dynamics. Academic Press: Orlando.
Rathburn SL, Rubin ZK. 2009. Effects of the 2003 Grand Ditch breachon Lulu Creek and the Colorado River, Rocky Mountain NationalPark, CO. In GSA Conference Proceedings, Portland, OR.
Reice SR, Wissmar RC, Naiman RJ. 1990. Disturbance regimes,resilience, and recovery of animal communities and habitats inlotic ecosystems. Environmental Management 14: 647–659.
Rubin ZK. 2010. Post-glacial valley evolution and post-disturbancechannel response as a context for restoration, upper ColoradoRiver, Rocky Mountain National Park. MS Thesis, Colorado StateUniversity.
Sadler PM. 1981. Sediment accumulation rates and the completenessof stratigraphic sections. Journal of Geology 89: 569–584.
Sanford B. 2010. Implications of hydrothermal alteration for landscapestability and environmental geochemistry. In Rocky MountainNational Park Research Conference Proceedings, Estes Park, CO.
Seton ET. 1953. Lives of Game Animals: an Account of Those LandAnimals in America, North of the Mexican Border, Which areConsidered “Game”, Either Because They Have Held the Attentionof Sportsmen, or Received the Protection of Law. C.T. Branford:Boston.
Short SK. 1985. Palynology of Holocene sediments, Colorado FrontRange: vegetation and treeline changes in the subalpine forest. LateQuaternary Vegetation and Climates of the American Southwest16: 7–29.
Soar PJ, Thorne CR. 2000. Channel restoration design for meanderingrivers. ERDC/CHL CR-01-1. Army Engineer Research and DevelopmentCenter, Flood Damage Reduction Research Program Report, Vicksburg,MS.
Earth Surf. Process. Landforms, Vol. 37, 209–222 (2012)
222 Z. RUBIN ET AL.
Strahler AN. 1952. Hypsometric (area-altitude) analysis of ero-sional topography. Geological Society of America Bulletin 63:1117–1142.
Turner MG, Romme WH, Gardner RH, O’Neill RV, Kratz TK. 1993. Arevised concept of landscape equilibrium: disturbance and stabilityon scaled landscapes. Landscape Ecology 8: 213–227.
Van Asselen S, Stouthamer E, Smith ND. 2010. Factors controlling peatcompaction in alluvial floodplains: a case study in the cold-temperateCumberland Marshes, Canada. Journal of Sedimentary Research 80:155–166.
Van Asselen S, Stouthamer E, Van Asch TWJ. 2009. Effects of peatcompaction on delta evolution: a review on processes, responses,measuring and modeling. Earth-Science Reviews 92: 35–51.
Vierling LA. 1998. Palynological evidence for late - and postglacialenvironmental change in Central Colorado. Quaternary Research49: 222–232.
Watson CC, Biedenharn DS, Thorne CR. 2007. Stream Rehabilitation.Cottonwood Research LLC: Fort Collins, CO.
Westbrook CJ, Cooper DJ, Baker BW. 2006. Beaver dams and over-bank floods influence groundwater–surface water interactions of
Copyright © 2011 John Wiley & Sons, Ltd.
a Rocky Mountain riparian area. Water Resources Research 42:W06404.
Westbrook CJ, Cooper DJ, Baker BW. 2010. Beaver assisted rivervalley formation. River Research and Applications, Published onlinein Wiley InterScience (http://www.interscience.wiley.com) DOI:10.1002/rra.1359.
Wohl E 2001. Virtual Rivers: Lessons from the Mountain Rivers of theColorado Front Range. Yale University Press: New Haven.
Wohl E, Angermeier PL, Bledsoe B, Kondolf GM, MacDonnell L, MerrittDM, Palmer MA, Poff N , Tarboton D. 2005. River restoration. WaterResources Research 41: W10301.
Woods SW. 2000. Unpublished thesis: Hydrologic effects of the GrandDitch on streams and wetlands in Rocky Mountain National Park,Colorado. Colorado State University.
Woods SW, Cooper DJ. 2005. Hydrologic factors affecting initialwillow seedling establishment along a subalpine stream, Colorado,USA. Arctic, Antarctic, and Alpine Research 37: 636–643.
Yount JD, Niemi GJ. 1990. Recovery of lotic communities and ecosystemsfrom disturbance – a narrative review of case studies. EnvironmentalManagement 14: 547–569.
Earth Surf. Process. Landforms, Vol. 37, 209–222 (2012)
Related Documents