LETTERS Histone H2AX-dependent GABA A receptor regulation of stem cell proliferation Michael Anda ¨ng 1 , Jens Hjerling-Leffler 1 , Annalena Moliner 2 , T. Kalle Lundgren 1 , Gonc¸alo Castelo-Branco 3 , Evanthia Nanou 2 , Ester Pozas 1 , Vitezslav Bryja 1 {, Sophie Halliez 5 , Hiroshi Nishimaru 2 , Johannes Wilbertz 4 , Ernest Arenas 1 , Martin Koltzenburg 6 , Patrick Charnay 5 , Abdeljabbar El Manira 2 , Carlos F. Iban ˜ez 2 & Patrik Ernfors 1 Stem cell self-renewal implies proliferation under continued maintenance of multipotency. Small changes in numbers of stem cells may lead to large differences in differentiated cell numbers, resulting in significant physiological consequences. Proliferation is typically regulated in the G1 phase, which is associated with differentiation and cell cycle arrest 1 . However, embryonic stem (ES) cells may lack a G1 checkpoint 2,3 . Regulation of proliferation in the ‘DNA damage’ S/G2 cell cycle checkpoint pathway is known for its role in the maintenance of chromatin structural integrity 4 . Here we show that autocrine/paracrine c-aminobutyric acid (GABA) signalling by means of GABA A receptors negatively con- trols ES cell and peripheral neural crest stem (NCS) cell prolifera- tion, preimplantation embryonic growth and proliferation in the boundary-cap stem cell niche, resulting in an attenuation of neuronal progenies from this stem cell niche. Activation of GABA A receptors leads to hyperpolarization, increased cell volume and accumulation of stem cells in S phase, thereby causing a rapid decrease in cell proliferation. GABA A receptors signal through S-phase checkpoint kinases of the phosphatidylinositol-3-OH kinase-related kinase family and the histone variant H2AX. This signalling pathway critically regulates proliferation independently of differentiation, apoptosis and overt damage to DNA. These results indicate the presence of a fundamentally different mech- anism of proliferation control in these stem cells, in comparison with most somatic cells, involving proteins in the DNA damage checkpoint pathway. Expression of subunits consistent with functional GABA A recep- tors (GABA A Rs) was found in both ES cells positive for stage-specific embryonic antigen 1 (SSEA-1) and NCS cells derived from the boundary cap (BC) 5 (Fig. 1a and Supplementary Fig. 1) with a com- mon and possibly critical expression of the b3 subunit. GABA or the GABA A R-specific agonist muscimol evoked an outward current in whole-cell voltage-clamp recordings of ES cells held at 260 mV (n 5 15) and the amplitude was decreased significantly by the GABA A R-specific antagonist bicuculline (Fig. 1b and Supple- mentary Fig. 2a). With the use of the perforated-patch technique the resting membrane potential of ES cells was estimated as 226.05 6 1.93 mV (n 5 20; mean 6 s.e.m.). The GABA reversal potential calculated by measuring the amplitude of the induced cur- rent at different holding potentials showed a linear relationship that reversed at 278 mV (n 5 11) (Fig. 1c and Supplementary Fig. 2b). The patch clamp data were independently confirmed by using a voltage-sensitive dye, bis-(1,3-dibutylbarbituric acid)trimethine oxonol (DiBAC 4 (3)), in ES and NCS cells (Supplementary Figs 2c, d and 3a). Ca 21 transients were not detected in NCS cells in response to GABA A R activation (Supplementary Fig. 3b). Taken together, these data show that ES and NCS cells possess functional GABA A Rs that induce a hyperpolarizing current by means of an influx of Cl 2 . Next we examined the significance of GABA A R activation in stem cell proliferation. The rate of mitotic events was determined by exploiting the tight adhesion that occurs between daughter ES cells after mitosis, resulting in cell doublets that are identified by flow cytometry forward scattering (FSC) 2 h after dissociation (Fig. 1f). Muscimol decreased cell number (Fig. 1d,e) and mitotic events (Fig. 1f, g) in ES cell cultures and potently blocked the proliferation of NCS cells in a reversible manner (Fig. 1h and Supplementary Fig. 3c). The percentage of multipotent SSEA-1 1 ES cells and multi- potency of NCS cells was unaffected, as were colony morphology and activity and the levels of markers for survival, death or differentiation in response to the agonist (Supplementary Fig. 4). The effect of muscimol seemed to be inversely proportional to cell numbers, because high-density cultures of both cell types showed a lower res- ponse. The density dependence of responses to the agonist suggested endogenous signalling. Expression analyses of components necessary for the production and release of GABA in ES and NCS cells showed their presence in both cell types (Fig. 1a and Supplementary Figs 1, 5 and 6); vesicular GABA transporter was localized in subcellular puncta (Fig. 2a and Supplementary Fig. 5). Differentiating ES cells (namely SSEA-1 2 cells) rapidly lost expression of these markers, indicating that endogenous GABA signalling may be specific to stem cell populations (Supplementary Fig. 6). Inhibition of endogenous signalling with bicuculline in high-density ES cell cultures signifi- cantly increased cell numbers (Fig. 2b) and led to a marked increase in incorporation of bromodeoxyuridine (BrdU) into NCS cells (Fig. 2c, d). Suppression of GABA A R b3 expression by RNA inter- ference (RNAi; Supplementary Fig. 1i) led to an increase in ES cells without affecting colony morphology (Fig. 2e, f) and increased mitotic events in the 2 h cell doublet assay (Fig. 2g). These data indicate that endogenously synthesized GABA functions in an auto- crine/paracrine manner in stem cells. Consistent with unaffected cell cycle regulation at the G1–S trans- ition (Supplementary Fig. 7a), the rapid effects of muscimol (Fig. 1f, g) suggested a mechanism acting within 2 h of mitosis; that is, in late S, G2 or M phase. BrdU incorporation during 1.5 h of muscimol stimulation showed a rapid threefold decrease in DNA synthesis (Fig. 2h). Cell cycle distribution analysis by flow cytometry revealed an accumulation or decrease in ES cells in S phase after 6 h of activation or inhibition of the receptor, respectively (Fig. 2i, j); this 1 Division of Molecular Neurobiology, Department of Medical Biochemistry and Biophysics, 2 Department of Neuroscience, 3 Laboratory of Molecular Neurodevelopment, Department of Neuroscience, 4 Department of Cell and Molecular Biology, Karolinska Institutet, 171 77 Stockholm, Sweden. 5 INSERM, U 784, E ´ cole Normale Supe ´rieure, 75230 Paris Cedex 05, France. 6 Neural Plasticity Unit, Institute of Child Health, University College London, London WCIE 6BT, UK. {Present address: Institute of Biophysics Academy of Sciences of the Czech Republic and Institute of Experimental Biology, Faculty of Science, Masaryk University, 603 65 Brno, Czech Republic. Vol 451 | 24 January 2008 | doi:10.1038/nature06488 460 Nature Publishing Group ©2008

Welcome message from author
This document is posted to help you gain knowledge. Please leave a comment to let me know what you think about it! Share it to your friends and learn new things together.
Transcript
LETTERS
Histone H2AX-dependent GABAA receptor regulationof stem cell proliferationMichael Andang1, Jens Hjerling-Leffler1, Annalena Moliner2, T. Kalle Lundgren1, Goncalo Castelo-Branco3,Evanthia Nanou2, Ester Pozas1, Vitezslav Bryja1{, Sophie Halliez5, Hiroshi Nishimaru2, Johannes Wilbertz4,Ernest Arenas1, Martin Koltzenburg6, Patrick Charnay5, Abdeljabbar El Manira2, Carlos F. Ibanez2 & Patrik Ernfors1
Stem cell self-renewal implies proliferation under continuedmaintenance of multipotency. Small changes in numbers of stemcells may lead to large differences in differentiated cell numbers,resulting in significant physiological consequences. Proliferationis typically regulated in the G1 phase, which is associated withdifferentiation and cell cycle arrest1. However, embryonic stem(ES) cells may lack a G1 checkpoint2,3. Regulation of proliferationin the ‘DNA damage’ S/G2 cell cycle checkpoint pathway is knownfor its role in the maintenance of chromatin structural integrity4.Here we show that autocrine/paracrine c-aminobutyric acid(GABA) signalling by means of GABAA receptors negatively con-trols ES cell and peripheral neural crest stem (NCS) cell prolifera-tion, preimplantation embryonic growth and proliferation in theboundary-cap stem cell niche, resulting in an attenuation ofneuronal progenies from this stem cell niche. Activation of GABAA
receptors leads to hyperpolarization, increased cell volume andaccumulation of stem cells in S phase, thereby causing a rapiddecrease in cell proliferation. GABAA receptors signal throughS-phase checkpoint kinases of the phosphatidylinositol-3-OHkinase-related kinase family and the histone variant H2AX. Thissignalling pathway critically regulates proliferation independentlyof differentiation, apoptosis and overt damage to DNA. Theseresults indicate the presence of a fundamentally different mech-anism of proliferation control in these stem cells, in comparisonwith most somatic cells, involving proteins in the DNA damagecheckpoint pathway.
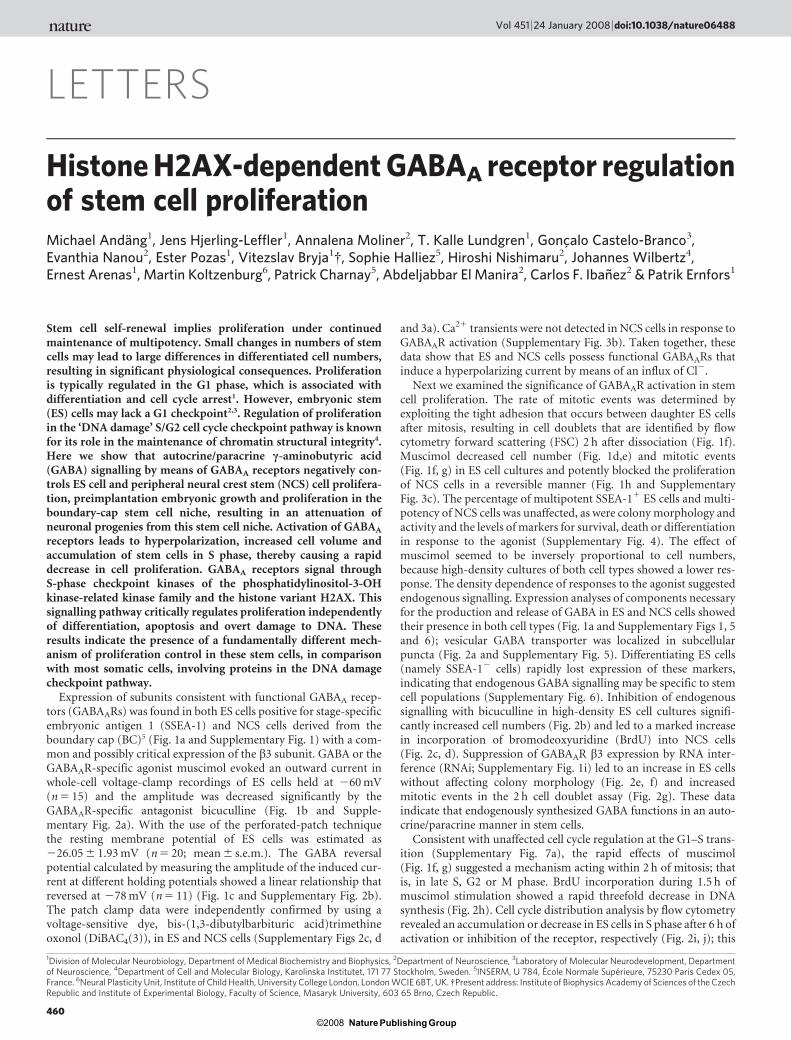
Expression of subunits consistent with functional GABAA recep-tors (GABAARs) was found in both ES cells positive for stage-specificembryonic antigen 1 (SSEA-1) and NCS cells derived from theboundary cap (BC)5 (Fig. 1a and Supplementary Fig. 1) with a com-mon and possibly critical expression of the b3 subunit. GABA or theGABAAR-specific agonist muscimol evoked an outward current inwhole-cell voltage-clamp recordings of ES cells held at 260 mV(n 5 15) and the amplitude was decreased significantly by theGABAAR-specific antagonist bicuculline (Fig. 1b and Supple-mentary Fig. 2a). With the use of the perforated-patch techniquethe resting membrane potential of ES cells was estimated as226.05 6 1.93 mV (n 5 20; mean 6 s.e.m.). The GABA reversalpotential calculated by measuring the amplitude of the induced cur-rent at different holding potentials showed a linear relationship thatreversed at 278 mV (n 5 11) (Fig. 1c and Supplementary Fig. 2b).The patch clamp data were independently confirmed by using avoltage-sensitive dye, bis-(1,3-dibutylbarbituric acid)trimethineoxonol (DiBAC4(3)), in ES and NCS cells (Supplementary Figs 2c, d
and 3a). Ca21 transients were not detected in NCS cells in response toGABAAR activation (Supplementary Fig. 3b). Taken together, thesedata show that ES and NCS cells possess functional GABAARs thatinduce a hyperpolarizing current by means of an influx of Cl2.
Next we examined the significance of GABAAR activation in stemcell proliferation. The rate of mitotic events was determined byexploiting the tight adhesion that occurs between daughter ES cellsafter mitosis, resulting in cell doublets that are identified by flowcytometry forward scattering (FSC) 2 h after dissociation (Fig. 1f).Muscimol decreased cell number (Fig. 1d,e) and mitotic events(Fig. 1f, g) in ES cell cultures and potently blocked the proliferationof NCS cells in a reversible manner (Fig. 1h and SupplementaryFig. 3c). The percentage of multipotent SSEA-11 ES cells and multi-potency of NCS cells was unaffected, as were colony morphology andactivity and the levels of markers for survival, death or differentiationin response to the agonist (Supplementary Fig. 4). The effect ofmuscimol seemed to be inversely proportional to cell numbers,because high-density cultures of both cell types showed a lower res-ponse. The density dependence of responses to the agonist suggestedendogenous signalling. Expression analyses of components necessaryfor the production and release of GABA in ES and NCS cells showedtheir presence in both cell types (Fig. 1a and Supplementary Figs 1, 5and 6); vesicular GABA transporter was localized in subcellularpuncta (Fig. 2a and Supplementary Fig. 5). Differentiating ES cells(namely SSEA-12 cells) rapidly lost expression of these markers,indicating that endogenous GABA signalling may be specific to stemcell populations (Supplementary Fig. 6). Inhibition of endogenoussignalling with bicuculline in high-density ES cell cultures signifi-cantly increased cell numbers (Fig. 2b) and led to a marked increasein incorporation of bromodeoxyuridine (BrdU) into NCS cells(Fig. 2c, d). Suppression of GABAAR b3 expression by RNA inter-ference (RNAi; Supplementary Fig. 1i) led to an increase in ES cellswithout affecting colony morphology (Fig. 2e, f) and increasedmitotic events in the 2 h cell doublet assay (Fig. 2g). These dataindicate that endogenously synthesized GABA functions in an auto-crine/paracrine manner in stem cells.
Consistent with unaffected cell cycle regulation at the G1–S trans-ition (Supplementary Fig. 7a), the rapid effects of muscimol(Fig. 1f, g) suggested a mechanism acting within 2 h of mitosis; thatis, in late S, G2 or M phase. BrdU incorporation during 1.5 h ofmuscimol stimulation showed a rapid threefold decrease in DNAsynthesis (Fig. 2h). Cell cycle distribution analysis by flow cytometryrevealed an accumulation or decrease in ES cells in S phase after 6 h ofactivation or inhibition of the receptor, respectively (Fig. 2i, j); this
1Division of Molecular Neurobiology, Department of Medical Biochemistry and Biophysics, 2Department of Neuroscience, 3Laboratory of Molecular Neurodevelopment, Departmentof Neuroscience, 4Department of Cell and Molecular Biology, Karolinska Institutet, 171 77 Stockholm, Sweden. 5INSERM, U 784, Ecole Normale Superieure, 75230 Paris Cedex 05,France. 6Neural Plasticity Unit, Institute of Child Health, University College London, London WCIE 6BT, UK. {Present address: Institute of Biophysics Academy of Sciences of the CzechRepublic and Institute of Experimental Biology, Faculty of Science, Masaryk University, 603 65 Brno, Czech Republic.
Vol 451 | 24 January 2008 | doi:10.1038/nature06488
460Nature Publishing Group©2008
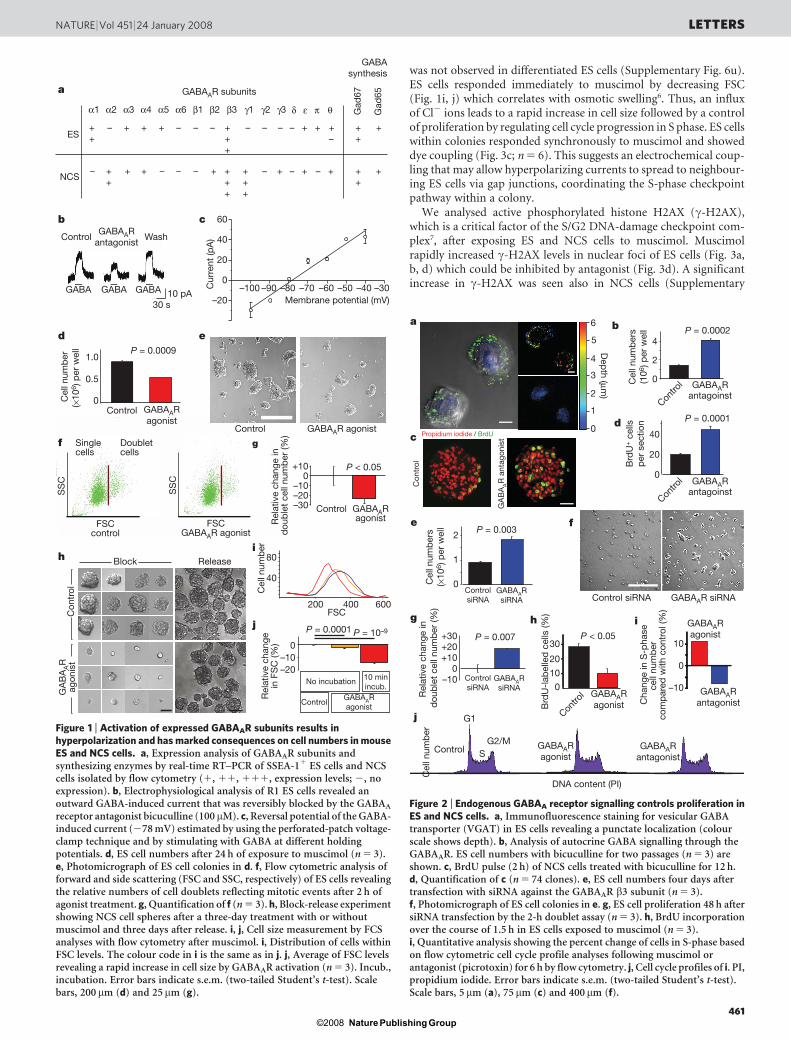
was not observed in differentiated ES cells (Supplementary Fig. 6u).ES cells responded immediately to muscimol by decreasing FSC(Fig. 1i, j) which correlates with osmotic swelling6. Thus, an influxof Cl2 ions leads to a rapid increase in cell size followed by a controlof proliferation by regulating cell cycle progression in S phase. ES cellswithin colonies responded synchronously to muscimol and showeddye coupling (Fig. 3c; n 5 6). This suggests an electrochemical coup-ling that may allow hyperpolarizing currents to spread to neighbour-ing ES cells via gap junctions, coordinating the S-phase checkpointpathway within a colony.
We analysed active phosphorylated histone H2AX (c-H2AX),which is a critical factor of the S/G2 DNA-damage checkpoint com-plex7, after exposing ES and NCS cells to muscimol. Muscimolrapidly increased c-H2AX levels in nuclear foci of ES cells (Fig. 3a,b, d) which could be inhibited by antagonist (Fig. 3d). A significantincrease in c-H2AX was seen also in NCS cells (Supplementary
P = 0.0009
Control
1.0
0.5
0GABAARagonist
0–10–20–30
+10
GABAARagonist
GA
BA
AR
agon
ist
Control
P < 0.05
ReleaseBlock
Con
trol
d
Singlecells
Doubletcells
FSCcontrol
SS
C
SS
C
FSCGABAAR agonist
f
h
200 400 600
40
80
–20
ControlGABAARagonist
No incubation 10 minincub.
P = 0.0001 P = 10–9
Cel
l num
ber
Rel
ativ
e ch
ange
in F
SC
(%)
FSCj
i
0 –10
Control WashGABAAR
antagonist
10 pA30 s
GABA GABAGABA
c
Membrane potential (mV)–30–40–50–60–70–80–90–100C
urre
nt (p
A)
–20
20
40
60
0
b
e
g
Rel
ativ
e ch
ange
in
dou
ble
t ce
ll nu
mb
er (%
)
a
α1 α2 α3 α4 α5 α6 β1 β2 β3 γ1 γ2 γ3
++
– + + + – – – +++
– – – – + + +–
++
+
– ++
+ + – – – + +++
+++
– + – + – + ++
+
Gad
67
Gad
65
GABAsynthesis
GABAAR subunits
δ ε π θ
ES
NCS
Cel
l num
ber
(×10
6 ) p
er w
ell
GABAAR agonistControl
Figure 1 | Activation of expressed GABAAR subunits results inhyperpolarization and has marked consequences on cell numbers in mouseES and NCS cells. a, Expression analysis of GABAAR subunits andsynthesizing enzymes by real-time RT–PCR of SSEA-11 ES cells and NCScells isolated by flow cytometry (1, 11, 111, expression levels; 2, noexpression). b, Electrophysiological analysis of R1 ES cells revealed anoutward GABA-induced current that was reversibly blocked by the GABAA
receptor antagonist bicuculline (100mM). c, Reversal potential of the GABA-induced current (278 mV) estimated by using the perforated-patch voltage-clamp technique and by stimulating with GABA at different holdingpotentials. d, ES cell numbers after 24 h of exposure to muscimol (n 5 3).e, Photomicrograph of ES cell colonies in d. f, Flow cytometric analysis offorward and side scattering (FSC and SSC, respectively) of ES cells revealingthe relative numbers of cell doublets reflecting mitotic events after 2 h ofagonist treatment. g, Quantification of f (n 5 3). h, Block-release experimentshowing NCS cell spheres after a three-day treatment with or withoutmuscimol and three days after release. i, j, Cell size measurement by FCSanalyses with flow cytometry after muscimol. i, Distribution of cells withinFSC levels. The colour code in i is the same as in j. j, Average of FSC levelsrevealing a rapid increase in cell size by GABAAR activation (n 5 3). Incub.,incubation. Error bars indicate s.e.m. (two-tailed Student’s t-test). Scalebars, 200mm (d) and 25mm (g).
0
2
4P = 0.0002
e
0
1
2
ControlsiRNA
GABAARsiRNA
ControlsiRNA
GABAARsiRNA
P = 0.003
–100
+10+20+30 P = 0.007
Rel
ativ
e ch
ange
in
dou
ble
t ce
ll nu
mb
er (%
)
f
g
ba
3
2
1
0
4
5
Dep
th (µm)
6
Propidium iodide / BrdU
Con
trol
c
GA
BA
AR
ant
agon
ist
Contro
l GABAARantagoinst
Contro
l GABAARantagoinst
d
Brd
U+ c
ells
per
sec
tion
20
0
40
P = 0.0001
Cel
l num
ber
s (1
06) p
er w
ell
Cel
l num
ber
s ( ×
106 )
per
wel
l
Control siRNA GABAAR siRNA
Contro
l0
10
20
30
Brd
U-l
abel
led
cel
ls (%
)
hP < 0.05
SG2/M
G1
Cel
l num
ber
DNA content (PI)
i
Control
Cha
nge
in S
-pha
sece
ll nu
mb
er
com
par
ed w
ith c
ontr
ol (%
)
GABAARagonist
GABAARantagonist
j
–10
0
10
GABAARagonist
GABAARantagonist
GABAARagonist
Figure 2 | Endogenous GABAA receptor signalling controls proliferation inES and NCS cells. a, Immunofluorescence staining for vesicular GABAtransporter (VGAT) in ES cells revealing a punctate localization (colourscale shows depth). b, Analysis of autocrine GABA signalling through theGABAAR. ES cell numbers with bicuculline for two passages (n 5 3) areshown. c, BrdU pulse (2 h) of NCS cells treated with bicuculline for 12 h.d, Quantification of c (n 5 74 clones). e, ES cell numbers four days aftertransfection with siRNA against the GABAAR b3 subunit (n 5 3).f, Photomicrograph of ES cell colonies in e. g, ES cell proliferation 48 h aftersiRNA transfection by the 2-h doublet assay (n 5 3). h, BrdU incorporationover the course of 1.5 h in ES cells exposed to muscimol (n 5 3).i, Quantitative analysis showing the percent change of cells in S-phase basedon flow cytometric cell cycle profile analyses following muscimol orantagonist (picrotoxin) for 6 h by flow cytometry. j, Cell cycle profiles of i. PI,propidium iodide. Error bars indicate s.e.m. (two-tailed Student’s t-test).Scale bars, 5mm (a), 75 mm (c) and 400mm (f).
NATURE | Vol 451 | 24 January 2008 LETTERS
461Nature Publishing Group©2008
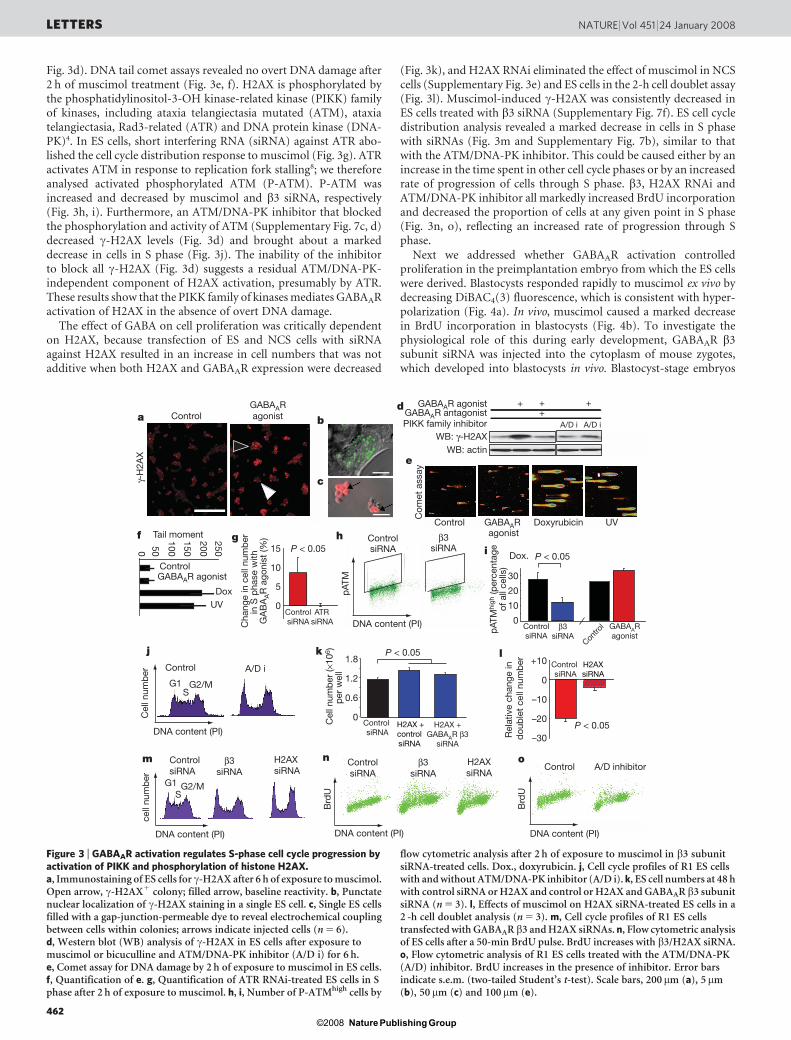
Fig. 3d). DNA tail comet assays revealed no overt DNA damage after2 h of muscimol treatment (Fig. 3e, f). H2AX is phosphorylated bythe phosphatidylinositol-3-OH kinase-related kinase (PIKK) familyof kinases, including ataxia telangiectasia mutated (ATM), ataxiatelangiectasia, Rad3-related (ATR) and DNA protein kinase (DNA-PK)4. In ES cells, short interfering RNA (siRNA) against ATR abo-lished the cell cycle distribution response to muscimol (Fig. 3g). ATRactivates ATM in response to replication fork stalling8; we thereforeanalysed activated phosphorylated ATM (P-ATM). P-ATM wasincreased and decreased by muscimol and b3 siRNA, respectively(Fig. 3h, i). Furthermore, an ATM/DNA-PK inhibitor that blockedthe phosphorylation and activity of ATM (Supplementary Fig. 7c, d)decreased c-H2AX levels (Fig. 3d) and brought about a markeddecrease in cells in S phase (Fig. 3j). The inability of the inhibitorto block all c-H2AX (Fig. 3d) suggests a residual ATM/DNA-PK-independent component of H2AX activation, presumably by ATR.These results show that the PIKK family of kinases mediates GABAARactivation of H2AX in the absence of overt DNA damage.
The effect of GABA on cell proliferation was critically dependenton H2AX, because transfection of ES and NCS cells with siRNAagainst H2AX resulted in an increase in cell numbers that was notadditive when both H2AX and GABAAR expression were decreased
(Fig. 3k), and H2AX RNAi eliminated the effect of muscimol in NCScells (Supplementary Fig. 3e) and ES cells in the 2-h cell doublet assay(Fig. 3l). Muscimol-induced c-H2AX was consistently decreased inES cells treated with b3 siRNA (Supplementary Fig. 7f). ES cell cycledistribution analysis revealed a marked decrease in cells in S phasewith siRNAs (Fig. 3m and Supplementary Fig. 7b), similar to thatwith the ATM/DNA-PK inhibitor. This could be caused either by anincrease in the time spent in other cell cycle phases or by an increasedrate of progression of cells through S phase. b3, H2AX RNAi andATM/DNA-PK inhibitor all markedly increased BrdU incorporationand decreased the proportion of cells at any given point in S phase(Fig. 3n, o), reflecting an increased rate of progression through Sphase.
Next we addressed whether GABAAR activation controlledproliferation in the preimplantation embryo from which the ES cellswere derived. Blastocysts responded rapidly to muscimol ex vivo bydecreasing DiBAC4(3) fluorescence, which is consistent with hyper-polarization (Fig. 4a). In vivo, muscimol caused a marked decreasein BrdU incorporation in blastocysts (Fig. 4b). To investigate thephysiological role of this during early development, GABAAR b3subunit siRNA was injected into the cytoplasm of mouse zygotes,which developed into blastocysts in vivo. Blastocyst-stage embryos
e
GABAARagonist
γ-H
2AX
l
a
A/D i
d
G1S
G2/M
Control siRNA
H2AX siRNA
cell
num
ber
n
G1S
G2/M
DNA content (PI)
β3siRNA
m
Control siRNA
H2AX siRNA
–10
+10
0
Rel
ativ
e ch
ange
in
dou
ble
t ce
ll nu
mb
er
–30
–20P < 0.05
0
0.6
1.2
1.8
Control siRNA
H2AX +control siRNA
H2AX +GABAAR β3
siRNA
P < 0.05
Cel
l num
ber
(×10
6 )p
er w
ell
WB: actinWB: γ-H2AX
A/D i
GABAAR agonistGABAAR antagonist
+ ++
PIKK family inhibitor+
A/D i
Dox.
c
Com
et a
ssay
Control
ControlGABAAR agonist
DoxUV
0 50
100
150
200
250
Tail moment
k
gf h
DNA content (PI)
pAT
M
ControlsiRNA
β3siRNA
Control A/D inhibitor
DNA content (PI)
Brd
U
DNA content (PI)
Brd
U
ControlsiRNA
β3siRNA
H2AXsiRNA
o
0
5
10
15
ControlsiRNA
ATRsiRNAC
hang
e in
cel
l num
ber
in S
pha
se w
ith
GA
BA
AR
ago
nist
(%)
i
j
Cel
l num
ber
DNA content (PI)
0
10
20
30
pAT
Mhi
gh (p
erce
ntag
eof
all
cells
)
ControlsiRNA
β3siRNA
GABAARagonist
Contro
l
P < 0.05P < 0.05
b
GABAAR agonist
Control Doxyrubicin UV
Control
Figure 3 | GABAAR activation regulates S-phase cell cycle progression byactivation of PIKK and phosphorylation of histone H2AX.a, Immunostaining of ES cells for c-H2AX after 6 h of exposure to muscimol.Open arrow, c-H2AX1 colony; filled arrow, baseline reactivity. b, Punctatenuclear localization of c-H2AX staining in a single ES cell. c, Single ES cellsfilled with a gap-junction-permeable dye to reveal electrochemical couplingbetween cells within colonies; arrows indicate injected cells (n 5 6).d, Western blot (WB) analysis of c-H2AX in ES cells after exposure tomuscimol or bicuculline and ATM/DNA-PK inhibitor (A/D i) for 6 h.e, Comet assay for DNA damage by 2 h of exposure to muscimol in ES cells.f, Quantification of e. g, Quantification of ATR RNAi-treated ES cells in Sphase after 2 h of exposure to muscimol. h, i, Number of P-ATMhigh cells by
flow cytometric analysis after 2 h of exposure to muscimol in b3 subunitsiRNA-treated cells. Dox., doxyrubicin. j, Cell cycle profiles of R1 ES cellswith and without ATM/DNA-PK inhibitor (A/D i). k, ES cell numbers at 48 hwith control siRNA or H2AX and control or H2AX and GABAAR b3 subunitsiRNA (n 5 3). l, Effects of muscimol on H2AX siRNA-treated ES cells in a2 -h cell doublet analysis (n 5 3). m, Cell cycle profiles of R1 ES cellstransfected with GABAAR b3 and H2AX siRNAs. n, Flow cytometric analysisof ES cells after a 50-min BrdU pulse. BrdU increases with b3/H2AX siRNA.o, Flow cytometric analysis of R1 ES cells treated with the ATM/DNA-PK(A/D) inhibitor. BrdU increases in the presence of inhibitor. Error barsindicate s.e.m. (two-tailed Student’s t-test). Scale bars, 200mm (a), 5mm(b), 50 mm (c) and 100mm (e).
LETTERS NATURE | Vol 451 | 24 January 2008
462Nature Publishing Group©2008
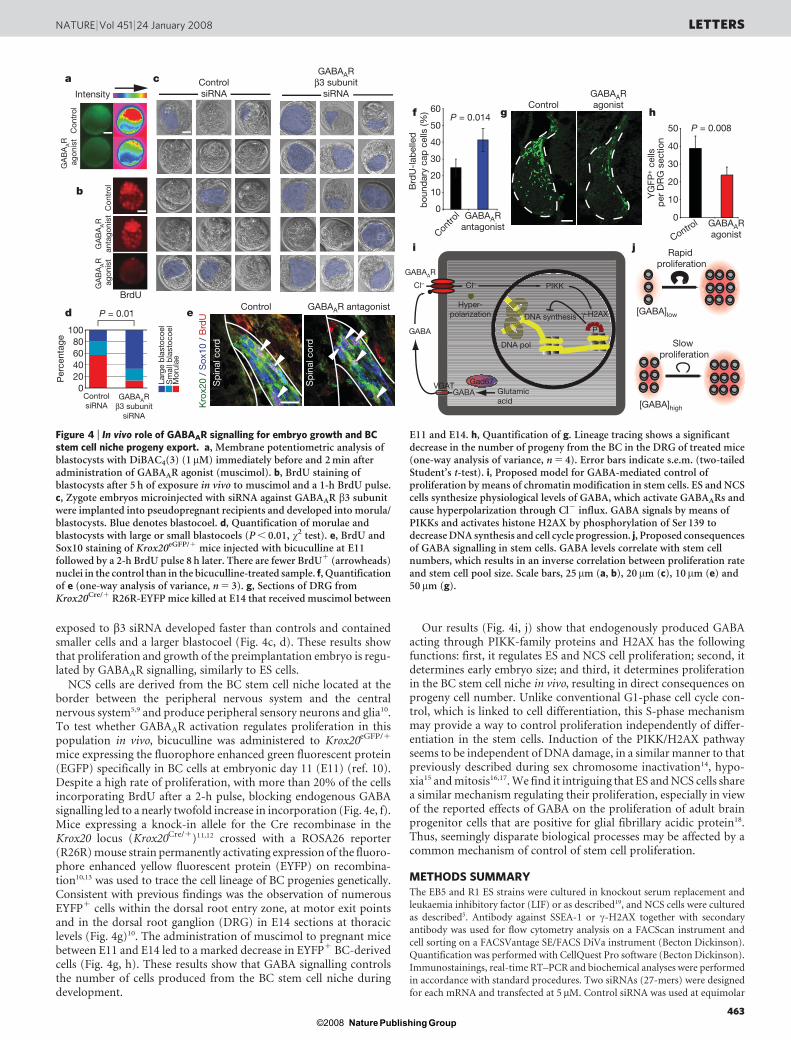
exposed to b3 siRNA developed faster than controls and containedsmaller cells and a larger blastocoel (Fig. 4c, d). These results showthat proliferation and growth of the preimplantation embryo is regu-lated by GABAAR signalling, similarly to ES cells.
NCS cells are derived from the BC stem cell niche located at theborder between the peripheral nervous system and the centralnervous system5,9 and produce peripheral sensory neurons and glia10.To test whether GABAAR activation regulates proliferation in thispopulation in vivo, bicuculline was administered to Krox20eGFP/1
mice expressing the fluorophore enhanced green fluorescent protein(EGFP) specifically in BC cells at embryonic day 11 (E11) (ref. 10).Despite a high rate of proliferation, with more than 20% of the cellsincorporating BrdU after a 2-h pulse, blocking endogenous GABAsignalling led to a nearly twofold increase in incorporation (Fig. 4e, f).Mice expressing a knock-in allele for the Cre recombinase in theKrox20 locus (Krox20Cre/1)11,12 crossed with a ROSA26 reporter(R26R) mouse strain permanently activating expression of the fluoro-phore enhanced yellow fluorescent protein (EYFP) on recombina-tion10,13 was used to trace the cell lineage of BC progenies genetically.Consistent with previous findings was the observation of numerousEYFP1 cells within the dorsal root entry zone, at motor exit pointsand in the dorsal root ganglion (DRG) in E14 sections at thoraciclevels (Fig. 4g)10. The administration of muscimol to pregnant micebetween E11 and E14 led to a marked decrease in EYFP1 BC-derivedcells (Fig. 4g, h). These results show that GABA signalling controlsthe number of cells produced from the BC stem cell niche duringdevelopment.
Our results (Fig. 4i, j) show that endogenously produced GABAacting through PIKK-family proteins and H2AX has the followingfunctions: first, it regulates ES and NCS cell proliferation; second, itdetermines early embryo size; and third, it determines proliferationin the BC stem cell niche in vivo, resulting in direct consequences onprogeny cell number. Unlike conventional G1-phase cell cycle con-trol, which is linked to cell differentiation, this S-phase mechanismmay provide a way to control proliferation independently of differ-entiation in the stem cells. Induction of the PIKK/H2AX pathwayseems to be independent of DNA damage, in a similar manner to thatpreviously described during sex chromosome inactivation14, hypo-xia15 and mitosis16,17. We find it intriguing that ES and NCS cells sharea similar mechanism regulating their proliferation, especially in viewof the reported effects of GABA on the proliferation of adult brainprogenitor cells that are positive for glial fibrillary acidic protein18.Thus, seemingly disparate biological processes may be affected by acommon mechanism of control of stem cell proliferation.
METHODS SUMMARYThe EB5 and R1 ES strains were cultured in knockout serum replacement and
leukaemia inhibitory factor (LIF) or as described19, and NCS cells were cultured
as described5. Antibody against SSEA-1 or c-H2AX together with secondary
antibody was used for flow cytometry analysis on a FACScan instrument and
cell sorting on a FACSVantage SE/FACS DiVa instrument (Becton Dickinson).
Quantification was performed with CellQuest Pro software (Becton Dickinson).
Immunostainings, real-time RT–PCR and biochemical analyses were performed
in accordance with standard procedures. Two siRNAs (27-mers) were designed
for each mRNA and transfected at 5 mM. Control siRNA was used at equimolar
Con
trol
020406080
100
Mor
ulae
Sm
all b
last
ocoe
lLa
rge
bla
stoc
oel
ControlsiRNA
GABAARβ3 subunit
siRNA
BrdU
Per
cent
age
a
b
cIntensity
d
ControlsiRNA
GA
BA
AR
anta
goni
stG
AB
AAR
ago
nist
0
10
20
30
40
50
60
Contro
l
Brd
U-l
abel
led
bou
ndar
y ca
p c
ells
(%)
Control0
10
20
30
40
50
YG
FP+ c
ells
p
er D
RG
sec
tion
Controlg hf
Sp
inal
cor
d
Sp
inal
cor
d
Control
Kro
x20
/ S
ox10
/ B
rdU
GABAAR antagonist
GABAARagonist
GABAARantagonist GABAAR
agonist
P = 0.01
P = 0.008P = 0.014
[GABA]low
[GABA]high
Slow proliferation
Rapid proliferation
DNA pol
γ-H2AX
GABA
Gad67VGATGlutamicacid
GABAAR
P
Hyper-polarization
GABA
Cl– Cl– PIKK
ji
GA
BA
AR
ago
nist
Con
trol
DNA synthesise
GABAARβ3 subunit
siRNA
Figure 4 | In vivo role of GABAAR signalling for embryo growth and BCstem cell niche progeny export. a, Membrane potentiometric analysis ofblastocysts with DiBAC4(3) (1mM) immediately before and 2 min afteradministration of GABAAR agonist (muscimol). b, BrdU staining ofblastocysts after 5 h of exposure in vivo to muscimol and a 1-h BrdU pulse.c, Zygote embryos microinjected with siRNA against GABAAR b3 subunitwere implanted into pseudopregnant recipients and developed into morula/blastocysts. Blue denotes blastocoel. d, Quantification of morulae andblastocysts with large or small blastocoels (P , 0.01, x2 test). e, BrdU andSox10 staining of Krox20eGFP/1 mice injected with bicuculline at E11followed by a 2-h BrdU pulse 8 h later. There are fewer BrdU1 (arrowheads)nuclei in the control than in the bicuculline-treated sample. f, Quantificationof e (one-way analysis of variance, n 5 3). g, Sections of DRG fromKrox20Cre/1 R26R-EYFP mice killed at E14 that received muscimol between
E11 and E14. h, Quantification of g. Lineage tracing shows a significantdecrease in the number of progeny from the BC in the DRG of treated mice(one-way analysis of variance, n 5 4). Error bars indicate s.e.m. (two-tailedStudent’s t-test). i, Proposed model for GABA-mediated control ofproliferation by means of chromatin modification in stem cells. ES and NCScells synthesize physiological levels of GABA, which activate GABAARs andcause hyperpolarization through Cl2 influx. GABA signals by means ofPIKKs and activates histone H2AX by phosphorylation of Ser 139 todecrease DNA synthesis and cell cycle progression. j, Proposed consequencesof GABA signalling in stem cells. GABA levels correlate with stem cellnumbers, which results in an inverse correlation between proliferation rateand stem cell pool size. Scale bars, 25 mm (a, b), 20 mm (c), 10mm (e) and50 mm (g).
NATURE | Vol 451 | 24 January 2008 LETTERS
463Nature Publishing Group©2008
levels. For in vivo analyses, zygotes were injected into the cytoplasm with 10 pl of20 mM siRNA. Picrotoxin, bicuculline and muscimol were used at 50, 20 and
100mM, respectively, on cultured cells with controls receiving vehicle. For
experiments in vivo, bicuculline or muscimol was diluted in PBS and adminis-
tered intraperitoneally to pregnant females at 4 mg kg21; for long-term experi-
ments this dose was given twice a day. BrdU (50 mg kg21, in PBS) was
administered intraperitoneally. Mice were held on a pure C57/Bl6 or mixed
C57Bl6/DBA2 background10. ATM/DNA-PK inhibitor (Calbiochem) was used
at 10mM.
Full Methods and any associated references are available in the online version ofthe paper at www.nature.com/nature.
Received 24 August; accepted 22 November 2007.Published online 9 January 2008.
1. Zhu, L. & Skoultchi, A. I. Coordinating cell proliferation and differentiation. Curr.Opin. Genet. Dev. 11, 91–97 (2001).
2. Savatier, P., Huang, S., Szekely, L., Wiman, K. G. & Samarut, J. Contrasting patternsof retinoblastoma protein expression in mouse embryonic stem cells andembryonic fibroblasts. Oncogene 9, 809–818 (1994).
3. Burdon, T., Smith, A. & Savatier, P. Signalling, cell cycle and pluripotency inembryonic stem cells. Trends Cell Biol. 12, 432–438 (2002).
4. Bartek, J., Lukas, C. & Lukas, J. Checking on DNA damage in S phase. Nature Rev.Mol. Cell Biol. 5, 792–804 (2004).
5. Hjerling-Leffler, J. et al. The boundary cap: a source of neural crest stem cells thatgenerate multiple sensory neuron subtypes. Development 132, 2623–2632(2005).
6. McGann, L. E., Walterson, M. L. & Hogg, L. M. Light scattering and cell volumes inosmotically stressed and frozen-thawed cells. Cytometry 9, 33–38 (1988).
7. Fernandez-Capetillo, O., Lee, A., Nussenzweig, M. & Nussenzweig, A. H2AX: thehistone guardian of the genome. DNA Repair (Amst.) 3, 959–967 (2004).
8. Stiff, T. et al. ATR-dependent phosphorylation and activation of ATM in responseto UV treatment or replication fork stalling. EMBO J. 25, 5775–5782 (2006).
9. Altman, J. & Bayer, S. A. The development of the rat spinal cord. Adv. Anat.Embryol. Cell Biol. 85, 1–164 (1984).
10. Maro, G. S. et al. Neural crest boundary cap cells constitute a source of neuronaland glial cells of the PNS. Nature Neurosci. 7, 930–938 (2004).
11. Voiculescu, O. et al. Hindbrain patterning: Krox20 couples segmentation andspecification of regional identity. Development 128, 4967–4978 (2001).
12. Voiculescu, O., Charnay, P. & Schneider-Maunoury, S. Expression pattern of aKrox-20/Cre knock-in allele in the developing hindbrain, bones, and peripheralnervous system. Genesis 26, 123–126 (2000).
13. Srinivas, S. et al. Cre reporter strains produced by targeted insertion of EYFP andECFP into the ROSA26 locus. BMC Dev. Biol. 1, 4 (2001).
14. Fernandez-Capetillo, O. et al. H2AX is required for chromatin remodeling andinactivation of sex chromosomes in male mouse meiosis. Dev. Cell 4, 497–508(2003).
15. Hammond, E. M., Dorie, M. J. & Giaccia, A. J. Inhibition of ATR leads to increasedsensitivity to hypoxia/reoxygenation. Cancer Res. 64, 6556–6562 (2004).
16. McManus, K. J. & Hendzel, M. J. ATM-dependent DNA damage-independentmitotic phosphorylation of H2AX in normally growing mammalian cells. Mol. Biol.Cell 16, 5013–5025 (2005).
17. Ichijima, Y. et al. Phosphorylation of histone H2AX at M phase in human cellswithout DNA damage response. Biochem. Biophys. Res. Commun. 336, 807–812(2005).
18. Liu, X., Wang, Q., Haydar, T. F. & Bordey, A. Nonsynaptic GABA signaling inpostnatal subventricular zone controls proliferation of GFAP-expressingprogenitors. Nature Neurosci. 8, 1179–1187 (2005).
19. Ying, Q. L., Nichols, J., Chambers, I. & Smith, A. BMP induction of Id proteinssuppresses differentiation and sustains embryonic stem cell self-renewal incollaboration with STAT3. Cell 115, 281–292 (2003).
Supplementary Information is linked to the online version of the paper atwww.nature.com/nature.
Acknowledgements We thank T. Harkany and O. Kiehn for discussions, B. Westerfor help with flow cytometry, and J. O. Bratteng for embryo injections. This workwas supported by the Swedish Research Council (P.E., C.F.I. and A.E.M), theSwedish foundation for strategic research, CEDB and DBRM grants, SwedishCancer Foundation, the Swedish Brain Foundation and Bertil Hallsten ResearchFoundation (P.E.), the Marianne and Marcus Wallenberg Foundation (C.F.I.) andthe Karolinska Institutet (A.E.M.). M.A. was supported by grants from theKarolinska Institutet and the Swedish Brain Foundation. G.C.-B. was supported bythe Swedish Brain Foundation.
Author Contributions M.A. was the main contributor to the work on ES cells; J.H.-L.was the main contributor to the work on NCS cells.
Author Information Reprints and permissions information is available atwww.nature.com/reprints. Correspondence and requests for materials should beaddressed to P.E. ([email protected]).
LETTERS NATURE | Vol 451 | 24 January 2008
464Nature Publishing Group©2008
METHODSCell culture. The ES EB5 strain was used for most experiments, and the R1 ES cell
strain cultured on feeder cells was used for confirmation experiments. EB5 cells
were cultured in serum-free medium (Knockout DMEM, 15% Knockout
Serum Replacement, 1 3 non-essential amino acids, 2 mM glutamine, 0.4 mM
2-mercaptoethanol, all from Gibco) or in DMEM/F12, N2 supplement, 0.4 mM
2-mercaptoethanol, 5 mM HEPES, 10 ng ml21 basic fibroblast growth factor
(modified from ref. 19) and 1,000 U ml21 ESGRO (Chemicon) in suspension
or on tissue culture plates coated with 0.1% gelatin. For experiments and cell
counts, ES cells were grown on six-well plates. The NCS cells were isolated andcultured as described previously5. ES cells were differentiated in DMEM and 10%
FCS without LIF.
Mouse lines. All mouse lines used in this study were maintained in either a
pure C57/Bl6 or a mixed C57Bl6/DBA2 background. In the Krox20Cre/1 and
Krox20GFP/1 alleles, the Krox20 coding sequence was replaced by the Cre recom-
binase coding sequence and EGFP, respectively. R26R-EYFP expresses EYFP
from the ROSA locus on Cre recombination.
Flow cytometry. For live cell sorting and analysis, cells were dissociated and
incubated in primary antibody against SSEA-1 (diluted 1:400 in PBS including
1% BSA; Developmental Studies Hybridoma Bank) for 1 h at 4 uC, followed by
incubation in fluorescein isothiocyanate (FITC)-conjugated secondary antibody
(diluted 1:400; Jackson Immuno Research) for 1 h at 4 uC followed by incubation
in PBS with 1% BSA and 1mg ml21 propidium iodide (Sigma) to discern dead
cells. Negative controls were treated identically but without primary antibody.
ES cell doublet analysis was performed by first passaging to single cells by
incubation in TrypLE Express (Invitrogen) for 15 min at 37 uC and filtering
through a 40-mm filter. The cells were then checked in a microscope to ensure
that only single cells were present. The cells were then incubated for 2 h at lowdensity under non-adherent conditions in Petri dishes. After the addition of
propidium iodide to discern dead cells, live cells were analysed for forward
and side scattering and the population of cell doublets was gated and quantified.
For cell cycle analysis, cells were fixed overnight with 70% ethanol and re-
hydrated in PBS with RNase and propidium iodide. For double staining with
propidium iodide and c-H2AX (c-H2AX diluted 1:400; Upstate) cells were fixed
briefly with 4% paraformaldehyde in PBS before immunostaining. Cell analysis
was performed on a FACScan instrument and cell sorting on a FACSVantage
SE/FACS DiVa instrument (Becton Dickinson). Cell cycle analysis and quanti-
fication were performed with CellQuest Pro software (Becton Dickinson).
Electrophysiology. Whole-cell and perforated-patch voltage-clamp recordings
were used to monitor the effect of GABA in ES cells by using the Axopatch 200A
amplifier (Axon Instruments). Whole-cell recordings were made with an intra-
cellular solution containing (in mM): potassium gluconate 120, KCl 5, CaCl20.0001, Mg2ATP 4, Na4GTP 0.3, HEPES 10, Na2 phosphocreatine 10; pH
adjusted to 7.4 with KOH, 275–280 osM. For perforated-patch recordings the
tip of the pipette was filled by dipping it briefly (for less than 1 s) into the normal
intracellular solution. The rest of the pipette was filled with amphotericin B(240mg ml21 intracellular solution). The cells were continuously perfused with
culture medium through a gravity-driven microperfusion system with the
nozzle positioned close to the recorded cell. The different drugs were added to
this solution at appropriate concentrations. Data were acquired and analysed
with pClamp software (Axon Instruments). For cell-coupling experiments a gap-
junction-permeable dye was injected through the patch pipette during whole-
cell patch-clamp recordings.
Immunostaining and western blotting. Cells and sections were fixed in 4%
paraformaldehyde in PBS (pH 7.4). Blastocysts were treated with Tyrode’s solu-
tion (Sigma) to remove the zona pellucida, fixed in 4% paraformaldehyde and
dried on Superfrost Plus glass slides (Microm) before immunostaining.
After being blocked for 2 h in PBS containing 3% BSA and 0.3% Triton X-100
and after two washes in PBS, cells were incubated in primary antibody against
VGAT (diluted 1:400; Advanced Targeting Systems), GABAAR b3 subunit
(diluted 1:1,000; Chemicon), Gad67 (diluted 1:1,000; Chemicon), GABA
(diluted 1:2,000; Sigma), BrdU-FITC (diluted 1:200; Becton Dickinson),
c-H2AX (diluted 1:400; Upstate), Sox10 (guinea pig, diluted 1:1,000, gift from
M. Wegner); SSEA-1 (mouse, diluted 1:400; Chemicon); monoamino oxidase B
(rabbit, diluted 1:2,000, gift from O. Cases), Sox2 (diluted 1:400; Chemicon),
Oct4 (diluted 1:400; Chemicon), BrdU (rat, diluted 1:125; AbCam), phospho-
ATM (diluted 1:200; Cell Signaling) and ATM/ATR substrate (diluted 1:200; Cell
Signaling) in PBS containing 1% BSA and 0.3% Triton X-100. For immuno-
staining against GABA, cells were also fixed with 1% glutaraldehyde. For anti-
BrdU staining, cells were treated with 0.1 M HCl before being stained.
Imaging was performed with an Axiovert 100M microscope (Zeiss) equipped
with a Hamamatsu C4742-95 digital camera and Openlab 5 software
(Improvision) or an Axioplan 2 microscope (Zeiss) with an LSM 510 system
and software (Zeiss) for confocal imaging.
Western blotting was performed as described20 with anti-c-H2AX (diluted
1:1,000; Upstate), ATM/ATR substrate (diluted 1:1,000, Cell Signaling) and
phospho-ATM (diluted 1:800; Cell Signaling) antibodies. Secondary antibodies
were conjugated with horseradish peroxidase (GE Healthcare) and films were
developed with the ECL enhanced chemiluminescence system (GE Healthcare).
Real-time RT–PCR. A detailed description is given in Supplementary
Information. In brief, total RNA was isolated with an RNeasy extraction kit
(Qiagen), reverse transcription was performed with Superscript II enzyme(Invitrogen), primers were designed with Primer Express software (Applied
Biosystems) and real-time PCR was conducted with the SYBR green detection
method on an ABI PRISM 7000 instrument (Applied Biosystems).
siRNA. Two siRNAs (27-mers, synthesized by MWG Biotech) were designed for
each mRNA, pooled or used separated and transfected at 5 mM each. Control
siRNA was used at equimolar levels. Transfections were performed with
Lipofectamine 2000 (Invitrogen). siRNA sequences were as follows: GABAAR
b3-(siRNA1), 59-GCUACACUACGGAUGACAUUGAAUUUU-39; GABAAR b3-
(siRNA2), 59-AGAAUGAUCGUUCUAAGAGUGAAAUAA-39; H2AX-(siRNA1),
59-CAAACACCUAGAUACCAGCACAAGCCG-39; H2AX-(siRNA2), 59-GACA-
AGAGUUCUAUACCUGCCGCAGGC-39; ATR-(siRNA1), 59-AAAAGCAGUU-
CUCCAGGAAUAUAGAAA-39 ATR-(siRNA2), 59-CCAAAGACAGUUGUAUU-
GAAUUCCGCG-39; control siRNA21, 59-AAGCUGACCCUGAAGUUCAUCU-GCACC-39.
Target gene downregulation was confirmed by real-time RT–PCR (see
Supplementary Information for primer sequences) and for H2AX also by west-
ern blotting with anti-H2AX antibody (diluted 1:2,000; Abcam). For analyses in
vivo, zygotes were injected into the cytoplasm with 10 pl of 20mM siRNA and
transferred to pseudopregnant females. At day 3 the mice were killed; embryos
were flushed out of the uteri and fixed in 4% paraformaldehyde.
Pharmacological, BrdU and potentiometric analyses. Chemical substances
were prepared as stock solutions as follows: picrotoxin (Tocris) and bicuculline
(C20H17NO6, catalogue no. 0130; Tocris) to 50 or 100 mM in dimethylsulph-
oxide (DMSO), respectively; muscimol (Tocris) to 100 mM in water, DiBAC4(3)
(Molecular Probes) in DMSO to 40 mM, hydroxyurea (Sigma) to 50 mg ml21 in
water, and BrdU (Sigma) was freshly dissolved to 10 mM in water.
Picrotoxin, bicuculline and muscimol ere used at 50, 20 and 100mM, respec-
tively, on cultured cells; controls received vehicle. Bicuculline was used in all
experiments as antagonist, unless picrotoxin is specifically stated. For in vivo
experiments, bicuculline or muscimol was diluted in PBS and administered
intraperitoneally to pregnant females to 4 mg kg21, in lineage tracing experi-
ments the dose was repeated every 8 h. BrdU and muscimol were administered
to 3.5-day pregnant females and analysed 5 h later for effects of the agonist onBrdU incorporation in vivo. Cells were loaded with 200 nM, and blastocysts with
1 mM, DiBAC4(3) in PBS or phenol-red-free culture medium for at least 15 min
before analysis. Hydroxyurea was used at a concentration of 8 mg ml21 in cell
culture medium, and BrdU was used in cell culture medium at a final concen-
tration of 10 mM. For experiments in vivo, 50 mg kg21 BrdU was diluted in PBS
and administered intraperitoneally. ATM/DNA-PK inhibitor (catalogue no.
118500, Calbiochem) was used at 10 mM.
20. Lundgren, T. K., Scott, R. P., Smith, M., Pawson, T. & Ernfors, P. Engineering therecruitment of phosphotyrosine binding domain-containing adaptor proteinsreveals distinct roles for RET receptor-mediated cell survival. J. Biol. Chem. 281,29886–29896 (2006).
21. Kim, D. H. et al. Synthetic dsRNA Dicer substrates enhance RNAi potency andefficacy. Nature Biotechnol. 23, 222–226 (2005).
doi:10.1038/nature06488
Nature Publishing Group©2008
Related Documents