RESEARCH ARTICLE Open Access Higher levels of psychological distress are associated with a higher risk of incident diabetes during 18 year follow-up: results from the British household panel survey Paula MC Mommersteeg 1* , Raphael Herr 2 , Wobbe P Zijlstra 1,3 , Sven Schneider 2 and François Pouwer 1 Abstract Background: Reviews have shown that depression is a risk factor for the development of type 2 diabetes. However, there is limited evidence for general psychological distress to be associated with incident diabetes. The aim of the present study was to test whether persons who report higher levels of psychological distress are at increased risk to develop type 2 diabetes during 18 years follow up, adjusted for confounders. Methods: A prospective analysis using data from 9,514 participants (41 years, SD=14; 44% men) of the British Household Panel Survey. The General Health Questionnaire 12 item version was used to assess general psychological distress, diabetes was measured by means of self-report. Cox proportional hazards regression models were used to calculate the multivariate-adjusted hazard ratio (HR) of incident diabetes during 18 years follow up, comparing participants with low versus high psychological distress at baseline (1991). Results: A total of 472 participants developed diabetes 18 year follow up. Those with a high level of psychological distress had a 33% higher hazard of developing diabetes (HR=1.33, 95% CI 1.10–1.61), relative to those with a low level of psychological distress, adjusted for age, sex, education level and household income. After further adjustment for differences in level of energy, health status, health problems and activity level, higher psychological distress was no longer associated with incident diabetes (HR=1.10, 95% CI 0.91-1.34). Conclusions: Higher levels of psychological distress are a risk factor for the development of diabetes during an 18 year follow up period. This association may be potentially mediated by low energy level and impaired health status. Keywords: Type 2 diabetes, Psychological distress, Prospective, Risk factor, British household panel survey Background Psychological distress has long been suspected as having important effects on the development of diabetes. The famous English physician Thomas Willis (1621–1675) for example, already noted that diabetes often appeared among persons who had experienced significant life events, sadness, or long sorrow [1]. In this context, psychological distress can be defined as “the unique discomforting, emotional state experienced by an indi- vidual in response to a specific stressor or demand that results in harm, either temporary or permanent, to the person” [2]. Psychological distress measures are sensitive screening instruments to detect mental disorders, affective disorders and anxiety disorders, in epidemiological studies and clinical populations [3,4]. In addition measurements of psychological distress reflect a general tendency toward expressing psychological distress rather than detecting psychological caseness. Thus screening for psychological distress goes beyond screening for either depression or anxiety and can have added value in examining general populations at risk. * Correspondence: [email protected] 1 CoRPS, Center of Research on Psychology in Somatic diseases, Department of Medical and Clinical Psychology, Tilburg University, Tilburg The Netherlands Full list of author information is available at the end of the article © 2012 Mommersteeg et al.; licensee BioMed Central Ltd. This is an Open Access article distributed under the terms of the Creative Commons Attribution License (http://creativecommons.org/licenses/by/2.0), which permits unrestricted use, distribution, and reproduction in any medium, provided the original work is properly cited. Mommersteeg et al. BMC Public Health 2012, 12:1109 http://www.biomedcentral.com/1471-2458/12/1109

Welcome message from author
This document is posted to help you gain knowledge. Please leave a comment to let me know what you think about it! Share it to your friends and learn new things together.
Transcript

Mommersteeg et al. BMC Public Health 2012, 12:1109http://www.biomedcentral.com/1471-2458/12/1109
RESEARCH ARTICLE Open Access
Higher levels of psychological distress areassociated with a higher risk of incident diabetesduring 18 year follow-up: results from the Britishhousehold panel surveyPaula MC Mommersteeg1*, Raphael Herr2, Wobbe P Zijlstra1,3, Sven Schneider2 and François Pouwer1
Abstract
Background: Reviews have shown that depression is a risk factor for the development of type 2 diabetes.However, there is limited evidence for general psychological distress to be associated with incident diabetes. Theaim of the present study was to test whether persons who report higher levels of psychological distress are atincreased risk to develop type 2 diabetes during 18 years follow up, adjusted for confounders.
Methods: A prospective analysis using data from 9,514 participants (41 years, SD=14; 44% men) of the BritishHousehold Panel Survey. The General Health Questionnaire 12 item version was used to assess generalpsychological distress, diabetes was measured by means of self-report. Cox proportional hazards regression modelswere used to calculate the multivariate-adjusted hazard ratio (HR) of incident diabetes during 18 years follow up,comparing participants with low versus high psychological distress at baseline (1991).
Results: A total of 472 participants developed diabetes 18 year follow up. Those with a high level of psychologicaldistress had a 33% higher hazard of developing diabetes (HR=1.33, 95% CI 1.10–1.61), relative to those with a lowlevel of psychological distress, adjusted for age, sex, education level and household income. After furtheradjustment for differences in level of energy, health status, health problems and activity level, higher psychologicaldistress was no longer associated with incident diabetes (HR=1.10, 95% CI 0.91-1.34).
Conclusions: Higher levels of psychological distress are a risk factor for the development of diabetes during an18 year follow up period. This association may be potentially mediated by low energy level and impaired healthstatus.
Keywords: Type 2 diabetes, Psychological distress, Prospective, Risk factor, British household panel survey
BackgroundPsychological distress has long been suspected as havingimportant effects on the development of diabetes. Thefamous English physician Thomas Willis (1621–1675)for example, already noted that diabetes often appearedamong persons who had experienced significant lifeevents, sadness, or long sorrow [1]. In this context,psychological distress can be defined as “the unique
* Correspondence: [email protected], Center of Research on Psychology in Somatic diseases, Departmentof Medical and Clinical Psychology, Tilburg University, TilburgThe NetherlandsFull list of author information is available at the end of the article
© 2012 Mommersteeg et al.; licensee BioMedCreative Commons Attribution License (http:/distribution, and reproduction in any medium
discomforting, emotional state experienced by an indi-vidual in response to a specific stressor or demand thatresults in harm, either temporary or permanent, to theperson” [2]. Psychological distress measures are sensitivescreening instruments to detect mental disorders, affectivedisorders and anxiety disorders, in epidemiological studiesand clinical populations [3,4]. In addition measurementsof psychological distress reflect a general tendency towardexpressing psychological distress rather than detectingpsychological caseness. Thus screening for psychologicaldistress goes beyond screening for either depression oranxiety and can have added value in examining generalpopulations at risk.
Central Ltd. This is an Open Access article distributed under the terms of the/creativecommons.org/licenses/by/2.0), which permits unrestricted use,, provided the original work is properly cited.

Mommersteeg et al. BMC Public Health 2012, 12:1109 Page 2 of 10http://www.biomedcentral.com/1471-2458/12/1109
In recent decades, most studies have focused on de-pression as a risk factor for type 2 diabetes. For example,meta-analyses by Knol et al. and Mezuk et al., showedthat the risk for incident diabetes was 37-60% higher indepressed participants, compared to non-depressed con-trols [5,6]. Studies that have investigated different formsof distress associated with type 2 diabetes incidencepoint toward an increased risk for increased distress [7].Concepts associated with psychological distress as stress[8], stress in daily life [9], Type A behavior [10], andanger temperament [11] show that mostly distressedmen [9], but not women [8,10], or both men and women[11] were more likely to develop diabetes. In addition,whereas both psychological distress, as measured withthe general health questionnaire (GHQ), and diabeteshave been associated with increased mortality [12], thecoexistence of both psychological distress and diabeteswere associated with an increased mortality risk aboveand beyond of either factor alone [12].Due to the various concepts of psychological distress
used in previous studies, we sought to examine the asso-ciation between psychological distress in general, usingthe GHQ12 and diabetes incidence. The aim of thepresent study was to examine the risk of psychologicaldistress to develop type 2 diabetes, adjusted for potentialconfounders, using data from a large prospective andrepresentative cohort study: the British Household PanelSurvey [13]. We hypothesize that reporting increasedpsychological distress at baseline, is associated withan increased diabetes incidence, over the course of18 years follow-up, independent of potential confound-ing variables.
MethodsDesign and participantsData are part of the British Household Panel Survey(BHPS), a nationally representative cohort of Britishhouseholds, recruited in 1991 and being re-interviewedeach successive year (or wave) [13]. The main aim of theBHPS is to “further understanding of social and eco-nomic change at the individual and household level inBritain [. . .], to identify, model and forecast suchchanges, their causes and consequences in relation to arange of socio-economic variables.” The British House-hold Panel Survey is conducted by the ESRC UK Longi-tudinal Studies Centre (ULSC), together with the theInstitute for Social and Economic Research (ISER) at theUniversity of Essex. In the present study, data collectedbetween 1991 and 2009 were used (18 year follow-upcohort)[14]. The households were randomly selectedfrom postcode districts in order to be nationally repre-sentative. In total 10,264 persons were annually inter-viewed starting in 1991, from age 16 and up. In eachwave data were collected on several topics e.g. ‘income
and wealth’, ‘housing’, and ‘health’ by a trained inter-viewer during a home visit. Data collection was done inaccordance to the declaration of Helsinki, and the studywas ethically approved by the University of Essex, Insti-tute for Social and Economic Research [13]. For thepresent study, data on general psychological distress,diabetes presence, demographic characteristics, life style,and general health were extracted from the onlinedatabase.Of the 10,264 individuals who participated in 1991,
respondents with missing data on the psychological dis-tress questionnaire (n = 589/10,264; 5.7%) or whoreported diabetes in 1991 (n = 179/10,264; 1.7%) wereexcluded. After exclusion of these two groups, the max-imum number of participants available for analysis atbaseline was 9,514 (Table 1). In total 45% of the non-diabetes group had information until the end of thestudy (Wave 18), and mean loss to follow-up time was7.3 years. The percentage of dropouts was largestbetween wave 1 and 2 (10%), and between wave 2 and 3(6%), and gradually decreased in consecutive waves, ran-ging between 5% and 2%. When comparing the charac-teristics of the dropout group between wave 1–17 to thegroup with information available in wave 18 (comple-ters) at baseline, the dropout group showed no differ-ence in psychological distress at baseline and was notdifferent in BMI. Both groups comprised people withand without diabetes. However, the dropout group wassignificantly more likely to be older, male, not married,lower educated, have a lower average household income,nonwhite, less energetic (compared to age), have animpaired health status, were more likely to report healthproblems, more often reported an inactive/sedentarylifestyle, and were more likely to smoke. At the sametime, the dropout group had a lower diabetes incidenceof 4% (219/5225), compared to 6% (253/4289) in thecompleters group (χ2 = 14.6, p<.001). It must be notedthat information on wave of diabetes presence and waveuntil last measurement was used in the analysis, thusoptimizing the information available of people whodropped out during the 18 waves.Baseline data were used for age, sex, marital status
(married = 1, separated/divorced/widowed/never mar-ried = 0), smoking (yes=1), educational level (lower edu-cation, medium education (up to O-level) and highereducation (A+ level), annual household income (<15,000£, 15,000 -<35,000 £, and ≥35,000 £), health status, andhealth problems. Race/ethnicity was defined as: ‘white’and ‘non-white’.
DiabetesIn each consecutive wave, diabetes presence wasassessed using a list of self-reported health problems(Do you have any of the health problems or disabilities

Table 1 Baseline characteristics of participants without diabetes, stratified by psychological distress
psychological distress
Total High [4,021] Low [5,493] Test-value1 p-value
N %/m n/SD %/m n/SD %/m n/SD
Sociodemographic factors
Age [years] 9,514 43.8 18.1 44.5 18.0 43.4 18.2 8.81 0.003
Sex [female] 9,514 54% 5,100 60% 2,417 49% 2,683 118.5 <0.001
Marital status [married] 9,502 59% 5,639 58% 2331 60% 3,308 5.00 0.025
Professional education 9,497 44.5 <0.001
Lower education 33% 3,101 36% 1,460 29% 1,641
Medium education 33% 3,119 32% 1,267 34% 1,852
Higher education 35% 3,277 32% 1,289 36% 1,998
Race/ethnicity [non-white] 9,503 4% 352 4% 171 3% 181 5.94 0.015
Annual household income 9,514 73.9 <0.001
<15,000 £ 44% 4,209 49% 1,979 41% 2,230
15,000-<35,000 £ 46% 4,358 42% 1,705 48% 2,653
≥35,000 £ 10% 947 8% 337 11% 610
Health
Energy 9,455 393.2 <0.001
More energetic 32% 2,987 25% 996 36% 1,991
About the same 54% 5,124 53% 2,109 55% 3,015
Less energetic 14% 1,344 22% 878 9% 446
Health status 9,508 13% 1,200 19% 777 8% 423 284.1 <0.001
One/some health problems of which: 9,486 52% 4,960 59% 2,375 47% 2585 134.1 <0.001
Heart/blood pressure 11% 1,076 13% 538 10% 538 29.7 <0.001
Breathing problems, asthma, bronchitis 10% 963 13% 507 8% 456 47.3 <0.001
Skin conditions/allergies 11% 1,001 12% 488 9% 513 19.3 <0.001
Stomach/liver/kidneys 6% 524 7% 295 4% 229 44.71 <0.001
Problems with arms, legs, etc. 23% 2,138 27% 1,102 19% 1,036 97.2 <0.001
Difficulty in seeing 7% 656 9% 348 6% 308 33.54 <0.001
Difficulty in hearing 7% 698 8% 313 7% 385 2.04 0.153
Migraine or frequent headaches 8% 760 10% 414 6% 346 50.4 <0.001
Anxiety, depression, psych. problems 9,486 5% 473 10% 390 2% 83 329.3 <0.001
Lifestyle
Leisure time activity 2 6,906 37.0 <0.001
Active 52% 3,609 50% 1,441 54% 2,168
Moderately active 20% 1,391 19% 548 21% 843
Inactive/sedentary 28% 1,906 31% 912 25% 994
Smoking 9,506 30% 2,856 33% 1,331 28% 1,525 31.5 <0.001
BMI [kg/m2] 2 4,933 26.4 4.7 26.3 4.9 26.4 4.6 0.019 0.889
BMI categories 2 4,933
Underweight < 18.5 1% 69 2% 31 1% 38 7.28 0.064
Normal weight 18.5 - 24.9 42% 2,077 44% 898 41% 1,179
Overweight 25.0 - 29.9 38% 1,868 36% 731 39% 1,137
Obese ≥ 30.0 19% 919 19% 385 19% 5341Test value Pearson χ2 for categorical variables and F-value for continuous scores.2 Activity level was measured in wave 6, and BMI was measured in wave 13.
Mommersteeg et al. BMC Public Health 2012, 12:1109 Page 3 of 10http://www.biomedcentral.com/1471-2458/12/1109

Mommersteeg et al. BMC Public Health 2012, 12:1109 Page 4 of 10http://www.biomedcentral.com/1471-2458/12/1109
listed on this card). In another study, self-reported dia-betes was shown to reliably correlate with physiciandiagnosed diabetes [15]. There was no distinction be-tween type 1 diabetes and type 2 diabetes, but as type 1diabetes is generally diagnosed before the age of 25,most cases with type 1 diabetes are most likely excludedin the first wave.
Psychological distressGeneral psychological distress was measured with the 12item version of the General Health Questionnaire, theGHQ12 [4]. This questionnaire was self-completed bythe participants during the home visit of the BHPS inter-viewer. The GHQ12 is used as a short screening instru-ment initially used to detect probable caseness ofpsychological disorders in epidemiological studies [4].However, the GHQ reflects a general tendency towardexpressing psychological distress rather than detectingpsychological caseness, and it was used as an indicatorof psychological distress in the present study. The reli-ability of the scale in the present sample was α = 0.85(N = 9,675). The items are scored on a 1–4 item re-sponse scale, adapted to a dimensional scale, whichcoded 0-0-1-1 for the positive items, and 0-1-1-1 for thenegative items (cGHQ12) [16]. In the present study acut-off of ≤4 for the low-psychological distress group,and >4 for the high psychological distress group wasused for the cGHQ12, based on previous large scalevalidation studies [4]. In the additional analysis, thecontinuous range of scores (0–12) were used.
Measurement of potential confoundersEnergy level, health status, health problems, and leisure-time activity were studied as potential confounders, aslower energy, poor health, and reduced physical activitycan contribute to both higher levels of distress and ahigher risk to develop diabetes [17].
Energy‘How energetic do you feel as compared to most peopleof your age?’ With three response categories: ‘more ener-getic’, ‘about the same’, ‘less energetic’.
Health status‘Does your health in any way limit your daily activitiescompared to most people of your age?’ (No=0/Yes=1).
Health problemsDiabetes is often preceded by prodromal complaints,which may not be identified as being related to diabetes.Therefore different categories of self-reported healthproblems were recoded into ‘none=0’ versus ‘one/some=1’, based on the following categories: ‘heart/bloodpressure’, ‘chest/breathing problems, asthma, bronchitis’,
‘skin conditions/allergies’, ‘stomach/liver/kidneys’, ‘problemswith arms/legs etc’, ‘difficulty in seeing’, ‘difficulty in hear-ing’, and ‘migraine or frequent headaches’.
Leisure-time activityPeople reported in a ‘Leisure-time activities’ item how fre-quently they did leisure activities. A score of 2 (=Active)was assigned if someone reported ‘at least once a week’ to‘play sport or go walking or swimming’, a score of 1(=Moderately active) was assigned if a person reported ‘atleast once a week’ to either ‘work in the garden’, ‘attendactivity groups such as evening classes, keep fit, yoga etc.’,or ‘Do Do-It-Yourself, home maintenance or car repairs’.Finally a score of ‘0’ (=Inactive/sedentary) was assignedfor the remaining answer categories.
BMI and leisure-time activity from other wavesData on body mass index (BMI) and leisure-time activitywere not available in the first wave. Data on leisure-time ac-tivity was available from 1996 (wave 6), and BMI was avail-able from 2004 (wave 13). Still, as both variables have beenfound to be related to diabetes development, these variableswere used to predict diabetes incidence. There was a con-siderable number of missing cases in the waves of leisure-time activity (73% available, n = 6,906/9,514), and BMI(52% available, n = 4,933/9,514), and we choose to analyzeBMI in a separate model in the additional analysis.
Statistical analysisCox proportional hazards regression models were usedto calculate the multivariate-adjusted hazard ratio’s (HR)of diabetes for the high-distress compared to the low-distress group using new diabetes cases in each consecu-tive wave [18]. Information on diabetes (present orabsent), and time (coded as either first wave of diabetespresence, or last wave of diabetes absence) were used forthe analysis. In total 12 cases were left-censored as therewas missing information on diabetes in 1–3 waves pre-ceding the the first wave of diabetes presence. As thistime frame and number of cases were limited, these left-censored cases were not excluded.We used two analysis strategies: first the effect of each
covariate was examined separately, and second, the multi-variate effect of a complete model was tested. In the firstanalyses, the individual HR of each covariate on diabetesincidence in the (age adjusted) model of high distress wasinvestigated (Table 2, first columns, with 95% CI andp-value). The covariate adjusted HR of (age adjusted) highdistress on diabetes incidence was reported (Table 2; col-umn HRcovariate adjusted). This was done by adding each cov-ariate separately to the crude model. The change and thepercent change in the log hazard ratio (B = Log HR) ofhigh psychological distress (Bcrude model – Bnew model) wascalculated before and after adjustment for each individual

Table 2 Covariate adjusted hazard ratio table
Covariate HR1 95% CI p-value HRCovariate-adjusted2 Change3 % Change 4
High distress [age adj.] 1.33 1.10-1.61 0.003 - - -
Sociodemographic factors
Age 1.04 1.03-1.04 <0.001 1.33 - -
Female sex [ref male] 0.74 0.62-0.90 0.002 1.37 0.030 10.36
Marital status [ref unmarried] 1.18 0.96-1.45 0.120 1.34 0.006 2.25
Lower education [ref medium] 1.29 1.02-1.64 0.037 1.29 −0.028 −9.37
Higher education [ref lower] 0.80 0.62-1.03 0.084
Race/ethnicity [ref white] 2.63 1.27-4.02 <0.001 1.33 −0.003 −0.95
Annual household income <15,000 [ref 15,000 - <35,000] 1.10 0.89-1.35 0.398 1.31 −0.013 −4.52
Annual household income ≥ 35,000 [ref 15,000 - <35,000] 0.60 0.39-0.91 0.016
Health
More energetic [ref same energy] 0.74 0.59-0.93 0.009 1.14 −0.155 −54.25
Less energy [ref same energy] 2.09 1.65-2.66 <0.001
Health status [ref ‘no’] 2.36 1.88-2.95 <0.001 1.19 −0.114 −39.90
One/some health problems [ref ‘none’] 1.70 1.38-2.10 <0.001 1.26 −0.055 −19.20
Lifestyle
Inactive/sedentary [ref moderately active] 0.95 0.74-1.23 0.698 1.31 −0.013 −4.54
Active [ref moderately active] 0.72 0.57-0.89 0.003
Smoking [ref no] 1.17 0.95-1.44 0.137 1.32 −0.006 −2.21
Additional analysis5
BMI [kg/m2] 1.12 1.11-1.14 <0.001 1.29 0.013 5.38
BMI category ≤ 18.5 [ref 18.5-24.9] 2.19 0.95-5.06 0.065 1.29 0.009 3.61
BMI category 25.0-29.9 [ref 18.5-24.9] 2.09 1.55-2.81 <0.001
BMI category ≥ 30 [ref 18.5-24.9] 6.13 4.61-8.14 <0.0011 The HR of each individual covariate is reported, adjusted for high distress and age. Health status and health problems are additionally adjusted for timedependent interactions (not shown).2 The ‘HRcovariate adjusted’ is the HR of high distress, adjusted for age and each covariate independently.3 Change in the strength (logHR) of association of high distress before and after each covariate adjustment = Change in logHR = (Bcrude model – Bnew model), and B = logHR.4 The percentage change = 100*(Change in logHR)/Bcrude model. Absolute changes >1% were considered relevant, and included in subsequent multivariate regression models.5 Information on BMI was not available until wave 13, and separate analysis were done for BMI, based on 452 diabetes events and 4780 cases. The age adjustedHR of high distress was 1.28 (95% CI = 1.03-1.57, p = .023) in that sample size.
Mommersteeg et al. BMC Public Health 2012, 12:1109 Page 5 of 10http://www.biomedcentral.com/1471-2458/12/1109
potential confounder for the complete model available andreported in Table 2 as well (Table 2: Change (Bcrude model –Bnew model) and % Change). To deal with loss to follow-up,a separate, additional, complete model was assessed for ab-solute or categorized BMI. A negative value depicts adecrease in LogHR for the high distress group after adjust-ment, whereas a positive score indicates an increase in theLogHR for the high-distress group after adjustment. Weconsidered an absolute change in LogHR >1% to have asubstantial effect as a confounder or mediator on thediabetes-associated risk of psychological distress, based onthe present sample size, the number of covariates andadapted in line with the method used by Whooley andcolleagues [19]. Second, a complete multivariate adjustedmodel was built. The covariates with a substantial effect(>1% absolute change in LogHR) were included
hierarchically in three blocks of factors (sociodemographic,health, and lifestyle) (Table 3).The proportional hazards assumptions of these models
were verified using log-minus-log survival plots, Pearsoncorrelations of the partial residuals, and the inclusion ofinteraction effects with process time. If the proportional-ity assumption was violated, nonproportional Cox mod-els were used, by including interaction effects of thecorresponding variable with process time, which correctsthe violation of the proportionality assumption. Thiscorrection was used for health status and health pro-blems. Additional analyses examined models with psy-chological distress as a continuous score, and modelswith interactions of sex or age with psychological dis-tress. Statistical analyses were conducted using SPSS Sta-tistics version 19.0 (IBM SPSS Inc., Chicago, IL, USA).

Table 3 Covariate adjusted hazard ratios for high distress (top panel) and hazard ratio of the covariates for thecomplete model (lower panel) for 18-year follow-up diabetes incidence
HR 95% CI p
Block 1: Sociodemographic factors
High distress 1.33 1.10-1.61 0.003
Block 2: Health
High distress 1.10 0.90-1.34 0.342
Block 3: Lifestyle
High distress 1.10 0.91-1.34 0.333
Covariates [complete model]
Sociodemographic factors
Age 1.03 1.02-1.04 <0.001
Female sex [ref male] 0.68 0.56-0.83 <0.001
Marital status 1.18 0.95-1.46 0.126
Lower education [ref medium] 1.21 0.95-1.54 0.115
Higher education [ref medium] 0.82 0.63-1.06 0.121
Annual hh income <15,000 [ref 15,000 - <35,000] 1.00 0.80-1.24 0.985
Annual hh income ≥ 35,000 [ref 15,000 - <35,000] 0.67 0.44-1.02 0.064
Health
More energetic [ref same energy] 0.79 0.63-1.00 0.59
Less energetic [ref same energy] 1.54 1.18-2.02 0.002
Health status [ref ‘no’] 2.81 1.55-5.11 0.001
Health problems One/some [ref ‘none’] 1.43 0.77-2.63 0.255
Lifestyle
Inactive/sedentary [ref moderately active] 1.06 0.82-1.38 0.655
Active [ref moderately active] 0.87 0.69-1.10 0.231
Smoking 1.01 0.82-1.25 0.915
Block 1: adjusted for age, female sex, marital status, education level, and annual household income.Block 2: adjusted for block 1 + energy, health status, and health problems.Block 3: adjusted for block 2 + activity in 1996, and smoking.
Mommersteeg et al. BMC Public Health 2012, 12:1109 Page 6 of 10http://www.biomedcentral.com/1471-2458/12/1109
ResultsDescriptivesAmong the 9,514 included individuals, there were 472incident cases of diabetes during the 18 year follow-upperiod. The incidence rate of new diabetes was 4.3 per1000 person-years for this period of 18 years for thetotal sample. The incidence rate was 3.8 per 1000person-years for low psychological distress and 4.9 per1000 person-years for high psychological distress. Intotal 42% of the participants reported a high level of psy-chological distress at baseline (4,021/9,514). There wasno difference in diabetes prevalence in 1991 between thehigh and low distress group (high psychological distress= 1.8%, low psychological distress = 1.5%, χ2 = 1.01, p =0.313). The high psychological distress group reported tobe less energetic compared to people of their age, havean overall poor health status and more health problems,including more psychiatric problems (Table 1). More-over, the high distress group reported an inactive/seden-tary lifestyle more often, had a higher prevalence of
smoking, but showed no overall difference in averageBMI, or BMI categories (Table 1).
Diabetes incidence by psychological distress andcovariate adjusted riskThere was a significantly increased incidence of diabetesin the high distress group (HR = 1.33, 95% CI = 1.10-1.61, p=0.003), adjusted for age (Figure 1). In Table 2,the hazard ratios of the covariates, adjusted for psycho-logical distress and age (columns 1–3), and the covariateadjusted change in logHR for the high distress group arereported (column 4–6). After controlling for sex, maritalstatus, and BMI, the adjusted LogHR for the high-distress group increased, whereas controlling for educa-tional level, race/ethnicity, income, energy level, healthstatus, health problems, leisure-time activity, and smok-ing lowered the LogHR for incident diabetes. Thus eachof these factors explained some of the variance ascribedto the high distress group. The percentage change inLogHR is given for the effect of each covariate on the
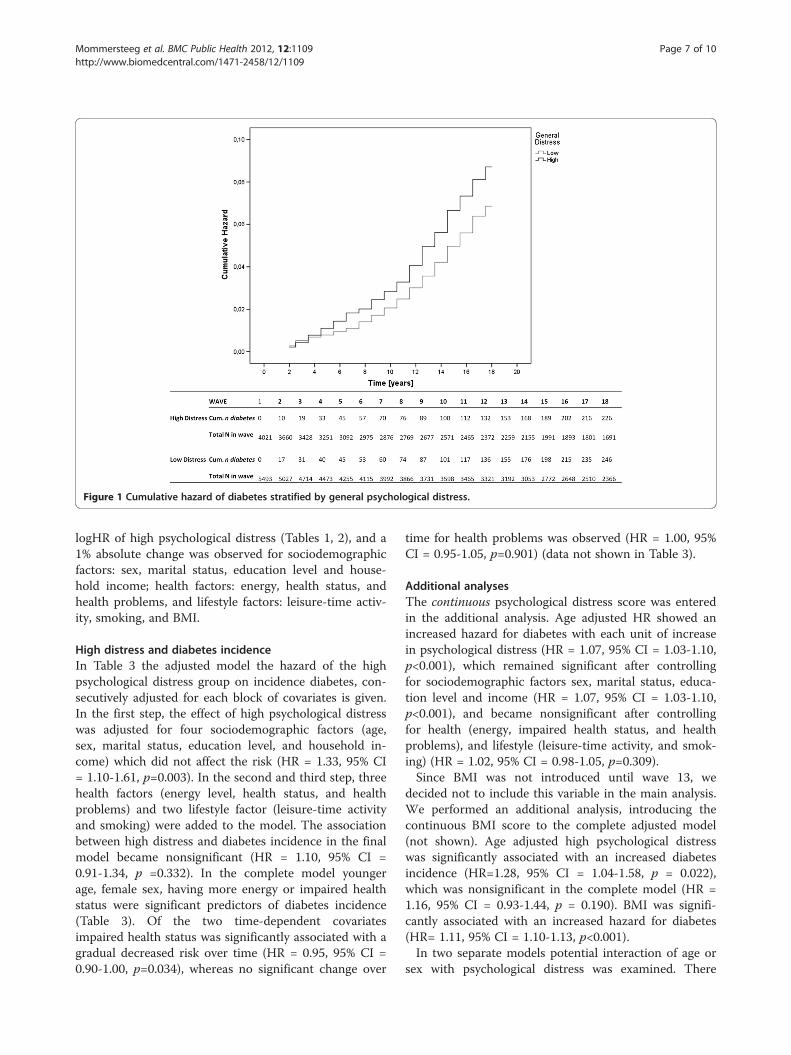
Figure 1 Cumulative hazard of diabetes stratified by general psychological distress.
Mommersteeg et al. BMC Public Health 2012, 12:1109 Page 7 of 10http://www.biomedcentral.com/1471-2458/12/1109
logHR of high psychological distress (Tables 1, 2), and a1% absolute change was observed for sociodemographicfactors: sex, marital status, education level and house-hold income; health factors: energy, health status, andhealth problems, and lifestyle factors: leisure-time activ-ity, smoking, and BMI.
High distress and diabetes incidenceIn Table 3 the adjusted model the hazard of the highpsychological distress group on incidence diabetes, con-secutively adjusted for each block of covariates is given.In the first step, the effect of high psychological distresswas adjusted for four sociodemographic factors (age,sex, marital status, education level, and household in-come) which did not affect the risk (HR = 1.33, 95% CI= 1.10-1.61, p=0.003). In the second and third step, threehealth factors (energy level, health status, and healthproblems) and two lifestyle factor (leisure-time activityand smoking) were added to the model. The associationbetween high distress and diabetes incidence in the finalmodel became nonsignificant (HR = 1.10, 95% CI =0.91-1.34, p =0.332). In the complete model youngerage, female sex, having more energy or impaired healthstatus were significant predictors of diabetes incidence(Table 3). Of the two time-dependent covariatesimpaired health status was significantly associated with agradual decreased risk over time (HR = 0.95, 95% CI =0.90-1.00, p=0.034), whereas no significant change over
time for health problems was observed (HR = 1.00, 95%CI = 0.95-1.05, p=0.901) (data not shown in Table 3).
Additional analysesThe continuous psychological distress score was enteredin the additional analysis. Age adjusted HR showed anincreased hazard for diabetes with each unit of increasein psychological distress (HR = 1.07, 95% CI = 1.03-1.10,p<0.001), which remained significant after controllingfor sociodemographic factors sex, marital status, educa-tion level and income (HR = 1.07, 95% CI = 1.03-1.10,p<0.001), and became nonsignificant after controllingfor health (energy, impaired health status, and healthproblems), and lifestyle (leisure-time activity, and smok-ing) (HR = 1.02, 95% CI = 0.98-1.05, p=0.309).Since BMI was not introduced until wave 13, we
decided not to include this variable in the main analysis.We performed an additional analysis, introducing thecontinuous BMI score to the complete adjusted model(not shown). Age adjusted high psychological distresswas significantly associated with an increased diabetesincidence (HR=1.28, 95% CI = 1.04-1.58, p = 0.022),which was nonsignificant in the complete model (HR =1.16, 95% CI = 0.93-1.44, p = 0.190). BMI was signifi-cantly associated with an increased hazard for diabetes(HR= 1.11, 95% CI = 1.10-1.13, p<0.001).In two separate models potential interaction of age or
sex with psychological distress was examined. There

Mommersteeg et al. BMC Public Health 2012, 12:1109 Page 8 of 10http://www.biomedcentral.com/1471-2458/12/1109
were no significant interaction effects of age and distress(HRage*distress= 0.99, 95% CI = 0.98-1.00, p = 0.193), andsex and distress (HRsex*distress= 1.32, 95% CI = 0.90-1.94,p = 0.152).
DiscussionIn this large prospective cohort study among men andwomen without known diabetes at baseline, a higherlevel of baseline symptoms of psychological distress,based on the GHQ 12 item version, were directly asso-ciated with a 33% increased hazard to develop diabetesduring 18 year follow up. This association appeared tobe confounded by energy level and health status aftercomplete adjustment.Earlier studies have examined the association between
general psychological distress measures and incident dia-betes, with varying results [7]. For example, both in theCopenhagen City Heart Study and two Japanese studies[8-10], particularly men with high levels of general dis-tress but not distressed women were more likely to de-velop diabetes during follow up. In contrast, in theWhitehall II cohort, a high baseline GHQ score was notpredictive of incident diabetes during a 10 year followup period [20]. In the Whitehall II cohort study, a simi-lar diabetes incidence rate was reported; 3.8 and 4.3 per1000 person years in men and women respectively, com-pared to 4.3/1000 person years in the present study. TheWhitehall II cohort was between 35–55 years at thestart, whereas the BHPS included everyone > 16 years,with an average of 41 years. The Whitehall II cohortused odds ratios to predict the incidence of diabetesafter an average of 10.5 years, whereas time dependenthazard ratios of 18 years were examined in the presentstudy. Examining HRs of 18 waves is a more sensi-tive method of analysis, more likely to detect smalldifferences.The association between general psychological distress
and incident diabetes in the present study was con-founded by level of energy and impaired health status.There was an decreased hazard for an active lifestylebased on leisure-time activities with diabetes risk, com-pared to a moderate leasure-time activities, but nolonger in the complete adjusted model. This is in con-trast to other studies which consistently show an associ-ation between activity level, depression and diabetes[17,21]. In the present study, activity level was operatio-nalized by leisure-time activity instead of a metabolicequivalent of physical activity and leisure-time activitywas not measured until wave 6, which could haveaffected the strength of association with the variablesmeasured at baseline. At the same time a person’s ‘en-ergy level compared to age’ and whether or not a per-son’s health status was impaired could be proxymeasures of a person’s health status and ability to be
active, therefore more variables were present to deter-mine health and potential activity at baseline. The over-lap between health status, energy, leisure-time activityand psychological distress with diabetes is consistentwith previous findings. For example, the study of Shiromand colleagues showed that vigor, a mood state compris-ing emotional energy, was related to a reduced diabetesrisk 20 years follow-up, independent of depressive symp-toms or anxiety [22]. Leisure-time physical activity hasbeen found to mediate the association between emo-tional wellbeing and diabetes presence [23]. Rod and col-leagues showed that respondents who reported highlevels of psychological distress had less adequate healthbehaviors, such as being physically inactive [8]. Integrat-ing increased activity into daily practice has been shownto be beneficial for mood as well as improve diseaseindicators [24]. Still, other factors such as a generalhealthier lifestyle, including a healthier diet with lesssaturated fat, reduced salt intake and increased fiber, andinterventions aimed to reduce bodyweight have been ef-fective in preventing diabetes [25], and could haveplayed a role in the present study, though were not fur-ther investigated. Since adjustment for confounders doesnot provide information on whether a covariate is a me-diator or a moderator in the association between psy-chological distress and diabetes incidence, we cannotdraw firm conclusions on mediators or moderators. Ra-ther, we can hypothesize that energy level, and healthstatus may act as mediating factors in explaining the as-sociation between general psychological distress and in-cident diabetes, which remains to be investigated.The observed association could also be confounded by
the general psychopathology of affected participants, aspsychological traits have been previously linked to inci-dent type 2 diabetes [5-7]. In our study self-reportedpsychiatric morbidity was investigated, which was moreprevalent in the high psychological distress group, how-ever small sample sizes prevented inclusion in the mainanalysis.Given that psychological distress is associated with an
increased diabetes incidence, explanatory pathways maybe via increased chronic stress. Chronic stress can in-crease the risk of type 2 diabetes directly, for example bylong term activation of psychoneuroendocrine pathwayswith the release of catecholamines, such as adrenalineand norepinephrine and glucocorticoids as cortisol. Thisgenerally results in an increased hepatic glucose output,decreased insulin secretion and sensitivity, central accu-mulation of body fat, hypertension, and an adverse lipidprofile [26,27]. Indirect pathways can operate throughlack of adherence to healthy lifestyle behaviors, such as alow level of physical activity, unhealthy eating behaviors(e.g. higher saturated fat and carbohydrate intake), andsmoking. The health associated factors ‘energy level

Mommersteeg et al. BMC Public Health 2012, 12:1109 Page 9 of 10http://www.biomedcentral.com/1471-2458/12/1109
compared to age’, and ‘impaired health status’ appearedto be of influence in the present study.We suggest that future studies include clinical assessment
of diabetes using an oral glucose tolerance test in associationwith measures of psychological distress, energy, and healthstatus, and to observe potential biological mechanisms tofurther explore the association between general distress anddiabetes incidence. At the same time interventions specific-ally aimed to increase activity level could potentially lead toreduced depressive symptoms and improve diabetes out-comes are currently being investigated [28,29]. Whereasscreening for depression in diabetes appears to be of limitedeffect in improving diabetes distress or HbA(1c) levels [30],improving regimen adherence by a structured self-monitoring of blood glucose lead to significantly greaterreductions in distress, compared to an active control group[31]. Clinical implications of the present study could be thata broader range of psychological distress symptoms needs tobe taken into account in general practice, not just depressivesymptoms. Primary prevention and anamnesis should alsocover social history and biopsychosocial aspects of the pa-tient. Caregivers and treatment providers (e.g. general practi-tioners and diabetologists) should therefore also take thecase history, the person’s general health status, and per-ceived level of energy into account. Interventions aimed toimprove lifestyle behavior (e.g. applying a diabetes preven-tion protocol to ‘real-world’ settings) were effective in attain-ing weight loss, which is associated to a reduced diabetesrisk [32]. This type of intervention could easily be expandedby adding techniques specifically addressing psychologicaldistress, yet whether addressing psychological distress hasadditional value in diabetes prevention programmes needsto be determined with a randomised controlled trial.Despite the longitudinal character of the present study
and the use of 18 waves, we cannot infer conclusionsregarding causality from these results, which is a limita-tion of the present study. At the same time, there was noinformation available on the exact date of diabetes diagno-sis which might be a limitation, but since informationabout diabetes was available in 18 consecutive waves weused the wave of first positive assessment of diabetes in-stead of the date. The variables related to drop out werealso related to diabetes incidence, however in the dropoutgroup the incidence rate of diabetes was lower. Therefore,it is difficult speculate about the effect of dropouts on theresults. As our study was non-randomized there might beresidual confounding, despite our attempted to adjust forthe most important confounders in the multivariate ana-lyses. Moreover, diabetes was measured by means of self-report in our study. Though studies have reported astrong association between physician’s report of diabetesand the patients self-report [15], there is still a consider-able number of patients with type 2 diabetes who are gen-erally not aware of the fact that they have type 2 diabetes.
This is because type 2 diabetes has a long asymptomaticpre-clinical phase, often with prodromal symptoms, whichfrequently goes undetected. Of people with Type 2diabetes, the proportion who are undiagnosed ranges from30% to 90% [33]. We did take into account self-reportedhealth problems that might be associated with prodromalcomplaints, e.g. problems related to blood pressure, skinconditions, kidney, difficulty seeing, though this was notfurther specified towards diabetes specific complaints. Thepresent dataset may be subject to bias, as the diabetesprevalence at the onset of the study was low (1.7% in1991), compared to the National diabetes prevalence (2.8%in 1996) [34]. Still, the selection of participants took placebased on a random draw of postal code area’s. At the sametime, the diabetes incidence rate of 4.3/1000 person yearswas representative of national findings of 4.4/1000 personyears in 2005 [34]. Finally, we need to acknowledge thatthe assessment of physical activity was merely focused onleisure-time activities, and may not have representedpeople with a high active lifestyle or who were frequentsporters. As a result, activities such as (heavy) labor activ-ities or household work were not covered.Strengths of our study include not only the population
based approach and the relatively large sample size, butalso the long follow-up period, the use of Cox-proportionalhazards model, which is more adequate and more sensitivein comparison to a logistic regression analysis. The avail-ability of data from wave to wave was optimized by exam-ining either the first wave of diabetes presence or the lastwave of absence of diabetes. The study addresses aninnovative question with potential clinical implications.
ConclusionResults of the present study show that persons withelevated levels of psychological distress are at increasedrisk to develop type 2 diabetes, potentially affected by lowenergy level and health status. These findings warrant adetection of psychological complaints beyond depression,and further investigation of life-style related interventionswhich include a module on psychological distress.
Competing interestsSvS was supported by a small grant from Roche Diagnostics DeutschlandGmbH, Mannheim, Germany, for a study on gestational diabetes. All otherauthors: Nothing to declare.
Authors' contributionsPM contributed to the statistical analyses, wrote the results section,reviewed/edited the manuscript, contributed to the discussion, revised themanuscript. RH retrieved the data, conducted the statistical analyses, draftedthe manuscript, reviewed/edited the manuscript, contributed to thediscussion. WZ contributed to the statistical analyses, reviewed/edited themanuscript. SvS reviewed/edited the manuscript, contributed to the dataanalyses, and discussion. FP wrote the introduction and first draft of thediscussion, reviewed/edited the manuscript. All authors read and approvedthe final manuscript.

Mommersteeg et al. BMC Public Health 2012, 12:1109 Page 10 of 10http://www.biomedcentral.com/1471-2458/12/1109
AcknowledgmentsThe data (and tabulations) used in this publication were made availablethrough the UK Data Archive. The data were originally collected by the ESRCResearch Centre on Micro-social Change at the University of Essex (nowincorporated within the Institute for Social and Economic Research). Neitherthe original collectors of the data nor the Archive bear any responsibility forthe analyses or interpretations presented here. All authors declare no conflictof interest.
Author details1CoRPS, Center of Research on Psychology in Somatic diseases, Departmentof Medical and Clinical Psychology, Tilburg University, TilburgThe Netherlands. 2MIPH, Mannheim Institute of Public Health, Social andPreventive Medicine, Medical Faculty Mannheim, Mannheim, Germany.3Department of Methodology and Statistics, Tilburg University, Tilburg, TheNetherlands.
Received: 30 May 2012 Accepted: 10 December 2012Published: 23 December 2012
References1. Willis T: Pharmaceutice rationalis sive diatriba de medicamentorum
operationibus in humano corpore. Oxford: E Theatro Sheldoniano: 1675.2. Ridner SH: Psychological distress: concept analysis. Journal of advanced
nursing 2004, 45(5):536–545.3. Hahn D, Reuter K, Harter M: Screening for affective and anxiety disorders
in medical patients - comparison of HADS, GHQ-12 and Brief-PHQ.Psychosoc Med 2006, 3:9.
4. Goldberg DP, Gater R, Sartorius N, Ustun TB, Piccinelli M, Gureje O, Rutter C:The validity of two versions of the GHQ in the WHO study of mentalillness in general health care. Psychol Med 1997, 27(1):191–197.
5. Knol MJ, Twisk JW, Beekman AT, Heine RJ, Snoek FJ, Pouwer F: Depressionas a risk factor for the onset of type 2 diabetes mellitus. A meta-analysis.Diabetologia 2006, 49(5):837–845.
6. Mezuk B, Eaton WW, Albrecht S, Golden SH: Depression and type 2diabetes over the lifespan: a meta-analysis. Diabetes Care 2008,31(12):2383–2390.
7. Pouwer F, Kupper N, Adriaanse MC: Does emotional stress cause type 2diabetes mellitus? A review from the European Depression in Diabetes(EDID) Research Consortium. Discov Med 2010, 9(45):112–118.
8. Rod NH, Gronbaek M, Schnohr P, Prescott E, Kristensen TS: Perceived stressas a risk factor for changes in health behaviour and cardiac risk profile: alongitudinal study. Journal of internal medicine 2009, 266(5):467–475.
9. Toshihiro M, Saito K, Takikawa S, Takebe N, Onoda T, Satoh J: Psychosocialfactors are independent risk factors for the development of Type 2diabetes in Japanese workers with impaired fasting glucose and/orimpaired glucose tolerance. Diabetic medicine 2008, 25(10):1211–1217.
10. Kato M, Noda M, Inoue M, Kadowaki T, Tsugane S: Psychological factors,coffee and risk of diabetes mellitus among middle-aged Japanese: apopulation-based prospective study in the JPHC study cohort. Endocrinejournal 2009, 56(3):459–468.
11. Golden SH, Williams JE, Ford DE, Yeh HC, Sanford CP, Nieto FJ, Brancati FL:Anger temperament is modestly associated with the risk of type 2diabetes mellitus: the Atheroslcerosis Risk in Communities Study.Psychoneuroendocrinology 2006, 31(3):325–332.
12. Hamer M, Stamatakis E, Kivimaki M, Pascal Kengne A, Batty GD:Psychological distress, glycated hemoglobin, and mortality in adults withand without diabetes. Psychosomatic Medicine 2010, 72(9):882–886.
13. Brice J, Buck N, Prentice-Lane E: British Household Panel Survey User ManualVolume A: Introduction, Technical Report and Appendices. Colchester:University of Essex; 2010.
14. Institute for Social and Economic Research, British Household Panel Survey:In Waves 1–18, 1991–2009 [computer file] Volume 7th Edition. University ofEssex, Colchester, Essex: UK Data Archive [distributor]: 2010.
15. Kriegsman DM, Penninx BW, van Eijk JT, Boeke AJ, Deeg DJ: Self-reportsand general practitioner information on the presence of chronicdiseases in community dwelling elderly. A study on the accuracy ofpatients' self-reports and on determinants of inaccuracy. Journal of clinicalepidemiology 1996, 49(12):1407–1417.
16. Hankins M: The reliability of the twelve-item general healthquestionnaire (GHQ-12) under realistic assumptions. BMC Public Health2008, 8:355.
17. Lysy Z, Da Costa D, Dasgupta K: The association of physical activity anddepression in Type 2 diabetes. Diabetic Medicine 2008, 25(10):1133–1141.
18. Klein M, Kleinbaum D: Survival Analysis: A Self-Learning Text. New YorkSpringer-Verlag: 2 edition; 2005.
19. Whooley MA, de Jonge P, Vittinghoff E, Otte C, Moos R, Carney RM, Ali S,Dowray S, Na B, Feldman MD, Schiller NB, Browner WS: Depressivesymptoms, health behaviors, and risk of cardiovascular events inpatients with coronary heart disease. JAMA 2008, 300(20):2379–2388.
20. Kumari M, Head J, Marmot M: Prospective study of social and other riskfactors for incidence of type 2 diabetes in the Whitehall II study. Archivesof internal medicine 2004, 164(17):1873–1880.
21. Koopmans B, Pouwer F, de Bie RA, van Rooij ES, Leusink GL, Pop VJ:Depressive symptoms are associated with physical inactivity in patientswith type 2 diabetes. The DIAZOB Primary Care Diabetes study. Familypractice 2009, 26(3):171–173.
22. Shirom A, Toker S, Jacobson O, Balicer RD: Feeling vigorous and the risks ofall-cause mortality, ischemic heart disease, and diabetes: a 20-year follow-up of healthy employees. Psychosomatic medicine 2010, 72(8):727–733.
23. Sawatzky R, Liu-Ambrose T, Miller WC, Marra CA: Physical activity as amediator of the impact of chronic conditions on quality of life in olderadults. Health and quality of life outcomes 2007, 5:68.
24. Barr-Anderson DJ, AuYoung M, Whitt-Glover MC, Glenn BA, Yancey AK:Integration of short bouts of physical activity into organizational routinea systematic review of the literature. American journal of preventivemedicine 2011, 40(1):76–93.
25. Orozco LJ, Buchleitner AM, Gimenez-Perez G, Roque IFM, Richter B, MauricioD: Exercise or exercise and diet for preventing type 2 diabetes mellitus.Cochrane database of systematic reviews 2008, 3:CD003054.
26. Champaneri S, Wand GS, Malhotra SS, Casagrande SS, Golden SH: Biologicalbasis of depression in adults with diabetes. Current diabetes reports 2010,10(6):396–405.
27. Dandona P, Aljada A, Chaudhuri A, Mohanty P, Garg R: Metabolicsyndrome: a comprehensive perspective based on interactions betweenobesity, diabetes, and inflammation. Circulation 2005, 111(11):1448–1454.
28. van der Heijden MM, Pouwer F, Romeijnders AC, Pop VJ: Testing theeffectiveness of a self-efficacy based exercise intervention for inactivepeople with type 2 diabetes mellitus: design of a controlled clinical trial.BMC Public Health 2012, 12:331.
29. Yates T, Davies MJ, Henson J, Troughton J, Edwardson C, Gray LJ, Khunti K:Walking away from type 2 diabetes: trial protocol of a clusterrandomised controlled trial evaluating a structured educationprogramme in those at high risk of developing type 2 diabetes. BMCFam Pract 2012, 13:46.
30. Pouwer F, Tack CJ, Geelhoed-Duijvestijn PH, Bazelmans E, Beekman AT,Heine RJ, Snoek FJ: Limited effect of screening for depression withwritten feedback in outpatients with diabetes mellitus: a randomisedcontrolled trial. Diabetologia 2011, 54(4):741–748.
31. Fisher L, Polonsky W, Parkin CG, Jelsovsky Z, Amstutz L, Wagner RS: Theimpact of blood glucose monitoring on depression and distress ininsulin-naive patients with type 2 diabetes. Current medical research andopinion 2011, 27(Suppl 3):39–46.
32. Johnson M, Jones R, Freeman C, Buckley Woods H, Gillett M, Goyder E,Payne N: Can diabetes prevention programmes be translated effectivelyinto real-world settings and still deliver improved outcomes? A synthesisof evidence. Diabetic medicine 2012.
33. Taskforce IDF g: Global Guideline for Type 2 Diabetes: recommendationsfor standard, comprehensive, and minimal care. Diabetic Medicine 2006,23(6):579–593.
34. Massó González EL, Johansson S, Wallander MA, Rodriguez LA: Trends inthe prevalence and incidence of diabetes in the UK: 1996–2005. Journalof epidemiology and community health 2009, 63(4):332–336.
doi:10.1186/1471-2458-12-1109Cite this article as: Mommersteeg et al.: Higher levels of psychologicaldistress are associated with a higher risk of incident diabetes during18 year follow-up: results from the British household panel survey. BMCPublic Health 2012 12:1109.
Related Documents