https://studentsuccessjournal.org/ Volume 10 (3) 2019 https://doi.org/10.5204/ssj.v10i3.1411 This work is licensed under a Creative Commons Attribution 4.0 International Licence. As an open access journal, articles are free to use with proper attribution. ISSN: 2205-0795 1 © The Author/s 2019 Make It Measurable: Assessing Psychological Distress, Wellbeing and Resilience at Scale in Higher Education Joep van Agteren South Australian Health and Medical Research Institute (SAHMRI)/ Flinders University, Adelaide, Australia Lydia Woodyatt Flinders University, Adelaide, Australia Matthew Iasiello South Australian Health and Medical Research Institute (SAHMRI)/ Flinders University, Adelaide, Australia Julie Rayner Flinders University, Adelaide, Australia Michael Kyrios Flinders University, Adelaide, Australia Abstract Keywords: Mental health; resilience; wellbeing; intervention. Mental Health in Higher Education Having good mental health and wellbeing is important to all of us – as individuals, family members, friends, neighbours and within our communities. When we thrive, we see benefits across many aspects of our lives. Improving our mental wellbeing lowers our risk of mental and physical illness (Keyes, Dhingra, & Simoes, 2010; Wood & Joseph, 2010), and can speed up recovery when we do get sick (Diener, Pressman, Hunter, & Delgadillo‐Chase, 2017; Iasiello, van Agteren, Keyes, & Cochrane, 2019). Our social lives improve and we have a higher number of positive relationships (Kansky & Diener, 2017). When we There is an ever-increasing focus on the importance of addressing the mental health of students across the higher education sector. Measuring psychological distress or symptoms of common mental disorders as a proxy for mental health does however provide a limited picture of someone’s mental health status. There is a need to comprehensively measure mental health via outcomes of psychological distress combined with “positive” and “adaptive” states of mental health such as mental wellbeing and resilience. This paper describes a study of 905 students in which an online mental health and wellbeing platform was used to measure the mental health of students, all the while providing real- time individual reports to each individual student. The data provides evidence of high levels of psychological distress (i.e. anxiety) and low levels of mental wellbeing and resilience in students, relative to population norms, with merely 18.6% of students demonstrating optimal scores on all outcomes. Contrary to predictions we found no evidence of poorer wellbeing amongst international students when compared to domestic students. The results indicate that complimenting measurement of distress with measurement of positive and adaptive states can more comprehensively capture the precarious mental status of our tertiary students. Providing this measurement in a scalable and targeted way provides universities and its students the opportunity to provide and use mental health interventions based on the needs of particular cohorts of students, moving beyond resource-intense but intermittent or untargeted approaches to intervention.

Welcome message from author
This document is posted to help you gain knowledge. Please leave a comment to let me know what you think about it! Share it to your friends and learn new things together.
Transcript
https://studentsuccessjournal.org/
Volume 10 (3) 2019 https://doi.org/10.5204/ssj.v10i3.1411
This work is licensed under a Creative Commons Attribution 4.0 International Licence. As an open access
journal, articles are free to use with proper attribution. ISSN: 2205-0795
1 © The Author/s 2019
Make It Measurable: Assessing Psychological
Distress, Wellbeing and Resilience at Scale in
Higher Education Joep van Agteren South Australian Health and Medical Research Institute (SAHMRI)/ Flinders University, Adelaide, Australia
Lydia Woodyatt Flinders University, Adelaide, Australia
Matthew Iasiello South Australian Health and Medical Research Institute (SAHMRI)/ Flinders University, Adelaide, Australia
Julie Rayner Flinders University, Adelaide, Australia
Michael Kyrios Flinders University, Adelaide, Australia
Abstract
Keywords: Mental health; resilience; wellbeing; intervention.
Mental Health in Higher Education
Having good mental health and wellbeing is important to all of us – as individuals, family members, friends, neighbours and
within our communities. When we thrive, we see benefits across many aspects of our lives. Improving our mental wellbeing
lowers our risk of mental and physical illness (Keyes, Dhingra, & Simoes, 2010; Wood & Joseph, 2010), and can speed up
recovery when we do get sick (Diener, Pressman, Hunter, & Delgadillo‐Chase, 2017; Iasiello, van Agteren, Keyes, & Cochrane,
2019). Our social lives improve and we have a higher number of positive relationships (Kansky & Diener, 2017). When we
There is an ever-increasing focus on the importance of addressing the mental health of students across the higher
education sector. Measuring psychological distress or symptoms of common mental disorders as a proxy for mental
health does however provide a limited picture of someone’s mental health status. There is a need to comprehensively
measure mental health via outcomes of psychological distress combined with “positive” and “adaptive” states of
mental health such as mental wellbeing and resilience. This paper describes a study of 905 students in which an online
mental health and wellbeing platform was used to measure the mental health of students, all the while providing real-
time individual reports to each individual student. The data provides evidence of high levels of psychological distress
(i.e. anxiety) and low levels of mental wellbeing and resilience in students, relative to population norms, with merely
18.6% of students demonstrating optimal scores on all outcomes. Contrary to predictions we found no evidence of
poorer wellbeing amongst international students when compared to domestic students. The results indicate that
complimenting measurement of distress with measurement of positive and adaptive states can more comprehensively
capture the precarious mental status of our tertiary students. Providing this measurement in a scalable and targeted
way provides universities and its students the opportunity to provide and use mental health interventions based on the
needs of particular cohorts of students, moving beyond resource-intense but intermittent or untargeted approaches to
intervention.
Volume 10 (3) 2019 Van Agteren
2
have higher levels of mental wellbeing our productivity increases, which can translate to better academic outcomes (Huppert,
2009).
Many researchers are proposing that issues of psychological distress are on the rise amongst university students (Orygen, 2017;
Scott-Young, Turner, & Holdsworth, 2018). This can have implications for student success as it may form a significant barrier
to retention, completion, and achievement. The impact of managing psychological distress during the study period extends
beyond university life, with research links to outcomes like employability and wellbeing at work, both presently and in the
future (Scott-Young et al., 2018). Carter, Paliano, Francis & Thorne (2017) for instance suggested that mental health difficulties
follow students when transitioning into employment and subsequently lead to lifelong negative impacts. Given this, it should
perhaps be unsurprising that students see their mental health not just as a means to success, but as a key outcome by which they
measure their own success (O’Shea & Delahunty, 2018).
The impact of psychological health on students and their success has led to recommendations to implement institution-wide
approaches to support student wellbeing and mental health across the university sector (Orygen, 2017; Okanagan Charter,
2015). However, in order for the Higher Education sector to make progress on this issue, student wellbeing and mental health
needs to be “made measurable” (Orygen, 2017). Despite millions of dollars spent in student support, it has proven challenging
to reliably measure and track change in mental health and wellbeing outcomes across the sector or within an institution (Carter
et al., 2017). Firstly, a challenge for assessment of wellbeing and mental health across higher education is balancing
questionnaire burden with sufficient validity to allow for evidence-based decisions to be made in relation to the mental health
of the student group. Secondly, higher education institutions have a duty of care to ensure students are cognisant of their current
distress status, but are similarly aware of their mental wellbeing and resilience status, and to provide students with resources or
interventions that can be used to improve the experience of their mental health status.
What Needs to be Measured when Assessing Mental Health in Higher Education (and why)
Psychological Distress
The vast majority of research on mental health in higher education investigates psychological distress symptoms. Psychological
distress, which focuses on distress resulting from symptoms associated with depression, anxiety or stress, has been associated
with significant reductions in academic performance and engagement (Andrews & Wilding, 2004; Stallman, 2010). Students
that experience high psychological distress are significantly impacted in their capacity to study, with research showing that, on
average, students using university health services are prevented from work or study for 8 days over a 4-week period as a result
of their distress (Stallman, 2008). Further, research suggests students may experience these symptoms at higher levels than the
general population. For example, in a survey of more than 5,000 students at the University of Melbourne in Australia, Larcombe
et al. (2016) found that students reported elevated levels of stress, anxiety and depression relative to population norms.
Symptoms of psychological distress are often aggregated into a single score, thereby capturing psychological distress as a total
construct. For example, screening tools such as the Mental Health Inventory (MHI)-5 (Berwick et al., 1991) or the popular
Kessler (K)-10 (Kessler et al., 2002) have the benefit of being validated and are readily used in Australia, but do not breakdown
scores for the independent subdomains of depression, anxiety or stress independently. An aggregated score of psychological
distress can be useful to show a wider mental health need but reduces the ability of a person or organisation to respond to
particular outcomes through targeted intervention. While symptoms associated with depression and anxiety share common and
differential antecedents (Eysenck & Fajkowska, 2018), they show differences in their relationship to mental wellbeing (Iasiello,
van Agteren, & Muir-Cochrane, forthcoming) and similarly may influence outcomes related to student success differentially.
Thus, although there is a need to assess psychological distress, there is a need to do so in a nuanced way that leads to a specific
indication of the mental health need.
Mental Wellbeing and Resilience
Capturing psychological distress only highlights one aspect of the overall mental health of students. It is similarly necessary to
measure “positive” and “adaptive” mental health outcomes such as mental wellbeing and resilience (Suldo & Shaffer, 2008).
Mental wellbeing is related to but distinct from the absence of psychological distress and mental illness and is an important
resource for student success (Denovan & Macaskill, 2017; Iasiello et al., forthcoming). Mental wellbeing (which can encompass
Volume 10 (3) 2019 Van Agteren
3
a range of positive emotional and motivational states) can significantly impact student success, as demonstrated in a several
studies. In a longitudinal study of students across four years of study in Hong Kong, good mental wellbeing was associated
with higher levels of engagement and subsequent learning outcomes (Yu, Shek & Zhu, 2018). Students showing better
adjustment to university life during their first 6 months of study experience higher mental wellbeing (compared to those with
poorer adjustment), which is associated with higher academic performance (Baily & Phillips, 2016).
Mental wellbeing describes the more “positive” aspects of human emotional and motivational states. Measures of mental
wellbeing are typically classified as either hedonic or eudaimonic. Hedonic measures of wellbeing generally focus on subjective
feelings of wellbeing (as in the presence of positive affect or positive motivational states, the absence of negative affect or
negative motivational states and the presence of life satisfaction) (Diener, 1984). Eudaimonic wellbeing focusses instead on
the experience of positive functioning, including aspects such as autonomy, personal growth, and a sense of meaning in life
(Ryff & Keyes, 1995). When measuring the wellbeing of university students, both hedonic and eudaimonic aspects of wellbeing
should be measured to capture a holistic image of student wellbeing. Imagine a student who is goal orientated, and feels that
they are learning new things and have purpose, and yet they do not experience subjective feelings of happiness or enjoyment.
Difficult emotions, failure, and frustrations may be part of the learning environment when one is challenged, but if this is
associated with a growing sense of connection to others, purpose, or growth, even these negative feelings can be part of
wellbeing (Kashdan & Biswas-Diener, 2014).
Where hedonic and eudaimonic wellbeing focus on individual feelings and ability to self-realise, social wellbeing describes
one’s wellbeing in relation to their community (e.g. the student population) or society. Social health or wellbeing has
traditionally been an important aspect of sociological theory (Durkheim, 2005), and has been integrated into overall mental
wellbeing (Keyes, 2002; Keyes, 1998). Social wellbeing describes one’s appraisals of their circumstances and functioning in
society. Broadly, it includes domains of social integration, social acceptance, social contribution, social actualisation, and social
coherence, which have been described elsewhere (Keyes, 1998). While some research has investigated the conceptual overlap
between student social wellbeing and sense of community and participation in university community (Cicognani et al., 2008),
it is often overlooked in university student mental health research in favour of isolation and loneliness (Houghton, Hattie,
Carroll, Wood, & Baffour, 2016). Social wellbeing may be particularly relevant for international students who may be least
likely to participate in the university community and report higher levels of loneliness and isolation (Alsahafi & Shin, 2016;
Macionis, Walters, & Kwok, 2018).
Irrespective of current levels of psychological distress and wellbeing, students need to possess the ability to cope with and
restore from the stressors or adversity that are inevitable parts of student life (Davydov, Stewart, Ritchie, & Chaudieu, 2010).
The student’s perceived ability to manage the stressors in their life, defined here as resilience, is a valuable outcome to measure.
If high levels of resilience are present, the student is better protected from developing low levels of wellbeing or distress in the
future. It is therefore unsurprising that resilience has been linked to student success at university (Baik et al., 2017; Stamp et
al., 2015) and can provide valuable insight in identifying at-risk students. For example, students may not be experiencing
worrisome stress levels at the moment but may feel that they could not deal with stress when it would arise in the future.
Measuring students early in the semester may not highlight issues with stress, but if the student has low resilience, this can flag
potential challenges in the future, e.g. closer to exam periods.
The Current Study
Taking this more comprehensive and nuanced approach to student mental health measurement can provide greater insight into
the student experience and can better inform student mental health interventions (Iasiello et al., forthcoming). For example, a
student may experience heightened stress during their studies, but if this is balanced by resilience, high subjective wellbeing,
and positive coping behaviours then the student may still be experiencing positive mental health. Another student may
experience low levels of stress or anxiety, but also low feelings of subjective wellbeing (low on purpose, growth, or happiness)
and may be at risk of poor mental health. Studies in high school students consistently show that measuring both well-being and
distress outcomes can identify sub-groups of students that are at risk of low academic performance including lower attendance
rates, academic scores, self-efficacy and academic self-perceptions (Rose, Lindsey, Xiao, Finigan-Carr, & Joe, 2017; Suldo,
Thalji, & Ferron, 2011; Suldo & Shaffer, 2008; Venning, Wilson, Kettler, & Eliott, 2013; Xiong, Qin, Gao, & Hai, 2017).
Studies with university students are less common, identifying the need to determine the impact of these outcomes on student
success in this population.
Volume 10 (3) 2019 Van Agteren
4
The current study attempts to make mental health – encompassing wellbeing, resilience and distress – measureable. Given that
local educational contexts may impact on student psychological wellbeing, the study was conducted with the aim of getting
insight into local psychological wellbeing and distress levels, as the first stage of developing a targeted student mental health
and wellbeing program. Given previous research it was expected that psychological distress would be higher amongst university
students relative to population norms. Similarly, it was hypothesised that wellbeing would be lower, as well as the general
resilience of the students compared to general norms. Furthermore, the impact of various moderators was investigated. For
instance, it was expected that the mental health and wellbeing of international students would be lower than that of domestic
students, as research suggests that the wellbeing of international student is worse than that of domestic students due to the range
of pressures and stressors such as learning new cultural norms, language barriers, level of engagement with the host society,
loneliness, financial security, and accommodation concerns (Han, Han, Luo, Jacobs, & Jean-Baptiste, 2013; Leung, 2001;
Poyrazli & Grahame, 2007; Wu, Garza, & Guzman, 2015).
Methods
Participants
During the months of March to April 2019, the entire student population from the disciplines of Education, Psychology and
Social Work at Flinders University (n = 5791) in Australia were invited to participate in a measure of mental health and
wellbeing. Students were invited via student newsletters, direct email, announcements in lectures and by asking academic staff
to promote the wellbeing survey directly to their students. Within a three-week response period, a sample of n = 905 (15.6%)
students completed a baseline measure.
Approach
The study was a collaborative project between the university and the South Australian Health and Medical Research Institute
(SAHMRI), which specialises in the measurement of intervention in mental health and wellbeing. SAHMRI has developed a
specialised technology platform (app.completementalhealth.com) which has been designed according to the highest privacy
standards (e.g. the platform is General Data Protection Regulation (GDPR) compliant) to ensure individual participant
anonymity and privacy. Students were invited to log into the platform via mobile-enabled devices on a browser that adhered to
modern web standards. Communication from both the university and SAHMRI, was devised to ensure that the student
understood that an external research institute was guardian of the data. Students were directed to take the measurement online,
which took roughly 10 to 15 minutes to complete.
The platform, in addition to acting as a measurement tool, had the aim to improve student mental health and wellbeing literacy
(Oades, 2017). Each student who completed the measurement received an in-depth online report that summarised the student’s
scores on each of the outcomes, provided an explanation for each of the domains and gave recommendations on activities to
complete when scores warranted improvement. The report was accessible in real-time on the platform after completing the
measurement. In addition to the tailored report, students could read a variety of wellbeing and mental health related content
accessible on the platform’s homepage. Finally, information regarding university wide health, mental health and wellbeing
resources and services was sent to students as part of the questionnaire procedure.
Data Analysis
A variety of statistical techniques were used in this study including independent samples, t-tests, Chi-Square tests, analysis of
Variance (ANOVA) and Analysis of Covariance (ANCOVA) to control for relevant covariates where necessary. While
normality of scores is typically an issue for wellbeing measures, ANOVA is relatively robust to a violation of normality, leading
to the decision to retain the original scores as opposed to conducting transformations to the data. Where possible, documented
cut-offs were used to form categorisations into risk-groups or to help infer severity of symptoms in the presented graphs.
Volume 10 (3) 2019 Van Agteren
5
Results
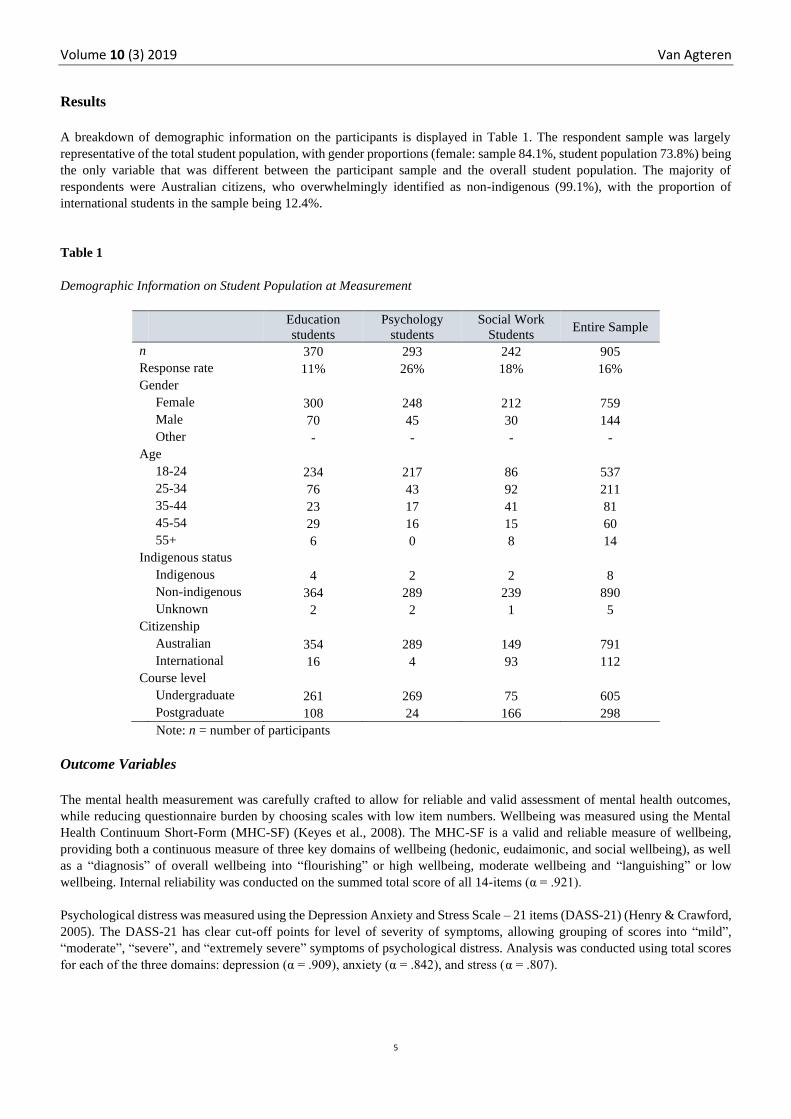
A breakdown of demographic information on the participants is displayed in Table 1. The respondent sample was largely
representative of the total student population, with gender proportions (female: sample 84.1%, student population 73.8%) being
the only variable that was different between the participant sample and the overall student population. The majority of
respondents were Australian citizens, who overwhelmingly identified as non-indigenous (99.1%), with the proportion of
international students in the sample being 12.4%.
Table 1
Demographic Information on Student Population at Measurement
Education
students
Psychology
students
Social Work
Students Entire Sample
n 370 293 242 905
Response rate 11% 26% 18% 16%
Gender
Female 300 248 212 759
Male 70 45 30 144
Other - - - -
Age
18-24 234 217 86 537
25-34 76 43 92 211
35-44 23 17 41 81
45-54 29 16 15 60
55+ 6 0 8 14
Indigenous status
Indigenous 4 2 2 8
Non-indigenous 364 289 239 890
Unknown 2 2 1 5
Citizenship
Australian 354 289 149 791
International 16 4 93 112
Course level
Undergraduate 261 269 75 605
Postgraduate 108 24 166 298
Note: n = number of participants
Outcome Variables
The mental health measurement was carefully crafted to allow for reliable and valid assessment of mental health outcomes,
while reducing questionnaire burden by choosing scales with low item numbers. Wellbeing was measured using the Mental
Health Continuum Short-Form (MHC-SF) (Keyes et al., 2008). The MHC-SF is a valid and reliable measure of wellbeing,
providing both a continuous measure of three key domains of wellbeing (hedonic, eudaimonic, and social wellbeing), as well
as a “diagnosis” of overall wellbeing into “flourishing” or high wellbeing, moderate wellbeing and “languishing” or low
wellbeing. Internal reliability was conducted on the summed total score of all 14-items (α = .921).
Psychological distress was measured using the Depression Anxiety and Stress Scale – 21 items (DASS-21) (Henry & Crawford,
2005). The DASS-21 has clear cut-off points for level of severity of symptoms, allowing grouping of scores into “mild”,
“moderate”, “severe”, and “extremely severe” symptoms of psychological distress. Analysis was conducted using total scores
for each of the three domains: depression (α = .909), anxiety (α = .842), and stress (α = .807).
Volume 10 (3) 2019 Van Agteren
6
Finally, the student’s own interpretations of their ability to deal with and bounce back from stress or adversity (i.e. resilience)
was measured using the Brief Resilience Scale (BRS) (Smith et al., 2008). The BRS conceptualises resilience as an outcome
and is a well-accepted tool to gain insight into resilience, with cut-offs for low, normal and high resilience (Windle, Bennett,
& Noyes, 2011). Participants answered 6 questions on a 1 (Strongly disagree) to 5 (Strongly Agree) scale (e.g., I tend to bounce
back quickly after hard times; (α = .839).
Mental Wellbeing (Flourishing) correlated r = 0.516 with resilience, while correlating between -.491 and -.515 with stress and
anxiety. The correlation between positive mental health and depressive symptoms was higher than expected at r = -.741, which
has been observed in other cohorts with high severity of symptoms (van Erp Taalman Kip & Hutschemaekers, 2018). The
constructs of psychological distress were correlated between .615 and .734.
Wellbeing, Resilience and Distress in Total Sample
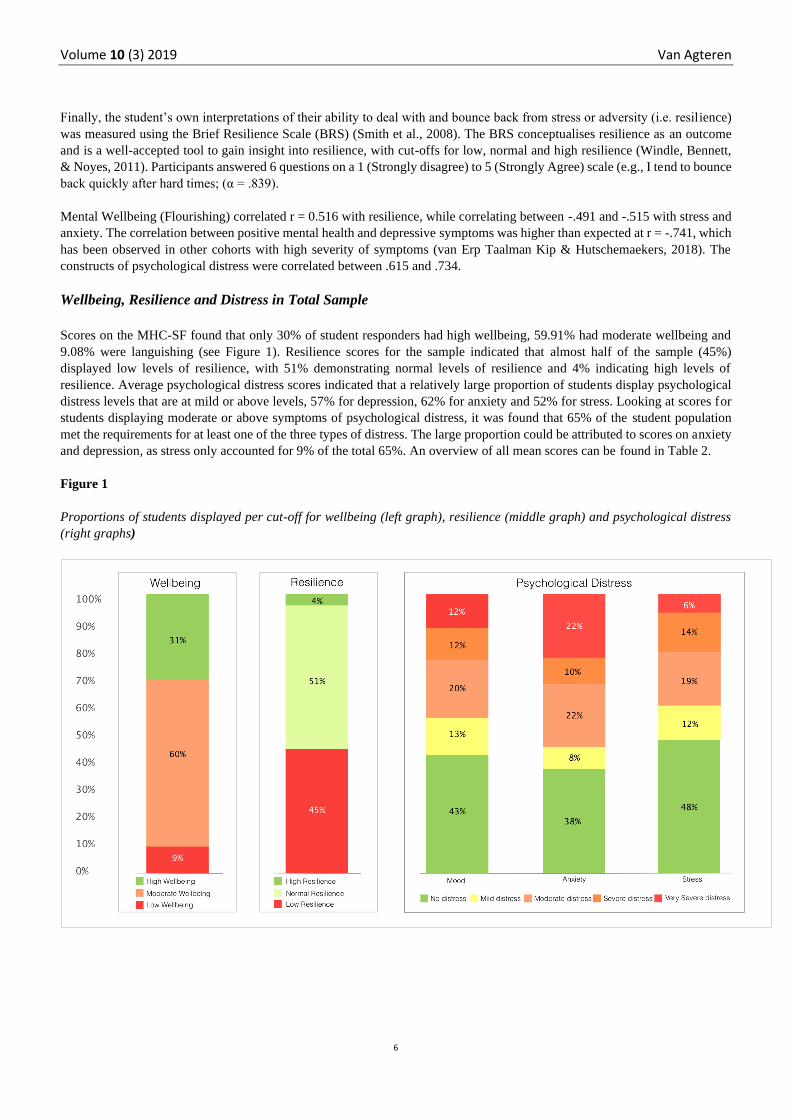
Scores on the MHC-SF found that only 30% of student responders had high wellbeing, 59.91% had moderate wellbeing and
9.08% were languishing (see Figure 1). Resilience scores for the sample indicated that almost half of the sample (45%)
displayed low levels of resilience, with 51% demonstrating normal levels of resilience and 4% indicating high levels of
resilience. Average psychological distress scores indicated that a relatively large proportion of students display psychological
distress levels that are at mild or above levels, 57% for depression, 62% for anxiety and 52% for stress. Looking at scores for
students displaying moderate or above symptoms of psychological distress, it was found that 65% of the student population
met the requirements for at least one of the three types of distress. The large proportion could be attributed to scores on anxiety
and depression, as stress only accounted for 9% of the total 65%. An overview of all mean scores can be found in Table 2.
Figure 1
Proportions of students displayed per cut-off for wellbeing (left graph), resilience (middle graph) and psychological distress
(right graphs)
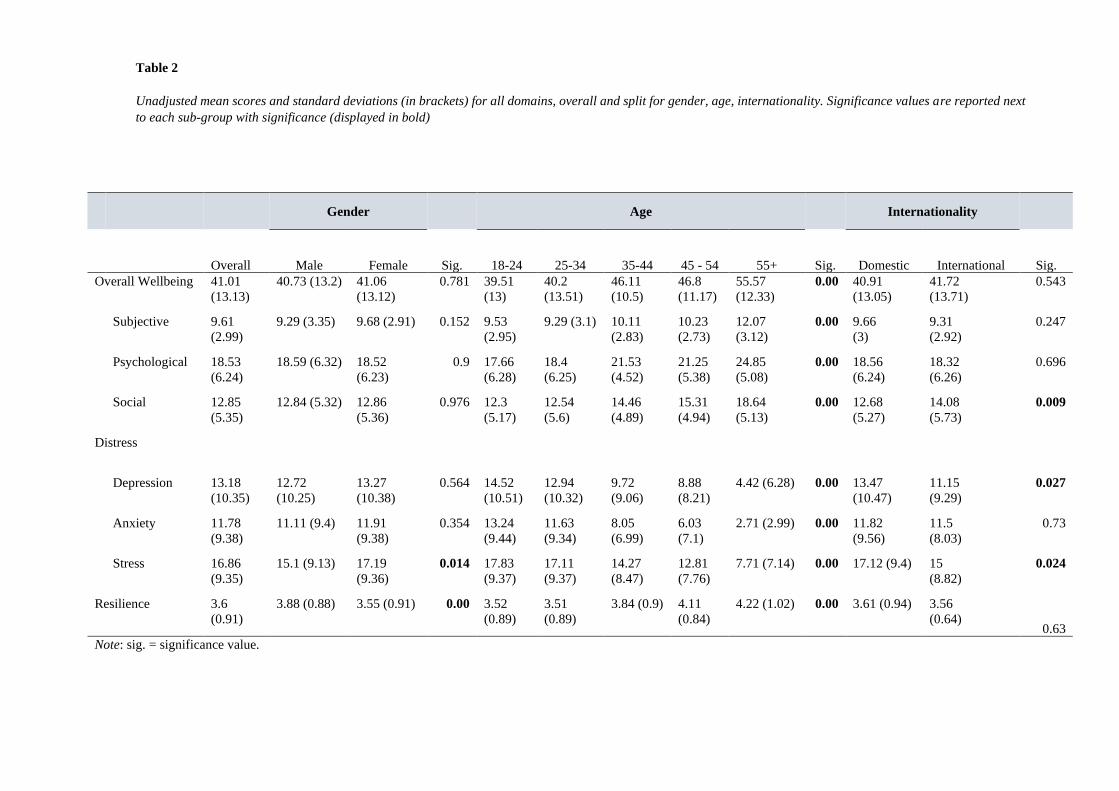
Table 2
Unadjusted mean scores and standard deviations (in brackets) for all domains, overall and split for gender, age, internationality. Significance values are reported next
to each sub-group with significance (displayed in bold)
Gender Age Internationality
Overall Male Female Sig. 18-24 25-34 35-44 45 - 54 55+ Sig. Domestic International Sig.
Overall Wellbeing 41.01
(13.13)
40.73 (13.2) 41.06
(13.12)
0.781 39.51
(13)
40.2
(13.51)
46.11
(10.5)
46.8
(11.17)
55.57
(12.33)
0.00 40.91
(13.05)
41.72
(13.71)
0.543
Subjective 9.61
(2.99)
9.29 (3.35) 9.68 (2.91) 0.152 9.53
(2.95)
9.29 (3.1) 10.11
(2.83)
10.23
(2.73)
12.07
(3.12)
0.00 9.66
(3)
9.31
(2.92)
0.247
Psychological 18.53
(6.24)
18.59 (6.32) 18.52
(6.23)
0.9 17.66
(6.28)
18.4
(6.25)
21.53
(4.52)
21.25
(5.38)
24.85
(5.08)
0.00 18.56
(6.24)
18.32
(6.26)
0.696
Social 12.85
(5.35)
12.84 (5.32) 12.86
(5.36)
0.976 12.3
(5.17)
12.54
(5.6)
14.46
(4.89)
15.31
(4.94)
18.64
(5.13)
0.00 12.68
(5.27)
14.08
(5.73)
0.009
Distress
Depression 13.18
(10.35)
12.72
(10.25)
13.27
(10.38)
0.564 14.52
(10.51)
12.94
(10.32)
9.72
(9.06)
8.88
(8.21)
4.42 (6.28) 0.00 13.47
(10.47)
11.15
(9.29)
0.027
Anxiety 11.78
(9.38)
11.11 (9.4) 11.91
(9.38)
0.354 13.24
(9.44)
11.63
(9.34)
8.05
(6.99)
6.03
(7.1)
2.71 (2.99) 0.00 11.82
(9.56)
11.5
(8.03)
0.73
Stress 16.86
(9.35)
15.1 (9.13) 17.19
(9.36)
0.014 17.83
(9.37)
17.11
(9.37)
14.27
(8.47)
12.81
(7.76)
7.71 (7.14) 0.00 17.12 (9.4) 15
(8.82)
0.024
Resilience 3.6
(0.91)
3.88 (0.88) 3.55 (0.91) 0.00 3.52
(0.89)
3.51
(0.89)
3.84 (0.9) 4.11
(0.84)
4.22 (1.02) 0.00 3.61 (0.94) 3.56
(0.64) 0.63
Note: sig. = significance value.
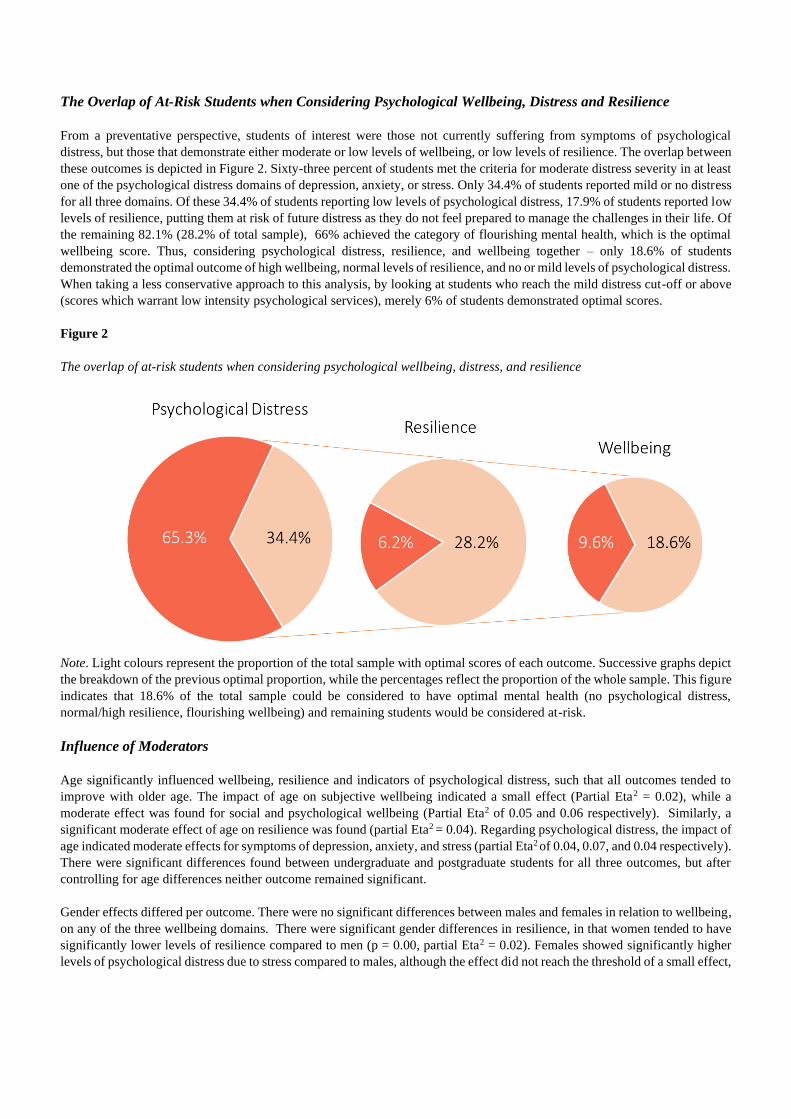
The Overlap of At-Risk Students when Considering Psychological Wellbeing, Distress and Resilience
From a preventative perspective, students of interest were those not currently suffering from symptoms of psychological
distress, but those that demonstrate either moderate or low levels of wellbeing, or low levels of resilience. The overlap between
these outcomes is depicted in Figure 2. Sixty-three percent of students met the criteria for moderate distress severity in at least
one of the psychological distress domains of depression, anxiety, or stress. Only 34.4% of students reported mild or no distress
for all three domains. Of these 34.4% of students reporting low levels of psychological distress, 17.9% of students reported low
levels of resilience, putting them at risk of future distress as they do not feel prepared to manage the challenges in their life. Of
the remaining 82.1% (28.2% of total sample), 66% achieved the category of flourishing mental health, which is the optimal
wellbeing score. Thus, considering psychological distress, resilience, and wellbeing together – only 18.6% of students
demonstrated the optimal outcome of high wellbeing, normal levels of resilience, and no or mild levels of psychological distress.
When taking a less conservative approach to this analysis, by looking at students who reach the mild distress cut-off or above
(scores which warrant low intensity psychological services), merely 6% of students demonstrated optimal scores.
Figure 2
The overlap of at-risk students when considering psychological wellbeing, distress, and resilience
Note. Light colours represent the proportion of the total sample with optimal scores of each outcome. Successive graphs depict
the breakdown of the previous optimal proportion, while the percentages reflect the proportion of the whole sample. This figure
indicates that 18.6% of the total sample could be considered to have optimal mental health (no psychological distress,
normal/high resilience, flourishing wellbeing) and remaining students would be considered at-risk.
Influence of Moderators
Age significantly influenced wellbeing, resilience and indicators of psychological distress, such that all outcomes tended to
improve with older age. The impact of age on subjective wellbeing indicated a small effect (Partial Eta2 = 0.02), while a
moderate effect was found for social and psychological wellbeing (Partial Eta2 of 0.05 and 0.06 respectively). Similarly, a
significant moderate effect of age on resilience was found (partial Eta2 = 0.04). Regarding psychological distress, the impact of
age indicated moderate effects for symptoms of depression, anxiety, and stress (partial Eta2 of 0.04, 0.07, and 0.04 respectively).
There were significant differences found between undergraduate and postgraduate students for all three outcomes, but after
controlling for age differences neither outcome remained significant.
Gender effects differed per outcome. There were no significant differences between males and females in relation to wellbeing,
on any of the three wellbeing domains. There were significant gender differences in resilience, in that women tended to have
significantly lower levels of resilience compared to men (p = 0.00, partial Eta2 = 0.02). Females showed significantly higher
levels of psychological distress due to stress compared to males, although the effect did not reach the threshold of a small effect,
Volume 10 (3) 2019 Van Agteren
9
partial Eta2 = 0.07. No significant gender differences were found between psychological distress as a result of mood and
anxiety.
There were no significant differences in any domains of wellbeing or resilience between the domestic and international students
tested. Surprisingly, domestic students scored significantly higher in distress due to mood and stress symptoms than
international students, although the partial Eta2 did not reach the threshold of a small effect (partial Eta2 of 0.01 in each case).
No differences were found for distress due to anxiety.
Discussion
This study demonstrated the importance of assessing mental health via measures of psychological distress as well as wellbeing
and resilience. The current study found low levels of wellbeing, high levels of psychological distress and a relatively high
proportion of students with low resilience in an Australian tertiary student population, with less than one fifth of the students
scoring high on any of the outcomes.
The results of this sample showed evidence of distress higher than population norms. In particular, symptoms of anxiety were
a significant issue for students, with one third of the population reporting severe or extremely severe levels of psychological
distress. The distress levels found in the current study were higher than the typically reported values of between 20 to 25% in
students and the Australian general population, but approach the results found by Stallman (2010), namely 83.9% of students
displaying sub-clinical distress or higher. These rates fall within the range of reported values, as the prevalence of distress in
student samples widely varies between studies. For example, medical student samples demonstrate distress estimates between
12.2 and 96.7% (Hope & Henderson, 2014). The current study was conducted with a student population comprising 905
students, and a “stress-free” moment in the academic year for the data collection was deliberately chosen. Therefore, this study
makes an important contribution to the data pointing to a high distress prevalence in the wider student population.
Two specific factors, age and internationality, showed interesting response patterns. The results found in this study suggested
that older students generally were doing better than younger students. Although higher distress levels are sometimes found to
be higher in younger adults (Jorm et al., 2005), wellbeing is typically considered to follow an inverted u-shape in relation to
age-effects with a clear dip happening in mid-life (Steptoe, Deaton, & Stone, 2015); a finding that does not uphold for the
currently studied student population. While mature-aged entry students may experience a number of barriers to study, they may
also have a set of psychological skills that can hold them in good stead for success, which may explain these results.
Contrary to expectations, international students were doing better than their domestic counterparts. While international students
are often thought to be at high risk of problematic mental health, for instance due to challenges related to help-seeking behaviour
(Clough, Nazareth, Day, & Casey, 2019), their distress levels were not higher than domestic students. Although this is in line
with some studies which failed to find a difference between domestic and international students in Australia (Khawaja &
Dempsey, 2008), the findings in this study warrant caution. For instance, there may have been possible limitations of language
and culture that hide various cultural specific expressions of poor (or positive) mental health.
The low levels of wellbeing and resilience, both together and independent from psychological distress, are a clear target area
for future intervention programs. Longitudinal studies clearly indicate that low wellbeing and resilience leads to increased risk
of future mental illness (Wood & Joseph, 2010). Similarly, high levels of wellbeing are protective for future mental illness
(Keyes et al., 2010) and improving wellbeing among people with mental illness improves their rate of recovery (Iasiello et al.,
2019). The current sample featured a large proportion of students with a need for improvements in resilience. These students
may be psychologically unprepared for challenges and stressors, which they are almost certain to encounter in their academic
and personal lives. This is not only a personal wellbeing need but will be a graduate/employability need. This data is already
being used to co-design (with students and staff) an intervention that will target support of these needs. Good measurement not
only highlights the need but informs targeted use of finite resources to address that need.
A variety of interventions can be considered for improving wellbeing, resilience or mental health (Bolier et al., 2013; Macedo
et al., 2014), but only limited evidence exists for interventions that are designed to improve all outcomes targeted in this study.
Different psychological and behavioural interventions have various intervention impact depending on different parameters, e.g.
cognitive-behavioural therapy (CBT) based interventions are impactful in improving wellbeing in people with mental illness,
Volume 10 (3) 2019 Van Agteren
10
but do not have the same effect in people without mental illness (Trompetter, Lamers, Westerhof, Fledderus, & Bohlmeijer,
2017; van Agteren et al., submitted). The current student sample showed a complex pattern of individual mental health and
wellbeing scores, results which indicate a need for a multi-faceted intervention that takes an individual’s mental state and
personal characteristics into account and matches intervention components to these characteristics. For example, students who
have mental illness and are flourishing may benefit most from traditional approaches to mental illness such as CBT. Students
who have moderate or low wellbeing and mental illness may benefit most from a combination of traditional approaches, new-
wave approaches such as acceptance and commitment therapy (ACT) or approaches aiming to improve wellbeing using positive
psychological principles. Mental health complexity requires more than generic catch-all interventions. Ongoing measurement
will allow for continuing identification and iterative design of wellbeing supports across a university.
The current study was limited in a number of ways. Although the sample was largely representative of the larger organisation,
the response rate was less than 16%. This means that conclusions for specific subsets of the population (e.g. the mental health
and wellbeing of Aboriginal or Torres Strait Islander students) was limited as the sample size and power was too low. In
addition, the current study is limited to one of six colleges within the larger university (encompassing Education, Psychology
and Social Work) meaning that the conclusions are limited to this sub-population. Furthermore, the current study was a cross-
sectional study which means no cause-effect can be established and the influence of confounders and bias (e.g. the influence
of timing of the study) cannot be ruled out. The study furthermore only relied on quantitative measures, which means it is
impossible to determine the exact drivers of the lower psychological profile of the students, with future studies needing to focus
on including a qualitative component to investigate core constructs such as stress on student success (Hurst, Baranik, & Daniel,
2013; Robotham & Julian, 2006).
Conclusion
The current study found high levels of distress, low levels of wellbeing and relatively low levels of resilience in this tertiary
student population, with results indicating that age moderated the results on all three outcomes. The project highlights the
complex interrelations between mental health and wellbeing and will serve as a foundation to inform future interventions and
maximise their effectiveness and efficiency.
References
Alsahafi, N., & Shin, S.-C. (2016). Factors affecting the academic and cultural adjustment of Saudi international students in
Australian universities. Journal of International Students, 7(1), 53-72. http://doi.org/10.32674/jis.v7i1.245
Andrews, B., & Wilding, J. M. (2004). The relation of depression and anxiety to life‐stress and achievement in students.
British Journal of Psychology, 95(4), 509-521. https://doi.org/10.1348/0007126042369802
Baik, C., Larcombe, W., Brooker, A., Wyn, J., Allen, L., Brett, M., ... & James, R. (2017). Enhancing student mental
wellbeing: A handbook for academic educators. Australian Government Department of Education and Training.
https://melbourne-cshe.unimelb.edu.au/__data/assets/pdf_file/0006/2408604/MCSHE-Student-Wellbeing-Handbook-
FINAL.pdf
Bailey, T. H., & Phillips, L. J. (2016). The influence of motivation and adaptation on students’ subjective well-being,
meaning in life and academic performance. Higher Education Research & Development, 35(2), 201-216.
https://doi.org/10.1080/07294360.2015.1087474
Berwick, D. M., Murphy, J. M., Goldman, P. A., Ware, J. E., Barsky, A. J., & Weinstein, M. C. (1991). Performance of a
five-item mental health screening test. Medical Care, 29(2). 169-176. http://dx.doi.org/10.1097/00005650-199102000-
00008
Bolier, L., Haverman, M., Westerhof, G. J., Riper, H., Smit, F., & Bohlmeijer, E. (2013). Positive psychology interventions:
A meta-analysis of randomized controlled studies. BMC Public Health, 13, 119. https://dx.doi.org/10.1186/1471-2458-13-
119
Volume 10 (3) 2019 Van Agteren
11
Carter, M. A., Pagliano, P., Francis, A., & Thorne, M. (2017). Australian university students and mental health: Viewpoints
from the literature. International Journal of Innovation, Creativity and Change, 3, 1-25.
https://www.ijicc.net/images/vol3iss3/1CarterPaglianoFrancisThorne.pdf
Cicognani, E., Pirini, C., Keyes, C., Joshanloo, M., Rostami, R., & Nosratabadi, M. (2008). Social participation, sense of
community and social wellbeing: A study on American, Italian and Iranian university students. Social Indicators
Research, 89(1), 97-112. https://doi.org/10.1007/s11205-007-9222-3
Clough, B. A., Nazareth, S. M., Day, J. J., & Casey, L. M. (2019). A comparison of mental health literacy, attitudes, and
help-seeking intentions among domestic and international tertiary students. British Journal of Guidance & Counselling,
47(1), 123-135. https://doi.org/10.1080/03069885.2018.1459473
Davydov, D. M., Stewart, R., Ritchie, K., & Chaudieu, I. (2010). Resilience and mental health. Clinical Psychology Review,
30(5), 479-495. https://doi.org/10.1016/j.cpr.2010.03.003
Denovan, A., & Macaskill, A. (2017). Stress and subjective well-being among first year UK undergraduate students. Journal
of Happiness Studies, 18(2), 505-525. https://doi.org/10.1007/s10902-016-9736-y
Diener, E. (1984). Subjective well-being. Psychological Bulletin, 95(3), 542. http://dx.doi.org/10.1037/0033-2909.95.3.542
Diener, E., Pressman, S. D., Hunter, J., & Delgadillo‐Chase, D. (2017). If, why, and when subjective well‐being influences
health, and future needed research. Applied Psychology: Health and Well‐Being, 9(2), 133-167.
https://doi.org/10.1111/aphw.12090
Durkheim, E. (2005). Suicide: A study in sociology. Routledge.
Eysenck, M. W., & Fajkowska, M. (2018). Anxiety and depression: Toward overlapping and distinctive features. Cognition
and Emotion: Special issue on Anxiety and Depression, 1391-1400. https://doi.org/10.1080/02699931.2017.1330255
Han, X., Han, X., Luo, Q., Jacobs, S., & Jean-Baptiste, M. (2013). Report of a mental health survey among Chinese
international students at Yale University. Journal of American College Health, 61(1), 1-8.
https://doi.org/10.1080/07448481.2012.738267
Henry, J. D., & Crawford, J. R. (2005). The short‐form version of the Depression Anxiety Stress Scales (DASS‐21):
Construct validity and normative data in a large non‐clinical sample. British Journal of Clinical Psychology, 44(2), 227-
239. https://doi.org/10.1348/014466505X29657
Hope, V., & Henderson, M. (2014). Medical student depression, anxiety and distress outside North America: A systematic
Review. Medical Education, 48(10), 963-979. https://doi.org/10.1111/medu.12512
Houghton, S., Hattie, J., Carroll, A., Wood, L., & Baffour, B. (2016). It hurts to be lonely! Loneliness and positive mental
wellbeing in Australian rural and urban adolescents. Journal of Psychologists and Counsellors in Schools, 26(1), 52-67.
https://doi.org/10.1017/jgc.2016.1
Huppert, F. A. (2009). Psychological well‐being: Evidence regarding its causes and consequences. Applied Psychology:
Health and Well‐Being, 1(2), 137-164. https://doi.org/10.1111/j.1758-0854.2009.01008.x
Hurst, C. S., Baranik, L. E., & Daniel, F. (2013). College student stressors: A review of the qualitative research. Stress and
Health, 29(4), 275-285. https://doi.org/10.1002/smi.2465
Iasiello, M., van Agteren, J., Keyes, C. L. M., & Cochrane, E. M. (2019). Positive mental health as a predictor of recovery
from mental illness. Journal of Affective Disorders, 251, 227-330. https://doi.org/10.1016/j.jad.2019.03.065
Iasiello, M., van Agteren, J., & Muir-Cochrane, E. (Forthcoming). Mental health and/or mental illness: A scoping review of
the evidence and implications of the dual-continua model of mental health. Evidence base.
Jorm, A. F., Windsor, T. D., Dear, K. B. G., Anstey, K. J., Christensen, H., & Rodgers, B. (2005). Age group differences in
psychological distress: The role of psychosocial risk factors that vary with age. Psychological Medicine, 35(9), 1253-
1263. https://doi.org/10.1017/S0033291705004976
Kansky, J., & Diener, E. (2017). Benefits of well-being: Health, social relationships, work, and resilience. Journal of Positive
Psychology and Wellbeing, 1(2), 129-169. http://www.journalppw.com/index.php/JPPW/article/view/20
Kashdan, T., & Biswas-Diener, R. (2014). The upside of your dark side: Why being your whole self-not just your "good" self-
drives success and fulfilment. Penguin.
Kessler, R. C., Andrews, G., Colpe, L. J., Hiripi, E., Mroczek, D. K., Normand, S.-L., . . . Zaslavsky, A. M. (2002). Short
screening scales to monitor population prevalences and trends in non-specific psychological distress. Psychological
medicine, 32(6), 959-976. http://dx.doi.org/10.1017/S0033291702006074
Keyes, C. L. M. (1998). Social well-being. Social Psychology Quarterly, 61(2), 121-140. http://dx.doi.org/10.2307/2787065
Keyes, C. L. M. (2002). The mental health continuum: From languishing to flourishing in life. Journal of Health and Social
Behavior, 42(2), 207-222. doi: 10.2307/3090197
Volume 10 (3) 2019 Van Agteren
12
Keyes, C. L. M., Dhingra, S. S., & Simoes, E. J. (2010). Change in level of positive mental health as a predictor of future risk
of mental illness. American Journal of Public Health, 100(12), 2366-2371. https://doi.org/10.2105/AJPH.2010.192245
Keyes, C. L. M., Wissing, M., Potgieter, J. P., Temane, M., Kruger, A., & van Rooy, S. (2008). Evaluation of the mental
health continuum-short form (MHC-SF) in Setswana-speaking South Africans. Clinical Psychology and Psychotherapy,
15(3), 181-192. https://doi.org/10.1002/cpp.572
Khawaja, N. G., & Dempsey, J. (2008). A comparison of international and domestic tertiary students in Australia. Journal of
Psychologists and Counsellors in Schools, 18(1), 30-46. https://doi.org/10.1375/ajgc.18.1.30
Larcombe, W., Finch, S., Sore, R., Murray, C. M., Kentish, S., Mulder, R. A., . . . Williams, D. A. (2016). Prevalence and
socio-demographic correlates of psychological distress among students at an Australian university. Studies in Higher
Education, 41(6), 1074-1091. https://doi.org/10.1080/03075079.2014.966072
Leung, C. (2001). The psychological adaptation of overseas and migrant students in Australia. International Journal of
Psychology, 36(4), 251-259. https://doi.org/10.1080/00207590143000018
Macedo, T., Wilheim, L., Goncalves, R., Coutinho, E. S. F., Vilete, L., Figueira, I., & Ventura, P. (2014). Building resilience
for future adversity: A systematic review of interventions in non-clinical samples of adults. BMC Psychiatry, 14, 227.
https://dx.doi.org/10.1186/s12888-014-0227-6
Macionis, N., Walters, G., & Kwok, E. (2018). International tertiary student experience in Australia: A Singaporean
perspective. Journal of Hospitality, Leisure, Sport & Tourism Education, 25, 100174
https://doi.org/10.1016/j.jhlste.2018.10.002
Oades, L. G. (2017). Wellbeing literacy: The missing link in positive education. n M. A. White, G. R. Slemp, & A. S. Murray
(Eds.) Future directions in well-being (pp. 169-173). Springer. https://doi.org/10.1007/978-3-319-56889-8_29
Okanagan Charter. (2015, June 22-25). An international charter for health promoting universities and colleges [Paper
presentation]. 2015 International Conference on Health Promoting Universities and Colleges/VII International Congress
Kelowna, BC, Canada. https://open.library.ubc.ca/cIRcle/collections/53926/items/1.0132754
Orygen. (2017). Under the radar: The mental health of Australian university students.
https://www.orygen.org.au/Policy/Policy-Reports/Under-the-radar
O'Shea, S., & Delahunty, J. (2018). Getting through the day and still having a smile on my face! How do students define
success in the university learning environment? Higher Education Research & Development, 37(5), 1062-1075.
https://doi.org/10.1080/07294360.2018.1463973
Poyrazli, S., & Grahame, K. M. (2007). Barriers to adjustment: Needs of international students within a semi-urban campus
community. Journal of Instructional Psychology, 34(1), 28-45.
Robotham, D., & Julian, C. (2006). Stress and the higher education student: a critical review of the literature. Journal of
Further and Higher Education, 30(2), 107-117. https://doi.org/10.1080/03098770600617513
Rose, T., Lindsey, M. A., Xiao, Y., Finigan-Carr, N. M., & Joe, S. (2017). Mental health and educational experiences among
Black youth: A latent class analysis. Journal of Youth and Adolescence, 46(11), 2321-2340.
http://dx.doi.org/10.1007/s10964-017-0723-3
Ryff, C. D., & Keyes, C. L. M. (1995). The structure of psychological well-being revisited. Journal of Personality and Social
Psychology, 69(4), 719. https://doi.org/10.1037//0022-3514.69.4.719
Scott-Young, C. M., Turner, M., & Holdsworth, S. (2018, 3-5 September). Fit for work? Comparative mental health of built
environment undergraduates [Paper presentation] ARCOM 2018: Mental Health, Stress and Wellbeing. Belfast, Northern
Ireland.
https://pdfs.semanticscholar.org/ac8d/1f01536fc92e47e1040a89aa4d79871d2b84.pdf?_ga=2.133271821.2073837584.157
5508720-24918857.1564631929
Smith, B. W., Dalen, J., Wiggins, K., Tooley, E., Christopher, P., & Bernard, J. (2008). The brief resilience scale: Assessing
the ability to bounce back. International Journal of Behavioral Medicine, 15(3), 194-200.
https://doi.org/10.1080/10705500802222972
Stallman, H. M. (2008). Prevalence of psychological distress in university students: Implications for service delivery.
Australian Family Physician, 37(8), 673.
Stallman, H. M. (2010). Psychological distress in university students: A comparison with general population data. Australian
Psychologist, 45(4), 249-257. https://doi.org/10.1080/00050067.2010.482109
Stamp, E., Crust, L., Swann, C., Perry, J., Clough, P., & Marchant, D. (2015). Relationships between mental toughness and
psychological wellbeing in undergraduate students. Personality and Individual Differences, 75, 170-174.
https://doi.org/10.1016/j.paid.2014.11.038
Volume 10 (3) 2019 Van Agteren
13
Steptoe, A., Deaton, A., & Stone, A. A. (2015). Subjective wellbeing, health, and ageing. The Lancet, 385(9968), 640-648.
https://doi.org/10.1016/S0140-6736(13)61489-0
Suldo, S., Thalji, A., & Ferron, J. (2011). Longitudinal academic outcomes predicted by early adolescents’ subjective well-
being, psychopathology, and mental health status yielded from a dual factor model. The Journal of Positive Psychology,
6(1), 17-30. https://doi.org/10.1080/17439760.2010.536774
Suldo, S. M., & Shaffer, E. J. (2008). Looking beyond psychopathology: The dual-factor model of mental health in youth.
School Psychology Review, 37(1), 52-68.
Trompetter, H., Lamers, S., Westerhof, G. J., Fledderus, M., & Bohlmeijer, E. T. (2017). Both positive mental health and
psychopathology should be monitored in psychotherapy: Confirmation for the dual-factor model in acceptance and
commitment therapy. Behaviour Research and Therapy, 91, 58-63. https://doi.org/10.1016/j.brat.2017.01.008
van Agteren, J., Iasiello, M., Lo, L., Bartholomaeus, J., Kopsaftis, Z., Carey, M. E., . . . Kyrios, M. (Submitted).
Psychological interventions to build positive mental health; A systematic review and meta-analysis.
van Erp Taalman Kip, R. M., & Hutschemaekers, G. J. M. (2018). Health, well-being, and psychopathology in a clinical
population: Structure and discriminant validity of Mental Health Continuum Short Form (MHC-SF). Journal of Clinical
Psychology. https://doi.org/10.1002/jclp.22621
Venning, A., Wilson, A., Kettler, L., & Eliott, J. (2013). Mental health among youth in South Australia: A survey of
flourishing, languishing, struggling, and floundering. Australian Psychologist, 48(4), 299-310.
https://doi.org/10.1111/j.1742-9544.2012.00068.x
Windle, G., Bennett, K. M., & Noyes, J. (2011). A methodological review of resilience measurement scales. Health and
Quality of Life Outcomes, 9(1), 8. doi: 10.1186/1477-7525-9-8.
Wood, A. M., & Joseph, S. (2010). The absence of positive psychological (eudemonic) well-being as a risk factor for
depression: A ten year cohort study. Journal of Affective Disorders, 122(3), 213-217.
https://doi.org/10.1016/j.jad.2009.06.032
Wu, H.-p., Garza, E., & Guzman, N. (2015). International student’s challenge and adjustment to college. Education Research
International, 2015. http://dx.doi.org/10.1155/2015/202753
Xiong, J., Qin, Y., Gao, M., & Hai, M. (2017). Longitudinal study of a dual-factor model of mental health in Chinese youth.
School Psychology International, 38(3), 287-303. https://doi.org/10.1177%2F0143034317689970
Yu, L., Shek, D. T., & Zhu, X. (2018). The influence of personal well-being on learning achievement in university students
over time: Mediating or moderating effects of internal and external university engagement. Frontiers in Psychology, 8,
2287. https://doi.org/10.3389/fpsyg.2017.02287
Please cite this article as:
van Agteren, J., Woodyatt, L., Iasiello, M., Rayner, J., Kyrios, M. (2019). Make it measurable: Assessing psychological distress,
wellbeing and resilience at scale in higher education. Student Success, 10(3), 1-13. https://doi.org/10.5204/ssj.v10i3.1411
This article has been peer reviewed and accepted for publication in Student Success. Please see the Editorial Policies under the ‘About’
section of the Journal website for further information.
Student Success: A journal exploring the experiences of students in tertiary education
This work is licensed under a Creative Commons Attribution 4.0 International Licence. As an open access journal, articles are
free to use with proper attribution. ISSN: 2205-0795
Related Documents