Overview of the Governor’s Proposed Overview of the Governor’s Proposed Higher Education Operating and Capital Budgets Staff Presentation to the Senate Ways & Means Committee January 18, 2011 January 18, 2011

Welcome message from author
This document is posted to help you gain knowledge. Please leave a comment to let me know what you think about it! Share it to your friends and learn new things together.
Transcript

Overview of the Governor’s ProposedOverview of the Governor’s ProposedHigher Education
Operating and Capital Budgets
Staff Presentation to the Senate Ways & Means Committee
January 18, 2011January 18, 2011
Today’s Agenday g
• Overview of current higher education budgetsOverview of current higher education budgets• Overview of the Governor’s operating and capital budget proposalscapital budget proposals
• Panel presentations– Council of Presidents– State Board for Community and Technical CollegesHigher Education Coordinating Board– Higher Education Coordinating Board
• Public testimony
2
Operating Budget Overview
3

During the 2009‐11 biennium, a total of $3.4 billion in state funds was appropriated for higher educationstate funds was appropriated for higher education
Community and Technical Colleges
$1.4 Billion$42%
HECB$511 Million
Direct Financial Aid$511 Million
15%
UWWSU
Comprehensives$368 Million
11%
$499 Million10%
UW$652 Million
19%
WSU$424 Million
13%Other
$12 Million2%
4State Funds = Near General Fund State + Federal ARRA + Opportunity Pathways Account + Opportunity Express Account

Higher education represents 10% of the 2009‐11 Near General Fund State budget, but the Near General Fund makes up 33% of the overall higher education budget.
Higher Human Services$11 0 Billion Education
$3.1 Billion10%
$11.0 Billion35%
All O hAll Other(incl. debt service)
$3.5 Billion11%
K‐12 Education$13 4 Billi$13.4 Billion
43%
5

State support, tuition, and financial aid are interconnected levers that drive the higher
education budgets• The three primary funding levers are interconnectedp y g
– State Appropriations– Tuition
Financial Aid– Financial Aid
• Tuition impacts Financial Aid– Practice has been to increase State Need Grant, State Work Study,
Washington Award for Vocational Excellence and Washington Scholars to fully offset impact of tuition increases.
• State Appropriations + Tuitionpp p– Together make up 55% of the overall higher education budget and cover
the core academic functions which include the cost of instruction, state sponsored research and public service activitiesp p
6

Governor’s Operating Budget Proposals
7

Highlights of the Governor’s O i B d P lOperating Budget Proposals
• Decreased appropriations for core academic functions by $502 million$39 illi d t fi i l id i l di i 2 700 f t d t• $39 million decrease to financial aid programs, including serving 2,700 fewer students via State Work Study, reducing the number of students served via Washington Scholars, WAVE, and other conditional loan and scholarship programs
• $50 million shifted from the general fund to the building accounts for maintenance$50 million shifted from the general fund to the building accounts for maintenance activities
• Compensation reductions totaling $126 million• $16 million enhancement for student‐centered initiative$• $2 million enhancement for services to facilitate greater success with low‐income
students• Tuition increases ($330 million):
– 11% per year at UW, WSU, and WWU– 9% per year at TESC, CWU, and EWU– 10% per year at community and technical colleges
• $92 million increase to the State Need Grant to offset tuition increases
8NOTE: Complete list can be found in the Appendix.State Funds = Near General Fund State + Federal ARRA + Opportunity Pathways Account + Opportunity Express Account

After accounting for tuition, state funds at the institutions decreased by 10% during the 2009‐11 biennium for core academic functions. After adjustments the Governor’s 2011‐13 proposal will decrease theseadjustments, the Governor s 2011‐13 proposal will decrease these
budgets by 4%.State Funds + Tuition Reductions(not including compensation)
4%
0%
2009‐11 (incl. 2010 Supplemental, 4.3% ATB, and Special Session) Governor's Proposals
‐10%
‐4%
‐10%
‐5%
20%
‐15%
‐22%‐20%
‐25%
‐20%
9State Funds = Near General Fund State + Federal ARRA + Opportunity Pathways Account + Opportunity Express Account
State Funds State Funds + Tuition

Capital Budget OverviewCapital Budget Overview
10

The 2009‐11 capital budget totaled $3.7 billion, 53% of which are bonds. Higher education
represents 26% of the bonds budget.Total State Bonds = $2.0 Billion,
2009‐11 Biennium
Research
Human Services and General Gov’t Research
$121 Million6%
Comprehensives$133 Million
7%Higher
Ed ti
and General Gov t$565 Million
29%
K 12 7%
Community & Technical Colleges
$254 Million
Education$509 Million
26%
K‐12 Education
$453 Million23%
Natural $254 Million
13%Resources$442 Million
22%
11

Higher education projects are ranked using an evaluation system. Financing is achieved via
three methods.• Evaluation Systemy
– The State Board for Community and Technical Colleges reviews, ranks, and prioritizes projects within specific categories.
– As a result of legislation enacted in the 2009‐11 biennium projects overAs a result of legislation enacted in the 2009 11 biennium, projects over $2 million for four year institutions are reviewed, ranked, and prioritized within specific categories via a panel with final recommendations submitted by the Higher Education Coordinating Board.y g g
• Financing Mechanisms– State bonds – backed by the state and subject to the debt limit
f f ( ) d h b d b k d b h– Certificates of Participation (COPs) and other bonds – not backed by the state or subject to the debt limit; debt is paid via specific revenue sources
– Building accounts – includes a portion of revenue from tuition; managed b hby the institutions
12

During 2009‐11, state bonds made up 52% of the higher education capital budget, with COPs and the building accounts representing 27% and 22%, respectively.
$96 Million $122 Million
$67 Million15%
$142 Million40%
$96 Million27%
$122 Million28%
$121 Million34%
40%
$134 Million72%
$51 Million28% $254 Million
57%
Research$360 Million
Comprehensives$184 Million
Community & Technical Colleges$443 Million
34%
13
State Bonds Certificates of Participation Building Accounts
Governor’s Capital Budget Proposal
14

Highlights of the Governor’s2011 13 C i l B d P l2011‐13 Capital Budget Proposal
• Spends $473 million less in higher education than inSpends $473 million less in higher education than in 2009‐11– $197 million less in bonds
• Priority was given to minor works, renovation and remodel projects
• Generally, no funding was provided for new building construction, predesign, design, and land acquisition
E ti– Exceptions:• House of Knowledge• Centralia Community College Student Services Building
15

Governor’s Proposed List of Capital Projects(Four Year Institutions)(Four Year Institutions)
$ in ThousandsBonds Total
Minor Works $44,129 $142,079
Construction - Design completed in 2009-11 Budget 49,407 49,407EWU - Patterson Hall Remodel Phase 2 38,630 38,630TESC C i ti L b Bld P ti & R ti 10 777 10 777TESC - Communications Lab Bldg Preservation & Renovation 10,777 10,777
Infrastructure 18,011 22,861EWU - Upgrade Campus Water System 7,511 7,511WSU - Pedestrian Bridge Replacement 2,500 2,500UW - High Voltage Infrastructure Improvement 0 4,850CWU Combined Utilities 8 000 8 000CWU - Combined Utilities 8,000 8,000
Growth 0 2,700UW - House of Knowledge 0 2,700
Renovation 55,130 59,929WWU - Classroom and Lab Upgrades 0 4,799pg ,WWU - Fraser Hall Renovation 4,480 4,480TESC - Science Lab 2nd Floor Modernization 4,950 4,950WSU - Fulmer Hall Partial Renovation 8,200 8,200UW - Odegaard Library Renovation 19,500 19,500WSU - Design Disciplines Facility 18,000 18,000
$166 677 $276 976
16NOTE: Complete list can be found in the Appendix.
$166,677 $276,976

Governor’s Proposed List of Capital Projects(Community and Technical Colleges)(Community and Technical Colleges)
$ in ThousandsBonds Total
Minor Works $0 $85,472
Renovation 42,699 42,699
Green River - Science, Math & Technology Bldg 21,838 21,838North Seattle - Technology Building Renewal 20,861 20,861
Replacement 102 228 108 966Replacement 102,228 108,966
Everett - Index Hall Replacement 37,633 37,633Skagit Valley - Academic and Student Services Building 29,494 29,494Lower Columbia - Health and Science Building 35,101 37,701Centralia Student Services Building Desing 0 4 138Centralia - Student Services Building Desing 0 4,138
TOTAL $144,927 $237,137
17NOTE: Complete list can be found in the Appendix.

Some policy questions to consider h ki di d i iwhen making spending decisions
Operating Budget:• Should tuition be increased and, if so, by how much?• Should the policy of holding certain financial aid programs
harmless to tuition increases continue?harmless to tuition increases continue?• Should core academic functions be reduced beyond the level
replaced by tuition?p y• Should financial aid programs be reduced?• Should specific performance targets be incorporated?Capital Budget:• How should capital budget funding decisions be prioritized?
Sh ld i b f d i j b f d d• Should a certain number of design projects be funded to prepare for new construction in the 2013‐15 biennium?
18
AppendixAppendix
19
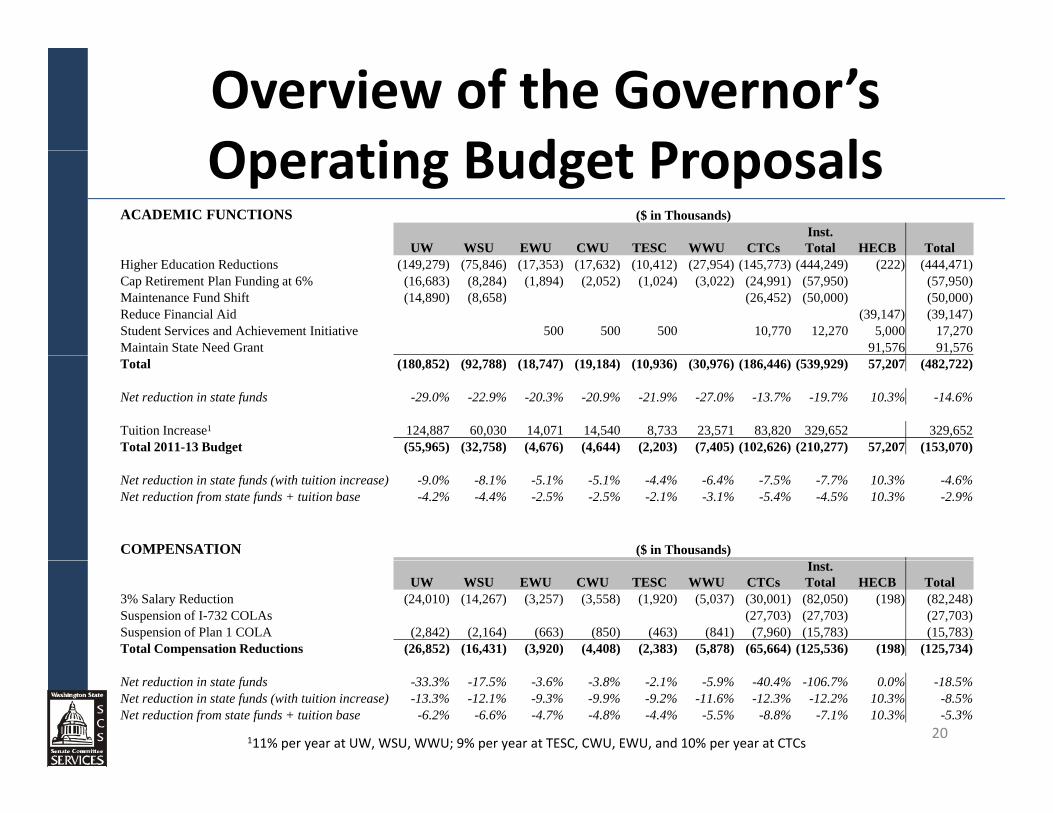
Overview of the Governor’s Operatin B d et ProposalsOperating Budget Proposals
ACADEMIC FUNCTIONS ($ in Thousands)
UW WSU EWU CWU TESC WWU CTCsInst. Total HECB Total
Higher Education Reductions (149,279) (75,846) (17,353) (17,632) (10,412) (27,954) (145,773) (444,249) (222) (444,471)Cap Retirement Plan Funding at 6% (16,683) (8,284) (1,894) (2,052) (1,024) (3,022) (24,991) (57,950) (57,950)Maintenance Fund Shift (14,890) (8,658) (26,452) (50,000) (50,000)Reduce Financial Aid (39,147) (39,147)Student Services and Achievement Initiative 500 500 500 10,770 12,270 5,000 17,270 Maintain State Need Grant 91,576 91,576 Total (180,852) (92,788) (18,747) (19,184) (10,936) (30,976) (186,446) (539,929) 57,207 (482,722)
Net reduction in state funds -29.0% -22.9% -20.3% -20.9% -21.9% -27.0% -13.7% -19.7% 10.3% -14.6%
Tuition Increase1 124,887 60,030 14,071 14,540 8,733 23,571 83,820 329,652 329,652 Total 2011-13 Budget (55,965) (32,758) (4,676) (4,644) (2,203) (7,405) (102,626) (210,277) 57,207 (153,070)
Net reduction in state funds (with tuition increase) -9.0% -8.1% -5.1% -5.1% -4.4% -6.4% -7.5% -7.7% 10.3% -4.6%Net reduction from state funds + tuition base -4.2% -4.4% -2.5% -2.5% -2.1% -3.1% -5.4% -4.5% 10.3% -2.9%
COMPENSATION ($ in Thousands)
UW WSU EWU CWU TESC WWU CTCsInst. Total HECB Total
3% Salary Reduction (24,010) (14,267) (3,257) (3,558) (1,920) (5,037) (30,001) (82,050) (198) (82,248)Suspension of I-732 COLAs (27,703) (27,703) (27,703)Suspension of Plan 1 COLA (2,842) (2,164) (663) (850) (463) (841) (7,960) (15,783) (15,783)Total Compensation Reductions (26,852) (16,431) (3,920) (4,408) (2,383) (5,878) (65,664) (125,536) (198) (125,734)
20111% per year at UW, WSU, WWU; 9% per year at TESC, CWU, EWU, and 10% per year at CTCs
Net reduction in state funds -33.3% -17.5% -3.6% -3.8% -2.1% -5.9% -40.4% -106.7% 0.0% -18.5%Net reduction in state funds (with tuition increase) -13.3% -12.1% -9.3% -9.9% -9.2% -11.6% -12.3% -12.2% 10.3% -8.5%Net reduction from state funds + tuition base -6.2% -6.6% -4.7% -4.8% -4.4% -5.5% -8.8% -7.1% 10.3% -5.3%
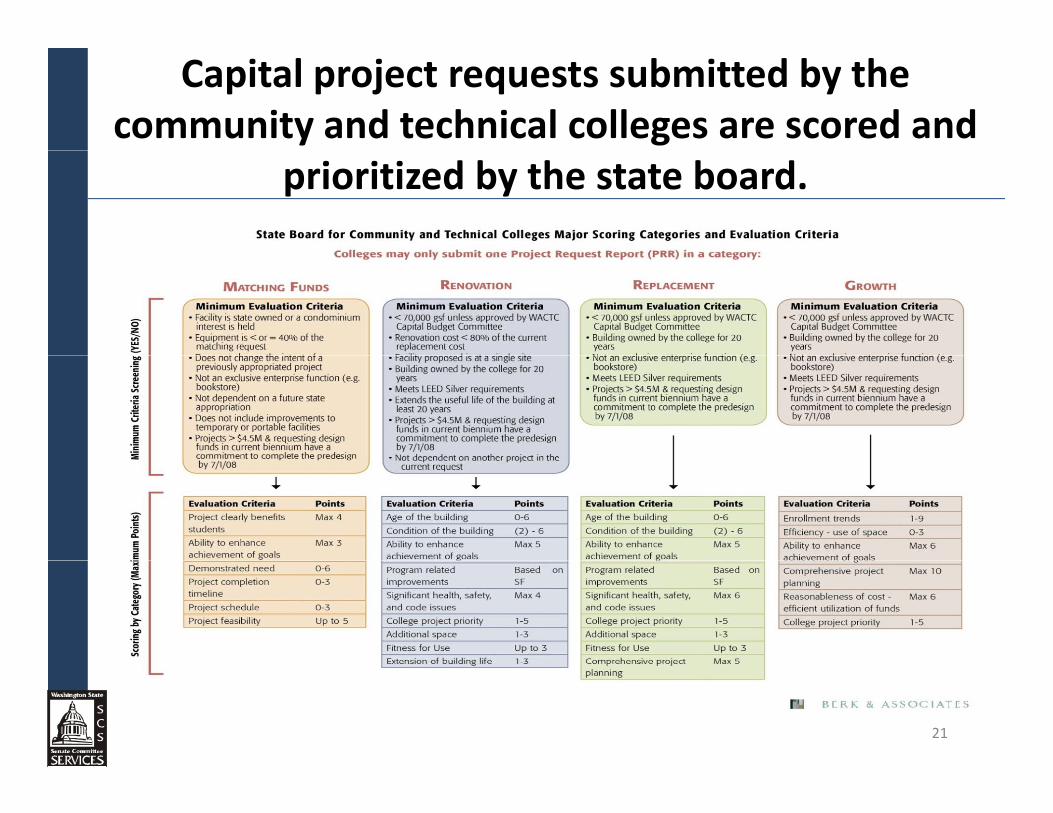
Capital project requests submitted by the community and technical colleges are scored and
prioritized by the state board.
21
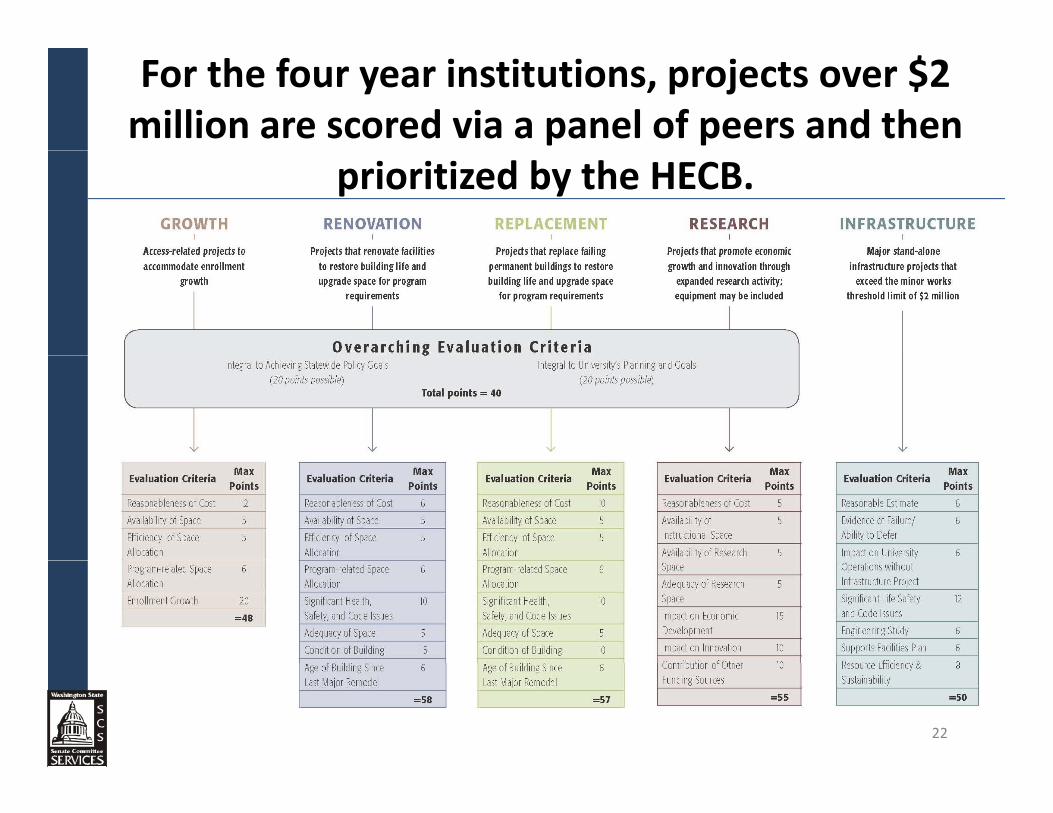
For the four year institutions, projects over $2 million are scored via a panel of peers and then
prioritized by the HECB.
22
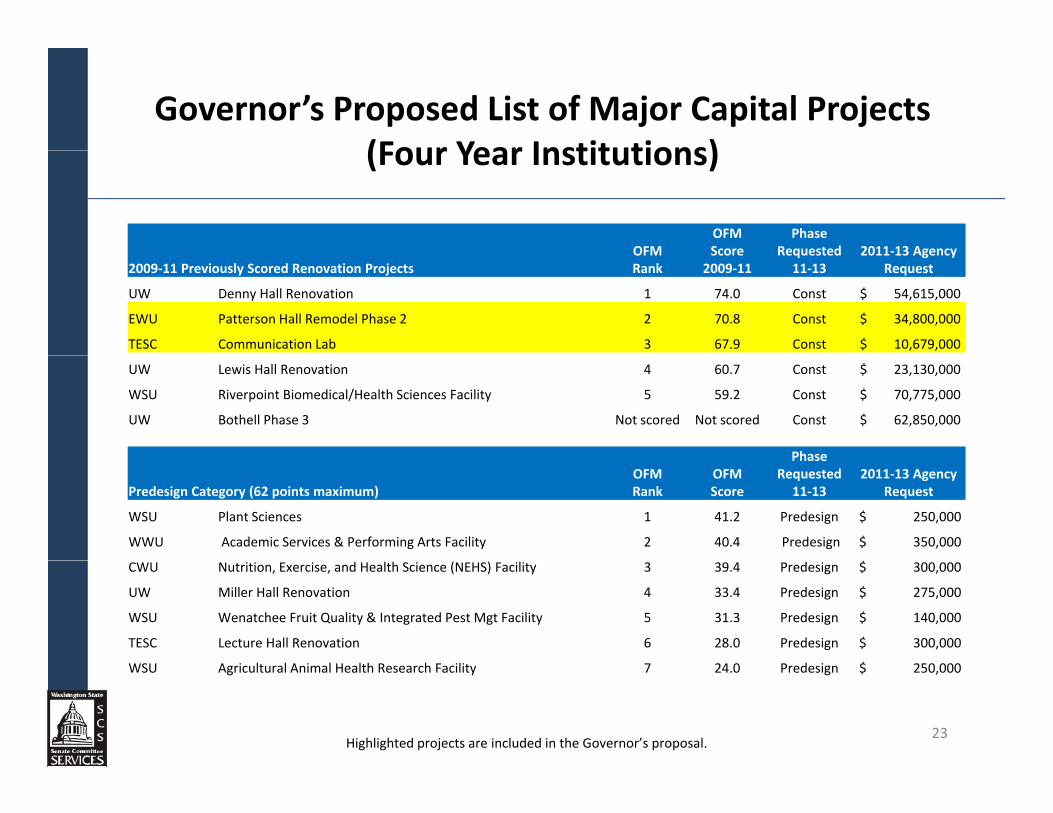
Governor’s Proposed List of Major Capital Projects(Four Year Institutions)(Four Year Institutions)
OFMOFMScore
Phase Requested 2011‐13 Agency
2009‐11 Previously Scored Renovation Projects OFMRank
Score2009‐11
Requested 11‐13
2011 13 Agency Request
UW Denny Hall Renovation 1 74.0 Const $ 54,615,000
EWU Patterson Hall Remodel Phase 2 2 70.8 Const $ 34,800,000
TESC Communication Lab 3 67.9 Const $ 10,679,000
UW Lewis Hall Renovation 4 60.7 Const $ 23,130,000
WSU Riverpoint Biomedical/Health Sciences Facility 5 59.2 Const $ 70,775,000
UW Bothell Phase 3 Not scored Not scored Const $ 62,850,000
Phase
Predesign Category (62 points maximum)OFMRank
OFMScore
Phase Requested
11‐132011‐13 Agency
Request
WSU Plant Sciences 1 41.2 Predesign $ 250,000
WWU Academic Services & Performing Arts Facility 2 40.4 Predesign $ 350,000
CWU Nutrition, Exercise, and Health Science (NEHS) Facility 3 39.4 Predesign $ 300,000
UW Miller Hall Renovation 4 33.4 Predesign $ 275,000
WSU Wenatchee Fruit Quality & Integrated Pest Mgt Facility 5 31.3 Predesign $ 140,000
TESC Lecture Hall Renovation 6 28.0 Predesign $ 300,000
l l l l h h l d $
23
WSU Agricultural Animal Health Research Facility 7 24.0 Predesign $ 250,000
Highlighted projects are included in the Governor’s proposal.

Governor’s Proposed List of Major Capital Projects(Four Year Institutions)(Four Year Institutions)
Phase
Infrastructure Category (58 points maximum)OFMRank
OFMScore
Phase Requested
11‐132011‐13 Agency
Request
EWU Infrastructure ‐ Upgrade Campus Water System 1 43.0 P‐C $ 7,511,000
WSU Infrastructure ‐ Bridge Replacement 2 42.6 D‐C $ 2,500,000
UW High Voltage Infrastructure Improvement Project 3 41.8 D‐C $ 4,850,000
CWU Combined Utilities 4 41.0 P‐C $ 8,000,000
CWU Biomass CHP 5 36.2 D‐C $ 8,000,000
WWU North Campus Utility Upgrade 6 28.6 D‐C $ 3,529,000
WWU Performing Arts Exterior Renewal 7 28.4 D‐C $ 2,877,000
TESC Alternative Energy Project (aka Campus‐Wide Alternative Energy) 8 28.1 D‐C $ 10,000,000
WWU Wireless Network Upgrade 9 21.0 D‐C $ 4,947,000
Growth Category (90 points maximum)OFMRank
OFMScore
Phase Requested
11‐132011‐13 Agency
RequestCWU Science Phase II $
24
CWU Science Phase II 1 66.9 Design $ 3,500,000
UW House of Knowledge 2 42.9 D‐C $ 2,700,000
Highlighted projects are included in the Governor’s proposal.

Governor’s Proposed List of Major Capital Projects(Four Year Institutions)(Four Year Institutions)
OFM OFMPhase
Requested 2011‐13 AgencyRenovation Category (101 points maximum)
OFMRank
OFMScore
Requested 11‐13
2011‐13 Agency Request
WWU Carver Academic Renovation 1 73.1 Design $ 6,784,000 WWU Classroom & Lab Upgrades 2 68.4 D‐C $ 4,799,000 WWU Fraser Hall Renovation 3 67.7 D‐C $ 4,480,000 UW Anderson Hall Renovation 4 60.2 Design $ 2,500,000 g , ,
CWUSamuelson Union Building 5 59.2 D‐C $ 35,821,000
TESC Science Lab 1 Modernization (2nd Flr) 6 58.3 D‐C $ 4,950,000 WSU Fulmer Hall Partial Renovation 7 56.7 D‐C $ 8,200,000
d d b $UW Odegard Library Renovation 8 55.1 D‐C $ 19,500,000 WSU Troy Hall Renovation 9 50.6 Design $ 1,800,000 CWU Business Continuity and Disaster Recover Data Center 10 48.4 P‐C $ 3,041,000
WSU Design Disciplines Facility 11 47.8 D‐C $ 18,000,000 UW Burke Museum Renovation 12 45 5 Design $ 5 000 000UW Burke Museum Renovation 12 45.5 Design $ 5,000,000 CWU Brooks Library Renovation 13 44.0 D‐C $ 4,900,000 WSU Washington Building 3rd Floor Renovation 14 42.1 D‐C $ 4,390,000 WSU Vancouver Library 2nd Floor Conversion 15 42.0 D‐C $ 4,600,000 WSU Riverpoint S. Campus Facility Ph 2 16 41.2 D‐C $ 4,075,000 CWU Health Center Remodel 17 39 5 D‐C $ 4 900 000
25
CWU Health Center Remodel 17 39.5 D C $ 4,900,000 CWU Psychology Renovation 18 34.2 D‐C $ 4,900,000 CWU Randall Michaelson Remodel 19 33.8 D‐C $ 4,900,000
Highlighted projects are included in the Governor’s proposal.
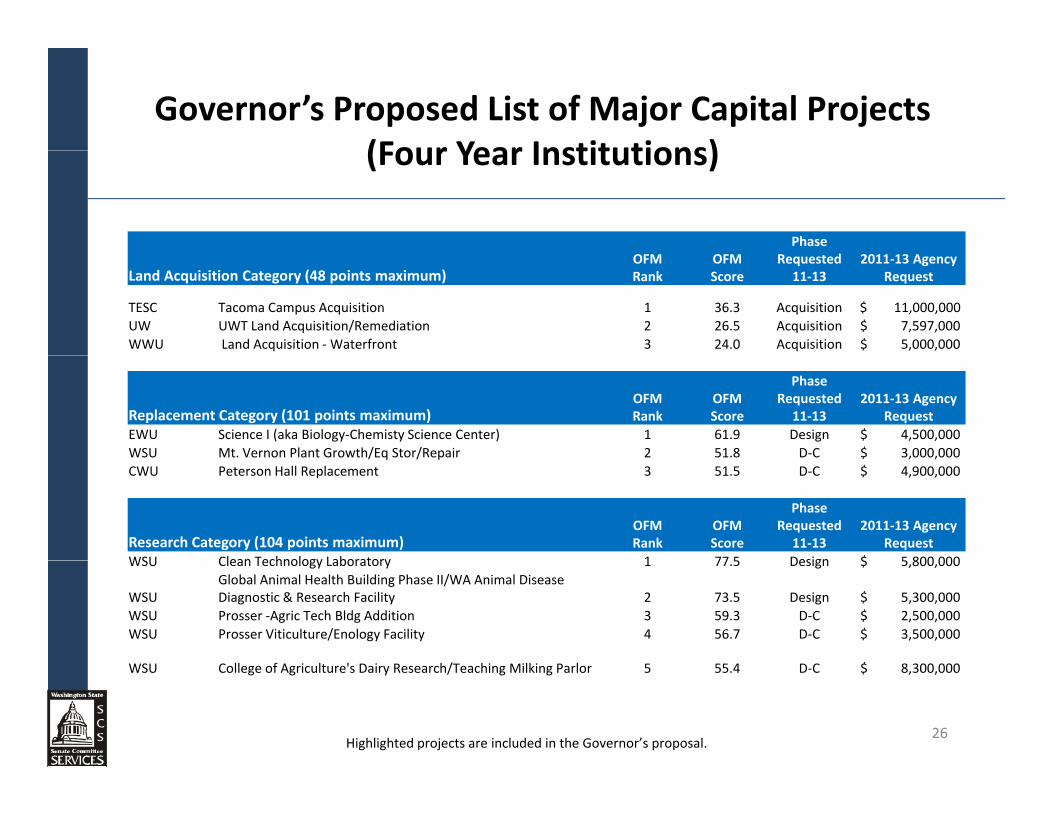
Governor’s Proposed List of Major Capital Projects(Four Year Institutions)(Four Year Institutions)
Phase
Land Acquisition Category (48 points maximum)OFMRank
OFMScore
Requested 11‐13
2011‐13 Agency Request
TESC Tacoma Campus Acquisition 1 36.3 Acquisition $ 11,000,000 UW UWT Land Acquisition/Remediation 2 26.5 Acquisition $ 7,597,000 WWU Land Acquisition ‐Waterfront 3 24.0 Acquisition $ 5,000,000
Replacement Category (101 points maximum)OFMRank
OFMScore
Phase Requested
11‐132011‐13 Agency
RequestEWU Science I (aka Biology‐Chemisty Science Center) 1 61.9 Design $ 4,500,000 WSU Mt. Vernon Plant Growth/Eq Stor/Repair 2 51.8 D‐C $ 3,000,000 / q / p $ , ,CWU Peterson Hall Replacement 3 51.5 D‐C $ 4,900,000
Research Category (104 points maximum)OFMRank
OFMScore
Phase Requested
11‐132011‐13 Agency
RequestWSU Clean Technology Laboratory 1 77 5 Design $ 5 800 000WSU Clean Technology Laboratory 1 77.5 Design $ 5,800,000
WSUGlobal Animal Health Building Phase II/WA Animal Disease Diagnostic & Research Facility 2 73.5 Design $ 5,300,000
WSU Prosser ‐Agric Tech Bldg Addition 3 59.3 D‐C $ 2,500,000 WSU Prosser Viticulture/Enology Facility 4 56.7 D‐C $ 3,500,000
ll f l ' h/ h lk l $
26
WSU College of Agriculture's Dairy Research/Teaching Milking Parlor 5 55.4 D‐C $ 8,300,000
Highlighted projects are included in the Governor’s proposal.

Governor’s Proposed List of Capital Projects(Community and Technical Colleges)(Community and Technical Colleges)
Priority Type Category College Project Requested1 Minor Works ‐ Preservation Statewide Statewide Emergency Repairs and Improvements 16,000,000 2 Roof Repairs "A" Statewide Statewide Roof Repairs 9 125 2912 Roof Repairs A Statewide Statewide Roof Repairs 9,125,291 3 Facility Repairs "A" Statewide Statewide Facility Repairs 15,828,821 4 Site Repairs "A" Statewide Statewide Site Repairs 5,045,888 5 Matching Fund Projects Matching Fund Projects Peninsula Fort Worden Education Center 2,000,000 6 Matching Fund Projects Matching Fund Projects Spokane Falls Stadium and Athletic Fields 758,000 7 Matching Fund Projects Matching Fund Projects Lower Columbia Myklebust Gymnasium 2,000,000 8 Minor Works ‐ Program Statewide Statewide Minor Program Improvements 20,000,000 9 M j P j t C t ti G th S k F ll C Cl 20 761 0009 Major Project ‐ Construction Growth Spokane Falls Campus Classrooms 20,761,000 10 Major Project ‐ Construction Growth South Puget Sound Learning Resource Center 35,525,411 11 Major Project ‐ Construction Growth Clover Park Allied Health Care Facility 24,360,000 12 Major Project ‐ Construction Replacement Everett Index Hall Replacement 37,633,000 13 Major Project ‐ Construction Renovation Green River Science Math and Technology Buildimg 21,838,000 14 Major Project ‐ Construction Replacement Skagit Valley Academic and Student Services Building 29,494,000 15 Major Project ‐ Construction Replacement Lower Columbia Health and Science Building 37,701,000 16 Major Project ‐ Design Replacement Olympic College Instruction Center 3,369,203 17 Major Project ‐ Construction Renovation North Seattle Technology Building Renewal 20,861,000 18 Major Project ‐ Construction Growth Tacoma Health Careers Center 38,819,000 19 Major Project ‐ Design Replacement Centralia Student Services 4,138,456 20 Major Project ‐ Construction Growth Bellevue Health Science Building 37,948,757 21 Major Project ‐ Design Growth Columbia Basin Social Science Center 1,106,359 22 Major Project ‐ Design Replacement Peninsula Allied Health and Early Childhood Dev Center 1,696,496 23 Major Project ‐ Construction Replacement Grays Harbor Science and Math Building 43,614,000 24 Major Project ‐ Design Replacement South Seattle Cascade Court 2,303,853 25 Major Project ‐ Design Renovation Renton Automotive Complex Renovation 1,770,611 26 Major Project ‐ Design Growth Edmonds Science Engineering Technology Bldg 8,375,751 27 Major Project ‐ Construction Replacement Seattle Central Seattle Maritime Academy 16,923,000 28 Major Project ‐ Construction Replacement Yakima Valley Palmer Martin Building 20,589,000 29 Major Project ‐ Construction Replacement Green River Trades and Industry Building 29,989,616
27
j j p y g , ,30 Major Project ‐ Design Growth Whatcom Learning Commons 1,622,763 31 Major Project ‐ Construction Growth Bates Mohler Communications Technology Center 22,325,000 32 Major Project ‐ Construction Growth Clark Health and Advanced Technologies Building 38,828,000
Highlighted projects are included in the Governor’s proposal.
Related Documents