High-temperature laser absorption diagnostics for CH 2 O and CH 3 CHO and their application to shock tube kinetic studies Shengkai Wang, David F. Davidson ⇑ , Ronald K. Hanson High Temperature Gasdynamics Laboratory, Mechanical Engineering Department, Stanford University, Stanford, CA, United States article info Article history: Received 28 February 2013 Received in revised form 3 May 2013 Accepted 3 May 2013 Available online 23 May 2013 Keywords: Laser absorption Shock tube Formaldehyde Acetaldehyde abstract Laser absorption diagnostic methods were developed for the quantitative measurement of formaldehyde (CH 2 O) and acetaldehyde (CH 3 CHO) at high temperatures in shock tube kinetic studies. Investigation of the high-temperature CH 2 O spectrum has shown that the optimal wavelength for CH 2 O detection using commercially available lasers is near 2896 cm 1 . By exploiting the structural difference between the absorption spectra of CH 2 O and that of broadband interfering species, a two-color (2895.92 cm 1 and 2895.60 cm 1 ) interference-free detection scheme for CH 2 O sensing in a combustion environment was developed. A third color (32601.10 cm 1 ) has also been added to develop a UV/IR detection scheme for combined CH 3 CHO/CH 2 O measurements. To implement these schemes, aldehyde cross-sections at all three colors were measured behind reflected shock waves over a wide span of temperatures (600– 1800 K) and pressures (0.8–3.6 atm), with an uncertainty of ±5%, and the diagnostic schemes were vali- dated using two controlled experiments with well-established chemistry. Applications of these diagnos- tics were also demonstrated in shock tube pyrolysis experiments of 1,3,5-trioxane, CH 2 O and CH 3 CHO. The unimolecular decomposition rate of 1,3,5-trioxane was determined over 869–1037 K at an average pressure of 2.1 atm: k I = 3.58 10 12 exp (18,590 K/T) s 1 , with an overall uncertainty of less than 20%. Ó 2013 The Combustion Institute. Published by Elsevier Inc. All rights reserved. 1. Introduction Aldehydes are important intermediate products in the oxida- tion of hydrocarbons [1]. They lie on the primary oxidation path- way of alkanes [2,3], form rapidly during the pre-ignition phase of hydrocarbon oxidation [4], and are key species of cool flame reactions [5,6]. Aldehydes are also benchmark species in engine design and testing [7]. They are primary targets of emissions con- trol, and high levels of aldehydes in the exhaust can be a warning of abnormal reaction quenching. In many hydrocarbon combustion processes, the two major aldehydes formed are formaldehyde (CH 2 O) and acetaldehyde (CH 3 CHO). Accurate quantitative diag- nostics for the two species are needed to advance combustion kinetics studies and engine design. So far, common methods to measure aldehydes in low-temper- ature kinetic experiments have involved mass spectroscopy (MS) [8] and gas chromatography (GC) [9]. Despite their success in kinetics model development, these methods usually require the reaction to be quenched before sampling and therefore are not suitable for time-resolved in situ species history measurements. Laser-induced fluorescence (LIF) has also been demonstrated for time- and space-resolved formaldehyde measurements in engine environments [10–12], but typically requires a calibration experi- ment with formaldehyde seeding and can suffer from broadband interference emission from hydrocarbons. On the other hand, laser absorption spectroscopy is an in situ, time-resolved, and poten- tially interference-free method for species time history measure- ment [13], and is a promising technique for aldehyde detection. There have been several studies of quantitative absorption detection of formaldehyde in shock tubes, using 174 nm UV- absorption [14,15] and 3.39 lm IR-absorption [16,17]. Recent ad- vance in mid-IR lasers [18–20] has enabled access to much stronger transitions of CH 2 O near 3.6 lm, and has spurred the development of several novel room temperature sensors for CH 2 O [21,22]. While there are multiple candidate wavelengths for formaldehyde detec- tion, this work focuses on finding the best way to measure formal- dehyde in high-temperature shock tube kinetics experiments. Using the latest spectroscopic database from Perrin et al. [23] and Jacquemart et al. [24], we have identified, within the capability of current commercially available lasers, the optimal wavelength for CH 2 O detection at combustion conditions. A two-color IR CH 2 O detection scheme has also been developed, which eliminates broad- band interference absorption when it is present. In the case of acet- aldehyde, fewer studies have been done using absorption diagnostics. Cook et al. [25] have measured the overall absorption of CH 2 O and CH 3 CHO during n-butanol pyrolysis at 306.8 nm, a few wavenumbers away from the A–X(0, 0) R 1 (5) OH transition. 0010-2180/$ - see front matter Ó 2013 The Combustion Institute. Published by Elsevier Inc. All rights reserved. http://dx.doi.org/10.1016/j.combustflame.2013.05.004 ⇑ Corresponding author. E-mail address: [email protected] (D.F. Davidson). Combustion and Flame 160 (2013) 1930–1938 Contents lists available at SciVerse ScienceDirect Combustion and Flame journal homepage: www.elsevier.com/locate/combustflame

Welcome message from author
This document is posted to help you gain knowledge. Please leave a comment to let me know what you think about it! Share it to your friends and learn new things together.
Transcript
Combustion and Flame 160 (2013) 1930–1938
Contents lists available at SciVerse ScienceDirect
Combustion and Flame
journal homepage: www.elsevier .com/locate /combustflame
High-temperature laser absorption diagnostics for CH2O and CH3CHOand their application to shock tube kinetic studies
0010-2180/$ - see front matter � 2013 The Combustion Institute. Published by Elsevier Inc. All rights reserved.http://dx.doi.org/10.1016/j.combustflame.2013.05.004
⇑ Corresponding author.E-mail address: [email protected] (D.F. Davidson).
Shengkai Wang, David F. Davidson ⇑, Ronald K. HansonHigh Temperature Gasdynamics Laboratory, Mechanical Engineering Department, Stanford University, Stanford, CA, United States
a r t i c l e i n f o a b s t r a c t
Article history:Received 28 February 2013Received in revised form 3 May 2013Accepted 3 May 2013Available online 23 May 2013
Keywords:Laser absorptionShock tubeFormaldehydeAcetaldehyde
Laser absorption diagnostic methods were developed for the quantitative measurement of formaldehyde(CH2O) and acetaldehyde (CH3CHO) at high temperatures in shock tube kinetic studies. Investigation ofthe high-temperature CH2O spectrum has shown that the optimal wavelength for CH2O detection usingcommercially available lasers is near 2896 cm�1. By exploiting the structural difference between theabsorption spectra of CH2O and that of broadband interfering species, a two-color (2895.92 cm�1 and2895.60 cm�1) interference-free detection scheme for CH2O sensing in a combustion environment wasdeveloped. A third color (32601.10 cm�1) has also been added to develop a UV/IR detection scheme forcombined CH3CHO/CH2O measurements. To implement these schemes, aldehyde cross-sections at allthree colors were measured behind reflected shock waves over a wide span of temperatures (600–1800 K) and pressures (0.8–3.6 atm), with an uncertainty of ±5%, and the diagnostic schemes were vali-dated using two controlled experiments with well-established chemistry. Applications of these diagnos-tics were also demonstrated in shock tube pyrolysis experiments of 1,3,5-trioxane, CH2O and CH3CHO.The unimolecular decomposition rate of 1,3,5-trioxane was determined over 869–1037 K at an averagepressure of 2.1 atm: kI = 3.58 � 1012 exp (�18,590 K/T) s�1, with an overall uncertainty of less than 20%.
� 2013 The Combustion Institute. Published by Elsevier Inc. All rights reserved.
1. Introduction
Aldehydes are important intermediate products in the oxida-tion of hydrocarbons [1]. They lie on the primary oxidation path-way of alkanes [2,3], form rapidly during the pre-ignition phaseof hydrocarbon oxidation [4], and are key species of cool flamereactions [5,6]. Aldehydes are also benchmark species in enginedesign and testing [7]. They are primary targets of emissions con-trol, and high levels of aldehydes in the exhaust can be a warningof abnormal reaction quenching. In many hydrocarbon combustionprocesses, the two major aldehydes formed are formaldehyde(CH2O) and acetaldehyde (CH3CHO). Accurate quantitative diag-nostics for the two species are needed to advance combustionkinetics studies and engine design.
So far, common methods to measure aldehydes in low-temper-ature kinetic experiments have involved mass spectroscopy (MS)[8] and gas chromatography (GC) [9]. Despite their success inkinetics model development, these methods usually require thereaction to be quenched before sampling and therefore are notsuitable for time-resolved in situ species history measurements.Laser-induced fluorescence (LIF) has also been demonstrated fortime- and space-resolved formaldehyde measurements in engine
environments [10–12], but typically requires a calibration experi-ment with formaldehyde seeding and can suffer from broadbandinterference emission from hydrocarbons. On the other hand, laserabsorption spectroscopy is an in situ, time-resolved, and poten-tially interference-free method for species time history measure-ment [13], and is a promising technique for aldehyde detection.
There have been several studies of quantitative absorptiondetection of formaldehyde in shock tubes, using 174 nm UV-absorption [14,15] and 3.39 lm IR-absorption [16,17]. Recent ad-vance in mid-IR lasers [18–20] has enabled access to much strongertransitions of CH2O near 3.6 lm, and has spurred the developmentof several novel room temperature sensors for CH2O [21,22]. Whilethere are multiple candidate wavelengths for formaldehyde detec-tion, this work focuses on finding the best way to measure formal-dehyde in high-temperature shock tube kinetics experiments.Using the latest spectroscopic database from Perrin et al. [23] andJacquemart et al. [24], we have identified, within the capability ofcurrent commercially available lasers, the optimal wavelength forCH2O detection at combustion conditions. A two-color IR CH2Odetection scheme has also been developed, which eliminates broad-band interference absorption when it is present. In the case of acet-aldehyde, fewer studies have been done using absorptiondiagnostics. Cook et al. [25] have measured the overall absorptionof CH2O and CH3CHO during n-butanol pyrolysis at 306.8 nm, afew wavenumbers away from the A–X(0,0) R1(5) OH transition.
S. Wang et al. / Combustion and Flame 160 (2013) 1930–1938 1931
The current work revisits Cook’s method and extends the aldehydescross-section measurement to a wider temperature range. Used inconjunction with the interference-free CH2O diagnostic, we havealso established a three-color combined UV/IR scheme for simulta-neous CH2O and CH3CHO detection. The method can easily be ex-tended to a four-color aldehydes/OH diagnostic for systems whereOH may also be present.
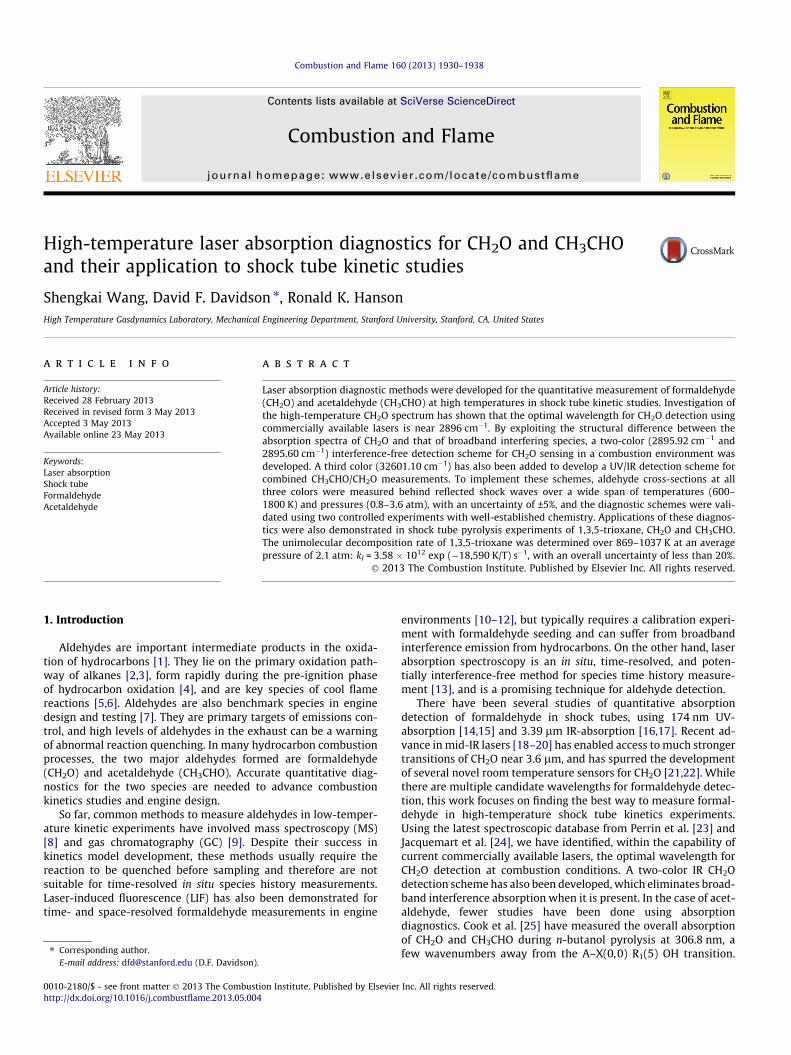
Fig. 2. Absorption line-strengths of CH2O, H2O, CO and CO2 at 1200 K, calculatedusing HITRAN 2008 [31].
2. Wavelength selection
2.1. IR wavelengths for CH2O detection
The ultimate goal of wavelength selection is to find a wave-length where (1) the sensitivity of the target species is maximized,and (2) the interfering absorption from other species is minimized.To achieve this goal, quantitative CH2O absorption spectra in theUV and IR are needed. However, although various studies havebeen reported on room-temperature CH2O absorption spectra[26–30], quantitative measurements at high temperatures arequite limited. An estimate of the high-temperature spectra canbe obtained through spectroscopic simulations using a line-by-linetransition database.
The latest version of the HITRAN database (HITRAN 2008 [31])fits this purpose well, as it has incorporated the recent updateson CH2O line intensities from Perrin et al. [23]. In our calculation,the line-broadening coefficients are also updated with the new val-ues from Jacquemart et al. [24]. Absorption spectra of major poten-tial interfering species (H2O, CO, CO2 and CH4) are also calculatedusing HITRAN 2008.
Figure 1 shows the IR absorption spectra of CH2O at 296 K andat 1200 K. The whole IR spectrum of CH2O can be divided into tworegions. The 3.6 lm region is the location of the strongest infraredbands of formaldehyde [23], namely the m1 (centered around2782 cm�1) and m5 (centered around 2844 cm�1) bands togetherwith several weaker overtones or combination dark bands, and isaccessible with difference-frequency-generation (DFG) lasers. The5.7 lm region is the location of the m2 band centered at1746 cm�1, which is accessible with quantum cascade lasers (QCL).
Although the 5.7 lm region may seem attractive for CH2Odetection due to its stronger peak absorption feature, comparisonwith potential interferers (Fig. 2) has suggested that this band
Fig. 1. IR absorption spectra of CH2O, calculated using data from Perrin et al. [23]and Jaquemart et al. [24]. Blue: 1200 K, 1 atm; gray: 298 K, 1 atm (scaled by 50% forcomparison). Also shown are the tuning ranges of lasers that currently arecommercially available. (For interpretation of the references to color in this figurelegend, the reader is referred to the web version of this article.)
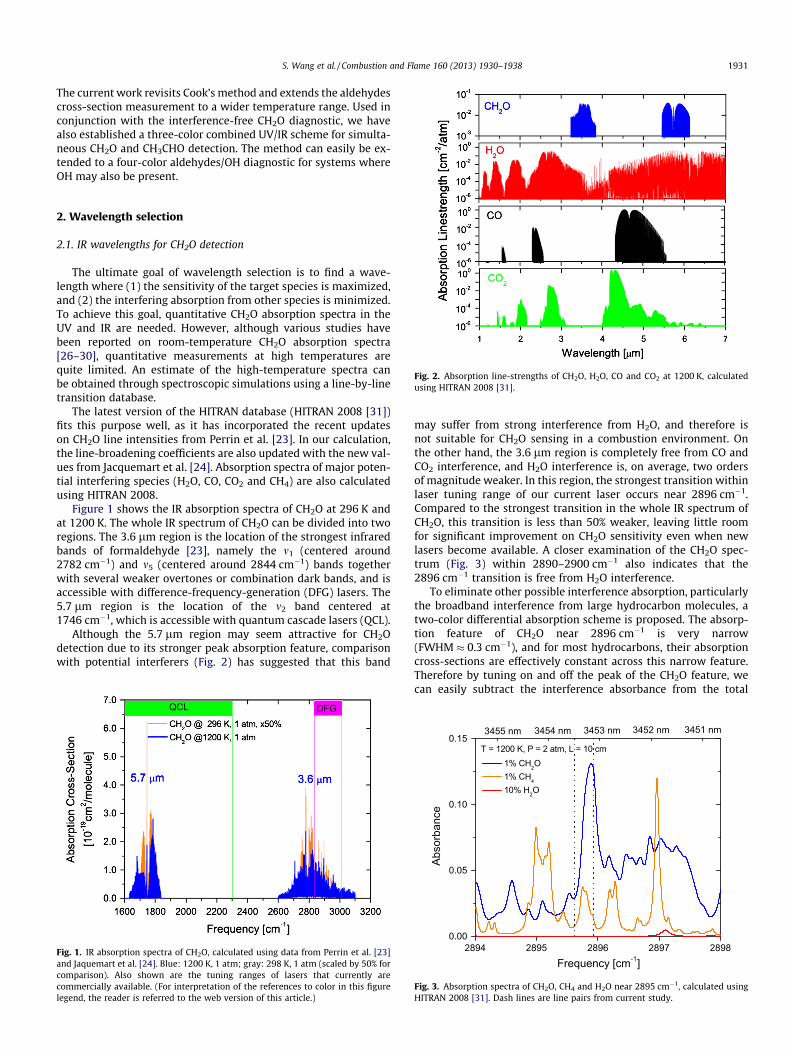
may suffer from strong interference from H2O, and therefore isnot suitable for CH2O sensing in a combustion environment. Onthe other hand, the 3.6 lm region is completely free from CO andCO2 interference, and H2O interference is, on average, two ordersof magnitude weaker. In this region, the strongest transition withinlaser tuning range of our current laser occurs near 2896 cm�1.Compared to the strongest transition in the whole IR spectrum ofCH2O, this transition is less than 50% weaker, leaving little roomfor significant improvement on CH2O sensitivity even when newlasers become available. A closer examination of the CH2O spec-trum (Fig. 3) within 2890–2900 cm�1 also indicates that the2896 cm�1 transition is free from H2O interference.
To eliminate other possible interference absorption, particularlythe broadband interference from large hydrocarbon molecules, atwo-color differential absorption scheme is proposed. The absorp-tion feature of CH2O near 2896 cm�1 is very narrow(FWHM � 0.3 cm�1), and for most hydrocarbons, their absorptioncross-sections are effectively constant across this narrow feature.Therefore by tuning on and off the peak of the CH2O feature, wecan easily subtract the interference absorbance from the total
Fig. 3. Absorption spectra of CH2O, CH4 and H2O near 2895 cm�1, calculated usingHITRAN 2008 [31]. Dash lines are line pairs from current study.
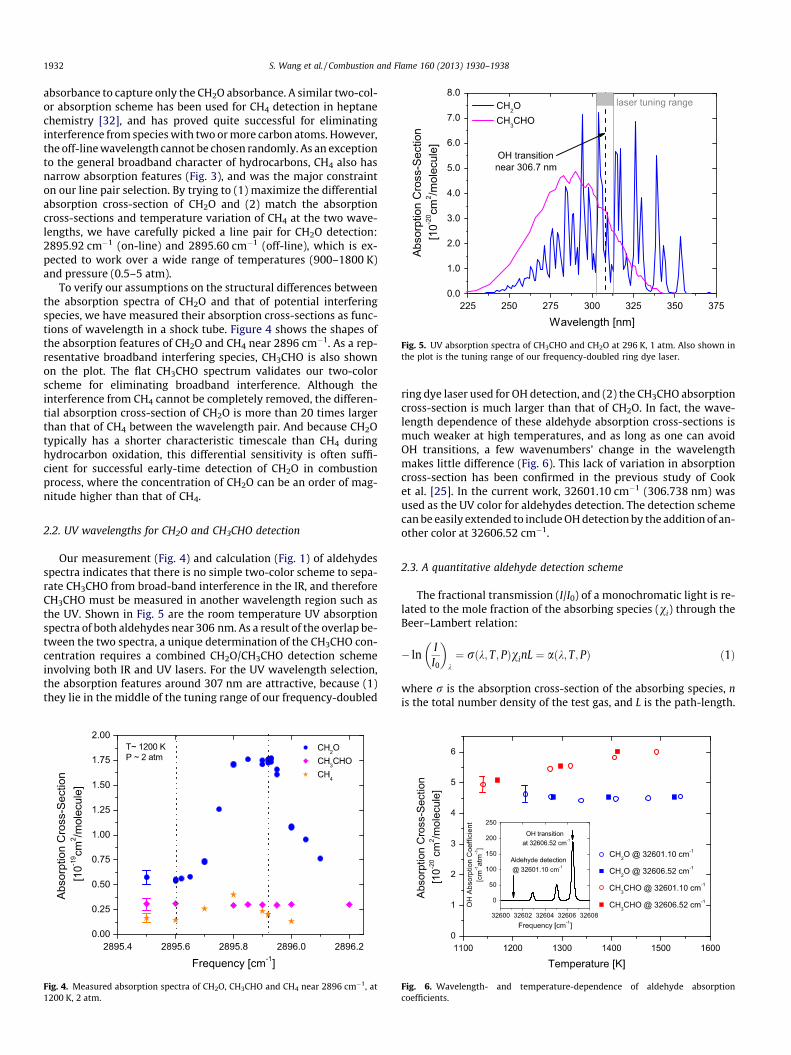
Fig. 5. UV absorption spectra of CH3CHO and CH2O at 296 K, 1 atm. Also shown inthe plot is the tuning range of our frequency-doubled ring dye laser.
1932 S. Wang et al. / Combustion and Flame 160 (2013) 1930–1938
absorbance to capture only the CH2O absorbance. A similar two-col-or absorption scheme has been used for CH4 detection in heptanechemistry [32], and has proved quite successful for eliminatinginterference from species with two or more carbon atoms. However,the off-line wavelength cannot be chosen randomly. As an exceptionto the general broadband character of hydrocarbons, CH4 also hasnarrow absorption features (Fig. 3), and was the major constrainton our line pair selection. By trying to (1) maximize the differentialabsorption cross-section of CH2O and (2) match the absorptioncross-sections and temperature variation of CH4 at the two wave-lengths, we have carefully picked a line pair for CH2O detection:2895.92 cm�1 (on-line) and 2895.60 cm�1 (off-line), which is ex-pected to work over a wide range of temperatures (900–1800 K)and pressure (0.5–5 atm).
To verify our assumptions on the structural differences betweenthe absorption spectra of CH2O and that of potential interferingspecies, we have measured their absorption cross-sections as func-tions of wavelength in a shock tube. Figure 4 shows the shapes ofthe absorption features of CH2O and CH4 near 2896 cm�1. As a rep-resentative broadband interfering species, CH3CHO is also shownon the plot. The flat CH3CHO spectrum validates our two-colorscheme for eliminating broadband interference. Although theinterference from CH4 cannot be completely removed, the differen-tial absorption cross-section of CH2O is more than 20 times largerthan that of CH4 between the wavelength pair. And because CH2Otypically has a shorter characteristic timescale than CH4 duringhydrocarbon oxidation, this differential sensitivity is often suffi-cient for successful early-time detection of CH2O in combustionprocess, where the concentration of CH2O can be an order of mag-nitude higher than that of CH4.
2.2. UV wavelengths for CH2O and CH3CHO detection
Our measurement (Fig. 4) and calculation (Fig. 1) of aldehydesspectra indicates that there is no simple two-color scheme to sepa-rate CH3CHO from broad-band interference in the IR, and thereforeCH3CHO must be measured in another wavelength region such asthe UV. Shown in Fig. 5 are the room temperature UV absorptionspectra of both aldehydes near 306 nm. As a result of the overlap be-tween the two spectra, a unique determination of the CH3CHO con-centration requires a combined CH2O/CH3CHO detection schemeinvolving both IR and UV lasers. For the UV wavelength selection,the absorption features around 307 nm are attractive, because (1)they lie in the middle of the tuning range of our frequency-doubled
Fig. 4. Measured absorption spectra of CH2O, CH3CHO and CH4 near 2896 cm�1, at1200 K, 2 atm.
ring dye laser used for OH detection, and (2) the CH3CHO absorptioncross-section is much larger than that of CH2O. In fact, the wave-length dependence of these aldehyde absorption cross-sections ismuch weaker at high temperatures, and as long as one can avoidOH transitions, a few wavenumbers’ change in the wavelengthmakes little difference (Fig. 6). This lack of variation in absorptioncross-section has been confirmed in the previous study of Cooket al. [25]. In the current work, 32601.10 cm�1 (306.738 nm) wasused as the UV color for aldehydes detection. The detection schemecan be easily extended to include OH detection by the addition of an-other color at 32606.52 cm�1.
2.3. A quantitative aldehyde detection scheme
The fractional transmission (I/I0) of a monochromatic light is re-lated to the mole fraction of the absorbing species (vi) through theBeer–Lambert relation:
� lnII0
� �k
¼ rðk; T; PÞvinL ¼ aðk; T; PÞ ð1Þ
where r is the absorption cross-section of the absorbing species, nis the total number density of the test gas, and L is the path-length.
Fig. 6. Wavelength- and temperature-dependence of aldehyde absorptioncoefficients.
S. Wang et al. / Combustion and Flame 160 (2013) 1930–1938 1933
The absorption signal is usually expressed in the form of absorbance(a).
Applying the Beer–Lambert law at the three colors selected foraldehydes detection, namely ~mIR;1 ¼ 2895:92 cm�1; ~mIR;2 ¼ 2895:60cm�1; ~mUV ;1 ¼ 32601:10 cm�1, together with the OH color at~mUV ;2 ¼ 32606:52 cm�1, we have a closed set of equations with anequal number of unknowns (vCH2O;vCH3CHO;vOH , and the interferenceabsorbance aint):
aIR1 ¼ aCH2O;IR1 þ aint ¼ rCH2O;IR1vCH2OnLþ aint ð2ÞaIR2 ¼ aCH2O;IR2 þ aint ¼ rCH2O;IR2vCH2OnLþ aint ð3ÞaUV1 ¼ aald;UV ¼ ðrCH2O;UVvCH2O þ rCH3CHO;UVvCH3CHOÞnL ð4Þ
aUV2 ¼ aald;UV þ aOH
¼ ðrCH2O;UVvCH2O þ rCH3CHO;UVvCH3CHO þ rCH2O;UVvCH2O
þ rOHvOHÞnL ð5Þ
Given the knowledge of their absorption cross-sections we cansolve for the mole fractions of aldehydes and OH. Particularly, fromthe two-color CH2O scheme ((2) and (3)),
vCH2O ¼aIR1 � aIR2
ðrCH2O;IR1 � rCH2O;IR2ÞnLð6Þ
The three-color aldehydes scheme (2)–(4) yields
vCH3CHO ¼ aUV1 �rCH2O;UV ðaIR1 � aIR2ÞrCH2O;IR1 � rCH2O;IR2
� ��rCH3CHO;UV nL ð7Þ
And the OH mole fraction, when of interest, is given by
vOH ¼aUV2 � aUV1
rOHnLð8Þ
3. Absorption cross-section measurement
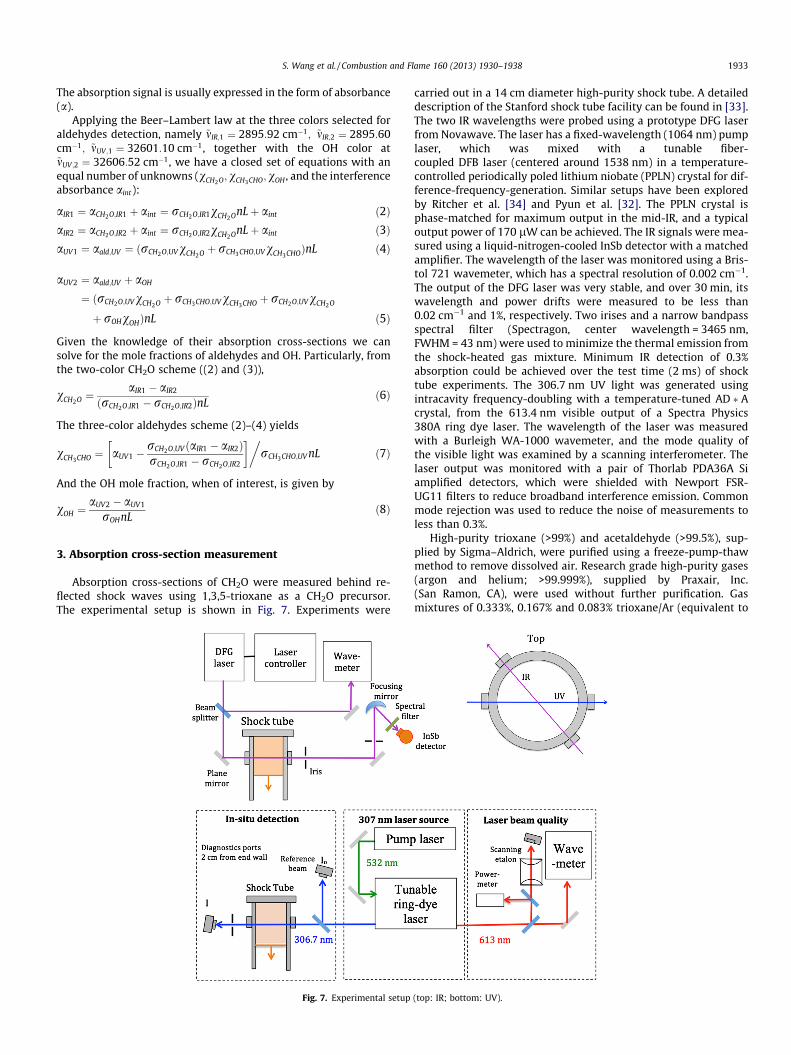
Absorption cross-sections of CH2O were measured behind re-flected shock waves using 1,3,5-trioxane as a CH2O precursor.The experimental setup is shown in Fig. 7. Experiments were
Fig. 7. Experimental setup
carried out in a 14 cm diameter high-purity shock tube. A detaileddescription of the Stanford shock tube facility can be found in [33].The two IR wavelengths were probed using a prototype DFG laserfrom Novawave. The laser has a fixed-wavelength (1064 nm) pumplaser, which was mixed with a tunable fiber-coupled DFB laser (centered around 1538 nm) in a temperature-controlled periodically poled lithium niobate (PPLN) crystal for dif-ference-frequency-generation. Similar setups have been exploredby Ritcher et al. [34] and Pyun et al. [32]. The PPLN crystal isphase-matched for maximum output in the mid-IR, and a typicaloutput power of 170 lW can be achieved. The IR signals were mea-sured using a liquid-nitrogen-cooled InSb detector with a matchedamplifier. The wavelength of the laser was monitored using a Bris-tol 721 wavemeter, which has a spectral resolution of 0.002 cm�1.The output of the DFG laser was very stable, and over 30 min, itswavelength and power drifts were measured to be less than0.02 cm�1 and 1%, respectively. Two irises and a narrow bandpassspectral filter (Spectragon, center wavelength = 3465 nm,FWHM = 43 nm) were used to minimize the thermal emission fromthe shock-heated gas mixture. Minimum IR detection of 0.3%absorption could be achieved over the test time (2 ms) of shocktube experiments. The 306.7 nm UV light was generated usingintracavity frequency-doubling with a temperature-tuned AD � Acrystal, from the 613.4 nm visible output of a Spectra Physics380A ring dye laser. The wavelength of the laser was measuredwith a Burleigh WA-1000 wavemeter, and the mode quality ofthe visible light was examined by a scanning interferometer. Thelaser output was monitored with a pair of Thorlab PDA36A Siamplified detectors, which were shielded with Newport FSR-UG11 filters to reduce broadband interference emission. Commonmode rejection was used to reduce the noise of measurements toless than 0.3%.
High-purity trioxane (>99%) and acetaldehyde (>99.5%), sup-plied by Sigma–Aldrich, were purified using a freeze-pump-thawmethod to remove dissolved air. Research grade high-purity gases(argon and helium; >99.999%), supplied by Praxair, Inc.(San Ramon, CA), were used without further purification. Gasmixtures of 0.333%, 0.167% and 0.083% trioxane/Ar (equivalent to
(top: IR; bottom: UV).
1934 S. Wang et al. / Combustion and Flame 160 (2013) 1930–1938
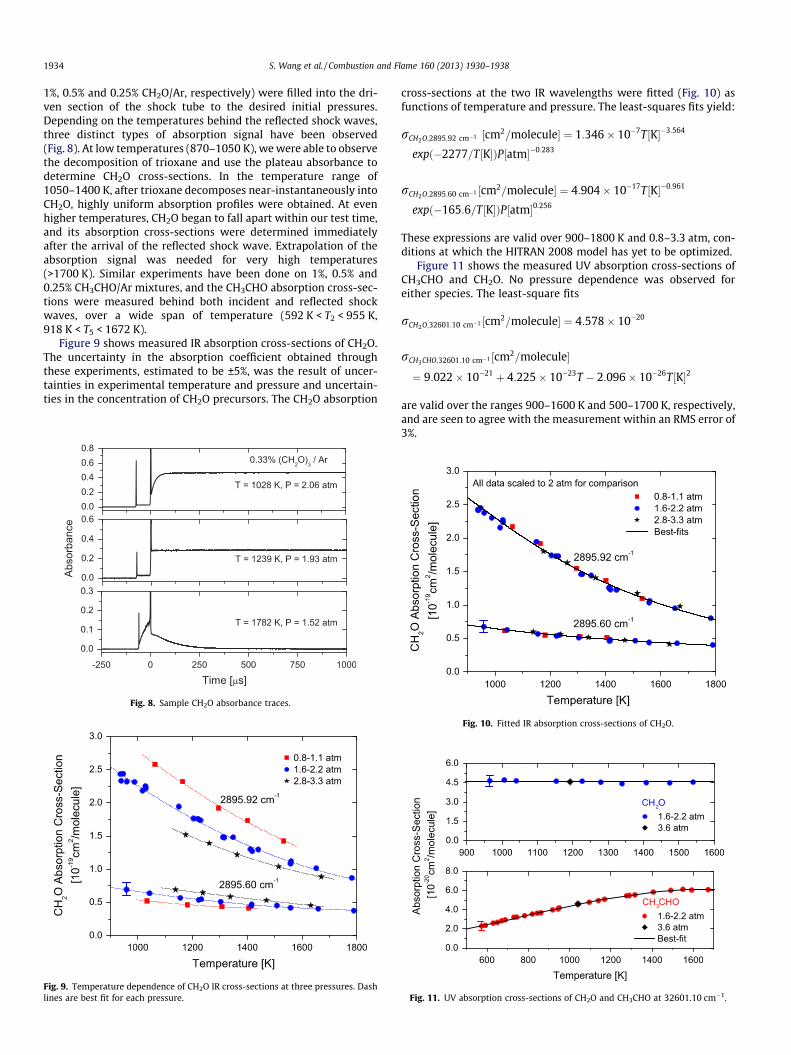
1%, 0.5% and 0.25% CH2O/Ar, respectively) were filled into the dri-ven section of the shock tube to the desired initial pressures.Depending on the temperatures behind the reflected shock waves,three distinct types of absorption signal have been observed(Fig. 8). At low temperatures (870–1050 K), we were able to observethe decomposition of trioxane and use the plateau absorbance todetermine CH2O cross-sections. In the temperature range of1050–1400 K, after trioxane decomposes near-instantaneously intoCH2O, highly uniform absorption profiles were obtained. At evenhigher temperatures, CH2O began to fall apart within our test time,and its absorption cross-sections were determined immediatelyafter the arrival of the reflected shock wave. Extrapolation of theabsorption signal was needed for very high temperatures(>1700 K). Similar experiments have been done on 1%, 0.5% and0.25% CH3CHO/Ar mixtures, and the CH3CHO absorption cross-sec-tions were measured behind both incident and reflected shockwaves, over a wide span of temperature (592 K < T2 < 955 K,918 K < T5 < 1672 K).
Figure 9 shows measured IR absorption cross-sections of CH2O.The uncertainty in the absorption coefficient obtained throughthese experiments, estimated to be ±5%, was the result of uncer-tainties in experimental temperature and pressure and uncertain-ties in the concentration of CH2O precursors. The CH2O absorption
Fig. 9. Temperature dependence of CH2O IR cross-sections at three pressures. Dashlines are best fit for each pressure.
Fig. 8. Sample CH2O absorbance traces.
cross-sections at the two IR wavelengths were fitted (Fig. 10) asfunctions of temperature and pressure. The least-squares fits yield:
rCH2O;2895:92 cm�1 ½cm2=molecule� ¼ 1:346� 10�7T½K��3:564
expð�2277=T½K�ÞP½atm��0:283
rCH2O;2895:60 cm�1 ½cm2=molecule� ¼ 4:904� 10�17T½K��0:961
expð�165:6=T½K�ÞP½atm�0:256
These expressions are valid over 900–1800 K and 0.8–3.3 atm, con-ditions at which the HITRAN 2008 model has yet to be optimized.
Figure 11 shows the measured UV absorption cross-sections ofCH3CHO and CH2O. No pressure dependence was observed foreither species. The least-square fits
rCH2O;32601:10 cm�1 ½cm2=molecule� ¼ 4:578� 10�20
rCH3CHO;32601:10 cm�1 ½cm2=molecule�
¼ 9:022� 10�21 þ 4:225� 10�23T � 2:096� 10�26T½K�2
are valid over the ranges 900–1600 K and 500–1700 K, respectively,and are seen to agree with the measurement within an RMS error of3%.
Fig. 10. Fitted IR absorption cross-sections of CH2O.
Fig. 11. UV absorption cross-sections of CH2O and CH3CHO at 32601.10 cm�1.
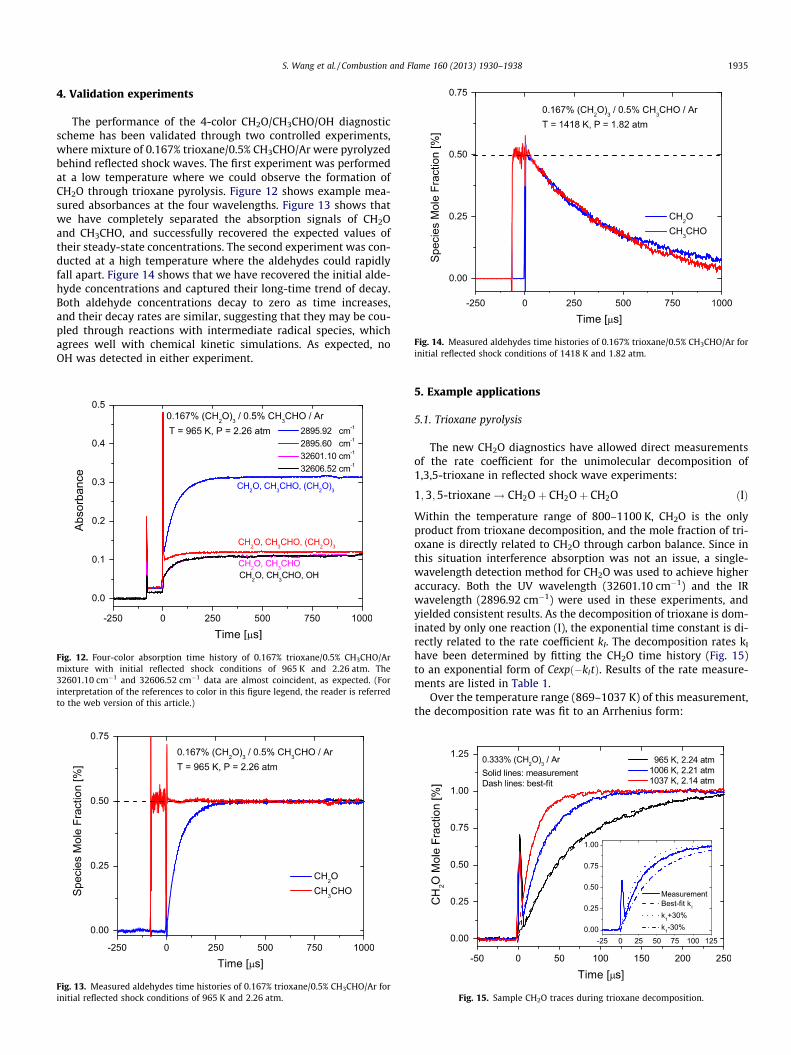
Fig. 14. Measured aldehydes time histories of 0.167% trioxane/0.5% CH3CHO/Ar forinitial reflected shock conditions of 1418 K and 1.82 atm.
S. Wang et al. / Combustion and Flame 160 (2013) 1930–1938 1935
4. Validation experiments
The performance of the 4-color CH2O/CH3CHO/OH diagnosticscheme has been validated through two controlled experiments,where mixture of 0.167% trioxane/0.5% CH3CHO/Ar were pyrolyzedbehind reflected shock waves. The first experiment was performedat a low temperature where we could observe the formation ofCH2O through trioxane pyrolysis. Figure 12 shows example mea-sured absorbances at the four wavelengths. Figure 13 shows thatwe have completely separated the absorption signals of CH2Oand CH3CHO, and successfully recovered the expected values oftheir steady-state concentrations. The second experiment was con-ducted at a high temperature where the aldehydes could rapidlyfall apart. Figure 14 shows that we have recovered the initial alde-hyde concentrations and captured their long-time trend of decay.Both aldehyde concentrations decay to zero as time increases,and their decay rates are similar, suggesting that they may be cou-pled through reactions with intermediate radical species, whichagrees well with chemical kinetic simulations. As expected, noOH was detected in either experiment.
Fig. 13. Measured aldehydes time histories of 0.167% trioxane/0.5% CH3CHO/Ar forinitial reflected shock conditions of 965 K and 2.26 atm.
Fig. 12. Four-color absorption time history of 0.167% trioxane/0.5% CH3CHO/Armixture with initial reflected shock conditions of 965 K and 2.26 atm. The32601.10 cm�1 and 32606.52 cm�1 data are almost coincident, as expected. (Forinterpretation of the references to color in this figure legend, the reader is referredto the web version of this article.)
5. Example applications
5.1. Trioxane pyrolysis
The new CH2O diagnostics have allowed direct measurementsof the rate coefficient for the unimolecular decomposition of1,3,5-trioxane in reflected shock wave experiments:
1;3;5-trioxane! CH2Oþ CH2Oþ CH2O ðIÞ
Within the temperature range of 800–1100 K, CH2O is the onlyproduct from trioxane decomposition, and the mole fraction of tri-oxane is directly related to CH2O through carbon balance. Since inthis situation interference absorption was not an issue, a single-wavelength detection method for CH2O was used to achieve higheraccuracy. Both the UV wavelength (32601.10 cm�1) and the IRwavelength (2896.92 cm�1) were used in these experiments, andyielded consistent results. As the decomposition of trioxane is dom-inated by only one reaction (I), the exponential time constant is di-rectly related to the rate coefficient kI. The decomposition rates kI
have been determined by fitting the CH2O time history (Fig. 15)to an exponential form of Cexpð�kItÞ. Results of the rate measure-ments are listed in Table 1.
Over the temperature range (869–1037 K) of this measurement,the decomposition rate was fit to an Arrhenius form:
Fig. 15. Sample CH2O traces during trioxane decomposition.
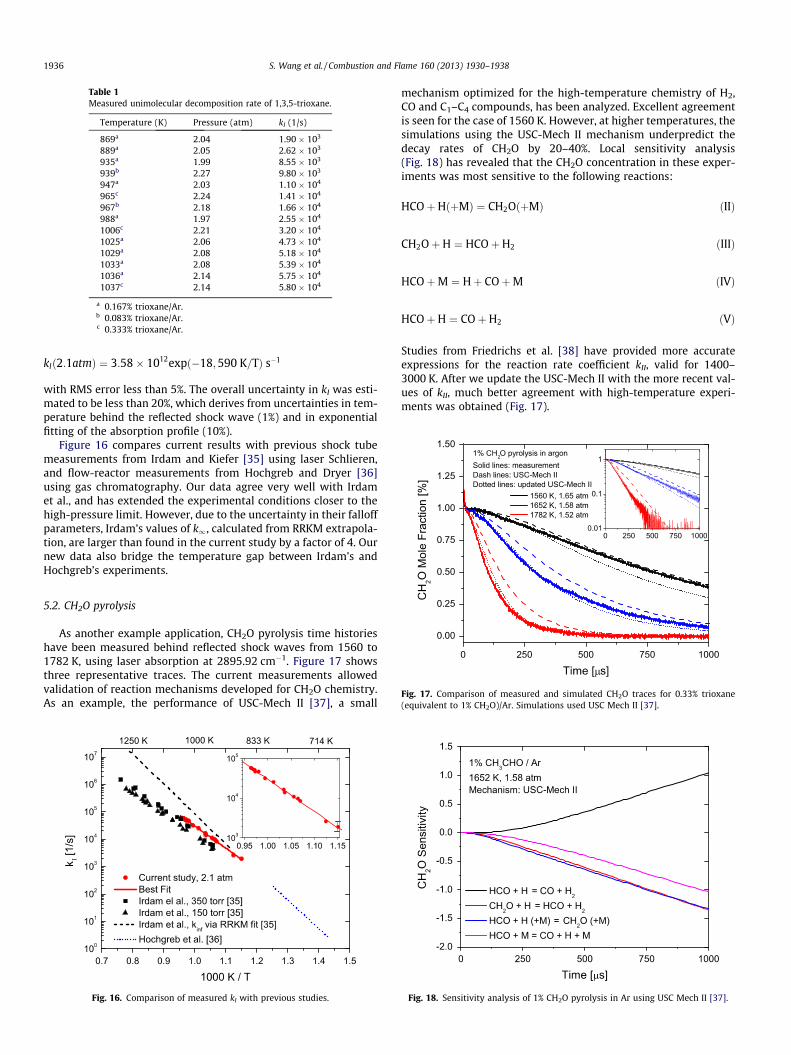
Table 1Measured unimolecular decomposition rate of 1,3,5-trioxane.
Temperature (K) Pressure (atm) kI (1/s)
869a 2.04 1.90 � 103
889a 2.05 2.62 � 103
935a 1.99 8.55 � 103
939b 2.27 9.80 � 103
947a 2.03 1.10 � 104
965c 2.24 1.41 � 104
967b 2.18 1.66 � 104
988a 1.97 2.55 � 104
1006c 2.21 3.20 � 104
1025a 2.06 4.73 � 104
1029a 2.08 5.18 � 104
1033a 2.08 5.39 � 104
1036a 2.14 5.75 � 104
1037c 2.14 5.80 � 104
a 0.167% trioxane/Ar.b 0.083% trioxane/Ar.c 0.333% trioxane/Ar.
1936 S. Wang et al. / Combustion and Flame 160 (2013) 1930–1938
kIð2:1atmÞ ¼ 3:58� 1012expð�18;590 K=TÞ s�1
with RMS error less than 5%. The overall uncertainty in kI was esti-mated to be less than 20%, which derives from uncertainties in tem-perature behind the reflected shock wave (1%) and in exponentialfitting of the absorption profile (10%).
Figure 16 compares current results with previous shock tubemeasurements from Irdam and Kiefer [35] using laser Schlieren,and flow-reactor measurements from Hochgreb and Dryer [36]using gas chromatography. Our data agree very well with Irdamet al., and has extended the experimental conditions closer to thehigh-pressure limit. However, due to the uncertainty in their falloffparameters, Irdam’s values of k1, calculated from RRKM extrapola-tion, are larger than found in the current study by a factor of 4. Ournew data also bridge the temperature gap between Irdam’s andHochgreb’s experiments.
Fig. 17. Comparison of measured and simulated CH2O traces for 0.33% trioxane(equivalent to 1% CH2O)/Ar. Simulations used USC Mech II [37].
5.2. CH2O pyrolysis
As another example application, CH2O pyrolysis time historieshave been measured behind reflected shock waves from 1560 to1782 K, using laser absorption at 2895.92 cm�1. Figure 17 showsthree representative traces. The current measurements allowedvalidation of reaction mechanisms developed for CH2O chemistry.As an example, the performance of USC-Mech II [37], a small
Fig. 16. Comparison of measured kI with previous studies.
mechanism optimized for the high-temperature chemistry of H2,CO and C1–C4 compounds, has been analyzed. Excellent agreementis seen for the case of 1560 K. However, at higher temperatures, thesimulations using the USC-Mech II mechanism underpredict thedecay rates of CH2O by 20–40%. Local sensitivity analysis(Fig. 18) has revealed that the CH2O concentration in these exper-iments was most sensitive to the following reactions:
HCOþHðþMÞ ¼ CH2OðþMÞ ðIIÞ
CH2OþH ¼ HCOþH2 ðIIIÞ
HCOþM ¼ Hþ COþM ðIVÞ
HCOþH ¼ COþH2 ðVÞ
Studies from Friedrichs et al. [38] have provided more accurateexpressions for the reaction rate coefficient kII, valid for 1400–3000 K. After we update the USC-Mech II with the more recent val-ues of kII, much better agreement with high-temperature experi-ments was obtained (Fig. 17).
Fig. 18. Sensitivity analysis of 1% CH2O pyrolysis in Ar using USC Mech II [37].
S. Wang et al. / Combustion and Flame 160 (2013) 1930–1938 1937
5.3. CH3CHO pyrolysis
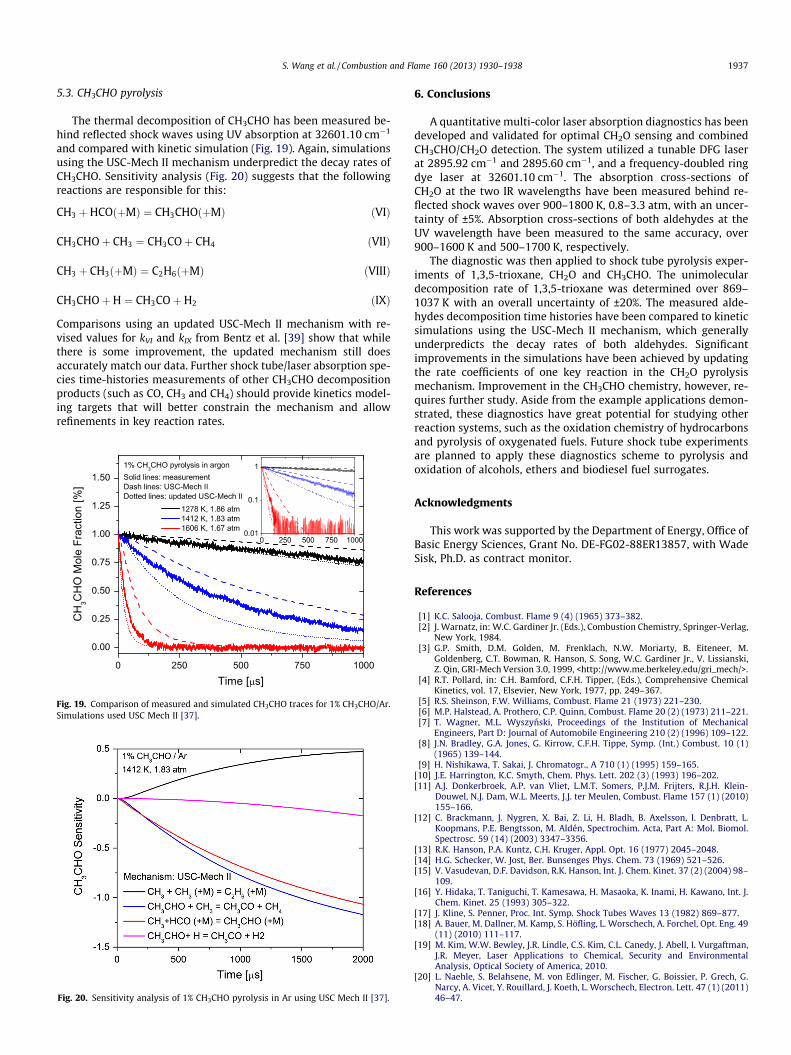
The thermal decomposition of CH3CHO has been measured be-hind reflected shock waves using UV absorption at 32601.10 cm�1
and compared with kinetic simulation (Fig. 19). Again, simulationsusing the USC-Mech II mechanism underpredict the decay rates ofCH3CHO. Sensitivity analysis (Fig. 20) suggests that the followingreactions are responsible for this:
CH3 þHCOðþMÞ ¼ CH3CHOðþMÞ ðVIÞ
CH3CHOþ CH3 ¼ CH3COþ CH4 ðVIIÞ
CH3 þ CH3ðþMÞ ¼ C2H6ðþMÞ ðVIIIÞ
CH3CHOþH ¼ CH3COþH2 ðIXÞ
Comparisons using an updated USC-Mech II mechanism with re-vised values for kVI and kIX from Bentz et al. [39] show that whilethere is some improvement, the updated mechanism still doesaccurately match our data. Further shock tube/laser absorption spe-cies time-histories measurements of other CH3CHO decompositionproducts (such as CO, CH3 and CH4) should provide kinetics model-ing targets that will better constrain the mechanism and allowrefinements in key reaction rates.
Fig. 20. Sensitivity analysis of 1% CH3CHO pyrolysis in Ar using USC Mech II [37].
Fig. 19. Comparison of measured and simulated CH3CHO traces for 1% CH3CHO/Ar.Simulations used USC Mech II [37].
6. Conclusions
A quantitative multi-color laser absorption diagnostics has beendeveloped and validated for optimal CH2O sensing and combinedCH3CHO/CH2O detection. The system utilized a tunable DFG laserat 2895.92 cm�1 and 2895.60 cm�1, and a frequency-doubled ringdye laser at 32601.10 cm�1. The absorption cross-sections ofCH2O at the two IR wavelengths have been measured behind re-flected shock waves over 900–1800 K, 0.8–3.3 atm, with an uncer-tainty of ±5%. Absorption cross-sections of both aldehydes at theUV wavelength have been measured to the same accuracy, over900–1600 K and 500–1700 K, respectively.
The diagnostic was then applied to shock tube pyrolysis exper-iments of 1,3,5-trioxane, CH2O and CH3CHO. The unimoleculardecomposition rate of 1,3,5-trioxane was determined over 869–1037 K with an overall uncertainty of ±20%. The measured alde-hydes decomposition time histories have been compared to kineticsimulations using the USC-Mech II mechanism, which generallyunderpredicts the decay rates of both aldehydes. Significantimprovements in the simulations have been achieved by updatingthe rate coefficients of one key reaction in the CH2O pyrolysismechanism. Improvement in the CH3CHO chemistry, however, re-quires further study. Aside from the example applications demon-strated, these diagnostics have great potential for studying otherreaction systems, such as the oxidation chemistry of hydrocarbonsand pyrolysis of oxygenated fuels. Future shock tube experimentsare planned to apply these diagnostics scheme to pyrolysis andoxidation of alcohols, ethers and biodiesel fuel surrogates.
Acknowledgments
This work was supported by the Department of Energy, Office ofBasic Energy Sciences, Grant No. DE-FG02-88ER13857, with WadeSisk, Ph.D. as contract monitor.
References
[1] K.C. Salooja, Combust. Flame 9 (4) (1965) 373–382.[2] J. Warnatz, in: W.C. Gardiner Jr. (Eds.), Combustion Chemistry, Springer-Verlag,
New York, 1984.[3] G.P. Smith, D.M. Golden, M. Frenklach, N.W. Moriarty, B. Eiteneer, M.
Goldenberg, C.T. Bowman, R. Hanson, S. Song, W.C. Gardiner Jr., V. Lissianski,Z. Qin, GRI-Mech Version 3.0, 1999, <http://www.me.berkeley.edu/gri_mech/>.
[4] R.T. Pollard, in: C.H. Bamford, C.F.H. Tipper, (Eds.), Comprehensive ChemicalKinetics, vol. 17, Elsevier, New York, 1977, pp. 249–367.
[5] R.S. Sheinson, F.W. Williams, Combust. Flame 21 (1973) 221–230.[6] M.P. Halstead, A. Prothero, C.P. Quinn, Combust. Flame 20 (2) (1973) 211–221.[7] T. Wagner, M.L. Wyszynski, Proceedings of the Institution of Mechanical
Engineers, Part D: Journal of Automobile Engineering 210 (2) (1996) 109–122.[8] J.N. Bradley, G.A. Jones, G. Kirrow, C.F.H. Tippe, Symp. (Int.) Combust. 10 (1)
(1965) 139–144.[9] H. Nishikawa, T. Sakai, J. Chromatogr., A 710 (1) (1995) 159–165.
[10] J.E. Harrington, K.C. Smyth, Chem. Phys. Lett. 202 (3) (1993) 196–202.[11] A.J. Donkerbroek, A.P. van Vliet, L.M.T. Somers, P.J.M. Frijters, R.J.H. Klein-
Douwel, N.J. Dam, W.L. Meerts, J.J. ter Meulen, Combust. Flame 157 (1) (2010)155–166.
[12] C. Brackmann, J. Nygren, X. Bai, Z. Li, H. Bladh, B. Axelsson, I. Denbratt, L.Koopmans, P.E. Bengtsson, M. Aldén, Spectrochim. Acta, Part A: Mol. Biomol.Spectrosc. 59 (14) (2003) 3347–3356.
[13] R.K. Hanson, P.A. Kuntz, C.H. Kruger, Appl. Opt. 16 (1977) 2045–2048.[14] H.G. Schecker, W. Jost, Ber. Bunsenges Phys. Chem. 73 (1969) 521–526.[15] V. Vasudevan, D.F. Davidson, R.K. Hanson, Int. J. Chem. Kinet. 37 (2) (2004) 98–
109.[16] Y. Hidaka, T. Taniguchi, T. Kamesawa, H. Masaoka, K. Inami, H. Kawano, Int. J.
Chem. Kinet. 25 (1993) 305–322.[17] J. Kline, S. Penner, Proc. Int. Symp. Shock Tubes Waves 13 (1982) 869–877.[18] A. Bauer, M. Dallner, M. Kamp, S. Höfling, L. Worschech, A. Forchel, Opt. Eng. 49
(11) (2010) 111–117.[19] M. Kim, W.W. Bewley, J.R. Lindle, C.S. Kim, C.L. Canedy, J. Abell, I. Vurgaftman,
J.R. Meyer, Laser Applications to Chemical, Security and EnvironmentalAnalysis, Optical Society of America, 2010.
[20] L. Naehle, S. Belahsene, M. von Edlinger, M. Fischer, G. Boissier, P. Grech, G.Narcy, A. Vicet, Y. Rouillard, J. Koeth, L. Worschech, Electron. Lett. 47 (1) (2011)46–47.
1938 S. Wang et al. / Combustion and Flame 160 (2013) 1930–1938
[21] D.G. Lancaster, A. Fried, B. Wert, B. Henry, F.K. Tittel, Appl. Opt. 39 (24) (2000)4436–4443.
[22] S. Lundqvist, P. Kluczynski, R. Weih, M. von Edlinger, L. Nähle, M. Fischer, A.Bauer, S. Höfling, J. Koeth, Appl. Opt. 51 (25) (2012) 6009–6013.
[23] A. Perrin, D. Jacquemart, F. Kwabia Tchana, N. Lacome, J. Quant. Spectrosc.Radiat. Transfer 110 (9) (2009) 700–716.
[24] D. Jacquemart, A. Laraia, F. Kwabia Tchana, R.R. Gamache, A. Perrin, N. Lacome,J. Quant. Spectrosc. Radiat. Transfer 111 (9) (2010) 1209–1222.
[25] R.D. Cook, D.F. Davidson, R.K. Hanson, Int. J. Chem. Kinet. 44 (5) (2012) 303–311.[26] D.J. Clouthier, D.A. Ramsay, Annu. Rev. Phys. Chem. 34 (1) (1983) 31–58.[27] F.D. Pope, C.A. Smith, M.N.R. Ashfold, A.J. Orr-Ewing, Phys. Chem. Chem. Phys.
7 (2005) 79–84.[28] C.A. Smith, F.D. Pope, B. Cronin, C.B. Parkes, A.J. Orr-Ewing, J. Phys. Chem. A110
(2006) 11645–11653.[29] S.W. Sharpe, T.J. Johnson, R.L. Sams, P.M. Chu, G.C. Rhoderick, P.A. Johnson,
Appl. Spectrosc. 58 (2004) 452–1461.[30] V. Catoire, F. Bernard, Y. Mébarki, A. Mellouki, G. Eyglunent, V. Daële, C. Robert,
J. Environ. Sci. 24 (1) (2012) 22–33.
[31] L.S. Rothman, I.E. Gordon, A. Barbe, D.C. Benner, P.F. Bernath, M. Birk, J. VanderAuwera, J. Quant. Spectrosc. Radiat. Transfer 110 (9) (2009) 533–572. <http://www.cfa.harvard.edu/hitran/>.
[32] S.H. Pyun, J. Cho, D.F. Davidson, R.K. Hanson, Meas. Sci. Technol. 22 (2) (2011)025303.
[33] Z. Hong, R.D. Cook, D.F. Davidson, R.K. Hanson, J. Phys. Chem. A114 (18) (2010)5718–5727.
[34] D. Richter, P. Weibring, A. Fried, O. Tadanaga, Y. Nishida, M. Asobe, H. Suzuki,Opt. Express 15 (2) (2007) 564–571.
[35] E.A. Irdam, J.H. Kiefer, Chem. Phys. Lett. 166 (5) (1990) 491–494.[36] S. Hochgreb, F.L. Dryer, J. Phys. Chem. 96 (1) (1992) 295–297.[37] H. Wang, X. You, A.V. Joshi, S.G. Davis, A. Laskin, F. Egolfopoulos, C.K. Law, USC
Mech Version II, 2007. <http://ignis.usc.edu/USC_Mech_II.htm>.[38] G. Friedrichs, D.F. Davidson, R.K. Hanson, Int. J. Chem. Kinet. 36 (3) (2004) 157–
169.[39] T. Bentz, F. Striebel, M. Olzmann, J. Phys. Chem. A112 (27) (2008) 6120–6124.
Related Documents