1 3 Arch Toxicol (2017) 91:1367–1383 DOI 10.1007/s00204-016-1781-0 IN VITRO SYSTEMS High‑content imaging‑based BAC‑GFP toxicity pathway reporters to assess chemical adversity liabilities Steven Wink 1 · Steven Hiemstra 1 · Bram Herpers 1 · Bob van de Water 1 Received: 9 February 2016 / Accepted: 21 June 2016 / Published online: 29 June 2016 © The Author(s) 2016. This article is published with open access at Springerlink.com stress response profiling platform will allow a high through- put and time-resolved classification of chemical-induced stress responses, thus assisting in the future mechanism-based safety assessment of chemicals. Keywords High-content imaging · DILI · Adaptive stress signaling Abbreviations ADR Adverse drug reaction AOP Adverse outcome pathway BAC Bacterial artificial chromosome BFA Brefeldin A CDDO-Me Bardoxolone methyl (methyl-2-cyano 3,12-dioxooleano-1,9-dien-28-oate) DDR DNA damage response DEM Diethylmaleate DILI Drug-induced liver injury ER-stress Endoplasmic reticulum stress IAA Iodoacetamide OSR Oxidative stress response/antioxidant pathways UPR Unfolded protein response Tc Tunicamycin Tg Thapsigargin Introduction In the past decades, hepatic toxicity has contributed dispro- portionately to drug withdrawals (Stevens and Baker 2009). Nowadays, drug-induced liver injury (DILI) is still notori- ously difficult to predict in as well preclinical and clinical trial settings because of the often idiosyncratic nature. There is a strong incentive to integrate human-relevant mechanistic Abstract Adaptive cellular stress responses are paramount in the healthy control of cell and tissue homeostasis and gener- ally activated during toxicity in a chemical-specific manner. Here, we established a platform containing a panel of distinct adaptive stress response reporter cell lines based on BAC- transgenomics GFP tagging in HepG2 cells. Our current panel of eleven BAC-GFP HepG2 reporters together contains (1) upstream sensors, (2) downstream transcription factors and (3) their respective target genes, representing the oxidative stress response pathway (Keap1/Nrf2/Srxn1), the unfolded protein response in the endoplasmic reticulum (Xbp1/Atf4/BiP/Chop) and the DNA damage response (53bp1/p53/p21). Using auto- mated confocal imaging and quantitative single-cell image analysis, we established that all reporters allowed the time- resolved, sensitive and mode-of-action-specific activation of the individual BAC-GFP reporter cell lines as defined by a panel of pathway-specific training compounds. Implement- ing the temporal pathway activity information increased the discrimination of training compounds. For a set of >30 hepa- totoxicants, the induction of Srxn1, BiP, Chop and p21 BAC- GFP reporters correlated strongly with the transcriptional responses observed in cryopreserved primary human hepato- cytes. Together, our data indicate that a phenotypic adaptive Steven Wink and Steven Hiemstra have contributed equally to this work. Electronic supplementary material The online version of this article (doi:10.1007/s00204-016-1781-0) contains supplementary material, which is available to authorized users. * Bob van de Water [email protected] 1 Division of Toxicology, Leiden Academic Centre for Drug Research, Leiden University, Einsteinweg 55, 2333 CC Leiden, The Netherlands

Welcome message from author
This document is posted to help you gain knowledge. Please leave a comment to let me know what you think about it! Share it to your friends and learn new things together.
Transcript
1 3
Arch Toxicol (2017) 91:1367–1383DOI 10.1007/s00204-016-1781-0
IN VITRO SYSTEMS
High‑content imaging‑based BAC‑GFP toxicity pathway reporters to assess chemical adversity liabilities
Steven Wink1 · Steven Hiemstra1 · Bram Herpers1 · Bob van de Water1
Received: 9 February 2016 / Accepted: 21 June 2016 / Published online: 29 June 2016 © The Author(s) 2016. This article is published with open access at Springerlink.com
stress response profiling platform will allow a high through-put and time-resolved classification of chemical-induced stress responses, thus assisting in the future mechanism-based safety assessment of chemicals.
Keywords High-content imaging · DILI · Adaptive stress signaling
AbbreviationsADR Adverse drug reactionAOP Adverse outcome pathwayBAC Bacterial artificial chromosomeBFA Brefeldin ACDDO-Me Bardoxolone methyl (methyl-2-cyano
3,12-dioxooleano-1,9-dien-28-oate)DDR DNA damage responseDEM DiethylmaleateDILI Drug-induced liver injuryER-stress Endoplasmic reticulum stressIAA IodoacetamideOSR Oxidative stress response/antioxidant
pathwaysUPR Unfolded protein responseTc TunicamycinTg Thapsigargin
Introduction
In the past decades, hepatic toxicity has contributed dispro-portionately to drug withdrawals (Stevens and Baker 2009). Nowadays, drug-induced liver injury (DILI) is still notori-ously difficult to predict in as well preclinical and clinical trial settings because of the often idiosyncratic nature. There is a strong incentive to integrate human-relevant mechanistic
Abstract Adaptive cellular stress responses are paramount in the healthy control of cell and tissue homeostasis and gener-ally activated during toxicity in a chemical-specific manner. Here, we established a platform containing a panel of distinct adaptive stress response reporter cell lines based on BAC-transgenomics GFP tagging in HepG2 cells. Our current panel of eleven BAC-GFP HepG2 reporters together contains (1) upstream sensors, (2) downstream transcription factors and (3) their respective target genes, representing the oxidative stress response pathway (Keap1/Nrf2/Srxn1), the unfolded protein response in the endoplasmic reticulum (Xbp1/Atf4/BiP/Chop) and the DNA damage response (53bp1/p53/p21). Using auto-mated confocal imaging and quantitative single-cell image analysis, we established that all reporters allowed the time-resolved, sensitive and mode-of-action-specific activation of the individual BAC-GFP reporter cell lines as defined by a panel of pathway-specific training compounds. Implement-ing the temporal pathway activity information increased the discrimination of training compounds. For a set of >30 hepa-totoxicants, the induction of Srxn1, BiP, Chop and p21 BAC-GFP reporters correlated strongly with the transcriptional responses observed in cryopreserved primary human hepato-cytes. Together, our data indicate that a phenotypic adaptive
Steven Wink and Steven Hiemstra have contributed equally to this work.
Electronic supplementary material The online version of this article (doi:10.1007/s00204-016-1781-0) contains supplementary material, which is available to authorized users.
* Bob van de Water [email protected]
1 Division of Toxicology, Leiden Academic Centre for Drug Research, Leiden University, Einsteinweg 55, 2333 CC Leiden, The Netherlands
1368 Arch Toxicol (2017) 91:1367–1383
1 3
understanding of adverse drug reactions in in vitro-based data for evidence and read across based on approaches for risk assessment. Transcriptomics has contributed much to our mechanistic understanding and has helped to initiate and populate the adverse outcome pathway (AOP) framework (Ankley et al. 2010; Vinken 2013). AOPs are described as a sequential chain of causally linked events at different lev-els of biological organization that together culminate in the adverse health outcome. While some AOPs have so far been established, a next important step is to translate AOP-related mechanistic understanding in advanced, preferably quantita-tive, high throughput assays that reflect pathways essential in target organ toxicity. Our vision is to establish an imag-ing-based platform that can quantitatively assess the activa-tion of individual key events relevant to AOPs. Our initial focus is on adaptive stress response pathways, which are typically part of AOPs and related to adverse drug reactions.
Chemicals may interact with cellular components, lead-ing to an altered cell biochemical status. Cells sense these biochemical changes and activate specific adaptive stress response pathways. These pathways are activated to com-bat detrimental conditions under which cells cannot func-tion normally. Classical adaptive stress response pathways are the antioxidant pathways (OSR) mediated by activa-tion of the Nrf2 transcriptional program (Venugopal and Jaiswal 1998), the endoplasmic reticulum (ER) unfolded protein response (UPR) mediated by Xbp1, Atf4 and Atf6 transcription factor activation (Kim et al. 2006), and the DNA damage response (DDR) pathway typically related to activation of the p53 (TP53) transcriptional program (Gir-insky et al. 1995; Reed et al. 1995). We propose that the quantitative dynamic monitoring of the activation of these adaptive stress response pathways at the single-cell level in high throughput systems will significantly contribute on the hand to chemical safety assessment.
All the above-mentioned adaptive stress response path-ways can roughly be conceived as three consecutive steps: (1) ‘sensing’ of the biochemical perturbations; (2) down-stream transcription factor activation through either stabi-lization and/or nuclear translocation; and (3) downstream target gene activation. For the OSR, this involves: (1) Keap1 modulation, (2) Nrf2 stabilization and nuclear transloca-tion, followed by (3) target gene expression including Srxn1 (Herpers et al. 2015; Mazur et al. 2010). The UPR involves (1) sensing of unfolded proteins in the lumen of the ER by BiP, IRE1, PERK and Atf6, followed by (2) downstream transcription factor stabilization and nuclear translocation of Atf4, ATF6 and Xbp1 and (3) subsequent activation of the expression of the chaperone BiP/GRP78/HSP5A and the transcription factor DDIT3/Chop (Takayanagi et al. 2013). Finally, the DDR involves (1) recognition of DNA damage sites and DNA damage foci formation with accumulation of, e.g., 53bp1 in these foci, (2) subsequent stabilization of p53
through phosphorylation by kinases activated after DNA damage and (3) expression key p53 target genes upon trans-location of p53 to the nucleus including p21 (CDKN1A) and Btg2 (d’Adda di Fagagna et al. 2003; Reinke and Lozano 1997) (see Fig. 1a). We anticipate that the integration of all these different sensors, transcription factors and down-stream targets in fluorescent protein reporters would facili-tate the evaluation of the dynamic activation of adaptive stress responses at the single-cell level using high-content imaging approaches. Therefore, the aim of the current work was to establish and systematically evaluate the application of GFP reporters using HepG2 cell lines for these three piv-otal adaptive stress response pathways using bacterial arti-ficial chromosome (BAC) cloning technology (Poser et al. 2008b), targeting individual ‘sensor’ proteins, transcription factors as well as downstream target proteins. Since DILI prediction remains a major problem, we focused on the integration of these reporters in the liver hepatoma cell line HepG2, which is routinely used for high throughput first tier liver toxicity liability assessment (Knasmuller et al. 2004; Lin and Will 2012; Maness et al. 1998).
Here, we established, characterized and evaluated in total eleven BAC-GFP HepG2 reporter cell lines reflect-ing three adaptive stress response pathways for the appli-cation in live cell high-content imaging in relation to a set of DILI reference compounds. Our data indicate that these reporter cell lines consistently and selectively monitor the dynamic activation of the OSR, UPR and DDR at the sin-gle-cell level for pathway-specific compounds. Moreover, when we correlate the HepG2 BAC-GFP with activation of adaptive stress response in primary human hepatocytes we are able to identify the activation of these stress response pathways that are typically seen by DILI drugs in primary human hepatocytes. Interestingly, the live cell acquisition data allow the improved classification of DILI compounds based on dynamic stress pathway activation.
Results
GFP‑tagged stress‑reporter proteins respond to corresponding chemically induced stress
To enable live cell imaging of the chemically induced dynamics of cellular adaptive stress response programs, a panel of reporter cell lines was created using BAC cloning technology (Poser et al. 2008a). For each adaptive stress response pathway, an upstream ‘sensor,’ a transcription fac-tor and a downstream target were chosen (Fig. 1a). For the oxidative stress response program (OSR), kelch-like ECH-associated protein 1 (Keap1) was selected as upstream sensor, nuclear factor, erythroid 2-like 2 (Nrf2/NFE2L2) as transcription factor and Srxn1 as downstream target

1369Arch Toxicol (2017) 91:1367–1383
1 3
(Herpers et al. 2015; Itoh et al. 2004). For the UPR, heat shock 70 kDa protein 5 (BiP/HSPA5) regulates the endo-plasmic reticulum (ER)-stress/unfolded protein response (UPR) pathway through binding to accumulated unfolded proteins and consequently dissociating from the trans-membrane transducers Atf6, PERK and IRE-1 (Hetz et al. 2015); as such, BiP acts as a sensor of the UPR. However,
BiP is also induced strongly after ER-stress (Gulow et al. 2002) and also reflects UPR activation. We labeled two arms of the UPR: For the pro-survival route, we labeled the transcription factor Xbp1 and downstream target chap-erone BiP; and for the translation inhibition and pro-apop-totic arm, we labeled the activating transcription factor 4 (Atf4) and DNA-damage-inducible transcript 3 (DDIT3/
Nrf2-GFP
Srxn1-GFP
Sensor
Transcription
Target
Factor
Oxidative Stress Response
ER Stress Response DNA Damage Response
Xbp1-GFP
BiP-GFP
Atf4-GFP
Chop-GFP
53bp1-GFP
p53-GFP
p21-GFP
Btg2-GFP
Keap1-GFP
DNA damage
Oxidative stress
ER stress
DNA Damage Response
Imaging
III. Clone formationII. Transfection in HepG2
I. Cloning of GFP
IV. Positive clone selection
GenePromotor regionsGFP
1
32
54
789
1011Etc.
V. Candidate selection
46
(A)
(B)W
estern blot
RNAi tran
sfecti
on
DMSO
DEM 24h
DMSO
DEM 24h
DMS O
Etoposid
e 24h
GFP
DMS O
Etopo
side 2
4h
DMSO
Etopo sid
e 24h
DMSO
DEM 5h
GFP
DMSO
Thaps
i 24h
GFP
DMS O
Thapsi
24h
GFP
GFPGFP
DMSO
BTG2-GFP
Etoposide - Mock
Etoposide - siTP53
P21-GFP
DMSO Etoposide - Mock
Etoposide - siTP53
SRXN1-GFP
CDDO-Me - siNFE2L2
CDDO-Me -Mock
DMSO
BIP-GFP
CHOP-GFP
Thapsigargin - siATF4
Thapsigargin - siATF6
Thapsigargin - siEIF2AK3
Thapsigargin
DMSO
DMSO
(C)
(D)
p53-GFP83 kD
p21-GFP51 kD
Btg2-GFP47 kD
Keap1-GFP100 kD
Nrf2-GFP125 kD
Srxn1-GFP44 kD
Atf4-GFP80 kD
Xbp1-GFP58 kD
Chop-GFP57 kD
BiP-GFP102 kD
Thapsigargin Thapsigargin - siATF4
Thapsigargin - siATF6
Thapsigargin - siEIF2AK3
Etoposide
Etoposide
CDDO-Me
Tubulin
Tubulin Tubulin
Tubulin GAPDH
Tubulin
Thapsigargin -Mock
Thapsigargin -Mock
Oxidative Stress Response
Unfolded Protein Response
Fig. 1 Selection and characterization of adaptive stress response pathway markers for OSR, UPR and DDR. a Selection of the indi-vidual reporters for the respective pathways representing ‘sensor,’ transcription factor and target genes. b Insertion of GFP into BAC plasmid is followed by transfection and selection of the (monoclo-nal) HepG2 reporter. The selection process involves: (1) imaging of 10–24 transfected HepG2 clones to determine suitability (fluores-cence intensity and cell–cell variability) as a reporter cell line, with or without exposure to a stress-inducing compound depending on the reporter type, (2) determining the size of the target protein-GFP fusion and induction level after stress-inducing exposure by West-ern blot. c Western blot analysis of reporter expression under control
conditions and treatment conditions. Reporters for oxidative stress (Keap1, Nrf2 & Srxn1), ER-stress (Atf4, Xbp1, Chop & BiP), DNA damage (p53, p21 & Btg2). The size and responsiveness to chemi-cal stress of the GFP-fusion protein product were evaluated. Cells were treated with 100 μM DEM (oxidative stress), 25 μM etoposide (DDR) and 1 μM thapsigargin (UPR) for the either 5 h (Nrf2-GFP) or 24 h (all others) followed by WB analysis. d Responsiveness of target genes was assessed by knock down for Nrf2 (Srxn1 activation), p53 (p21 and Btg2 activation) and UPR transcription factors Xbp1, Atf4 or Atf6 (BiP and Chop activation). Mock is the control condition transfected with transfection reagents, but without siRNA
1370 Arch Toxicol (2017) 91:1367–1383
1 3
Chop). For the DNA damage response program (DDR), the upstream sensor tumor protein p53-binding protein 1 (TP53BP1/53bp1) was chosen based on its ability to sense double-strand breaks (Lee et al. 2014) and activate the ataxia telangiectasia-mutated protein pathway (ATM). For the DDR, tumor protein p53 (TP53/p53) was chosen as the pivotal transcription factor; finally, the two p53 downstream targets cyclin-dependent kinase inhibitor 1 (CDKN1A/p21) and BTG family member 2 (Btg2) were selected. To ensure near-endogenous protein-fusion levels and normal regula-tion of these adaptive stress response programs, enhanced green fluorescent protein (eGFP) and selection markers were cloned in bacterial artificial chromosome (BAC) vec-tors, which consist of genomic DNA which still contain the endogenous promoter, enhancers and introns. BACs were selected that contained at least 10 kbp on either side of the exon domains.
The BAC-GFP constructs were created using homo-logues recombination with pRed/ET recombinase, and these constructs were used to transfect HepG2 as described previously (Hendriks et al. 2012). Viable HepG2 colonies were passaged separately to obtain monoclonal BAC-GFP cell lines. For each target gene, a single monoclonal BAC-GFP cell line was selected based on fluorescent intensity and protein size (Fig. 1b). All selected reporter lines were evaluated on fusion protein size, responsiveness to selec-tive pathway activators and targeted knock down by RNAi (Fig. 1c, d). The GFP-tagged protein sizes for all targets with the exception of Nrf2 [which runs at 95 kDa instead of the theoretical 67 kDa as reported previously (Lau et al. 2013)] were in line with reported values (http://www.gen-ecards.org/). While Keap1-GFP levels were not induced by the pro-oxidant DEM, as expected, the levels of Nrf2-GFP and Srxn1-GFP were clearly induced by DEM. The ER-stress reporters Atf4-GFP, Chop-GFP, Xbp1-GFP and BiP-GFP clearly responded to the ER-stress inducer thap-sigargin. The DDR reporters p53-GFP, p21-GFP and Btg2-GFP are clearly induced after 24-h exposure of the topoi-somerase inhibitor etoposide; the large size of 53bp1-GFP (241 kDa) prohibited qualitative assessment by Western blotting.
Cellular localization of GFP-fusion products for all reporters was evaluated by confocal microscopy for control and compound treatment for 5 h (Nrf2) or 24 h (all others) (Fig. 2). A clear increase in levels of all downstream targets Srxn1-GFP, Btg2-GFP and BiP-GFP in the cytosol was seen. For the transcription factors Nrf2-GFP, Xbp1-GFP, Chop-GFP and p53-GFP as well as p21-GFP, an increase in nuclear intensity was observed. An increase in the number of nuclear DNA damage foci for 53bp1-GFP and cytosolic autophagosome-related foci for Keap1-GFP is also evident (autophagosomes co-localizes with p62 in immunofluores-cent experiments, indicating autophagosomal location of
Keap1-GFP (data not shown)). Little increase in Atf4-GFP was visible, yet image analysis revealed a clear and selec-tive increase (see later Fig. 4).
Next for all individual BAC-GFP reporters, an auto-mated multi-parameter imaging analysis pipeline was established using CellProfiler (Kamentsky et al. 2011) soft-ware and ImageJ plug-ins (Fig. 3). Depending on the BAC-GFP reporter type, the different imaging readouts were determined using automated image analysis. For 53bp1-GFP and Keap1-GFP, we quantified foci formation in the cytosolic (Keap1-GFP translocation with autophagosomes) and nuclear compartment (53bp1-GFP localization in DNA damage foci), respectively. For Srxn1, BiP and Btg2, we quantified the integrated GFP intensity in the cytosol. For Nrf2, Xbp1, Atf4, Chop, p53 and p21, we determined the mean GFP intensity in the nucleus. The different quantita-tive measurements reflect the altered expression and locali-zation of our stress reporters.
Altogether, we have established a functional panel of adaptive stress response reporters that allow us to quantita-tively assess the dynamic activation of individual pathway components in living cells at the single-cell level popula-tion level.
Adaptive stress response BAC‑GFP reporters respond in a sensitive and selective manner to reference compounds
As a next step, we set out to test the responsiveness and selectivity of the panel of stress-reporter cell lines to: (1) oxidative stress-inducing agents DEM, CDDO-Met [a pharmacological inducer of Nrf2 activity, (Yang et al. 2009)] and iodoacetamide (IAA); (2) DNA-damage-induc-ing agents etoposide and cisplatin; and (3) UPR-inducing agents brefeldin A (BFA), tunicamycin (Tc) and thapsi-gargin (Tg) (Supplemental Table 1). To monitor signaling programs well before any significant cytotoxicity occurs and, thereby, deduce causative relationships for the onset of cytotoxicity, compound concentrations were chosen that would not lead to significant cell death after 24 h as well as two additional concentrations that were twofold and four-fold lower to assess the overall sensitivity of the reporter panel. Reporter cell lines were imaged for a period of 24 h using live cell confocal imaging and evaluated for onset of cytotoxicity by propidium iodide (PI) exclusion (Supple-mental Fig. 1). Little cell death was observed, and no major differences between cell lines were discernable.
We set out to obtain mechanistic information on the mode of activation of our different reporters and antici-pated a selective activation by our reference compounds. We first evaluated whether, as a simplified method, only the final time point of the live imaging dataset would be sufficient to determine reporter activation. The endpoints

1371Arch Toxicol (2017) 91:1367–1383
1 3
from the different quantitative features of each reporter (see Fig. 3) were collected for each reference compound con-centration range and subjected to an unsupervised hierar-chical clustering (Pearson distance method and Ward clus-tering) and displayed as a heatmap (Fig. 4). The heatmap showed a clear clustering of the reporter cell lines and ref-erence compound groups within the corresponding adap-tive stress response pathway. This was reflected by a sig-nificant activation of the GFP reporters. Intriguingly, at this 24-h time point Nrf2-GFP did not show enhanced nuclear localization and for any of the reference compounds, pos-sibly related to an earlier activation. The DNA damage and UPR reporters were all activated by their correspond-ing reference compound sets. Interestingly, the UPR ref-erence compound thapsigargin also strongly activated the oxidative stress reporters Keap1 and Srxn1, in accordance with observations in neuronal cells (Li and Hu 2015), yet brefeldin A and tunicamycin selectively induced the UPR response. Brefeldin A slightly activated the 53bp1-GFP reporter, while the p53-GFP, Btg2-GFP and p21-GFP were not activated. This underscores the possibility to identify compound-specific responses.
Live cell imaging of HepG2 reporters defines temporal ranked adaptive stress response profile
We obtained detailed live cell imaging data over a 24-h time course for the entire reference dataset. Next, we inves-tigated whether live cell imaging adds value in quantify-ing adaptive stress response programs. For most reference compounds, reporter activation occurred within the first hours after treatment, dependent on the reporter (Fig. 5). Also, the dynamics of the response differed per reference compound and reporter. Thus, the live cell data demon-strate a rapid accumulation of Nrf2-GFP starting around 2 h and returning to close to baseline levels after 15 h for
BiP
Tg 1 μM
XB
P1
ATF
4C
HO
P
orig. zoom(B)i)
ii)
iii)
iv)
TP53
BP
1p5
3p2
1B
tg2
Etop. 25 μMorig. zoom(C)i)
ii)
iii)
iv)
Kea
p1
DMSO DEM 100 μM
Nrf2
Srx
n1
orig. zoom(A)i)
ii)
iii)
orig. zoom
DMSOorig. zoom
DMSOorig. zoom
Fig. 2 Representative confocal images of BAC-GFP adaptive stress response reporters. Representative confocal images are shown for OSR: Keap1, Nrf2 and Srxn1 (a); UPR: BiP, Xbp1, Atf4 and Chop (b), and DDR: 53bp1, p53, p21 and Btg2 (c). Two left columns reflect vehicle treatment for 24 or 5 h for Nrf2 (left column overall image; right column zoomed image); the two right panels reflect model com-pound treatment for 24 h or 5 h for Nrf2 (left column overall image; right column zoomed image): OSR, 100 μM DEM; UPR, 1 μM thap-sigargin; DDR, 25 μM etoposide. Images of most reporters are cap-tured at 20 or 40 times magnification on 512 × 512 pixels; however, the reporters Keap1 and 53bp1 require a higher resolution to be able to count the number of foci per cell, and as such these were captured at 40× magnification on 1024 × 1024 pixels. Hoechst channel is omitted for low intensity-level reporters in the right columns (zoom) panel
▸

1372 Arch Toxicol (2017) 91:1367–1383
1 3
CDDO-Me, DEM as well as IAA (Fig. 5). IAA exposure caused early activation of several adaptive stress response programs: the OSR reporters Keap1, Nrf2 and Srxn1 but also UPR reporter Xbp1 and DDR reporter 53bp1. Inter-estingly, while thapsigargin showed strong activation of all UPR reporters as well as the Keap1 and Srxn1 reporter, no clear stabilization of Nrf2-GFP was observed. Next, the entire set of quantitative time course data of the reference compounds for all reporters was subjected to cubic hier-archical clustering (maximum distance measure and com-plete linkage clustering), thus taking into consideration
the time dynamics of each reporter–treatment combina-tion. The reporter and treatment stress types again cluster fully together (Fig. 6). However, by inclusion of the time
Fig. 3 Automated image analysis of BAC-GFP reporter cell lines. Automated imaged analysis was performed using CellProfiler and ImageJ-based algorithms as described in “Materials and methods” section. a The Keap1 and 53bp1 reporters were based on foci detection. Left panel: A 1024 × 1024 pixel 40 times magnified image of Keap1-GFP reporter after 24-h exposure to 100 μM DEM. Blue staining corresponds to the nuclei (i) and green corresponds to the Keap1-GFP-fusion protein (iii). The nuclei are segmented (ii) and used as seeds for the cytosol identification using the GFP signal (iv), the outlines of the nuclei and cytosols are dis-played as yellow lines. Next, the GFP-signal foci corresponding to Keap1-GFP being degraded in autophagosomes are seg-mented (v) and assigned to indi-vidual cells. b The Btg2, Srxn1 and BiP reporters are based on quantifying the GFP signal in the cytosolic region of cells. First, the nuclei signal (i) is segmented (ii) and used as seeds for the cytosol identification (iii, iv). c The p21, p53, Nrf2, Xbp1, Atf4 and Chop reporters are based on quantifying the GFP signal in the nuclei. The nuclei signal (i) is segmented (ii), and these regions (iv) are directly used to quantify the GFP inten-sity (iii) (color figure online)
Number of foci per cell
foci reporters• Keap1• 53bp1
Keap1 24hr 100 µM DEM40X magn. 1024X1024 px.
Btg2 24hr 6 µM Etop.40X magn. 512X512 px.
Integrated GFP intensity in cytosol
cytosolic reporters• Btg2 • Srxn1• BiP
p21 24hr 6 µM Etop.40X magn. 512X512 px.
nucleic reporters• p21 • p53 • Nrf2• Xbp1 • Atf4 • Chop
Mean GFPintensity in nuclei
(B)
(A)
(C)
p p
Fig. 4 Effect of reference compounds on adaptive stress GFP reporter response. Heatmap displays the individual GFP reporter and compound measurements of the various reference compounds in all reporter cell lines. Shown are the 24-h endpoint measurements as the average of three independent experiments. Color intensity corre-sponds to plate-cell line-normalized feature values. Data shown were subjected to unsupervised hierarchical clustering. Side bars corre-spond to stress pathway reporter type (top bar) and reference com-pound treatment class (side bar) (color figure online)
▸

1373Arch Toxicol (2017) 91:1367–1383
1 3
p21
Btg2
p53
53bp1
Nrf2
Keap1
Srxn1
Atf4
BiP
Chop
Xbp1
DEM 50
CDDO 0.03
DEM 100
IAA 5
IAA 10
DEM 25
CDDO 0.015
CDDO 0.008
IAA 2.5
DMSO 50
DMSO 25
DMSO 75
Cisplatin 5
Etoposide 6
Etoposide 25
Etoposide 12.5
Cisplatin 20
Cisplatin 10
Tunicamycin 6
Tunicamycin 12
Tunicamycin 3
BFA 36
BFA 18
BFA 9
Thapsigargin 1
Thapsigargin 0.5
Thapsigargin 0.25
reporter_typeox_stressDDRER_stress
treatment_typeox_stressDDRER_stresscontrol
0.2
0.4
0.6
0.8
1

1374 Arch Toxicol (2017) 91:1367–1383
1 3
************
****************
Tunicamycin
*********
*
***************
**************
** * *********
0.00
0.50
1.00
BiP
Xbp
1Atf4
Cho
pKea
p1Nrf2
Srxn1
p53
53bp
1p2
1Btg2
0hr 24hr
(A)
(B) concentrationlowest
middle
highest
Atf4 BiP Btg2 Chop Keap1 Nrf2 p21 p53 53bp1 Srxn1 Xbp1
timeAfterExposure
resp
onse
CDDO
BFA
Thapsigargin
IAA
Etoposide
DMSO
DEM
Cisplatin0.00
0.50
1.00
0.00
0.50
1.00
0.00
0.50
1.00
0.00
0.50
1.00
0.00
0.50
1.00
0.00
0.50
1.00
0.00
0.50
1.00
0
0.00
0.50
1.00 ****** ** ******
******** *****
*******
**
**********
********* ********
******
**********
*************
****************** ** ****
***
************** ** * *** ******
******************
*****
****************
10 20 0 10 20 0 10 20 0 10 20 0 10 20 0 10 20 0 10 20 0 10 20 0 10 20 0 10 20 0 10 20
DMSO 1 μM Tg
DMSO 100 μM DEM
0hr 24hr24hr
DMSO 25 μM Etop.
1375Arch Toxicol (2017) 91:1367–1383
1 3
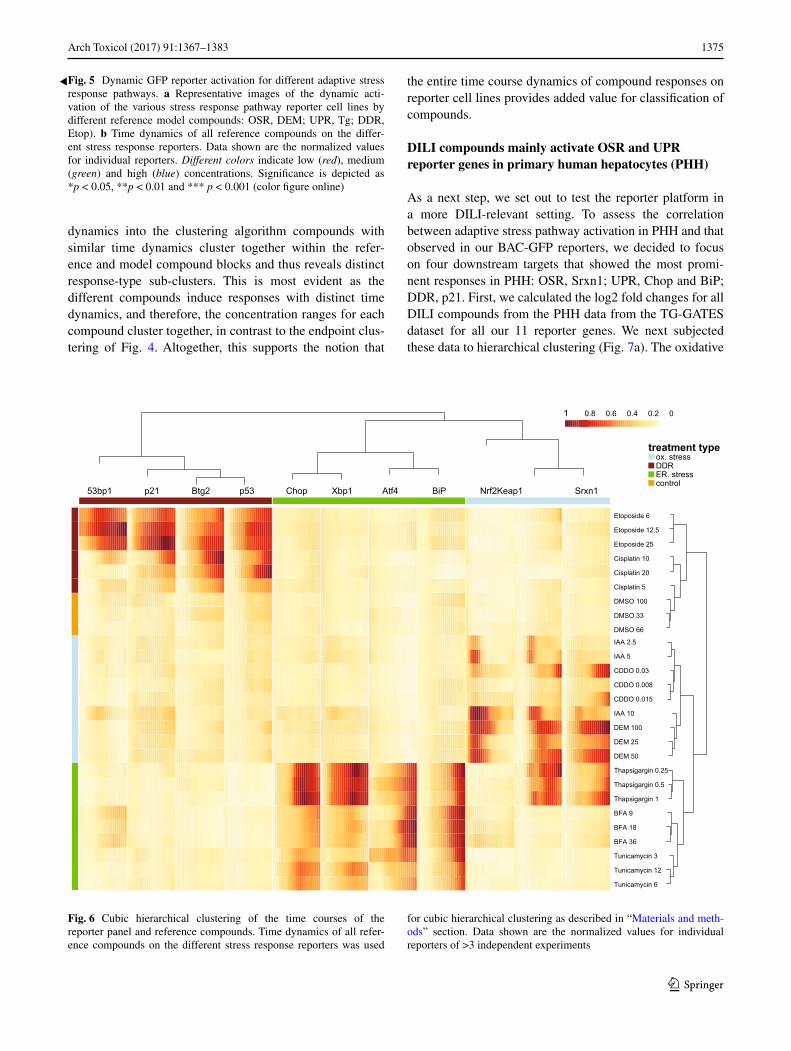
dynamics into the clustering algorithm compounds with similar time dynamics cluster together within the refer-ence and model compound blocks and thus reveals distinct response-type sub-clusters. This is most evident as the different compounds induce responses with distinct time dynamics, and therefore, the concentration ranges for each compound cluster together, in contrast to the endpoint clus-tering of Fig. 4. Altogether, this supports the notion that
the entire time course dynamics of compound responses on reporter cell lines provides added value for classification of compounds.
DILI compounds mainly activate OSR and UPR reporter genes in primary human hepatocytes (PHH)
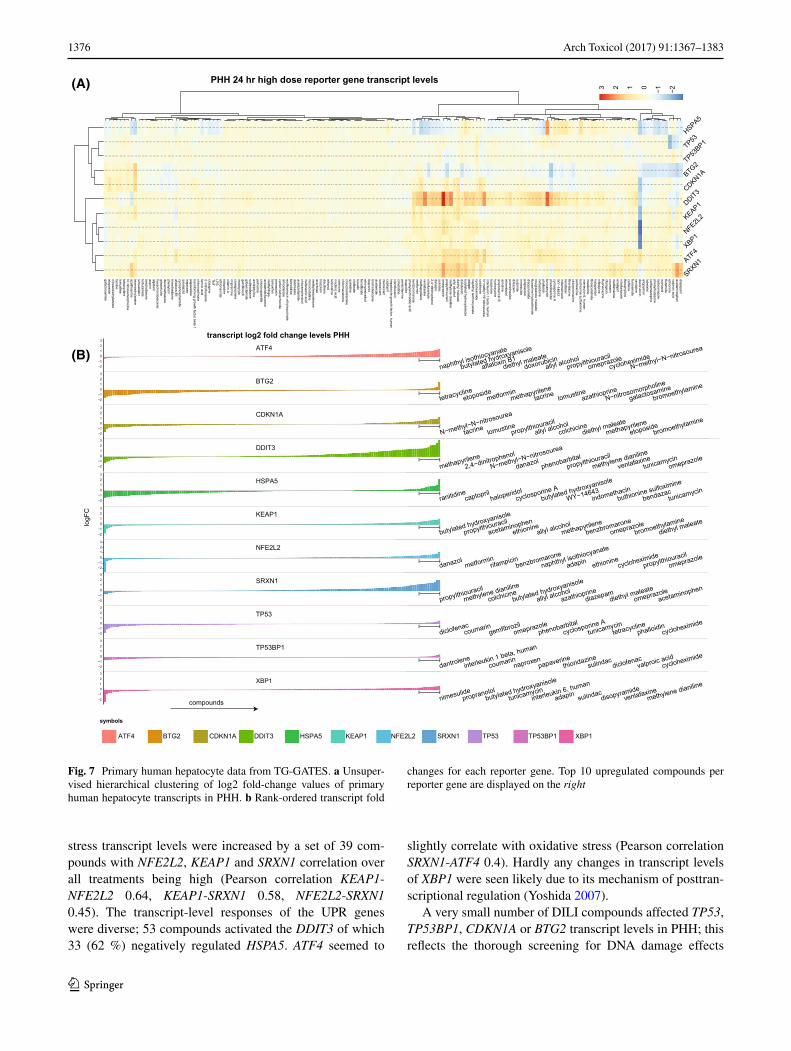
As a next step, we set out to test the reporter platform in a more DILI-relevant setting. To assess the correlation between adaptive stress pathway activation in PHH and that observed in our BAC-GFP reporters, we decided to focus on four downstream targets that showed the most promi-nent responses in PHH: OSR, Srxn1; UPR, Chop and BiP; DDR, p21. First, we calculated the log2 fold changes for all DILI compounds from the PHH data from the TG-GATES dataset for all our 11 reporter genes. We next subjected these data to hierarchical clustering (Fig. 7a). The oxidative
Fig. 5 Dynamic GFP reporter activation for different adaptive stress response pathways. a Representative images of the dynamic acti-vation of the various stress response pathway reporter cell lines by different reference model compounds: OSR, DEM; UPR, Tg; DDR, Etop). b Time dynamics of all reference compounds on the differ-ent stress response reporters. Data shown are the normalized values for individual reporters. Different colors indicate low (red), medium (green) and high (blue) concentrations. Significance is depicted as *p < 0.05, **p < 0.01 and *** p < 0.001 (color figure online)
Etoposide 6
Etoposide 12.5
Etoposide 25
Cisplatin 10
Cisplatin 20
Cisplatin 5
DMSO 100
DMSO 33
DMSO 66
IAA 2.5
IAA 5
CDDO 0.03
CDDO 0.008
CDDO 0.015
IAA 10
DEM 100
DEM 25
DEM 50
Thapsigargin 0.25
Thapsigargin 0.5
Thapsigargin 1
BFA 9
BFA 18
BFA 36
Tunicamycin 3
Tunicamycin 12
Tunicamycin 6
Srxn1Nrf2Keap1
treatment typeox. stressDDRER. stresscontrol
0.20.40.60.8 01
Atf4 BiPXbp1ChopBtg2p21 p5353bp1
Fig. 6 Cubic hierarchical clustering of the time courses of the reporter panel and reference compounds. Time dynamics of all refer-ence compounds on the different stress response reporters was used
for cubic hierarchical clustering as described in “Materials and meth-ods” section. Data shown are the normalized values for individual reporters of >3 independent experiments
◂
1376 Arch Toxicol (2017) 91:1367–1383
1 3
stress transcript levels were increased by a set of 39 com-pounds with NFE2L2, KEAP1 and SRXN1 correlation over all treatments being high (Pearson correlation KEAP1-NFE2L2 0.64, KEAP1-SRXN1 0.58, NFE2L2-SRXN1 0.45). The transcript-level responses of the UPR genes were diverse; 53 compounds activated the DDIT3 of which 33 (62 %) negatively regulated HSPA5. ATF4 seemed to
slightly correlate with oxidative stress (Pearson correlation SRXN1-ATF4 0.4). Hardly any changes in transcript levels of XBP1 were seen likely due to its mechanism of posttran-scriptional regulation (Yoshida 2007).
A very small number of DILI compounds affected TP53, TP53BP1, CDKN1A or BTG2 transcript levels in PHH; this reflects the thorough screening for DNA damage effects
−0.57
−0.17
−0.26
0.48
0.34
0.33
−0.33
−0.53
−0.59
0.05
0.02
−0.50
−0.13
−0.06
0.21
1.03
0.22
−0.17
0.08
−0.01
−0.03
0.17
−0.03
−0.16
−0.04
0.18
0.42
0.17
0.01
−0.09
0.16
−0.09
0.10
−0.26
−0.08
0.03
0.32
0.60
0.19
−0.04
0.11
−0.22
−0.06
0.03
−0.62
0.04
−0.08
0.33
0.67
−0.50
0.37
−0.06
−0.19
−0.10
0.41
−0.03
0.33
0.00
0.19
0.16
−0.23
0.15
0.17
0.05
0.06
0.15
−0.23
0.14
−0.07
0.60
0.58
−0.13
0.24
0.12
0.07
0.03
0.23
−1.02
0.03
0.07
0.34
0.50
−0.93
0.43
−0.01
−0.44
−0.02
1.55
−1.19
−0.09
−0.35
1.56
1.38
0.53
0.92
−0.14
−0.21
0.61
0.77
−0.01
−0.33
−0.06
−0.24
−0.26
−0.01
−0.11
0.07
0.35
−0.01
−0.01
−0.15
−0.12
−0.03
−0.31
−0.07
0.20
−0.01
0.00
0.36
0.13
0.07
−0.20
−0.05
0.01
−0.21
−0.34
0.27
0.07
−0.07
0.00
0.01
−0.03
0.02
0.03
−0.10
−0.33
−0.38
0.14
−0.04
0.17
0.04
0.21
0.05
−0.01
−0.16
−0.00
−0.40
−0.30
0.18
−0.13
0.02
0.05
0.18
0.05
−0.03
−0.07
0.08
−0.24
−0.27
0.11
0.03
0.08
−0.02
0.09
0.09
−0.20
−0.13
−0.18
−0.29
−0.60
−0.02
−0.02
−0.33
−0.08
0.03
−0.18
−0.36
0.12
0.01
−0.60
−0.29
0.12
−0.13
−0.17
0.21
0.44
0.08
−0.23
0.02
−0.00
−0.61
−0.56
−0.23
−0.02
0.03
0.08
0.02
0.01
−0.31
−0.21
0.05
−0.50
−0.33
−0.04
−0.15
−0.07
0.13
0.03
0.14
−0.76
0.14
−0.23
0.07
−0.65
0.25
−0.78
−0.41
−0.52
0.97
−0.36
−0.32
0.13
0.08
−0.24
−0.07
−0.05
0.26
0.18
0.07
0.29
0.30
−0.23
−0.13
−0.07
0.03
0.16
−0.14
0.17
0.01
−0.01
0.17
0.07
−0.22
0.03
0.15
−0.09
−0.04
−0.19
0.12
−0.05
−0.06
0.19
0.21
0.07
−0.13
0.17
−0.19
0.28
0.04
0.03
−0.22
0.15
0.48
−0.16
−0.18
−0.41
−0.02
−0.38
0.42
0.08
−0.04
0.09
0.02
0.41
0.01
−0.27
−0.25
−0.10
−0.11
0.27
0.32
0.22
0.18
0.21
0.45
0.16
−0.84
0.02
−0.05
−0.02
−0.29
0.36
0.12
0.13
0.16
0.23
0.17
−0.53
−0.07
−0.08
−0.39
−0.02
0.10
0.05
0.21
0.17
0.34
0.31
−0.83
−0.14
−0.15
−0.46
0.00
0.27
0.11
0.21
0.31
0.51
0.38
−0.75
−0.01
0.04
−0.19
0.20
−0.02
0.07
0.24
−0.09
0.38
−0.13
−0.77
−0.19
0.03
−0.51
−0.09
−0.24
0.01
0.05
0.10
0.06
−0.05
−0.52
−0.12
0.05
−0.20
−0.24
−0.15
−0.13
0.05
0.10
0.04
−0.36
0.24
0.15
0.07
−0.08
−0.03
0.20
0.08
0.20
0.29
0.02
0.10
0.17
0.01
−0.06
−0.07
−0.17
0.11
0.14
0.11
0.19
0.20
0.00
0.08
−0.07
−0.03
−0.09
0.04
0.17
0.03
0.13
0.16
0.15
0.08
0.08
−0.01
−0.03
−0.20
−0.07
0.19
0.08
0.18
0.26
0.11
0.09
−0.04
−0.14
0.07
−0.07
−0.02
0.19
0.18
0.19
0.16
0.16
0.54
0.19
0.18
−0.01
0.15
0.14
0.22
0.15
0.16
0.25
0.31
0.27
0.09
0.02
−0.09
0.06
−0.10
0.43
0.00
0.10
−0.02
0.03
−0.04
0.02
−0.03
−0.05
0.09
0.09
0.34
−0.07
0.06
−0.00
0.10
0.00
−0.09
−0.10
−0.04
−0.04
−0.13
0.18
−0.15
0.16
0.11
−0.03
0.02
−0.15
−0.01
0.04
−0.00
−0.01
−0.00
−0.10
0.20
0.14
0.02
0.01
0.02
0.01
0.06
−0.05
0.07
−0.04
−0.10
0.17
0.31
0.14
0.12
−0.10
−0.07
0.01
−0.04
−0.02
0.05
0.10
0.15
0.17
−0.02
0.13
−0.03
−0.02
−0.00
−0.09
0.05
0.01
0.02
0.09
0.13
0.04
0.05
0.01
−0.00
−0.00
−0.07
−0.06
0.05
0.03
0.11
0.26
0.08
0.09
0.01
−0.02
−0.07
−0.17
−0.06
0.22
−0.02
0.01
0.12
−0.02
0.23
−0.01
−0.06
0.04
−0.04
−0.03
0.20
−0.00
0.09
−0.06
0.04
0.14
−0.02
0.03
−0.04
−0.06
0.06
0.03
0.04
0.00
−0.00
0.01
0.04
0.11
0.01
−0.05
0.04
0.05
0.04
0.03
0.03
0.05
0.02
0.02
−0.01
−0.01
0.02
0.06
0.00
0.12
0.11
0.03
0.00
0.06
0.04
−0.00
0.10
0.12
0.00
−0.02
0.11
0.03
−0.02
0.04
0.01
0.08
−0.15
−0.01
−0.08
−0.12
0.07
−0.01
0.09
−0.00
0.04
0.02
0.14
−0.07
−0.06
0.02
−0.11
−0.06
0.08
0.13
0.03
0.02
0.19
0.00
0.07
0.02
−0.02
0.00
−0.06
−0.17
0.12
−0.08
0.06
−0.12
0.18
−0.02
0.12
0.02
0.10
0.07
−0.04
0.12
−0.10
−0.03
−0.11
0.09
−0.05
0.11
−0.01
−0.21
−0.02
−0.21
0.07
0.17
−0.02
−0.05
0.03
0.12
0.00
−0.05
−0.06
−0.10
0.01
0.02
−0.00
0.18
−0.06
−0.05
0.13
0.12
0.06
−0.23
−0.16
−0.06
−0.02
−0.04
0.01
0.06
0.07
0.14
−0.01
0.03
−0.19
−0.01
−0.01
0.17
−0.07
−0.07
−0.06
0.06
0.02
−0.09
−0.05
−0.16
−0.05
−0.12
−0.26
−0.07
−0.06
−0.06
−0.12
−0.11
−0.04
−0.10
0.05
−0.13
−0.12
−0.18
0.01
−0.04
−0.03
−0.00
−0.07
−0.14
−0.09
0.01
−0.03
−0.18
−0.17
0.16
0.09
−0.08
−0.02
−0.27
−0.14
−0.01
−0.18
−0.06
−0.08
−0.13
−0.01
0.02
0.05
0.07
−0.13
−0.03
−0.05
0.01
−0.18
−0.03
−0.06
0.07
−0.14
−0.04
0.18
−0.22
−0.20
−0.04
−0.12
−0.07
0.10
0.06
−0.03
−0.14
−0.07
0.03
0.00
−0.23
−0.01
−0.01
0.07
0.13
−0.02
−0.13
−0.06
−0.07
−0.03
0.08
−0.05
−0.01
−0.15
−0.07
0.04
−0.09
−0.12
−0.18
0.03
0.00
0.00
0.03
−0.04
−0.08
−0.05
−0.00
−0.07
−0.04
−0.08
−0.05
0.06
0.07
−0.04
−0.05
0.02
−0.04
−0.05
−0.03
−0.09
−0.09
−0.02
−0.00
−0.07
0.00
−0.01
−0.07
−0.10
0.04
0.02
−0.03
0.03
−0.05
−0.03
−0.08
0.06
0.04
−0.01
−0.05
0.04
−0.02
0.03
−0.05
−0.02
−0.10
−0.07
0.01
−0.05
−0.08
0.08
−0.02
−0.08
−0.02
0.01
−0.09
0.00
−0.13
−0.01
−0.09
0.07
−0.01
−0.02
−0.02
−0.01
−0.03
0.05
−0.02
−0.09
0.00
−0.10
−0.14
−0.16
−0.08
−0.01
−0.12
−0.08
−0.04
−0.01
−0.16
−0.01
0.07
−0.01
−0.19
−0.08
−0.06
−0.06
0.06
−0.07
−0.07
0.45
−0.12
0.09
−0.11
−0.42
−0.28
−0.19
−0.18
0.22
−0.26
−0.11
−0.08
−0.45
0.03
−0.21
−0.13
−0.23
0.18
−0.12
−0.18
−0.01
−0.07
−0.28
−0.11
0.02
−0.11
−0.19
−0.24
−0.16
−0.04
−0.26
−0.16
−0.12
−0.35
0.02
−0.06
−0.10
−0.21
−0.37
−0.07
−0.10
−0.03
−0.16
−0.14
−0.01
−0.08
−0.11
0.12
−0.02
−0.49
−0.07
−0.13
0.06
−0.34
0.20
−0.34
−0.11
0.07
−0.11
−0.29
−0.47
0.05
0.06
0.31
−0.14
0.18
−0.37
0.04
0.07
−0.34
0.09
−0.13
0.01
−0.11
0.39
−0.09
0.21
−1.02
0.13
−0.40
−0.23
0.27
1.11
0.88
0.60
0.08
0.53
0.77
−0.50
−0.26
−0.13
0.22
0.41
1.53
0.42
0.56
0.24
0.23
0.37
−1.26
−0.27
−0.22
0.31
0.97
1.58
0.81
0.49
0.40
0.48
0.64
−1.11
−0.16
−0.32
−0.42
0.15
2.30
0.04
0.33
0.68
0.34
0.30
−1.06
−0.24
−0.03
−0.99
−0.35
1.34
0.45
0.01
−0.01
0.50
0.92
−0.84
−0.29
−0.18
−0.17
0.29
1.62
0.40
0.24
0.36
0.72
0.71
−0.79
0.07
−0.02
−0.35
−0.05
1.56
0.23
0.50
0.40
0.53
0.82
−0.77
−0.07
0.29
−0.22
0.01
1.52
0.31
0.36
0.60
0.54
1.02
−0.67
0.26
−0.44
−0.49
0.39
3.29
0.88
1.24
0.42
1.25
2.06
−0.53
−0.16
−0.56
−1.14
0.72
1.83
0.59
0.87
0.21
1.15
1.29
−0.59
−0.28
−0.46
−0.48
0.06
2.32
0.40
0.50
0.79
0.93
1.34
−0.12
−0.37
−0.29
−0.29
0.72
0.54
0.77
0.20
0.12
1.15
1.41
−0.49
−0.08
−0.20
0.00
0.94
1.07
1.11
0.40
0.08
1.05
1.75
0.36
0.16
0.31
−0.98
−0.52
0.85
0.36
0.01
0.22
0.77
1.26
0.86
−0.12
0.09
−0.58
0.19
1.56
0.57
0.49
0.57
1.04
1.53
0.24
−0.07
−0.22
−0.66
−0.11
1.39
0.23
0.66
0.57
0.79
0.73
0.07
0.02
0.08
−0.21
−0.12
1.49
0.32
0.74
0.34
1.00
1.10
−0.02
0.63
0.55
0.13
0.40
1.09
0.02
0.80
−0.09
1.30
0.04
0.07
−0.67
−0.33
−0.53
0.94
1.37
−0.34
0.07
−0.19
0.51
1.31
−0.34
−0.02
−0.51
−0.30
0.60
2.19
−0.53
0.39
0.03
1.48
0.38
−0.56
−0.26
0.13
−0.56
−0.15
0.76
−0.11
0.17
0.25
0.31
−0.19
−0.64
0.07
0.10
−0.51
−0.31
0.79
−0.07
0.17
−0.07
0.42
0.30
−0.54
0.11
0.06
−0.14
−0.03
0.56
0.02
−0.06
−0.31
−0.18
−0.04
−0.51
−0.06
−0.01
−0.42
−0.08
0.60
−0.05
−0.06
−0.14
0.09
0.30
−0.55
−0.11
−0.08
−0.25
−0.00
0.49
0.15
0.08
0.13
0.05
0.15
−0.37
−0.16
−0.01
−0.18
−0.10
0.77
−0.02
0.10
0.12
0.19
0.26
−0.21
−0.07
−0.02
−0.13
−0.10
1.02
0.03
0.13
0.17
0.14
0.28
−0.19
−0.13
−0.08
−0.12
−0.09
0.47
−0.14
0.19
0.17
0.07
0.04
−0.33
−0.29
−0.17
−0.30
0.20
0.63
−0.01
0.27
0.34
0.03
0.03
−0.52
−0.09
−0.06
0.01
0.09
0.86
0.37
0.27
0.43
0.36
−0.10
−0.43
−0.33
−0.22
−0.44
0.17
0.92
−0.03
0.07
0.46
0.45
0.33
−0.41
−0.46
−0.13
−0.29
0.05
1.18
0.17
0.31
0.66
0.24
0.08
0.09
−0.25
−0.20
−0.60
−0.07
1.36
−0.16
0.22
0.11
0.55
0.37
−0.56
0.14
0.03
−0.51
0.07
1.43
0.07
0.26
0.29
0.70
0.35
−0.70
−0.12
−0.34
−0.55
−0.25
1.47
0.01
0.22
0.27
0.95
−0.31
−0.98
0.43
0.00
−0.21
−0.07
1.05
0.13
0.00
0.07
0.80
−0.02
2.22
0.30
−0.11
−0.52
−0.32
2.65
−0.03
0.10
0.54
0.68
0.42
0.09
0.26
−0.36
−1.46
−0.89
1.67
0.25
0.43
0.13
0.75
−0.61
0.72
0.27
0.01
−0.62
−0.34
1.24
−0.14
0.32
0.24
0.80
0.48
0.79
0.06
−0.09
−0.38
−0.37
1.26
0.24
0.24
−0.07
0.42
0.46
0.87
−0.03
−0.02
−0.68
−0.42
0.72
0.08
0.33
0.13
0.51
0.32
0.95
−0.11
−0.02
−0.37
−0.28
0.91
0.08
0.11
0.08
0.37
0.26
0.35
−0.07
0.18
−0.45
−0.59
0.49
−0.15
−0.18
−0.24
0.02
−0.04
0.11
−0.11
−0.10
−0.81
−0.59
0.54
0.02
−0.07
0.01
0.44
0.25
−0.05
0.00
−0.08
−0.32
−0.49
0.76
0.24
0.06
0.12
0.43
0.52
1.13
0.04
0.06
−0.11
−0.10
0.17
0.17
0.14
0.33
0.13
0.32
0.23
0.10
−0.02
−0.40
−0.28
0.49
−0.02
0.07
0.59
0.08
−0.14
0.18
−0.08
−0.02
−0.19
−0.14
0.72
0.00
0.22
0.22
0.05
−0.11
0.40
−0.02
0.05
−0.23
−0.07
0.23
0.11
0.02
0.09
0.26
0.19
0.49
−0.06
−0.01
−0.10
−0.09
0.48
−0.05
0.15
0.02
0.15
0.17
0.14
−0.22
0.04
−0.03
0.08
0.62
−0.00
0.16
−0.04
0.20
0.40
0.38
−0.19
−0.06
−0.19
−0.09
0.69
−0.04
0.29
0.25
0.31
0.31
0.16
−0.04
−0.09
−0.59
−0.10
0.09
0.19
0.58
0.21
0.42
0.34
−0.19
0.17
0.13
−0.44
−0.10
0.19
0.43
0.10
0.10
0.10
0.83
0.01
−0.53
−0.03
−0.50
−0.04
0.22
−0.10
0.24
−0.07
−0.03
1.09
−0.09
−0.19
0.03
−0.13
0.10
−0.38
0.12
−0.07
−0.20
−0.04
0.62
−0.08
−0.25
0.00
−0.10
0.07
−0.14
0.44
0.02
−0.15
0.07
0.86
0.16
−0.55
−0.29
0.07
0.20
−0.07
−0.23
0.01
0.05
0.78
0.24
−0.03
−0.61
−0.42
0.01
0.30
0.28
0.25
0.07
0.04
0.84
0.43
−0.02
−0.21
−0.09
0.06
0.26
0.71
0.44
0.15
−0.08
0.47
0.48
0.40
−0.43
−0.14
0.14
0.37
1.02
0.07
0.49
0.23
0.28
0.62
−1.35
0.09
−0.51
−0.62
−1.47
−1.17
−1.70
−2.62
−2.31
1.07
−0.66
−0.95
0.13
−0.08
−0.97
−0.64
−0.45
0.05
−0.01
0.33
0.22
−0.06
−0.64
−0.14
−0.19
−0.93
−0.48
−0.28
0.07
−0.08
0.18
0.12
0.34
−0.66
0.02
−0.03
−0.95
−0.55
−0.10
0.05
0.12
0.25
0.37
0.37
−1.01
−0.05
0.01
−0.96
−0.06
−0.17
0.11
0.17
−0.13
0.26
0.26
−1.12
−0.16
−0.03
−0.81
−0.27
0.04
0.20
−0.00
0.23
0.47
0.64
−0.88
−0.08
0.11
−0.85
−0.02
0.26
0.02
0.34
0.37
0.51
0.38
−0.98
0.10
−0.06
−0.82
−0.08
0.24
0.15
0.34
0.25
0.47
0.57
−0.33
−1.72
0.02
−1.02
0.31
−0.66
0.64
0.69
0.12
0.39
0.45
0.11
−1.02
0.46
−1.07
−0.32
−0.59
−0.68
−0.01
−0.32
−0.08
1.12
−0.57
−0.85
−0.24
−1.25
−0.49
−0.89
0.64
0.24
−0.85
−0.14
2.14
−0.76
−0.35
−0.16
−0.98
−0.34
0.05
0.04
0.08
−0.09
0.21
1.55
aflatoxin B1naphthyl isothiocyanate
butylated hydroxyanisole
diethyl maleatedoxorubicin
allyl alcoholpropylthiouracil
omeprazolecycloheximide
N−methyl−N−nitrosourea
tetracyclineetoposide
metforminmethapyrilene
tacrine lomustineazathioprine
galactosamineN−nitrosomorpholine
bromoethylamine
N−methyl−N−nitrosourea
tacrine lomustinepropylthiouracil
allyl alcoholcolchicine
diethyl maleatemethapyrilene
etoposidebromoethylamine
danazolmethapyrilene
2,4−dinitrophenol
phenobarbitalpropylthiouracil
N−methyl−N−nitrosourea
venlafaxinemethylene dianiline
tunicamycinomeprazole
ranitidinecaptopril
haloperidolcyclosporine A
WY−14643butylated hydroxyanisole
indomethacinbendazac
buthionine sulfoximine
tunicamycin
butylated hydroxyanisole
propylthiouracil
acetaminophenethionine
allyl alcoholmethapyrilene
benzbromarone
omeprazolebromoethylamine
diethyl maleate
danazolmetformin
rifampicinbenzbromarone
adapin ethioninenaphthyl isothiocyanate
cycloheximidepropylthiouracil
omeprazole
propylthiouracil
colchicinemethylene dianiline
allyl alcoholbutylated hydroxyanisole
azathioprinediazepam
diethyl maleateomeprazole
acetaminophen
diclofenaccoumarin
gemfibrozilomeprazole
phenobarbitalcyclosporine A
tunicamycintetracycline
phalloidincycloheximide
dantroleneinterleukin 1 beta, human
coumarinnaproxen
papaverinethioridazine
sulindacdiclofenac
valproic acidcycloheximide
nimesulidepropranolol
tunicamycinbutylated hydroxyanisole
adapininterleukin 6, human
sulindacdisopyramide
venlafaxinemethylene dianiline
PHH 24 hr high dose reporter gene transcript levels
galactosamine
etoposidenitrosodiethylam
inetacrinelom
ustinetetracyclineN
−nitrosomorpholine
azathioprinebrom
oethylamine
simvastatin
tolbutamide
benziodaroneaspirinalpidemhexachlorobenzenegriseofulvindexam
ethasonephenytointrim
ethadioneaflatoxin B
1cyclophospham
ideiproniazidnaproxenpapaverinetransform
ing growth factor beta 1
chlormadinone
tannic acid2−nitrofluoreneclozapineTN
FLP
Sethionam
ideticlopidinevitam
in Aim
ipramine
clomipram
inem
oxisylytegem
fibrozilglibenclam
idesulfasalazineam
itriptylinepem
olinechlorpropam
ideacetam
idofluorenem
ethyldopatam
oxifenphenacetincarbon tetrachlorideam
iodaroneerythrom
ycin ethylsuccinatefam
otidinedantroleneacetazolam
idechloram
phenicolm
efenamic acid
monocrotaline
methyltestosterone
acarbosetriazolamdisulfiramethanolterbinafinenicotinic acidrotenonechlorm
ezanonechlorpheniram
inequinidineclofibratebucetinfenofibrateethinylestradioltioproninbrom
obenzeneacetam
idelornoxicamm
eloxicamcaptoprilhepatocyte grow
th factor, human
ciprofloxacincim
etidinepenicillam
ineibuprofenphenylanthranilic acidbenzbrom
aronem
etformin
methapyrilene
venlafaxinenitrofurantoin2,4−dinitrophenoldanazolsulindacom
eprazolepropylthiouracilm
ethylene dianilineallyl alcoholdiethyl m
aleatediclofenacbutylated hydroxyanisoleadapinnaphthyl isothiocyanatecyclohexim
idecolchicineN
−methyl−N
−nitrosoureainterleukin 1 beta, hum
anbuspironehydroxyzineam
photericin Bajm
alineetham
b utolprom
ethazinediltiazemsulpiridenim
esulidepropranololdisopyram
idefluoxetine hydrochloriderosiglitazone m
aleatenefazodonephalloidintunicam
ycinphenobarbitalcyclosporine AW
Y−14643
indomethacin
bendazacthioridazinechlorprom
azineperhexilinebuthionine sulfoxim
ineinterleukin 6, hum
anm
exiletinethioacetam
idehaloperidolnifedipinefluphenazinerifam
picincoum
arinm
ethimazole
enalaprilnitrofurazonetheophyllinecaffeinefurosem
ideranitidinedoxorubicinallopurinollabetalolcarbam
azepinephenylbutazoneketoconazoleisoniazidflutam
ideethioninevalproic acidacetam
inophendiazepam
HSPA5
TP53
TP53BP1
BTG2
CDKN1A
DDIT3
KEAP1
NFE2L2
XBP1
ATF4
SRXN1
−2−10123
ATF4
−2−1
0123
−2−1
0123
−2−1
0123
CDKN1A
−2−1
0123
DDIT3
−2−1
0123
NFE2L2
−2−1
0123
SRXN1
−2−1
0123
TP53
−2−1
0123
TP53BP1
−2−1
0123
XBP1
−2−1
0123
KEAP1
−2−1
0123
logF
C
transcript log2 fold change levels PHH
BTG2
HSPA5
ATF4 BTG2 CDKN1A DDIT3 HSPA5 KEAP1 NFE2L2 SRXN1 TP53 TP53BP1 XBP1
symbols
compounds
(A)
(B)
Fig. 7 Primary human hepatocyte data from TG-GATES. a Unsuper-vised hierarchical clustering of log2 fold-change values of primary human hepatocyte transcripts in PHH. b Rank-ordered transcript fold
changes for each reporter gene. Top 10 upregulated compounds per reporter gene are displayed on the right

1377Arch Toxicol (2017) 91:1367–1383
1 3
of pharmaceuticals. A small cluster of compounds acti-vated the CDKN1A and BTG2 expression but not TP53 and TP53BP1.
To select a set of DILI compounds that selectively affects individual reporters, we rank-ordered the PHH fold-change transcript-level data for Srxn1, Chop, BiP and p21 and selected 10 compounds that originate from the top 12 ranked compounds as DILI-compound test set (Fig. 7b), in total resulting in 29 different DILI compounds that partly had overlap between downstream targets.
HepG2 reporters define temporal ranked adaptive stress response profiles of DILI‑relevant compounds
Next, we tested the 29 DILI compounds in the Srxn1-GFP, Chop-GFP, BiP-GFP and p21-GFP cell line. For compara-tive purposes, the same concentrations were used as in the PHH TG-GATES high-dose data. All four reporter cell lines were imaged live for 24 h (Supplemental Fig. 2). The result-ant reporter–response time courses were subjected to the same cubic hierarchical clustering, which led to several dis-tinct clusters of response types (Fig. 8). Different response types were defined based on the intensity of the response, the response type and the order of the response types. Based on the Srxn1-intensity level, clusters of no induc-tion (S-0), weak induction (S-1), middle induction (S-2) and strong induction (S-3) can be defined. The S-0 group of compounds includes a set of 7 treatments, which are nega-tive among all 4 reporters. The remaining S-0 treatments showed a weak p21 activation. The S-1 cluster of slightly increased Srxn1 levels is preceded by p21 activation, and in the case of cyclosporin A BiP-GFP levels increased mark-edly in time preceding Srxn1-GFP activation. Within the strong Srxn1 activation cluster (S-3), a subset of treatments oxidative stress co-occurred with p21 as well, most notably etoposide and colchicine. A distinct adaptive stress response profile was related to strong Chop-GFP induction by tacrine, omeprazole and thioridazine. However, no increase in BiP-GFP chaperone is evident, in contrast to azathioprine and sulindac, which have a low Chop-GFP activation, but a strong BiP-GFP activation. Finally, we assessed the positive co-occurrence of reporter gene activation between reporter transcript levels in PHH and GFP reporter levels in the four reporter cell lines. The correlation was 9/10 for Srxn1-GFP, 6/10 for p21-GFP and 2/10 for Chop-GFP and 2/10 for BiP-GFP (Supplementary Fig. 2).
Discussion
In the current study, we established a panel of fluores-cent protein reporter HepG2 cell lines using BAC clon-ing technology to follow the dynamics of several adaptive
stress response pathways essential in chemical-induced cytotoxicity. We focused on target genes that are central in the regulation of three key adaptive stress response programs; for each pathway, we successfully established reporters for the sensory machinery, downstream tran-scription factor and one of the transcription factors down-stream targets. Our results show that the adaptive stress response reporters are selective and sensitive to their cor-responding reference training compounds. Moreover, live cell imaging enabled us to define the temporal order of activation of the adaptive stress response programs initi-ated after chemical exposure. Furthermore, DILI-related compounds that are strong inducers of our selected adap-tive stress response pathways in PHH were positively identified in the HepG2 reporter cell models with Srxn1, Chop and p21.
Monitoring of adaptive stress response pathways as a predictive tool for chemical safety prediction has gained considerable attention in systems toxicology (Jennings et al. 2013; Wink et al. 2014). So far the approaches have largely been used as transcriptomic-based strategies (Jen-nings et al. 2013; Limonciel et al. 2015). Transcriptom-ics provides a comprehensive analysis to monitor cellular stress responses to chemicals at a single time point and average population level. The application of our GFP-based reporter cell lines as presented here, in conjunction with high-content live cell imaging, provides various advance-ments in chemical safety assessment that are not feasible with and/or complementary to transcriptomics. Firstly, we now can quantitatively assess the regulation of the entire adaptive stress response pathway irrespective of transcrip-tional regulation. Thus, we can monitor the modulation of upstream regulators such as Keap1 and 53bp1, which are constitutively expressed and translocate to the autophago-somes and DNA damage foci, respectively, upon activa-tion. Moreover, we can observe posttranslational regula-tion of reporter expression of in particular transcription factors due to protein stabilization, e.g., Nrf2, or p53, or alternative processing of mRNA (e.g., Xbp1). Secondly, our GFP-based reporters allow a more mechanistic evalu-ation of the relationship between stress pathway activation and cytotoxicity since we can follow the onset of stress responses at the real protein expression level, the cell physiology-relevant molecules in cells, in single cells with the subsequent assessment of cell viability (e.g., onset of necrosis or apoptosis). Thirdly, it is more cost- and tech-nically feasible to monitor the response in a high time resolution to determine temporal orders of stress pathway activation. It is of critical importance to define the detailed oscillatory dynamics from, e.g., NF-κB (Fredriksson et al. 2014) that are generally controlled by genetically defined negative feedback loops. Fourthly, the GFP reporters allow the possibility to assess the overall cell and cell organelle

1378 Arch Toxicol (2017) 91:1367–1383
1 3
S1
S0
S3
S2
Srxn1 p21 Chop BiP
0
0.2
0.4
0.6
0.8
1to
p10
PH
H S
rxn1
top1
0 P
HH
BiP
top1
0 P
HH
Cho
pto
p10
PH
H p
21 yes no
Etoposide 330
Colchicine 4000
Iodoacetamide 10
BHA 200
Sulindac 3000
Lomustine 120
DEM 1500
Azathioprine 73
APAP 5000
Allyl alcohol 70
Bromoethylamine 500
Phenobarbital 10000
BSO 10000
Diclofenac 400
Danazol 35
Indomethacin 200
DMSO 0.2
Captopril 1800
Fluphenazine 20
Cisplatin 20
WY−14643 150
Metformin 1000
DMSO 0.4
DMEM 0
Bendazac 200
Propylthiouracil 1800
Nefazodone 30
Venlafaxine 1200
Methapyrilene 600
2,4−dinitrophenol 100
Cyclosporin A 6
Thioridazine 15
Omeprazole 600
Tacrine 37
Tunicamycin 10
Thapsigargin 1

1379Arch Toxicol (2017) 91:1367–1383
1 3
morphological perturbations as well as foci formation from, e.g., autophagosomes or DDR repair foci (Wink et al. 2014).
In comparison with previous high-content imaging stud-ies, to our knowledge we developed the first high-content imaging assay able to monitor the response of cells to chemical exposure on a signaling level. Previous high-con-tent imaging studies were based on either cytotoxic param-eters such as cell death, ROS, mitochondrial potential and Ca2+-based dyes which measure toxic outcome measures and not the cellular responses that combat these adversities, or morphological features which capture morphological changes of cells or organelles and correlate these indirectly to mechanisms or classify morphology-based perturba-tions due to chemical exposure with the use of training data (Garside et al. 2014; Loo et al. 2007; Persson et al. 2013).
Our data indicate that our BAC-GFP-based reporter approach can clearly reveal subtle differences in the mode of action of compounds. Our UPR reference compounds thapsigargin and tunicamycin both induced the onset of two key UPR reporters, e.g., Chop-GFP and BiP-GFP, to a sim-ilar extent and with a similar temporal profile (see Fig. 5). Yet, while thapsigargin also induced a strong induction of the Srxn1 reporter, tunicamycin did not. Thapsigargin causes ER-stress due to its inhibition of the SARC/ER Ca2+ ATPase, thereby lowering Ca2+ levels in the lumen of the ER. Tunicamycin blocks protein glycosylation in the ER. While both conditions initiate the UPR response, ER cal-cium perturbations also induce an oxidative stress response. Yet, the latter response is different from compounds that directly target protein thiols, including iodoacetamide and DEM; although thapsigargin caused Keap1-GFP foci for-mation, this was not associated with a strong accumula-tion of Nrf2-GFP, which is observed with iodoacetamide and DEM. These results clearly illustrate the strength of the temporal single-cell live cell analysis of adaptive stress responses for mode-of-action clarification. Likewise, such reporter systems may also contribute to the adverse out-come pathway (AOP) toolbox and as such quantify the acti-vation of individual key events that reflect and are critical in toxicological-relevant AOPs (Ankley et al. 2010).
An important asset of our reporter systems is the tem-poral information on the activation of cellular defense pro-grams after toxicological insult. This allows the definition
of a detailed stress-response fingerprint for individual compounds. Since our method also marks the onset of cell death, this would include the identification of a point-of-no-return or tipping point, reflecting both the concentra-tion and time point after which a certain fraction of cells dies because the defensive programs cannot cope with the level of stress induced by the toxicant. Together, the acti-vation of certain adaptive stress response programs, the order of activation of these programs, the concentration or time after which the tipping point is reached will be of great benefit for risk assessment early in the toxicity test-ing pipeline and for realization of more mechanistically defined AOPs.
An important feature of our reporter cell systems is that we can detect DILI compound stress responses that are observed in primary human hepatocytes. For a proof of con-cept, we concentrated on four downstream target genes for oxidative stress (Srxn1), UPR (BiP, Chop) and DDR (p21). We observed a strong concordance for in particular Srxn1-GFP and p21-GFP reporters and a reduced concordance for the BiP-GFP and Chop-GFP reporters. This suggests that our HepG2 reporter models translate well to responses in PHH. This is in particular of interest since the PHH responses were based on transcriptomics and not protein expression. Our finding would be in agreement with recent observations that the onset of cytotoxicity caused by a broad set of DILI compounds is comparable between HepG2 and PHH (Park and Goldring, personal communication). Dis-crepancies between PHH and HepG2 reporters could be due to this difference, since it is established that the corre-lation between transcriptomics and proteomics in the same model does not correlate well. Alternatively, ADME and/or cell physiological differences between HepG2 reporters and PHH could explain the differences. The Srxn1-GFP reporter showed the highest concordance with PHH, also suggesting a conservation of the Keap1/Nrf2/Srxn1 pathway activation in HepG2 cells compared to PHH.
We have established our reporters in HepG2 cells. The adaptive stress response pathways that we have incor-porated in these cells are not specific to liver cells and involved in the regulation of toxicity in most if not all cells in the body, albeit most likely with different set points. As such, our HepG2 reporters could be representative for gen-eral toxicity. Induced pluripotent stem cell technology in combination with genetic recombineering strategies will allow the integration of the GFP reporters in iPSC followed by the differentiation in any cell type. This would open the way for the assessment of the adaptive stress pathway acti-vation in any differentiated cell type as well as the precise quantitative understanding of the differences in control and activation between the various cell types in a same genetic background.
Fig. 8 Effect of selected DILI test compounds on stress response acti-vation. DILI compound selection origin is labeled black (left legend), 24-h time course corresponds to the 4 individual columns, each col-umn representing a time course for 1 of 4 reporter cell lines. Response magnitude is labeled as orange intensity and according to the legend (top right). Compounds and concentrations are displayed as rows and labeled on the right. The time course profiles were subjected to cubic clustering as described in “Materials and methods” section (color fig-ure online)
◂

1380 Arch Toxicol (2017) 91:1367–1383
1 3
In conclusion, we established a robust high throughput imaging-based platform for the single-cell assessment of adaptive stress response pathway activation in a tempo-ral fashion. This platform can contribute to a mechanism-based chemical safety assessment in both an industry and regulatory setting.
Materials and methods
Reagents
All compound drugs were acquired from Sigma-Aldrich, except for cisplatin (Ebewe), CDDO-Me (kind gift from Dr. Ian Copple, University of Liverpool), bendazac (kind gift from Dr. Anita Dankers, Janssen Pharmaceutics), met-formin (MIP DILI consortium), propylthiouracil, captopril, tacrine, thioridazine, azathioprine and sulindac (all a kind gift from Dr. Weida Tong, NCTR-FDA). All compounds were freshly dissolved in DMSO, except for metformin, venlafaxine, methapyrilene, fluphenazine, buthionine sul-foximine, bromoethylamine, lomustine (all PBS), acetami-nophen, 2,4-dinitrophenol and phenobarbital (all DMEM).
Cell culture
Human hepatoma HepG2 cells were acquired from ATCC (clone HB8065) and maintained and exposed to drugs in DMEM high glucose supplemented with 10 % (v/v) FBS, 25U/mL penicillin and 25 μg/mL streptomycin. The cells were used between passage 5 and 20. For live cell imaging, the cells were seeded in Greiner black μ-clear 384 wells plates, at 20,000 cells per well.
Generation of GFP‑tagged cell lines
Human KEAP1, NFE2L2 (Nrf2), CDKN1A (p21), TP53 (p53), BTG2, TP53BP1 (53bp1), XBP1, DDIT3 (Chop), ATF4, HSPA5 (BiP) and mouse SRXN1 BAC clones were selected and GFP-tagged as described previously (Poser et al. 2008b) and stably introduced into HepG2 cells by transfection and 500 μg/ml G-418 selection. At least 20 of the monoclonal BAC-transfected HepG2 colonies were separately grown out, and GFP-positive clones suitable for imaging were selected to complement the BAC-GFP stress response reporter platform.
RNA interference
siRNAs against human NFE2L2 (NRF2), TP53 (P53), ATF4, ATF6 and EIF2AK3 (PERK) were acquired from Dharmacon (Thermo Fisher Scientific) as siGENOME SMARTpool reagents, as well as in the form of four
individual siRNAs. HepG2 cells were transiently trans-fected with the siRNAs (50 nM) using INTERFERin (Poly-plus) as described previously (Fredriksson et al. 2011).
Western blotting
Samples were collected by direct cell lysis (including pel-leted apoptotic cells) in 1× sample buffer supplemented with 5 % v/v β-mercaptoethanol and heat-denatured at 95 °C for 10 min. The separated proteins were blotted onto PVDF membranes before antibody incubation in 1 % BSA in TBS-Tween20. Antibodies: mouse-anti-GFP (Roche) and mouse-anti-tubulin (Sigma) and mouse-anti-GAPDH (Santa Cruz), all antibodies were diluted 1000 times. Horseradish peroxidase detection was performed by Pierce® ECL (Thermo Scientific) using the Image-Quant LAS4000 (GE HealthCare). Cy5 was detected by the ImageQuant LAS4000 (GE HealthCare).
Microscopy
Accumulation of target protein-GFP levels, localization or foci formation and propidium iodide staining was moni-tored using a Nikon TiE2000 confocal laser microscope (lasers: 561, 488 and 408 nm), equipped with an automated stage and perfect focus system. Prior to imaging at 20× magnification and either 1X, 2X or 4X zoom, HepG2 cells were loaded for 45 min with 100 ng/mL Hoechst 33342 to visualize the nuclei, upon which the Hoechst-containing medium was washed away to avoid Hoechst phototoxicity (Purschke et al. 2010). After Hoechst-33342 staining, com-pound exposure was conducted, followed by automated 24-h live cell confocal imaging. The time interval was dependent on the required resolution for the corresponding reporter cell line and on the number of reporter types plated simultaneously on the imaging plates. Cell death was deter-mined by monitoring the accumulation of PI stained cells after a 24-h time period.
Quantitative image analysis
Image quantification was performed with CellProfiler ver-sion 2.1.1 (Kamentsky et al. 2011) with an in-house devel-oped module implementing the watershed masked algorithm for segmentation (Di et al. 2012). The watershed separates an image in regions with single cells followed by pixel clas-sification for each region as fore- or background, and this method performs well detecting the Hoechst33342 stained nuclei of the closely packed HepG2 cells. The binary mask containing the segmented nuclei was fed to the identify-primary-objects module, overlap-based-tracking module and intensity-nuclei-size-shape-measurement modules of CellProfiler. For the cytosol location of the Srxn1-GFP,

1381Arch Toxicol (2017) 91:1367–1383
1 3
Btg2-GFP and BiP-GFP reporters, the nuclear objects were used as seeds for the identify-secondary-objects module set to a propagation method with the MCT algorithm on adap-tive (window size approximately 20 pixels) segmentation. The Keap1-GFP and 53bp1-GFP reporters are based on foci detection. The nuclei are segmented and used as seeds for the cytosol identification using the cytosolic GFP signal for the Keap1-GFP cell line. The foci detection is performed with the FociPicker3D plug-in (Du et al. 2011) in ImageJ, and each individual focus is assigned to either the nuclei (for 53bp1) or cytosol (Keap1) using the CellProfiler assign par-ent–child relationship module. The p21, p53, Nrf2, Xbp1, Atf4 and Chop reporters are based on quantifying the GFP signal in the nuclei. The nuclei signal is segmented, and these regions are directly used to quantify the GFP intensity. Segmentation results were stored as PNG files for quality control purposes, and CellProfiler pipelines were stored for reproducibility. Image analysis results were stored on the local machine as HDF5 files.
Data analysis
Data analysis, quality control and graphics were performed using the in-house developed R package H5CellProfiler (Wink, manuscript in preparation). The features of interest were extracted from the HDF5 files and further analyzed using the graphical user interface of the H5CellProfiler package. The mean of single-cell features for each com-pound, concentration, cell line and replicate combination was calculated. To account for PI background staining and noise, the segmented PI segmentations were masked by a 2 pixel dilated nuclei. The area of these nuclei and the PI were divided to obtain the cell death stain to cell area ratio. These ratios were filtered to be at least 10 % of the cell size, and following this procedure, each cell was either flagged as alive or dead in the final time point of the 24 live imaging sessions. In this manner, the fraction of dead cells could be accurately determined. All resultant summarized data were stored as tab-delimited text files and further processed for normalization and graphical presentation using R.
Scaling and plate normalization
For model compound dataset, the different imaging meas-ures were standardized by scaling (i.e., mean or sum of intensity measures, foci counts), and scaling was used for each plate—cell line combination:
For the DILI compound dataset, the fraction of GFP-posi-tive cells was determined to increase sensitivity of the assay. A GFP-positive cell was defined as minimally twice the
xscaled =x − xmin
xmax − xmin
DMSO—control background level. No scaling was used for the GFP-positive fraction measures. The total imaging time and time intervals for the different plates and repli-cates varied; thus, for statistical analysis and plate normali-zation regression was performed using the ‘lm’ function of the ‘stats’ package. Natural spline regression with 6 degrees of freedom was performed using the ‘ns’ function of the ‘splines’ package. The additional linear constraints of the natural spline algorithm at the predictor boundaries allowed a stable extrapolation of the total time to equal length for all plates. Twenty-four equidistant time points for each condi-tion were sampled from the model and subjected to quantile normalization to equalize the distributions for each plate.
Statistical analysis
The quantile normalized data were subjected to statistical significance tests with the following set of formulae; the mean over the replicates for the DMSO controls for each reporter rp and time point tp:
The difference x_diff between the DMSO means and treatments normalized with standard errors at each reporter rp, treatment tr and time point tp. With the stand-ard errors:
The standard error over the replicates of the DMSO con-trols, for each reporter and time point:
The standard error over the replicates, for each reporter, treatment and time point:
The mean residual standard error, with resid the residu-als from the regression, for each replicate, reporter and treatment. This ensures the variance from the raw data is included in the statistical analysis.
Finally, for each replicate, reporter and treatment, the mean difference over time meanDiff is calculated:
x̄DMSO(rp, tp) =1
repl
repl∑
r=1
xDMSO(rp, tp)
xdiff(repl, rp, tr, tp) =x − x̄DMSO
√
σ 2DMSO + σ 2
DMSO,resid + σ 2tr + σ 2
tr,resid
σxDMSO(rp, tp) = sd(xDMSO(rp, tp))
σx(rp, tr, tp) = sd(x(rp, tr, tp))
σx̂,resid(repl, rp, tr) =
√
(∑
tp (resid(repl, rp, tr ))2
dftp − 1
)
xmeanDiff(repl, rp, tr) =1
tp
tp∑
tp=1
x(repl, rp, tr)

1382 Arch Toxicol (2017) 91:1367–1383
1 3
A two-sample one-sided Student’s t tests between the meanDiff values of matched DMSO control replicates and treatment replicates were performed. A one-sided test was chosen as we are only interested in positive responses with respect to our DMSO controls. To control for the p value gained by using a one-sided test, all p values were multi-plied by 2.
In summary, the average and standard error for each point in time of the quantile normalized values were cal-culated over the replicates for DMSO. The distance of the treatments to the DMSO mean at each point was determined and normalized by four standard error terms; the standard error of the treatment replicates, the DMSO replicates and the mean residual standard error of the regression analysis for the treatments and controls. The mean difference over time was calculated, followed by a one-sided Student’s t test to determine whether the replicate treatment curves were significantly different in the positive direction compared to the DMSO control replicates.
Cluster analysis
Cluster analysis was performed using the ‘dist’ and ‘hclust’ functions from the ‘stats’ package from the base R distri-bution. For all cluster analysis, the distance metric was ‘euclidean’ and clustering algorithm ‘complete.’ The clus-tering of the time curve data required clustering of an extra dimension (time). All pairwise time curve distances were computed. The mean distances per compound–com-pound and reporter–reporter combinations were calculated, reduced the dimensions to 2 and used as input for the clus-tering algorithm.
Data representation
All HCI data representations were generated or modi-fied with Illustrator CS6, Fiji, ggplot2 (Wickham 2009), the aheatmap function of the NMF package (Gaujoux and Seoighe 2010). For response data clustering, the equidistant sample time profile features from the b-spline model were used to calculate a distance matrix for each feature sepa-rately using Euclidean distance. A mean distances matrix was calculated and subjected to clustering with the ward.D method of the hclust function.
Gene expression analysis
CEL files were downloaded from the Open TG-GATEs database: ‘Toxicogenomics Project and Toxicogenomics Informatics Project under CC Attribution-Share Alike 2.1 Japan’ http://dbarchive.biosciencedbc.jp/en/open-tggates/desc.html. Probe annotation was performed using the hthgu133pluspmhsentrezg.db package version 17.1.0,
and Probe mapping was performed with hthgu133plusp-mhsentrezgcdf downloaded from NuGO (http://nmg-r.bioinformatics.nl/NuGO_R.html). Probe-wise back-ground correction (Robust Multi-Array Average expres-sion measure), between-array normalization within each treatment group (quantile normalization) and probe set summaries (median polish algorithm) were calculated with the rma function of the Affy package (Affy package, version 1.38.1 (Irizarry et al. 2003). The normalized data were statistically analyzed for differential gene expression using a linear model with coefficients for each experi-mental group within a treatment group. (Smyth 2004; Wolfinger et al. 2001). A contrast analysis was applied to compare each exposure with the corresponding vehicle control. For hypothesis testing, the empirical Bayes sta-tistics for differential expression was used followed by an implementation of the multiple testing correction of Ben-jamini and Hochberg (1995) using the LIMMA package (Smyth 2004).
Acknowledgments This work was supported by a grant from IMI MIP DILI project grant agreement number 115336 and the EU FP7 Seurat-1 Detective project grant agreement number 266838.
Open Access This article is distributed under the terms of the Crea-tive Commons Attribution 4.0 International License (http://crea-tivecommons.org/licenses/by/4.0/), which permits unrestricted use, distribution, and reproduction in any medium, provided you give appropriate credit to the original author(s) and the source, provide a link to the Creative Commons license, and indicate if changes were made.
References
Ankley GT, Bennett RS, Erickson RJ et al (2010) Adverse outcome pathways: a conceptual framework to support ecotoxicology research and risk assessment. Environ Toxicol Chem 29(3):730–741. doi:10.1002/etc.34
Benjamini Y, Hochberg Y (1995) Controlling the false discovery rate: a practical and powerful approach to multiple testing. J Roy Stat-ist Soc B 57:289–300
d’Adda di Fagagna F, Reaper PM, Clay-Farrace L et al (2003) A DNA damage checkpoint response in telomere-initiated senescence. Nature 426(6963):194–198. doi:10.1038/nature02118
Di Z, Herpers B, Fredriksson L et al (2012) Automated analysis of NF-kappaB nuclear translocation kinetics in high-through-put screening. PLoS One 7(12):e52337. doi:10.1371/journal.pone.0052337
Du G, Drexler GA, Friedland W et al (2011) Spatial dynamics of DNA damage response protein foci along the ion trajectory of high-LET particles. Radiat Res 176(6):706–715
Fredriksson L, Herpers B, Benedetti G et al (2011) Diclofenac inhib-its tumor necrosis factor-alpha-induced nuclear factor-kappaB activation causing synergistic hepatocyte apoptosis. Hepatology 53(6):2027–2041. doi:10.1002/hep.24314
Fredriksson L, Wink S, Herpers B et al (2014) Drug-induced endo-plasmic reticulum and oxidative stress responses independently sensitize toward TNFalpha-mediated hepatotoxicity. Toxicol Sci 140(1):144–159. doi:10.1093/toxsci/kfu072

1383Arch Toxicol (2017) 91:1367–1383
1 3
Garside H, Marcoe KF, Chesnut-Speelman J et al (2014) Evaluation of the use of imaging parameters for the detection of compound-induced hepatotoxicity in 384-well cultures of HepG2 cells and cryopreserved primary human hepatocytes. Toxicol In Vitro 28(2):171–181. doi:10.1016/j.tiv.2013.10.015
Gaujoux R, Seoighe C (2010) A flexible R package for non-negative matrix factorization. BMC Bioinform 11:367. doi:10.1186/1471-2105-11-367
Girinsky T, Koumenis C, Graeber TG, Peehl DM, Giaccia AJ (1995) Attenuated response of p53 and p21 in primary cultures of human prostatic epithelial cells exposed to DNA-damaging agents. Cancer Res 55(17):3726–3731
Gulow K, Bienert D, Haas IG (2002) BiP is feed-back regulated by control of protein translation efficiency. J Cell Sci 115(Pt 11):2443–2452
Hendriks G, Atallah M, Morolli B et al (2012) The ToxTracker assay: novel GFP reporter systems that provide mechanistic insight into the genotoxic properties of chemicals. Toxicol Sci 125(1):285–298. doi:10.1093/toxsci/kfr281
Herpers B, Wink S, Fredriksson L et al (2015) Activation of the Nrf2 response by intrinsic hepatotoxic drugs correlates with suppression of NF-kappaB activation and sensitizes toward TNFalpha-induced cytotoxicity. Arch Toxicol. doi:10.1007/s00204-015-1536-3
Hetz C, Chevet E, Oakes SA (2015) Proteostasis control by the unfolded protein response. Nat Cell Biol 17(7):829–838. doi:10.1038/ncb3184
Irizarry RA, Hobbs B, Collin F et al (2003) Exploration, normali-zation, and summaries of high density oligonucleotide array probe level data. Biostatistics 4(2):249–264. doi:10.1093/biostatistics/4.2.249
Itoh K, Tong KI, Yamamoto M (2004) Molecular mechanism acti-vating Nrf2-Keap1 pathway in regulation of adaptive response to electrophiles. Free Radic Biol Med 36(10):1208–1213. doi:10.1016/j.freeradbiomed.2004.02.075
Jennings P, Limonciel A, Felice L, Leonard MO (2013) An overview of transcriptional regulation in response to toxicological insult. Arch Toxicol 87(1):49–72. doi:10.1007/s00204-012-0919-y
Kamentsky L, Jones TR, Fraser A et al (2011) Improved structure, function and compatibility for cell profiler: modular high-throughput image analysis software. Bioinformatics 27(8):1179–1180. doi:10.1093/bioinformatics/btr095
Kim R, Emi M, Tanabe K, Murakami S (2006) Role of the unfolded protein response in cell death. Apoptosis 11(1):5–13. doi:10.1007/s10495-005-3088-0
Knasmuller S, Mersch-Sundermann V, Kevekordes S et al (2004) Use of human-derived liver cell lines for the detection of environ-mental and dietary genotoxicants; current state of knowledge. Toxicology 198(1–3):315–328. doi:10.1016/j.tox.2004.02.008
Lau A, Tian W, Whitman SA, Zhang DD (2013) The predicted molec-ular weight of Nrf2: it is what it is not. Antioxid Redox Signal 18(1):91–93. doi:10.1089/ars.2012.4754
Lee DH, Acharya SS, Kwon M et al (2014) Dephosphorylation ena-bles the recruitment of 53BP1 to double-strand DNA breaks. Mol Cell 54(3):512–525. doi:10.1016/j.molcel.2014.03.020
Li L, Hu GK (2015) Pink1 protects cortical neurons from thapsigar-gin-induced oxidative stress and neuronal apoptosis. Biosci Rep. doi:10.1042/BSR20140104
Limonciel A, Moenks K, Stanzel S et al (2015) Transcriptomics hit the target: monitoring of ligand-activated and stress response pathways for chemical testing. Toxicol In Vitro. doi:10.1016/j.tiv.2014.12.011
Lin Z, Will Y (2012) Evaluation of drugs with specific organ tox-icities in organ-specific cell lines. Toxicol Sci 126(1):114–127. doi:10.1093/toxsci/kfr339
Loo LH, Wu LF, Altschuler SJ (2007) Image-based multivari-ate profiling of drug responses from single cells. Nat Methods 4(5):445–453. doi:10.1038/nmeth1032
Maness SC, McDonnell DP, Gaido KW (1998) Inhibition of androgen receptor-dependent transcriptional activity by DDT isomers and methoxychlor in HepG2 human hepatoma cells. Toxicol Appl Pharmacol 151(1):135–142. doi:10.1006/taap.1998.8431
Mazur W, Lindholm P, Vuorinen K, Myllarniemi M, Salmenkivi K, Kinnula VL (2010) Cell-specific elevation of NRF2 and sulfire-doxin-1 as markers of oxidative stress in the lungs of idiopathic pulmonary fibrosis and non-specific interstitial pneumonia. APMIS 118(9):703–712. doi:10.1111/j.1600-0463.2010.02646.x
Persson M, Loye AF, Mow T, Hornberg JJ (2013) A high content screening assay to predict human drug-induced liver injury dur-ing drug discovery. J Pharmacol Toxicol Methods 68(3):302–313. doi:10.1016/j.vascn.2013.08.001
Poser I, Sarov M, Hutchins JR et al (2008a) BAC TransgeneOmics: a high-throughput method for exploration of protein function in mammals. Nat Methods 5(5):409–415. doi:10.1038/nmeth.1199
Poser I, Sarov M, Hutchins JR et al (2008b) BAC TransgeneOmics: a high-throughput method for exploration of protein function in mammals. Nat Methods 5(5):409–415. doi:10.1038/nmeth.1199
Purschke M, Rubio N, Held KD, Redmond RW (2010) Phototoxicity of Hoechst 33342 in time-lapse fluorescence microscopy. Photo-chem Photobiol Sci 9(12):1634–1639. doi:10.1039/c0pp00234h
Reed M, Woelker B, Wang P, Wang Y, Anderson ME, Tegtmeyer P (1995) The C-terminal domain of p53 recognizes DNA damaged by ionizing radiation. Proc Natl Acad Sci USA 92(21):9455–9459
Reinke V, Lozano G (1997) Differential activation of p53 targets in cells treated with ultraviolet radiation that undergo both apopto-sis and growth arrest. Radiat Res 148(2):115–122
Smyth GK (2004) Linear models and empirical Bayes methods for assessing differential expression in microarray experiments. Stat Appl Genet Mol Biol 3(1). doi:10.2202/1544-6115.1027
Stevens JL, Baker TK (2009) The future of drug safety testing: expanding the view and narrowing the focus. Drug Discov Today 14(3–4):162–167. doi:10.1016/j.drudis.2008.11.009
Takayanagi S, Fukuda R, Takeuchi Y, Tsukada S, Yoshida K (2013) Gene regulatory network of unfolded protein response genes in endoplasmic reticulum stress. Cell Stress Chaperones 18(1):11–23. doi:10.1007/s12192-012-0351-5
Venugopal R, Jaiswal AK (1998) Nrf2 and Nrf1 in association with Jun proteins regulate antioxidant response element-mediated expression and coordinated induction of genes encoding detoxi-fying enzymes. Oncogene 17(24):3145–3156. doi:10.1038/sj.onc.1202237
Vinken M (2013) The adverse outcome pathway concept: a pragmatic tool in toxicology. Toxicology 312:158–165. doi:10.1016/j.tox.2013.08.011
Wickham H (2009) ggplot2: elegant graphics for data analysis. Springer, New York. doi:10.1007/978-0-387-98141-3
Wink S (In prep) H5CellProfiler; single-cell high-content image and data analysis on a single desktop
Wink S, Hiemstra S, Huppelschoten S et al (2014) Quantitative high content imaging of cellular adaptive stress response pathways in toxicity for chemical safety assessment. Chem Res Toxicol 27(3):338–355. doi:10.1021/tx4004038
Wolfinger RD, Gibson G, Wolfinger ED et al (2001) Assessing gene significance from cDNA microarray expression data via mixed models. J Comp Biol 8(6):625–637
Yang L, Calingasan NY, Thomas B et al (2009) Neuroprotec-tive effects of the triterpenoid, CDDO methyl amide, a potent inducer of Nrf2-mediated transcription. PLoS One 4(6):e5757. doi:10.1371/journal.pone.0005757
Yoshida H (2007) Unconventional splicing of XBP-1 mRNA in the unfolded protein response. Antioxid Redox Signal 9(12):2323–2333. doi:10.1089/ars.2007.1800
Related Documents