No. 182 January 2020 HHL Working Paper External Assurance and Transparency in CSR Reporting European Evidence Carl W. Weuster a , Philipp B. Ottenstein b , Sébastien Jost b , Sophie Winter b a Research Associate at the Chair of Accounting and Auditing at HHL Leipzig Graduate School of Management, Leipzig, Germany. Email: [email protected] b Research Associate at the Chair of Accounting and Auditing at HHL Leipzig Graduate School of Management, Leipzig, Germany. The spread of CSR reporting is accompanied by an increase of external assurance. Firms are employing assurance to signal the credibility of their CSR reports towards stakeholders and im- prove their reputation. Whether this practice is socially and economically beneficial remains up for debate. The research question of this paper concerns whether external assurance is associ- ated with transparency in CSR reports. A panel data model is used to investigate the empirical relationship of external assurance and three indicators of transparency: reporting scope as an indicator for completeness, readability as an indicator for clarity and optimism as an indicator for reporting balance, with the latter two proxies derived from text analysis. We find an ambiguous relationship between external assurance and reporting transparency: External assurance is positively related to reporting scope and negatively to optimism and rea- dability. This study adds to the scarce literature on external assurance for CSR reporting. We contribute one of the first investigations on how external assurance relates to linguistic aspects of CSR reporting transparency. Acknowledgement: The authors thank Saskia Erben, Benjamin Hammer and Henning Zülch for helpful comments and discussions, the participants of the 4th and 5th RIC Conferences 2018 and 2019 at HHL Leip- zig Graduate School of Management for their comments, and, Nazife Bayraktar, Lena Geßner, Carsten Lendeckel, Lucas Seiler and Martin Wolf for their research assistance. The usual caveat applies.

Welcome message from author
This document is posted to help you gain knowledge. Please leave a comment to let me know what you think about it! Share it to your friends and learn new things together.
Transcript

No. 182 January 2020
HHL Working Paper
External Assurance and Transparency in CSR Reporting
European Evidence
Carl W. Weustera, Philipp B. Ottensteinb, Sébastien Jostb, Sophie Winterb
a Research Associate at the Chair of Accounting and Auditing at HHL Leipzig Graduate School of Management, Leipzig, Germany. Email: [email protected] b Research Associate at the Chair of Accounting and Auditing at HHL Leipzig Graduate School of Management, Leipzig, Germany.
The spread of CSR reporting is accompanied by an increase of external assurance. Firms are employing assurance to signal the credibility of their CSR reports towards stakeholders and im-prove their reputation. Whether this practice is socially and economically beneficial remains up for debate. The research question of this paper concerns whether external assurance is associ-ated with transparency in CSR reports. A panel data model is used to investigate the empirical relationship of external assurance and three indicators of transparency: reporting scope as an indicator for completeness, readability as an indicator for clarity and optimism as an indicator for reporting balance, with the latter two proxies derived from text analysis.We find an ambiguous relationship between external assurance and reporting transparency: External assurance is positively related to reporting scope and negatively to optimism and rea-dability. This study adds to the scarce literature on external assurance for CSR reporting. We contribute one of the first investigations on how external assurance relates to linguistic aspects of CSR reporting transparency.
Acknowledgement:The authors thank Saskia Erben, Benjamin Hammer and Henning Zülch for helpful comments and discussions, the participants of the 4th and 5th RIC Conferences 2018 and 2019 at HHL Leip-zig Graduate School of Management for their comments, and, Nazife Bayraktar, Lena Geßner, Carsten Lendeckel, Lucas Seiler and Martin Wolf for their research assistance. The usual caveat applies.

1 Introduction
Reporting on Corporate Social Responsibility (CSR)-related activities and its external assur-
ance present two widespread and at the same time controversial practices (Ball and Craig,
2010; O’Dwyer and Owen, 2005; 2007; Smith et al., 2011; Junior et al., 2014). On the one
hand, increasing public awareness for CSR has led many companies to complement their
financial disclosure through additional information on their social and/or environmental per-
formance. As of 2017, it has become an established practice among many of the largest
companies worldwide (KPMG, 2017). This spread is accompanied by an increased supply of
external assurance of CSR reports. The Global Reporting Initiative (GRI) supports assur-
ance as a means to increase the reliability of reports and increase their credibility towards
stakeholders (GRI, 2013). Standards for assuring CSR reports have been formulated by
AccountAbility and the International Audit Assurance Standards Board (IAASB) and are
widely used on an international level (Velte and Stawinoga, 2017). Surveys by KPMG suggest
that in 2017, 93% of the worlds’ largest 250 firms (as measured by revenue) provided CSR
reporting in some form, of which 67% had their reports externally assured (KPMG, 2017).
On the other hand, whether the external assurance of CSR reports present a socially and
economically beneficial practice in its current form remains up for debate. Critics argue that,
while intended to ensure that companies adhere to principles of content and quality and thus
provide transparent reports, assurance may itself fall prey to managerial ‘capture’. It may
thus be ineffective in safeguarding reporting transparency and gains in credibility largely un-
due. As noted by Velte and Stawinoga (2017), while CSR reporting assurance is increasingly
covered in accounting research, its influence on reporting deserves further attention. Our
study thus tackles the question: Are externally assured CSR reports more transparent?
For a sample spanning the CSR reporting of 185 European firms from 2014 to 2016, we
analyze the relationship between external assurance and three different indicators of trans-
parency: reporting scope as an indicator for completeness, readability, as an indicator for
clarity and optimism as an indicator for balance in reporting. We complement several prior
studies that focus on the influence of assurance on the quantity (Michelon et al., 2015) or
1

content (Moroney et al., 2012; Michelon et al., 2015; Braam et al., 2016; Hummel and Schlick,
2016) of CSR reporting. Our findings show that assurance correlates with an increased scope
of company activities covered in CSR reporting as well as with a less optimistic verbal tone,
but is also associated with a more complex, less readable language. These findings show
statistical significance across several robustness checks.
The remainder of this paper is structured as follows: In section 2, we describe the the-
oretical background of our analysis and in section 3, we derive the research hypotheses. In
section 4, we elaborate our sample selection process, methodology and variables. Section 5
is dedicated to the presentation of our results. Finally, in section 6, we discuss our findings,
their potential implications and suggestions for future research. The section also concludes
this paper.
2 Theoretical Background
2.1 CSR Reporting, Assurance and Transparency
Unlike financial statements auditing, which presents a compulsory exercise for most compa-
nies worldwide, external assurance of CSR reports so far is mostly conducted voluntarily.
This lends it to be analyzed through the lenses of agency theory and related conceptions
(Cohen and Simnett, 2015; Velte and Stawinoga, 2017). One such approach, promoted by
Cohen and Simnett (2015) as well as Velte and Stawinoga (2017) is stakeholder agent theory
(Hill and Jones, 1992). In classical agency theory, the role of the ‘principal’ has traditionally
been reserved for firms’ shareholders. Under stakeholder agency theory, it is enriched by the
broader construct of corporate stakeholders.[1]
[1] Unlike shareholders, many stakeholder groups do not hold immediate financial investments in a companyand as such do not possess explicit ownership rights and claims to financial returns. Still, they may still be‘invested’ in a number of other ways. For example, employees that lend their skills and basic labor power,communities that provide the space to house corporate facilities or governments that secure the basic publicand legal infrastructures that enable economic action all hold a reasonable stake in a firm’s success andconduct. They raise their own expectations towards it, that may range from receiving an adequate wage for,compliance with commercial laws and customs or the basic respect for and consideration of the people andnatural environment affected by corporate activities (Jensen and Meckling (1976); Hill and Jones (1992); Grayet al. (1995); Velte and Stawinoga (2017)).
2

Firms thus use CSR reporting as a signal towards these groups to decrease information
asymmetries on their social and environmental conduct and secure their continued support.
Such signaling is only credible when CSR reporting is relatively more costly for ‘poor’ so-
cial/environmental performers in relation to ‘good’ ones (Spence, 1973). Otherwise, it would
represent ‘cheap talk’ and be considered easily negligible (Crawford and Sobel, 1982).
Firms are facing increasing public and legislative pressure to verify that their CSR re-
porting indeed provides incremental information. External assurance is promoted as an in-
strument to secure the transparency of CSR reports (Hahn et al., 2015; Cohen and Simnett,
2015; Michelon et al., 2015; Braam et al., 2016; Velte and Stawinoga, 2017) and increase their
‘recognition, trust and credibility’ (GRI, 2013) towards stakeholders. In contrast, referring
to its voluntary nature, critics suggest that CSR assurance may follow a ‘symbolic’ approach
to legitimization (Ashfort and Gibbs, 1990; Michelon et al., 2015). Corporate managers ini-
tiate assurance, pay the assurance providers and decide on the scope of assurance (Jones
and Solomon, 2010). As a result, assurance providers’ independence is often impaired. Their
work may be vulnerable to managerial ‘capture’ (Smith et al., 2011) and be ineffective in
securing or improving the transparency of CSR reporting (Ball and Craig, 2010; O’Dwyer
and Owen, 2005, 2007; Smith et al., 2011).
2.2 Empirical Research on Assurance and CSR Reporting
While scientific research on CSR assurance is broad and growing, its association with trans-
parency in CSR reporting has scarcely been investigated empirically (Velte and Stawinoga,
2017). Few studies have considered an association between assurance and CSR reporting
(and related forms of disclosure, such as integrated reporting), and those that do so far tend
to find a positive association. Moroney et al. (2012) and Braam et al. (2016) investigate the
influence of assurance on the contents of environmental reporting as measured by a disclo-
sure content index developed by Clarkson et al. (2008), in Australia and the Netherlands,
respectively. Both find that assurance is associated with an increased extent of objective and
verifiable environmental disclosure. Similarly, Hummel and Schlick (2016), for a sample of
3

European firms, use a content indexing scheme to distinguish ‘high’ (as proxied for by the
amount of numerical information) from ‘low‘ (non-numerical information) social and environ-
mental disclosure. They find that assurance correlates with increased levels of ‘high-quality’
and reduced levels of ‘low-quality’ disclosure. Gerwanski et al. (2019) find that assurance
may positively affect the quality of materiality disclosure within integrated reports. In con-
trast, Michelon et al. (2015) investigate the impact of assurance on the relative quantity,
topical density, accuracy and managerial orientation of sustainability reports and find no
statistically significant relationship with any of these measures.
We recognize the value of these investigations, but suggest that further research is needed
in this area for several reasons. First, five studies, (Moroney et al., 2012; Braam et al., 2016;
Hummel and Schlick, 2016; Velte, 2018; Gerwanski et al., 2019) find a positive impact of
assurance on reporting transparency while one —across several proxies —finds no relation
at all. This encourages us to believe there exists further demand for investigation to con-
tribute to the overall conclusion on this issue. Second, studies’ contents range from purely
environmental reporting (Moroney et al., 2012; Braam et al., 2016) to environmental and
social reporting (Hummel and Schlick, 2016; Michelon et al., 2015) and integrated reporting
(Gerwanski et al., 2019). This naturally impedes their comparability and provides a strong
justification to complement any of these three areas of research. Third, various other ways
in which transparency may find its expression in CSR reporting remains underresearched as
of yet. The studies conducted provide insights on the association of assurance with CSR re-
porting quantity (Michelon et al., 2015), specific aspects of reporting (Michelon et al., 2015;
Gerwanski et al., 2019) and the content-related depth of CSR reporting (Moroney et al., 2012;
Michelon et al., 2015; Braam et al., 2016; Hummel and Schlick, 2016). Such approaches work
well for capturing the substantial character of the information disclosed within a report.
Yet, the narrative and discretionary nature of CSR reporting (Cho et al., 2010) suggest its
overall verbal tone or rhetoric makeup may also play a role in how transparently information
is actually transmitted, even when formally disclosed (Davis et al., 2012; Arena et al., 2015).
This aspect appears to have been considered only scarcely for external assurance. To the best
4

of our knowledge, Velte (2018) provides the only study of this kind: For an European sample,
he shows that assurance is associated with an improved readability within integrated reports.
Without further inquiries, the complex relation between assurance and CSR reporting will
not be fully understood. Thus, the influence of external assurance on the readability of CSR
reports needs to be investigated.
3 Research question and hypothesis development
We pick up and contribute to this relatively young conversation. As our main research ques-
tion, we examine if and how external assurance is associated with the transparency of CSR
reports. However, transparency is an elusive concept and may only be measured indirectly.
As one of the major standard setters in the field, the GRI has defined a set of principles
of reporting content and quality that, if applied collectively, contribute to the transparency
of CSR reporting. In the following, we base our choice of indicators for transparency on
selected reporting principles as developed by the GRI and formulate our research hypotheses
in relation to them.[2] Details on the dependent variables employed to operationalize our
hypotheses are given in section 4.3.
3.1 Completeness and Reporting Scope
Completeness presents a principle of reporting content and is applied when it comes to define
what information has to be included in a company’s report about its activities, impacts and
the expectations it faces from its stakeholders (GRI, 2018). Specifically, the completeness
principle denotes that a CSR report should “(. . . ) include coverage of material topics and
their Boundaries, sufficient to reflect significant economic, environmental, and social impacts,
and to enable stakeholders to assess the reporting organization’s performance (. . . ).” (GRI,
2018). According to the GRI, completeness is secured in an information gathering process
[2] We base our following elaborations on the formulation of the reporting principles as found in the GRIreporting standards, as published in October 2016. Reporting principles did not change with transitions fromprevious iterations, such as G 3.1 or G4 of the GRI Reporting Guidelines, which were in effect during ourinvestigated period (2014-2016).
5

when data is collected for all entities in- and outside the firm whose activities in relation to
it significantly contribute to said impacts (GRI, 2018). Based on this guidance, as our proxy
for completeness, we employ the scope of reporting, which we define as the relative coverage
of a company’s activities covered in its CSR reporting.
Assurance providers should take the completeness of reporting into consideration during
their assurance engagement. Consequently, they should insist on the inclusion of certain
activities into the reporting scope when an omission would result in incomplete disclosure of
the companies’ impacts and leave stakeholder expectations neglected. As a result, assured
reports should display a higher relative coverage of company activities. This logic is similar
to suggestions by Moroney et al. (2012), Braam et al. (2016) or Hummel and Schlick (2016),
that assurance should contribute to the extent of CSR reporting, that is, the amount (or
‘breadth’) of information provided therein. We therefore formulate our first hypothesis as
follows:
H1: External assurance is positively associated with the scope of CSR reporting.
3.2 Clarity and Readability
Clarity constitutes a major principle of reporting quality. These principles sketch the expecta-
tions raised towards information included in a CSR report, including its proper presentation.
They also apply to and should guide the processes to gather and prepare information for
disclosure within a given report. The clarity principle itself denotes that information should
be made available “in a manner that is understandable and accessible to stakeholders (. . . ).”
and comprehensible to those “who have a reasonable understanding of the organization and
its activities.” (GRI, 2018). A common proxy for clarity in reporting is the readability of the
narrative disclosure contained in it (Rutherford, 2003). Complex and convoluted phrasing
makes it harder to read and understand a text, and extract given information from it. Poor
readability in a text may therefore effectively work as a form of obfuscation (Merkl-Davies
and Brennan, 2007).
6

It is ambiguous how external assurance affects the readability of CSR reports. From a stake-
holder perspective, assurance providers should consider the clarity of the reporting under their
review and persuade preparers to draft statements that readers can readily access. Although
he does not explicitly formulate any hypotheses on the relationship between assurance and
readability of CSR reports, the findings of Velte (2018) support this notion. Alternatively, it
may be that assurance providers – intentionally or unwittingly – contribute to making CSR
reports less readable: Assurance is often conducted by members of the auditing profession,
which itself holds an affinity for judicial language and technical ‘jargon’ terms. Barnett and
Loeffler (1979) point out that auditing statements are formulated in a manner that is hard to
read or understand. This affinity may lead assurance providers to promote a similar language
within reports themselves and decrease their clarity towards readers. Similarly, as Smith et
al. (2011) point out, there may also exist situations of ‘professional capture’ by assurance
providers. As assurance providers intent to be perceived as holding special expertise to pre-
serve their position within the market, they may effectively offer assurance with an attitude
of consultancy and actively cooperate with report preparers. Since negative information may
hold reputational or even legal consequences for companies, they may advise companies to
obfuscate respective disclosure to mitigate such risks. Based on these diverging predictions,
we formulate our second, undirected hypothesis as follows:
H2: External assurance is associated with readability of CSR reporting.
3.3 Balance and Optimism
As a second principle of reporting quality, we consider the balance of CSR reports. To the
GRI, to be considered balanced, a report should “reflect positive and negative aspects of
the reporting organization’s performance to enable a reasoned assessment of overall perfor-
mance.” (GRI, 2018). To this end, report preparers should avoid to compile or formulate
information for the report in a form that transports an (unduly) optimistic image of the com-
pany and its activities. Notably, it should abstain from any form of “selections, omissions,
7

or presentation formats” that could further such a biased impression. One way to evaluate
the balance of a report is through its verbal tone. Verbal tone may find its expression in
a heightened use of positively connoted words and a decreased use of negatively connoted
ones (Hildebrandt and Snyder, 1981; Merkl-Davies and Brennan, 2007; Cho et al., 2010),
which overall can make the message of a report appear as more optimistic. Indeed, Cho et
al. (2010) find some evidence that an overtly optimistic tone in disclosure indicates ‘poorer’
environmental performance and decreased levels of transparency. In contrast, Arena et al.
(2015) find optimism to be indicative for future positive CSR performance.
When assurance is effective and free from managerial capture, we assume assurance
providers will ensure balance within CSR reports. They will try to exert a correcting in-
fluence on such unduly positive presentation and enforce the use of a more neutral, less
persuasive style of language. We thus formulate our final hypothesis as follows:
H3: External assurance is negatively associated with optimism in CSR reporting.
4 Data and methodology
4.1 Sample selection and sample characteristics
The sample selection process consists of three steps (see Table 1). First, we select listed Eu-
ropean firms from the S&P Euro, an index designed to be reflective of the Eurozone market
(S&P Indices, 2019). We base our analysis on the index constituents list as of June 2018
that encompasses 187 companies. Second, we perform a hand collection of the latter firms’
CSR reports, for the years 2014 through 2016. We exclude nine firms, for which no CSR
report is available (or was not published), e.g. firms whose common stock and preferred
stock/retirement savings plan/holding corporation are included in the S&P Euro. In these
cases, we find two ISINs for one firm and exclude the ISIN of the non-ordinary share. Third,
additional exclusions are caused by missing data for single firms or firm-year observations in
Datastream. Therefore, the final sample consists of 144 firms or 380 firm-years, respectively.
8

Table 1: Sample selection and report availability
Step Selection criteria∑
Unit
1. 187 listed European firms encompassed within the S&P
Euro index that feature Refinitiv ESG / ASSET4 data
coverage, as of June 13, 2018
187 Firms
2. No CSR reports available, e.g., firms with two ISINs (reg-
ular share and preferred share or pension plans or holding
corporation), where the latter is excluded for the absence
of an CSR report
9 Firms
3. Sample after exclusion 178 Firms
4. Datastream and Refinitiv ESG / ASSET4 observations
missing
34 Firms
5. Final sample for baseline results 144 Firms
Table 2 and Table 3 show an overview of the sample distribution by country and industry.
Overall, more than 50% of total companies in our sample are based either in Germany or in
France, which appears in line with the countries’ share of the Eurozone’s total GDP (Euro-
pean Commission, 2017).
9

Table 2: Country distribution in the sample
Country Observations Percentage
1. France 113 29.74
2. Germany 82 21.58
3. Spain 53 13.95
4. Italy 40 10.53
5. Netherlands 29 7.63
6. Finland 27 7.11
7. Belgium 13 3.42
8. United Kingdom 8 2.11
9. Austria 6 1.58
10. Portugal 6 1.58
11. Ireland 3 0.79
Total 380 100.00
Note: Country identifications of firms were made based on the Alpha-2 Code available in Datastream
(Item: GEOGC).
Looking at the industry distribution (see Table 3) based on the INDM2 industry classifi-
cation, the sample mostly encompasses firms classified within the industrial and financial
sectors, respectively representing 22.11% and 18.42% of total firms, followed by firms active
within the consumer goods and utilities sectors. The rest of the sample appears relatively
balanced among the six remaining industries.
10

Table 3: Industry distribution in the sample
Industry Observations Percentage
1. Industrials 84 22.11
2. Financials 70 18.42
3. Consumer Goods 53 13.95
4. Utilities 39 10.26
5. Basic Materials 31 8.16
6. Consumer Services 30 7.89
7. Oil & Gas 20 5.26
8. Technology 20 5.26
9. Healthcare 17 4.47
10. Telecommunications 16 4.21
Total 380 100.00
Note: Industry classifications are based on the INDM2 industry classification (Datastream item INDM2).
4.2 Empirical Model
In order to test our hypotheses, we utilize an OLS panel data model with a set of covari-
ates and fixed effects. We construct three empirical models with reporting scope, readability
and optimism as dependent variables. The variable of interest in each model is the external
assurance of CSR reporting (ASSURANCE). Furthermore, we include a number of com-
pany specific variables and industry membership as control variables (Braam et al., 2016).
We control for omitted time-varying variables that are constant between firms through year
dummies. The following Ordinary Least Squares (OLS) regression is formulated:
11

(1)
REPORTINGSCOPEit = β0 + β1ASSURANCEit +12∑j=2
βjFIRM it, CONTROL+
22∑k=13
βkINDUSTRY it, CONTROL +
25∑l=23
βlYEAR it, CONTROL+
36∑m=26
βmCOUNTRY it, CONTROL + εit
(2)
READABILITYit = β0 + β1ASSURANCEit +12∑j=2
βjFIRM it, CONTROL+
22∑k=13
βkINDUSTRY it, CONTROL +25∑
l=23
βlYEAR it, CONTROL+
36∑m=26
βmCOUNTRY it, CONTROL + εit
(3)
OPTIMISMit = β0 + β1ASSURANCEit +
12∑j=2
βjFIRM it, CONTROL+
22∑k=13
βkINDUSTRY it, CONTROL +25∑
l=23
βlYEAR it, CONTROL+
36∑m=26
βmCOUNTRY it, CONTROL + εit
12

where the subscript letters indicate the following: i, company; t, year; j, firm character-
istic; k, industry membership; l, year membership; m, country membership. The analyzed
firm characteristics consist of standalone reporting (STANDALONE), conformity with GRI
guidelines (GRI), mandatory CSR reporting (MANDATORY), volume of CSR reporting
(VOLUME), ESG performance (ESG), ESG controversies score (CONTROVERSIES), firm
size (SIZE), volatility of operating cash flow (RISK), analyst coverage (COVERAGE), profit
warnings (WARNING), and closely held shares (CLOSELYHELD). These covariates are fur-
ther elaborated in the description of our independent variables in section 4.4.
Regarding the assumptions underlying the linear regression model, all parameters were
estimated with robust standard errors to consider the issue of heteroscedasticity and au-
tocorrelation (Gerwanski et al., 2019). Multicollinearity was tested based on the variance
inflation factor (VIF), similar to the approach by Michelon et al. (2015). The VIF analysis
does not provide evidence of threat to our findings caused by multicollinearity since the mean
is VIF = 4.48 (Model 1) and 4.51 (Model 2 and Model 3). We find the largest VIF values for
MANDATORY (in Model 1 to 3 between 18.87 and 18.93), which indicates that the models
may suffer from multicollinearity. Therefore, we respecify the three baseline models without
the variable MANDATORY as robustness checks. These robustness checks confirm our initial
results in terms of the coefficient signs and significance levels (not tabulated). Furthermore,
as the correlation matrix Table 8 shows, multicollinearity is not an issue in our model, since
correlation coefficients are far below the critical threshold of 80% (Gujarati, 2004, p. 359).
We test our model for heteroscedasticity with the Breusch-Pagan / Cook-Weisberg test and
find the presence of heteroscedasticity for Models 1 and 3. Since we use robust standard
errors in all baseline models, this is no threat to our results.
4.3 Dependent variables
To measure the scope of reporting (REPORTINGSCOPE) as described in our hypothesis
development, we employ the ESG Reporting Scope variable from the Refinitiv ESG Score
database (formerly Thomson Reuters ESG / ASSET 4). According to Thomson Reuters
13

(2018), the indicator presents the percentage of the firm’s activities covered in its environ-
mental and social reporting (CGVSDP041). This percentage is calculated based on indicators
such as the number of employees, group revenue or number of group operations covered within
reporting.
For our readability (READABILITY) and optimism (OPTIMISM) variables, similar to
Cho et al. (2010) and Arena et al. (2015), we employ DICTION (version 7.0) to conduct a
computer-aided analysis of the firms’ CSR reporting. DICTION is an analysis program devel-
oped to determine the verbal tone of any given English-language text. The software employs
a corpus of 10,000 words grouped into 33 distinct dictionaries and calculated variables. These
are used to calculate the five ‘master variables’ of ‘optimism’, ‘certainty’, ‘activity’, ‘realism’
and ‘commonality’. Via lexical analysis, DICTION is thus able to provide a comprehensive
profile of the verbal tone of any analyzed text. Cho et al. (2010) and Arena et al. (2015)
point out a number of advantages of using DICTION. First, its approach provides a strong
theoretical basis rooted in linguistic semantics and applied linguistics research (Sydserff and
Weetman, 2002; Cho et al., 2010). Second, it is available to be used by different scholars, and
creates ‘objective, normalized scores’ (Arena et al., 2015). Its continued usage also increases
the comparability of research results across studies.
As the basis of our analysis, we employ companies’ CSR reporting available in the PDF-
Format, both when companies opt for publication within a standalone CSR report or for a
distinct chapter within their annual report. The use of computer aided text analysis regularly
requires the prior ‘cleaning’ of the documents to be analyzed, and does so in the context of
this study. As DICTION follows a dictionary-based approach, the software in itself is unable
to distinguish ‘relevant’ from ‘irrelevant’ parts of a given text and simply includes all given
information within a text file. However, CSR reports often contain substantial amounts of
text not part of the central (narrative) disclosure, such as tables of content, page numbers,
information on imprint and contact and the like. The inclusion of such information may sub-
sequently affect the scores that DICTION calculates for a text, which could dilute our results.
To mitigate this issue, we prepare companies’ CSR reports for analysis as follows: First, we
14

categorize whether a company provides a stand-alone CSR report or a chapter within the
annual report in a given year. In cases of annual report chapters, we first cut out the respec-
tive pages that make up the chapter and save them as a separate PDF-file. Next, we clean
the reporting documents of several types of ‘noisy’ contents that we consider irrelevant to
our analysis.[3] After conducting this standardized cleaning procedure, we conduct a lexical
analysis of each document with DICTION to receive our two dependent variables.
As our measure for readability, we employ the reciprocal of DICTION’s ‘complexity’ sub-
variable. The variable calculates the average number of characters-per-word of an analyzed
text. As such, it follows a suggestion by Flesch (1951) in that a text’s message becomes more
abstract—and thus, less understandable—the more convoluted its phrasing is.
To measure the optimism in CSR reports’ narrative disclosure, we follow Cho et al. (2010)
and Arena et al. (2015) and use DICTION’s ‘optimism’ master variable. According to the
DICTION 7.0 manual, the variable calculates a score to what degree a text’s language is
“endorsing some person, group, concept or event or highlighting their positive entailments.”
(Digitext Inc. 2013).[4]
[3] We regularly clean the documents of the following reoccurring types of information: (1) tables of content,(2) images, tables and their respective headlines or explanatory footnotes, (3) hyperlink-references withinthe document or from the document to other documents or HTML-Websites, (4) page numbers, headers andfooters, (5) imprint and contact information, (6) assurance statements by external auditors, and (7) GRIcontent indices. In a prior testing for our analysis, we found that DICTION counts any numerical valuewithin a table or an image as a separate numerical term. This, however, could dilute results, as in manycases individual values may only ‘function’ (that is, transport reasonable, interpretable information) whenconsidered together with the rest of the values contained in their respective table or image. The individualcounting by DICTION may therefore be interpreted as a ‘double counting’ and unduly increase the totalnumber of words of a document that the software uses as its basis to calculate its scores. For this reason,tables and images are deleted. Assurance statements are deleted as they do not present a part of disclosurethat is under the control of the reporting company, but is formulated by the assurance provider. GRI contentindices are deleted since, in the main, they present reference documents that provide guidance to readers insearch for specific disclosure items, but do not generally provide additional information on their own.[4] The ‘optimism’ master variable is calculated via the formula [Praise + Satisfaction + Inspiration] - [Blame+ Hardship + Denial] Digitext Inc. (2015) 2013 . Like Ober et al. (1999), Cho et al. (2010) and Arena et al.(2015), we do not adjust the variable for our analysis.
15

4.4 Independent variables
To test our three hypotheses, we use the variable ASSURANCE as our variable of interest.
The latter corresponds to a dummy variable equal to one if a given firm has an external
auditor for its sustainability report in a given year, and zero otherwise (Bollas-Araya et al.,
2018, Moroney et al., 2012). Moreover, we include a set of independent variables at the firm-,
industry- and country level. All variables except our instrumental variable and the fixed
effects-covariates are defined on a firm-year basis, in line with our panel structure.
Table 4: Overview of the independent variables used within the model
Nr. Type Variable Definition
1.CSR Dis-
closure
quality,
quantity,
and timing
controls
ASSURANCEi,t Dummy variable = 1 if the firm i has an external
auditor for its CSR report in year t, 0 otherwise
(Source: Refinitiv ESG; Code: CGVSDP041)
2. STANDALONEi,t Dummy variable = 1 if the firm i publishes CSR
report separated from its annual report in year
t, 0 otherwise
(Source: Hand-collected)
3. GRIi,t Dummy variable = 1 if the firm i ’s CSR report is
published in accordance with the GRI guidelines
in year t, 0 otherwise.
(Source: Refinitiv ESG; Code: CGVSDP028)
4. MANDATORYi,t Dummy variable = 1 for fiscal years (FYs) start-
ing from the first time a CSR report had to be
disclosed onwards, 0 for FYs before.
(Source: Hand-collected)
5. VOLUMEi,t Total number of words within the CSR report
of firm i in year t. (Source: DICTION)
16

6. ESGi,t ESG Score of firm i in year t.
(Source: Refinitiv ESG; Code: TRESGS)
7. CONTROVERSIESi,t ESG Controversies Score of firm i in year t.
(Source: Refinitiv ESG; Code: TRESGCCS)
8.
Other firm
level controls
SIZEi,t Measured as the natural logarithm of firm i ’s net
sales / revenues in million US-Dollars in year t.
(Source: Datastream; Code: WC07240)
9. RISKi,t Ratio of the standard deviation of firm i ’s net
operating cash flow (i.e. net OCF) over the last
3 years. (i.e. t-2; t-1; t) to the 3-year average
value of its net OCF.
(Source: Datastream; Code: WC04860, calcu-
lated)
10. COVERAGEi,t Total number of analyst earnings per share (i.e.
EPS) forecasts for firm i in year t.
(Source: Datastream; Code: EPS1NET)
11. WARNINGi,t Dummy variable = 1 if the firm i issued a profit
warning in the fiscal year t.
(Source: Datastream; Code: ECSLDP059)
12. CLOSELYHELDi,t Ratio of the total number of closely held shares
of firm i in year t to firm i ’s number of com-
mon shares outstanding in year t (in percent).
(Source: Datastream; Code: WC08021)
13. Instrumentalvariable
PERCASSUREDm The percentage of firms that receive CSR report
ASSURANCE in country m. (Source: Datas-
tream; Code: CGVSDP041, calculated)
17

To control for the CSR reporting practices on our dependent variables, i.e. REPORT-
INGSCOPE, READABILITY, OPTIMISM, we use a set of variables focusing on firms’ CSR
disclosure. To that extent, we first include the variable STANDALONE, to distinguish firms
releasing an integrated report (i.e. IR) from the ones publishing two separate reports (i.e. an
annual report and a CSR report). We use a dummy variable set to one if a given company
publishes its CSR report separately from its annual report and zero otherwise. Moreover,
similar to Michelon et al. (2015) we also distinguish whether firms follow the GRI standards
or guidelines in their CSR reporting via the variable GRI, a dummy variable equal to one if a
given firms releases its CSR report in accordance with the GRI guidelines and zero otherwise
(Bollas-Araya et al., 2018; Moroney et al., 2012). To differentiate mandatory from voluntary
disclosure practices, we use the variable MANDATORY, a dummy variable set to one for
firms reporting under mandatory CSR disclosure regime, and zero otherwise. Furthermore,
we include the variable VOLUME, which corresponds to the total number of words contained
within a firm’s CSR report in a given year to control for the quantity of CSR disclosure.
To measure the firm’s CSR performance, we use two distinct variables provided within the
Refinitiv ESG / ASSET4 database, namely ESG and CONTROVERSIES. This database
(ASSET4) has become increasingly used in research on CSR reporting (Gomes and Marsat,
2018; Lys et al., 2015). Specifically, ESG corresponds to the firms’ ESG scores, which assess
their CSR performance relatively to a peer group, based on the information they disclose
within the environmental, social and governance fields. Complementing ESG, the variable
CONTROVERSIES corresponds to a firm’s ESG Controversies score, which reflects the level
of controversies regarding environmental, social or governance problematics firms face: the
higher the number of controversies, the more the firms are penalized by the scoring model
(Thomson Reuters, 2018).
Second, we include additional firm-level variables to control for firm specificities and their
(potential) influence on REPORTINGSCOPE, READABILITY and OPTIMISM. For in-
stance, Braam et al. (2016) and Bollas-Araya et al. (2018), Guidry and Patten (2012)
showed that firm size influences its environmental reporting practices; thus we include SIZE
18

as the natural logarithm of a firm’s total revenues. Following Wasley and Wu (2006), we
also include a proxy for companies’ business model volatility through the variable RISK, as
a more volatile business model may incentivize a firm to provide more transparent disclosure
to manage stakeholders’ expectations. We operationalize RISK as the volatility of a firm’s
three-year net operating cash flow over the average of its three-year net operating cash flow.
To control for differences in information asymmetry, we use the variable COVERAGE, i.e.
the number of earnings per share forecasts available for a given firm (Hope, 2003; Dhaliwal
et al., 2011). Indeed, analysts operate as information providers or information asymmetry
reducers, through the release of recommendations and forecasts (Healy and Palepu, 2001;
Chang et al., 2000). To control for capital-market-induced pressure on results and, therefore,
disclosure, we add the variable WARNING, i.e. a dummy variable set to one if a given firm
issued a profit warning during the fiscal year and zero otherwise. Finally, we include the
variable CLOSELYHELD, corresponding to the ratio of a firm’s closely held shares to the
firms total number of common shares outstanding; we use the latter variable to control for
differences in firms’ corporate governance practices (Nagar et al., 2011). Descriptive statistics
for dependent and independent variables are summarized in Table 5.
19

Table 5: Descriptive statistics
Variable N M SD Min P25 P75 Max
1. REPORTINGSCOPE 375 88.11 22.40 0.00 86.00 100.00 100.00
2. READABILITY 380 0.182 0.014 0.134 0.174 0.189 0.227
3. OPTIMISM 380 51.37 2.73 44.47 49.66 52.83 61.70
4. ASSURANCE 380 0.950 0.218 0.000 1.000 1.000 1.000
5. STANDALONE 380 0.537 0.499 0.000 0.000 1.000 1.000
6. GRI 380 0.968 0.175 0.000 1.000 1.000 1.000
7. MANDARTORY 380 0.297 0.458 0.000 0.000 1.000 1.000
8. VOLUME 380 28,809 19,3 1,377 15,621 38,869 100,623
9. ESG 380 73.20 10.84 39.15 66.62 80.95 93.1
10. CONTROVERSIES 380 39.16 24.41 0.37 10.45 58.45 67.24
11. SIZE 380 9.70 1.23 6.59 8.89 10.67 12.18
12. RISK 380 0.344 1.043 -2.814 0.086 0.286 6.946
13. COVERAGE 380 25.03 21337 0.00 21.00 30.00 37.00
14. WARNING 380 0.134 0.341 0.000 0.000 0.000 1.000
15. CLOSELYHELD 380 22.44 20.53 0.00 3.10 36.86 72.58
16. PERCASSUREDa) 380 86.15 25.70 0.00 81.65 100.00 100.00
Note: This table summarizes all variables for firms in the sample. The analyzed sample is a panel covering 380
firm-year observations in 11 countries during the period from 2014 to 2016. The number of observations, mean,
standard deviation, minimum, values at the 25th percentile, and values at 75th percentile, and maximum
are shown for each variable. Firm-level data are obtained from Thomson Reuters Datastream, I/B/E/S, and
Refinitiv ESG / ASSET4 databases. All metric variables are winsorized at their 1st and 99th percentiles.
a) PERCASSURED is our instrumental variable, explained in detail in section 4.4.
20

To control for unobserved differences across industries and countries, we add a set of dummy
variables. In fact, Simnett et al. (2009), and Kolk and Perego (2010) show that reporting
practices are influenced at country-level by the stakeholder-orientation level as well as at the
industry-level, since industries such as mining or finance are more highly exposed to CSR
issues than other sectors. We therefore use industry fixed effects, following the Thomson
Reuters Datastream classification based on the Industry Classification Benchmark (ICB).
We assign a one if a firm belongs to a particular industry and a zero otherwise. Similarly,
we use country fixed effects, assigning the value one for firms belonging to a given country,
and zero otherwise. To avoid perfect multicollinearity in the model, we omit one industry
membership dummy, respectively one country belonging dummy. For further details on in-
dependent variables, refer to section 4.4, Table 4.
5 Empirical results
5.1 Univariate and correlation analyses
We conduct univariate tests of differences to understand how firms set their CSR reporting
strategies along with REPORTINGSCOPE, READABILITY, and the OPTIMISM of their
CSR reports. Given the nonparametric nature of panel data, we use Wilcoxon rank-sum
tests. The test results show that firms that issue a standalone CSR report are likely to
have lower READABILITY (p = .042) and OPTIMISM (p = .013). The univariate test
indicate that firms in a mandatory CSR reporting regime are likely to exhibit higher RE-
PORTINGSCOPE (p = .009). Firms that receive CSR assurance are likely to exhibit higher
REPORTINGSCOPE (p < .000); with approximately double the REPORTINGSCOPE of
firms without assurance. Similarly, firms with assurance are likely to issue less optimistic
CSR reports (p = .001).
21

Table 6: Univariate tests by reporting format and mandatory sustainability reporting
Vari
ab
le
Vari
ati
ona)
ST
AN
D-
STAND-
Diff
.c)
MANDA-
MANDA-
Diff
.
(Betw
een
)A
LO
NE
AL
ON
E(1
)-(2
)T
OR
YT
OR
Y(3
)-(4
)
[Wit
hin
]=
1b
)(1
)=
0(2
)=
1(3
)=
0(4
)
1.R
EP
OR
TIN
GS
CO
PE
22.4
03
86.2
1090
.280
-4.0
67
89.6
8187
.429
2.25
2***
-22.
102
(.35
1)(.
009)
[6.7
55]
2.R
EA
DA
BIL
ITY
0.01
39
0.18
080.
1826
-0.0
018*
*
0.18
500.
1802
0.00
5***
(0.0
097)
(.04
2)(.
000)
[0.0
100]
3.O
PT
IMIS
M
2.73
5
51.6
4051
.066
0.57
3**
50.7
6951
.630
-0.8
61**
*
-2.3
26(.
013)
(.00
4)
[1.6
94]
Note
:T
his
table
sum
mari
zes
mea
ndiff
eren
ces
and
univ
ari
ate
test
resu
lts
for
dep
enden
tva
riable
sfo
rfirm
sin
the
sam
ple
.T
he
analy
zed
sam
ple
isa
panel
cover
ing
380
firm
-yea
robse
rvati
ons
in11
countr
ies
duri
ng
the
per
iod
from
2014
to2016.
All
met
ric
vari
able
sare
win
sori
zed
at
thei
r
1st
and
99th
per
centi
les.
a)
Rep
ort
edva
riati
on
(tota
l,b
etw
een,
and
wit
hin
)is
the
resp
ecti
ve
standard
dev
iati
on
stati
stic
.
b)
Valu
esre
port
edunder
(1),
(2),
(3)
and
(4)
are
mea
nst
ati
stic
s.
c)
Diff
eren
ces
rep
ort
edare
mea
ndiff
eren
ces.
The
test
sfo
rdiff
eren
ces
are
two-s
am
ple
Wilco
xon
rank-s
um
test
s.
*,**,
and
***
indic
ate
ssi
gnifi
cance
at
the
10%
,5%
,and
1%
level
,re
spec
tivel
y.
22

Table 7: Univariate tests by GRI reporting compliance and external assurance of CSR report
Vari
ab
le
GR
Ia)
GR
ID
iff.b
)ASSU
ASSU
Diff
.
=1
(1)
=0
(2)
(1)-
(2)
-RANCE
-RANCE
(3)-
(4)
=1
(3)
=0
(4)
1.
RE
PO
RT
ING
89.5
6943
.917
45.6
52**
*
90.3
6745
.367
44.8
96**
*
-SC
OP
E(.
000)
(.00
0)
2.
RE
AD
AB
ILIT
Y0.1
817
0.1
792
0.00
25
0.18
140.
1865
-.00
52
(.59
4)(.
190)
3.
OP
TIM
ISM
51.
382
51.
133
0.24
8
51.2
8353
.097
-1.8
14**
*
(.63
4)(.
001)
Note
:T
his
table
sum
mari
zes
mea
ndiff
eren
ces
and
univ
ari
ate
test
resu
lts
for
dep
enden
tva
riable
sfo
rfirm
sin
the
sam
ple
.T
he
analy
zed
sam
ple
isa
panel
cover
ing
380
firm
-yea
robse
rvati
ons
in11
countr
ies
duri
ng
the
per
iod
from
2014
to2016.
All
met
ric
vari
able
sare
win
sori
zed
at
thei
r1st
and
99th
per
centi
les.
a)
Valu
esre
port
edunder
(1),
(2),
(3)
and
(4)
are
mea
nst
ati
stic
s.
b)D
iffer
ence
sre
port
edare
mea
ndiff
eren
ces.
The
test
sfo
rdiff
eren
ces
are
two-s
am
ple
Wilco
xon
rank-s
um
test
s.
*,**,
and
***
indic
ate
ssi
gnifi
cance
at
the
10%
,5%
,and
1%
level
,re
spec
tivel
y.
23

Table 8: Pearson and Spearman correlations
Vari
ab
le9.
10.
11.
12.
13.
1.R
EP
OR
TIN
GS
CO
PE
.035
-.16
1***
.059
-51
-.022
2.R
EA
DA
BIL
ITY
.043
-.091
*-.
026
-.035
-.022
3.O
PT
IMIS
M-.
006
-.11
9**
.054
.013
.089
*
4.A
SS
UR
AN
CE
.232
***
-.082
.043
-.057
-.033
5.P
ER
CA
SS
UR
ED
-.08
3-.
129*
*-.
253*
**-.
085
.114*
*
6.V
OL
UM
E.2
91**
*.0
13
.102*
*-.
041
-.017
7.E
SG
.311
***
.008
.366
***
.033
-.253
***
8.C
ON
TR
OV
ER
SIE
S-.
407*
**.0
16
-.31
1***
-.112
**.1
33*
**
9.S
IZE
1.0
02.5
12*
**.1
16**
.009
10.
RIS
K.0
92*
1-.
047
.026
-.017
11.
CO
VE
RA
GE
.452
***
.045
1.1
05**
-.042
12.
WA
RN
ING
.129
**.0
90*
.084
1-.
022
13.
CL
OS
EL
YH
EL
D.0
26-.
045
-.05
1-.
022
1
24

Vari
ab
le1.
2.
3.
4.
5.
6.
7.
8.
1.
RE
PO
RT
ING
SC
OP
E1
-.09
7*-.
013
.252
***
-.05
0-.
056
.070
-.03
5
2.
RE
AD
AB
ILIT
Y-.
136*
**1
-.18
3***
-.07
6.1
50**
*-.
015
-.00
8-.
009
3.
OP
TIM
ISM
-.09
3*-.
205*
**1
-.15
7***
-.12
1**
-.02
5-.
041
.048
4.
AS
SU
RA
NC
E.4
29**
*-.
081
-.14
5***
1.2
17**
*.2
15**
*.1
77**
*-.
058
5.
PE
RC
AS
SU
RE
D-.
075
.122
**.0
20.0
161
.225
***
.001
.136
***
6.
VO
LU
ME
-.05
6.0
19.0
20.1
82**
*.1
70**
*1
.190
***
-.13
2**
7.
ES
G.1
77**
*.0
36.0
40-.
850*
.087
*-.
154*
**1
-.21
0***
8.
CO
NT
RO
VE
RS
IES
-.02
5-.
055
.040
-.08
5*.0
87*
-.15
4***
-.23
6***
1
9.
SIZ
E.0
14.0
78-.
013
.247
***
-.12
1**
.252
***
.322
***
-.49
7***
10.
RIS
K-.
026
-.02
3-.
052
.024
.035
0.02
1.1
16**
-.03
1
11.
CO
VE
RA
GE
.056
-.01
9.0
26.0
80-.
141*
**.0
92*
.390
***
-.34
7***
12.
WA
RN
ING
.046
-.03
0-.
012
-.05
1-.
057
-.03
2.0
47-.
144*
**
13.
CL
OS
EL
YH
EL
D-.
003
-.04
5.0
70-.
053
.081
.051
-.24
6***
.086
*
Note
:P
ara
met
ric
Pea
rson’s
rco
rrel
ati
ons
are
rep
ort
edb
elow
the
dia
gonal.
Nonpara
met
ric
Sp
earm
an’s
rsco
rrel
ati
ons
are
rep
ort
edab
ove
the
dia
gonal.
Pair
wis
eN
=380
for
all
corr
elati
on
analy
ses,
exce
pt
those
corr
elati
ons
incl
udin
gR
EP
OR
TIN
GSC
OP
E,
whic
hin
clude
N=
375.
All
met
ric
vari
able
sare
win
sori
zed
at
thei
r1st
and
99th
per
centi
les.
*,**,
and
***
indic
ate
ssi
gnifi
cance
at
the
10%
,5%
,and
1%
level
,re
spec
tivel
y.
25

Non-parametric Spearman (1904) correlations indicate a positive and significant correlation
of our variable of interest ASSURANCE with REPORTINGSCOPE (rs = .252, p < .000),
and a negative and significant correlation with OPTIMISM (rs = -.157, p = .0047). In
the correlation analysis, the empirical association of ASSURANCE and READABILITY is
negative but statistically insignificant (rs = -.076, p = .1137).
5.2 Regression analyses
To test our hypotheses H1 to H3, we conduct a multiple regression analysis. Table 9 shows
the results from the baseline multiple regression models (Models 1 to 3) with fixed effects,
with REPORTINGSCOPE, READABILITY and OPTIMISM as the dependent variable,
respectively. There is a strong relation between reporting scope of ESG related topics (RE-
PORTINGSCOPE ) and external assurance (ASSURANCE ), GRI conformity (GRI ), volume
(VOLUME ) as well as size (SIZE ). Since reporting scope is significantly positive associated
with external assurance of CSR reporting (ASSURANCE ; β1 = 33.92, p < .01), GRI con-
formity (GRI ; β3 = 29.04, p < .01) is significantly negative associated with volume of CSR
reporting (VOLUME ; β5 = - 0.000, p< .05) as well as with size of the company (SIZE ;
β8 = -2.847, p < .05). Furthermore, there is a weak relation between reporting scope and
the variable closely held share (CLOSELYHELD ; β12 = 0.1033, p < .1). The readability
(READABILITY ) is significantly negative associated with external assurance of CSR re-
ports (ASSURANCE ; β1 = -0.009, p < .05). A negative relation between the verbal tone
optimism (OPTIMISM ) in CSR reporting and external assurance (ASSURANCE ) can be
found (ASSURANCE ; β1 = -1.667, p < .05). There is a strong positive significant relation
between the variable of mandatory sustainability reporting (MANDATORY ; β4 = 4.310,
p < .05) and the optimistic tone on CSR reporting. Thus, Hypotheses 1, 2 and 3 are strongly
supported. The results contribute to the current discussion about external assurance in CSR
reporting and show another perspective compared to the results from Velte (2018).
26
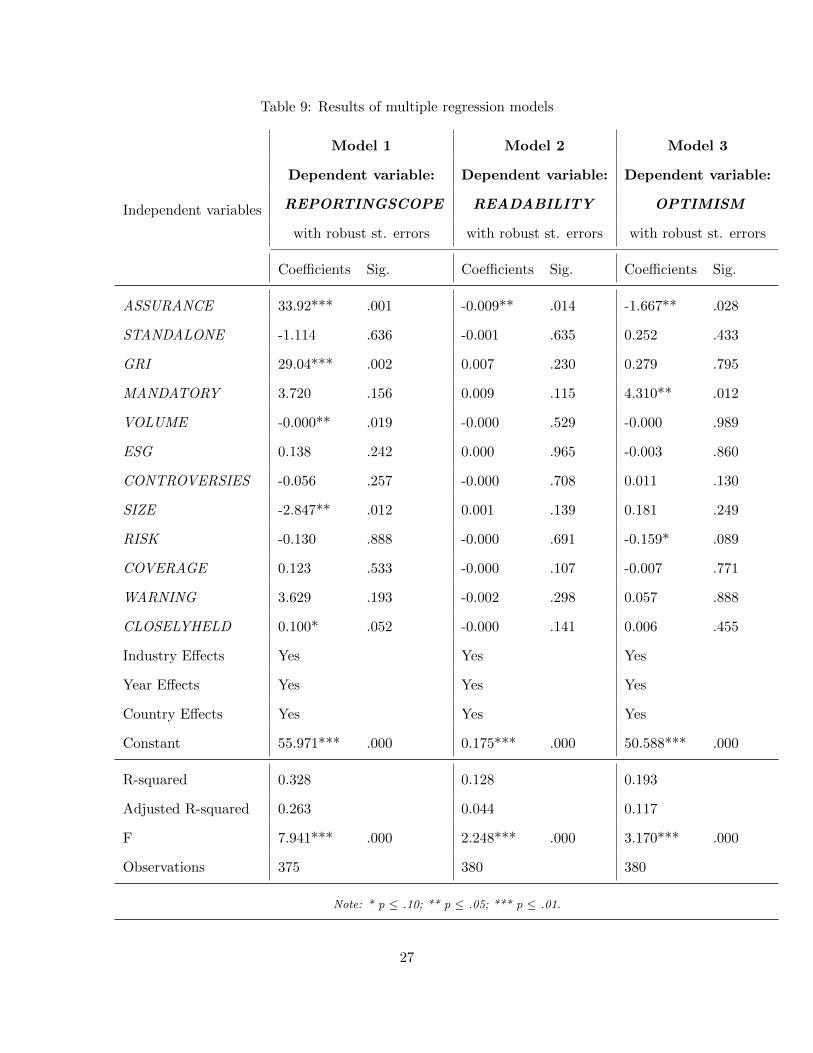
Table 9: Results of multiple regression models
Independent variables
Model 1 Model 2 Model 3
Dependent variable: Dependent variable: Dependent variable:
REPORTINGSCOPE READABILITY OPTIMISM
with robust st. errors with robust st. errors with robust st. errors
Coefficients Sig. Coefficients Sig. Coefficients Sig.
ASSURANCE 33.92*** .001 -0.009** .014 -1.667** .028
STANDALONE -1.114 .636 -0.001 .635 0.252 .433
GRI 29.04*** .002 0.007 .230 0.279 .795
MANDATORY 3.720 .156 0.009 .115 4.310** .012
VOLUME -0.000** .019 -0.000 .529 -0.000 .989
ESG 0.138 .242 0.000 .965 -0.003 .860
CONTROVERSIES -0.056 .257 -0.000 .708 0.011 .130
SIZE -2.847** .012 0.001 .139 0.181 .249
RISK -0.130 .888 -0.000 .691 -0.159* .089
COVERAGE 0.123 .533 -0.000 .107 -0.007 .771
WARNING 3.629 .193 -0.002 .298 0.057 .888
CLOSELYHELD 0.100* .052 -0.000 .141 0.006 .455
Industry Effects Yes Yes Yes
Year Effects Yes Yes Yes
Country Effects Yes Yes Yes
Constant 55.971*** .000 0.175*** .000 50.588*** .000
R-squared 0.328 0.128 0.193
Adjusted R-squared 0.263 0.044 0.117
F 7.941*** .000 2.248*** .000 3.170*** .000
Observations 375 380 380
Note: * p ≤ .10; ** p ≤ .05; *** p ≤ .01.
27

To assess the possibility of an omitted variable bias to the validity of our baseline findings,
we conduct various specification tests and find no violation.
5.3 Consideration of Potential Selection Bias
The used sample is non-randomly selected which might raise concerns about the validity of
the empirical findings of our study. Our sample considers the 185 largest firms (by market
capitalization) in the EURO STOXX 300. This could lead to a sample bias in the selection
procedure. To address this potential sample selection bias, we employ a Heckman two-step
selection model (Heckman, 1979; Michelon et al., 2015; Steinmeier and Stich, 2019). First, the
following probit regression model was estimated for all firms included in the EURO STOXX
600 from 2014-2016. The model is:
(4)
P(Incl it = 1) = φ(β0 + β1MarketCapit + uit)
where the subscript letters indicate the following: i, firm; t, year. Inclit it is a dichotomous
variable that indicates whether an observation is included in the major analysis. The criterion
for an inclusion in our sample is whether a firm belongs to the 185 largest public firms in the
EURO STOXX 300. Further, market capitalization (MarketCapit) in USD is included in the
model. Based on equation (4), we obtain the inverse Mills ratio (IMRit). The inverse Mills
ratio (IMR) is used to construct a selection bias control factor. In a second step we include
the inverse Mills ratio as an additional control variable for each baseline regression model
(see Table 10 for Models 4 to 6) to account for the impact of potential sample selection bias.
The results from these Heckman selection models support our baseline results. Therefore, it
is unlikely that our baseline models suffer from a sample selection bias.
28

Table 10: Results of multiple regression models with Heckman correction
Independent variables
Model 4 Model 5 Model 6
Dependent variable: Dependent variable: Dependent variable:
REPORTINGSCOPE READABILITY OPTIMISM
with robust st. errors with robust st. errors with robust st. errors
Coefficients Sig. Coefficients Sig. Coefficients Sig.
ASSURANCE 32.361*** .001 -0.010** .012 -1.554** .043
STANDALONE -0.834 .736 -0.001 .566 0.165 .621
GRI 29.963*** .002 0.007 .238 0.212 .846
MANDATORY 1.586 .608 0.009 .121 4.571*** .006
VOLUME -0.000** .033 -0.000 .579 0.000 .829
ESG 0.113 .366 0.000 .968 -0.006 .715
CONTROVERSIES -0.039 .449 -0.000 .750 0.011 .141
SIZE -3.846*** .001 0.001 .195 0.245 .175
RISK -0.219 .820 -0.000 .660 -0.194** .046
COVERAGE 0.058 .793 -0.000 .141 0.013 .619
WARNING 3.766 .182 -0.002 .331 0.109 .788
CLOSELYHELD 0.076 .152 -0.000 .115 0.007 .431
IMR -18.690** .025 -0.001 .819 1.554 .159
Industry Effects Yes Yes Yes
Year Effects Yes Yes Yes
Country Effects Yes Yes Yes
Constant 92.801*** .000 0.178*** .000 47.693*** .000
R-squared 0.336 0.129 0.201
Adjusted R-squared 0.269 0.042 0.121
F 7.794*** .000 2.186*** .000 5.181*** .000
Observations 368 373 373
Note: * p ≤ .10; ** p ≤ .05; *** p ≤ .01.
29
5.4 Adressing Endogeneity Concerns
Since firms have considerable discretion, whether to receive ASSURANCE of their CSR re-
port or not, ASSURANCE is regarded to be an endogenous regressor. This is especially
prevalent in a voluntary setting of CSR report assurance (Simnett et al., 2009; Steinmeier
and Stich, 2019). This self-selection stems from the fact that firms seek CSR report assurance
on a voluntary basis in Europe throughout our sample period from 2014 to 2016—except for
French firms, that have been reporting under a mandatory CSR reporting regime since 31st
December 2013 (Kaya, 2016; Sethi et al., 2017). Therefore, our baseline results may be prone
to firms’ self-selection mechanism and resulting bias because of management’s decision to
receive CSR report assurance (Ruhnke and Gabriel, 2013; Sethi et al., 2017). Consequently,
a classical assumption of our OLS estimator, i.e. no endogeneity (Studenmund and Johnson,
2017) would be violated. Therefore, our estimates of the true regression coefficients would
be biased and inconsistent (Greene, 2008; Backhaus et al., 2016).
We follow Sethi et al. (2017) and make use of the Heckman two-step approach to consider
this endogeneity concern (Heckman, 1979). Specifically, we use a two-stage regression with
ASSURANCE as dependent variable in the first-stage equation, and each dependent variable
REPORTINGSCOPE, READABILITY, and OPTIMISM in the second-stage equations (ex-
cluding ASSURANCE in the second-stage equation).
Our instrumental variable (IV) for the first-stage regression is PERCASSURED, defined
as the percentage of firms that receive CSR report ASSURANCE in a particular country,
as an exogenous regressor for the first-stage equation, which is a regression of ASSURANCE
on PERCASSURED and the exogenous covariates used in our baseline models. Country-
or industry-means like our IV have frequently been used as instruments by prior empirical
studies (Lev and Sougiannis, 1996; Nevo, 2000; Hanlon et al., 2003; Cheng et al., 2014; Sethi
et al., 2017). For the second-stage equations, the predicted values of ASSURANCE (obtained
from the first-stage regression), are used as an independent variable instead of the observed
values of ASSURANCE. The results of our two-step models (Models 7 to 9) are tabulated in
Table 11.
30

Table 11: Results of instrumental variable regression models
Independent variables
Model 7 Model 8 Model 9
Dependent variable: Dependent variable: Dependent variable:
REPORTINGSCOPE READABILITY OPTIMISM
with robust st. errors with robust st. errors with robust st. errors
1st stage 2nd stage 1st stage 2nd stage 1st stage 2nd stage
ASSURANCE 56.016*** -0.024*** -3.013***
PERCASSURED 0.101** 0.098** 0.098**
STANDALONE -0.778 -0.911 -0.837* -0.002 -0.837* 0.257
GRI 6.122 25.960*** 5.800 0.011** 5.800 1.275
MANDATORY 9.033 0.768 8.727 0.006*** 8.727 -0.621*
VOLUME 0.000 -0.000*** 0.000 0.000 0.000 0.000
ESG 0.031 0.104 0.038* 0.000 0.038* 0.002
CONTROVERSIES -0.001 -0.045 -0.001 0.000 -0.001 0.006
SIZE 0.768** -3.537*** 0.776*** 0.002*** 0.776*** 0.059
RISK 0.093 -0.644 0.084 -0.000 0.084 -0.154
COVERAGE -0.076 0.124 -0.075* -0.000 -0.075* 0.002
WARNING -0.503 5.284* -0.518 -0.002 -0.518 -0.144
CLOSELYHELD -0.007 0.080 -0.006 -0.000 -0.006 0.006
Constant -20.109 38.285*** -20.132 0.175*** -20.132 51.786***
Wald x 2 154.00*** 53.73*** 42.46***
p-value (.0000) (.0003) (.0080)
Observations 375 380 380
Note: * p ≤ .10; ** p ≤ .05; *** p ≤ .01.
31

These Heckman (1979) two-step models allow us to analyze the potential impact of firms’
self-selection bias. The results of the respective second-stage regressions feature coefficients
for ASSURANCE with the same sign directions as our baseline models and the same—or
even higher—significance levels (p-values less than 10%, 5%, or 1% respectively). We con-
clude that our baseline results are not subject to a potential self-selection bias concerning
our variable of interest, ASSURANCE. However, like Michelon et al. (2015), we acknowledge
a potential cause of endogeneity due to reverse causality: given the present data granular-
ity of firm-year observations, we presume that firms simultaneously decide on whether to
receive external CSR report assurance, the verbal tone, and the incremental information of
their CSR report. Therefore, we cannot infer from our findings that an adoption of AS-
SURANCE will inevitably lead to shifts in a firm’s REPORTINGSCOPE, READABILITY,
and/or OPTIMISM. Likewise, our empirical research design could not identify such causal
effects.
6 Conclusion
Our study addresses the question whether external assurance is associated with increased
transparency in CSR reporting. To this end, we investigate the empirical relation of as-
surance with three dimensions of reporting content and quality: completeness, clarity, and
balance.
This study contributes to the literature on the external assurance of CSR reporting in sev-
eral ways. First, complementing the pioneering work by Velte (2018), we add to the stream
of research investigating the relation of assurance with linguistic aspects of reporting. To the
best of our knowledge, we are also the first to consider the potential association of assurance
with reporting optimism. Our results add to the understanding of how assurance is associ-
ated with transparency across several dimensions of reporting quality. On the one hand, our
results show that assurance is, at statistically significant levels, positively associated with
reporting scope and negatively with reporting optimism. In this, they support other stud-
ies which suggest that assurance is positively related with alternative indicators for report
32

transparency, such as reporting content (Moroney et al., 2012; Braam et al., 2016; Hummel
and Schlick, 2016) or materiality disclosure (Gerwanski et al., 2019). On the other hand,
we find that external assurance is also associated with decreased readability of CSR reports.
Questions of comparability notwithstanding, our results challenge those of Velte (2018), who
finds assurance to be associated with increased readability in integrated reports. Our find-
ings remain significant across several robustness checks. Taken together, they suggest that,
while assurance may contribute to make CSR reporting more comprehensive in its coverage
of corporate activities and balanced in its verbal tone, it does not necessarily make reporting
clearer and more accessible. In fact, it may even run counter to these aspirations.
Our study comes with certain limitations. First, our sample comprises the largest blue
chip European firms. This implies that our findings have limited generalizability but are
mostly valid in the realm of large listed firms. Second, as already stated in the assessment
of potential endogeneity, we cannot infer from our findings that the adoption of CSR report
assurance leads to shifts in completeness, clarity, and balance.
In this, our study provides a clear starting point for future research. We have already
formulated some suggestions for further investigation: For one, it may be that assurance
providers from the financial auditor profession are introducing a more technical and ‘jargon’-
heavy language to reporting (Barnett and Loeffler, 1979) that, as a side effect, also turns out
to be less readable. Future studies on the relation of assurance and report readability could
thus investigate differences between assurance from auditing and non-auditing firms. Com-
plementary, it may also be that assurance providers ‘consult’ firms on the report under their
review (Smith et al., 2011) and actively suggest more hedged, complex statements in regard
to negative information, to avoid reputational or compliance issues. In line with Cohen and
Simnett (2015), insights on this suggestion, which concern behavior at the individual or group
decision-making level, may be won through the use of experimental or survey designs. Addi-
tionally, further research may also consider the influence of assurance on reporting principles
associated with transparency in CSR reporting that are not covered in our study or in other
studies (such as Gerwanski et al. (2019) who consider materiality). For example they may
33

consider principles of reporting content, such as stakeholder inclusiveness and sustainability
context, or of reporting quality, such as accuracy, comparability, reliability and timeliness.
Differences in association between distinct levels of assurance scope and security may also
provide a point for further inquiry.
We conduct our study for a European sample from the period 2014-2016, shortly before
non-financial reporting became mandatory for many firms from the European Union in 2017.
Nevertheless, our findings have implications for CSR reporting in the EU under the current
system. The respective Directive 2014/95/EU only demands a ‘formal’ check of assistance
of CSR disclosure by the financial statements auditor. Most countries have so far opted
to content with this minimum requirement. Consequently, substantial assurance remains a
mostly voluntary exercise to many companies in the EU. Our findings, as far as they con-
cern reporting completeness and balance, may thus promote external assurance in two ways:
For companies it may indeed present a valuable option to increase the credibility of their
CSR reports and set themselves apart from their competitors. For EU regulators, our find-
ings provide encouragement that the enforcement of substantial assurance may increase the
overall credibility of CSR reports in their sphere of influence, and thus present a valuable
contribution to the socio-economic system.
34

7 References
Arena, C., Bozzolan, S. and Michelon, G. (2015), “Environmental Reporting: Transparency
to Stakeholders or Stakeholder Manipulation? An Analysis of Disclosure Tone and the
Role of the Board of Directors”, Corporate Social Responsibility and Environmental Man-
agement, Vol. 22 No. 6, pp. 346–361.
Ashfort, B. E. and Gibbs, B. W. (1990), “The Double-Edge of Organizational Legitimation”,
Organization Science, Vol. 1 No. 2, pp. 177–194.
Backhaus, K., Erichson, B., Plinke, W. and Weiber, R. (2016), Multivariate Analysemetho-
den, 14th ed., Springer Berlin Heidelberg; Imprint: Springer Gabler, Berlin, Heidelberg.
Ball, A. and Craig, R. (2010), “Using neo-institutionalism to advance social and environmen-
tal accounting”, Critical Perspectives on Accounting, Vol. 21 No. 4, pp. 283–293.
Barnett, A. and Loeffler, K. (1979), “Readability of accounting and auditing messages”, Jour-
nal of Business Communication, Vol. 16 No. 3, pp. 49–59.
Bollas-Araya, H. M., Polo-Garrido, F. and Seguı-Mas, E. (2018), “Determinants of CSR Re-
porting and Assurance: An Analysis of Top Cooperative and Mutual Organisations”, Aus-
tralian Accounting Review, Vol. 14 No. 4, p. 97.
Braam, G. J. M., Uit de Weerd, L., Hauck, M. and Huijbregts, M. A. J. (2016), “Determi-
nants of corporate environmental reporting: the importance of environmental performance
and assurance”, Journal of Cleaner Production, Vol. 129, pp. 724–734.
Chang, J. J., Khanna, T. and Palepu, K. (2000), “Analyst Activity Around the World”,
SSRN Electronic Journal.
Cheng, B., Ioannou, I. and Serafeim, G. (2014), “Corporate social responsibility and access
to finance”, Strategic Management Journal, Vol. 35 No. 1, pp. 1–23.
Cho, C. H., Roberts, R. W. and Patten, D. M. (2010), “The language of US corporate environ-
mental disclosure”, Accounting, Organizations and Society, Vol. 35 No. 4, pp. 431–443.
Clarkson, P. M., Li, Y., Richardson, G. D. and Vasvari, F. P. (2008), “Revisiting the relation
between environmental performance and environmental disclosure: An empirical analy-
sis”, Accounting, Organizations and Society, Vol. 33 No. 4-5, pp. 303–327.
35

Cohen, J. R. and Simnett, R. (2015), “CSR and Assurance Services: A Research Agenda”,
AUDITING: A Journal of Practice & Theory, Vol. 34 No. 1, pp. 59–74.
Crawford, V. P. and Sobel, J. (1982), “Strategic Information Transmission”, Econometrica,
Vol. 50 No. 6, pp. 1431–1451.
Davis, A. K., Piger, J. M. and Sedor, L. M. (2012), “Beyond the Numbers: Measuring the
Information Content of Earnings Press Release Language”, Contemporary Accounting Re-
search, Vol. 29 No. 3, pp. 845–868.
Dhaliwal, D. S., Li, O. Z., Tsang, A. and Yang, Y.G. (2011), “Voluntary Nonfinancial Dis-
closure and the Cost of Equity Capital: The Initiation of Corporate Social Responsibility
Reporting”, The Accounting Review, Vol. 86 No. 1, pp. 59–100.
Digitext Inc. (2015), “Help Manual. DICTION 7.0”, available at: https://www.dictionsoft-
ware.com/download.php?file=wp-content/uploads/2015/07/DICTION-7.1Manual.pdf
(accessed 3 October 2019).
European Commission (2017), “Share of Member States in EU GDP”, available at: https://ec.
europa.eu/eurostat/web/products-eurostat-news/-/DDN-20170410-1 (accessed 4 Septem-
ber 2019).
Flesch, R. F. (1951), How to Test Readability, Harper, New York.
Gerwanski, J., Kordsachia, O. and Velte, P. (2019), “Determinants of materiality disclosure
quality in integrated reporting: Empirical evidence from an international setting”, Busi-
ness Strategy and the Environment, Vol. 28 No. 5, pp. 750–770.
Gomes, M. and Marsat, S. (2018), “Does CSR impact premiums in M&A transactions?”,
Finance Research Letters, Vol. 26, pp. 71–80.
Gray, R., Kouhy, R. and Lavers, S. (1995), “Corporate social and environmental reporting.
A review of the literature and a longitudinal study of UK disclosure”, Accounting, Audit-
ing & Accountability Journal, Vol. 8 No. 2, pp. 47–77.
Greene, W. H. (2008), Econometric analysis, 6th ed., Pearson internat. ed., Pearson Prentice
Hall, Upper Saddle River, NJ.
36

GRI (2013), “The external assurance of sustainability reporting”, available at: https://www.
globalreporting.org/resourcelibrary/GRI-Assurance.pdf (accessed 4 September 2019).
GRI (2018), “GRI 101: Foundation 2016”, available at: https://www.globalreporting.org
/standards/media/1036/gri-101-foundation-2016.pdf (accessed 15 September 2019).
Guidry, R. P. and Patten, D. M. (2012), “Voluntary disclosure theory and financial control
variables: An assessment of recent environmental disclosure research”, Accounting Forum,
Vol. 36 No. 2, pp. 81–90.
Gujarati, D. N. (2004), Basic econometrics, 4th ed., Tata McGraw-Hill, New Delhi, London.
Hahn, R., Reimsbach, D. and Schiemann, F. (2015), “Organizations, Climate Change, and
Transparency”, Organization & Environment, Vol. 28 No. 1, pp. 80–102.
Hanlon, M., Rajgopal, S. and Shevlin, T. (2003), “Are executive stock options associated
with future earnings?”, Journal of Accounting and Economics, Vol. 36 No. 1-3, pp. 3–43.
Healy, P. M. and Palepu, K. G. (2001), “Information asymmetry, corporate disclosure, and
the capital markets: A review of the empirical disclosure literature”, Journal of Account-
ing and Economics, No. 31, pp. 405–440.
Heckman, J. J. (1979), “Sample Selection Bias as a Specification Error”, Econometrica,
Vol. 47 No. 1, p. 153.
Hildebrandt, H. W. and Snyder, R. D. (1981), “The Pollyanna Hypothesis in Business Writ-
ing: Initial Results, Suggestions for Research”, Journal of Business Communication, Vol.
18 No. 1, pp. 5–15.
Hill, C. W. L. and Jones, T. M. (1992), “Stakeholder-Agency Theory”, Journal of Manage-
ment Studies, Vol. 29 No. 2, pp. 131–154.
Hope, O. K. (2003), “Analyst following and the influence of disclosure components, IPOs
and ownership concentration”, Asia-Pacific Journal of Accounting & Economics,
Vol. 10 No. 2, pp. 117–141.
Hummel, K. and Schlick, C. (2016), “The relationship between sustainability performance
and sustainability disclosure – Reconciling voluntary disclosure theory and legitimacy
theory”, Journal of Accounting and Public Policy, Vol. 35 No. 5, pp. 455–476.
37

Jensen, M. C. and Meckling, W.H. (1976), “Theory of the firm: Managerial behavior, agency
costs and ownership structure”, Journal of Financial Economics, Vol. 3 No. 4, pp.
305–360.
Jones, M. J. and Solomon, J. F. (2010), “Social and environmental report assurance: Some
interview evidence”, Accounting Forum, Vol. 34 No. 1, pp. 20–31.
Junior, R. M., Best, P. J. and Cotter, J. (2014), “Sustainability Reporting and Assurance: A
Historical Analysis on a World-Wide Phenomenon”, Journal of Business Ethics, Vol. 120
No. 1, pp. 1–11.
Kaya, I. (2016), “The Mandatory Social and Environmental Reporting: Evidence from
France”, Procedia - Social and Behavioral Sciences, Vol. 229, pp. 206–213.
Kolk, A. and Perego, P. (2010), “Determinants of the Adoption of Sustainability Assurance
Statements: An International Investigation”, Business Strategy and the Environment,
Vol. 3 No. 19, pp. 182–198.
KPMG (2017), “The road ahead. The KPMG Survey of Corporate Responsibility Reporting
2017”, available at: https://assets.kpmg/content/dam/kpmg/be/pdf/2017/kpmg-survey-
of-corporate-responsibility-reporting-2017.pdf (accessed 4 September 2019).
Lev, B. and Sougiannis, T. (1996), “The capitalization, amortization, and value-relevance of
R&D”, Journal of Accounting and Economics, Vol. 21 No. 1, pp. 107–138.
Lys, T., Naughton, J. P. and Wang, C. (2015), “Signaling through corporate accountability
reporting”, Journal of Accounting and Economics, Vol. 60 No. 1, pp. 56–72.
Merkl-Davies, D. M. and Brennan, N. M. (2007), “Discretionary Disclosure Strategies in Cor-
porate Narratives: Incremental Information or Impression Management?”, Journal of Ac-
counting Literature, Vol. 27, pp. 116–196.
Michelon, G., Pilonato, S. and Ricceri, F. (2015), “CSR reporting practices and the quality
of disclosure: An empirical analysis”, Critical Perspectives on Accounting, Vol. 33, pp.
59–78.
38

Moroney, R., Windsor, C. and Aw, Y. T. (2012), “Evidence of assurance enhancing the qual-
ity of voluntary environmental disclosures: an empirical analysis”, Accounting & Finance,
Vol. 52 No. 3, pp. 903–939.
Nagar, V., Petroni, K. and Wolfenzon, D. (2011), “Governance Problems in Closely Held
Corporations”, Journal of Financial and Quantitative Analysis, Vol. 46 No. 4, pp.
943–966.
Nevo, A. (2000), “Mergers with Differentiated Products: The Case of the Ready-to-Eat Ce-
real Industry”, The RAND Journal of Economics, Vol. 31 No. 3, p. 395.
Ober, S., Zhao, J. J., Davis, R. and Alexander, M.W. (1999), “Telling It Like It Is: The Use
of Certainty in Public Business Discourse”, Journal of Business Communication, Vol. 36
No. 3, pp. 280–296.
O’Dwyer, B. and Owen, D. L. (2005), “Assurance statement practice in environmental, social
and sustainability reporting: a critical evaluation”, The British Accounting Review, Vol.
37 No. 2, pp. 205–229.
O’Dwyer, B. and Owen, D. L. (2007), “Seeking Stakeholder-Centric Sustainability Assur-
ance”, Journal of Corporate Citizenship, Vol. 25, pp. 77–94.
Ruhnke, K. and Gabriel, A. (2013), “Determinants of voluntary assurance on sustainabil-
ity reports: an empirical analysis”, Journal of Business Economics, Vol. 83 No. 9, pp.
1063–1091.
Rutherford, B. A. (2003), “Obfuscation, Textual Complexity and the Role of Regulated Nar-
rative Accounting Disclosure in Corporate Governance”, Journal of Management and Gov-
ernance, Vol. 7, pp. 187–210.
S&P Indices (2019), “S&P Euro”, available at: https://us.spindices.com/indices/equity/sp-
euro (accessed 4 September 2019).
Sethi, S. P., Martell, T.F. and Demir, M. (2017), “Enhancing the Role and Effectiveness of
Corporate Social Responsibility (CSR) Reports: The Missing Element of Content Verifi-
cation and Integrity Assurance”, Journal of Business Ethics, Vol. 144 No. 1, pp. 59–82.
39
Simnett, R., Vanstraelen, A. and Chua, W. F. (2009), “Assurance on Sustainability Reports:
An International Comparison”, The Accounting Review, Vol. 84 No. 3, pp. 937–967.
Smith, J., Haniffa, R. and Fairbrass, J. (2011), “A Conceptual Framework for Investigating
‘Capture’ in Corporate Sustainability Reporting Assurance”, Journal of Business Ethics,
Vol. 99 No. 3, pp. 425–439.
Spearman, C. (1904), ”General Intelligence,” Objectively Determined and Measured”, The
American Journal of Psychology, Vol. 15 No. 2, p. 201.
Spence, M. (1973), “Job Market Signaling”, The Quarterly Journal of Economics, Vol. 87
No. 3, p. 355.
Steinmeier, M. and Stich, M. (2019), “Does Sustainability Assurance Improve Managerial
Investment Decisions?”, European Accounting Review, Vol. 28 No. 1, pp. 177–209.
Studenmund, A. H. and Johnson, B. K. (2017), Using Econometrics: A Practical Guide, 7th
ed., Pearson, Harlow, England.
Sydserff, R. and Weetman, P. (2002), “Developments in content analysis: a transitivity index
and DICTION scores”, Accounting, Auditing & Accountability Journal, Vol. 15 No. 4,
pp. 523–545.
Thomson Reuters (2018), “Thomson Reuters ESG Scores”, available at: http://zeerovery.nl
/blogfiles/esg-scores-methodology.pdf (accessed 3 October 2019).
Velte, P. (2018), “Is audit committee expertise connected with increased readability of inte-
grated reports: Evidence from EU companies”, Problems and Perspectives in Manage-
ment, Vol. 16 No. 2, pp. 23–41.
Velte, P. and Stawinoga, M. (2017), “Empirical research on corporate social responsibility
assurance (CSRA): A literature review”, Journal of Business Economics, Vol. 87 No. 8,
pp. 1017–1066.
Wasley, C. E. and Wu, J. S. (2006), “Why Do Managers Voluntarily Issue Cash Flow Fore-
casts?”, Journal of Accounting Research, Vol. 44 No. 2, pp. 389–429.
40

HHL Leipzig Graduate School of Management is a university-level institution and ranks amongst the leading international business schools. The goal of the oldest business school in German-speaking Europe is to educate effective, responsible and entrepreneurially-minded leaders. HHL stands out for its excellent teaching, its clear research focus, its effective knowledge transfer into practice as well as its outstanding student services. According to the Financial Times, HHL ranks first in Germany and fifth globally for its entrepreneurship focus within the M.Sc. and EMBA pro-grams. HHL is accredited by AACSB International. www.hhl.de
ISSN 1864-4562 (Online version)© HHL Leipzig Graduate School of Management, 2020The sole responsibility for the content of the HHL Working Paper lies with the author/s. We encourage the use of the material for teaching or research purposes with reference to the source. The reproduction, copying and distribution of the paper for non-commercial purposes is permitted on condition that the source is clearly indicated. Any commercial use of the docu-ment or parts of its content requires the written consent of the author/s.For further HHL publications see www.hhl.de/publications
Related Documents