The Rockefeller University Press $30.00 J. Cell Biol. Vol. 187 No. 3 375–384 www.jcb.org/cgi/doi/10.1083/jcb.200904140 JCB 375 JCB: Report Correspondence to Steven J. Altschuler: [email protected]; or Lani F. Wu: [email protected] Abbreviations used in this paper: AdipoQ, adiponectin; C/EBP, CCAAT/ enhancer-binding protein ; FFA, free fatty acid; HSL, hormone-sensitive lipase; LD, lipid droplet; pHSL, phospho-HSL; PPAR, peroxisome proliferator-activated receptor . Introduction Adipogenesis, the differentiation process of adipocytes from precursor cells, provides constant renewal of adipocytes and contributes to the increase of adipose tissue mass in obesity (Camp et al., 2002; Spalding et al., 2008). Many key compo- nents of adipogenesis-related pathways have been identified (Farmer, 2006). These include key transcriptional regulators, such as peroxisome proliferator-activated receptor (PPAR) and CCAAT/enhancer-binding protein (C/EBP), adipocyte- specific secretory proteins, such as adiponectin (AdipoQ), and lipolysis regulators, such as perilipin A and hormone-sensitive lipase (HSL). Temporal studies based on population-averaged measurements, such as mRNA microarrays (Soukas et al., 2001; Ross et al., 2002), Western blots (Fig. 1 a; Park et al., 2004), and quantitative PCR (Fu et al., 2005), indicate that the expression levels of these molecules increase monotonically during adipogenesis. However, significant cell to cell variability in cellular morphology and lipid accumulation has long been observed for differentiating preadipocytes (Green and Kehinde, 1975; Nan et al., 2003; Nagayama et al., 2007). Although recent studies have further demonstrated that these heterogeneous cells have distinct signaling responses to hormonal and growth factor per- turbations (Shigematsu et al., 2001; Le and Cheng, 2009), it is unknown to what extent the observed heterogeneity simply reflects stochastic phenotypic variation or the presence of mul- tiple distinct physiological states. Furthermore, the degree to which individual differentiating preadipocytes follow population- averaged trends in expression levels or respond differently to other important metabolic or pharmacological perturbations is unclear. Better characterization of heterogeneity in adipogenesis may reveal novel molecular states and subpopulation-specific responses to external perturbations that were missed in previous population-averaged studies. I ncreases in key components of adipogenesis and li- polysis pathways correlate at the population-averaged level during adipogenesis. However, differentiating pre- adipocytes are highly heterogeneous in cellular and lipid droplet (LD) morphologies, and the degree to which indi- vidual cells follow population-averaged trends is unclear. In this study, we analyze the molecular heterogeneity of differentiating 3T3-L1 preadipocytes using immuno- fluorescence microscopy. Unexpectedly, we only observe a small percentage of cells with high simultaneous expres- sion of markers for adipogenesis (peroxisome proliferator- activated receptor [PPAR], CCAAT/enhancer-binding protein , and adiponectin) and lipid accumulation (hormone-sensitive lipase, perilipin A, and LDs). Instead, we identify subpopulations of cells with negatively corre- lated expressions of these readouts. Acute perturbation of adipocyte differentiation with PPAR agonists, forskolin, and fatty acids induced subpopulation-specific effects, including redistribution of the percentage of cells in ob- served subpopulations and differential expression levels of PPAR. Collectively, our results suggested that hetero- geneity observed during 3T3-L1 adipogenesis reflects a dynamic mixture of subpopulations with distinct physi- ological states. Heterogeneity in the physiological states and pharmacological responses of differentiating 3T3-L1 preadipocytes Lit-Hsin Loo, 1,2 Hai-Jui Lin, 1,2 Dinesh K. Singh, 1,2 Kathleen M. Lyons, 1,2 Steven J. Altschuler, 1,2 and Lani F. Wu 1,2 1 Green Center for Systems Biology and 2 Department of Pharmacology, University of Texas Southwestern Medical Center, Dallas, TX 75390 © 2009 Loo et al. This article is distributed under the terms of an Attribution–Noncommercial– Share Alike–No Mirror Sites license for the first six months after the publication date (see http://www.jcb.org/misc/terms.shtml). After six months it is available under a Creative Commons License (Attribution–Noncommercial–Share Alike 3.0 Unported license, as de- scribed at http://creativecommons.org/licenses/by-nc-sa/3.0/). THE JOURNAL OF CELL BIOLOGY

Welcome message from author
This document is posted to help you gain knowledge. Please leave a comment to let me know what you think about it! Share it to your friends and learn new things together.
Transcript
The Rockefeller University Press $30.00J. Cell Biol. Vol. 187 No. 3 375–384www.jcb.org/cgi/doi/10.1083/jcb.200904140 JCB 375
JCB: Report
Correspondence to Steven J. Altschuler: [email protected]; or Lani F. Wu: [email protected] used in this paper: AdipoQ, adiponectin; C/EBP, CCAAT/enhancer-binding protein ; FFA, free fatty acid; HSL, hormone-sensitive lipase; LD, lipid droplet; pHSL, phospho-HSL; PPAR, peroxisome proliferator-activated receptor .
IntroductionAdipogenesis, the differentiation process of adipocytes from precursor cells, provides constant renewal of adipocytes and contributes to the increase of adipose tissue mass in obesity (Camp et al., 2002; Spalding et al., 2008). Many key compo-nents of adipogenesis-related pathways have been identified (Farmer, 2006). These include key transcriptional regulators, such as peroxisome proliferator-activated receptor (PPAR) and CCAAT/enhancer-binding protein (C/EBP), adipocyte-specific secretory proteins, such as adiponectin (AdipoQ), and lipolysis regulators, such as perilipin A and hormone-sensitive lipase (HSL). Temporal studies based on population-averaged measurements, such as mRNA microarrays (Soukas et al., 2001; Ross et al., 2002), Western blots (Fig. 1 a; Park et al., 2004), and quantitative PCR (Fu et al., 2005), indicate that the expression levels of these molecules increase monotonically during adipogenesis.
However, significant cell to cell variability in cellular morphology and lipid accumulation has long been observed for differentiating preadipocytes (Green and Kehinde, 1975; Nan et al., 2003; Nagayama et al., 2007). Although recent studies have further demonstrated that these heterogeneous cells have distinct signaling responses to hormonal and growth factor per-turbations (Shigematsu et al., 2001; Le and Cheng, 2009), it is unknown to what extent the observed heterogeneity simply reflects stochastic phenotypic variation or the presence of mul-tiple distinct physiological states. Furthermore, the degree to which individual differentiating preadipocytes follow population- averaged trends in expression levels or respond differently to other important metabolic or pharmacological perturbations is unclear. Better characterization of heterogeneity in adipogenesis may reveal novel molecular states and subpopulation-specific responses to external perturbations that were missed in previous population-averaged studies.
Increases in key components of adipogenesis and li-polysis pathways correlate at the population-averaged level during adipogenesis. However, differentiating pre-
adipocytes are highly heterogeneous in cellular and lipid droplet (LD) morphologies, and the degree to which indi-vidual cells follow population-averaged trends is unclear. In this study, we analyze the molecular heterogeneity of differentiating 3T3-L1 preadipocytes using immuno-fluorescence microscopy. Unexpectedly, we only observe a small percentage of cells with high simultaneous expres-sion of markers for adipogenesis (peroxisome proliferator-activated receptor [PPAR], CCAAT/enhancer-binding
protein , and adiponectin) and lipid accumulation (hormone-sensitive lipase, perilipin A, and LDs). Instead, we identify subpopulations of cells with negatively corre-lated expressions of these readouts. Acute perturbation of adipocyte differentiation with PPAR agonists, forskolin, and fatty acids induced subpopulation-specific effects, including redistribution of the percentage of cells in ob-served subpopulations and differential expression levels of PPAR. Collectively, our results suggested that hetero-geneity observed during 3T3-L1 adipogenesis reflects a dynamic mixture of subpopulations with distinct physi-ological states.
Heterogeneity in the physiological states and pharmacological responses of differentiating 3T3-L1 preadipocytes
Lit-Hsin Loo,1,2 Hai-Jui Lin,1,2 Dinesh K. Singh,1,2 Kathleen M. Lyons,1,2 Steven J. Altschuler,1,2 and Lani F. Wu1,2
1Green Center for Systems Biology and 2Department of Pharmacology, University of Texas Southwestern Medical Center, Dallas, TX 75390
© 2009 Loo et al. This article is distributed under the terms of an Attribution–Noncommercial–Share Alike–No Mirror Sites license for the first six months after the publication date (see http://www.jcb.org/misc/terms.shtml). After six months it is available under a Creative Commons License (Attribution–Noncommercial–Share Alike 3.0 Unported license, as de-scribed at http://creativecommons.org/licenses/by-nc-sa/3.0/).
TH
EJ
OU
RN
AL
OF
CE
LL
BIO
LO
GY
JCB • VOLUME 187 • NUMBER 3 • 2009 376
to their respective median values obtained from the quiescent subpopulation. Hereafter, we simply refer to these ratios as the marker levels.
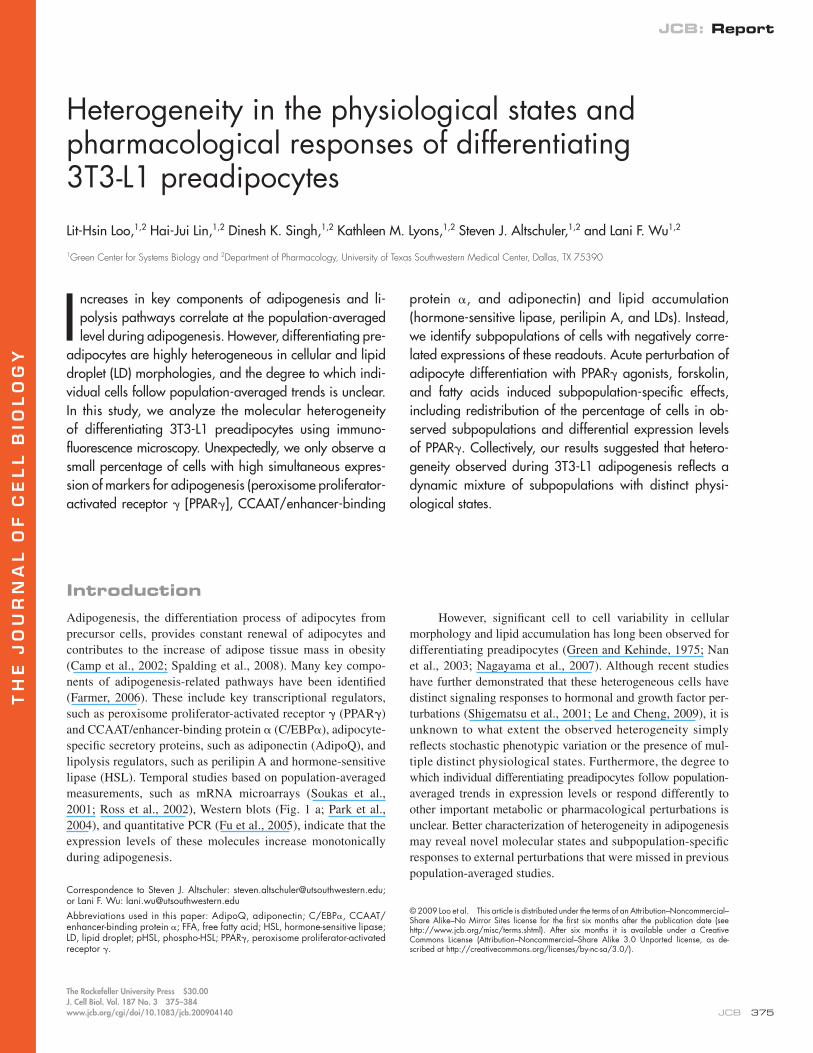
At the population-averaged level, AdipoQ, LDs, and PPAR all increased monotonically from D0 to 12, although some degree of variation in initiation times and slopes was observed (Fig. 1, a and c). In previous studies, similar temporal trends were also observed, although PPAR was seen to plateau even-tually (or even slightly decrease) earlier than other markers (Park et al., 2004; Fu et al., 2005). This difference may be be-cause of differences in differentiation rates or culture condi-tions. In any case, within the time window of our observations, these population-averaged measurements suggested that our tested markers were positively correlated to LDs (Fig. 1 c).
Characterization of 3T3-L1 adipogenesis heterogeneityOn individual differentiating 3T3-L1 cells, the levels of AdipoQ, LD, and PPAR were visibly heterogeneous (Fig. 1 b). To char-acterize the observed heterogeneity, we chose to focus on Adi-poQ and LD, which are regulated either directly (Iwaki et al., 2003) or indirectly by PPAR (Fig. 2 a). We used a Gaussian mixture model (Slack et al., 2008; Wang et al., 2008) to auto-matically cluster differentiating (i.e., nonquiescent) 3T3-L1 cells from D6 to 12 into subpopulations with similar AdipoQ and LD levels (see Materials and methods). We chose to use four sub-populations, as this number both provided a good fit to our data (Fig. S1 a) and reduced the risks of data overfitting. Similar con-clusions in our subsequent analyses would have been obtained with five or six subpopulations (unpublished data).
In this study, we applied high content image analysis (Perlman et al., 2004; Loo et al., 2007; Slack et al., 2008) to model the heterogeneity observed during adipogenesis of 3T3-L1 preadipocytes as a mixture of phenotypically distinct subpopulations. We then used this decomposition to investigate the dynamics and molecular changes that occur during adipo-genesis. Finally, we characterized redistributions and changes to the subpopulations in response to pharmacological and metabolic perturbations.
Results and discussion3T3-L1 adipogenesis at the population-averaged level3T3-L1 cells were fixed on days 3 (D3), 6, 9, and 12 after induc-tion of differentiation (Fig. 1 b) and were costained with a DNA marker and the adipogenesis markers AdipoQ (Scherer et al., 1995), PPAR (Tontonoz et al., 1994), and lipid droplets (LDs; an essential readout for adipocyte maturation). As expected, ac-cumulations of these adipogenesis markers were observed after D3. A subpopulation of fibroblast-like quiescent 3T3-L1 cells, with background levels of staining for these adipogenesis mark-ers, remained throughout the observation period.
We next quantified changes in marker intensities. First, individual cells were automatically identified (Loo et al., 2007) and manually annotated as either differentiating or quiescent (see Materials and methods). Next, for each cell, we measured the averaged cellular levels of AdipoQ and LDs and the aver-aged nuclear level of PPAR. Finally, for each differentiating cell, the three averaged marker levels were normalized as ratios
Figure 1. Population-averaged levels of adipocyte markers increased monotonically on differentiating 3T3-L1 preadipocytes. (a) West-ern blots of differentiating 3T3-L1 cells probed with antibodies for AdipoQ, PPAR, and HSL. Equal amounts of proteins were collected from each day of differentiation. For AdipoQ, only the tetramer bands are shown (D0, right before differentiation induction; D3–12, D3–12 after differentiation induction). (b) Bright field differ-ential interference contrast and immunofluores-cence images showing differentiating 3T3-L1 cells. For visualization only, marker intensity ranges were equalized across all images. (c) Comparisons of marker levels obtained from Western blots and median cell expres-sion values from immunofluorescence images (see Materials and methods). Each graph was normalized to have unit sum across all days. Bar, 150 µm.
377Heterogeneity in 3T3-L1 adipogenesis • Loo et al.
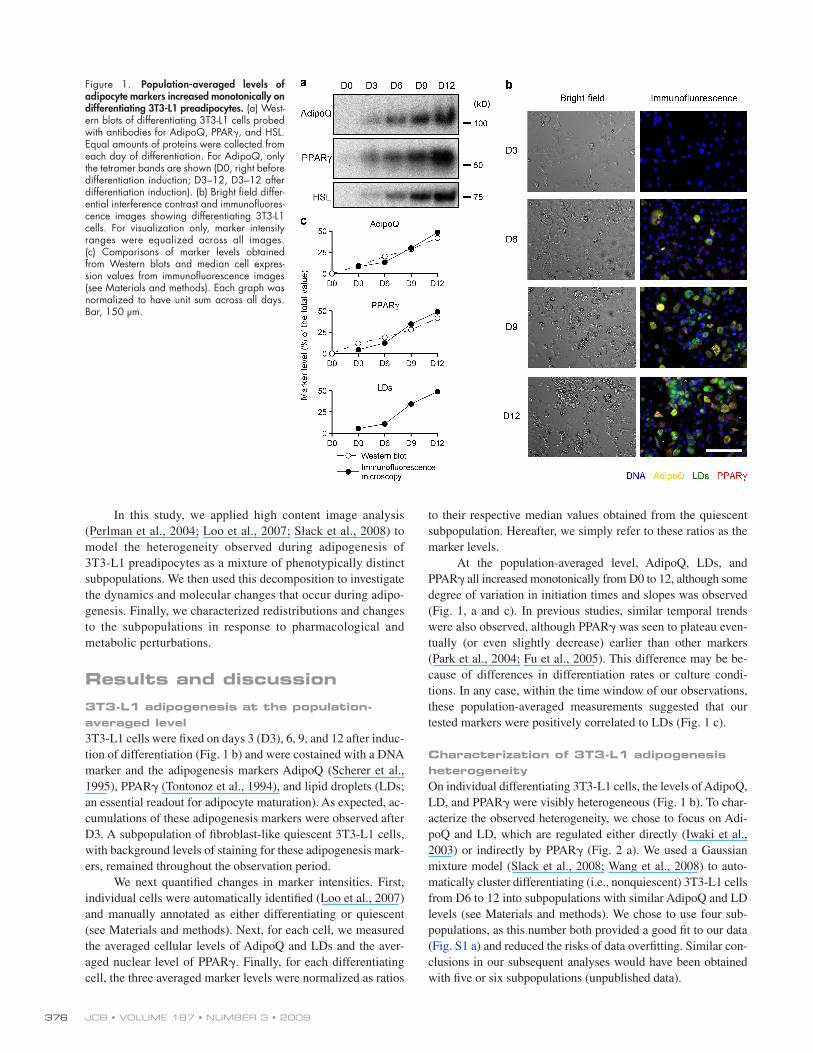
unexpected states with negatively correlated levels of AdipoQ and LDs. Interestingly, negative correlations were also observed in vivo between the serum level of AdipoQ and body mass in-dex (Arita et al., 1999) or overexpression of AdipoQ and adi-pose tissue mass (Bauche et al., 2007).
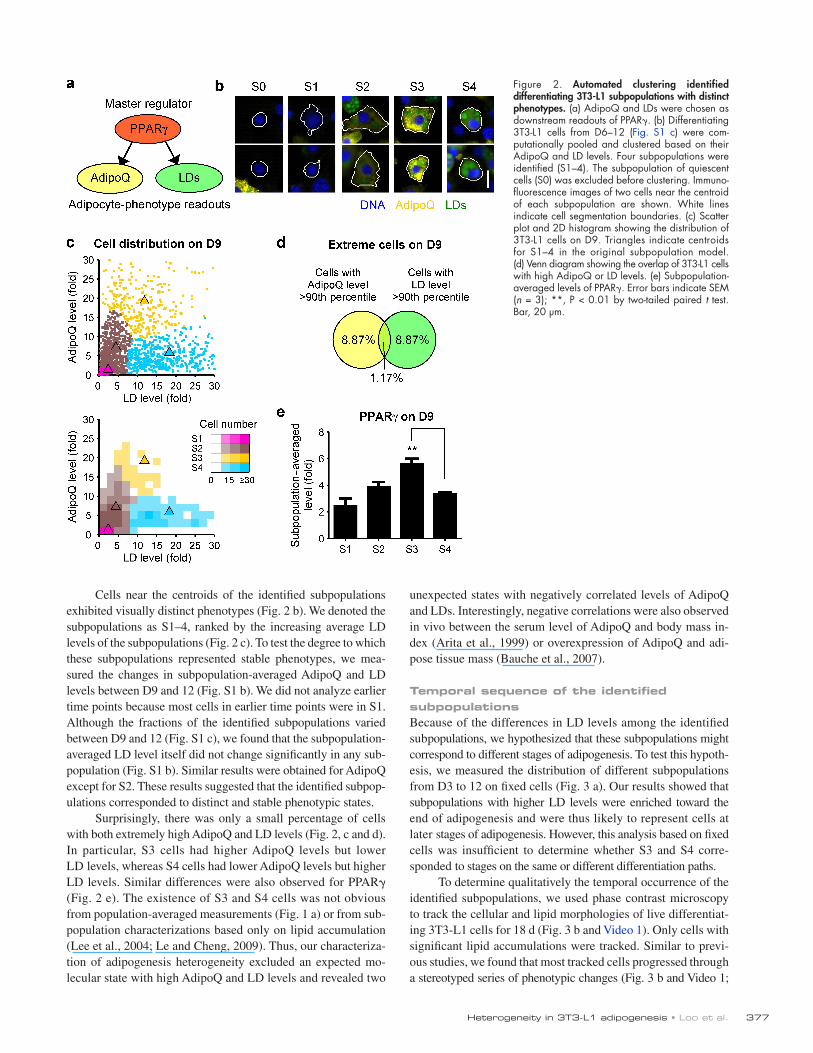
Temporal sequence of the identified subpopulationsBecause of the differences in LD levels among the identified subpopulations, we hypothesized that these subpopulations might correspond to different stages of adipogenesis. To test this hypoth-esis, we measured the distribution of different subpopulations from D3 to 12 on fixed cells (Fig. 3 a). Our results showed that subpopulations with higher LD levels were enriched toward the end of adipogenesis and were thus likely to represent cells at later stages of adipogenesis. However, this analysis based on fixed cells was insufficient to determine whether S3 and S4 corre-sponded to stages on the same or different differentiation paths.
To determine qualitatively the temporal occurrence of the identified subpopulations, we used phase contrast microscopy to track the cellular and lipid morphologies of live differentiat-ing 3T3-L1 cells for 18 d (Fig. 3 b and Video 1). Only cells with significant lipid accumulations were tracked. Similar to previ-ous studies, we found that most tracked cells progressed through a stereotyped series of phenotypic changes (Fig. 3 b and Video 1;
Cells near the centroids of the identified subpopulations exhibited visually distinct phenotypes (Fig. 2 b). We denoted the subpopulations as S1–4, ranked by the increasing average LD levels of the subpopulations (Fig. 2 c). To test the degree to which these subpopulations represented stable phenotypes, we mea-sured the changes in subpopulation-averaged AdipoQ and LD levels between D9 and 12 (Fig. S1 b). We did not analyze earlier time points because most cells in earlier time points were in S1. Although the fractions of the identified subpopulations varied between D9 and 12 (Fig. S1 c), we found that the subpopulation-averaged LD level itself did not change significantly in any sub-population (Fig. S1 b). Similar results were obtained for AdipoQ except for S2. These results suggested that the identified subpop-ulations corresponded to distinct and stable phenotypic states.
Surprisingly, there was only a small percentage of cells with both extremely high AdipoQ and LD levels (Fig. 2, c and d). In particular, S3 cells had higher AdipoQ levels but lower LD levels, whereas S4 cells had lower AdipoQ levels but higher LD levels. Similar differences were also observed for PPAR (Fig. 2 e). The existence of S3 and S4 cells was not obvious from population-averaged measurements (Fig. 1 a) or from sub-population characterizations based only on lipid accumulation (Lee et al., 2004; Le and Cheng, 2009). Thus, our characteriza-tion of adipogenesis heterogeneity excluded an expected mo-lecular state with high AdipoQ and LD levels and revealed two
Figure 2. Automated clustering identified differentiating 3T3-L1 subpopulations with distinct phenotypes. (a) AdipoQ and LDs were chosen as downstream readouts of PPAR. (b) Differentiating 3T3-L1 cells from D6–12 (Fig. S1 c) were com-putationally pooled and clustered based on their AdipoQ and LD levels. Four subpopulations were identified (S1–4). The subpopulation of quiescent cells (S0) was excluded before clustering. Immuno-fluorescence images of two cells near the centroid of each subpopulation are shown. White lines indicate cell segmentation boundaries. (c) Scatter plot and 2D histogram showing the distribution of 3T3-L1 cells on D9. Triangles indicate centroids for S1–4 in the original subpopulation model. (d) Venn diagram showing the overlap of 3T3-L1 cells with high AdipoQ or LD levels. (e) Subpopulation-averaged levels of PPAR. Error bars indicate SEM (n = 3); **, P < 0.01 by two-tailed paired t test. Bar, 20 µm.
JCB • VOLUME 187 • NUMBER 3 • 2009 378
misrepresent cellular states of single cells and why cells with widely varying lipid accumulations were observed within each of our time points (Fig. 1 b and Fig. 3 a). The dwell times of ≥1–2 d for differentiating 3T3-L1 cells in these identifiable stages accounted for our ability to identify distinct states within the fixed cell data (Fig. 2 b and Fig. S1 b). In summary, both the fixed and live cell results supported the hypothesis that the iden-tified subpopulations represented different stages of adipogene-sis ordered in time from S1 to S4. The last subpopulation, S4, likely corresponded to the terminally differentiated state.
Molecular profiles of the subpopulationsTo better understand the molecular states of the identified sub-populations, we investigated the expression levels of additional components of adipogenesis-related pathways, namely C/EBP, perilipin A, total HSL, and inactive phospho-HSL (pHSL; phos-phorylated at Ser565; Strålfors et al., 1984). In new replicate experiments, we costained cells with markers for DNA, LDs, AdipoQ, and one of the aforementioned molecules and used the
Nan et al., 2003; Nagayama et al., 2007). We manually assigned each time point in the captured live cell sequences to a subpopu-lation based on cellular and LD morphology (Fig. 3, b and c; and Table S1). Most of the cells exhibited temporal changes in cellu-lar morphology following the same order of lipid accumulation as in S1–4 (Fig. 3 d). Importantly, the reductions in cytosolic re-gions (S4 phenotypes) were almost always preceded by accumu-lations of large numbers of tiny LDs (S3 phenotypes), suggesting that S3 and S4 were subsequent stages on the same differentiation path (Fig. 3, b–d; and Video 1). For several of our tracked cells, LDs began to shrink in size after the cells were in S4, and in some cases, the LDs even vanished entirely (Fig. 3 d and Video 1).
Previous studies have shown that 3T3-L1 preadipocytes synchronously enter into mitotic clonal expansion upon uniform induction of differentiation (Gratzner et al., 1985; Tang et al., 2003), yet the subsequent time of appearance for lipid accu-mulations can be highly variable (Fig. 3 d; Nan et al., 2003; Nagayama et al., 2007). This heterogeneity provided a plausible explanation as to why population-averaged measurements could
Figure 3. Temporal ordering of the identified 3T3-L1 subpopulations. (a) Changes in the percentages of subpopulations from D3–12. (b) Differentiating 3T3-L1 cells with visible lipid accumulations were tracked for 18 d using live cell phase contrast microscopy. Significant cell morphological changes for one of the 40 tracked cells are shown. Time-lapse videos for this and two other cells are shown in Video 1. (c) Examples of fixed 3T3-L1 cells in differen-tial interference contrast (top) and immunofluorescence (bottom) from D6 to 12 that appeared similar to the cell tracked in b. (d) Bar chart showing the subpopulation assignments for all 40 tracked live cell sequences. Triangles indicate cells shown in Video 1. “Lost” refers to cells that either lost their LDs or disappeared from our view. Error bars indicate SEM (n = 3). Bars, 20 µm.
379Heterogeneity in 3T3-L1 adipogenesis • Loo et al.
perturbations might affect the distribution of the identified 3T3-L1 subpopulations. We used three classes of perturbations: PPAR agonists, cAMP-elevating agents, and fatty acids. To character-ize acute effects, we applied these perturbations for only 24 h on D8 and measured changes in the population-averaged and subpopulation-averaged marker levels. We also tested whether these perturbations induced significant numbers of cells with new phenotypes that were not modeled by our subpopulation model (see Materials and methods). Under the control condi-tions, only 4–5% of all cells were detected as having new pheno-types. Thus, for each subpopulation, we deemed an absolute change in the percentage of cells as significant when the abso-lute change was >5% of all cells.
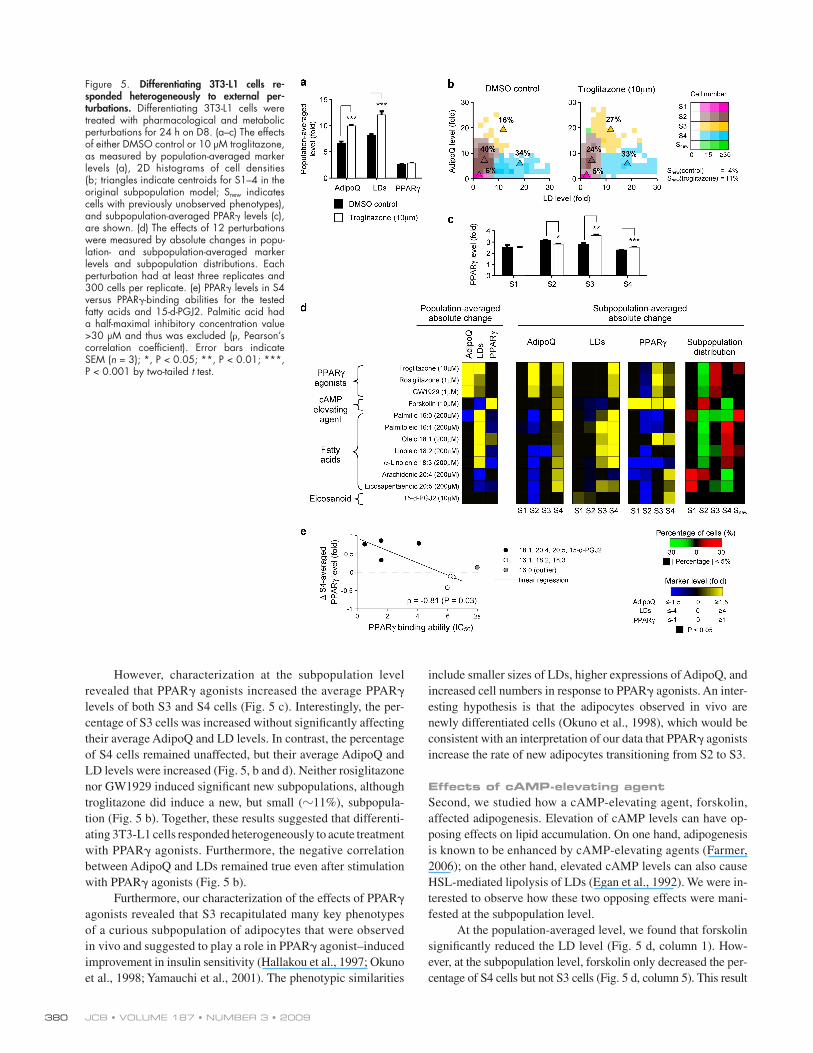
Effects of PPAR agonistsFirst, we examined the effects of three structurally dissimilar PPAR agonists: thiazolidinedione-based troglitazone and rosi-glitazone and non–thiazolidinedione-based GW1929. All three PPAR agonists increase the expressions of most PPAR down-stream targets, including AdipoQ (Iwaki et al., 2003). As ex-pected, at the population-averaged level, these drugs significantly increased AdipoQ and LD levels but did not significantly change PPAR levels (Fig. 5 a). Based on these results, one might ex-pect that PPAR agonists would have no effect on PPAR levels for all subpopulations, increase the percentages of both S3 and S4, and/or induce a new subpopulation with both high AdipoQ and LD levels.
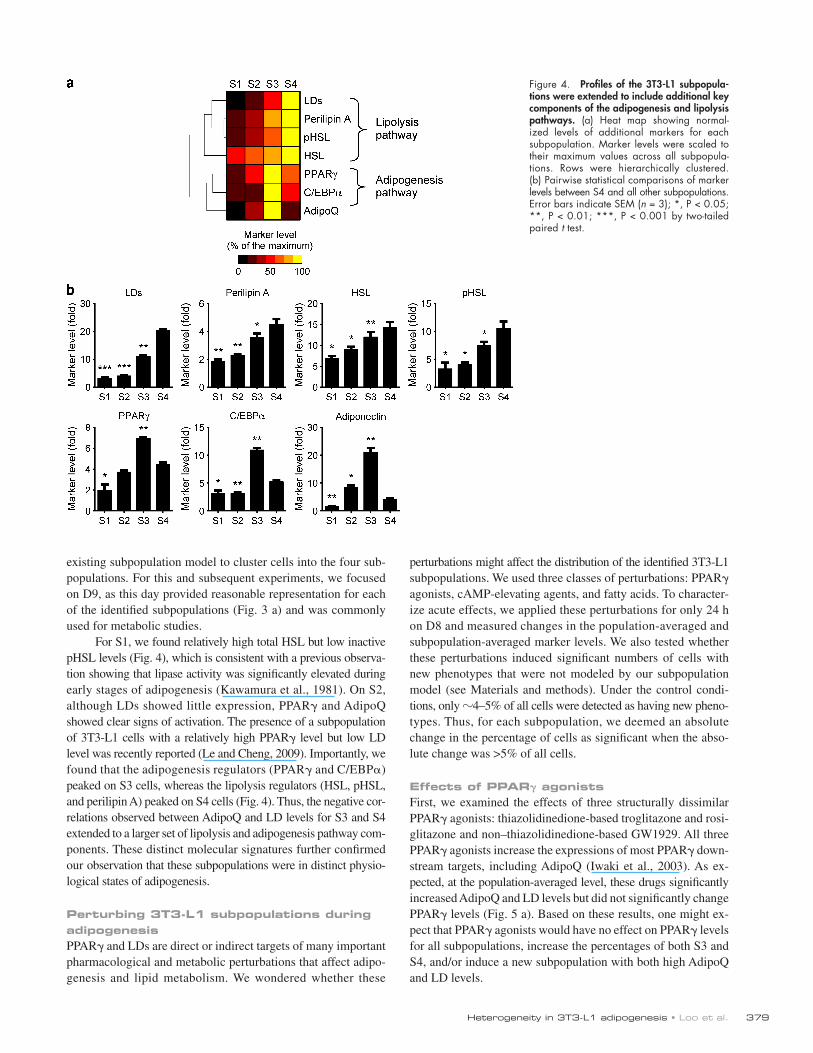
existing subpopulation model to cluster cells into the four sub-populations. For this and subsequent experiments, we focused on D9, as this day provided reasonable representation for each of the identified subpopulations (Fig. 3 a) and was commonly used for metabolic studies.
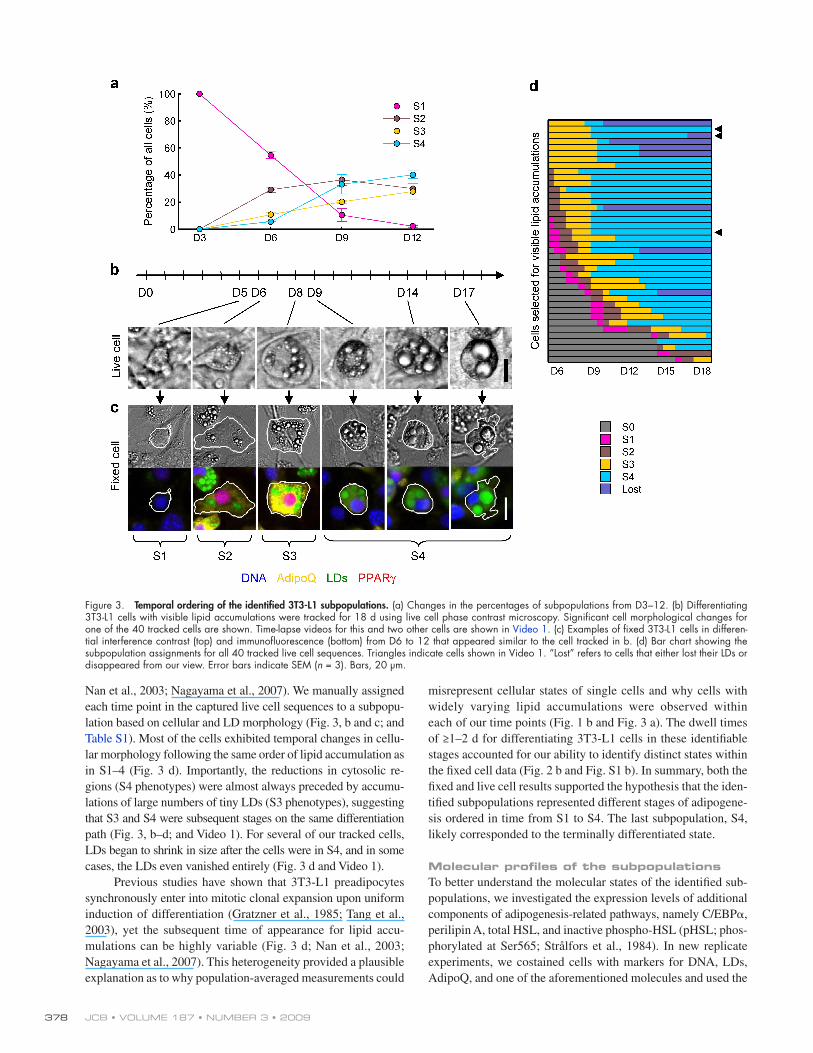
For S1, we found relatively high total HSL but low inactive pHSL levels (Fig. 4), which is consistent with a previous observa-tion showing that lipase activity was significantly elevated during early stages of adipogenesis (Kawamura et al., 1981). On S2, although LDs showed little expression, PPAR and AdipoQ showed clear signs of activation. The presence of a subpopulation of 3T3-L1 cells with a relatively high PPAR level but low LD level was recently reported (Le and Cheng, 2009). Importantly, we found that the adipogenesis regulators (PPAR and C/EBP) peaked on S3 cells, whereas the lipolysis regulators (HSL, pHSL, and perilipin A) peaked on S4 cells (Fig. 4). Thus, the negative cor-relations observed between AdipoQ and LD levels for S3 and S4 extended to a larger set of lipolysis and adipogenesis pathway com-ponents. These distinct molecular signatures further confirmed our observation that these subpopulations were in distinct physio-logical states of adipogenesis.
Perturbing 3T3-L1 subpopulations during adipogenesisPPAR and LDs are direct or indirect targets of many important pharmacological and metabolic perturbations that affect adipo-genesis and lipid metabolism. We wondered whether these
Figure 4. Profiles of the 3T3-L1 subpopula-tions were extended to include additional key components of the adipogenesis and lipolysis pathways. (a) Heat map showing normal-ized levels of additional markers for each subpopulation. Marker levels were scaled to their maximum values across all subpopula-tions. Rows were hierarchically clustered. (b) Pairwise statistical comparisons of marker levels between S4 and all other subpopulations. Error bars indicate SEM (n = 3); *, P < 0.05; **, P < 0.01; ***, P < 0.001 by two-tailed paired t test.
JCB • VOLUME 187 • NUMBER 3 • 2009 380
include smaller sizes of LDs, higher expressions of AdipoQ, and increased cell numbers in response to PPAR agonists. An inter-esting hypothesis is that the adipocytes observed in vivo are newly differentiated cells (Okuno et al., 1998), which would be consistent with an interpretation of our data that PPAR agonists increase the rate of new adipocytes transitioning from S2 to S3.
Effects of cAMP-elevating agentSecond, we studied how a cAMP-elevating agent, forskolin, affected adipogenesis. Elevation of cAMP levels can have op-posing effects on lipid accumulation. On one hand, adipogenesis is known to be enhanced by cAMP-elevating agents (Farmer, 2006); on the other hand, elevated cAMP levels can also cause HSL-mediated lipolysis of LDs (Egan et al., 1992). We were in-terested to observe how these two opposing effects were mani-fested at the subpopulation level.
At the population-averaged level, we found that forskolin significantly reduced the LD level (Fig. 5 d, column 1). How-ever, at the subpopulation level, forskolin only decreased the per-centage of S4 cells but not S3 cells (Fig. 5 d, column 5). This result
However, characterization at the subpopulation level revealed that PPAR agonists increased the average PPAR levels of both S3 and S4 cells (Fig. 5 c). Interestingly, the per-centage of S3 cells was increased without significantly affecting their average AdipoQ and LD levels. In contrast, the percentage of S4 cells remained unaffected, but their average AdipoQ and LD levels were increased (Fig. 5, b and d). Neither rosiglitazone nor GW1929 induced significant new subpopulations, although troglitazone did induce a new, but small (11%), subpopula-tion (Fig. 5 b). Together, these results suggested that differenti-ating 3T3-L1 cells responded heterogeneously to acute treatment with PPAR agonists. Furthermore, the negative correlation between AdipoQ and LDs remained true even after stimulation with PPAR agonists (Fig. 5 b).
Furthermore, our characterization of the effects of PPAR agonists revealed that S3 recapitulated many key phenotypes of a curious subpopulation of adipocytes that were observed in vivo and suggested to play a role in PPAR agonist–induced improvement in insulin sensitivity (Hallakou et al., 1997; Okuno et al., 1998; Yamauchi et al., 2001). The phenotypic similarities
Figure 5. Differentiating 3T3-L1 cells re-sponded heterogeneously to external per-turbations. Differentiating 3T3-L1 cells were treated with pharmacological and metabolic perturbations for 24 h on D8. (a–c) The effects of either DMSO control or 10 µM troglitazone, as measured by population-averaged marker levels (a), 2D histograms of cell densities (b; triangles indicate centroids for S1–4 in the original subpopulation model; Snew indicates cells with previously unobserved phenotypes), and subpopulation-averaged PPAR levels (c), are shown. (d) The effects of 12 perturbations were measured by absolute changes in popu-lation- and subpopulation-averaged marker levels and subpopulation distributions. Each perturbation had at least three replicates and 300 cells per replicate. (e) PPAR levels in S4 versus PPAR-binding abilities for the tested fatty acids and 15-d-PGJ2. Palmitic acid had a half-maximal inhibitory concentration value >30 µM and thus was excluded (, Pearson’s correlation coefficient). Error bars indicate SEM (n = 3); *, P < 0.05; **, P < 0.01; ***, P < 0.001 by two-tailed t test.
381Heterogeneity in 3T3-L1 adipogenesis • Loo et al.
of underlying biological processes (Elowitz et al., 2002; Geva-Zatorsky et al., 2006) as well as asynchrony of differentiation processes. In this study, we found that this heterogeneity also reflects the presence of a dynamically evolving mixture of pheno-typically distinct subpopulations. This finding was consistent with the hypothesis that differentiating cells transit through multiple robust and discrete phenotypic states (Waddington, 1957; Huang and Ingber, 2006–2007).
Our decomposition of heterogeneity provided new in-sights into the process of 3T3-L1 adipogenesis that were masked by population-averaged assays. In theory, correlated increases in readouts at the population-averaged level could be caused by correlated increases at the single-cell level. However, we found that AdipoQ and LD were negatively correlated in later stages of adipogenesis. Future studies with finer temporal resolution and additional markers may refine our characterization of the identified subpopulations and their physiological states. The elucidation of cellular states and dynamics during differentia-tion will improve our understanding of mechanisms underlying adipogenesis and help in the design of better therapeutic strate-gies for targeting specific subpopulations.
Materials and methodsCell culture and differentiation3T3-L1 mouse preadipocytes were obtained from American Type Culture Collection (CL-173; lot 4715281) and propagated in Dulbecco’s minimum essential medium with 4 g/liter glucose and 10% bovine calf serum (Hy-clone). Cells were regularly subcultured before reaching 70% confluence, and the passage number was kept at less than six. 3T3-L1 cells were differ-entiated according to standard methods (Sadowski et al., 1992; Engelman et al., 1999). In brief, 3T3-L1 preadipocytes were plated to a 100-mm cul-ture dish at a very high density (3–4 million in 20 ml medium) and incu-bated overnight. On the next day (D0), the medium was gently replaced with stage I differentiation medium of Dulbecco’s minimum essential medium (glucose content 4 g/liter) supplemented with 10% FBS (Gemini Bio-Products), 160 nM insulin (Sigma-Aldrich), 250 nM dexamethasone (Sigma-Aldrich), and 0.5 mM 3-isobutyl-1-methylxanthine (Sigma-Aldrich). The medium was renewed once on D2. On D3, the medium was switched to stage II differentiation medium of Dulbecco’s minimum essential medium with 10% FBS and 160 nM insulin. On D5, the medium was changed to adipocyte maintenance medium of Dulbecco’s minimum essential medium with 10% FBS supplement and was renewed every other day.
For fixed-cell assays, 40 h before fixation, differentiating cells were harvested and transferred to 384-well glass-bottom imaging plates (Thermo Fisher Scientific) pretreated with 0.01% sterile poly-L-lysine solution (molec-ular mass of 70,000–150,000 D; Sigma-Aldrich). Cells were gently washed with PBS and detached with 10 min trypsin EDTA treatment at room temperature. The detached cells were spun down by centrifugation at 900 rpm and suspended in low glucose adipocyte maintenance medium (Dulbecco’s minimum essential medium with 1 g/liter glucose and 10% FBS supplement) before being mixed and transferred to the imaging plates by hand pipetting. The optimal cell density was 7,000 cells at 50 µl in each well. Cells were settled to the bottoms of plates by centrifugation at 200 rpm for 2 min. After overnight incubation, cells were starved in defined Dulbecco’s minimum essential medium with 1 g/liter glucose and 0.5% wt/vol BSA (fatty acid free; Gemini Bio-Products) for 24 h. For live cell assays, 3T3-L1 cells were subcultured and differentiated directly onto 96-well glass-bottom imaging plates (Thermo Fisher Scientific).
Drug and fatty acid treatmentThe stock solutions of troglitazone, rosiglitazone, 15-d-PGJ2 (Cayman Chemical), GW 1929 (Enzo Life Sciences, Inc.), and forskolin (Sigma- Aldrich) were prepared either in water or DMSO depending on their stabil-ity and solubility. The BSA-bound stocks of palmitic, palmitoleic, oleic, linoleic, -linolenic, arachidonic, and eicosapentaenoic acids (Sigma- Aldrich) were prepared as 5 or 10 mM according to their solubility (Hannah et al., 2001). In brief, free fatty acids (FFAs) were dissolved with ethanol in
suggested that forskolin did not stimulate hydrolysis equally for cells in different stages of adipogenesis, which is consistent with previous studies showing that adipocytes with larger LDs (S4 phenotypes) had higher lipolytic sensitivity than adipocytes with smaller LDs (S3 phenotypes; Smith et al., 1974; Arner and Ostman, 1978).
Forskolin increased the population-averaged PPAR level (Fig. 5 d, column 1). However, unlike forskolin’s subpopulation-specific effects on LDs, the PPAR levels of all subpopula-tions were significantly increased (Fig. 5 d, column 5), even on S1 and S2 cells, whose PPAR levels were not increased by PPAR agonists. Our results indicated that forskolin’s lipo-lytic effects were more subpopulation specific than its adipo-genic effects.
Effects of fatty acidsThird, we studied the effects of seven fatty acids and the eicosa-noid 15-d-PGJ2 (15-deoxy-12,14-prostaglandin J2; Fig. 5 d). Past studies found that saturated and monounsaturated fatty acids were more effective than polyunsaturated fatty acids in increasing LD accumulation during adipogenesis (Madsen et al., 2005). However, polyunsaturated fatty acids and 15-d-PGJ2 were demonstrated to affect PPAR’s transcriptional activities directly (Forman et al., 1997; Kliewer et al., 1997). We won-dered how acute treatment with these fatty acids would affect adipogenesis at the subpopulation level.
At the population-averaged level, the responses to the tested fatty acids could be divided into two major categories. The first category consisted of fatty acids with low saturation levels (16:0, 16:1, 18:1, 18:2, and 18:3) that increased the population-averaged LD levels. At the subpopulation level, the increases of LD levels were mostly caused by enrichment of S4 cells and in-creased average LD levels of S3 and S4 cells. Palmitic (16:0) and linoleic (18:2) acids also induced new subpopulations that had extremely high average LD levels (94- and 41-fold over qui-escent cells). Most of the fatty acids in this category did not increase PPAR level at both the population-averaged and subpopulation levels. The only exception was oleic acid, which increased PPAR levels on S3 and S4 cells.
The second category consisted of polyunsaturated fatty acids with high saturation levels (20:4 and 20:5) and 15-d-PGJ2 that did not increase the population-averaged LD level. These fatty acids increased the percentage of cells that had few and small LDs (S1). Interestingly, although these perturbations did not increase population-averaged PPAR levels, they signifi-cantly increased the PPAR level of S4 cells (Fig. 5 d). In fact, for the fatty acids in our study, we found that their half-maximal inhibitory concentration values in a PPAR-binding competi-tion assay (Kliewer et al., 1997; Xu et al., 1999) were highly correlated to their effects on S4-averaged PPAR levels (Fig. 5 e). Together, our results suggested that different categories of fatty acids affected the identified subpopulations differently.
ConclusionsDifferentiating 3T3-L1 preadipocytes are highly heterogeneous in their cellular and lipid morphologies. Some aspects of this observed heterogeneity likely reflect the intrinsic stochasticity
JCB • VOLUME 187 • NUMBER 3 • 2009 382
with 5% BSA in TBST for 2 h at room temperature, membranes were incu-bated with the appropriate dilutions of primary antibodies, namely anti-PPAR at 1:1,000, anti-HSL at 1:1,000 (Cell Signaling Technology), and anti-AdipoQ at 1:10,000 (provided by P.E. Scherer) overnight. After incu-bation, the membrane was washed with TBST five times followed by incu-bation with HRP-conjugated secondary antibody (1:10,000) in 5% BSA for 1 h. The membranes were washed for 30 min after the incubation period. Target proteins were visualized by enhanced chemiluminescence. The Gel Analyzer function in ImageJ (version 1.41o; National Institutes of Health) was used to quantify the captured images of Western blots.
Fixed- and live cell imagingFor fixed-cell imaging, we used a 20× objective on an inverted fluores-cence microscope (TE-2000; Nikon) equipped with a 12-bit charge- coupled device camera (CoolSNAP HQ; Photometrics) controlled by MetaMorph software (version 7.1; Universal Imaging). 16 images were ac-quired for each imaging well. We subtracted background intensities from the images using the rolling ball algorithm in ImageJ software (version1.38l) and stitched the 16 images together using the TurboReg plugin (http://bigwww.epfl.ch/thevenaz/turboreg). For live cell imaging, we used a 20× phase contrast objective on an inverted light microscope (TS-100; Nikon) equipped with a 12-bit color charge-coupled device camera (DS-Fi1; Nikon) controlled by a control unit (DS-L1; Nikon). Two color images were taken per day (12 h apart) from D5 to 18. The color images were con-verted into grayscale by averaging all of the color channels, and the inten-sity values were automatically scaled by using the imadjust function in Matlab (version 2007a; Mathworks) with default parameters. Individual cells were manually tracked from the captured image sequences.
Cell categorization and quantificationAll image and data analyses were performed using Matlab software. We applied a previously developed segmentation algorithm (Loo et al., 2007) to automatically identify the cellular and nuclear regions for each 3T3-L1 cell. Although low marker staining levels tended to result in underestimation of cellular areas (Fig. S2 a), in general, estimated marker levels were still strongly and positively correlated to the “ground truth” (Fig. S2 b). Further-more, subpopulation statistics were similar regardless of whether cellular regions were identified by the automated or manual segmentation proce-dures (Fig. S2 c). Once automatically segmented, cells were manually cate-gorized into one of the two mutually exclusive categories: quiescent and differentiating. Quiescent cells showed no sign of differentiation, as indi-cated by a lack of visible PPAR and AdipoQ expressions and lipid accu-mulations. The only significant staining on these cells was the DNA marker (Fig. 2 b, S0), and thus, these cells could be easily distinguished from other cells by their round cellular boundary around the nucleus. All nonquiescent cells were categorized as differentiating. We identified 500 differentiat-ing cells per replicate per time point. During the categorization process, overlapping or badly segmented cells were also discarded from further analysis. After categorization, the average cellular or nuclear level of a marker was quantified by summing the intensity values from all pixels in the cellular or nuclear region, respectively, and dividing the resulting total value with the corresponding number of pixels. Finally, each marker level was normalized by the median values measured from the quiescent cells as described in Results and discussion.
Data analysisTo identify subpopulations, cells were computationally pooled from all rep-licates of D6, 9, and 12 (each day had three replicates) and were equally subsampled by 1:9. A standard expectation maximization algorithm (ver-sion 3.2; NetLab Toolbox; http://www.ncrg.aston.ac.uk/netlab/index .php) was applied to the resulting cell samples to determine the optimum Gaussian mixture models (Slack et al., 2008). We tried 2–10 clusters (Fig. S1 a). To identify new phenotypes, a standard one-dimensional sup-port vector machine (version 2.88; libsvm Toolbox; http://www.csie.ntu .edu.tw/~cjlin/libsvm) was used (Schölkopf et al., 2001). We fixed the parameter to be 0.001 and used a fivefold cross-validation to determine the optimum value of the parameter that gave us 99% training classifica-tion accuracy. For our dataset, the optimum was found to be 2.96 × 10³. To perform hierarchical clustering of Fig. 4, we used the clustergram function of Matlab and set the parameters to be cosine distance and single linkage. Before clustering, the subpopulation-averaged level for each marker was first computed, subtracted by one (as the minimum possible value was onefold), and divided by the maximum value across all subpop-ulations. All statistical analyses were performed using the Statistics Toolbox (version 6.0) in Matlab.
scintillation tubes, and their sodium salts were precipitated with 5 M NaOH solution. After ethanol was blow dried with a gentle argon stream, the so-dium salts of FFAs were reconstituted with sodium chloride at 0.9% wt/vol and 24% BSA (fatty acid free) by stirring continuously at room temperature. The final concentration of BSA was 10% in 0.15 M NaCl solution. The BSA-bound FFA solutions were aliquoted in microtubes evacuated with argon and frozen at 20°C. We note that under control conditions, S2–4 had lower PPAR levels than our earlier time course and molecular-profiling re-sults (Fig. 5 c [black bars] vs. Figs. 2 e and 4 b), potentially as a result of the presence of DMSO and BSA. However, there was no significant change in the AdipoQ and LD levels under the control conditions (Fig. 2 c vs. Fig. 5 b [left]), and thus, the original subpopulation model was still applicable.
For the following steps of medium changes, drug applications, and vital dye staining, a Laboratory Automation Workstation (Biomek FX; Beckman Coulter) was used. Maintenance medium in the imaging plate was replaced with 50 µl of defined medium 16 h after the cells were transferred to imaging plates, and 25 µl freshly prepared drug working stocks (diluted with defined medium) were dispensed onto the plates and incubated for 24 h. The final concentrations of DMSO and BSA in the medium were compensated to 0.3% and 0.5% wt/vol, respectively, for control and drug-treated sets. The final concentrations of all perturbations can be found in Fig. 5 d.
Immunofluorescence staining4,4-difluoro-1,3,5,7,8-pentamethyl-4-bora-3a,4a-diaza-s-indacene (BODIPY 493/503; Invitrogen) was used to stain LDs at the concentration of 1 µg/liter in Dulbecco’s minimum essential medium. After a 30-min incu-bation, cells were washed once with Dulbecco’s minimum essential medium and immediately fixed with 4% PFA (Electron Microscopy Sciences) in PBS for 15 min at room temperature. The PFA solution was kept warm at 37°C until being added to the plate with an automatic microplate dispenser (Matrix WellMate; Thermo Fisher Scientific). At the end of incubation, the fixative was quickly flicked out and quenched with 50 mM ammonium chloride. After a 10-min incubation, the cell plate was gently rinsed three times with TBS using a plate washer (ELX405; BioTek).
The following primary antibodies were used: anti-HSL, anti-pHSL (Ser565), anti-PPAR, anti-C/EBP (rabbit polyclonal; Cell Signaling Tech-nology), antiperilipin (rabbit polyclonal; Abcam), and anti-AdipoQ (mouse monoclonal; provided by P.E. Scherer, University of Texas Southwestern Medical Center, Dallas, TX). The following secondary antibodies were used: Alexa Fluor 647–conjugated anti–rabbit and Alexa Fluor 546–conjugated anti–mouse immunoglobulin (Invitrogen). Fixed 3T3-L1 cells were permea-bilized with 0.2% Triton X-100 in TBS for 5 min and washed twice with TBS on a plate washer (ELX405). Blocking solution of 5% BSA in TBST was added for a 1-h incubation and replaced with different primary antibody combinations (one from mouse and one from rabbit) diluted in blocking so-lution. The plates were tightly sealed with Parafilm and incubated at 4°C overnight. The primary antibodies were thoroughly rinsed off three times with TBS and once with blocking buffer. Each wash took at least a 10-min incubation time. The fixed cells were further incubated with fluorescence-labeled secondary antibodies for 1 h and washed three times with TBST. Finally, 2 µg/ml Hoechst (Invitrogen) was introduced to highlight nuclei. After two TBS washes, the plates were preserved in 0.1% freshly prepared sodium azide at 4°C.
Subcellular protein fractionationA subcellular protein fractionation kit (Thermo Fisher Scientific) was used to fractionate proteins into nuclear and cytoplasmic fractions using the manu-facturer’s protocol. The supernatants obtained from the cytoplasmic, mem-brane, and cytoskeletal fractions were pooled together to form the nonnuclear fraction. The nuclear fraction was saved separately. Next, chilled acetone was added at four times the volume of the supernatant for each of the nuclear and nonnuclear fractions and incubated at 20°C for 1 h. After incubation, the fractions were centrifuged at 16,000 g for 10 min to precipitate the proteins. The supernatant was discarded, and the pellet was air dried. To each of the pellets, 100 µl Tris buffer, pH 7.0, was added. Protein concentration was estimated, and the samples were boiled with 2× SDS sample loading buffer.
Western blot analysesA Bradford protein assay (Protein Assay kit; Bio-Rad Laboratories) was used to quantify the concentrations of proteins presented in the samples collected from each day of differentiation. 10 µg of protein was loaded in a 4–20% gradient SDS polyacrylamide gel, subjected to electrophoresis for 2 h, and transferred to Immobilon-P membrane (Millipore). After blocking
383Heterogeneity in 3T3-L1 adipogenesis • Loo et al.
Iwaki, M., M. Matsuda, N. Maeda, T. Funahashi, Y. Matsuzawa, M. Makishima, and I. Shimomura. 2003. Induction of adiponectin, a fat-derived antidia-betic and antiatherogenic factor, by nuclear receptors. Diabetes. 52:1655–1663. doi:10.2337/diabetes.52.7.1655
Kawamura, M., D.F. Jensen, E.V. Wancewicz, L.L. Joy, J.C. Khoo, and D. Steinberg. 1981. Hormone-sensitive lipase in differentiated 3T3-L1 cells and its activation by cyclic AMP-dependent protein kinase. Proc. Natl. Acad. Sci. USA. 78:732–736. doi:10.1073/pnas.78.2.732
Kliewer, S.A., S.S. Sundseth, S.A. Jones, P.J. Brown, G.B. Wisely, C.S. Koble, P. Devchand, W. Wahli, T.M. Willson, J.M. Lenhard, and J.M. Lehmann. 1997. Fatty acids and eicosanoids regulate gene expression through direct interactions with peroxisome proliferator-activated re-ceptors alpha and gamma. Proc. Natl. Acad. Sci. USA. 94:4318–4323. doi:10.1073/pnas.94.9.4318
Le, T.T., and J.X. Cheng. 2009. Single-cell profiling reveals the origin of pheno-typic variability in adipogenesis. PLoS One. 4:e5189. doi:10.1371/journal .pone.0005189
Lee, Y.H., S.Y. Chen, R.J. Wiesner, and Y.F. Huang. 2004. Simple flow cytomet-ric method used to assess lipid accumulation in fat cells. J. Lipid Res. 45:1162–1167. doi:10.1194/jlr.D300028-JLR200
Loo, L.H., L.F. Wu, and S.J. Altschuler. 2007. Image-based multivariate profiling of drug responses from single cells. Nat. Methods. 4:445–453.
Madsen, L., R.K. Petersen, and K. Kristiansen. 2005. Regulation of adipocyte differentiation and function by polyunsaturated fatty acids. Biochim. Biophys. Acta. 1740:266–286.
Nagayama, M., T. Uchida, and K. Gohara. 2007. Temporal and spatial variations of lipid droplets during adipocyte division and differentiation. J. Lipid Res. 48:9–18. doi:10.1194/jlr.M600155-JLR200
Nan, X., J.X. Cheng, and X.S. Xie. 2003. Vibrational imaging of lipid droplets in live fibroblast cells with coherent anti-Stokes Raman scattering micros-copy. J. Lipid Res. 44:2202–2208. doi:10.1194/jlr.D300022-JLR200
Okuno, A., H. Tamemoto, K. Tobe, K. Ueki, Y. Mori, K. Iwamoto, K. Umesono, Y. Akanuma, T. Fujiwara, H. Horikoshi, et al. 1998. Troglitazone in-creases the number of small adipocytes without the change of white adi-pose tissue mass in obese Zucker rats. J. Clin. Invest. 101:1354–1361. doi:10.1172/JCI1235
Park, B.-H., L. Qiang, and S.R. Farmer. 2004. Phosphorylation of C/EBPbeta at a consensus extracellular signal-regulated kinase/glycogen synthase kinase 3 site is required for the induction of adiponectin gene expression during the differentiation of mouse fibroblasts into adipocytes. Mol. Cell. Biol. 24:8671–8680. doi:10.1128/MCB.24.19.8671-8680.2004
Perlman, Z.E., M.D. Slack, Y. Feng, T.J. Mitchison, L.F. Wu, and S.J. Altschuler. 2004. Multidimensional drug profiling by automated microscopy. Science. 306:1194–1198. doi:10.1126/science.1100709
Ross, S.E., R.L. Erickson, I. Gerin, P.M. DeRose, L. Bajnok, K.A. Longo, D.E. Misek, R. Kuick, S.M. Hanash, K.B. Atkins, et al. 2002. Microarray analyses during adipogenesis: understanding the effects of Wnt sig-naling on adipogenesis and the roles of liver X receptor alpha in adi-pocyte metabolism. Mol. Cell. Biol. 22:5989–5999. doi:10.1128/MCB .22.16.5989-5999.2002
Sadowski, H.B., T.T. Wheeler, and D.A. Young. 1992. Gene expression during 3T3-L1 adipocyte differentiation. Characterization of initial responses to the inducing agents and changes during commitment to differentiation. J. Biol. Chem. 267:4722–4731.
Scherer, P.E., S. Williams, M. Fogliano, G. Baldini, and H.F. Lodish. 1995. A novel serum protein similar to C1q, produced exclusively in adipocytes. J. Biol. Chem. 270:26746–26749. doi:10.1074/jbc.270.45.26746
Schölkopf, B., J.C. Platt, J. Shawe-Taylor, A.J. Smola, and R.C. Williamson. 2001. Estimating the support of a high-dimensional distribution. Neural Comput. 13:1443–1471. doi:10.1162/089976601750264965
Shigematsu, S., S.L. Miller, and J.E. Pessin. 2001. Differentiated 3T3L1 adipo-cytes are composed of heterogenous cell populations with distinct recep-tor tyrosine kinase signaling properties. J. Biol. Chem. 276:15292–15297. doi:10.1074/jbc.M009684200
Slack, M.D., E.D. Martinez, L.F. Wu, and S.J. Altschuler. 2008. Characterizing heterogeneous cellular responses to perturbations. Proc. Natl. Acad. Sci. USA. 105:19306–19311. doi:10.1073/pnas.0807038105
Smith, U., J. Kral, and P. Björntorp. 1974. Influence of dietary fat and carbohy-drate on the metabolism of adipocytes of different size in the rat. Biochim. Biophys. Acta. 337:278–285.
Soukas, A., N.D. Socci, B.D. Saatkamp, S. Novelli, and J.M. Friedman. 2001. Distinct transcriptional profiles of adipogenesis in vivo and in vitro. J. Biol. Chem. 276:34167–34174. doi:10.1074/jbc.M104421200
Spalding, K.L., E. Arner, P.O. Westermark, S. Bernard, B.A. Buchholz, O. Bergmann, L. Blomqvist, J. Hoffstedt, E. Näslund, T. Britton, et al. 2008. Dynamics of fat cell turnover in humans. Nature. 453:783–787. doi:10.1038/nature06902
Strålfors, P., P. Björgell, and P. Belfrage. 1984. Hormonal regulation of hormone-sensitive lipase in intact adipocytes: identification of phosphorylated sites
Online supplemental materialFig. S1 shows the change in subpopulation phenotypes over time. Fig. S2 shows the dependency of marker level estimation with respect to cellular area estimation. Video 1 shows the temporal changes of cellular and lipid morphologies of three selected cells from Fig. 3 d. Table S1 shows the criteria used for manual subpopulation assignment. Online supplemental material is available at http://www.jcb.org/cgi/content/full/jcb.200904140/DC1.
We thank members of the Altschuler and Wu laboratory for critical discussions and assistance with manual cell categorization, Dr. P.E. Scherer for the gift of the AdipoQ antibodies, and Drs. S. Kliewer, D. Mangelsdorf, J. Repa, E. Ross, and P.E. Scherer for helpful discussions.
This work was funded by the National Institutes of Health (grant R01 GM081549 to L.F. Wu), the Welch Foundation (grants I-1619 and I-1644 to L.F. Wu and S.J. Altschuler), and the University of Texas Southwestern Endow-ment for Scholars in Biomedical Research (to L.F. Wu and S.J. Altschuler).
Submitted: 27 April 2009Accepted: 30 September 2009
ReferencesArita, Y., S. Kihara, N. Ouchi, M. Takahashi, K. Maeda, J. Miyagawa, K. Hotta,
I. Shimomura, T. Nakamura, K. Miyaoka, et al. 1999. Paradoxical de-crease of an adipose-specific protein, adiponectin, in obesity. Biochem. Biophys. Res. Commun. 257:79–83. doi:10.1006/bbrc.1999.0255
Arner, P., and J. Ostman. 1978. Relationship between the tissue level of cyclic AMP and the fat cell size of human adipose tissue. J. Lipid Res. 19:613–618.
Bauche, I.B., S.A. El Mkadem, A.M. Pottier, M. Senou, M.C. Many, R. Rezsohazy, L. Penicaud, N. Maeda, T. Funahashi, and S.M. Brichard. 2007. Overexpression of adiponectin targeted to adipose tissue in trans-genic mice: impaired adipocyte differentiation. Endocrinology. 148:1539–1549. doi:10.1210/en.2006-0838
Camp, H.S., D. Ren, and T. Leff. 2002. Adipogenesis and fat-cell function in obesity and diabetes. Trends Mol. Med. 8:442–447. doi:10.1016/S1471- 4914(02)02396-1
Egan, J.J., A.S. Greenberg, M.K. Chang, S.A. Wek, M.C. Moos Jr., and C. Londos. 1992. Mechanism of hormone-stimulated lipolysis in adipocytes: translo-cation of hormone-sensitive lipase to the lipid storage droplet. Proc. Natl. Acad. Sci. USA. 89:8537–8541. doi:10.1073/pnas.89.18.8537
Elowitz, M.B., A.J. Levine, E.D. Siggia, and P.S. Swain. 2002. Stochastic gene expression in a single cell. Science. 297:1183–1186. doi:10.1126/ science.1070919
Engelman, J.A., A.H. Berg, R.Y. Lewis, A. Lin, M.P. Lisanti, and P.E. Scherer. 1999. Constitutively active mitogen-activated protein kinase kinase 6 (MKK6) or salicylate induces spontaneous 3T3-L1 adipogenesis. J. Biol. Chem. 274:35630–35638. doi:10.1074/jbc.274.50.35630
Farmer, S.R. 2006. Transcriptional control of adipocyte formation. Cell Metab. 4:263–273. doi:10.1016/j.cmet.2006.07.001
Forman, B.M., J. Chen, and R.M. Evans. 1997. Hypolipidemic drugs, polyunsat-urated fatty acids, and eicosanoids are ligands for peroxisome proliferator-activated receptors alpha and delta. Proc. Natl. Acad. Sci. USA. 94: 4312–4317. doi:10.1073/pnas.94.9.4312
Fu, M., T. Sun, A.L. Bookout, M. Downes, R.T. Yu, R.M. Evans, and D.J. Mangelsdorf. 2005. A nuclear receptor atlas: 3T3-L1 adipogenesis. Mol. Endocrinol. 19:2437–2450. doi:10.1210/me.2004-0539
Geva-Zatorsky, N., N. Rosenfeld, S. Itzkovitz, R. Milo, A. Sigal, E. Dekel, T. Yarnitzky, Y. Liron, P. Polak, G. Lahav, and U. Alon. 2006. Oscillations and variability in the p53 system. Mol. Syst. Biol. doi:10.1038/msb4100068.
Gratzner, H.G., P.M. Ahmad, J. Stein, and F. Ahmad. 1985. Flow cytometric analysis of DNA replication during the differentiation of 3T3-L1 preadi-pocytes. Cytometry. 6:563–569. doi:10.1002/cyto.990060610
Green, H., and O. Kehinde. 1975. An established preadipose cell line and its dif-ferentiation in culture. II. Factors affecting the adipose conversion. Cell. 5:19–27. doi:10.1016/0092-8674(75)90087-2
Hallakou, S., L. Doaré, F. Foufelle, M. Kergoat, M. Guerre-Millo, M.F. Berthault, I. Dugail, J. Morin, J. Auwerx, and P. Ferré. 1997. Pioglitazone induces in vivo adipocyte differentiation in the obese Zucker fa/fa rat. Diabetes. 46:1393–1399. doi:10.2337/diabetes.46.9.1393
Hannah, V.C., J. Ou, A. Luong, J.L. Goldstein, and M.S. Brown. 2001. Unsaturated fatty acids down-regulate srebp isoforms 1a and 1c by two mechanisms in HEK-293 cells. J. Biol. Chem. 276:4365–4372. doi:10.1074/jbc .M007273200
Huang, S., and D.E. Ingber. 2006–2007. A non-genetic basis for cancer progres-sion and metastasis: self-organizing attractors in cell regulatory networks. Breast Dis. 26:27–54.
JCB • VOLUME 187 • NUMBER 3 • 2009 384
and effects on the phosphorylation by lipolytic hormones and insulin. Proc. Natl. Acad. Sci. USA. 81:3317–3321. doi:10.1073/pnas.81.11.3317
Tang, Q.Q., T.C. Otto, and M.D. Lane. 2003. Mitotic clonal expansion: a syn-chronous process required for adipogenesis. Proc. Natl. Acad. Sci. USA. 100:44–49. doi:10.1073/pnas.0137044100
Tontonoz, P., E. Hu, and B.M. Spiegelman. 1994. Stimulation of adipogenesis in fibroblasts by PPAR gamma 2, a lipid-activated transcription factor. Cell. 79:1147–1156. doi:10.1016/0092-8674(94)90006-X
Waddington, C.H. 1957. The Strategy of the Genes; a discussion of some aspects of theoretical biology. Allen & Unwin, London. 262 pp.
Wang, J., X. Zhou, P.L. Bradley, S.F. Chang, N. Perrimon, and S.T. Wong. 2008. Cellular phenotype recognition for high-content RNA interfer-ence genome-wide screening. J. Biomol. Screen. 13:29–39. doi:10.1177/ 1087057107311223
Xu, H.E., M.H. Lambert, V.G. Montana, D.J. Parks, S.G. Blanchard, P.J. Brown, D.D. Sternbach, J.M. Lehmann, G.B. Wisely, T.M. Willson, et al. 1999. Molecular recognition of fatty acids by peroxisome proliferator-activated receptors. Mol. Cell. 3:397–403. doi:10.1016/S1097-2765(00)80467-0
Yamauchi, T., J. Kamon, H. Waki, K. Murakami, K. Motojima, K. Komeda, T. Ide, N. Kubota, Y. Terauchi, K. Tobe, et al. 2001. The mechanisms by which both heterozygous peroxisome proliferator-activated receptor gamma (PPARgamma) deficiency and PPARgamma agonist improve insulin resis-tance. J. Biol. Chem. 276:41245–41254. doi:10.1074/jbc.M103241200
Related Documents