H ILL IN I S UNIVERSITY OF ILLINOIS AT URBANA-CHAMPAIGN PRODUCTION NOTE University of Illinois at Urbana-Champaign Library Large-scale Digitization Project, 2007.

Welcome message from author
This document is posted to help you gain knowledge. Please leave a comment to let me know what you think about it! Share it to your friends and learn new things together.
Transcript
HILL IN I SUNIVERSITY OF ILLINOIS AT URBANA-CHAMPAIGN
PRODUCTION NOTE
University of Illinois atUrbana-Champaign Library
Large-scale Digitization Project, 2007.

UNIVERSITY OF ILLINOIS BULLETINISSUED WEEKLY
Vol. XXVII June 17, 1930 No. 42
[Entered as second-class matter December 11, 1912, at the post office at Urbana, Illinois, underthe Act of August 24, 1912. Acceptance for mailing at the special rate of postage provided
for in section 1103, Act of October 3, 1917, authorized July 31, 1918.]
HEAT TRANSFER IN AMMONIAcONI)ENSERS
PART III
BY
ALONZO P. KRATZHORACE J. MACINTIRE
/RICHARD E. GOULD
BULLETIN No. 209ENGINEERING EXPERIMENT STATION
PuusumIa BSY THE UNiTErvasr OF ILtINOIS, UABANA
PrICs: THIrY-Frv CkNTs
T HE Engineering Experiment Station was established by actof the Board of Trustees of the University of Illinois on De-cember 8, 1903. It is the purpose of the Station to conduct
investigations and make studies of importance to the engineering,
manufacturing, railway, mining, and other industrial interests of the
State.The management of the Engineering Experiment Station is vested
in an Executive Staff composed of the Director and his Assistant, theHeads of the several Departments in the College of Engineering, and
the Professor of Industrial Chemistry. This Staff is responsible forthe establishment of general policies governing the work of the Station,
including the approval of material for publication. All members ofthe teaching staff of the College are encouraged to engage in scientificresearch, either directly or in co5peration with the Research" Corpscomposed of full-time research assistants, research graduate assistants,and special investigators.
To render the results of its scientific investigations available tothe public, the Engineering Experiment Station publishes and dis-tributes a series of bulletins. Occasionally it publishes circulars oftimely interest, presenting information of importance, compiled fromvarious sources which may not readily be accessible to the clienteleof the Station.
The volume and number at the top of the front cover page are7 merely arbitrary numbers and refer to the general publications of the
University. Either above the title or below the seal isgiven the num-ber of the Engineering Experiment Station bulletin or circular whichshould be used in referring to these publications.
For copies of bulletins or circulars or for other information addressTHE ENGINEERING EXPERIMENT STATION,
UNIVERSITY OF ILLINOIS,
UEBANA, ILLINOIS
UNIVERSITY OF ILLINOIS
ENGINEERING EXPERIMENT STATION
BULLETIN No. 209 JUNE, 1930
HEAT TRANSFER IN AMMONIA CONDENSERS
PART III
BY
ALONZ(O P. KRATZRESEARCH PROFESSOR, ENGINEERING EXPERIMENT STATION
HORACE J. MACINTIREASSOCIATE PROFESSOR, DEPARTMENT OF MECHANICAL ENGINEERING
RICHARD E. GOULDRESEARCH ASSOCIATE, ENGINEERING EXPERIMENT STATION
ENGINEERING EXPERIMENT STATIONPUBLISHED BY THE UNIVERSITY 01' ILLINOIS, URBANA

UNIVERSITOF sLLINOIS
6300 3 30 598 *- pRESS ,
CONTENTSPAGE
I. INTRODUCTION . . . . . . . . . . . . . 51. Preliminary Statement . . . . . . . . 52. Objects of Investigation . . . . . . . . 53. Acknowledgments . . . . . . . . . . 5
II. DESCRIPTION OF APPARATUS . . . . . . . . 64. Condenser . . . . . . . . . . . . 65. Testing Apparatus. . . . . . . . . . 6
III. METHOD OF PROCEDURE . . . . . . . . . . 76. General Method for Conducting Tests . . . . 77. Test Conditions for the Various Series . . . . 78. Method of Calculation . . . . . . . . 8
IV. RESULTS OF TESTS . . . . . . . . . . . 99. General . . . . . . . . . . . . . 9
10. Total Effective Cooling Water and Total CondenserTonnage . . . . . . . . . . . . 9
11. Effect of Liquefaction Pressure on CondenserTonnage . . . . . . . . . . . . 18
12. Effect of Changes in Condensing Surface on Con-denser Tonnage . .. . . ... . . . 21
13. Coefficients of Heat Transfer. . . . . . . 2214. Pressure Loss Through Condenser Tubes . . . 2615. Performance Charts . . . . . . . . . 2716. Effect of Fouled Tubes . . . . . . . . 2717. Comparison of Performance of Four Types of Con-
densers . . . . . . . . . . .. 30
V. APPLICATION OF GENERAL EQUATIONS FOR HEAT FLOW . 3218. Flow Through Resistances in Series . . . . . 3219. Resistance of Ammonia Film. . . . . . . 3620. Resistance of Water Film. . . . . . . . 3721. Application of Equations to Test Results for Com-
mercially Clean Tubes . . . . . . . . 4122. Application of Equations to Test Results for
Fouled Tubes . . . . . . . . . . 46
VI. CONCLUSIONS . . . . . . . . . . . . . 4823. Conclusions. . . . . . . . . . . 48
LIST OF FIGURESNO. PAGE
1. Diagram of Horizontal Shell-and-Tube Condenser . . . . . . . 62. Initial Water Temperature for Different Tonnages and Water Rates in F
Series of Horizontal Shell-and-Tube Condenser Tests . . . . . 93. Initial Water Temperature for Different Tonnages and Water Rates in G
and H Series of Horizontal Shell-and-Tube Condenser Tests . . . 104. Initial Water Temperature for Different Tonnages and Water Rates in I
and J Series of Horizontal Shell-and-Tube Condenser Tests . . . 115. Total Tonnage and Water Rate for F, G, H, I, and J Series of Horizontal
Shell-and-Tube Condenser Tests . . . . . . . . . . . 196. Total Tonnage and Liquefaction Pressure for F, G, and H Series of Hori-
zontal Shell-and-Tube Condenser Tests . . . . . . . . . 207. Total Tonnage for Different Water Rates with Constant Difference in Tem-
perature between Saturated Ammonia and Initial Water for F, G, andH Series of Horizontal Shell-and-Tube Condenser Tests . . .. 21
8. Coefficients of Heat Transfer for Different Water Velocities for F, G, H, I,and J Series of Horizontal Shell-and-Tube Condenser Tests . . . 23
9. Coefficients of Heat Transfer and Friction Pressure Loss for Different UnitWater Rates for F, G, H, I, and J Series of Horizontal Shell-and-TubeCondenser Tests .... . . . . . . . . . . . 25
10. Friction Pressure Loss for Different Water Velocities for Horizontal Shell-and-Tube Condenser Tests . . . . . . . . . . . . . 26
11. Performance Chart for F Series of Horizontal Shell-and-Tube CondenserTests . . . . . . . . . . . . . . . . . . . . 27
12. Performance Chart for G Series of Horizontal Shell-and-Tube CondenserTests . . . . . . . . . . . . . . . .. . 27
13. Performance Chart for H Series of Horizontal Shell-and-Tube CondenserT ests . . . . . . . . . . . . . . . . . . . 27
14. Rate of Decrease in Coefficient of Heat Transfer with Formation of Scale inTube of Horizontal Shell-and-Tube Condenser . . . . . . . 28
15. Effect of Scale on Difference between Ammonia Saturation Temperatureand Water Temperature in Horizontal Shell-and-Tube Condenser . 29
16. Temperature Gradient Through Tubes of Horizontal Shell-and-TubeCondenser . .. ....... . . . . . . . . 30
17. Comparison of Performance of Four Types of Condensers . . . . . 3118. Unit Tonnages and Unit Water Rates for Different Initial Water Temper-
atures for Four Types of Condensers . . . . . . . . . . 3219. Observed and Calculated Coefficients of Heat Transfer for Clean Tubes . 35
C,,,d dv20. Relation between C and L for Different Ratios of Tube Length to
Tube Diameter . . . . . .. . . . . . . . .. . 39C,•d d,21. Relation between - and . . . .. . . . . . . . 40
22. Kinematic Viscosity of Water for Different Water Temperatures . . . 4123. Diagram of Temperature Gradient Through Tube Walls and Fluid Films 4224. Observed and Calculated Coefficients of Heat Transfer for Fouled Tubes . 47
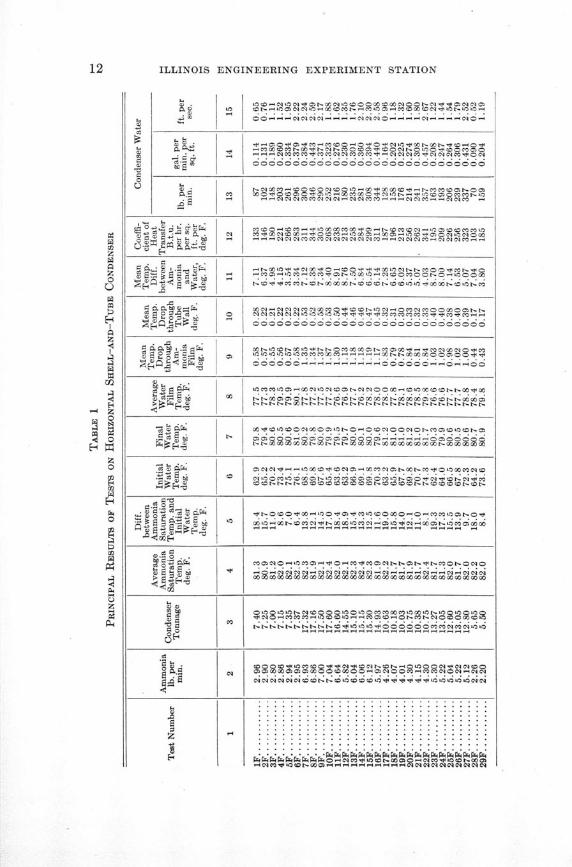
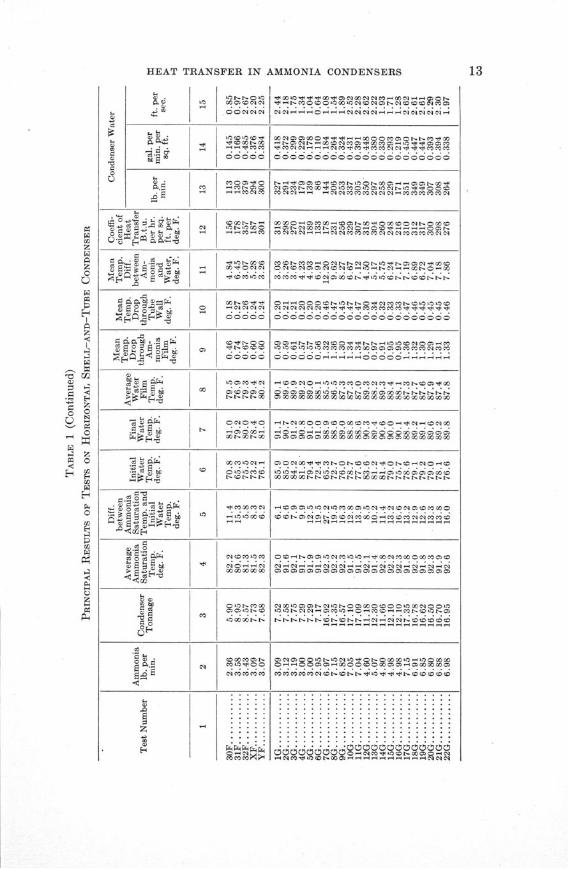
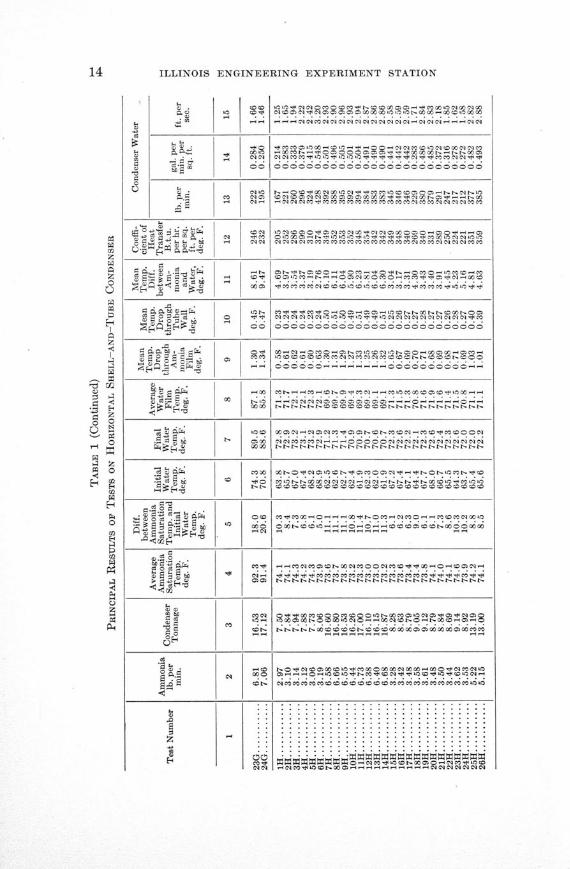
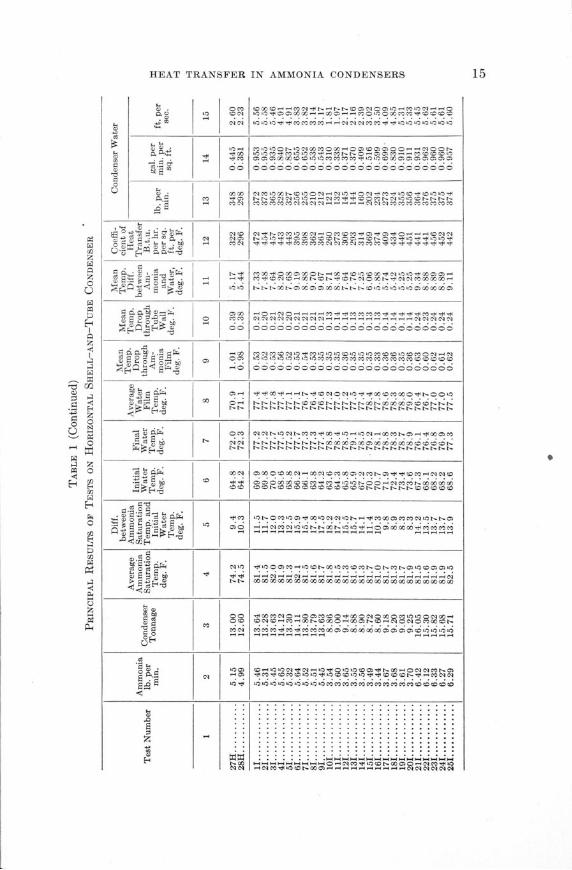
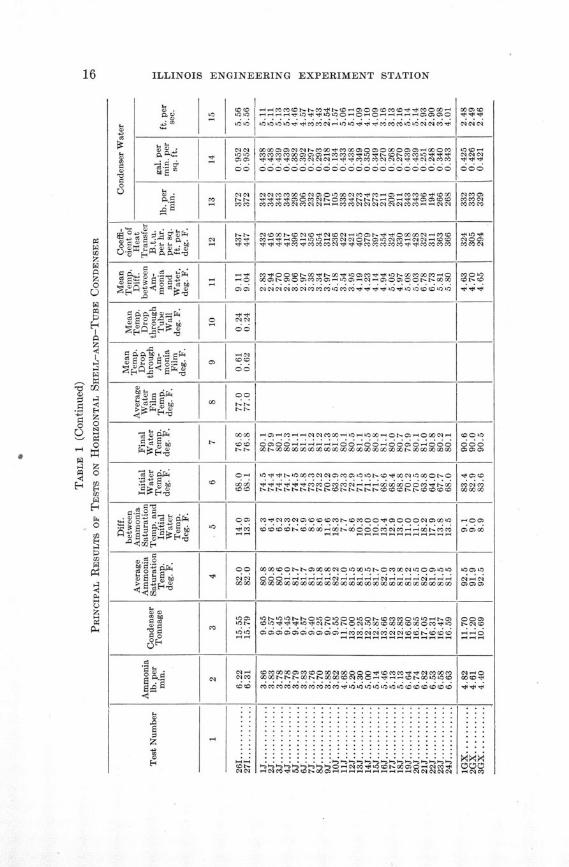
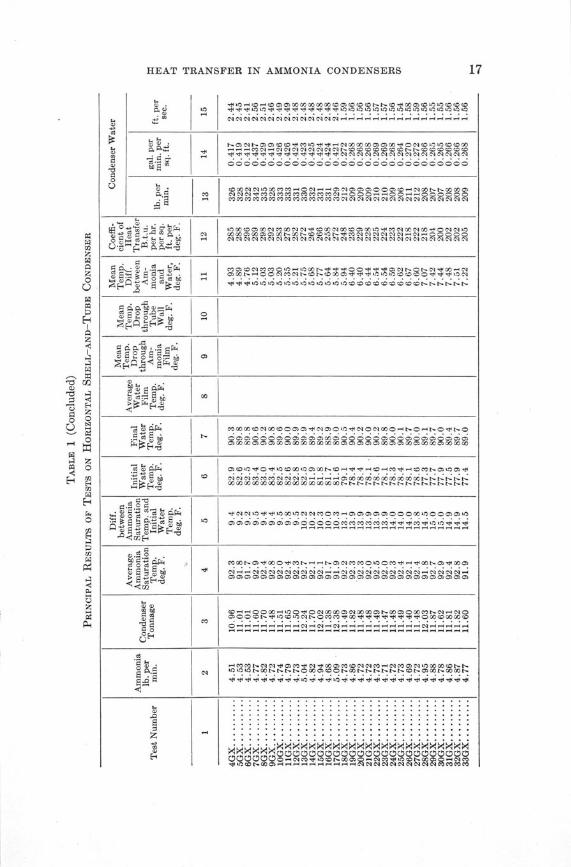
LIST OF TABLES1. Principal Results of Tests on Horizontal Shell-and-Tube Condenser . . 12-17
HEAT TRANSFER IN AMMONIA CONDENSERS
PART III
I. INTRODUCTION
1. Preliminary Statement.-This bulletin constitutes a report ofthe progress made in the investigation of the heat transfer in varioustypes of ammonia condensers since the publication of EngineeringExperiment Station Bulletins Nos. 171 and 186. The former dealtwith the performance of three types of ammonia condensers, namely,the atmospheric-bleeder, the double-pipe, and the vertical shell-and-tube; the latter with results obtained when certain changes were madein the design and operation of the vertical shell-and-tube condenserand with results from a study of the heat transfer in a double-tubesuperheat remover. The present bulletin presents results from astudy of the performance of a horizontal shell-and-tube condenser,sometimes designated as the multitube-multipass type, over a widerange of operating conditions, and with certain variations in the ar-rangement of surfaces.
2. Objects of Investigation.-The objects of this investigation maybe stated briefly as follows:
(1) To determine the coefficient of heat transfer and performancecharacteristics of the condenser with the water passing in parallelthrough the two shells and with various rates of flow and initialtemperatures for the water.
(2) To determine the effect of the pressure of the ammonia in thecondenser on the coefficient of heat transfer and the performancecharacteristics of the condenser.
(3) To determine the performance characteristics when the con-denser was operated with one shell alone, and also with the waterpassing in series through the two shells instead of in parallel.
(4) To determine the rate of scale formation, or fouling of thetubes, and the effect of such fouling action on the coefficient of heattransfer for the condenser.
3. Acknowledgments.-This investigation has been part of thework of the Engineering Experiment Station of the University ofIllinois, of which DEAN M. S. KETCHUM is the director, and of the
Department of Mechanical Engineering of which PROF. A. C.WILLARD is the head.
ILLINOIS ENGINEERING EXPERIMENT STATION
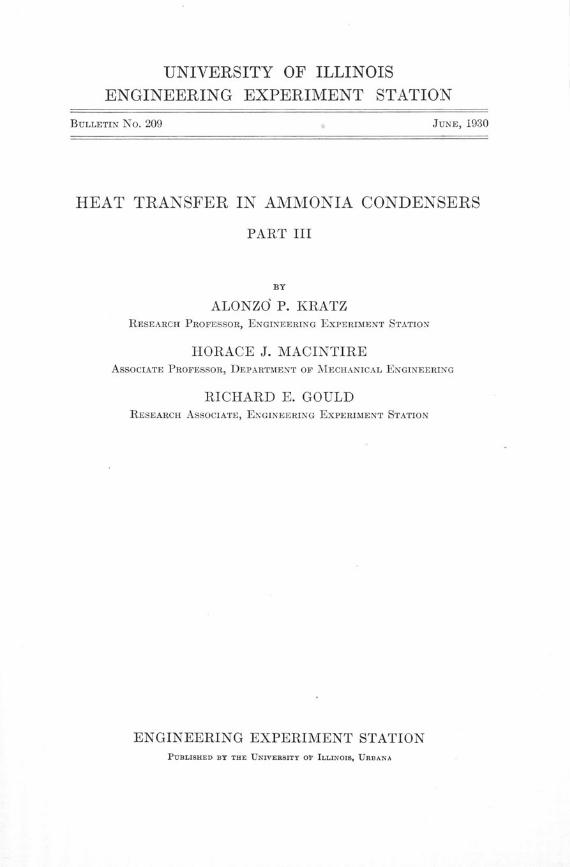
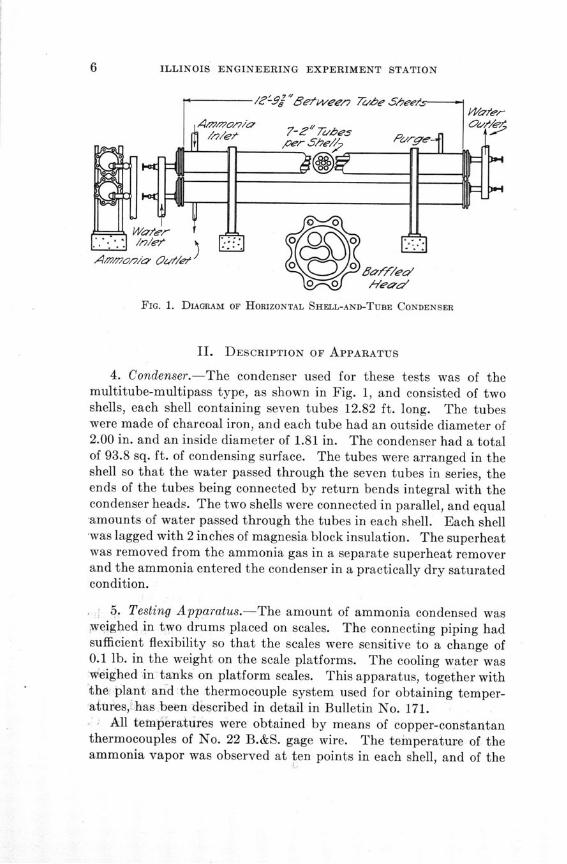
FIG. 1. DIAGRAM OF HORIZONTAL SHELL-AND-TUBE CONDENSER
II. DESCRIPTION OF APPARATUS
4. Condenser.-The condenser used for these tests was of themultitube-multipass type, as shown in Fig. 1, and consisted of twoshells, each shell containing seven tubes 12.82 ft. long. The tubeswere made of charcoal iron, and each tube had an outside diameter of2.00 in. and an inside diameter of 1.81 in. The condenser had a totalof 93.8 sq. ft. of condensing surface. The tubes were arranged in theshell so that the water passed through the seven tubes in series, theends of the tubes being connected by return bends integral with thecondenser heads. The two shells were connected in parallel, and equalamounts of water passed through the tubes in each shell. Each shell'was lagged with 2 inches of magnesia block insulation. The superheatwas removed from the ammonia gas in a separate superheat removerand the ammonia entered the condenser in a practically dry saturatedcondition.
5. Testing Apparatus.-The amount of ammonia condensed wasweighed in two drums placed on scales. The connecting piping hadsufficient flexibility so that the scales were sensitive to a change of0.1 lb. in the weight on the scale platforms. The cooling water wasweighed in tanks on platform scales. This apparatus, together withthe plant and the thermocouple system used for obtaining temper-atures, has been described in detail in Bulletin No. 171.
All temperatures were obtained by means of copper-constantanthermocouples of No. 22 B.&S. gage wire. The temperature of theammonia vapor was observed at ten points in each shell, and of the
HEAT TRANSFER IN AMMONIA CONDENSERS
water at the points of entry at each tube in the shell and at the pointof exit for the last tube. The thermocouples in the ammonia vaporwere protected by encasing them in nickel p ated copper tubing, andthose in the water were placed inside of glass tubes filled with oil.In all cases a depth of immersion sufficient to eliminate the effect ofconduction along the thermocouple leads was employed.
III. METHOD OF PROCEDURE
6. General Method for Conducting Tests.-The general method forconducting tests and controlling conditions has been fully describedin Bulletin No. 171.
7. Test Conditions for the Various Series.-The different series oftests were each designated by a letter. For the F series the ammonialiquefaction pressure was maintained at 145 lb. per sq. in. gage andtests were run for six different rates of condensation varying fromapproximately 2.8 to 7.0 lb. of ammonia condensed per minute,and corresponding to condenser tonnages of from 5.68 to 17.24. Foreach rate of condensation six different water rates were used for thecooling water, varying from 85 to 350 lb. per min. In all cases bothshells of the condenser were used and the water passed through thetwo shells in parallel.
All tests were run with commercially clean tubes except test XFfor which the tubes were purposely allowed to become fouled. Con-siderable difficulty was experienced from the tubes becoming fouledwith a very soft scale-like deposit and it was necessary to clean themafter approximately 6 hours of running. The temperature differencebetween the ammonia and the water was closely observed, however,and testing was discontinued at the first evidence of fouling.
The G and H series were run under the same conditions as the Fseries except that for the G series the condenser pressure was main-tained at 172 lb. per sq. in. gage, and for the H series at 122 lb. persq. in. gage. For the G series three and for the H series four differentrates of condensation were used.
For the I series only one shell of the condenser was effective, thesecond shell being completely removed from service. The tests wererun under the same conditions as for the F series, with the pressuremaintained at 145 lb. per sq. in. gage. Three different rates of con-densation were used, and the water rate was varied from 120 to375 lb. per min.
ILLINOIS ENGINEERING EXPERIMENT STATION
In the case of the J series the condenser was re-piped so that thewater passed first through one shell and then through the second shellin series. All tests were run with a condenser pressure of 145 lb. persq. in. gage, and three rates of condensation were used. The waterrates were varied as in the cases for the other series.
The GX series was run for the purpose of determining the rate ofscale formation. For these tests the condenser was operated con-tinuously over a long period of time at a constant rate of condensationand a constant water rate, and observations were made at approxi-mately one-hour intervals of the mean temperature difference be-tween the ammonia vapor and the water. The increase in this tem-perature difference was an indication of the rate at which foulingoccurred. A rate of condensation of approximately 4.7 lb. of am-monia per min. was used for both tests in the series. A water rate of209 lb. per min. was used for one test and of 331 lb. per min. forthe other.
8. Method of Calculation.-The formulas for computing the testswere developed in Bulletin No. 171.
The condenser tonnage was computed from the formula
N(i" - i')T-200
and the coefficient of heat transfer from the formula
60N(i" - i')K =A om
in which T = condenser tonnageN = ammonia condensed, lb. per min.i" = heat content of dry saturated ammonia vapor at the
temperature of liquefaction in the condenser, B.t.u.per lb.
i' = heat content of the liquid at the temperature of theliquid leaving the condenser, B.t.u. per lb.
K = average coefficient of heat transfer, or the B.t.u. trans-mitted per sq. ft. per hr. per deg. difference in tem-perature.
A = effective condensing surface, sq. ft.Om = mean temperature difference between the ammonia
and the cooling water, deg. F.
HEAT TRANSFER IN AMMONIA CONDENSERS
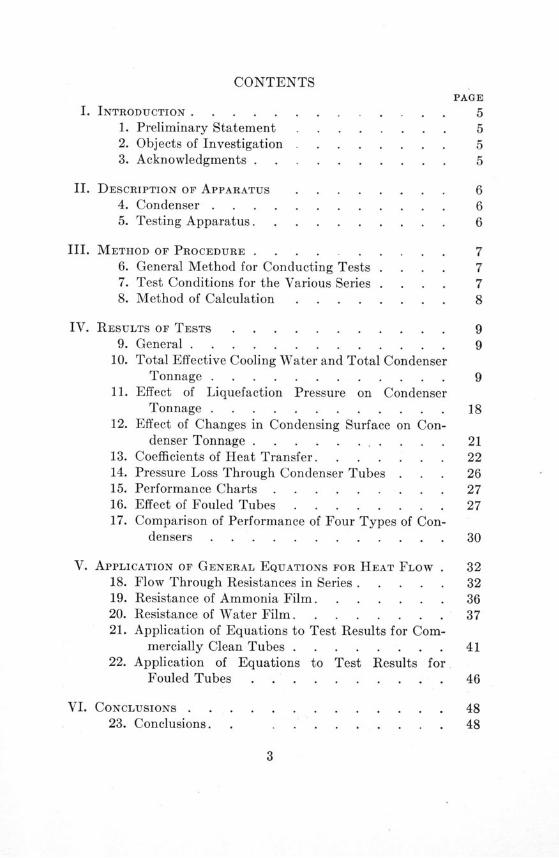
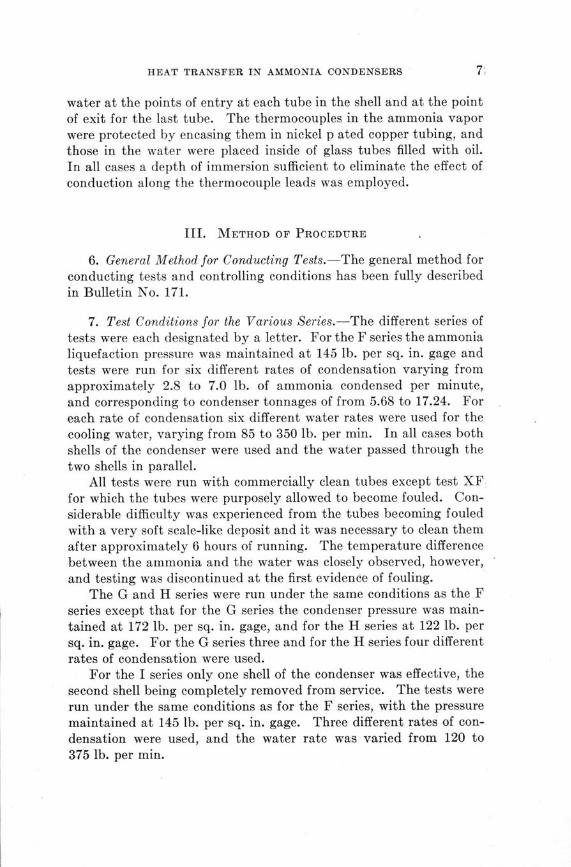
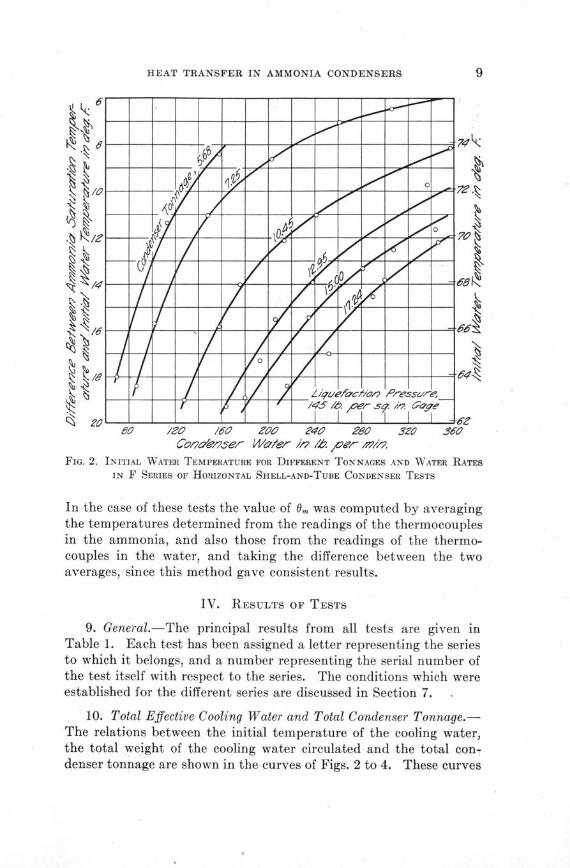
Cao'e/Wse/- W Mo/ le /677.- /-//;.FIG. 2. INITIAL WATER TEMPERATURE FOR DIFFERENT TONNAGES AND WATER RATES
IN F SERIES OF HORIZONTAL SHELL-AND-TUBE CONDENSER TESTS
In the case of these tests the value of 0m was computed by averagingthe temperatures determined from the readings of the thermocouplesin the ammonia, and also those from the readings of the thermo-couples in the water, and taking the difference between the twoaverages, since this method gave consistent results.
IV. RESULTS OF TESTS
9. General.-The principal results from all tests are given inTable 1. Each test has been assigned a letter representing the seriesto which it belongs, and a number representing the serial number ofthe test itself with respect to the series. The conditions which wereestablished for the different series are discussed in Section 7.
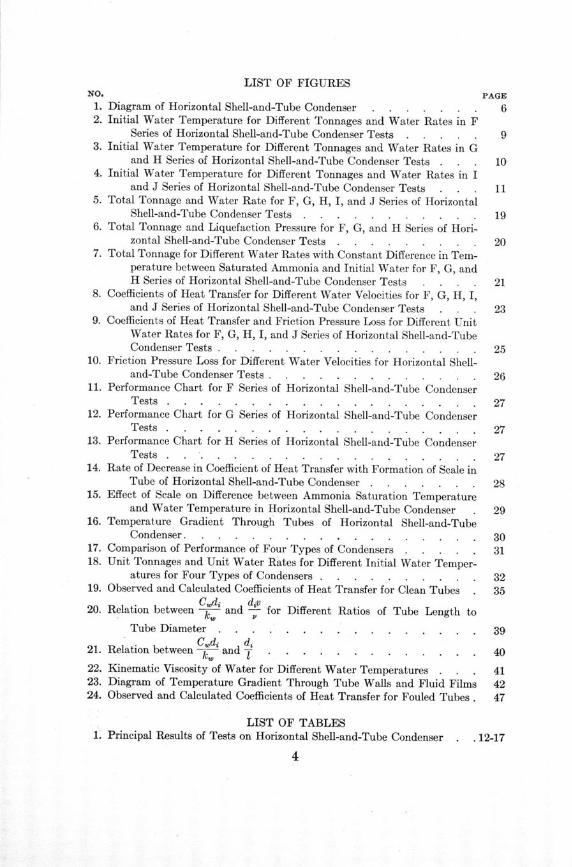
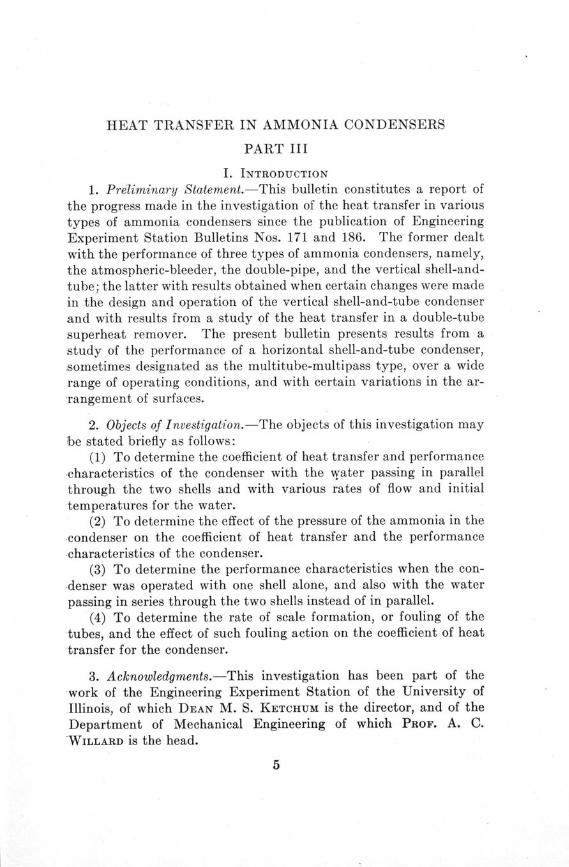
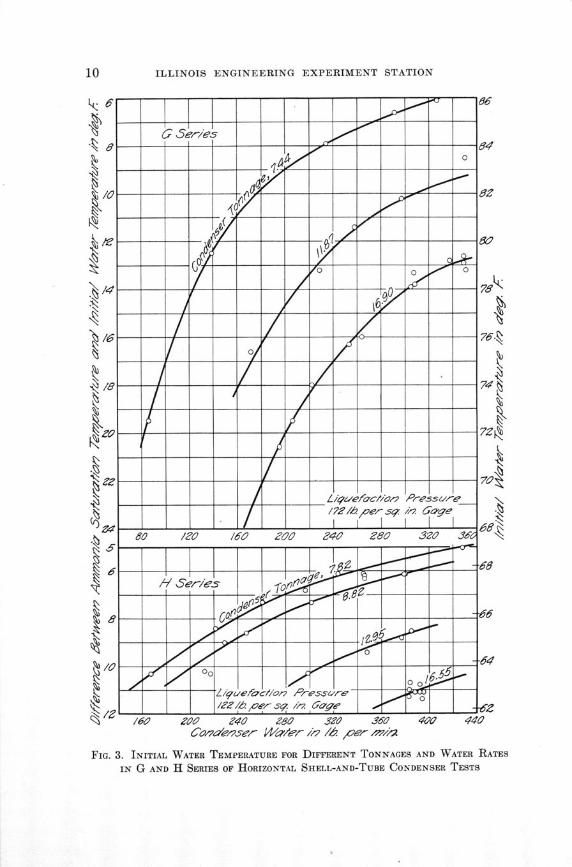
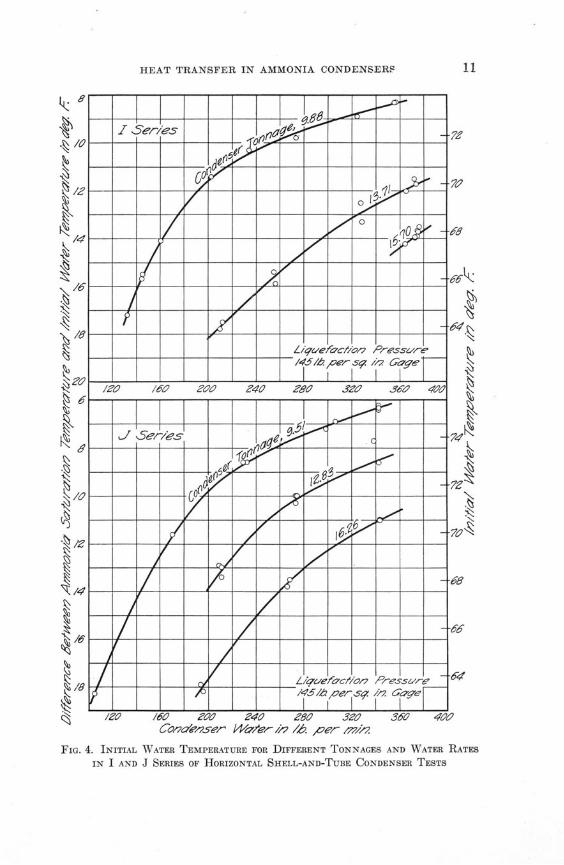
10. Total Effective Cooling Water and Total Condenser Tonnage.-The relations between the initial temperature of the cooling water,the total weight of the cooling water circulated and the total con-denser tonnage are shown in the curves of Figs. 2 to 4. These curves
ILLINOIS ENGINEERING EXPERIMENT STATION
Co7wdse,z7es wa/•er/ //, /,A. ,oer /7/m
7 NK
76.
4Oa 440
FIG. 3. INITIAL WATER TEMPERATURE FOR DIFFERENT TONNAGES AND WATER RATES
IN G AND H SERIES OF HORIZONTAL SHELL-AND-TUBE CONDENSER TESTS
HEAT TRANSFER IN AMMONIA CONDENSERS
FIG. 4. INITIAL WATER TEMPERATURE FOR DIFFERENT TONNAGES AND WATER RATES
IN I AND J SERIES OF HORIZONTAL SHELL-AND-TUBE CONDENSER TESTS
(- op'w,7e i^vTe re //2 /P>. "er 177/,-;
ILLINOIS ENGINEERING EXPERIMENT STATION
be|0
0
0
0
0
0
N
0
0
0
0
0
g .a g lo
ll p .g P• o 3 .d a .
a; -t o . .- ̂
•0
71E l
03S .0
: ro6hea.-
ad^t**"a o~f
heJP
dfI073 000
to~-lNtO<-ýN " i>OONc ýOOOO=4QONsO t--N "3=N N 41~l~
cc -- 0N 00N -O -00 NO. ~co h" m ;ý m 0 c "0 "N--ý ýxý o- w- 0o
0-0000 0 0000 0 CONN ONo O" 00. 0
c ch i- liOO>Nl 1ý i clQ ctD t- ~<C mo ^l!C ý t COiOci <C!>>0"Sc
t-0 N N w 0; Dcc0 N ON 000000 NOwx Cmt 000000
oo 000 c 0000a,0=00"0C, N000m NO0m0 ;0000 0000000'D m h t0 O"g- ON -0o mo CON mmo
4000 00C,40 tom0N 0 0-00 M " ~ -D
00000000000000000000000000000
t^dwo'tDiddoo'Nto o dddio oooOd'i~o cqooo-ooo
00 N0N 0 0 0 NOmm0 00 00"
00000000000000000000000000000
WONOONOiO'flONNlOOO0N OO'N t^iltOt0000000i
0000000------- 000=0-00
000 000 000 N 00000C=0000 0 N! NOc ý! o~ýýt7 00
NNIOi~t-OOO ONNNO ONO OONOO-^^^ m'l.-OOONNt^'OO
NN<Oi-lO O'lON-ONNNOONOOiC^OOOO^OONOOOO
t- - 0 000t ot ,00 000000 00 ý00 00 o
000000000000000000NON000000000
Oý 09 i lorlWO ct llý -OOOO ý it . CT 1:OO - 'lM 11 OR1tNO i c 1
00 N- N N N 000000000 Nt 000 N N 000 NO
00 0 N 000 oN 0000000000001 l O"N-x0 N- 00000m
00000000c3-" 0000000N INON ON 00lN 00
0 -0m0m0 00OOO- OOOO 00 000O
am=ci C9co eo a c. 0! c
0N N N N c N N N * N N o N.0000000000000000000N
t-Nm'oOO OOOt>OOt~tt2 GOO0-3 - 3 - o -SS
i88882O2288-83O'^O 8MtrtOOOO-^-iOCOSat^.O^
0000000 ON N 00000000000000tO 00000
,**- *-*, *- t*fhftitf&ita~titfcahftepfeith~feeffeeoffeao-O'CO'^ffft'OOi 00MtO-tc0 -O~^-0^CtfUtD *00'^*l-l-'000 00 0^^i^^~l^^CNTCS
HEAT TRANSFER IN AMMONIA CONDENSERS
tOI-tO-0 n
00 N N 0
00
000000000000000
0 0:;
0
rtgo El'7
E 0.
40
t ao r
0)
'3 S o-i
Ill
_ ~a. '°
0 0§'a o ~
.0 ̂ a fr a[
^jllE
5
10)
00
0)
"3I
a:Oqz
z
0o
FA
'* *:i00
00
0
5 02
^0
3 Q
0
0
0
00
N
00
00
00
00
0
00000
000000CID
0000 NGN
00 N 00000
0 NO 00 000
000t. ~t.00
o0 oo o0-
cq m o'- M c
00 000G OC
80000000
0a00 0
N N N N 00
00000000000000
I. i
0 00 m" "m0
000>-t<- 00 0.C>MO00 f<O00 0NN0000gSO
- N 0 N 'MCOIMM D0 N C-4n m0 N0 N0000 00C00 0000000000000000000000000000000000000000000000000
0 0 cCD 00 0 0 0 CD 0 0 0 -0 0 0 00 0 0
co0 Z8 0 0t c N N- D t0 0 0 0 0 N
0000N00000000Nl~NCOCOOC00NCO00eOC000
00000000000T 0ON00
0W0000 N X 0 NO N O 000 NO M0000000WX
Co CqoC CNI,-o t- lo lo q ,v o t-,o fro
000N N 000000 N c N 00000000000.- 0
00000000 N N N- 00000 N N NNz
lo t c meo c ee c e c
ddddoooddddoodddddd
0000000000000000000000
0000000000000000000-»t^«-l000000000000000
00000000000 NCON 00000000 N 000000-0000000 00000000000N00,.-.-^0r0000000000
000000 00NN00NNNN000000NNNNNNNN-t.t~t-
0000000N0000000f-0MO~®tCO-'iaOOT00>0000
00, 0 dctCi<~h0000000000000000-000'0000
000000 00TH> iOS" N 0 0 N3 N 00000000 N 00 00000000 C
00000000000 N -00000 0000-<SOOOO
ILLINOIS ENGINEERING EXPERIMENT STATION
0M
O 0 ý Co00C
M0000 O(M'-
00
1C 'SS 3i3CT~e ON
Woo
El0
r3 S30f
00la.s0
-s 10^!
le0a
00~f
0<o'
0
0O
05
0^
CO00
o
Ns
asC ý®0»00li«
00§0~h
M COi N co-immm00 M mNmA0N
i- 000-T-l00 .- 0 0QC CT> 0 '^ 00000000000~-~OC
m N 0m-coc t-, = v0 m N m 00mo - xc co00000000000000000000000000
-ovoa -- -0oo00 om N m- 0 0 mom N NO
0ooI- oN 0 ooo a, o -x xo0
ON ýo NO 00 w~ w0, N 0 z 2 N N~ m N' 00 0
000Cý .. .00 0 11: 0c 1ý9 cl! 000iO
00000 0000 0000 ON NO 0 O N N0
00000se-0000000an000--e
OtON -- 0'm NO ' 0 l OC 00000 Otn 0
0~~t^0 000 0000000-i~~t'^-OC'r'^ t~r
000 000 O~at O N CO N OC0M0-'^ 00 lO' 00000l'
000000. '^~-"00000 000000000000*b-s.»b--*^.^
N N N N N N N N N N N N N N N N N N N N N <}N N N
0 O dOS 00 O N O' 0000iO ~t~^.O- l NON0O N 'l~ 0l
0 ON N 00000<OCD-COCO' NWNONSOSON000 iMC000
00000000000000000000000000OO 'y'N~if
0 00)»<-'N00'3~Of<.^OMl'00~O005^f~Oi00-
00N00 0O0^ 000000N0000
HEAT TRANSFER IN AMMONIA CONDENSERS
VCC
io'Ot eioo nou^>oococ mwc eor~oo mtoccoco
V N V X V7 V- Vx VW Vm V- V VVVVVx V V
Vo mVVVVVVVVVVVVVVVVVVVVV
V0 V V VCý l?ý CV V CCV V N V V VN N NNN, N V V V 0N N N N NV N CCV =ziV V V NNN
N N N N .>>-N N N N N N N N N N N ONON»N N»NN N NV V N V V N V V V CCV V - V V -CVNV- V CCV VM
N N N N NN N N NVCCV VO CCV VO CCV CCV V V V V NN N N N N N N N N N N N N N N N N N N N N N N N
V CCV V CCV - ~lCCV V V C -^COOiCCV VNi VV V - V V
VVVCCCr.C VVVVV V VVNVVVVVVNVlOOOOOOO-CO;CVC
VVNVVVVVVV V VVVNN®Ct-^ 1^W>'.OS. 0®V SOV
V N V V V V V CCV V V V N - V V CCV V V V V N N
- - VCOCl'CCV V N V NV VV VV VCCV CCV V V V
V V V V CVV V N CCV CCV V N V '-N VN V V V V
V V V V V V V V V V V V VVooocM~~ii~'t'ooit
CCV C~iCV ^CC CCV CCV C CC CCV CV CCV CCV CV V VV CC
VCCVVVVC V VVVVVCCVV V VVVVVVVc~t^.^fr-COCV
VVVVV-^ -ll- V NVoChClO-'COCVN V VVVVVVCtCVNtV CCV V V V CCV CCV V V CCV CCV V V V V V V V V VC
]^C
t~e
SVcV V
0000000000000000000000000
V V V VOC V V V V V V V V ~t~ V V V V V V V V V V V-
doodoooooadoododdoooddc
VV
CCVV0 V-CCV
C> ' d
a Sa
a t E a
VV
VVV
o-•
C>. cjr3 S0 bO,
C3
OE,
.g.
CC>
Co•
C>
"•.
'SS •r
0o
CO j
N
V-
Ve
N N
V V
ONN
CCV
V VV V
V V
V V:
V8V
VMVN- N-
CCVS
VVlO
- Vt
ILLINOIS ENGINEERING EXPERIMENT STATION
~0' 0
"E•
o
S, 0t "0=
.0jg
0f~b 00.2 0)-afl o? c3ca 0
e0Q^S 0
^se0
i^0
-104
t-
0
0O
03
0*
CO
S00
O•
N NmCID
00
Ot0
Mý
=""000 0800 85 0 MS
000000000000000000000000
1ýo N m lNOMOCNo vg44O*O
00000000000NO<OO S000000@@ ® Ommmm0000N 00mN N N =~m 0 N" ~00
00ý "N 0 =:) 0 ý0 N00000 m0 ýN N N;0 cc000 0OO i0 000 00000MONO 0000 COOC0COMNO 00C0 0 = 0000Ci 0C0KM 0NMCrl-N00
"B 00 0000000000000 0 Nm
N<O t Cý 1ý ®1ý aC ® ý cl Cý cý cý c QOli lM<
NN"NmNmSmnO 0NPMM NCOt-t-- C 00
M0 OOt0N00<0~00N0000OSO 00iO0OCPOON0~0
0~t.00000000OOOO0000000000Wt00~00%
oMWNOOWN C 000 NMOO-OOO0ONO
wixmooxxx od oc ;Go xiR tEM Rý od
000000 4 00 0 0 00 0 N0o0000N 00
0ot,0000000000omoOO 00oB00t0wooi i'fN0Not'.0 0o! oo,-i'.<' .o99 OO R
000000000,0C) 00000000000
0 ^ 0 '*' *' *' *^'S^^'B^'B»}IB*?^^^'3^h,0000)0N0 000000ico to r-ooO''oic-
000
000
N N C1
000
010
MMN000
00M
MOMO000
mcqm
000
00S
0OW00
*-000
0! OS 00=M00
000
000000l0100O
000
000
N Cs000^
HEAT TRANSFER IN AMMONIA CONDENSERS
00
T.
E,|N E
ri C '. s r 3 ^'T
o .0
05
00
S~oh
Ill 0
fl.S§00
- ' '3
Sor
*l l i l *0 ~
^III"00
0~
^*00
IJ00
00
$30005 000Eii~i~iH
. . . . . . . . N N N A0 0 N N 000000000000~
000000000000000000000000000000
000II00 0 mm0 00 N coo 00000occ
000i000000i0l000-C000 N0000000 l0i000000ON 0"l"00 c
ri oT l c ioý r- 1ý aýcý llýCi a! t tD R ý!otý IRf-C~~tCC
c cl 0 o o = ao =oc molw =0o c o o m0 coo~odmmoo oodooo ooododaoodoo
000 N, m,0 000000'""; ; ý; o co o oG o oo N 00 N 000000000000000000000000000000000000000000000000000000000000000 N N N Nt -t N N t
000000000000000000000000000000000!0 NO N 000 N
MMMMMMM NNA N"NUMMMMM
0000000000000000900000000000000
0000000000000-000000-i-"-'0000000000000M000000N N N NNN
O00 0000000000 010OOOSOOOGOOO0 0300 00000000 00000000 00000000,
0000*t^*<^000000100^00t^0000000000000000^-lOP~^*~aOO*
00000000 0 0N000 00000000000000000000001>-^tt»~>lltbhittt
000000N00NNNN 000000 N00 N NN NNN0NO00^N00N00
Sil-OO(QCCi0-000000 0000N000 0 400OO~OOO~44C '-iNO0000 ~'"N00 - 0 CCOC '0000 000000000000 000OW 000OO
ILLINOIS ENGINEERING EXPERIMENT STATION
form the basis for the derivation of the performance charts in Section15 as well as for all of the subsequent curves by means of which com-parisons are made in regard to unit quantities, and afford a means ofcomparing total performances of the condenser with different amountsand arrangements of the condensing surface, and under different con-ditions of operation. The points on the curves represent the data ascomputed from the individual tests, and have been plotted againstprimary scales of ordinates consisting of the differences between theobserved ammonia saturation temperatures and the observed initialtemperatures of the cooling water, in order to eliminate the effect ofthe small deviations occurring in the separate tests from the lique-faction pressures of 145, 172, or 122 lb. per sq. in. gage predeterminedfor the respective series. The secondary scales designated as initialwater temperatures were obtained by subtracting the differencesshown on the primary scales from the fixed values of 81.7, 92, or73.8 deg. F., or the saturation temperatures corresponding to theliquefaction pressures of 145, 172, and 122 lb. per sq. in. gage, respec-tively. The scale of initial water temperatures on each group ofcurves, therefore, represents the initial water temperature correctedto a common ammonia saturation temperature for that particulargroup. Since these corrections were always small, the curves may beregarded as representative of the actual conditions under which thetests were run.
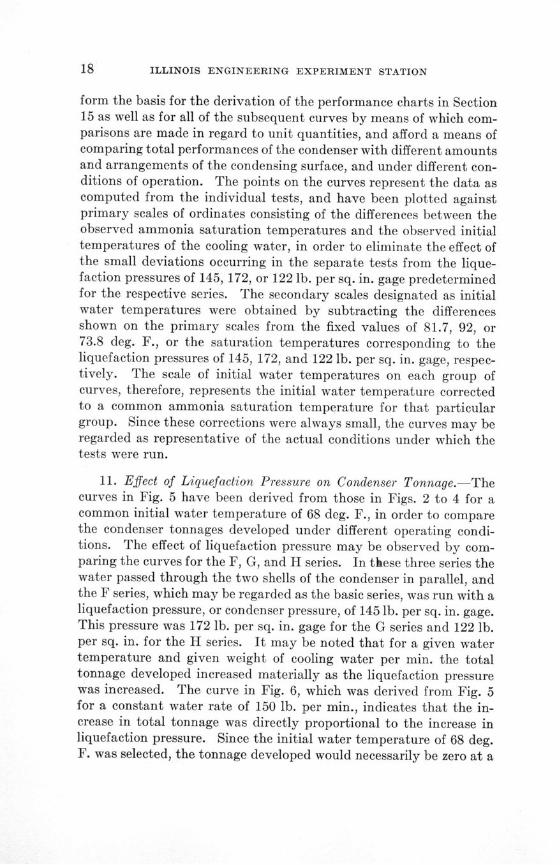
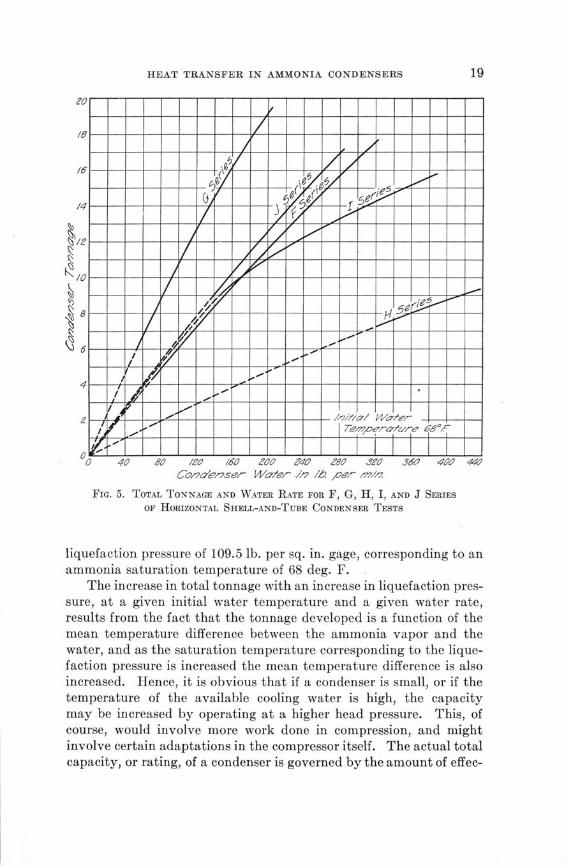
11. Effect of Liquefaction Pressure on Condenser Tonnage.-Thecurves in Fig. 5 have been derived from those in Figs. 2 to 4 for acommon initial water temperature of 68 deg. F., in order to comparethe condenser tonnages developed under different operating condi-tions. The effect of liquefaction pressure may be observed by com-paring the curves for the F, G, and H series. In these three series thewater passed through the two shells of the condenser in parallel, andthe F series, which may be regarded as the basic series, was run with aliquefaction pressure, or condenser pressure, of 145 lb. per sq. in. gage.This pressure was 172 lb. per sq. in. gage for the G series and 122 lb.per sq. in. for the H series. It may be noted that for a given watertemperature and given weight of cooling water per min. the totaltonnage developed increased materially as the liquefaction pressurewas increased. The curve in Fig. 6, which was derived from Fig. 5for a constant water rate of 150 lb. per min., indicates that the in-crease in total tonnage was directly proportional to the increase inliquefaction pressure. Since the initial water temperature of 68 deg.F. was selected, the tonnage developed would necessarily be zero at a
HEAT TRANSFER IN AMMONIA CONDENSERS
2 _ i t'- __ _ ___
FIG. 5. TOTAL TONNAGE AND WATER RATE FOR F, G, H, I, AND J SERIESOF HORIZONTAL SHELL-AND-TUBE CONDENSER TESTS
liquefaction pressure of 109.5 lb. per sq. in. gage, corresponding to anammonia saturation temperature of 68 deg. F.
The increase in total tonnage with an increase in liquefaction pres-sure, at a given initial water temperature and a given water rate,results from the fact that the tonnage developed is a function of themean temperature difference between the ammonia vapor and thewater, and as the saturation temperature corresponding to the lique-faction pressure is increased the mean temperature difference is alsoincreased. Hence, it is obvious that if a condenser is small, or if thetemperature of the available cooling water is high, the capacitymay be increased by operating at a higher head pressure. This, ofcourse, would involve more work done in compression, and mightinvolve certain adaptations in the compressor itself. The actual totalcapacity, or rating, of a condenser is governed by the amount of effec-
zo --- 7
, f2 0 1 1 1 , 1
- -- -^-^^ - ^^le
/ 0i- -5---
ILLINOIS ENGINEERING EXPERIMENT STATION
2-- ^- _ __ _ _ _
1} ~ -- - . --- - -- - -- - - - - __ _ _ _ _
/01000
I00 l / /O 140 4a 15 160 /70L/ielela6'1'10i Pr-essuare //7 l b er S'7 /7. Ga7ge
FIG. 6. TOTAL TONNAGE AND LIQUEFACTION PRESSURE FOR F, G, AND H SERIES
OF HORIZONTAL SHELL-AND-TUBE CONDENSER TESTS
tive condensing surface, the limiting condenser pressure, the temper-ature of the water available, and the amount of water circulated.
The curves in Figs. 5 and 6 indicate that for a given initial watertemperature and water rate the ammonia saturation temperaturedetermines the mean temperature difference, or temperature head,and consequently the total capacity of the condenser, but give noindication as to whether the rate of condensation or rate of heat trans-fer is influenced by the saturation temperature itself, apart from itsinfluence as a factor determining the temperature head. The curvein Fig. 7 was therefore plotted, giving the relation between both
T8 -oF-- /I I
10 /b. Coaese- Wa7'el vel
'4- r
/6'-====/ =
6 -mzzz^zr
V'{ -1-{1 7t< 1-1- } - 4-4-I - F - F - F - - II - I - 1-4-4- jL I - 4-4-4- -4-4--I - I - - - - I
;
HEAT TRANSFER IN AMMONIA CONDENSERS
/4
le
K
6
%L'/0
770
WO /60 /60 ZOO 640 8.0 3,z0 360 400 440Co0,"/7er -Wai, erl' //27 /. pe-r ,7/,.
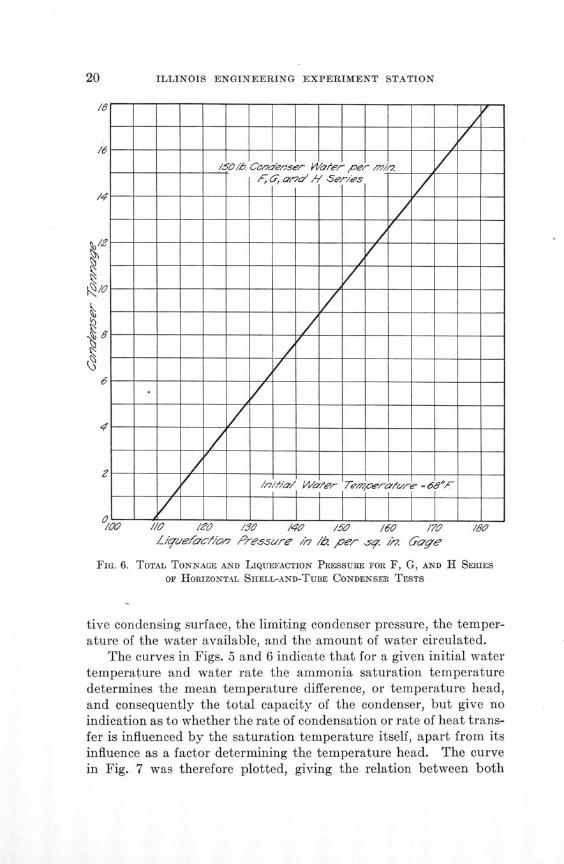
FIG. 7. TOTAL TONNAGE FOR DIFFERENT WATER RATES WITH CONSTANT DIFFERENCE
IN TEMPERATURE BETWEEN SATURATED AMMONIA AND INITIAL WATER FOR F,G, AND H SERIES OF HORIZONTAL SHELL-AND-TUBE CONDENSER TESTS
water rate and condenser tonnage for a common temperature head,or difference in temperature between ammonia saturation temper-ature and initial water temperature, of 10.5 deg. F. for the threeseries. The distribution of points for the three series indicates that,for a given temperature head, the liquefaction pressure had no mate-rial influence on the condenser tonnage developed for a given waterrate in pounds per minute. The curve further indicates that, overthe range of the tests, for a given temperature head, the increase intonnage developed was directly proportional to the increase in thepounds of cooling water used per minute.
12. Effect of Changes in Condensing Surface on Condenser Ton-nage.-The effect of changing the arrangement and amount of con-densing surface may be observed by comparing the curves for the F,I, and J series in Fig. 5. For these three series the liquefaction pres-sure was maintained at 145 lb. per sq. in. gage. For the F series bothshells of the condenser having a total condensing surface of 93.8 sq. ft.
/,00z
//7/f/a/ VV~',~7 0"'~s/ ~ / -'./ ' ~-.'t'4'fl'
&7/e715'O..V ~/oetl7/~2I I
7
A/ .'e7/es- A - H Seris --I ] ISr-e
4-
---- ,-A--
ILLINOIS ENGINEERING EXPERIMENT STATION
were used, and the water passed through the two shells in parallel.For the J series the water was passed through the two shells in series,and the total condensing surface was still 93.8 sq. ft. For the I seriesbut one shell was used, and the condensing surface was 46.9 sq. ft.
From the curves in Fig. 5 it may be noted that, for a given initialwater temperature, and with a given weight of cooling water perminute, a greater tonnage was developed by the J series than by theF series. When the water was passed through the two shells in seriesthe effect was to double the velocity of the water through the tubesfor a given weight of water used per minute, as compared with thevelocity obtained when the two shells were used in parallel. Whileboth the change in arrangement and the change in water velocitywere accompanied by readjustments in the rate of heat transfer, asexplained in Section 13, the effect of increased water velocity pre-dominated, and the net result was an increase in total tonnagedeveloped.
When one shell alone was used, the velocity of the water passingthrough the tubes was also doubled as compared with the velocityobtained when the same weight of water per minute was passedthrough the two shells in parallel. The curve for the I series, shown inFig. 5, indicates that up to a limit of approximately 10 tons theincreased rate of heat transfer resulting from the greatly increasedwater velocity was more than sufficient to offset the effect of thereduced amount of surface and the tonnage developed probably was,if anything, slightly greater than that developed by the F series.Above this limit, the reduction in condensing surface more than offsetthe effect of increased water velocity, and resulted in a rapid reduc-tion in capacity as compared with the capacity developed by the Fseries. The curve for the I series does not belong to the same familyof curves as those for the other series, and indicates that with only oneshell in operation the condenser became overloaded at rates above10 tons. With both shells in operation no overloading became appar-ent over the range of tests run.
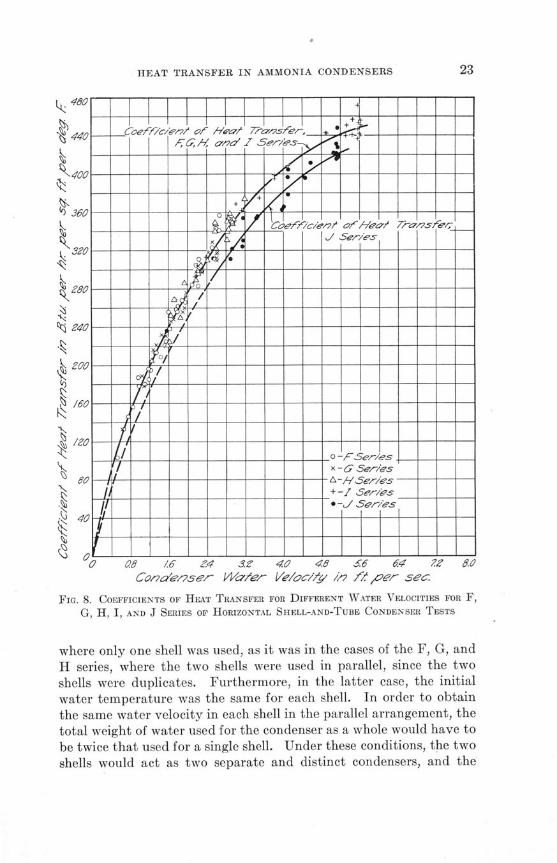
13. Coefficients of Heat Transfer.-The effects of both water ve-locity and arrangement of condensing surfaces on the coefficients ofheat transfer are shown in Fig. 8. The rate of heat transfer increasedrapidly as the mean velocity of the water passing through the tubeswas increased.
The arrangement of condensing surface was essentially the samefor the F, G, H, and I series. The length of water travel with respectto the condensing surface was the same in the case of the I series,
HEAT TRANSFER IN AMMONIA CONDENSERS
Ct
k
KI
N
0.8 /6 z4 3.Z 40 48 56 64 Z 8.0Con7de72ser VlWa'/er- Ve/cic/<'y 117 /z Ier sec.
FIG. 8. COEFFICIENTS OF HEAT TRANSFER FOR DIFFERENT WATER VELOCITIES FOR F,
G, H, I, AND J SERIES OF HORIZONTAL SHELL-AND-TUBE CONDENSER TESTS
where only one shell was used, as it was in the cases of the F, G, andH series, where the two shells were used in parallel, since the twoshells were duplicates. Furthermore, in the latter case, the initialwater temperature was the same for each shell. In order to obtainthe same water velocity in each shell in the parallel arrangement, thetotal weight of water used for the condenser as a whole would have tobe twice that used for a single shell. Under these conditions, the twoshells would act as two separate and distinct condensers, and the
480 -- - - - - - - - - - - - - j
I II I I I I
6 oef,%A'f / of HsA'/g 7af w '/, ±* 4S_ _ __ _ _
.400 - - - -- .o- -
320 -----------
-× -- -Se -/es
280 - - - - - ^ £ * -- - - - - - - - - -
' / A-- - -- -- -- - - -
i40 + --- - - -- -
00
1609,,2--- -
!60 - -- ff-- -- -- - -- - -- - -- -- - -- - -- - -- -
40--------------------
ILLINOIS ENGINEERING EXPERIMENT STATION
capacity of the condenser as a whole would be twice the capacitydeveloped by a single shell. Hence it is evident that, when comparedon the basis of the same water velocity, the single and double shellcondensers would exhibit the same characteristics in regard to therate of heat transfer, and the points representing the coefficients ofheat transfer would all fall on the same curve, as shown for the F, G,H, and I series in Fig. 8.
The arrangement of condensing surface for the J series, in whichthe two shells were used in series, was fundamentally different fromthat used in the F, G, H, and I series in that the length of water travelwith respect to the condensing surface was twice as great. With thesame initial water temperature and the same water velocity a differ-ence in the mean temperature difference between the ammonia vaporand the water, and accordingly in the heat transfer characteristics,would be expected in the two cases. Figure 8 indicates that underthese conditions the greater length of water travel resulted in a greatermean temperature difference, and consequently in smaller values forthe mean coefficients of heat transfer, as shown by the curve for theJ series. It is further indicated that the most effective arrangementof condensing surface is one in which the water travel is compara-tively short, and which offers a large area for the action of the coldestwater near the point of entry.
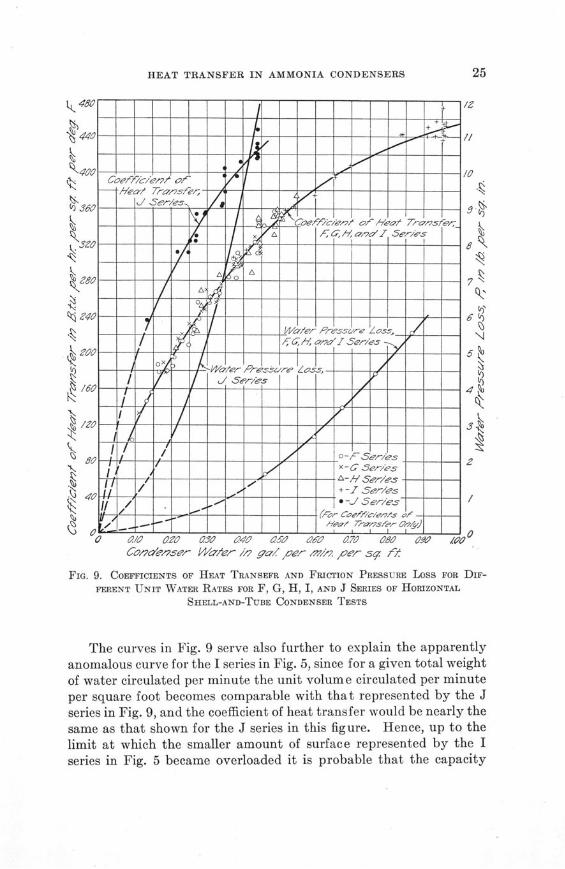
The curves in Fig. 9 afford a comparison of the coefficients of heattransfer on the basis of water circulated per minute per square footof surface. For a given volume of cooling water circulated per minuteper square foot the water velocity would be the same for the singleshell and for the two shells arranged in parallel. Hence the resultsfor the F, G, H, and I series are again all represented by the samecurve.
In the case of the J series, in which the two shells were used inseries, a given volume of water circulated per minute per square footrepresents twice the water velocity obtained when the same volumeof water was circulated per minute per square foot in the parallel orsingle shell arrangements used for the F, G, H, and I series. Hence,while the effect of the arrangement of surfaces alone was such as toreduce the coefficient of heat transfer as shown in Fig. 8, the increaseresulting from increased water velocity for a given volume of watercirculated per minute per square foot was more than enough to offsetthe reduction due to arrangement of surface alone, and the net result,as shown in Fig. 9, was to materially increase the values of the co-efficients of heat transfer for the J series as compared with those forthe F, G, H, and I series for the same unit volume of water circulated.
HEAT TRANSFER IN AMMONIA CONDENSERS
K
K
N
K
K.
480
44)
^400
1360
K3ZO
280
24o
iZOS/66
80
40
10
II.TI/
A'ea'/ 7~2Ws/~'/ -
A EZSet-/es-4-------
A A
Wa.'~6',' ,'?-ess6','-e Zos.5, -C/Ct .1 OCr/to *-.. ~2
-4I
-t1-I
-I-- -OCr/es
-y~1~
-t/
g
1-
J 1Sd
'7,
//
10
0 00 00 z 3 o 70 o aa0 6 0.70 a0o 6a ooCo/y'eif,,- e,,- /'/ _qg9a0. Cep /7///7. 10el- Sq. &.
FIG. 9. COEFFICIENTS OF HEAT TRANSEFR AND FRICTION PRESSURE LOSS FOR DIF-
FERENT UNIT WATER RATES FOR F, G, H, I, AND J SERIES OF HORIZONTAL
SHELL-AND-TUBE CONDENSER TESTS
The curves in Fig. 9 serve also further to explain the apparentlyanomalous curve for the I series in Fig. 5, since for a given total weightof water circulated per minute the unit volume circulated per minuteper square foot becomes comparable with that represented by the Jseries in Fig. 9, and the coefficient of heat transfer would be nearly thesame as that shown for the J series in this figure. Hence, up to thelimit at which the smaller amount of surface represented by the Iseries in Fig. 5 became overloaded it is probable that the capacity
5,-
7,
eff/c-/e.'7/s tt -
T
I i _ ± ii
J/ Setres..
F
- &
* Z Ser/-J .Yet/es
vw/tff r/ e.^^c// e.
J
{i^C
***y/ty y ^-'fc'/'/eo ~^, ^
2
/
/-1->
. £.
4' «
V-,L-
f *('•-r i
J
1!
j»>
ILLINOIS ENGINEERING EXPERIMENT STATION
Wa/er kle/oc/.4/ // ;/ per sec.Fia. 10. FRICTION PRESSURE Loss FOR DIFFERENT WATER VELOCITIES
FOR HORIZONTAL SHELL-AND-TUBE CONDENSER TESTS
developed by the single shell would be nearly as great as that devel-oped by the two shells in series.
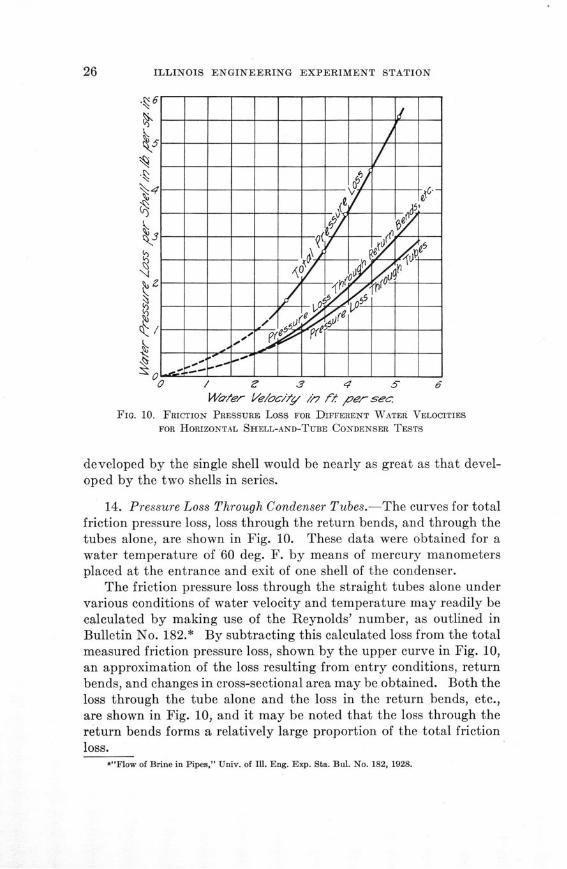
14. Pressure Loss Through Condenser Tubes.-The curves for totalfriction pressure loss, loss through the return bends, and through thetubes alone, are shown in Fig. 10. These data were obtained for awater temperature of 60 deg. F. by means of mercury manometersplaced at the entrance and exit of one shell of the condenser.
The friction pressure loss through the straight tubes alone undervarious conditions of water velocity and temperature may readily becalculated by making use of the Reynolds' number, as outlined inBulletin No. 182.* By subtracting this calculated loss from the totalmeasured friction pressure loss, shown by the upper curve in Fig. 10,an approximation of the loss resulting from entry conditions, returnbends, and changes in cross-sectional area may be obtained. Both theloss through the tube alone and the loss in the return bends, etc.,are shown in Fig. 10, and it may be noted that the loss through thereturn bends forms a relatively large proportion of the total frictionloss.
*"Flow of Brine in Pipes," Univ. of Ill. Eng. Exp. Sta. Bul. No. 182, 1928.
k~.
390-
K * ^ -
lk am3-
\i
a 4\ ;6
(ssk -
a 1
^/ -
-z
7- /
f
(-.
7/
1..
ZVIZTIflZ[ZV17774Z!i)f2ZfZKTT77K. ~Ti2iZ
-4-4-I
I,'/
A/I I
,4'
'-f---+ F-+ *---F-W--~ F-+--~ F ~--~'-----
/ // /
,/ /
/
-7 i 0
-z
- 41§Z'_ 66~ _ _ _ _ _
__ __ __ __ __ __ 0+ _.-z122~__ _ S _ --- I. ___ -a- - ___ - ___ ___ ___
- 17-~+-~-F F-4~'F F 4~~'4 4 4-~1
-' )-^ i.--
1-1-4 ~--4---4 4 V- A----I-
4 4-4~-----i 4 1-1-
- ~- -4- - F ~- - *~- -4-4-4-4-4-4-4-
I 4 4-4 4 4 4 4-4 4-4-------
I- 7 essure 15 /b. r ,-/. I a9I e-I I I I I I i
I I I I I I IzŽ~I~tLitz[z[ztzIztzIzIzIzI . Jz
a/7 a/8
35'2
325
3c2~2
K
25~2K
2~5
K2~2c'
0/9 azoa06o a007 ao ao a0 0.// a/2 a/S 0/4 0/5 016Co F EsIES TO nge SH -AD-T E CONDENSE TESTS
FIo. 11. PERFORMANCE CHART FOR F SERIES OF HORIZONTAL SHELL-AND-TUBE CONDENSER TESTS
FF
F F Efi£/f<q , ]
I I I -lei -
i i
-----------
-OL -----
II
m7- //z
J Ji ^_ 7i
JI
i ?^- -E2 f-' J
oYv"/
V
rc,
./ I01 Im, /
- y
j'/ j!
y y
.°^ y•̂ fJ
.^r ^
JY

3 25- 0-4
0^^36K stz?^-
„ N;
KI K
K 4
00-i-
/75
& a
(/50 0-
a.
/6 Fzz
7+
2
7<-z
7
B
_ '
- 47',
i~rrz/
SL-
7
ii
-7
2
a.05 ao08 O.O a09 a.o
flJ,-i
I I -I -~ *I-/.I--4 4-4-4 4-.-1--I 4 4 -4--I-
fi
Z55_1-A-I--I--I I 4 4-I II-I I I I-I-*13,~j
0/
N
200
/?7 5e
SK
-4-4 + 4-1-/
4-4 +-,'~ I 4-4--4--L-,-A-----I 4-4 4-,1--r-----4-4-
4 ~-~¶ 4--I-4 4-~% ~-4-4
./ /
y\ /
7,---- _
\
- '' I T- - ---- i t I - -
- - - - - - - Z,,~'k~z' Rd'5Sd.'/~' /7e/.~pd-r3 9 ~//A 6t~7;6~
I I I I I I ___
-I- ~1ii1 I ~ ___ I I I I I I I I I ___ Ia/6 a01 a0e a01
FIG. 12. PERFORMANCE CHART FOR G SERIES Op HORIZONTAL SHELL-AND-TUBE CONDENSER TESTS
al a/z a/3S aCondenser Tonnygoe ,oer s-. f/
- -+ A- i
/ / t- -- -- -A---- --^I I I I I I / I I I I I y/_ _ _ 7 _ _ _ _ _z _ __-1
'I I I 7
- -
.A't
I--- /
\ / 'llI
. ---- --- -<a --- AC --- ---- --- -* ---- u --- --- i ---- F --- - c - --- - , ~ --- - ^ *i---- -- !
1ý7i T4ýý
h
/
ii
!t /- y

HEAT TRANSFER IN AMMONIA CONDENSERS
In order to compare the friction pressure losses occurring underthe conditions of service established for the different series of testswith the coefficients of heat transfer obtained under these same con-ditions, the curves for total friction pressure loss have also been shownin Fig. 9. Since for a given volume of water circulated per minute persquare foot of surface the water velocity would be the same for thetwo shells in parallel as for the single shell, the pressure loss per shellwould also be the same. Also, in the case of the parallel arrangement,the total pressure required to circulate the water through the con-denser as a whole would be the same as the friction pressure lossper shell. Therefore, when compared on the basis of water circulatedper minute per square foot of surface the same curve would representthe total friction pressure loss for the F, G, H, and I series.
In the case of the J series, since a given volume of water circulatedper minute per square foot of surface represents twice the watervelocity obtained for the F, G, H, and I series under the same con-ditions, the friction pressure loss per shell would be four times as*great. Furthermore, since the two shells were used in series, the totalpressure required to circulate the water would be twice the frictionpressure loss per shell. Hence, for a given volume of water circulatedper minute per square foot of surface, the total friction pressure lossfor the J series, as shown in Fig. 9, was eight times the correspondingfriction pressure loss for the F, G, H, and I series. Thus it is evidentthat, although the coefficient of heat transfer and total capacity of the.condenser for a given amount of water circulated may be materiallyincreased by connecting the two shells in series instead of in parallel,this increase is necessarily accompanied by a corresponding increasein the power required to circulate the water.
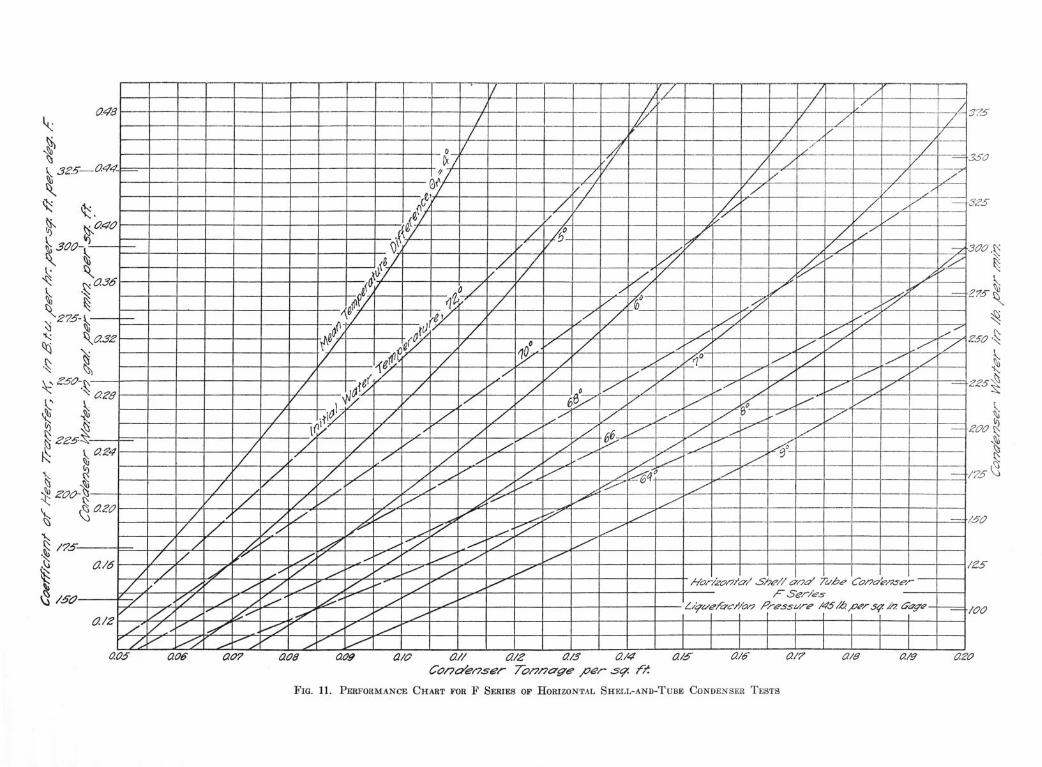
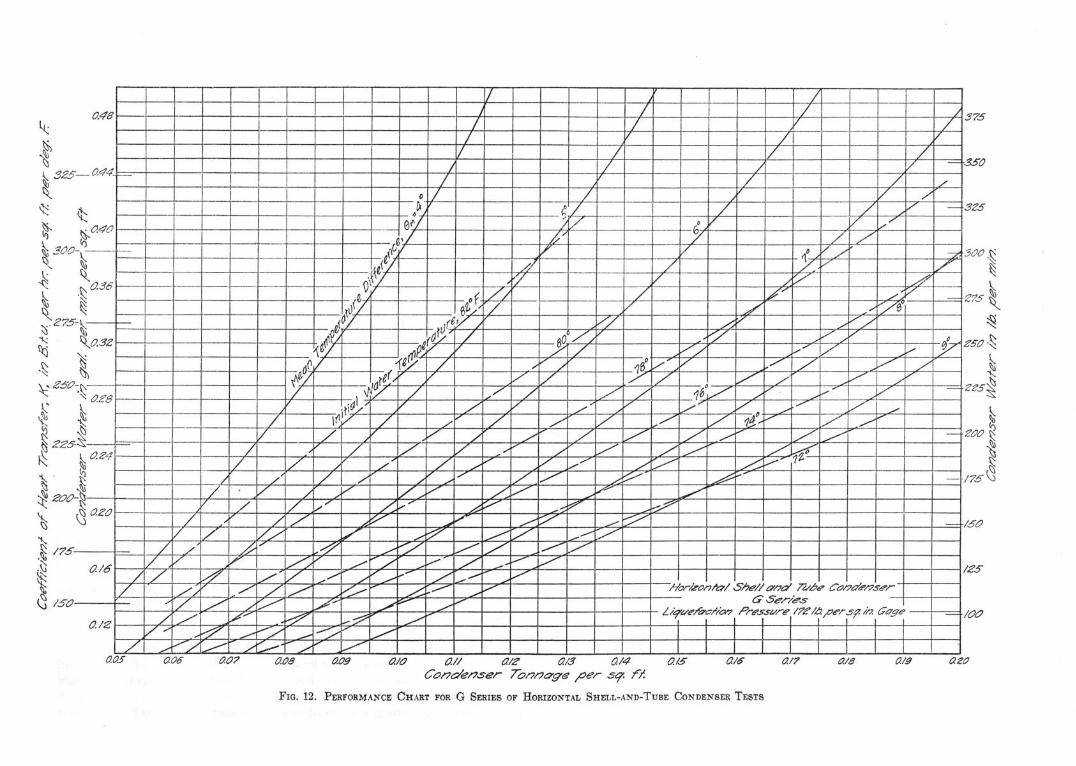
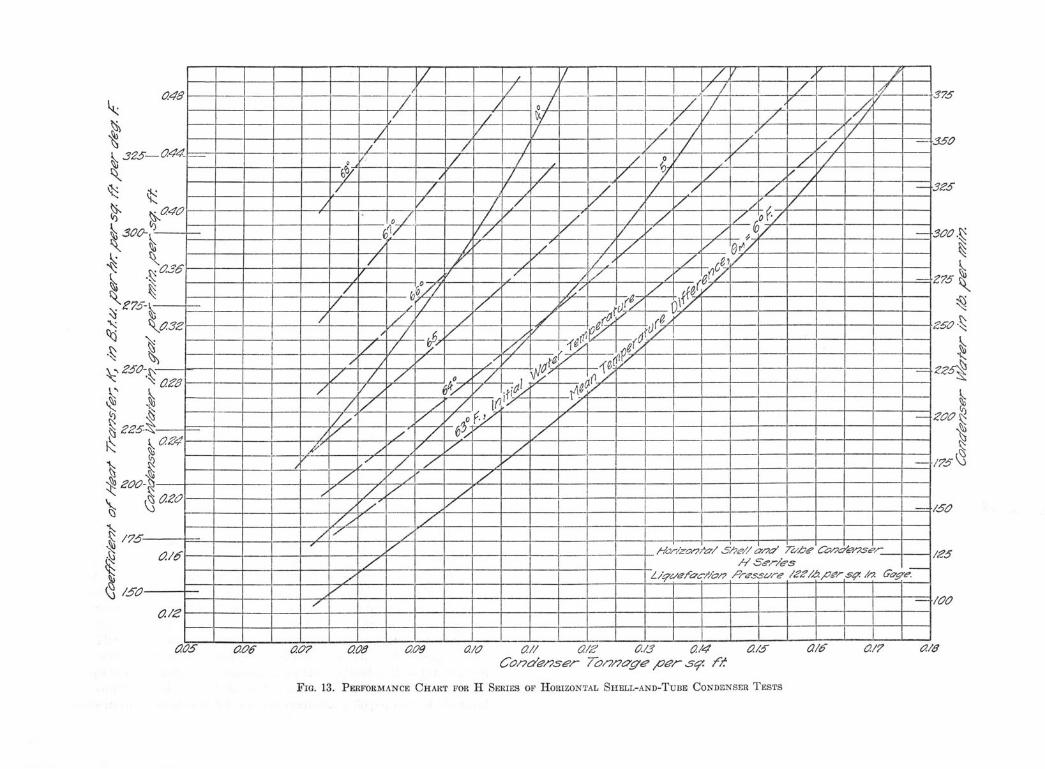
15. Performance Charts.-Figures 11, 12, and 13 consist of per-formance charts representing the relations between all of the variousfactors affecting the perfornmance of the condenser over the range ofthe tests. These charts are shown for the three condenser pressuresused, and for the standard arrangement only, in which the two shellswere connected in parallel.
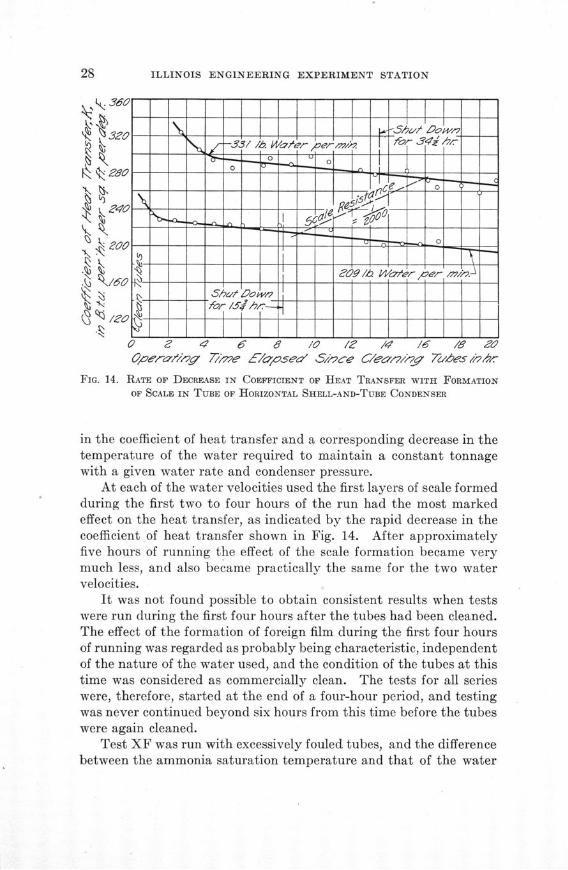
16. Effect of Fouled Tubes.-The results of the GX series, run forthe purpose of determining the rate of fouling of the tubes, are shownin Fig. 14. The water used was deep well water which contained ahigh percentage of iron bicarbonate, and the deposit of ferric hy-•droxide that formed was more of the nature of a soft sludge than of atrue scale. The effect of this sludge was to cause a gradual decrease
ILLINOIS ENGINEERING EXPERIMENT STATION
Operl'Ž/'g 7T7e §/g',sea' S/Žce < 7/W/w Ti S/2r,
FIG. 14. RATE OF DECREASE IN COEFFICIENT OF HEAT TRANSFER WITH FORMATIONOF SCALE IN TUBE OF HORIZONTAL SHELL-AND-TUBE CONDENSER
in the coefficient of heat transfer and a corresponding decrease in thetemperature of the water required to maintain a constant tonnagewith a given water rate and condenser pressure.
At each of the water velocities used the first layers of scale formedduring the first two to four hours of the run had the most markedeffect on the heat transfer, as indicated by the rapid decrease in thecoefficient of heat transfer shown in Fig. 14. After approximatelyfive hours of running the effect of the scale formation became verymuch less, and also became practically the same for the two watervelocities.
It was not found possible to obtain consistent results when testswere run during the first four hours after the tubes had been cleaned.The effect of the formation of foreign film during the first four hoursof running was regarded as probably being characteristic, independentof the nature of the water used, and the condition of the tubes at thistime was considered as commercially clean. The tests for all serieswere, therefore, started at the end of a four-hour period, and testingwas never continued beyond six hours from this time before the tubeswere again cleaned.
Test XF was run with excessively fouled tubes, and the differencebetween the ammonia saturation temperature and that of the water
K
~
~
~
,- K _ _*
^N-r
^^I*: ^e.
f^^-
v e ao2i^ 6'2
/76.
I /5--
F
/
/
-
J
-7
~7-
f
d
0
/
7/I
z
_,4-f
/
+
+
-7
z
-I
^
?
/
005 ow a06 7 a06 009 a/
I/
7A
Y ., 00
147=1
A-
r
ZIW]ZZ~AZIZ~Z4-
/ /
/
/ // ,
/-
A'r
------------- I--e^rv : ____ 3 ,
-+ 4 4-I-I---±1t1 ~
4 4--I-4-4--4-+-+-I-4-
-// 0/2 0./3 0/4Coan7'ense" 7 ^onnage per s. f•
0/5 0/6 0/7 0/1
FIG. 13. PERFORMANCE CHART FOR H SERIES OF HORIZONTAL SHELL-AND-TUBE CONDENSER TESTS
K~1~~
K(4)
>1
'ZI
-- 4 *-
I '
~-1
'7-
+ # A II
rq/"H
__ _ _/ i _/ _ 77 __// /° /' ~/// ^-z^ / ,// r
_ / 7 ~., / / _ _-
# If
I / / I"It ilil
/ / ,r i '
/
?
1
?
7
r
»
o¢/^
€
z_-------- •'t~
1>,= =^ ~ - -- = g
7z fl-' 1lF1E~ 77 ilKI ____h~'r~~c24ta/ 5.~'e// ~d 7~'be co405et
-- { - L,~ef~y~' ~ s~z /~ G~
~tEl /00
I //
4^
/f-•kt

HEAT TRANSFER IN AMMONIA CONDENSERS
<6
"> C'o/7ie~se I/~ ge Ws /'t/;£. er Xw/^., 297
S-----------/-e----- Pressu~72'. he\ 4 / he~s . 7. Uf'gq'6
,Ice\ 1=-7\\ 0
7 - Z1041el2~n// a ! TI. SN117-/___ _ _ I _ _ _ _ _
W671et- 725e cvý/e '','s
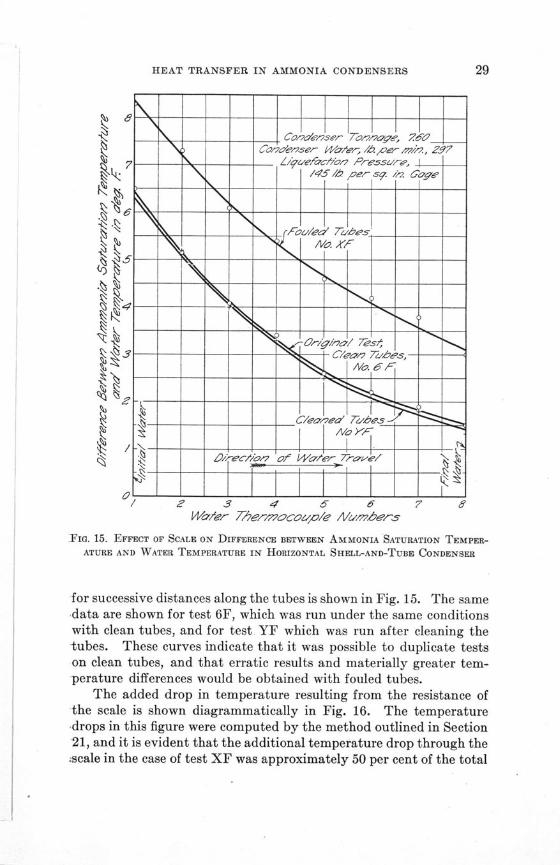
TIG. 15. EFFECT OF SCALE ON DIFFERENCE BETWEEN AMMONIA SATURATION TEMPER-ATURE AND WATER TEMPERATURE IN HORIZONTAL SHELL-AND-TUBE CONDENSER
for successive distances along the tubes is shown in Fig. 15. The samedata are shown for test 6F, which was run under the same conditionswith clean tubes, and for test YF which was run after cleaning thetubes. These curves indicate that it was possible to duplicate testson clean tubes, and that erratic results and materially greater tem-perature differences would be obtained with fouled tubes.
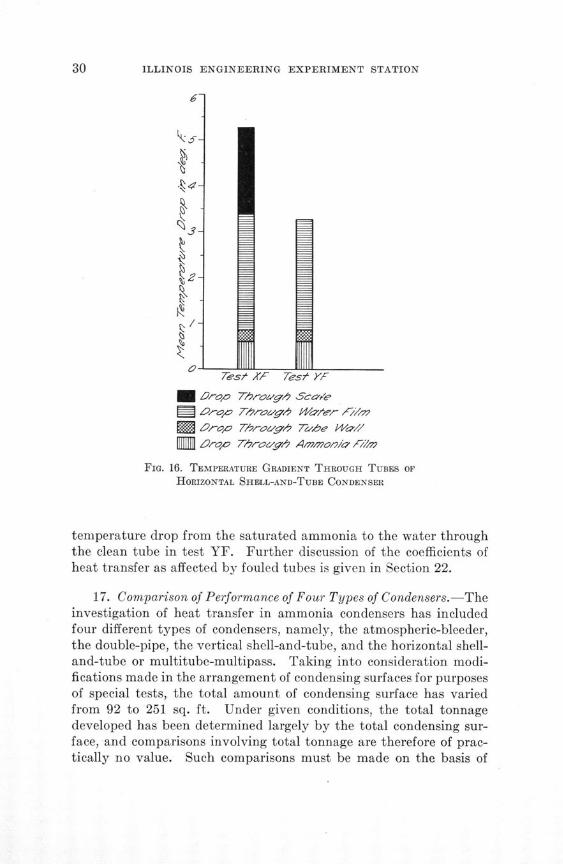
The added drop in temperature resulting from the resistance ofthe scale is shown diagrammatically in Fig. 16. The temperaturedrops in this figure were computed by the method outlined in Section21, and it is evident that the additional temperature drop through the-scale in the case of test XF was approximately 50 per cent of the total
7 8
ILLINOIS ENGINEERING EXPERIMENT STATION
K6-
.~ 4-
x
1-
Test A'F Test YF
I Droo Th9ror W Sca'e9reyy 7hro•g Wg/yr i-W'//Y
FIG. 16. TEMPERATURE GRADIENT THROUGH TUBES OF
HORIZONTAL SHELL-AND-TUBE CONDENSER
temperature drop from the saturated ammonia to the water throughthe clean tube in test YF. Further discussion of the coefficients ofheat transfer as affected by fouled tubes is given in Section 22.
17. Comparison of Performance of Four Types of Condensers.-Theinvestigation of heat transfer in ammonia condensers has includedfour different types of condensers, namely, the atmospheric-bleeder,the double-pipe, the vertical shell-and-tube, and the horizontal shell-and-tube or multitube-multipass. Taking into consideration modi-fications made in the arrangement of condensing surfaces for purposesof special tests, the total amount of condensing surface has variedfrom 92 to 251 sq. ft. Under given conditions, the total tonnagedeveloped has been determined largely by the total condensing sur-face, and comparisons involving total tonnage are therefore of prac-tically no value. Such comparisons must be made on the basis of
!
HEAT TRANSFER IN AMMONIA CONDENSERS
C'da1ser-P W ,7er /_/ g 0/ ,er- ,7'. per s,7 fit
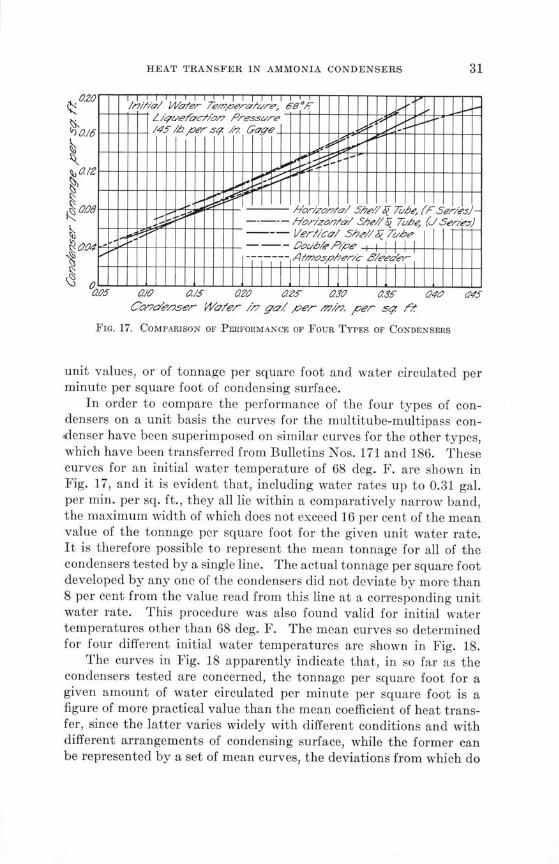
FaIG. 17. COMPARISON OF PERFORMANCE OF FOUR TYPES OF CONDENSERS
unit values, or of tonnage per square foot and water circulated perminute per square foot of condensing surface.
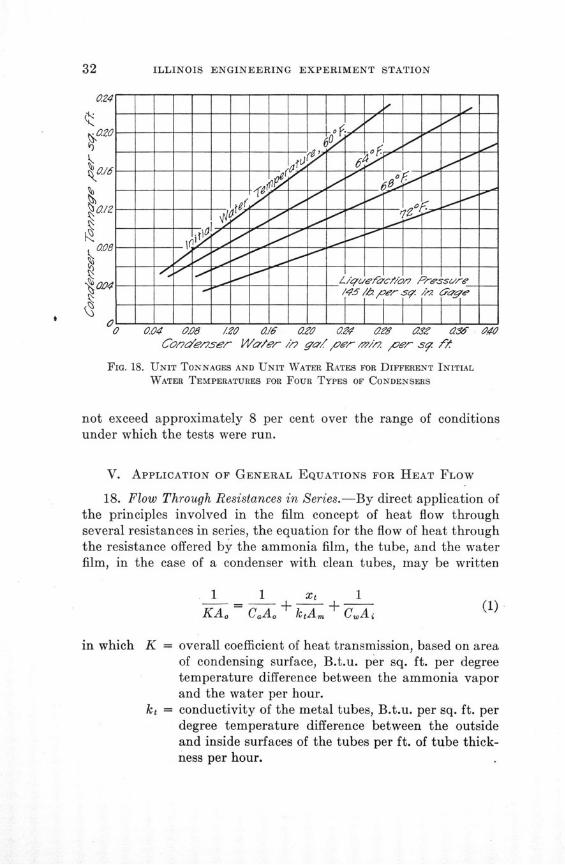
In order to compare the performance of the four types of con-densers on a unit basis the curves for the multitube-multipass con-denser have been superimposed on similar curves for the other types,which have been transferred from Bulletins Nos. 171 and 186. Thesecurves for an initial water temperature of 68 deg. F. are shown inFig. 17, and it is evident that, including water rates up to 0.31 gal.per min. per sq. ft., they all lie within a comparatively narrow band,the maximum width of which does not exceed 16 per cent of the meanvalue of the tonnage per square foot for the given unit water rate.It is therefore possible to represent the mean tonnage for all of thecondensers tested by a single line. The actual tonnage per square footdeveloped by any one of the condensers did not deviate by more than8 per cent from the value read from this line at a corresponding unitwater rate. This procedure was also found valid for initial watertemperatures other than 68 deg. F. The mean curves so determinedfor four different initial water temperatures are shown in Fig. 18.
The curves in Fig. 18 apparently indicate that, in so far as thecondensers tested are concerned, the tonnage per square foot for agiven amount of water circulated per minute per square foot is afigure of more practical value than the mean coefficient of heat trans-fer, since the latter varies widely with different conditions and withdifferent arrangements of condensing surface, while the former canbe represented by a set of mean curves, the deviations from which do
ILLINOIS ENGINEERING EXPERIMENT STATION
Con'de,'ser Wa/e- /r2 ga le/ per ,'711. per s• ft.
FIG. 18. UNIT TONNAGES AND UNIT WATER RATES FOR DIFFERENT INITIAL
WATER TEMPERATURES FOR FOUR TYPES OF CONDENSERS
not exceed approximately 8 per cent over the range of conditionsunder which the tests were run.
V. APPLICATION OF GENERAL EQUATIONS FOR HEAT FLOW
18. Flow Through Resistances in Series.-By direct application ofthe principles involved in the film concept of heat flow throughseveral resistances in series, the equation for the flow of heat throughthe resistance offered by the ammonia film, the tube, and the waterfilm, in the case of a condenser with clean tubes, may be written
1 1 xt 1
KA. - C.A.o k+ A C.Aj
in which K = overall coefficient of heat transmission, based on areaof condensing surface, B.t.u. per sq. ft. per degreetemperature difference between the ammonia vaporand the water per hour.
k, = conductivity of the metal tubes, B.t.u. per sq. ft. perdegree temperature difference between the outsideand inside surfaces of the tubes per ft. of tube thick-ness per hour.
HEAT TRANSFER IN AMMONIA CONDENSERS
Co = conductance of the ammonia film, based on the areaof the film, or the outside area of the tubes, and theactual thickness of film, B.t.u. per sq. ft. per degreetemperature difference between the ammonia vaporand the outside surface of the tube per hour.
Cw = conductance of the water film, based on the area ofthe film, or the inside area of the tubes, and the actualthickness of film, B.t.u. per sq. ft. per degree tem-perature difference between the inside surface of thetube and the water per hour.
Ao = area of the outside surface of the tubes, sq. ft.Ai = area of the inside surface of the tubes, sq. ft.
Am = mean of the areas of the outside and inside surfacesof the tubes, sq. ft.
xt = thickness of tube wall, in ft.
Equation (1) may be written in terms of the area of the condensingsurface as follows:
1 1 x, 2d, 1 do)KAo CaA, ktAo. d + do ' C«Ao di (
in which do = outside diameter of tubes, ft.di = inside diameter of tubes, ft.
From Equation (2)
1 1 xt ( 2do, 1 (do\K-C,+ ] + ± (3)K Cý kt di + de C., di
The terms in Equation (3) now represent the total resistance to heatflow, the resistance of the ammonia film, the resistance of the cleantubes, and the resistance of the water film, respectively, all expressedas functions of the area of the condensing surface.
Since it is customary to use condensing surface, or the surface incontact with ammonia vapor, as the reference surface in making allcondenser computations, it will be convenient to use a virtual con-ductance for the water film C',,, which may be defined as the conduc-tance of the water film, based on condensing surface in B.t.u. persq. ft. of condensing surface per degree temperature difference be-tween the inside surface of the tubes and the water per hour. Then,
C'ýdo = Cd,
ILLINOIS ENGINEERING EXPERIMENT STATION
d.C' = C, (5)
Equation (3) then becomes
1 1 xt ( 2do 1K C + kt d + d + C, (6)
From Equation (6) it is evident that if the resistances of the tubesand ammonia film are assumed to be constant, and if the resistance of
1 1the water film -, is some function - of the water velocity v, a plot
1 1of - as ordinates against - as abscissas will give a straight line.
This form of plot was proposed by Wilson,* and has since been usedby Haslam, Ryan, and Weber,f and by McAdams, Sherwood, andTurnerl in evaluating the resistance of liquid films. These investi-gators have shown that for turbulent flow inside of tubes
1 1C - av0 8s (7)
in which a is a constant depending on the dimensions of the apparatusused.
Substituting the value of C. from Equation (5) and combininga di
do into a single constant b
1 1C'. b v° 's (8)
in which b is also a constant depending on the dimensions of the ap-paratus used, and represents the slope of the line obtained by plotting
1the observed values of '
1A plot of the observed values of 1 against the observed values of
1-0- obtained from the four series of tests, F, G, H, and I, is shown in
*E. E. Wilson, Trans. A.S.M.E., Vol. 37, 1915, p. 47.tR. T. Haslam, W. P. Ryan, and H. C. Weber, Industrial and Engineering Chemistry, Vol. 15,
1923, p. 1105.JW. H. McAdams, T. K. Sherwood, and R. F. Turner, Trans. A.S.M.E., Vol. 48, 1926, p. 1233.
HEAT TRANSFER IN AMMONIA CONDENSERS
/
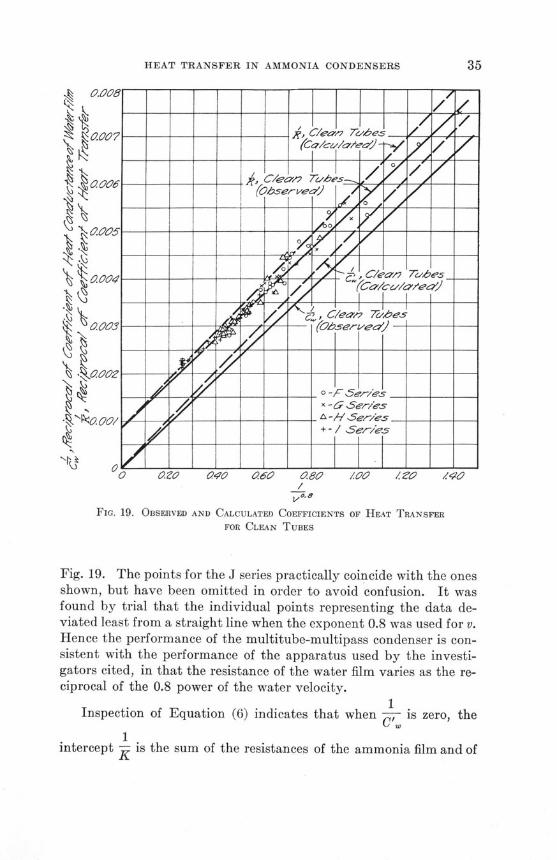
FIG. 19. OBSERVED AND CALCULATED COEFFICIENTS OF HEAT TRANSFER
FOR CLEAN TUBES
Fig. 19. The points for the J series practically coincide with the onesshown, but have been omitted in order to avoid confusion. It wasfound by trial that the individual points representing the data de-viated least from a straight line when the exponent 0.8 was used for v.Hence the performance of the multitube-multipass condenser is con-sistent with the performance of the apparatus used by the investi-gators cited, in that the resistance of the water film varies as the re-ciprocal of the 0.8 power of the water velocity.
1Inspection of Equation (6) indicates that when - is zero, the
1intercept - is the sum of the resistances of the ammonia film and of
K.
ILLINOIS ENGINEERING EXPERIMENT STATION
the clean tube. Furthermore, if these two resistances are assumed toremain constant over the range of the tests, a line drawn through the
1origin parallel to the line representing - for clean tubes will represent
1the resistance of the water film ,-, based on a unit of condensing
surface.
19. Resistance of Ammonia Film.-If the conductivity of themetal in the tube is known, the conductance of the ammonia film may
1be calculated by making ,- zero, and substituting the value of the
1intercept for K in Equation (6). In the case of the tests under dis-
cussion, the intercept, from Fig. 19, is 0.00085, the outside diameterof the tubes was 0.1667 ft., the inside diameter 0.1508 ft., and thethickness of tubes 0.00795 ft. The tubes were made of charcoal ironand the conductivity kt was taken as 34.9.* Substituting in Equa-tion (6)
1 0.00795 X 2 X 0.16670.00085 = C~ 34.9 X (0.1667 + 0.1508) + 0
Ca = 1635.
The value, 1635, thus found is somewhat higher than the value952 deduced by Sherwoodt for vertical shell and tube condensers.Sherwood based his computations on a conductivity of 25 for themetal tube. If this value were used in the present computations avalue of 1940 for Ca would result. In both cases the effect of scale orrust on the tube has been neglected. If the scale were taken into con-sideration the effect would be to increase the calculated value of Co.The presence of a greater amount of scale in the condensers investi-gated by Sherwood than in the one used on the tests under discussionmight serve as a possible explanation of the difference in the valuesof C. observed, since the greater scale resistance would cause a pro-portionally larger reduction in the value of C. for the vertical shell andtube condenser. However, it is not probable that this would accountfor so large a difference. The tests on the vertical shell and tube con-densers included in Sherwood's analysis were run under somewhatdifferent conditions than the ones on the multitube-multipass con-
*Mark's Handbook, p. 303.tT. K. Sherwood, Refrigerating Engineering, Vol. 13, No. 8, February, 1927, p. 253.
HEAT TRANSFER IN AMMONIA CONDENSERS
denser, in that in the former the superheat was removed in the con-denser itself, while in the latter a separate superheat remover wasused. Hence, the average conductance determined by Sherwoodincluded that of the gas film in the superheated region. The conduc-tance of the superheated gas film would be lower than that for satur-ated vapor or liquid film, and the average conductance would be lowerthan the average determined under conditions where the whole con-denser contained saturated vapor only. Therefore, it seems reason-able that the value 1635 is more representative of the conductanceof the saturated ammonia film than the value 952.
20. Resistance of Water Film.-The resistance of the water filmper square foot of condensing surface is shown in Fig. 19 by the solid
1line, ,-, which passes through the origin. The conductance of the
Cfw
water film per square foot of condensing surface may be calculatedfrom this line, or from the empirical equation representing it.
C', = 211 vo 8. (9)
The idea that heat is transmitted from a flowing fluid to a surfaceby conduction through a stationary film of the fluid at the surface,and that the thickness of this film, and hence the rate of heat con-duction through it, is some function of the frictional resistance at thesurface, probably originated with Osborne Reynolds. This theoryhas been extended by Major C. I. Taylor,* T. E. Stanton, J. R.Pannell, and a number of other investigators.
Since the frictional resistance is a function of linear velocity,density, and viscosity of the liquid, and inside diameter of the tube,
kmand C =- , Rice,t and McAdams and FrostT have shown by the
principle of dimensional analysis that
C. di \ (10)
in which C, = conductance of a water film of thickness x,, B.t.u. perhr. per deg. F. per sq. ft. of water surface of the tube.
kv = conductivity of water, B.t.u. per hr. per sq. ft. perdeg. F. per ft. of thickness.
*British Advisory Committee for Aeronautics, Reports and Memoranda, Nos. 243 and 272.fC. W. Rice, Indus. & Eng. Chem., Vol. 16, No. 5, May, 1924, p. 460.:W. H. McAdams and T. H. Frost, Indus. & Eng. Chem., Vol. 14, No. 12, December, 1922, p. 1101.
ILLINOIS ENGINEERING EXPERIMENT STATION
di = inside diameter of tube, ft.v = velocity of water, ft. per sec.p = density of water, lb. per cu. ft., = absolute viscosity of water at the mean temperature
of the film, lb. per ft. per sec.By making use of these principles, and introducing a factor to
correct for entrance conditions, McAdams and Frost* have deducedthe equation
I / N\ divp nC = k- 1 (+ N K ) (11)
in which N = number of inside tube diameters to be added to theactual length of tube expressed in diameters, to obtainthe effective length for heat transfer.
r = ratio of actual tube length to actual inside diameter.
The ratio of the absolute viscosity to the density - is defined asp
the kinematic viscosity. By letting v = the kinematic viscosity insq. ft. per sec., Equation (11) may be written
C = = 1 + -) -) (12)
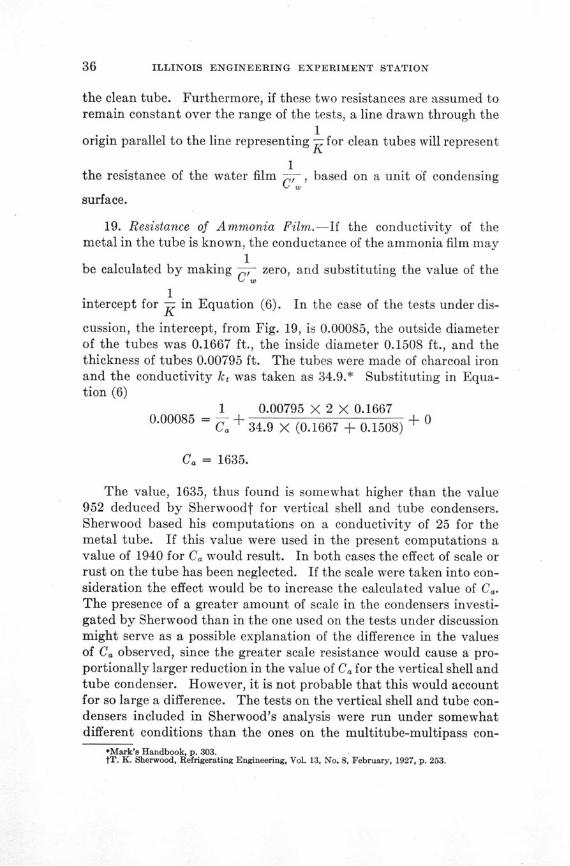
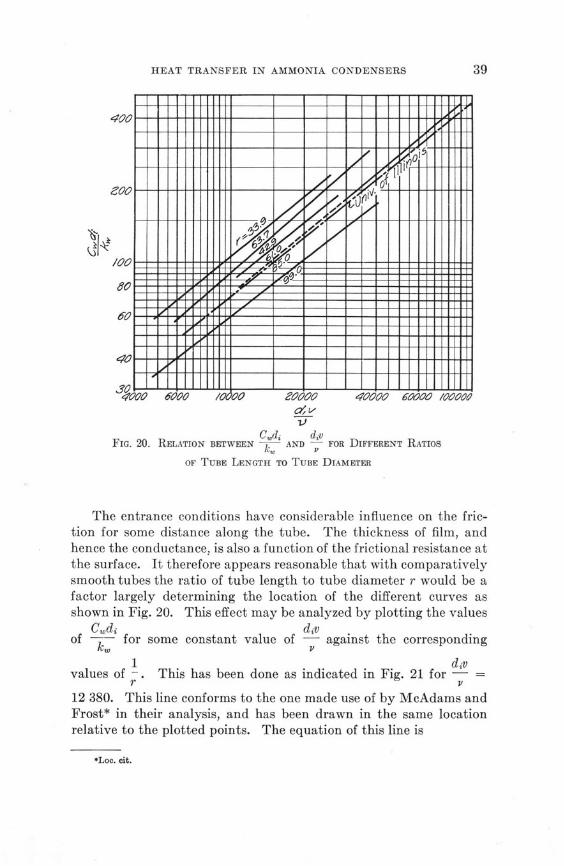
In order to evaluate N and to determine the nature of the functiondi v-- McAdams and Frost, using the data of Stanton,f Webster,t
Cwdi divand Bray and Sayler,§ plotted -A against -. These curves have
been replotted to conform to the units used in this paper, and areshown in Fig. 20. Since the average slope of the straight lines shown
divis 0.8, it is evident that - in Equation (12) must also have the
exponent 0.8, or
C-. / N)\(di (13)
where 4 is some constant to be determined from the experimentaldata.
*W. H. McAdams and T. H. Frost, Refrigerating Engineering, Vol. 10, No. 9, March, 1924, p. 323.tT. E. Stanton, Phil. Trans., Vol. 190A, 1897, p. 67.$Webster, Trans. Inst. Eng. and Shipbuilders in Scotland, Vol. 57, p. 58.§Bray and Sayler, Undergraduate Thesis, Mass. Inst. Tech.
HEAT TRANSFER IN AMMONIA CONDENSERS
4'4000 6000
2
6C'6'6'6'civ~Li d~v
4
7
I I I I I1 .1
b4
-Vii1
_0 [ I TI
){iI-j-
I I
4•U00 600W0 /00009
C~dj divFIG. 20. RELATION BETWEEN kw AND FOR DIFFERENT RATIOS
OF TUBE LENGTH TO TUBE DIAMETER
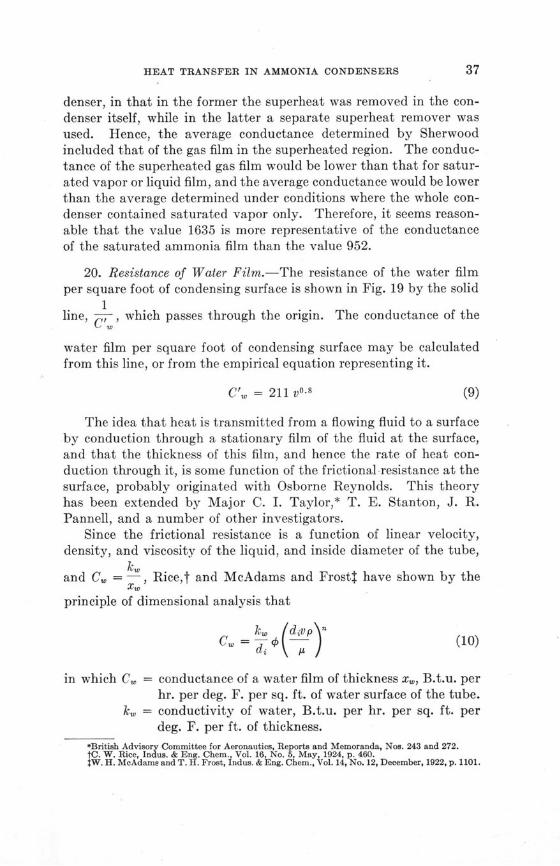
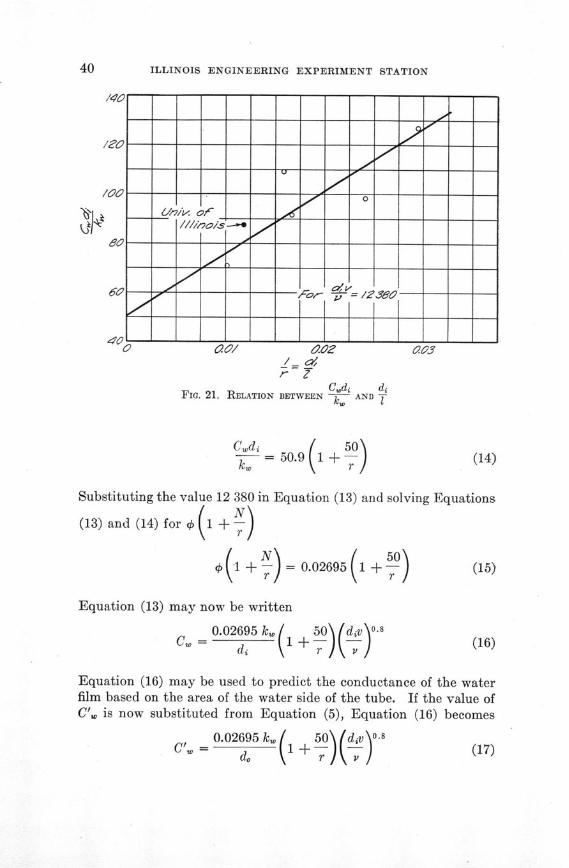
The entrance conditions have considerable influence on the fric-tion for some distance along the tube. The thickness of film, andhence the conductance, is also a function of the frictional resistance atthe surface. It therefore appears reasonable that with comparativelysmooth tubes the ratio of tube length to tube diameter r would be afactor largely determining the location of the different curves asshown in Fig. 20. This effect may be analyzed by plotting the values
Cwdi divof -d- for some constant value of - against the corresponding
1 divvalues of -. This has been done as indicated in Fig. 21 for -
r v12 380. This line conforms to the one made use of by McAdams andFrost* in their analysis, and has been drawn in the same locationrelative to the plotted points. The equation of this line is
*Loc. cit.
.4,ri"/
?K
-awHI \
ý0_
- _ ___M [- -_ _ I I. . . ..ll_ • I I I I_ _ l i. _ Ie1
.?/')
^
J .fJ J'$
VL/
ILLINOIS ENGINEERING EXPERIMENT STATION
/20 -- --- --- --- - -- - -- -- -- -- -
/-------- -'
10-
IIleao IF--
I0 ///7/s ^
6I -- -- -- -- -. - -- - - -- - - -- - -
__ _ __ ^ I __ _ _ _ _ _ _ _ _ _
6t -^ - - - - -/o !̂=/3I- - - -
£3 - - -- - -- -- - - -- -- - -- - -- _
r ZCwd, di
FIa. 21. RELATION BETWEEN k AND Tw
C(di 50)kC - 50.9 1 + rkýw r (14)
Substituting the value 12 380 in Equation (13) and solving Equations
(13) and (14) for l + N )
Equation (13) may now be written
0.02695 ký 50 ddv 0.8
C. di 4 7
Equation (16) may be used to predict the conductance of the waterfilm based on the area of the water side of the tube. If the value ofC'. is now substituted from Equation (5), Equation (16) becomes
0.02695 kc, 50 dv\ o .s8C- = 1 + -l
o"° \ / V
S1 + - 1= 0.02695 1 + -\ r )\ r
HEAT TRANSFER IN AMMONIA CONDENSERS
/wo000
<!'.
k
I,
*S
N
I'
3"
1'C-5
.. ' V /t^C - ----
/20O'CO --1/0 006)
/0000 -
60000-
60000 -
70000 -
60000-
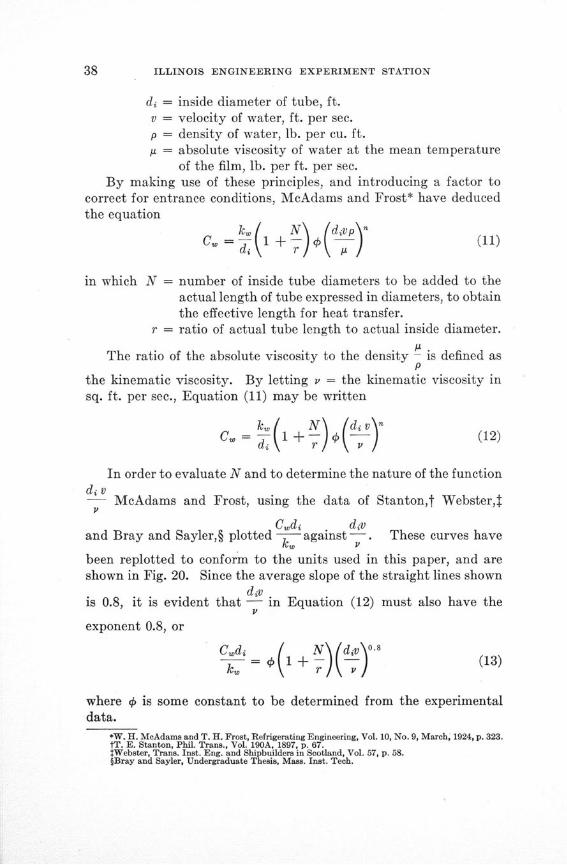
sooo00740 s0 60 70 60 90
Wa/'erF 'r?2peT tre ,? d'/ g_. /-
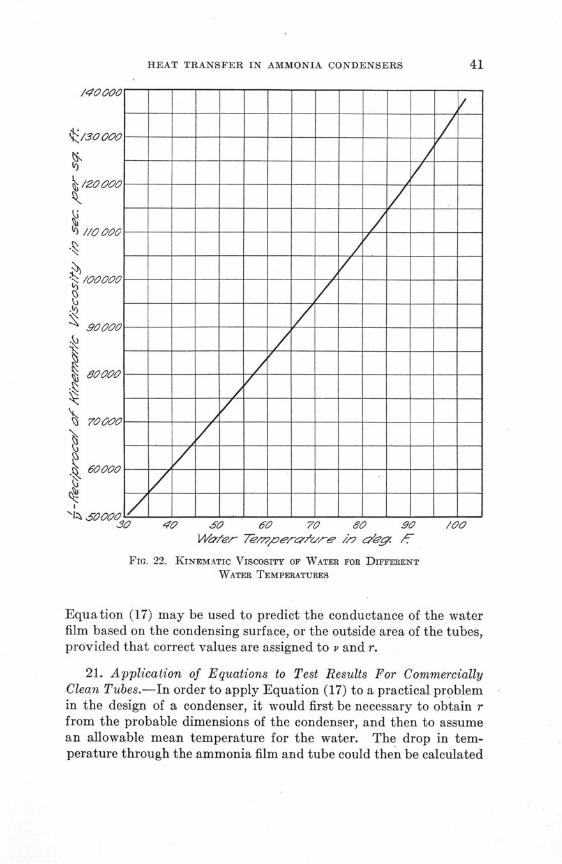
22. KINEMATIC VISCOSITY OF WATER FOR DIFFERENTWATER TEMPERATURES
Equation (17) may be used to predict the conductance of the waterfilm based on the condensing surface, or the outside area of the tubes,provided that correct values are assigned to v and r.
21. Application of Equations to Test Results For CommerciallyClean Tubes.-In order to apply Equation (17) to a practical problemin the design of a condenser, it would first be necessary to obtain rfrom the probable dimensions of the condenser, and then to assumean allowable mean temperature for the water. The drop in tem-perature through the ammonia film and tube could then be calculated
77
/7/
77/927
z92
J
ILLINOIS ENGINEERING EXPERIMENT STATION
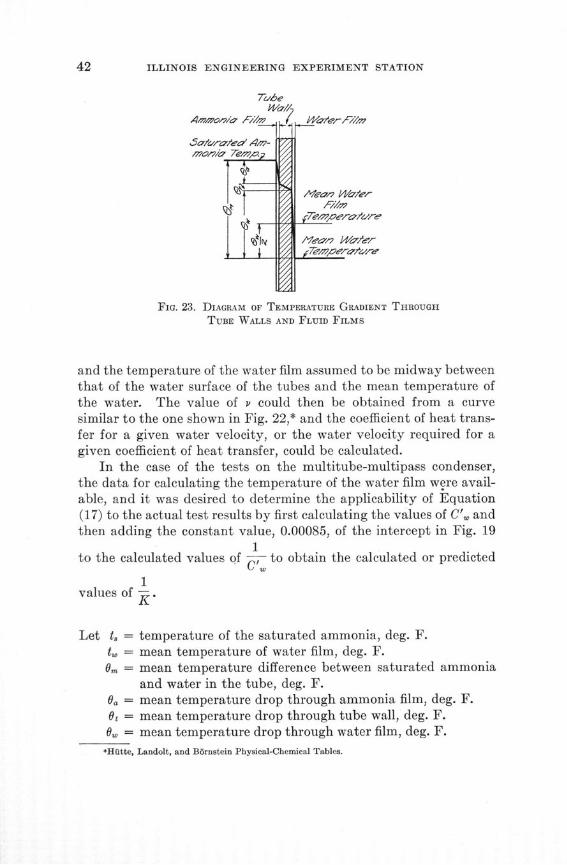
FIG. 23. DIAGRAM OF TEMPERATURE GRADIENT THROUGH
TUBE WALLS AND FLUID FILMS
and the temperature of the water film assumed to be midway betweenthat of the water surface of the tubes and the mean temperature ofthe water. The value of v could then be obtained from a curvesimilar to the one shown in Fig. 22,* and the coefficient of heat trans-fer for a given water velocity, or the water velocity required for agiven coefficient of heat transfer, could be calculated.
In the case of the tests on the multitube-multipass condenser,the data for calculating the temperature of the water film were avail-able, and it was desired to determine the applicability of Equation(17) to the actual test results by first calculating the values of C', andthen adding the constant value, 0.00085, of the intercept in Fig. 19
1to the calculated values of , to obtain the calculated or predicted
1values of -.
Let t, = temperature of the saturated ammonia, deg. F.t4 = mean temperature of water film, deg. F.
0m = mean temperature difference between saturated ammoniaand water in the tube, deg. F.
Oa = mean temperature drop through ammonia film, deg. F.0t = mean temperature drop through tube wall, deg. F.0C = mean temperature drop through water film, deg. F.
*Hiitte, Landolt, and B6rnstein Physical-Chemical Tables.
HEAT TRANSFER IN AMMONIA CONDENSERS
Then, from Fig. 23,
0w = Om - (O0 + 0o)
t= t.- , + 2
o + 0. + Ot)•".* tw = t. -- 32
The total heatthe ammonia
transfer may be calculated from the heat given up by
H = 60 W (i" - i') (21)
in which H = heat transferred from the ammonia to the water,B.t.u. per hour.
W = ammonia condensed, lb. per min.i" = heat content of dry saturated ammonia vapor at the
temperature of liquefaction in the condenser, B.t.u.per lb.
i' = heat content of the liquid ammonia at the temperatureof the liquid leaving the condenser, B.t.u. per lb.
The temperature drop through the ammonia film may be cal-culated from
HS= CaAo
Cý ^Aý
or substituting from Equation (21), and using the value Ca = 1635as determined from the intercept in Fig. 19
60W(i" -i')a = 1635 X 93.8
The temperature drop through the tube may be calculated from
H xt 0.00795 X 60 W (i" - i')kt A m 34.9 X 89.5
Since the liquid leaving the condenser was at the same temper-ature as the saturated ammonia, sufficient data are given in Table 1to permit the calculation of the mean temperature of the water film
(18)
(19)
(20)
ILLINOIS ENGINEERING EXPERIMENT STATION
from Equations (24), (23), and (20). This has been done for eachtest and the results are also given in Table 1.
The correction factor, 50.9 1 + - , which was obtained in
Equation (14) to correct for entrance conditions, was derived frominvestigations on single straight tubes. Just what effect the arrange-ment of tubes in the multitube-multipass condenser would have onthis correction factor is somewhat problematical. In the final an-alysis, therefore, the application of Equation (17) to the results ob-tained on these tests must be regarded as a test of the validity of thiscorrection factor as applied to a commercial condenser of the typetested. In the present case the value of r was obtained from thefollowing considerations: Since the two shells were connected inparallel, the friction pressure losses, and hence the entry conditions,for the condenser as a whole were identical with those for a singleshell. In a single shell the water passed through the seven tubes inseries, and the seven tubes were regarded as a single tube with length71, having the equivalent of seven entry losses. The ratio r for a
12.82 Nsingle tube would be - - 85, and the factor - was regarded as
0.151 r7 X 50 50 507 X = , which would conform to the - in Equation (17).
From the film temperatures given in Table 1 it is possible toobtain three separate curves for the calculated values of C'U, one foreach of the three condenser pressures, 125, 150, and 175 lb. per sq. in.gage. However, since the points representing the observed values of1
- in Fig. 19 did not appear to be arranged in separate bands corres-
ponding to the three condenser pressures, a single line representing1
the composite values of - was drawn. It is probable that with in-
creased condenser pressures a corresponding decrease in the conduc-tance of the ammonia film occurs to offset the normally increasedconductance of the water film resulting from the higher mean tem-peratures of the water for a given water velocity. Hence, the effectof increased temperature observed in the calculated values of C',
1would not be reflected in the observed values of K or - . This could
not be accounted for in the present calculations, because the values of11K were obtained by adding the fixed intercept 0.00085, representing
HEAT TRANSFER IN AMMONIA CONDENSERS
the resistance of the commercially clean tubes and ammonia film, to1
the calculated values of - . For this reason the water film temper-CI,
1atures given in Table 1 were averaged, and the average value - =
105 600 read from the curve in Fig. 22, corresponding to the averagetemperature 78.1 deg. F., was substituted in Equation (17) in order
1to obtain the single average curve , (calculated), which is shown as
a broken line in Fig. 19. Also, a constant value of 0.329 B.t.u. per hr.per sq. ft. per deg. F. per ft. of thickness was used for k,.Substitution in Equation (17) gives
0.02695 X 0.329 +50C' = 0.1667 8 + (105 600 X 0.1508 v)o 8
Therefore, C'w = 194 v0°. (25)
1This line has been shown as , (calculated) in Fig. 19, and the
equation may be compared with that of the observed line given inEquation (9).
1The line - (calculated) in Fig. 19 was obtained by adding the
intercept 0.00085 to the values calculated from Equation (25), and1
it may be observed that it also represents the observed values of -K
with a fair degree of accuracy.It has been indicated that any uncertainty in the application of
Equation (17) to commercial condensers lies in the evaluation of theratio r, and the fact that the correction factor for entrance conditionswas obtained from a consideration of data obtained on single straighttubes with one entry loss as shown in Fig. 21. The points represent-ing the data show considerable deviations from the line drawn, andthe line so drawn has been made to conform to the one used byMcAdams and Frost* in order that the final Equation (17) mightconform to the one deduced by them.
If it is assumed that the resistances of the ammonia film and thetube wall remain practically constant over the whole range, and that
1the line C,- (observed) in Fig. 19 is a correct representation of the
*Loc. cit.
ILLINOIS ENGINEERING EXPERIMENT STATION
1observed values of , for the University of Illinois tests, correspond-
Cyd diving values of C and - may be calculated, and, a line representing
these tests drawn as shown in Fig. 20. From this line another point,as shown in Fig. 21, may be derived. A line drawn through this pointwould represent the composite data almost as well as the line that wasused. Under these conditions a new value for the correction factor
4 1 + - N), given in Equation (13), could be derived, and by using
this factor in Equation (17) the line representing the calculated values1
of in Fig. 19 could have been made identical with the one represent-K1
ing the observed values of - . It has not been considered advisable,
however, to derive a new correction factor and rewrite Equation (17),for the reason that, while it might be representative of tests on themultitube-multipass condenser used, the data obtained from one sizeof condenser are not sufficient to draw the conclusion that the cor-rection factor so derived would be representative of the multitube-multipass type as a whole. The equation, as it exists in the literatureat present, although not based on data including this type, representsthe results within limits of about 10 per cent, which is probably anacceptable degree of accuracy for the practical purposes of condenserdesign. However, the analysis does indicate the advisability of morefundamental work being done using tube arrangements correspondingto those found in commercial types of condensers in order to establishrelations similar to those shown in Fig. 21, from which correctionfactors strictly applicable to the various types may be derived.
22. Application of Equations to Test Results for Fouled Tubes.-The results of the GX series of tests indicating the relation betweenthe values of K and the rate at which scale formed on the tubes areshown in Fig. 14.
In the case of fouled tubes Equation (6) must be modified by1
adding a term, C-', the conductance of the scale based on area of
condensing surface. In this case the intercept will represent the sumof the resistances of the ammonia film, the tube wall, and the scale.Hence, if the line for commercially clean tubes has been determined asin Fig. 19, the resistance of the scale may be found by drawing a line
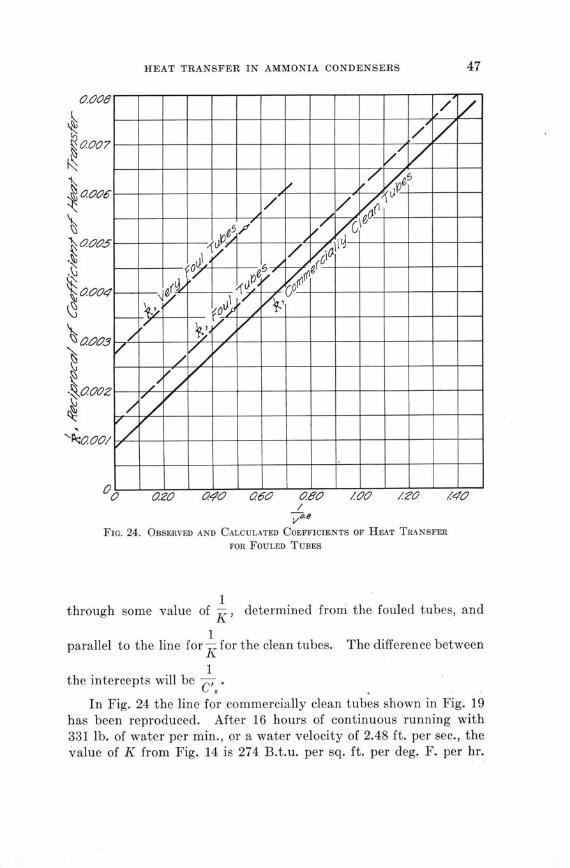
HEAT TRANSFER IN AMMONIA CONDENSERS
FIG. 24. OBSERVED AND CALCULATED COEFFICIENTS OF HEAT TRANSFER
FOR FOULED TUBES
1through some value of K, determined from the fouled tubes, and
parallel to the line for - for the clean tubes. The difference between
1the intercepts will be C'%.
In Fig. 24 the line for commercially clean tubes shown in Fig. 19has been reproduced. After 16 hours of continuous running with331 lb. of water per min., or a water velocity of 2.48 ft. per sec., thevalue of K from Fig. 14 is 274 B.t.u. per sq. ft. per deg. F. per hr.
ILLINOIS ENGINEERING EXPERIMENT STATION
1 1The corresponding values of - and - have been plotted in Fig. 24,
1and the line - for foul tubes has been drawn parallel to the one for
clean tubes. The difference in intercepts is 0.00135 - 0.00085 =0.0005. Hence the conductance of the scale, C'3 , after 16 hours ofrunning, was 2000 B.t.u. per sq. ft. of condensing surface per deg. F.per hr.
When 209 lb. of water per min. were circulated the velocity was1 1
1.56 ft. per sec. and 0-. = 0.701. The corresponding value of - read
from the curve in Fig. 24 is 0.00467, or K = 214. This point on thecurve for 209 lb. of water per min. in Fig. 14 would give the number ofhours necessary to run at this rate in order to build up a scale resis-
1tance of 2 corresponding to that obtained at the 331 lb. rate after
200016 hours of running. The time thus obtained is 9.2 hours. These twopoints have been connected with the line marked "Scale Resistance =
1000 in Fig. 14.
2000Test XF in Table 1 was run when the tubes had a comparatively
thick deposit of scale, while test YF was run under the same condi-tions of load and water velocity, but with clean tubes. For test XF,1 1
- = 0.532, and K = 0.00535. This point has also been plotted in
1Fig. 24, and the line k- for very fouled tubes has been drawn parallel
to the one for clean tubes. The difference in intercepts is 0.00275 -0.00085 = 0.00190. Hence C', for the very fouled tubes is 527 ascompared to 2000 for tubes only moderately fouled.
VI. CONCLUSIONS
23. Conclusions.-The following conclusions may be drawn fromthis investigation, subject to such limitations as may be imposed bythe range covered, and by the conditions specifically stated underwhich the tests were run:
(1) For a given initial water temperature and given weight ofcooling water per minute the increase in total tonnage is directlyproportional to the increase in condenser pressure expressed in lb. persq. in. gage.
HEAT TRANSFER IN AMMONIA CONDENSERS
(2) The actual total capacity developed is governed by theamount of condensing surface, the limiting condenser pressure, thetemperature of the water available, and the amount of water cir-culated.
(3) For a given difference between the ammonia saturation tem-perature and the initial water temperature, the condenser pressurehas no material effect on the total tonnage developed with a givenweight of water circulated per minute.
(4) For a given difference between the ammonia saturation tem-perature and the initial water temperature, the increase in tonnagedeveloped is directly proportional to the increase in weight of coolingwater circulated per minute.
(5) For given water velocities through the condenser tubes, lowervalues are obtained for the coefficients of heat transfer when the twoidentical shells of the condenser are connected in series than whenthey are connected in parallel.
(6) The most effective arrangement for condensing surface is onein which the water travel is comparatively short, and which offers alarge area for the action of the coldest water near the point of entry.
(7) For a given weight of water circulated per minute per squarefoot a higher value for the'coefficient of heat transfer and for the totaltonnage developed is obtained when the two identical shells of thecondenser are connected in series, than when they are connected inparallel, but these higher values are accompanied by greatly increasedfriction pressure losses, and hence increased power is required to cir-culate the cooling water.
(8) The decrease in the heat transmission caused by fouling of thetubes was very marked during the first four hours of running subse-quent to cleaning. At the end of this time the effect of scale formationmaterially decreased and the rate of heat transfer became practicallyconstant over a wide range of water rates.
(9) For a given tonnage developed and a given water rate foulingof the tubes results in greatly increased temperature differences be-tween the saturated ammonia and the cooling water, and in greatlyreduced coefficients of heat transfer.
(10) For a given initial water temperature the condenser tonnagesdeveloped per square foot of condensing surface over a range ofvolumes of water circulated per minute per square foot can be rep-resented by a mean curve, with deviations not exceeding 8 per centfor any of the condensers tested. It is possible that these curves maybe of more practical value than those for mean coefficients of heattransfer.
50 ILLINOIS ENGINEERING EXPERIMENT STATION
(11) The general equations, now existing in the literature, for heatflow in condensers may be used within limits of 10 per cent to predictthe coefficients of heat transfer obtained for the multitube-multipassammonia condenser under the conditions and over the range of watervelocities used in these tests.
(12) More fundamental work should be done with tube arrange-ments corresponding to those found in commercial types of condensersin order to establish factors in the equations to render them moregenerally and more strictly applicable to the various types.
RECENT PUBLICATIONS OFTHE ENGINEERING EXPERIMENT STATIONt
Bulletin No. 163. A Study of Hard Finish Gypsum Plasters, by Thomas N.McVay. 1927. Thirty cents.
Circular No. 15. The Warm-Air Heating Research Residence in Zero Weather,by Vincent S. Day. 1927. None Available.
Bulletin No. 164. Tests of the Fatigue Strength of Cast Iron, by H. F. Moore,S. W. Lyon, and N. P. Inglis. 1927. Thirty cents.
Bulletin No. 165. A Study of Fatigue Cracks in Car Axles, by H. F. Moore.1927. Fifteen cents.
Bulletin No. 166. Investigation of Web Stresses in Reinforced Concrete Beams,by F. E. Richart. 1927. Sixty cents.
Bulletin No. 167. Freight Train Curve-Resistance on a One-Degree Curve and aThree-Degree Curve, by Edward C. Schmidt. 1927. Twenty-five cents.
Bulletin No. 168. Heat Transmission Through Boiler Tubes, by Huber 0. Croft.1927. Thirty cents.
Bulletin No. 169. Effect of Enclosures on Direct Steam Radiator Performance,by Maurice K. Fahnestock. 1927. Twenty cents.
Bulletin No. 170. The Measurement of Air Quantities and Energy Losses inMine Entries. Part II, by Alfred C. Callen and Cloyde M. Smith. 1927. Forty-fivecents.
Bulletin No. 171. Heat Transfer in Ammonia Condensers, by Alonzo P. Kratz,Horace J. Macintire, and Richard E. Gould. 1927. Thirty-five cents.
Bulletin No. 172. The Absorption of Sound by Materials, by Floyd R. Watson.1927. Twenty cents.
*Bulletin No. 173. The Surface Tension of Molten Metals, by Earl E. Libman.1928. Thirty cents.
*Circular No. 16. A Simple Method of Determining Stress in Curved FlexuralMembers, by Benjamin J. Wilson and John F. Quereau. 1928. Fifteen cents.
Bulletin No. 174. The Effect of Climatic Changes upon a Multiple-Span Re-inforced Concrete Arch Bridge, by Wilbur M. Wilson. 1928. Forty cents.
Bulletin No. 175. An Investigation of Web Stresses in Reinforced ConcreteBeams. Part II. Restrained Beams, by Frank E. Richart and Louis J. Larson.1928. Forty-five cents.
Bulletin No. 176. A Metallographic Study of the Path of Fatigue Failure inCopper, by Herbert F. Moore and Frank C. Howard. 1928. Twenty cents.
Bulletin No. 177. Embrittlement of Boiler Plate, by Samuel W. Parr and Fred-erick G. Straub. 1928. None Available.
*Bulletin No. 178. Tests on the Hydraulics and Pneumatics of House Plumbing.Part II, by Harold E. Babbitt. 1928. Thirty-five cents.
Bulletin No. 179. An Investigation of Checkerbrick for Carbureters of Water-gasMachines, by C. W. Parmelee, A. E. R. Westman, and W. H. Pfeiffer. 1928. Fiftycents.
Bulletin No. 180. The Classification of Coal, by Samuel W. Parr. 1928. Thirty-five cents.
Bulletin No. 181. The Thermal Expansion of Fireclay Bricks, by Albert E. R.Westman. 1928. Twenty cents.
*Bulletin No. 182. Flow of Brine in Pipes, by Richard E. Gould and Marion I.Levy. 1928. Fifteen cents.
Circular No. 17. A Laboratory Furnace for Testing Resistance of Firebrick toSlag Erosion, by Ralph K. Hursh and Chester E. Grigsby. 1928. Fifteen cents.
*Bulletin No. 183. Tests of the Fatigue Strength of Steam Turbine Blade Shapes,by Herbert F. Moore, Stuart W. Lyon, and Norville J. Alleman. 1928. Twenty-fivecents.
*Bulletin No. 184. The Measurement of Air Quantities and Energy Losses inMine Entries. Part III, by Alfred C. Callen and Cloyde M. Smith. 1928. Thirty-five cents.
tCopies of the complete list of publications can be obtained without charge by addressing theEngineering Experiment station, Urbana, Ill.
*A limited number of copies of the bulletins staired are available for free distribution.
ILLINOIS ENGINEERING EXPERIMENT STATION
*Bulletin No. 185. A Study of the Failure of Concrete Under Combined Com-pressive Stresses, by Frank E. Richart, Anton Brandtzaeg, and Rex L. Brown. 1928.Fifty-five cents.
*Bulletin No. 186. Heat Transfer in Ammonia Condensers. Part II, by AlonzoP. Kratz, Horace J. Macintire, and Richard E. Gould. 1928. Twenty cents.
*Bulletin No. 187. The Surface Tension of Molten Metals. Part II, by Earl E.Libman. 1928. Fifteen cents.
*Bulletin No. 188. Investigation of Warm-air Furnaces and Heating Systems.Part III, by Arthur C. Willard, Alonzo P. Kratz, and Vincent S. Day. 1928. Forty-five cents.
Bulletin No. 189. Investigation of Warm-air Furnaces and Heating Systems.Part IV, by Arthur C. Willard, Alonzo P. Kratz, and Vincent S. Day. 1929. Sixtycents.
*Bulletin No. 190. The Failure of Plain and Spirally Reinforced Concrete inCompression, by Frank E. Richart, Anton Brandtzaeg, and Rex L. Brown. 1929.Forty cents.
Bulletin No. 191. Rolling Tests of Plates, by Wilbur M. Wilson. 1929. Thirtycents.
Bulletin No. 192. Investigation of Heating Rooms with Direct Steam RadiatorsEquipped with Enclosures and Shields, by Arthur C. Willard, Alonzo P. Kratz,Maurice K. Fahnestock, and Seichi Konzo. 1929. Forty cents.
Bulletin No. 193. An X-Ray Study of Firebrick, by Albert E. R. Westman.1929. Fifteen cents.
*Bulletin No. 194. Tuning of Oscillating Circuits by Plate Current Variations,by J. Tykocinski-Tykociner and Ralph W. Armstrong. 1929. Twenty-five cents.
Bulletin No. 195. The Plaster-Model Method of Determining Stresses Appliedto Curved Beams, by Fred B. Seely and Richard V. James. 1929. Twenty cents.
*Bulletin No. 196. An Investigation of the Friability of Different Coals, by CloydeM. Smith. 1929. Thirty cents.
*Circular No. 18. The Construction, Rehabilitation, and Maintenance of GravelRoads Suitable for Moderate Traffic, by Carroll C. Wiley. 1929. Thirty cents.
*Bulletin No. 197. A Study of Fatigue Cracks in Car Axles. Part II, by HerbertF. Moore, Stuart W. Lyon, and Norville J. Alleman. 1929. Twenty cents.
*Bulletin No. 198. Results of Tests on Sewage Treatment, by Harold E. Babbittand Harry E. Schlenz. 1929. Fifty-five cents.
*Bulletin No. 199. The Measurement of Air Quantities and Energy Losses inMine Entries. Part IV, by Cloyde M. Smith. 1929. Thirty cents.
*Bulletin No. 200. Investigation of Endurance of Bond Strength of Various Claysin Molding Sand, by Carl H. Casberg and William H. Spencer. 1929. Fifteen cents.
*Circular No. 19. Equipment for Gas-Liquid Reactions, by Donald B. Keyes.1929. Ten cents.
Bulletin No. 201. Acid Resisting Cover Enamels for Sheet Iron, by Andrew I.Andrews. 1929. Twenty-five cents.
*Bulletin No. 202. Laboratory Tests of Reinforced Concrete Arch Ribs, byWilbur M. Wilson. 1929. Fifty-five cents.
*Bulletin No. 203. Dependability of the Theory of Concrete Arches, by HardyCross. 1929. Twenty cents.
*Bulletin No. 204. The Hydroxylation of Double Bonds, by Sherlock Swann, Jr.1930. Ten cents.
*Bulletin No. 205. A Study of the Ikeda (Electrical Resistance) Short-Time Testfor Fatigue Strength of Metals, by Herbert F. Moore and Seichi Konzo. 1930.Twenty cents.
*Bulletin No. 206. Studies in Electrodeposition of Metals, by Donald B. Keyesand Sherlock Swann, Jr. 1930. Ten cents.
*Bulletin No. 207. The Flow of Air Through Circular Orifices with RoundedApproach, by Joseph A. Polson, Joseph G. Lowther and Benjamin J. Wilson. 1930.Thirty cents.
*Circular No. 20. An Electrical Method for the Determination of the Dew-Pointof Flue Gases, by Henry Fraser Johnstone. 1929. Fifteen cents.
*Bulletin No. 208. A Study of Slip Lines, Strain Lines, and Cracks in MetalsUnder Repeated Stress, by Herbert F. Moore and Tibor Ver. 1930. In press.
*Bulletin No. 209. Heat Transfer in Ammonia Condensers. Part III, by AlonzoP. Kratz, Horace J. Macintire, and Richard E. Gould. 1930. Thirty-five cents.
*A limited number of copies of the bulletins starred are available for free distribution.
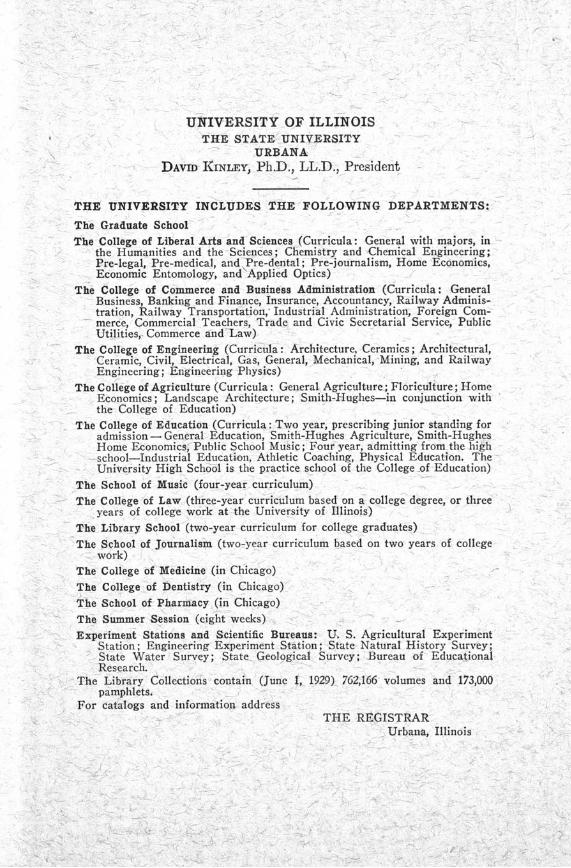
UNIVERSITY OF ILLINOISTHE STATE UNIVERSITY
URBANADAVID IINLEY, Ph.D., LL.D., President
THE UNIVERSITY INCLUDES THE FOLLOWING DEPARTMENTS:
The Graduate School
The College of Liberal Arts and Sciences (Curricula: General with majors, inthe Humanities and the Sciences; Chemistry and Chemical Engineering;Pre-legal, Pre-medical, and Pre-dental; Pre-journalism, Home Economics,Economic Entomology, and Applied Optics)
The College of Commerce and Business Administration (Curricula: GeneralBusiness, Banking and Finance, Insurance, Accountancy, Railway Adminis-tration, Railway Transportation," Industrial Administration, Foreign Com-merce, Commercial Teachers, Trade and Civic Secretarial Service, PublicUtilities, Commerce and Law)
The College of Engineering (Curricula: Architecture, Ceramics; Architectural,Ceramic, Civil, Electrical, Gas, General, Mechanical, Mining, and RailwayEngineering; Engineering Physics)
The College of Agriculture (Curricula: General Agriculture; Floriculture; HomeEconomics; Landscape Architecture; Smith-Hughes-in conjunction withthe College of Education)
The College of Education (Curricula: Two year, prescribing junior standing foradmission -General Education, Smith-Hughes Agriculture, Smith-HughesHome Economics/Public School Music; Four year, admitting from the highschool-Industrial Education, Athletic Coaching, Physical Education. TheUniversity High School is the practice school of the College of Education)
The School of Music (four-year curriculum)
The College of Law (three-year curriculum based on a college degree, or threeyears of college work at the University of Illinois)
The Library School (two-year curriculum for college graduates)
The School of Journalism (two-year curriculum based on two years of collegework)
The College of Medicine (in Chicago)
The College of Dentistry (in Chicago)
The School of Pharmacy (in Chicago)
The Summer Session (eight weeks)
Experiment Stations and Scientific Bureaus: U. S. Agricultural ExperimentStation; Engineering Experiment Station; State Natural History Survey;State Water Survey; State Geol9gical Survey; Bureau of EducationalResearch.
The Library Collections, contain (June 1,, 1929) 762,166 volumes and 173,000pamphlets.
For catalogs and information addressTHE REGISTRAR
Urbana, Illinois

N 4
I -~ (N N
N-
I < / CN-
C-- N N N y -,
Related Documents