Optimized Design of Refrigerant Condensers ACRC TR-l00 For additional information: Air Conditioning and Refrigeration Center University of Illinois Mechanical & Industrial Engineering Dept. 1206 West Green Street Urbana. IL 61801 (217) 333-3115 D. J. Kirshbaum and J. C. Chato June 1996 Prepared as part of ACRC Project 37 Effect of Geometric Variables and R-22 Alternatives on Refrigerant-Side Evaporation and Condensation J. C. Chato, Principal Investigator

Welcome message from author
This document is posted to help you gain knowledge. Please leave a comment to let me know what you think about it! Share it to your friends and learn new things together.
Transcript

Optimized Design of Refrigerant Condensers
ACRC TR-l00
For additional information:
Air Conditioning and Refrigeration Center University of Illinois Mechanical & Industrial Engineering Dept. 1206 West Green Street Urbana. IL 61801
(217) 333-3115
D. J. Kirshbaum and J. C. Chato
June 1996
Prepared as part of ACRC Project 37 Effect of Geometric Variables and R-22 Alternatives on Refrigerant-Side Evaporation and Condensation
J. C. Chato, Principal Investigator

The Air Conditioning and Refrigeration Center was founded in 1988 with a grant from the estate of Richard W. Kritzer, thefounder of Peerless of America Inc. A State of Illinois Technology Challenge Grant helped build the laboratory facilities. The ACRC receives continuing support from the Richard W. Kritzer Endowment and the National Science Foundation. The following organizations have also become sponsors of the Center.
Amana Refrigeration, Inc. Brazeway, Inc. Carrier Corporation Caterpillar, Inc. Dayton Thermal Products Delphi Harrison Thermal Systems Eaton Corporation Electric Power Research Institute Ford Motor Company Frigidaire Company General Electric Company Lennox International, Inc. Modine Manufacturing Co. Peerless of America, Inc. Redwood Microsystems, Inc. U. S. Army CERL U. S. Environmental Protection Agency Whirlpool Corporation
For additional information:
Air Conditioning & Refrigeration Center Mechanical & Industrial Engineering Dept. University of Illinois 1206 West Green Street Urbana IL 61801
2173333115

OPTIMIZED DESIGN OF REFRIGERANT CONDENSERS
Daniel J. Kirshbaum and John C. Chato
ABSTRACT
A Microsoft Excel spreadsheet program developed previously at ACRC to optimize condenser size with respect to surface area has been modified. A new method of modeling pipe bends has been developed incorporating a new pressure drop correlation. Estimation of total liquid and vapor masses has been added. The results using this new, more accurate method of modeling pipe bends proved to vary almost negligibly from those obtained from the previous, simpler method, confmning the usefulness of the older version of this program with the addition of the new pressure drop correlation and the estimation of the refrigerant inventory. The optimization method is also applicable to evaporator design with appropriate modifications.
1

INTRODUCTION The use of a Microsoft Excel spreadsheet program to model refrigerant condensation in a heat exchanger was initially reported by Dobson et al. (1993), and followed by Chato et al. (1995). This program investigates the effect of tube diameter on the length required to completely condense a refrigerant, with fluid mass flow rate and the air side resistance held constant. The technique used to obtain a solution is to divide the heat exchanger into elements representing 5% quality decrements. The length for a given diameter is then calculated for each element using local parameters corresponding to the average quality in the element. Knowing the total length of tubing for a given diameter and for arbitrary inputs in a heat exchanger allows the surface area to be minimized by varying the tube diameter.
Unfortunately, the use of five percent quality changes may not accurately model all aspects of a heat exchanger. Generally, the element length corresponding to five percent quality decrements ranges between 100 and 500 cm. Because many calculations are dependent on average values from these relatively long sections, the accuracy of the final results using this technique may be questionable. Also, the pressure drop resulting from each pipe bend is difficult to incorporate into the calculations. Previous versions of the simulation program added a pressure drop at the end of each element to account for the effect of pipe bends. None of these approaches added a pressure drop at the correct location of the pipe bend. The addition of these pressure drops at their actual locations is the most realistic method of modeling the pipe bends.
The main foci of this study concern improvements to the previous techniques of modeling pipe bends and the addition of estimating the refrigerant inventory. A new, more accurate method for calculating pipe bend pressure drops is explored and compared to results using previous versions of the program. This comparison provides insight into the necessity for changing the method of modeling pipe bends. In addition, various other features have been added to the program. These include a new two-phase pressure drop correlation, and calculations of total liquid and vapor masses in the condenser.
THE SIMULATION PROGRAM Due to the relative complexity of the simulation program, a discussion will be given to facilitate understanding of its main features. Assumptions made in the forming of the program include:
1. Inlet quality of 100% 2. Constant air side resistance per unit length 3. Uniform flow characteristics for each quality element
The previous version of the program does not use the type of refrigerant as an input. Therefore, separate programs exist for R -22 and R -134a, due to their different properties. Once the type of refrigerant is known, the program requires several operating conditions to be inputted by the user. These inputs, and the symbols used to denote them in the spreadsheet, are given below:
1. Refrigerant mass flow rate (mdot) 2. Inner tube diameter (0) 3. 180 0 return bend diameter (Orb) 4. Distance between return bends (zbend) 5. Inlet saturation temperature of refrigerant (Tsatin) 6. Air side resistance per unit length (Rair) 7. Air temperature (Tair)
The simulation program uses a main spreadsheet for inputs, outputs and simple calculations. This spreadsheet then calls Command Macros for more involved calculations. Each time any cell in the program is changed, the program runs completely through all the calculations to compute the total
2

length necessary to condense the fluid. In addition, the program returns several other useful outputs. All of the outputs and their symbols are shown below:
1. Two-phase length (L2ph) 2. Condenser surface area (SA) 3. Percentage of annular flow (%Ann) 4. Total pressure drop (dP) 5. Total temperature drop (d1) 6. Percentage of the temperature drop compared to the driving temperature difference (dT%) 7. Mean quality (xbar) 8. Mean refrigerant side resistance (R'ref) 9. Percentage ofR'ref compared to total resistance per unit length (RrlRt)
10. Total mass of liquid refrigerant (mliq) 11. Total mass of vapor refrigerant (mvap)
An actual spreadsheet program's display of inputs and outputs is shown in Figure 1 for R-22.
REFRIGERANT 22 INPUTS OUTPUTS
mdot 80 [Ibm/hr] 0 4.5 mm]
0 4.5 [mm] m(liq) 0.0449 kg]
Orb 76.2 [mm] m(vap) 0.0080 kg]
z Bend 500 [mm] L2ph 9.612 m]
Tsatin 43.33 [C] S.A. 0.1359 mA2]
R'air 0.042 [m-K/W] dp 83.23 kPa] Tair 32.22 [C] dT 2.12 0C]
dT% 19.08%
%Ann 100.0%
R'ref 0.014 m-K/W]
Rr/Rt 24.4%
xbar 0.45
dprb 18.4
Rr/Ra 0.322
Figure 1 - Simulation program's display of inputs and outputs
CONDENSATION CALCULATIONS Refrigerant Side Resistance The refrigerant side resistance is given by the equation:
R' - 1 (1) ref- N k
7t U 1
The Nusselt number is dependent on the type of flow regime present. To determine this flow characteristic, the program incorporates the Wallis dimensionless gas velocity [Breber et aI., 1979]
.* Ox (2) Jg = ..jgDPv(Pl - Pv)
3

It is assumed that annular flow exists for j; values above 1.8, while wavy flow exists for j; values below 1.8. The Nusselt number calculations corresponding to wavy and annular flow, respectively, are given below [Dobson et al., 1993]:
Nu = f(X )* gPL(PI -Pv)D Ilv [ 3.' ]0.25 wavy tt JJA Tk I
0.375 where f(Xtt ) = X 0.23
tt
Nu - 0 023 ReO.80 Pr,0.3 g(X ) ann-' I I tt
h 2.61 w ere g(X tt ) = 0.805
Xtt
(3)
(4)
Logic statements are used to detennine which Nusselt number to use in calculating R'ref. Figure 2 indicates how the program travels from the main spreadsheet to Command Macros and ultimately calculates R'ref.
VVorksheetFunctions Outputs Macro Functions
ITsMml----------------+·~
l~J 1 /Ts-Ta I"
" .....
~ ...
0
x inputted automatically from program R'ref' G, and Tin will be used to calculate Lact
~ ~4 I
~ I
jEJ' ~IJINU,"" I· (
INUwavylo(
I ~ R'ref 0(
~ ...
~
~
fNu::l
~ I NUwavJ
I
rs=J I
Figure 2 - Flowchart describing calculation of R' ref
4
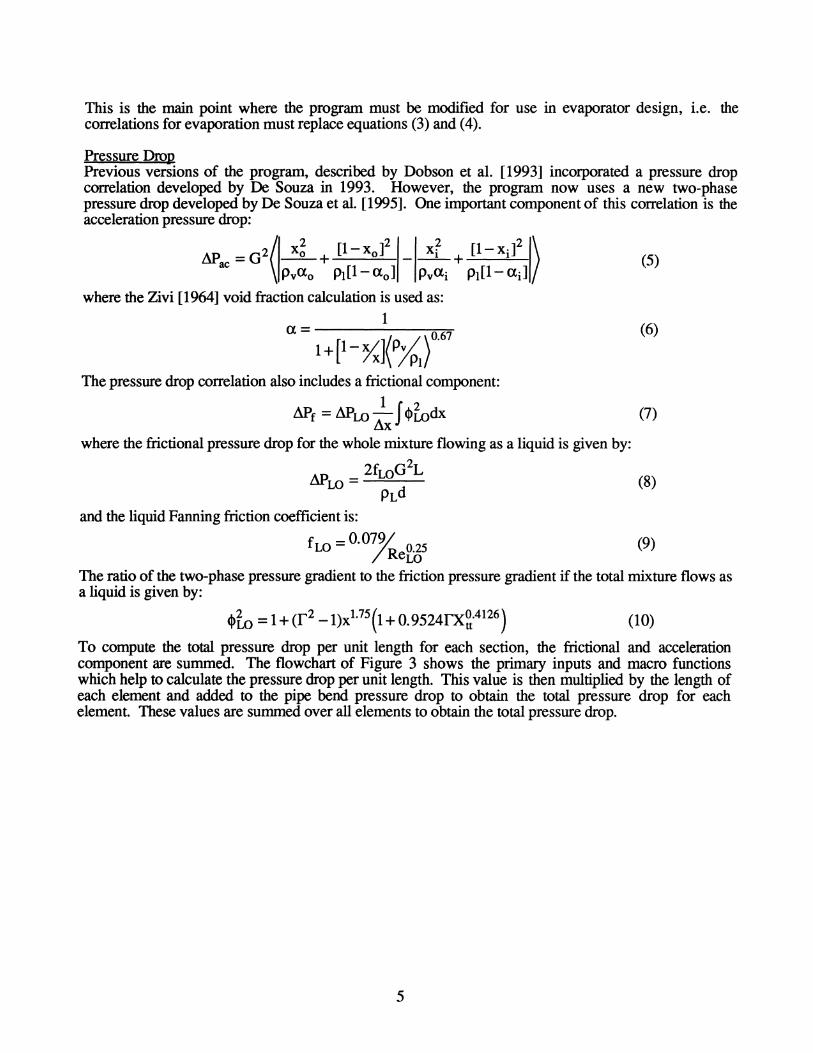
This is the main point where the program must be modified for use in evaporator design, i.e. the correlations for evaporation must replace equations (3) and (4).
Pressure Drop Previous versions of the program, described by Dobson et al. [1993] incorporated a pressure drop correlation developed by De Souza in 1993. However, the program now uses a new two-phase pressure drop developed by De Souza et al. [1995]. One important component of this correlation is the acceleration pressure drop:
M> - 0 2 Xo [l-xo] Xi [1- xd ( 2 2 2 2) ac - Pvao + Pl[l- ao ] - Pvai + Pl[l- ad
where the Zivi [1964] void fraction calculation is used as:
1 a = 067
1+[I-YxJ(P~) . The pressure drop correlation also includes a frictional component:
Mlf = MlLO - I-J<I>lodx ~x
where the frictional pressure drop for the whole mixture flowing as a liquid is given by: 2
An _ 2fLOO L tlrLO -
PLd and the liquid Fanning friction coefficient is:
fLO = O.O%e~5
(5)
(6)
(7)
(8)
(9)
The ratio of the two-phase pressure gradient to the friction pressure gradient if the total mixture flows as a liquid is given by:
(10)
To compute the total pressure drop per unit length for each section, the frictional and acceleration component are summed. The flowchart of Figure 3 shows the primary inputs and macro functions which help to calculate the pressure drop per unit length. This value is then multiplied by the length of each element and added to the pipe bend pressure drop to obtain the total pressure drop for each element These values are summed over all elements to obtain the total pressure drop.
5

Worksheet inputs
z bend "D m I ~ I T air "R'air "l1Idotl I T sat in I
..... ",
R'ref' G, and Tin shown in previous flow chart x automatically inputted by program
I
" ,/
" (
Outputs
Q2phas't
.. i , Lminl ... .... ~
....-
dpdzf .......
C dpdza:-
C.tr*min .......
'" .1it Lact I
l (
.... d1bend .I 1
Macro Functions
.... Hfg
.,
I R~cI T· m
~r ....~ dpdzfj
11 G
... , I--
, dpdzacc
x ...... I
dTdPsat/<-
~ - dPbend ~ .... x
)~ -
Figure 3 - Flowchart describing calculation of pressure drop and element length
Condenser Length Knowing R'ref and the total pressure drop per unit length for each element, calculate the element length using the equations provided by Dobson [1994]:
L . = Oq(R~f + R~) mm TIef - Tair
where Oq = rilhlv~
% - (%t -yr*(I+R*) Lact = T*
it is now possible to
(11)
(12)
(13)
where "(=2 for linear temperature variations. The computation of the element length is also diagrammed in the flowchart of Figure 3. The element length is summed over all elements to determine the total condenser length.
6

Pipe Bend Pressure Drop The pressure drop due to pipe bends is dependent on the length of each element, and is the last parameter of each element calculated by the program. The equation used for dPbend depends on two components, friction and turning. The frictional component is given in equations (7) to (10), while the turning component was given by Christoffersen et al. [1993]:
2 An _ G VaveE llr t -
2
where vave =(I-x)Vl +xvv
C XC4 and E = 3 tt
20 ReI
(14)
The constants C3 and C4 are equal to 6.93x1O-5 and -0.712, respectively. The parameter dis defmed
as ..jD/DRB •
Liquid and Vapor Masses The total mass of liquid and vapor phases in the condenser is an output that has been added to the simulation program. This feature has been added by calculating the liquid and vapor masses for each quality element, then summing over all elements. Using equation (6) to compute the void fraction, the liquid and vapor masses for each element can then be found:
D2 my =apy 1t4 &
D2 m1 = (l-a)Pl1t-&
4
(15a)
(15b)
It is to be noted that equation (6) is only one of several equations proposed for the void fraction. However, at present there are not enough reliable experimental data available to decide which of these is the best. Consequently, we selected the one that gives reasonable values and is relatively simple.
LIMIT ATIONS OF THE SIMULATION PROGRAM Wavy Flow Correlation Equation (3) shows that a DT tenn exists in the calculation of Nuwavy. This tenn complicates the calculations significantly under wavy flow conditions because Nuwavy and R'ref have a mutual dependence, as shown in Figure 3. This means that when equation (2) indicates wavy flow, an iterative procedure must be used by the program to calculate R'ref. Because iteration is a relatively timeconsuming process, calculations for wavy flow take significantly more time than those for annular flow. In addition, Excel requires initial values in interdependent cells to begin iteration. If no number value exists in these cells, the program will not iterate successfully. Therefore, when the program fails to provide output values under wavy flow conditions, inputs corresponding to 100% annular flow should be initially used. Equation (3) shows that to produce annular flow, mass flux values should be increased. This can be easily accomplished by increasing the mass flow rate and/or decreasing tube diameter. The program will then generate results for annular or wavy flow situations. Table 1 provides input values that will yield completely annular flow for both R-22 and R-134a. These values also correspond to the high flow rates incurred in the condenser of a mobile air-conditioner.
7

Table 1: High flow rate input values producing completely annular flow
4.5
500
Return bend diameter 76.2
Inlet saturation 43.3
0.042
Air 32.2
Pipe Bend Pressure Drop Calculation The pressure drop resulting from pipe bends is difficult to incorporate into the solution methodology used in this program. Watte1et [1994] added the pressure drop of a full bend after each five percent element. This method is only accurate if each element corresponds to the distance between bends. However, the element length and distance between bends can be quite different, making this technique a relatively poor approximation. Dobson [1994] added a bend pressure drop after each element, but
multiplied the full bend pressure drop by the ratio of .1L to the distance between bends. This technique is a highly conservative approach, which calculates a slightly lower pressure than actually exists for each element, thereby underestimating the driving temperature difference. Although Dobson's approach was an improvement over earlier techniques, the return bend pressure drops are not placed in their actual location. Therefore, improvements can still be made in the modeling of pipe bends.
ANALYSIS The method of calculating pipe bend pressure drops has been modified in an effort to more accurately model these effects. The pressure drop for a full pipe bend is now added to the total pressure drop at the end of the quality element immediately preceding the bend location. This provides a more accurate method of modeling pipe bends. Figure 4 shows physically why this is true. The pressure variation in an actual heat exchanger decreases in each straight section, and also undergoes drops in the pipe bends. For the method used by Dobson [1994] to calculate pipe bend pressure drop, the pressure variation along the tube is qualitatively shown in Figure 4(a), compared with that in an actual heat exchanger. This shows that the calculated pressure is generally lower than the actual pressure throughout the condenser, because scaled pressure drops are added after each quality decrement. This results in a smaller temperature difference between the fluid and the air over the length of the condenser. Equation (11) shows that a lower temperature difference results in a longer calculated length than actually needed. Figure 4(b) compares the new method of calculating pipe bend pressure drop to the situation in an actual heat exchanger. To locate the pipe bend more exactly, the quality change per element has been reduced to 2.5%. This method of modeling pipe bends is only effective if the element length is short enough (or the distance between bends long enough) to have several quality elements in-between each pipe bend. Otherwise it becomes very similar to earlier approaches.
8

(a)
L
; ;L __ _ Dobson's model
end of quality element
100 95 90 85 Quality of fluid (%)
(b)
- - - - - -/~
I New technique
Real heat exchanger
100 97.5 95 92.5 90 87.5 85 Quality of fluid (%)
Figure 4- Physical comparison of different approaches of modeling pipe bends
The analysis used in modifying the simulation program initially was focused on improving the method of modeling pipe bends. However, several other changes were made to the program used by Dobson [1994]. These changes include updating the program to incorporate a new two-phase pressure drop correlation developed by De Souza et al. [1995]. This correlation, shown in equations (5) to (10), is also applied to the pipe bend pressure drop.
In addition, a new feature has been added to the program. It is the calculation of total masses of liquid and vapor in the condenser, i.e. the charge inventory. Equations (15) are used for these calculations. As previously stated, the liquid and vapor masses in each section are calculated for each quality element, then summed over all elements and returned as outputs.
9

DISCUSSION Although the new approach of modeling pipe bends provides more accurate results, several disadvantages exist with this technique. First, the time required to complete each run through the program increases considerably. Excel must calculate the length of each element before it adds in the pipe bend pressure drop. The modified program checks if a bend will be found in the next element, then adds in a pressure drop corresponding to a full bend at the outlet quality of the element. This approach makes iteration necessary, which dramatically increases computation time. In addition, reducing the quality decrement per element from 5 to 2.5% doubles the amount of calculations the program must perform. Both of these effects cause the calculation time to be extremely long for the modified program.
In spite of the excessively long calculation time, results using the modified program have been found. Figure 5 shows a comparison of optimization results using several different methods for modeling pipe bends. One technique shown which was not explicitly discussed uses Dobson's methods, but decreases the element length to 2.5%. This figure illustrates the negligible difference in the optimization results between old and new techniques. This theme is reinforced in Table 2, which compares the condenser lengths using three different approaches.
From the differences in the techniques of modeling pipe bends, one would expect the new method to calculate a smaller value for condenser surface area and length. However, it is apparent from Figure 5 that the values for R-22 are nearly identical to the previous methods. There are several explanations for this. First, the pipe bend pressure drop, for any given quality element, is between 10 to 25 percent of the frictional pressure drop. This means that the pipe bend pressure drop has a small effect compared to the frictional pressure drops. In addition, the new method of modeling pipe bends, although more accurate than previous methods, is limited by the length of each element. Although the quality decrement per element was decreased from 5 to 2.5%, this method still cannot insert pressure drops as close to the actual pipe bend location as desired. Therefore, both methods underestimate the driving temperature difference and calculate greater lengths and surface areas than in a real heat exchanger. It appears that the element length would have to be decreased even further to observe more obvious differences between old and new techniques.
Figure 6 and Table 3 respectively show the surface area and length comparisons for R-134a. The differences between the techniques of modeling pipe bends is very clear for this refrigerant. As expected, the condenser length and surface area is lower for the new method, indicating a less conservative approximation. The differences between results for R-22 and R-134a can be explained partially by the fact that the percentage of the total pressure drop per element caused by the pipe bends is significantly higher for R -134a. This makes the technique of modeling pipe bends more important in the condenser size. However, the optimization of surface area indicates the same optimum diameter for R-134a using all three approaches. For pure diameter optimization purposes, therefore, the Dobson method is just as effective as the new method.
10

0.154
.-. 0.152 N e ........ 0.15 ~
~ 0.148 0 (.)
] 0.146 r.f.)
~ 0.144 rn d .g 0.142 d
8 0.14
• Dobson, 5% elements
~ ~~s~~~~ {~~:~!entsmr
::~:I:II:=l::rl """"""""""""""""r"""""""""""""""""t""""""""""""""""""j""""""" """""""t""""""""""""""""""j"""""""""""""""""""I""""""""""""""""
! i 1 f
"""""""""""t""""""" ""I""""""""""""""""""r"""""""""""""""""r""""""""""""""""r"""""""""""""""
0.138 4 4.2 4.4 4.6 4.8 5 5.2 5.4
Tube Diameter [mm] Figure 5 - Comparison of optimization results using different techniques of modeling pipe bends for
R-22 with high flow rate inputs
Table 2 - Comparison of condenser lengths, in meters, using different techniques of modeling pipe bends for R-22 with high flow rate inputs
4.3 10.27 10.32 10.33 4.4 10.03 10.07 10.06 4.5 9.85 9.88 9.92 4.6 9.71 9.74 9.74 4.7 9.60 9.62 9.63 4.8 9.52 9.54 9.54 4.9 9.45 9.47 9.47 5 9.40 9.42 9.42
5.1 9.39 9.41 9.40 5.2 9.34 9.36 9.36
11

0.21
......, 0.2 NS '--'
1:':1 0.19 ~
CD 0.18 ~ a 0.17 en
~ c:: 0.16 -8 c:: 8 0.15
0.14 4
,.-_-----.---_ ... -_--_-_ ... -
• Dobson, 5% elements • Dobson, 2.5% elements
--<>-- New method, 2.5% elements
~--~--~----~--~ ... · . . . . . __ .............................. _n ................ ____ .............................. _____ ....... __ .......... _ .... ______ .... _ · . . . . . · . . . . . , . . . . . , . . , , . · . . . . . · . . . . . · . . . , . · . . . . . · . . . . . , . . , . . · . . , . . , . . . . . . . . . . -------.---......... -.. ·······j'-_········ .. ····,y--_···············l·················-'f----·········---·'T···········---·
r ........ ill 1····+ ill 1 : ············· .. r················ ........... ._ .................. /"" ................. ; ....... .
4.2 4.4 4.6 4.8 5 5.2 5.4 Tube Diameter [mm]
Figure 6 - Comparison of optimization results using different techniques of modeling pipe bends for R-134a with high flow rate inputs
Table 3 - Comparison of condenser lengths, in meters, using different techniques of modeling pipe bends for R -134a with high flow rate inputs
4.3 12.42 12.64 11.56 4.4 11.34 11.46 10.79 4.5 10.69 10.76 10.32 4.6 10.25 10.30 9.98 4.7 9.93 9.97 9.71 4.8 9.70 9.73 9.52 4.9 9.52 9.54 9.37 5 9.38 9.39 9.26
5.1 9.34 9.35 9.25 5.2 9.23 9.24 9.15
12
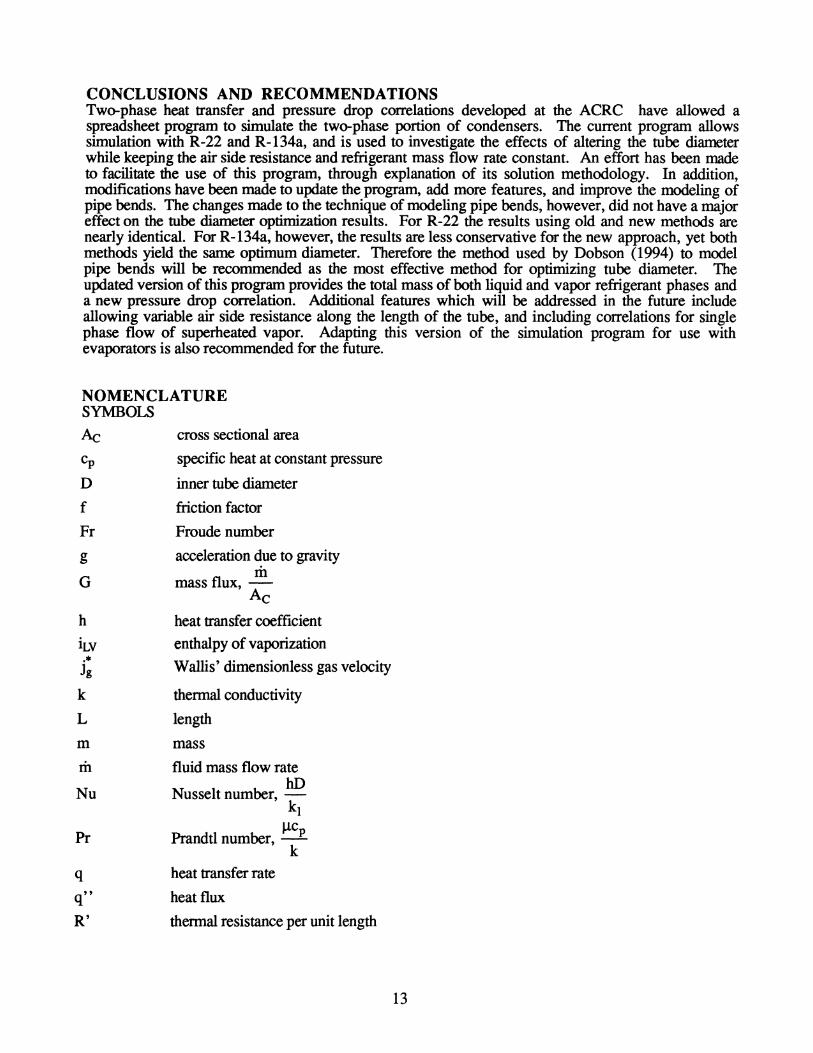
CONCLUSIONS AND RECOMMENDATIONS Two-phase heat transfer and pressure drop correlations developed at the ACRC have allowed a spreadsheet program to simulate the two-phase portion of condensers. The current program allows simulation with R -22 and R -134a, and is used to investigate the effects of altering the tube diameter while keeping the air side resistance and refrigerant mass flow rate constant. An effort has been made to facilitate the use of this program, through explanation of its solution methodology. In addition, modifications have been made to update the program, add more features, and improve the modeling of pipe bends. The changes made to the technique of modeling pipe bends, however, did not have a major effect on the tube diameter optimization results. For R -22 the results using old and new methods are nearly identical. For R-134a, however, the results are less conservative for the new approach, yet both methods yield the same optimum diameter. Therefore the method used by Dobson (1994) to model pipe bends will be recommended as the most effective method for optimizing tube diameter. The updated version of this program provides the total mass of both liquid and vapor refrigerant phases and a new pressure drop correlation. Additional features which will be addressed in the future include allowing variable air side resistance along the length of the tube, and including correlations for single phase flow of superheated vapor. Adapting this version of the simulation program for use with evaporators is also recommended for the future.
NOMENCLATURE SYMBOLS
Ac cross sectional area
cp specific heat at constant pressure
D inner tube diameter
f friction factor
Fr Froude number
g acceleration due to gravity
G ril
mass flux, -Ac
h heat transfer coefficient
iLV enthalpy of vaporization .* Wallis' dimensionless gas velocity Jg
k thermal conductivity
L length
m mass
ril fluid mass flow rate
Nu hD
Nusselt number, -kl
J.1c Pr Prandtl number, _P
k
q heat transfer rate
q" heat flux
R' thermal resistance per unit length
13

R * dimensionless resistance factor, R~;f Ra
Rew Liquid Reynolds number, Gd III
Ret superficial liquid Reynolds number, GD(I- x) III
T* dimensionless temperature drop
x vapor quality
( )O.S( )0.1( )0.9 Xu Lockhart-Martinelli parameter,~: ~: 1: x
GREEK SYMBOLS
a void fraction
a pressure drop parameter
£ dimensionless resistance factor
L\P pressure difference
L\ T temperature difference
y nonlinear temperature drop factor
( )O.S( )0.125 r physical property index,~: ~:
cl>l.o two-phase friction multiplier
Il dynamic viscosity
p density
SUBSCRIPTS
ac acceleration
ann annular flow conditions
f friction
I inlet
I liquid
10 liquid only
0 outlet
ref refrigerant
RB return bend
tot total
v vapor
wavy wavy flow conditions
14

REFERENCES Breber, G., J.W. Palen, and J. Taborek, 1979, "Prediction of Horizontal Tubeside
Condensation of Pure Components Using Flow Regime Criteria", Condensation Heat Transfer, AS ME, New York, pp. 1-8.
Chato, J.C. et al., 1995, "Predicition of Refrigerant-Side Heat Transfer and Pressure Drop for the Design of Evaporators and Condensers," Proc. 46th International Appliance Technical Conference, University of Illinois at Urbana-Champaign
Christoffersen, B.C., J.e. ehato, and J.P. Wattelet, 1993, "Evaporation of R-22 and its Alternatives in Horizontal Smooth and Micro-Fin Tubes", ACRC Technical Report. 47, University of Illinois at Urbana-Champaign.
Dobson, M.K., J.P. Wattelet, and J.C. Chato, 1993, "Optimal Sizing of Two-Phase Heat Exchangers", ACRC Technical Report 42., University of Illinois at Urbana-Champaign.
Dobson, M.K., et al., 1994, "Heat Transfer and Flow Regimes During Condensation in Horizontal Tubes", ACRC Technical Report. 57, University of Dlinois at Urbana-Champaign ..
Souza, A.M., and Pimenta, M.M., 1995, "Prediction of Pressure Drop During Horizontal Two-Phase Flow of Pure and Mixed Refrigerants", ASME Symposium on Cavitation and Multiphase Flow, 210, pp. 161-171.
Wattelet, J.P., et al., 1994, "Heat Transfer Flow Regimes of Refrigerants in a Horizontal-Tube Evaporator", ACRC Technical Report. 55, University of Illinois at Urbana-Champaign.
Zivi, S.M. 1964. ''Estimation of Steady-State Steam Void-Fraction by Means of the Principle of Minimum Entropy Production", Journal of Heat Transfer, 86, pp. 247-252.
15
Related Documents