Healthy Families Arizona Annual Evaluation Report FY2008 July 2007 – June 2008 Prepared by: LeCroy & Milligan Associates, Inc. 4911 E. Broadway Blvd., Suite 100 Tucson, Arizona 85711 (520) 326-5154 www.lecroymilligan.com Prepared for: The Arizona Department of Economic Security Division of Children, Youth and Families Office of Prevention and Family Support 1789 W. Jefferson, Site Code 940A Phoenix, Arizona 85007

Welcome message from author
This document is posted to help you gain knowledge. Please leave a comment to let me know what you think about it! Share it to your friends and learn new things together.
Transcript
Healthy Families Arizona Annual Evaluation Report
FY2008 July 2007 – June 2008
Prepared by:
LeCroy & Milligan Associates, Inc. 4911 E. Broadway Blvd., Suite 100
Tucson, Arizona 85711 (520) 326-5154
www.lecroymilligan.com
Prepared for: The Arizona Department of Economic Security
Division of Children, Youth and Families Office of Prevention and Family Support
1789 W. Jefferson, Site Code 940A
Phoenix, Arizona 85007
Healthy Families Arizona Annual Evaluation Report 2008 1
Acknowledgements
This evaluation report represents the efforts of many individuals and many
collaborating organizations.
The evaluation team for Healthy Families Arizona that contributed to this year’s
report includes evaluators Craig W. LeCroy, Ph.D., Kerry Milligan, MSSW, Jen Kozik,
M.P. H., Darcy Richardson, BA, Cindy Jones, BS-MIS ; Olga Valenzuela, BA, Judy
Krysik, Ph.D., Allyson Baehr, BA; Steven Wind, Ph.D., Geoff Wood, M.A., Allison
Titcomb, Ph.D. , and data management staff, Veronica Urcadez, Delcia Cardenas,
Melissa Nelson and Perla Poras.
We are grateful to Karen Bulkeley, Manager, Office of Prevention and Family
Support, for her guidance and support. The Healthy Families Quality Assurance and
Training Team deserves many kudos for their ongoing commitment to helping
Healthy Families program sites collect, interpret and use program evaluation
findings for program improvement. Thank you to Kate Whitaker, TA/QA
Coordinator, Kathy Van Meter, Ellie Jimenez, Danielle Gagnier, Esthela Navarro ,
Lee Zinsky, TA/QA Program Specialists, and to Maritza Noriega and Claudia Garcia,
Administrative Managers. Thank you to the program managers and supervisors,
who have worked diligently to ensure data is collected, submitted and shared with
staff for practice improvement. Family Assessment Workers, Family Support
Specialists and support staff at the sites have dutifully collected the data, and have
participated in the evaluation process--all of whom help to tell an accurate story
about Healthy Families Arizona. Lastly, we acknowledge with appreciation the
families who have received Healthy Families Arizona services.
Suggested Citation: LeCroy & Milligan Associates, Inc. (2008). Healthy Families Arizona Annual Evaluation Report 2008. Tucson, AZ: LeCroy & Milligan Associates, Inc.

Healthy Families Arizona Annual Evaluation Report 2008 2
Table of Contents Executive Summary ................................................................................................................ 6 Introduction ........................................................................................................................... 10 In this Report ......................................................................................................................... 13 The prevention-protection continuum ........................................................................... 14 Evaluation Methodology ................................................................................................. 17
Who does Healthy Families Arizona Serve? ..................................................................... 19 Characteristics of the target population ......................................................................... 23 Father/Male Involvement ............................................................................................... 25 Assessment of risk factors ................................................................................................ 26 Infant Characteristics ........................................................................................................ 28
Key Healthy Families Arizona Services ............................................................................. 30 Referral services ................................................................................................................ 30 Services to Prenatal Families ........................................................................................... 32 Participant satisfaction ..................................................................................................... 34
Outcomes for Families .......................................................................................................... 36 What is changing for Healthy Families Participants? ...................................................... 36 Parent outcomes ................................................................................................................ 36 Social Support .................................................................................................................... 39 Problem Solving ................................................................................................................ 40 Depression ......................................................................................................................... 41 Personal Care ..................................................................................................................... 42 Mobilizing Resources ....................................................................................................... 42 Commitment to Parent Role ............................................................................................ 43 Parent/child Interaction .................................................................................................. 44 Home environment ........................................................................................................... 44 Parenting Efficacy ............................................................................................................. 45 Total change score on the HFPI ...................................................................................... 45 Child abuse and neglect ................................................................................................... 46 Child Development and Wellness .................................................................................. 47 Immunizations .................................................................................................................. 47 Access to Medical Doctors ............................................................................................... 48 Safety Practices in the Home ........................................................................................... 49 Mothers’ Health, Education, and Employment ............................................................ 50 Subsequent Pregnancies and Birth Spacing .................................................................. 50 School , Educational enrollment, and Employment ..................................................... 51 Substance Abuse Screening ............................................................................................. 53
Continuous Program Improvement ................................................................................... 54 Program and Policy Updates .......................................................................................... 54 The Building Bridges Newsletter .................................................................................... 57 Knowledge Contributions to the Field ........................................................................... 58
Prenatal Sub-study ................................................................................................................ 60
Healthy Families Arizona Annual Evaluation Report 2008 3
Interview with Quality Assurance Team Members ..................................................... 61 Prenatal Curriculum Review ........................................................................................... 62 Healthy Families Staff Survey Responses ..................................................................... 64 Profile of Prenatal Engaged Families ............................................................................. 67 Time in program ........................................................................................................... 68 Healthy Behaviors ......................................................................................................... 68 Birth Outcomes .............................................................................................................. 69
Conclusions ........................................................................................................................ 69 Outreach Sub-Study.............................................................................................................. 71 Review of Creative Outreach Policies and Procedures ............................................... 72 Healthy Families Staff Perspectives on Outreach......................................................... 73 Profile of Families on Outreach ...................................................................................... 77 Conclusions ........................................................................................................................ 79
Families at Risk Sub-study................................................................................................... 81 Literature Review .............................................................................................................. 81 Risk Profile -- Depression ................................................................................................ 82 Demographics ................................................................................................................ 83 Assessment of Risk ....................................................................................................... 84 Healthy Families Parenting Inventory Findings ...................................................... 85 Time in program ........................................................................................................... 87
Summary of Findings ....................................................................................................... 87 Risk Profile—Substance Abuse ....................................................................................... 88 Profile of Substance Abuse Subgroup ............................................................................ 89 Demographics ................................................................................................................ 89 Assessment of Risk ....................................................................................................... 90 HFPI and Substance Abuse ......................................................................................... 92 Time in program ........................................................................................................... 93 Follow-up Substance Abuse Screenings—CRAFFT at 6 and 12 months .............. 93 Co-morbidity ................................................................................................................. 93
Summary of Findings ....................................................................................................... 93 Conclusions and Recommendations .................................................................................. 95 References .............................................................................................................................. 98 Appendix A: Site Level Data ............................................................................................ 103 Appendix B. Instrument Properties ................................................................................ 130 Appendix C. Healthy Families Arizona Prenatal Logic Model ................................... 132 Appendix D. Healthy Families Arizona Postnatal Logic Model ................................. 133 Appendix E. Healthy Families Participant Satisfaction Survey ................................... 134

Healthy Families Arizona Annual Evaluation Report 2008 4
List of Exhibits
Exhibit 1. Healthy Families Arizona Map ............................................................................... 11
Exhibit 2. The Prevention-Protection Continuum .................................................................. 15
Exhibit 3. Participants Enrolled and Actively Engaged July 2007 – June 2008 .................. 20
Exhibit 4. Rate of Retention for Healthy Families Arizona 2007-2008 ................................. 22
Exhibit 5. Selected Risk Factors for Mothers at Intake - 2008 ............................................... 23
Exhibit 6. Ethnicity of Mothers ................................................................................................. 24
Exhibit 7. Father’s Ethnicity ....................................................................................................... 24
Exhibit 8. Male Involvement at 6 Months ................................................................................ 25
Exhibit 9. Percentage of Parents Rated Severe on Parent Survey Items .............................. 26
PRENATAL ............................................................................................................. 26
Exhibit 10. Percentage of Parents Rated Severe on Parent Survey Items ............................ 27
POSTNATAL ........................................................................................................... 27
Exhibit 11. Risk Factors for Infants - 2008 ................................................................................ 28
Exhibit 12. Types of Healthy Families Arizona Referrals at six, twelve, ............................ 31
eighteen and twenty-four months......................................................................... 31
Exhibit 13. Trimester of Enrollment ......................................................................................... 32
Exhibit 14. ASQ Screening ......................................................................................................... 33
Exhibit 15. ASQ Follow-Up Services – 2008 ............................................................................ 34
Exhibit 16. Participant Satisfaction Survey – Selected Items ................................................ 35
Exhibit 17. Factor Loadings and Subscale Alphas for the Nine Factor Model ................... 37
Exhibit 18. Change in Social Support ...................................................................................... 40
Exhibit 20. Change in Depression ............................................................................................. 41
Exhibit 21. Change in Personal Care ........................................................................................ 42
Exhibit 22. Change in Mobilizing Resources ........................................................................... 43
Exhibit 23. Change in Commitment to Parent Role ............................................................... 43
Exhibit 24. Change in Parent/child Interaction ...................................................................... 44
Exhibit 25. Change in Home Environment.............................................................................. 45
Exhibit 26. Change in time for Parenting Efficacy .................................................................. 45
Exhibit 27. Overall Change in Healthy Families Parenting Inventory outcomes .............. 46
Exhibit 28. Percent of families showing no child abuse and neglect incidences ................ 47
Exhibit 29. Immunization Rate of Healthy Families Arizona Children .............................. 48
Exhibit 30. Percentage of Children Linked to a Medical Doctor .......................................... 48
Exhibit 31. Percent of all families implementing safety practices ........................................ 49
Exhibit 32. Percent of prenatal families implementing prenatal safety practices .............. 50
Exhibit 33. Percentage of Mothers who reported subsequent pregnancies ........................ 51

Healthy Families Arizona Annual Evaluation Report 2008 5
Exhibit 34. Length of Time to Subsequent Pregnancy for Those Families .......................... 51
with Subsequent Births ........................................................................................... 51
Exhibit 35. Percent of Mothers enrolled in school-2008 ......................................................... 52
Exhibit 36. Mother’s employment status ................................................................................. 52
Exhibit 37. Percent screened and assessed positive on the CRAFFT ................................... 53
Exhibit 38. Curriculum Review Findings ................................................................................ 63
Exhibit 39. Prenatal Topics by Trimester as Reported by HFAz Program Staff ................ 65
Exhibit 40. Mothers Ethnicity for Prenatal Mothers Compared to Postnatal Mothers ..... 67
Exhibit 41. Demographics and Risk Factors for Prenatal Mothers Compared to
Postnatal Mothers .................................................................................................... 67
Exhibit 42. Healthy Behaviors for Prenatal Mothers Compared to Postnatal Mothers .... 68
Exhibit 43. Birth Outcomes for Prenatal Mothers Compared to Postnatal Mothers ......... 69
Exhibit 44. Incidence of Families on Outreach Over Time in HFAz Program ................... 77
Exhibit 45. Mothers Ethnicity for Outreach Family Compared to Non-Outreach
Family ........................................................................................................................ 78
Exhibit 46. Demographics and Health Insurance Information for Outreach Families
Compared to Non-Outreach Families .................................................................. 78
Exhibit 47. Mothers Ethnicity in Depression Subgroup Compared to All Other
Healthy Families Participants ................................................................................ 83
Exhibit 48. Demographics for Mothers in Depression Subgroup Compared to All
Other Healthy Families Participants at Intake .................................................... 83
Exhibit 49. Percentage of Parents Participants Rated Severe on the Parent Survey
Items: By Depression Subgroup and All Other Healthy Families
Participants ............................................................................................................... 84
Exhibit 50. Healthy Families Parenting Inventory: Baseline to 6 Months by Depression
Subgroup and All Other Healthy Families Participants .................................... 85
Exhibit 51. Healthy Families Parenting Inventory: Baseline to 12 Months by
Depression Subgroup and All Other Healthy Families Participants ............... 86
Exhibit 52. Mothers’ Ethnicity in Substance Abuse Subgroup Compared to All Other
Healthy Families Participants ................................................................................ 90
Exhibit 53. Demographics for Mothers in Substance Abuse Subgroup Compared to
All Other Healthy Families Participants at Intake, 2008 .................................... 90
Exhibit 54. Percentage of Parents Rated Severe on the Parent Survey Items: By
Substance Abuse Subgroup and All Other Healthy Families Participants ..... 91
Exhibit 55. Healthy Families Parenting Inventory: Baseline to 6 Months by Substance
Abuse Subgroup and All Other Healthy Families Participants ........................ 92
Healthy Families Arizona Annual Evaluation Report 2008 6
Executive Summary
The promotion of the healthy development of children continues to be an important
priority, fueled in part by research that has supported child abuse prevention, early
childhood education, and family support programs.
Much of this enthusiasm emerges because of the recognition that there are immense
unmet needs among children and families in this country. Many of the most
pervasive and intractable problems experienced by children can be found in homes
with insufficient income, poor child care, poor parenting skills, and stressful
conditions that interfere with effective child rearing and parenting. The long term
consequences of poor care take a toll on many of America’s children, among these
are: infant mortality, low birth weight, neurodevelopmental impairments, child abuse
and neglect, and accidental childhood injuries. The toll on parents is also devastating
in terms of diminished economic self sufficiency, violence, educational failure and
sporadic workforce participation. Every year, a large sum of money is spent by child
welfare organizations in response to this myriad of problems.
Increasingly, policy makers are looking toward prevention programs as one remedy.
Effective prevention programs that promote the safe and healthy development of
children have the potential to greatly reduce the short and long-term costs of these
social conditions. Home visitation programs are being promoted as a promising
approach to reduce these serious problems and a way to embrace the new research in
the birth-to-three field by promoting greater health and development among all of
our children. Home visitation programs share several common beliefs: the
importance of children’s early years, a focus on the pivotal role parents can play in
shaping the healthy development of children’s lives, and a perspective that service
delivery works better when bringing services to families rather than expecting them
to seek and find assistance in their communities.
The Healthy Families Arizona Program
Healthy Families Arizona serves families experiencing multiple stressors that can put
their children at risk for child abuse and neglect. The program has operated in
Arizona since 1991 and follows the national Healthy Families America® model.
Healthy Families Arizona continued program expansion activities, which began in

Healthy Families Arizona Annual Evaluation Report 2008 7
fall 2004. As a result of this work, program sites increased in number from 51 to 58 in
FY2008. The program also continues to its expansion of prenatal services for pregnant
women and their families. Over time, the program has also increased its professional
development support for staff by updating web-based orientation training and
providing specialty training in areas such as substance abuse and mental health
issues.
Who Does Healthy Families Arizona Serve?
There were 5,527 families actively engaged in the program from July 1, 2007 to June
30, 2008. These families engaged in 4 or more home visits and over half of the families
remained in the program 1 year or longer. Most of the engaged families entered the
program after the birth of their child (4,225 families) , and 1,302 families entered
during the prenatal phase.
Program participants reported a significant number of risk factors at entry into the
program (listed with prenatal & postnatal percentages respectively), including:
• 80% and 76% were single mothers;
• 31% and 23% were teen births;
• 82% and 85% of the families utilized AHCCCS; and
• 68% and 63% of mothers had not finished high school.
Additionally, postnatal families reported the following risk factors at intake:
• 21% of the infants were born at less than 37 weeks gestation;
• 14% of the infants had low birth weight (less than 5.5 pounds)

Healthy Families Arizona Annual Evaluation Report 2008 8
What Difference Does Healthy Families Arizona Make for Families and Children?
Areas of Parental Improvement among Healthy Families participants
• Increased social support • Increased problem solving • Decreased depression • Increased use of resources • Improved commitment to parent role • Improved parent child interaction • Improved home environment • Increased parenting efficacy
The Healthy Families Parenting Inventory (HFPI) revealed statistically significant
improvement on 8 of 9 subscales and on the total HFPI score, suggesting that
participation in the program reduced risk factors related to child abuse and neglect.
Although the evaluation lacks a comparison group to study program effects, these
findings continue to show that participants consistently report improvements in
healthy parenting behaviors. The Healthy Families Longitudinal Evaluation, a
separate 5-year study using an experimental design, will be able to provide
comparisons with a control group. (see, LeCroy & Milligan Associates, 2008. Healthy
Families Longitudinal Evaluation, 4th year Study).
Child Health, Development, and Safety
Child health and development indicators show positive results for the program. For
example, there was a reported 87% immunization rate for the children of Healthy
Families Arizona participants at 18 months. This is in comparison to a 79%
immunization rate for 2-year-olds in Arizona and 82% for those insured by the
Arizona Health Care Cost Containment System (AHCCCS) . A large percentage (94%)
of families reported having a consistent medical doctor. Assessment of home safety
practices shows over 90% of participants are reducing risks at the 24 month
assessment on three safety practices: use of car seats, poisons locked, and smoke
alarms installed. This compares favorably with national trends among the general
population (e.g., national estimates of 90% car seat usage and 75% “working” smoke
detectors). The program also screens for developmental delays and provides referrals
for further services.

Healthy Families Arizona Annual Evaluation Report 2008 9
Child Abuse and Neglect
Child abuse and neglect incidents (substantiated) were examined for program
participants. The results estimate that the percent of families showing no child abuse
or neglect incidences was 98.9 percent. A small number of families, 43 out of 3885
families, had substantiated cases of child abuse and neglect.
Mothers’ Health, Education, and Employment
The Healthy Families’ model extends beyond parenting outcomes and also attempts
to influence maternal life course outcomes. In terms of the mothers’ health, time
between subsequent pregnancies provides significant health benefits. Only 16% of
mothers with subsequent pregnancy waited over 24 months. This percentage has
gone down since 2006 which means that a smaller percentage of women are spacing
their births in spite of the health benefits. Mothers do return to school at a significant
percent—30% are enrolled in school within 2 years of program participation.
Substance abuse continues to be a difficult problem for some of the families. The
program screens over 20% of the participants as having potential substance abuse
problems during the first 2 months of the program.
Continuous Program Improvement
The Healthy Families Arizona program is committed to continuous program
improvement and reports on program changes and policy updates every year in the
annual report. Also, program improvement is fostered through the Building Bridges
Newsletter which publishes articles that reflect research developments in the field.
Knowledge development has been ongoing and this year 2 articles, one on the
development and validation of the Healthy Families Parenting Inventory (HFPI) and
another on measurement issues in home visitation, were completed. Finally, three
substudies were completed on prenatal program delivery, implementation of
outreach, and an in-depth examination of risk factors for participants. Program
recommendations include examining the use of supervision, improving the use of
data for decision-making, development of protocols based on assessment data,
assessing and improving program utilization by families, reconsidering the use of
outreach, developing more clear criteria for risk assessment, reviewing the HFPI
depression subscale, improving efforts to provide social support, and improving
efforts to prevent repeat births and increasing the time between subsequent births.

Healthy Families Arizona Annual Evaluation Report 2008 10
Introduction
The Healthy Families Arizona program was established in 1991 as an initiative of the
Department of Economic Security to develop and implement home visitation services
with at-risk families. The program is modeled after the Healthy Families America
initiative and is accredited by Prevent Child Abuse America. Healthy Families
America began under the auspices of Prevent Child Abuse America (formerly known
as the National Committee to Prevent Child Abuse) in partnership with Ronald
McDonald House Charities and was designed to promote positive parenting, enhance
child health and development, and prevent child abuse and neglect. Healthy
Families America exists in over 440 communities in the United States and Canada.
As described by Prevent Child Abuse America, the Healthy Families program model
is designed to help expectant and new parents get their children off to a healthy start.
Families are screened according to specific criteria and participate voluntarily in the
program. Participating families receive home visits and referrals from trained staff.
By providing services to under-resourced, stressed, and overburdened families, the
Healthy Families Arizona program fits into a continuum of services provided to
Arizona families.
Initially, Healthy Families America drew largely from existing research, and
knowledge and experiences gained through Hawaii Healthy Start program to design
the program. Healthy Families America is built on a set of 12 research-based critical
elements that provide a benchmark used to measure quality. As Healthy Families
Arizona has evolved, ongoing studies have helped to enhance research-based home
visitation practices in Arizona.
Healthy Families Arizona (HFAz) is a nationally credentialed, community-based
voluntary home visitation program designed to promote positive parenting, child
development and wellness, and to prevent child abuse and neglect. The program was
established in Arizona in 1991 and has since expanded statewide to serve pregnant
women and families who have risk factors that may result in abuse and neglect of
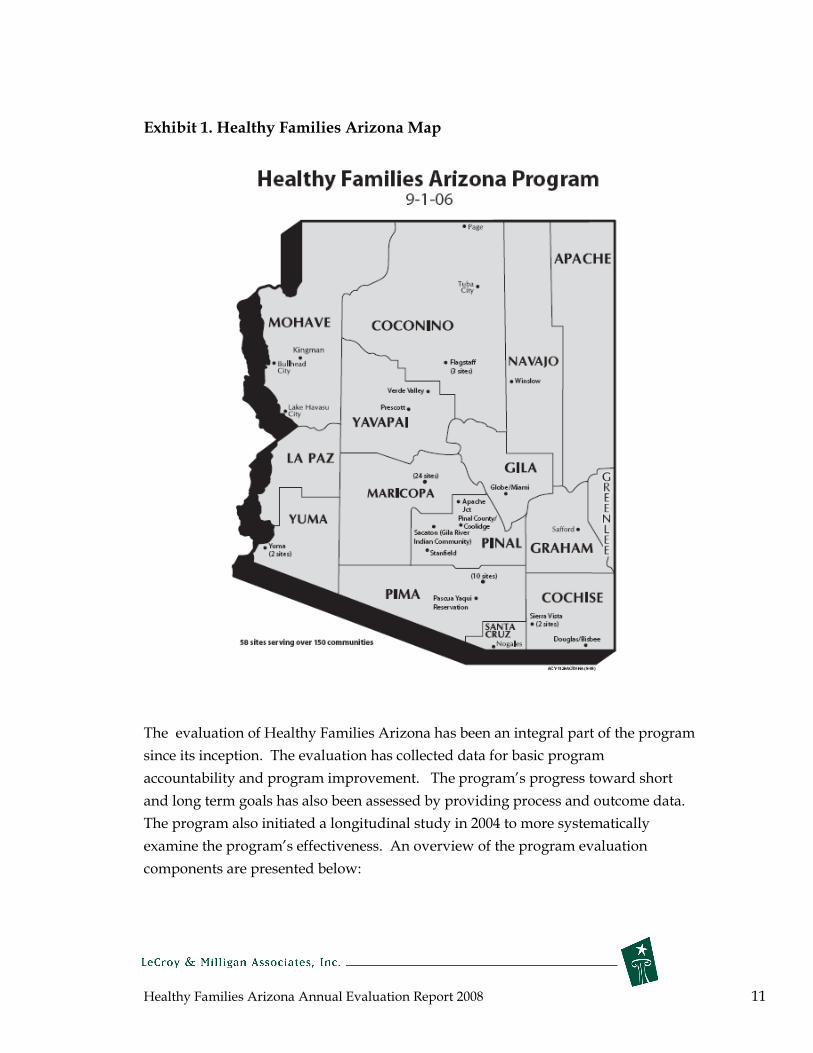
their children. Since 2006, HFAz has included 55 program sites and 3 intake sites (58
total sites) serving over 150 communities (see Exhibit 1).
Healthy Families Arizona Annual Evaluation Report 2008 11
Exhibit 1. Healthy Families Arizona Map
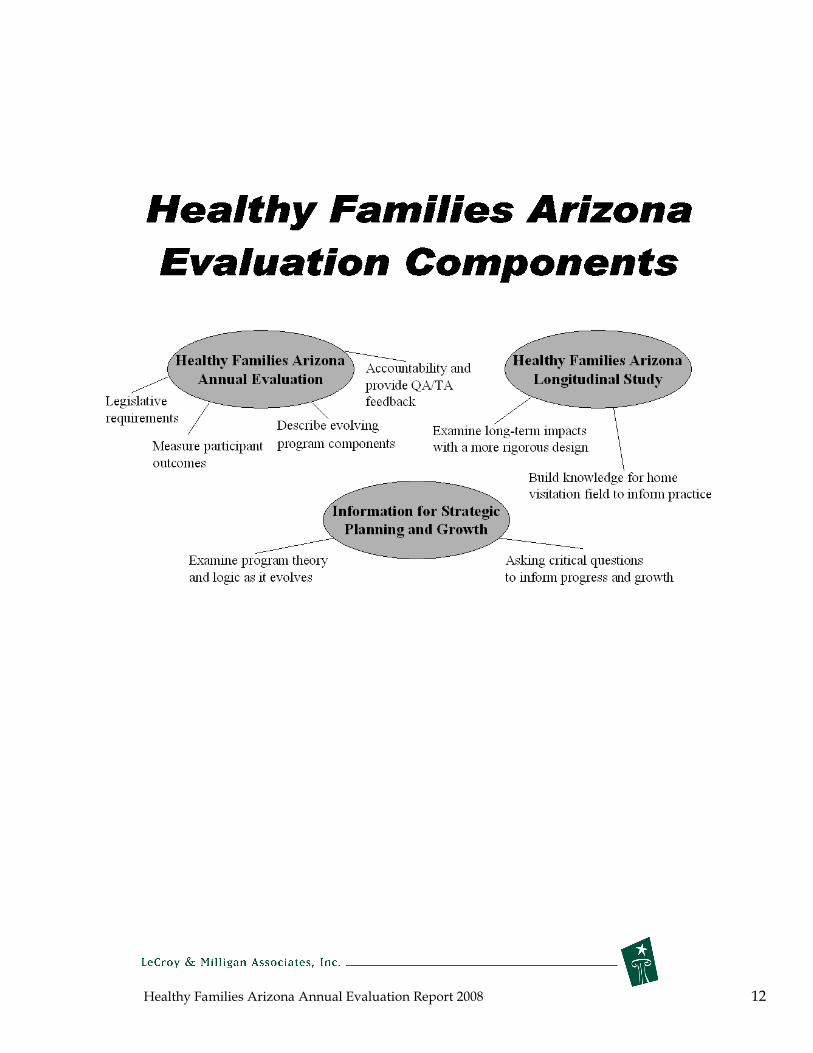
The evaluation of Healthy Families Arizona has been an integral part of the program
since its inception. The evaluation has collected data for basic program
accountability and program improvement. The program’s progress toward short
and long term goals has also been assessed by providing process and outcome data.
The program also initiated a longitudinal study in 2004 to more systematically
examine the program’s effectiveness. An overview of the program evaluation
components are presented below:
Healthy Families Arizona Annual Evaluation Report 2008 12
Healthy Families Arizona Annual Evaluation Report 2008 13
In this Report
This annual program evaluation report for Healthy Families Arizona centers on
annual participant outcomes, process information, and evaluation information useful
for program improvement for the time period July 1, 2007- June 30, 2008. The process
evaluation describes how the program is being implemented, the types of services
provided, and characteristics of families participating in the program. The outcome
(or summative) evaluation examines program outcomes and looks at the program’s
impact across a number of measures. Detailed appendices provide specific site data
on process and outcome variables. The description of evaluation methodology
explains the methods used for each part of the report.
Several unique additions have been incorporated into this year’s report. An
overview of a conceptual model for how Healthy Families fits within a prevention
and protection continuum helps to illustrate how the program fits within the
Department of Economic Security’s priorities for children and families. Second,
results from a series of evaluation sub-studies that examine key programmatic issues
in greater detail are included to promote ongoing program learning and
improvement.
The 2008 Annual Report is only one of the many aspects of the Healthy Families
Arizona evaluation. The evaluation also includes the creation and distribution of
quarterly reports used for training and quality assurance purposes, the longitudinal
study designed to examine program effectiveness, participation with Prevent Child
Abuse America research initiatives to examine issues that impact Healthy Families
nationally, systematic research and publication to advance knowledge learned from
the evaluation, provision of ongoing special data analysis for credentialing and site
visits, and presentations for program improvement based on the findings generated
by the evaluation.
Healthy Families Arizona Annual Evaluation Report 2008 14
The prevention-protection continuum
An action plan for a comprehensive child abuse and neglect prevention system in
Arizona was initially set forth in 2004 with recommendations that “a family at risk for
child abuse and neglect is likely to cross multiple risk and protective factors. Thus,
the recommended strategy is one that encompasses all domains, and involves an
intelligent wraparound service delivery concept for children and families at risk for
child abuse and neglect” (Action Plan for Reform of Arizona’s Child Protection
System, 2004). There is a continuing need for examination and refinement of the
“continuum of services” across state agencies and community-based organizations to
maximize the value of limited resources to serve families in need. Since its inception,
Healthy Families Arizona has sought to provide a continuum of services for children
and famlies, so that families are served appropriately as their needs increase or
decrease. A continuum of services ensures that the family receives the appropriate
level of service with sufficient support, coordination, consistency, and follow-up to
provide the optimal chance for success.
The purpose of this Prevention-Protection continuum is to provide a better
understanding of where Healthy Families Arizona fits into the overall model of
prevention and protection services. The model starts by conceptualizing a
prevention-protection continuum. As the Exhibit 2 shows, the continuum starts at
the far left, representing primary or universal prevention, and continues to the far
right, with required child protection. Along this continuum families function at five
different levels: families without significant difficulties (5), families with identifiable
difficulties (4), families with significant risk factors present (3), families likely to
neglect or abuse their children (2), and families with child protection required (1).

Healthy Families Arizona Annual Evaluation Report 2008 15
Exhibit 2. The Prevention-Protection Continuum
Prevention
5 4 3 2 1
Protection
Families with Families with
significant risk Families very identifiable
factors present likely to abuse difficulties Families or neglect
Families with needing
few child
difficulties protection
Provide support services to
strengthen positive
development and functioning
Identify and Protect address specific against harm
risks in families to prevent
maltreatment and promote well-being
This framework is helpful in understanding how Healthy Families Arizona addresses
the needs of a wide range of families and spans much of the prevention-protection
continuum. The program is considered a prevention program designed to promote
wellness while also preventing maltreatment. On the wellness side, Healthy
Families considers prevention more than the absence of disease or discord—it
involves the promotion of protective factors that impact wellness such as support,
parenting competence, and positive parent child interactions. The program also
concerns itself with child maltreatment and identifies families at risk and seeks to
reduce child neglect and abuse in the home. It is important to recognize that all
families can benefit from the different interventions—for example, home visitation
efforts to promote support and well-being benefit both families with less serious
problems as well as families who are at risk for maltreatment.

Healthy Families Arizona Annual Evaluation Report 2008 16
Giving another example, when working with families with identifiable difficulties
(scale level 4), the program emphasizes providing support and identifying services to
help families ease stress and function more effectively. For families with identifiable
risk factors present (scale level 3), the focus will be on assessing the level of risk and
the multiplicity of risk factors. Depending on the assessment, families may be
referred for psychological treatment, domestic violence services, or substance abuse
counseling. These families will need to be more closely monitored and supervised.
The Healthy Families Arizona program focuses most of its attention on families with
these characteristics.
For families likely to neglect or abuse (scale level 2), the risk factors are severe enough
that monitoring the family’s progress, providing targeted services, and involving
supervisors in ongoing decision-making is required. If families are unable to reduce
their risk factors, additional services are required. For example, families with
substance abuse problems would receive more intensive attention because research
has shown that substance abuse is a significant risk factor associated with neglect and
abuse.
For families requiring protection for the children (scale level 1), Child Protective
Services must be brought into the picture. Although the goal of Healthy Families is
to prevent abuse and limit the need for Child Protective Services, the program
provides an opportunity for observation and monitoring of families that can bring
safety to a child when needed. Without this “window” into the family’s life, a child
needing protection might not be identified.
It is important to note that the outcomes of most interest to program staff may vary
with the different types of families described above. For example, the program can
be evaluated according to outcomes related to promoting family wellness, and it can
be evaluated with regard to its ability to avert abuse among families with the highest
risk. It is also important to realize that families change and move up and down the
continuum depending on a number of factors. Several programmatic implications
emerge from the prevention-protection continuum conceptualization. Child
maltreatment is more likely when numerous and high risk factors are present.
However, it is possible that at this high level of risk prevention of maltreatment may
rarely occur. This may be a situation where it is too little and too late to truly prevent
child maltreatment. It is possible that Healthy Families works more effectively in

Healthy Families Arizona Annual Evaluation Report 2008 17
preventing families from moving toward greater risk factors and higher levels of risk.
Because these families at a lower level of risk have an even lower base rate of child
maltreatment it is difficult to test this theory with research. Hopefully, this
continuum captures the many different families the Healthy Families programs
attempts to serve and suggests the need for an evaluation that can assess a wide
range of outcomes.
Evaluation Methodology
This evaluation includes both a process (or formative) evaluation component and an
outcome (or summative) evaluation component. The primary questions for the
process evaluation are: What are the procedures used to implement the program and
do these procedures reflect the program model? Who participates in the program and
what are the services provided? The primary question for the outcome evaluation is:
What are the short and long term outcomes of the program? Together the process
and outcome evaluations provide a comprehensive picture of the Healthy Families
Arizona program.
For the process evaluation, we use a variety of quantitative and qualitative data
collection methods to measure program operations and program implementation.
Evaluation activities focus on obtaining and describing the program “inputs” such as
numbers served, participant characteristics, and services received. The goal is to
describe the participants involved in the Healthy Families Arizona program and
document the services they receive. Also, we examine the program with regard to
critical elements and expected standards from Healthy Families America as a
benchmark for assessing some aspects of the implementation. The primary data for
the process evaluation comes from the management information system developed to
process data for Healthy Families Arizona. Sites are required to submit data that
captures enrollment statistics, number of home visits, administration of assessment
and outcome forms, descriptions of program participants, types of services provided,
etc. Interviews and focus groups have been conducted with site staff on a variety of
implementation issues. We also include information obtained from the quality
assurance team regarding program implementation.
The overall aim for the outcome study is to examine program effects or outputs, at
both the parent and child level on a number of different outcomes. The evaluation

Healthy Families Arizona Annual Evaluation Report 2008 18
team has worked together with program staff to develop and select key program
measures that are used to provide feedback and to measure the program’s ability to
achieve specific outcomes. The primary activities of the outcome evaluation are to:
examine the extent to which the program is achieving its overarching goals, examine
the program’s effect on short term goals, and examine the extent to which participant
characteristics, program characteristics, or community characteristics moderate the
attainment of the program’s outcomes. For most of the outcome measures, Healthy
Families site staff collect pretest or baseline data and follow up data at different time
points of program participation at 6 months, 1 year, 18 months, and every 6 months
thereafter as long as families are in the program. Part of the outcome evaluation also
includes examination of substantiated cases of child abuse and neglect obtained
through the Department of Economic Security’s CHILDS data base. More detailed
information about outcome measures is included in the outcomes section of this
report.
Process and outcome components of the evaluation were developed and revised
based n the logic models for both the prenatal and postnatal programs. Logic models
for the prenatal and postnatal components of Healthy Families Arizona are presented
in the Appendix.

Healthy Families Arizona Annual Evaluation Report 2008 19
Who does Healthy Families Arizona Serve?
During the current study year, July 2007 through June 2008, the total number of
families actively engaged by the program was 5,527. Successful program engagement
is defined as those families who complete 4 home visits. Not all families who enroll
become actively engaged in the program Overall the engagement rate among families
was 87 percent. This data is similar to what is reported nationally, with most
programs reporting between 70-80 percent engagement (Katzev et al, 2002; Jacobs, et
al., 2005; Williams, et al., 2005). The average length of family involvement in the
program was 497 days with a median of 343 days.
Although Healthy Families Arizona has been expanded over the past several years,
the program still serves a relatively small percent of the population across Arizona.
In Arizona in 2007 there were 102,687 births (Arizona Health Statistics and Vital
Statistics, 2007), and approximately 15% (15,403) of this total would be eligible for
HFAz services, according to screening criteria used for the program. During the
study year, 2,786 new families entered the program. Therefore, approximately 18%
(2,786 out of approximately 15,403 eligible births) of all eligible families were served
in 2007-2008 study year.
The data for this report focuses on participants who were “actively engaged”
(received 4 or more home visits) in the Healthy Families program. About one quarter
(23%) of the families enter the program in the prenatal period (prenatal participants)
and about three quarters (77%) of the families enter the program after the birth of the
child (postnatal participants). From July 2007 to June 2008, there were 1,302 families
actively engaged as prenatal participants and 4,222 actively engaged as postnatal
families. These numbers represent small increases from last year with 186 more
prenatal participants and 312 more postnatal participants compared to last year.
There are currently 55 Healthy Families Arizona sites with Family Support Specialists
and 3 sites with Family Assessment Workers for a total of 58 sites across the state.
Exhibit 3 presents the total numbers of prenatal and postnatal participants enrolled
and actively engaged from July 2007 to June 2008.
Healthy Families Arizona Annual Evaluation Report 2008 20
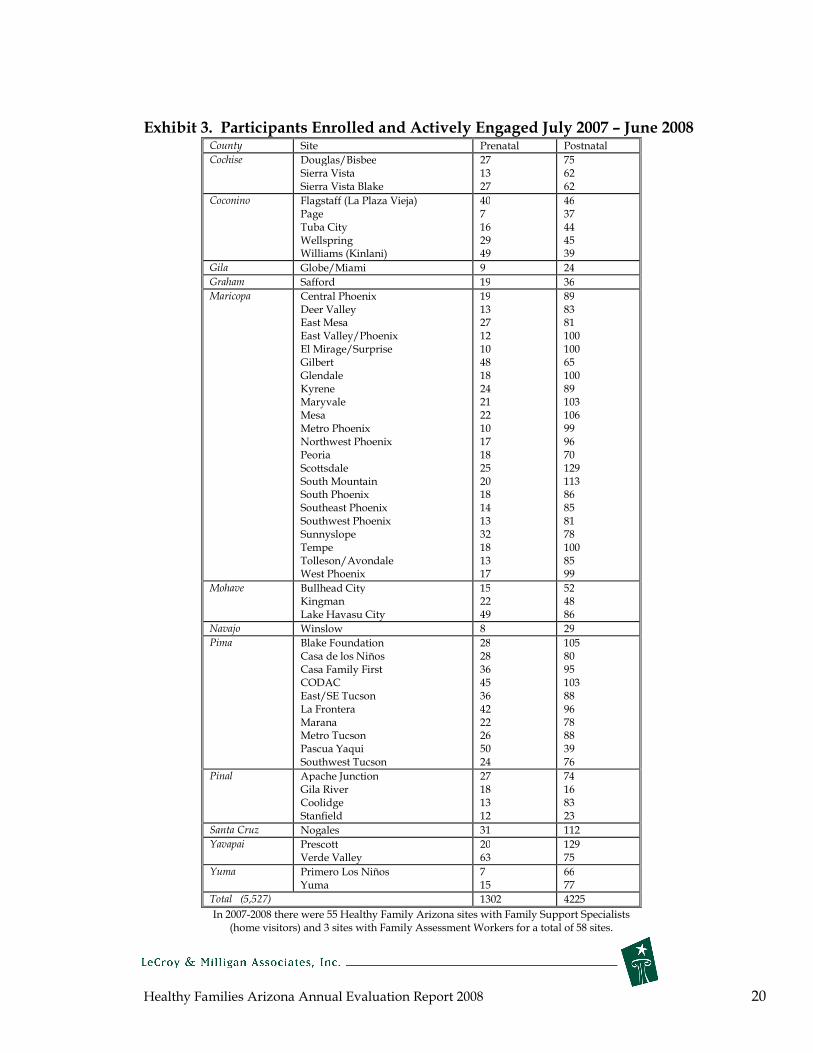
Exhibit 3. Participants Enrolled and Actively Engaged July 2007 – June 2008 County Site Prenatal Postnatal
Cochise Douglas/Bisbee Sierra Vista
27 13
75 62
Sierra Vista Blake 27 62
Coconino Flagstaff (La Plaza Page Tuba City Wellspring Williams (Kinlani)
Vieja) 40 7 16 29 49
46 37 44 45 39
Gila Globe/Miami 9 24
Graham Safford 19 36
Maricopa Central Phoenix Deer Valley East Mesa
19 13 27
89 83 81
East Valley/Phoenix El Mirage/Surprise Gilbert
12 10 48
100 100 65
Glendale 18 100 Kyrene Maryvale Mesa
24 21 22
89 103 106
Metro Phoenix 10 99 Northwest Phoenix 17 96 Peoria 18 70 Scottsdale 25 129 South Mountain 20 113 South Phoenix 18 86 Southeast Phoenix 14 85 Southwest Phoenix 13 81 Sunnyslope Tempe Tolleson/Avondale West Phoenix
32 18 13 17
78 100 85 99
Mohave Bullhead City Kingman Lake Havasu City
15 22 49
52 48 86
Navajo Winslow 8 29
Pima Blake Foundation 28 105 Casa de los Niños 28 80 Casa Family First CODAC
36 45
95 103
East/SE Tucson La Frontera
36 42
88 96
Marana 22 78 Metro Tucson 26 88 Pascua Yaqui Southwest Tucson
50 24
39 76
Pinal Apache Junction Gila River
27 18
74 16
Coolidge Stanfield
13 12
83 23
Santa Cruz Nogales 31 112
Yavapai Prescott Verde Valley
20 63
129 75
Yuma Primero Los Niños 7 66 Yuma 15 77
Total (5,527) 1302 4225
In 2007-2008 there were 55 Healthy Family Arizona sites with Family Support Specialists (home visitors) and 3 sites with Family Assessment Workers for a total of 58 sites.
Healthy Families Arizona Annual Evaluation Report 2008 21
Engagement and Retention
There are many different ways to determine how successfully the program engages
its participants. Our work has suggested that at least four home visits are needed for
the participants to be engaged enough to benefit from the program. A further
consideration in maintaining engagement with families is the extent to which home
visitors are making the expected number of home visits. In general, the expectation is
that program participants begin the program on level one with weekly visits for at
least six months. Across almost all Healthy Families programs nationally, home
visitors have not been able to meet the Healthy Families America (HFA) standard of
75% or more of expected visits (See Jacobs, 2005 for a review). Gomby et al. (1999) in
her review of Healthy Families programs found that families receive only about half
of the home visits they are suppose to receive. Programs continue to pursue new
ways of keeping families engaged in service delivery over time.
In an attempt to better understand the challenges of meeting the 75% home visitation
rate, Jacobs (2005) conducted an exploratory study that revealed the following: up to
20% of the home visits were missed because of staff-related factors including
program demands, personal reasons given by the staff, and scheduling difficulties.
As programs struggle to meet a higher standard of engagement, alternative program
delivery options should be considered.
For Healthy Families Arizona, the evaluation team analyzed data regarding the
number of home visits during the first 6 months of the 2007-2008 program year for all
families who were not on outreach. Across all sites, the overall median number of
home visits during the six month period was 15 visits (or approximately 2.5 visits per
month). However, because families are on different levels of service intensity during
the time period, this analysis does not provide information about the degree to which
the 75% home visitation completion rate was attained.
Overall, the length of time families stayed in the program remains to be
approximately one year. For all families (both postnatal and prenatal) who closed
(1,965), the median number of days in the program was 343 (just under 1 year).
The most frequently given reasons for leaving the program include:

Healthy Families Arizona Annual Evaluation Report 2008 22
1) did not respond to outreach (31.7%); 2) moved away (25.1%); 3) family refused further services (14.1%); 4) unable to contact (6.7%); 5) self-sufficiency (5.5%); 6) completed program (4.3%); and 7) refused worker change (3.6%).
Exhibit 4 shows the rate of retention of families in the Healthy Families Arizona
program at monthly intervals. As the figure illustrates, 85 percent of families
remained active in the program at three months, and this declined to 71 percent by
the six month interval. At the nine month interval, 58 percent of families remained
active in the program and this decreased to 52 percent by the end of the first year.
These retention rates were closely aligned with retention rates reported for nine other
states with HFA programs (Evaluation of HFNY: First Year Program Impacts). As
will be described in the outcomes section of this report, many significant positive
outcomes are achieved within the first year of service.
Exhibit 4. Rate of Retention for Healthy Families Arizona 2007-2008
10095
8985
8075
7167 63
60 58 55 52
0
10
20
30
40
50
60
70
80
90
100
0 1 2 3 4 5 6 7 8 9 10 11 12
Pe
rce
nt
Act
ive
Follow-up Month
Rate of Retention for HFAz
2007-8
Healthy Families Arizona Annual Evaluation Report 2008 23
Characteristics of the target population
The Healthy Families Arizona program targets expectant parents and parents with
newborn infants who live in high risk communities—those communities with high
rates of teen pregnancies, child abuse and neglect reports, and low birth weight
babies. Furthermore, the program seeks to offer services specifically to parents at
high risk for parenting difficulties due to high stress, single parenting, lack of
commitment to parenting, ineffective parenting, or mental health, substance abuse
and domestic violence issues.
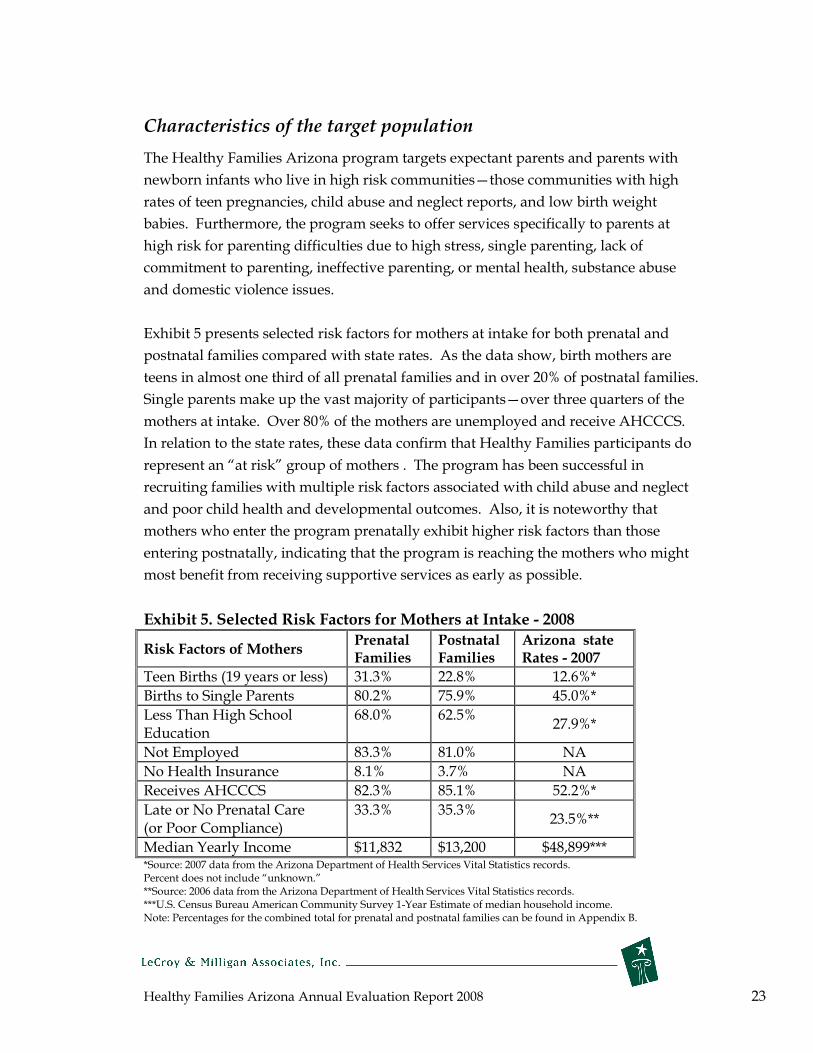
Exhibit 5 presents selected risk factors for mothers at intake for both prenatal and
postnatal families compared with state rates. As the data show, birth mothers are
teens in almost one third of all prenatal families and in over 20% of postnatal families.
Single parents make up the vast majority of participants—over three quarters of the
mothers at intake. Over 80% of the mothers are unemployed and receive AHCCCS.
In relation to the state rates, these data confirm that Healthy Families participants do
represent an “at risk” group of mothers . The program has been successful in
recruiting families with multiple risk factors associated with child abuse and neglect
and poor child health and developmental outcomes. Also, it is noteworthy that
mothers who enter the program prenatally exhibit higher risk factors than those
entering postnatally, indicating that the program is reaching the mothers who might
most benefit from receiving supportive services as early as possible.
Exhibit 5. Selected Risk Factors for Mothers at Intake - 2008
Risk Factors of Mothers Prenatal Families
Postnatal Families
Arizona state Rates - 2007
Teen Births (19 years or less) 31.3% 22.8% 12.6%*
Births to Single Parents 80.2% 75.9% 45.0%*
Less Than Education
High School 68.0% 62.5% 27.9%*
Not Employed 83.3% 81.0% NA
No Health Insurance 8.1% 3.7% NA
Receives AHCCCS 82.3% 85.1% 52.2%*
Late or No Prenatal Care (or Poor Compliance)
33.3% 35.3% 23.5%**
Median Yearly Income $11,832 $13,200 $48,899*** *Source: 2007 data from the Arizona Department of Health Services Vital Statistics records. Percent does not include “unknown.” **Source: 2006 data from the Arizona Department of Health Services Vital Statistics records. ***U.S. Census Bureau American Community Survey 1-Year Estimate of median household income. Note: Percentages for the combined total for prenatal and postnatal families can be found in Appendix B.
Healthy Families Arizona Annual Evaluation Report 2008 24
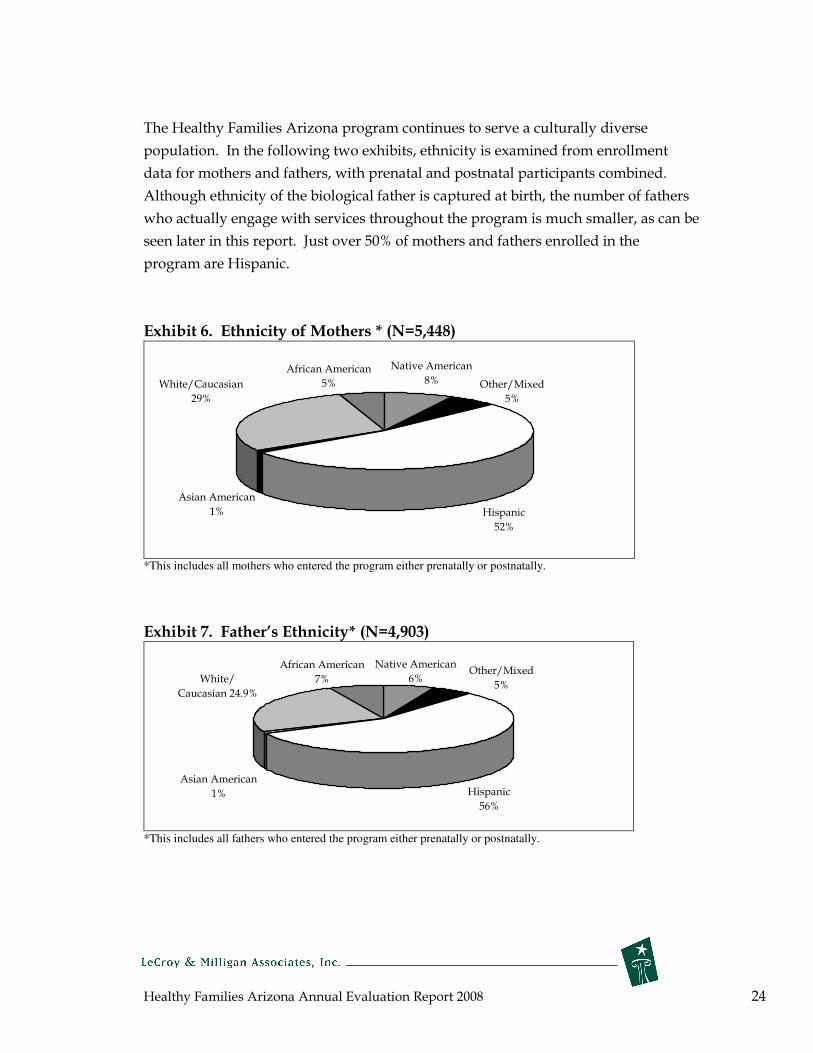
The Healthy Families Arizona program continues to serve a culturally diverse
population. In the following two exhibits, ethnicity is examined from enrollment
data for mothers and fathers, with prenatal and postnatal participants combined.
Although ethnicity of the biological father is captured at birth, the number of fathers
who actually engage with services throughout the program is much smaller, as can be
seen later in this report. Just over 50% of mothers and fathers enrolled in the
program are Hispanic.
Exhibit 6. Ethnicity of Mothers * (N=5,448)
Hispanic
52%
Asian American
1%
White/Caucasian
29%
African American
5%
Native American
8% Other/Mixed
5%
*This includes all mothers who entered the program either prenatally or postnatally.
Exhibit 7. Father’s Ethnicity* (N=4,903)
Hispanic
56%
Asian American
1%
White/
Caucasian 24.9%
African American
7%
Native American
6%Other/Mixed
5%
*This includes all fathers who entered the program either prenatally or postnatally.

Healthy Families Arizona Annual Evaluation Report 2008 25
Father/Male Involvement
Fathers contribute significantly to a child’s emotional and developmental outcomes.
Families that do not have a father or partner involved to share the stresses and
responsibilities of parenting are at higher risk for child abuse and neglect. One
ongoing goal over the past several years in Healthy Families Arizona has been
increased male involvement. Data on 3,029 fathers and other male caretakers is
available for families at the six month post-birth time period. During the first 6
months after the baby’s birth, nearly 60% of families report father involvement in a
variety of caretaking roles. However, fathers do not participate in Healthy Families
activities as frequently, with only about 40% of families reporting father’s
involvement. This could be due to fathers working or being away from the home
during the home visit. The role of grandparents in raising children is evident with
approximately 10 percent of families reporting grandfather involvement. Of
continued concern is the observation that 20-25 percent of all families report no male
involvement during this time of the child’s life. When these data are compared with
last year, all activities show an increase of 3-4 percent. For example, “shares child
care responsibilities” increased 3 percent and “helps with basic care” increased 4
percent. Efforts on the part of home visitors to provide support, encouragement and
ideas for male family involvement are of ongoing importance.
Exhibit 8. Male Involvement at 6 Months
0% 20% 40% 60% 80% 100%
Participates in H.F. Activities
Currently resides in same home as
target child
Provides Financial Support
Helps with Extended Care
Helps with Basic Care
Shares Child Care Responsibilites
Father
Grandfather

Healthy Families Arizona Annual Evaluation Report 2008 26
Assessment of risk factors
Both mothers and fathers are assessed during an initial screening with the Parent
Survey1. The parent survey helps the program learn about the family’s circumstances
and life events that place them at risk for child maltreatment and other adverse
outcomes. During the intake process, the Family Assessment Worker evaluates each
family across the 10 domains of the Parent Survey. The survey is administered in an
interview format and the items are then rated by the worker according to level of
severity. The percentage of parents scoring severe on each of the scales is presented
for prenatal mothers and fathers and for postnatal mothers and fathers in Exhibits 9
and 10.
Exhibit 9. Percentage of Parents Rated Severe on Parent Survey Items
PRENATAL *
0 10 20 30 40 50 60 70 80 90 100
Childhood Abuse
Crime, Substance Abuse, Mental Illness
Self-esteem, isolation
CPS Involvement
Current Life Stresses
Violence Potential
Expectations of Infant
Discipline Attitudes
Difficult Child
Parental Attachment
Mom
Dad
*Note: The Ns ranged from 1247-1288 for mothers and from 468-1076 for fathers depending on the
item.
1 The Family Stress Checklist was revised by the original developer and renamed the Parent Survey to impart a more strengths based perspective, however, the rating scale remains unchanged.
Healthy Families Arizona Annual Evaluation Report 2008 27
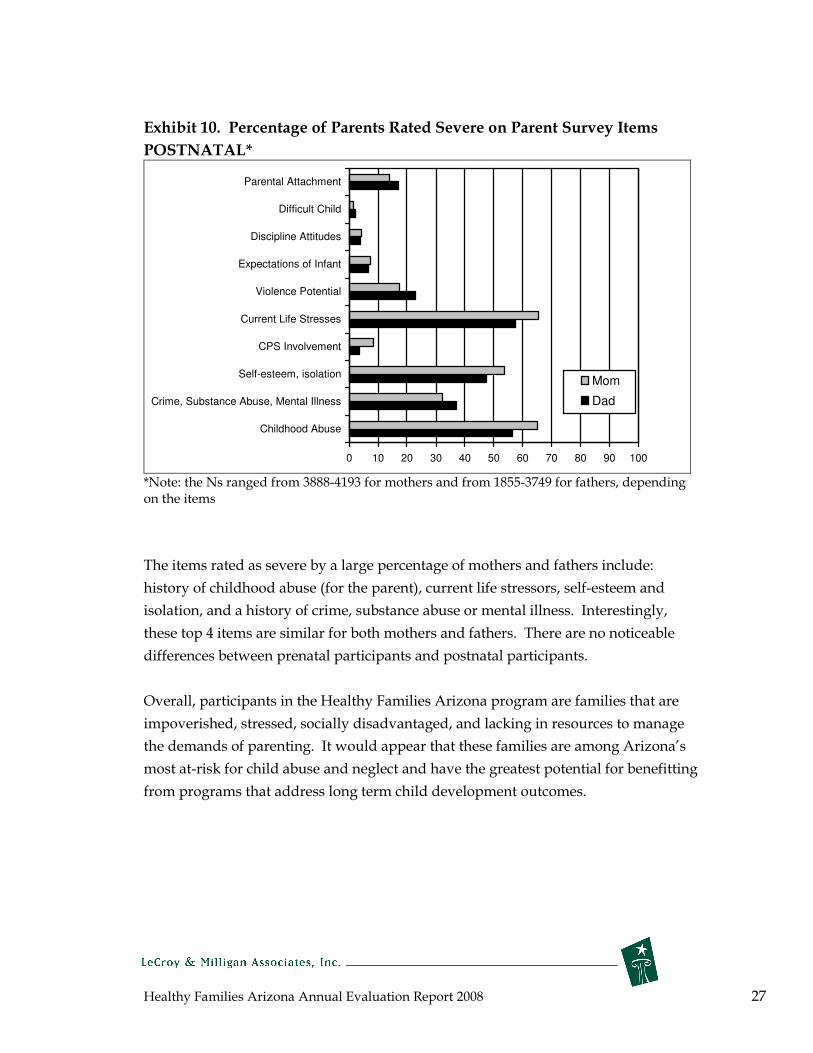
Exhibit 10. Percentage of Parents Rated Severe on Parent Survey Items
POSTNATAL*
0 10 20 30 40 50 60 70 80 90 100
Childhood Abuse
Crime, Substance Abuse, Mental Illness
Self-esteem, isolation
CPS Involvement
Current Life Stresses
Violence Potential
Expectations of Infant
Discipline Attitudes
Difficult Child
Parental Attachment
Mom
Dad
*Note: the Ns ranged from 3888-4193 for mothers and from 1855-3749 for fathers, depending on the items
The items rated as severe by a large percentage of mothers and fathers include:
history of childhood abuse (for the parent), current life stressors, self-esteem and
isolation, and a history of crime, substance abuse or mental illness. Interestingly,
these top 4 items are similar for both mothers and fathers. There are no noticeable
differences between prenatal participants and postnatal participants.
Overall, participants in the Healthy Families Arizona program are families that are
impoverished, stressed, socially disadvantaged, and lacking in resources to manage
the demands of parenting. It would appear that these families are among Arizona’s
most at-risk for child abuse and neglect and have the greatest potential for benefitting
from programs that address long term child development outcomes.

Healthy Families Arizona Annual Evaluation Report 2008 28
Infant Characteristics
In addition to family risk factors, information about infant risk factors is collected at
intake for postnatal families and at birth for prenatal families. This information helps
to indicate the level of need of the families served by the program. The following
exhibit displays the high-risk characteristics of the newborns among families who
entered prenatally and postnatally.
Exhibit 11. Risk Factors for Infants - 2008
Risk Factors for Infants Prenatal Families* Postnatal Families**
Arizona State percent***
Born < 37 weeks gestation
(1st
16.7% (overall)
16.9% Trimester Enrollment)
16.8%
20.9% 10.3%
(3rd Trimester Enrollment)
Birth Defects 0.8 % 1.7% <1%
Low Birth Weight 13.6% 15.6% 7.1%
Positive Alcohol/Drug Screen 1.6% 4.2% NA *The Family Support Specialist collects this information either from the family or a CPS referral for prenatal families. **Family Assessment Workers collect this information from hospital records for postnatal families. ***2007 data from the Arizona Department of Health Services Vital Statistics records.
The overall risk factors for infants have remained about the same from last year. The
percentage of postnatal Healthy Families Arizona program infants born early (less
than 37 weeks gestation) is almost 17% regardless of the trimester in which the parent
is enrolled. This is considerably higher than the overall state rate, again suggesting
that the families being identified for service have a significant level of need. The
percentage of low birth weight infants in the program also remains high in
comparison to the state rate.
Data suggests the Healthy Families Arizona program is reaching parents and babies
who have greater risks of child maltreatment and other unhealthy outcomes.
Healthy Families Arizona home visitors have the opportunity to help mothers
prevent having pre-term or low birth weight babies by encouraging parents to attend
regular prenatal visits, to adopt healthy behaviors such as good nutrition habits, and
to stop alcohol, drug, and tobacco use. The recent Healthy Families New York
randomized control study reports that in a the control group mothers were
significantly more likely to deliver low birth weight babies than were the mothers
eng

Healthy Families Arizona Annual Evaluation Report 2008 29
aged in the Healthy Families program (Mitchell-Herzfeld et al., 2005).
These data show that the infants in the Healthy Families Arizona program are at
significant risk. Both low birth weight children and children born at less than 37
weeks gestation are at more risk for child maltreatment and present special
challenges for parents.
Healthy Families Arizona Annual Evaluation Report 2008 30
Key Healthy Families Arizona Services
To reach the overall goals of reducing child abuse and neglect, success will be more
likely when the program ensures that families not only stay engaged in the program
but also receive the services and resources they need and are satisfied with the
program. Three aspects of Healthy Families Arizona services are highlighted in more
depth in this section: referral to resources, services for pre-natal families, and
participant satisfaction with services.
Referral services
Many of the new and inexperienced mothers and fathers served by Healthy Families
live in isolated or high risk neighborhoods or communities. An important aspect of
the Healthy Families program model is linking families with needed community
resources. While much of the home visitor’s assistance is provided in the home,
equally important is the home visitor’s efforts to connect the family with educational,
health, and family support services in the community. While some Healthy Families
sites exist in communities with adequate resources, others are in communities with
very limited support resources for families. Common problems noted among many
sites are that there are not enough resource options for families who need help;
eligibility requirements may restrict access to services; and families experience long
waiting lists or need to travel long distances to receive services. Exhibit 12 presents
data on the number of families that received various referrals to needed resources
and the percent of families who actually accessed services.
Healthy Families Arizona Annual Evaluation Report 2008 31
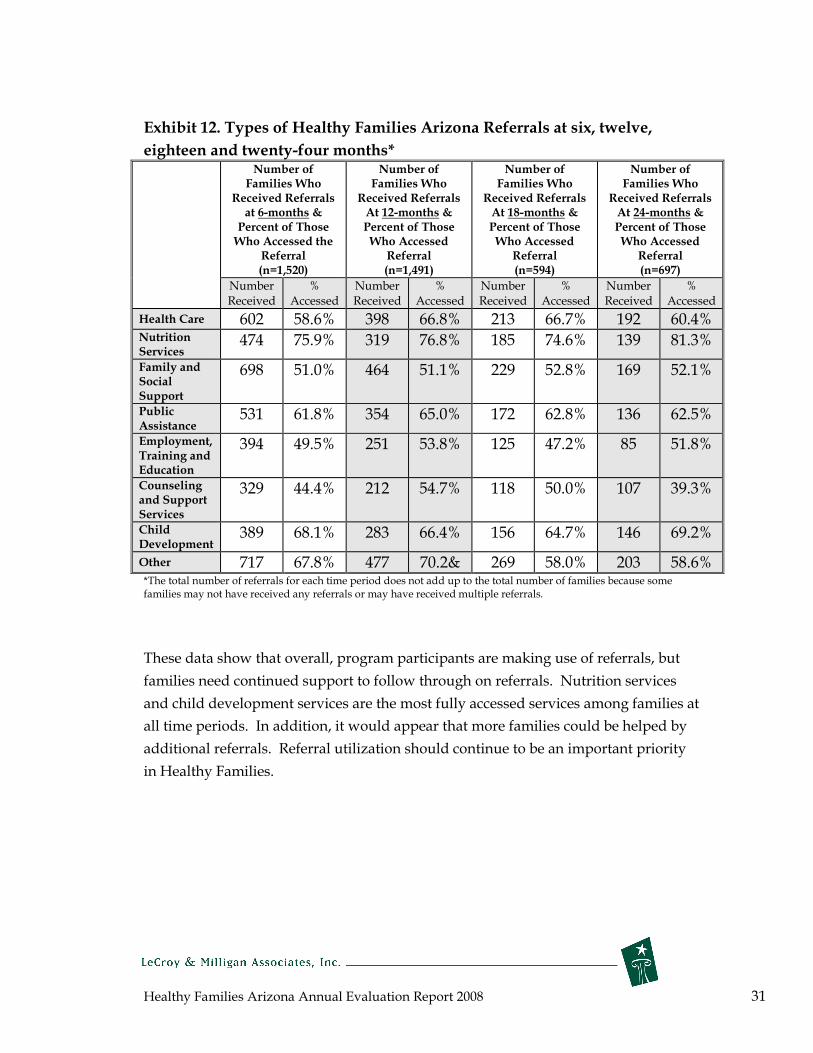
Exhibit 12. Types of Healthy Families Arizona Referrals at six, twelve,
eighteen and twenty-four months*
Number of Families Who
Received Referrals at 6-months &
Percent of Those Who Accessed the
Referral (n=1,520)
Number of Families Who
Received Referrals At 12-months & Percent of Those Who Accessed
Referral (n=1,491)
Number of Families Who
Received Referrals At 18-months & Percent of Those Who Accessed
Referral (n=594)
Number of Families Who
Received Referrals At 24-months & Percent of Those Who Accessed
Referral (n=697)
Number Received
% Accessed
Number Received
% Accessed
Number Received
% Accessed
Number Received
% Accessed
Health Care 602 58.6% 398 66.8% 213 66.7% 192 60.4% Nutrition Services
474 75.9% 319 76.8% 185 74.6% 139 81.3%
Family and Social Support
698 51.0% 464 51.1% 229 52.8% 169 52.1%
Public Assistance
531 61.8% 354 65.0% 172 62.8% 136 62.5%
Employment, Training and Education
394 49.5% 251 53.8% 125 47.2% 85 51.8%
Counseling and Support Services
329 44.4% 212 54.7% 118 50.0% 107 39.3%
Child Development
389 68.1% 283 66.4% 156 64.7% 146 69.2%
Other 717 67.8% 477 70.2& 269 58.0% 203 58.6% *The total number of referrals for each time period does not add up to the total number of families because some families may not have received any referrals or may have received multiple referrals.
These data show that overall, program participants are making use of referrals, but
families need continued support to follow through on referrals. Nutrition services
and child development services are the most fully accessed services among families at
all time periods. In addition, it would appear that more families could be helped by
additional referrals. Referral utilization should continue to be an important priority
in Healthy Families.

Healthy Families Arizona Annual Evaluation Report 2008 32
Services to Prenatal Families
Healthy Families Arizona expanded services to prenatal families in 2005. The
program has focused on trying to reach mothers as early as possible, and data shows
that the risk factors faced by the mothers that are being reached prenatally are
significant. Identifying and engaging families early in their pregnancy can be
challenging. It is a program focus for Healthy Families Arizona to reach families in
the first trimester of pregnancy.
Exhibit 13 shows the trimester of enrollment for all families entering the program
prenatally. The majority of the families do not enter until the third trimester, and this
year’s data is very similar to last year’s results so there has not been an increase in
recruiting families during the first trimester. This shows the continuing challenge the
program faces in reaching families earlier. It also indicates a need to review
definitions of prenatal enrollment (e.g., “prenatal” could be limited to those families
who enroll prior to 24 weeks gestational age) to better target and track the effects of
early involvement in HFAz visits.
Exhibit 13. Trimester of Enrollment*
12.6%
32.3%
49.6%
5.5%
0%
20%
40%
60%
80%
100%
1st
Trimester
(n=164)
2nd
Trimester
(n=421)
3rd
Trimester
(n=646)
Post-birth
(n=71)
(assumption - trimesters equal 280 days divided in three equal parts)
perc
ent
*Families who are referred to the program prior to birth of the baby are considered to be in the prenatal category. While they may have been screened prior to the birth of the baby, final acceptance and enrollment did not occur until after the baby was born. Therefore, about 5.5% of “prenatal” families have a “post-birth” date of enrollment.

Healthy Families Arizona Annual Evaluation Report 2008 33
Developmental Screens for Children
Developmental screens are a service provided to families that participate in home
visitation services. They are used to measure a child’s developmental progress and
identify potential developmental delays requiring specialist intervention. The
program administers the Ages and Stages Questionnaire (ASQ) for physical
development and the ASQ-Social Emotional (SE) which focuses on social and
emotional difficulties. The program goal is to screen 80% of the children in families
served by the program. As Exhibit 14 shows, the program is close to meeting this
goal for the ASQ, but no interval of ASQ screening met the 80% standard. Rates of
screening for this year are slightly below the previous year (2-6% lower), but hover
right around the national average of 75% across sites (Harding, et.al., 2007). While
some screenings are missed due to families being on outreach status, there is a need
for continued attention to timely ASQ screening.
Exhibit 14. ASQ Screening
Interval ASQ
Screening
Percent of children Screened with ASQ
2008
Percent screened as delayed 2008
Percent screened as delayed on the
ASQ-SE * 2008
6-month 69.8% 5.6% 2.9%
12-month 75.7% 8.5% 4.5%
18-month 77.0% 24.2% 4.7%
24-month 75.6% 26.0% 8.0%
30-month 73.0% 18.1% 10.9%
36-month 75.2% 19.0% 20.7%
48-month 78.9% 18.9% 2.9%
• Note: data on screenings for the ASQ-SE is limited.
Healthy Families program data tracks what happens after a family’s ASQ is scored: 1)
the child is assessed as having no delays, 2) the child is referred for further
assessment and is determined to have no delays upon a more extensive assessment,
3) families are referred to different services such as the Arizona Early Intervention
Program (AzEIP) or other early intervention or therapy, or 4) the home visitor may
provide developmental intervention or education to the family. Although from 5-
26% of children (depending on their age) are initially screened as delayed in their
development, up to one fourth of the children who initially screen as delayed on the
ASQ are determined “not delayed” upon further assessment (see Exhibit 15 below).

Healthy Families Arizona Annual Evaluation Report 2008 34
For example, of the families at 6 months who screened as delayed on the ASQ and
were referred for more assessment, 19 families showed no delay, 20 families were
referred to the AzEIP, 12 families were referred to an early intervention program, 45
families received developmental intervention, 6 families received specialized therapy,
and 2 declined further referral. The ASQ screening provides a valuable service to
families because it enables them to access appropriate services to meet their child’s
particular needs. The following exhibit shows the level of screening being obtained
with families at the different time intervals and the percent identified as delayed.
Exhibit 15. ASQ Follow-Up Services – 2008
Continued Assessment
shows “no delay”
% (n)
Referred to
AzEIP % (n)
Referred to other Early Intervention
% (n)
Provided Developmental Intervention
% (n)
Referred to
Therapy % (n)
Parent Declined Referral % (n)
6-month 29.7% 31.3% 18.8% 70.3% 9.4% 3.1 % Screen (19) (20) (12) (45) (6) (2)
12-month 19.7% 18.2% 15.2% 81.8% 1.5% 9.1% Screen (13) (12) (10) (54) (1) (6)
18-month Screen
26.1 (31) 26.9 (32) 16.0 (19) 78.2 (93) 4.2 (5) 5.9 (7)
24-month Screen
18.8 (22) 34.2 (40) 15.4 (18) 76.9 (90) 6.0 (7) 8.5 (10)
30-month Screen
25.0 (17) 23.5 (16) 11.8 (8) 61.8 (42) 7.4 (5) 7.4 (5)
36-month Screen
18.4 (9) 12.2 (6) 14.3 (7) 79.6 (39) 4.1 (2) 4.1 (2)
48-month Screen
41.2 (7) 0% (0) 0% (0) 82.4 (14) 5.9 (1)
0%
(0)
Note: Percents do not equal 100% as multiple referrals can happen for s single child.
Participant satisfaction
Data on participant satisfaction information provides valuable information for
program staff and a time for reflection for participants. If participants are satisfied
with the program and the work of the home visitor, they are more likely to benefit
from the program. The following data summarizes the responses of participants who
took the Healthy Families participant satisfaction survey during the spring of 2008.
The survey is distributed to all current participants in the program and returned by
mail. Data was received from all 55 sites for a total of 1,502 completed surveys;
Healthy Families Arizona Annual Evaluation Report 2008 35
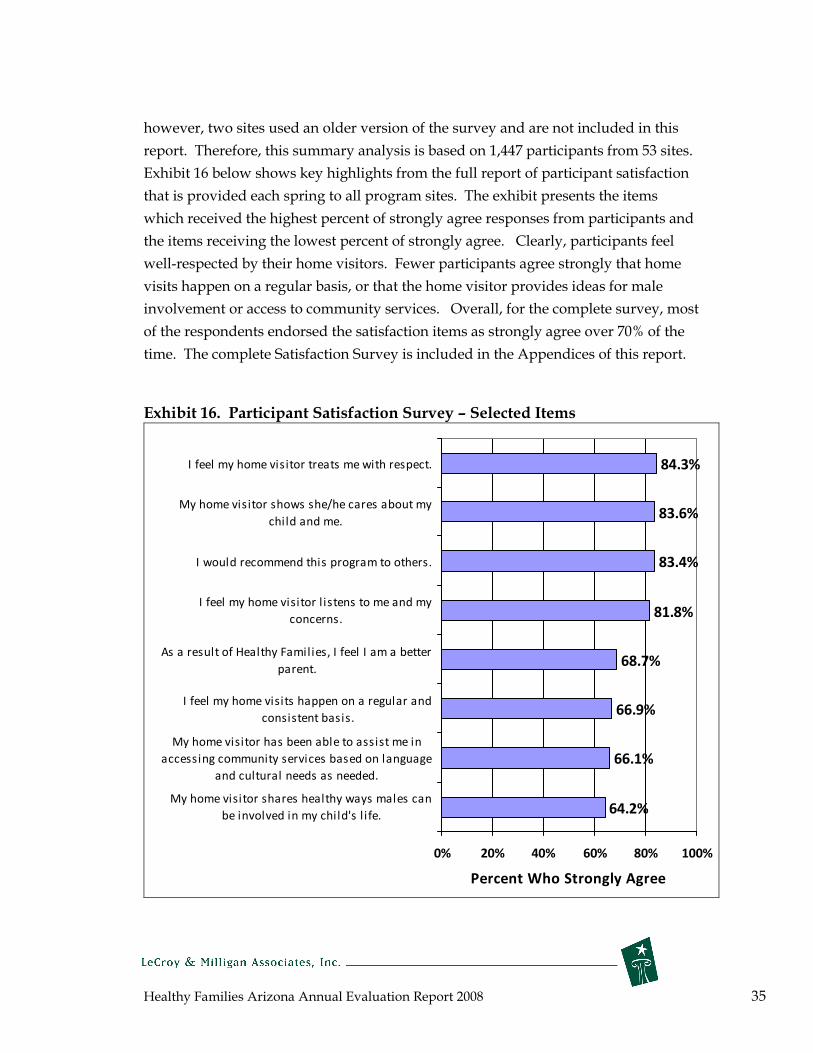
however, two sites used an older version of the survey and are not included in this
report. Therefore, this summary analysis is based on 1,447 participants from 53 sites.
Exhibit 16 below shows key highlights from the full report of participant satisfaction
that is provided each spring to all program sites. The exhibit presents the items
which received the highest percent of strongly agree responses from participants and
the items receiving the lowest percent of strongly agree. Clearly, participants feel
well-respected by their home visitors. Fewer participants agree strongly that home
visits happen on a regular basis, or that the home visitor provides ideas for male
involvement or access to community services. Overall, for the complete survey, most
of the respondents endorsed the satisfaction items as strongly agree over 70% of the
time. The complete Satisfaction Survey is included in the Appendices of this report.
Exhibit 16. Participant Satisfaction Survey – Selected Items
64.2%
66.1%
66.9%
68.7%
81.8%
83.4%
83.6%
84.3%
0% 20% 40% 60% 80% 100%
My home visitor shares healthy ways males can
be involved in my child's l ife.
My home visitor has been able to assist me in
accessing community services based on language
and cultural needs as needed.
I feel my home visits happen on a regular and
consistent basis.
As a result of Healthy Families, I feel I am a better
parent.
I feel my home visitor l istens to me and my
concerns.
I would recommend this program to others.
My home visitor shows she/he cares about my
child and me.
I feel my home visitor treats me with respect.
Percent Who Strongly Agree

Healthy Families Arizona Annual Evaluation Report 2008 36
Outcomes for Families What is changing for Healthy Families Participants?
While there are multiple outcomes that could be measured, the Healthy Families
Arizona program focuses the evaluation on the following primary outcome
indicators:
• Parent outcomes
• Child abuse and neglect
• Child development and wellness
• Mother’s health, education, and employment
Parent outcomes
One of the primary intermediate goals of the Healthy Families Arizona program is to
have a positive influence on parenting attitudes and behaviors. While reducing child
abuse and neglect is the ultimate outcome, intermediate objectives such as changes in
parenting behaviors can inform us about progress toward the ultimate goal. The
intermediate goals of the Healthy Families program revolve around a few key factors
known to be critical in protecting children from maltreatment (Jacobs, 2005):
• providing support for the family;
• having a positive influence on parent-child interactions;
• improving parenting skills and abilities and sense of confidence; and
• promoting the parents healthy functioning.
In order to evaluate critical intermediate goals the evaluation team developed the
Healthy Families Parenting Inventory or the HFPI in 2004. The development of the
HFPI was guided by several perspectives and sources: the practice experience of the
home visitors in the Healthy Families Arizona program; data gathered directly from
home visitors, supervisors, and experts; information obtained from previous studies
of the Healthy Families program; and examination of other similar measures. The
process included focus groups with home visitors, the development of a logic model,
and an extensive review of relevant literature. The final instrument includes 9 scales:
Social Support, Problem-solving, Depression, Personal Care, Mobilizing Resources,
Role Satisfaction, Parent/child interaction, Home Environment and Parenting
Efficacy.

Healthy Families Arizona Annual Evaluation Report 2008 37
In 2007-2008, the HFPI underwent more extensive testing, specifically, a method
called exploratory factor analysis. Essentially, this analysis explores patterns among
the survey questions in order to discern relationships and to assess the strength of the
HFPI's ability to measure key concepts.
For this study, an exploratory factor analysis (EFA) was conducted using the
principal components extraction method with varimax rotation. The EFA was
conducted to provide preliminary evidence as to the adequacy of the factor structure
of the model upon which the HFPI was developed. An a priori criterion loading of
0.30 was set for inclusion of items in the initial stage of item reduction as per the
recommendation of Feher Waltz, Stickland, & Lenz (2004, p. 162). The pattern of
item-to-item correlations within subscales and item to total subscale score
correlations were generally as predicted. Based on the pattern of correlations,
however, one of the 10 subscales was deleted. The parental competence subscale was
highly correlated with three subscales: parent child interaction (r = .84), home
environment (r = .90), and parental efficacy (r = .86). Also, two items with factor
loadings less than .30 were deleted from the original scale. The subscale and overall
reliability was assessed and found to be adequate to good. A complete report was
generated detailing the efforts to establish the initial validation of the HFPI and has
been submitted for publication in a peer reviewed journal (Krysik & LeCroy, 2008).
The factor loading and subscale alphas for the nine factor model which establishes
the initial validity and reliability of the instrument are presented in the following
exhibit.
Exhibit 17. Factor Loadings and Subscale Alphas for the Nine Factor Model Subscale Title Factor (Chronbach’s Item Loading Alpha)
Social (.84)
Support I feel supported by others .71
I feel that others care about me .74
I discuss my feelings with someone .54
If I have trouble, I feel there is always someone I can turn to for help .85
I have family or friends who I can turn to for help .80
Problem-Solving (.92)
I learn new ways of doing things from solving problems .53
I deal with setbacks without getting discouraged .69
When I have a problem, I take steps to solve it .56
When I am faced with a problem, I can think of several solution .47
I am good at dealing with unexpected problems .65
I remain calm when new problems come up .75

Healthy Families Arizona Annual Evaluation Report 2008 38
Subscale Title Factor (Chronbach’s Item Loading Alpha)
Depression (.79)
I feel sad .50
I feel positive about myself .68
The future looks positive for me .72
I feel unhappy about everything .68
I feel hopeless about the future .70
There isn’t much happiness in my life .48
I have so many problems I feel overwhelmed by them .51
It is hard for me to get in a good mood .64
My life is fulfilling and meaningful .53
Personal (.76)
Care I find ways to care for myself .54
I take care of my appearance .57
I get enough sleep .75
I am a better parent because I take care of myself .79
I take time for myself .58
Mobilizing Resources (.86)
I know where to find resources for my family .76
I know where to find important medical information .70
I can get help from the community if I need it .80
I am comfortable in
finding the help I need .67
I know community agencies I can go to for help .76
It is hard for me to a sk for help from others .18*
Role (.76)
Satisfaction Because I’m a parent, I’ve had to give up much of my life .57
I feel trapped by all the things I have to do for my child .69
I feel drained dealing with my child .48
There are times my child gets on my nerves .48
I feel controlled by all the things I have to do as a parent .59
I feel frustrated because my whole life seems to revolve around my .30 child
Parent/Child Interaction (.77)
I have a hard time managing my child .67
I can be patient with my child .67
I respond quickly to my child’s needs .60
I do activities that help my child grow and develop .56
When my child is upset, I’m not sure what to do .49
I use positive words to encourage my child .46
I can tell what my child wants .41
I am able to increase my child’s good behavior .37*
I remain calm when my child is upset .61
I praise my child everyday .55
Home Environment (.76)
My child has favorite things to comfort him/her .55
I read to my child .39*
I plan and do a variety of activities with my child every day .60
I have made my home exciting and fun for my child .71
I have organized my home for raising a child .58
I check my home for safety .50

Healthy Families Arizona Annual Evaluation Report 2008 39
Subscale Title Factor (Chronbach’s Item Loading Alpha)
My child has a schedule for eating and sleeping in my home .30*
I set limits for my child consistently .26*
I make plans for our family to do things together .57
I set rules for behavior in my home .45
Parenting Efficacy (.87)
I feel I’m doing an excellent job as a parent .81
I am proud of myself as a parent .83
I am more effective than most parents .72
I have set goals about how I want to raise my child .58
I am a good example to other parents .78
I learn new parenting skills and use them with my child .60
Note. * indicates that the item was revised as presented; however, the factor loading is for the original item.
Since the HFPI is newly developed, ongoing work and refinement is being conducted
with the tool. The demand for it as an evaluation tool has grown steadily, and it is
used in many programs across several states, and recently it was introduced in
Finland.
The following section describes the results obtained for each subscale of the HFPI.
The level of significance is reported along with the effect size which estimates the
magnitude of the change. The results using this instrument include multiple tests,
however, all the findings except one exceed a p. <.000 level (a very good significance
level), therefore, we did not attempt to control for the number of tests being
conducted as this would not have changed the findings. These findings are based on
data reported from the sites and represent approximately 1,500 participants who
completed both instruments at the 6 month interval, and 500 participants who had
matched instruments at the 12 month intervals.
Social Support
Research has found that communities with low rates of social support and mutual
caring have higher rates of child maltreatment (Gelles, 1992; MacMillan et al., 1995;
Wolfe, 1998). In essence, effective parenting is compromised by limited social ties to
extended family, neighbors, and informal community resources. Too often parents
are left without the needed support. The HFPI measurement of social support tries
to examine the emotional support available to the parent. As the following exhibit
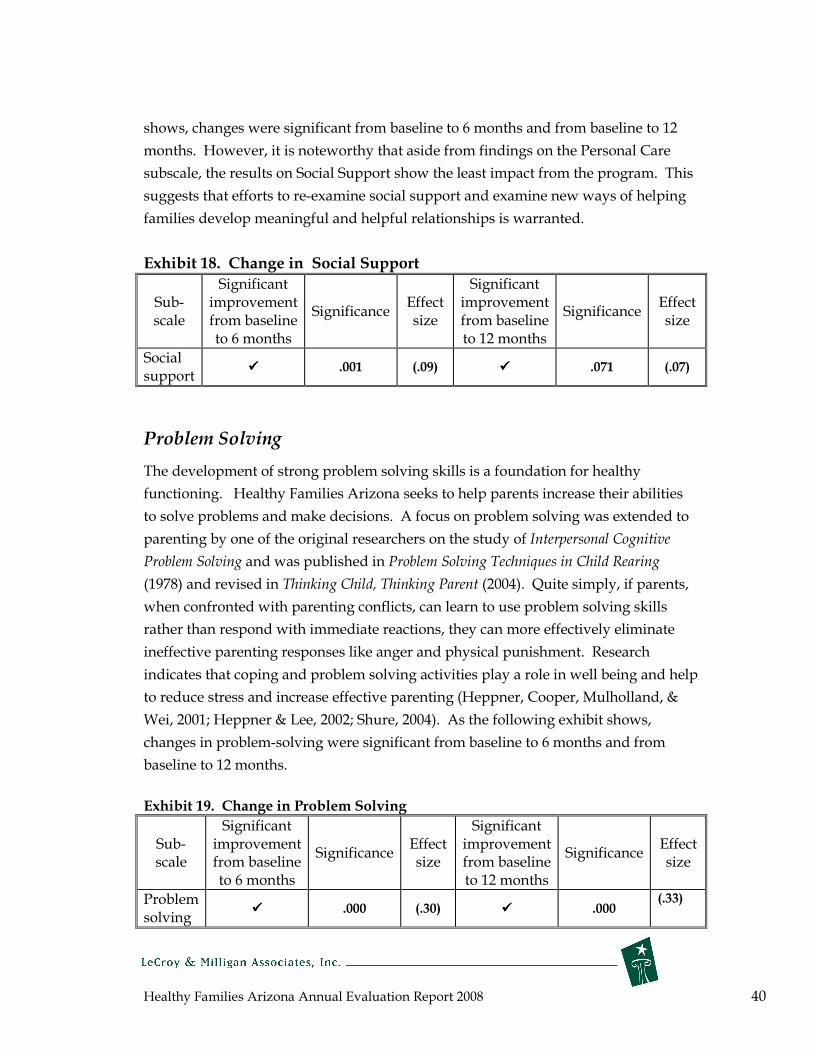
Healthy Families Arizona Annual Evaluation Report 2008 40
shows, changes were significant from baseline to 6 months and from baseline to 12
months. However, it is noteworthy that aside from findings on the Personal Care
subscale, the results on Social Support show the least impact from the program. This
suggests that efforts to re-examine social support and examine new ways of helping
families develop meaningful and helpful relationships is warranted.
Exhibit 18. Change in Social Support
Significant Significant Sub- improvement Effect improvement Effect
Significance Significance scale from baseline size from baseline size
to 6 months to 12 months
Social ���� .001 (.09) ���� .071 (.07)
support
Problem Solving
The development of strong problem solving skills is a foundation for healthy
functioning. Healthy Families Arizona seeks to help parents increase their abilities
to solve problems and make decisions. A focus on problem solving was extended to
parenting by one of the original researchers on the study of Interpersonal Cognitive
Problem Solving and was published in Problem Solving Techniques in Child Rearing
(1978) and revised in Thinking Child, Thinking Parent (2004). Quite simply, if parents,
when confronted with parenting conflicts, can learn to use problem solving skills
rather than respond with immediate reactions, they can more effectively eliminate
ineffective parenting responses like anger and physical punishment. Research
indicates that coping and problem solving activities play a role in well being and help
to reduce stress and increase effective parenting (Heppner, Cooper, Mulholland, &
Wei, 2001; Heppner & Lee, 2002; Shure, 2004). As the following exhibit shows,
changes in problem-solving were significant from baseline to 6 months and from
baseline to 12 months.
Exhibit 19. Change in Problem Solving
Sub- scale
Significant improvement from baseline to 6 months
Significance Effect size
Significant improvement from baseline to 12 months
Significance Effect size
Problem solving
���� .000 (.30) ���� .000 (.33)

Healthy Families Arizona Annual Evaluation Report 2008 41
Depression
When combined with the demands of being a parent, the characteristics of adult
depression, such as feeling helpless or useless, being unable to function effectively,
poor concentration, and interpersonal disinterest, make it highly unlikely that a
positive and productive relationship will develop between parent and child (Factor
and Wolfe 1990). Depression has been associated with child physical abuse
(Whipple & Webster-Stratton, 1991). Mothers with depression are less able to interact
effectively with their children, and irritability and anger often result when interacting
with children (Myers, 2002). Weissman, Paykel and Klerman (1972) conducted a
number of observational studies of the interactions between depressed mothers and
their offspring. They concluded that these children were deprived of normal
involvement with their parents. Parent-child interactions in these families were
marked by disinterest, less involvement, and poor communication. Furthermore,
studies (Leschied, et al., 2005) have found that maternal depression is related to
increased involvement with child welfare agencies and with poor child outcomes
such as attention deficit disorder, conduct disorder, and poor emotional adjustment.
Postpartum depression can be common in women. Across Healthy Families sites,
depression is frequently present with about 20% of mothers reporting depression
(Diaz, et al., 2004; Jacobs et al., (2005) report that half of teen mothers served in the
Massachusetts Healthy Families program reported depressive symptoms in the
clinical range. Reducing depression can have a wide range of positive outcomes for
both mothers and children. As the following exhibit shows, changes in depression
were significant from baseline to 6 months and from baseline to 12 months for HFAz
program participants.
Exhibit 20. Change in Depression
Significant Significant Sub- improvement Effect improvement Effect
Significance Significance scale from baseline size from baseline size
to 6 months to 12 months
Depression ���� .000 (.20) ���� .000 (.23)

Healthy Families Arizona Annual Evaluation Report 2008 42
Personal Care
Home visitors identified increasing the parents’ abilities to care for themselves as an
important goal in their work with families in the Healthy Families program. The
personal care subscale provides information about the extent to which the mother is
taking care of herself and meeting some of her own wants and needs. Often parents
feel trapped by the birth of a child and have not made the adjustments necessary to
feel good about themselves in their new role as parents—enhancing their sense of
personal care can help address this concern. Research that suggests children are at
higher risk for maltreatment during times of instability and stress (Wolfe, 1998), and
if parents are unable to care adequately for themselves, their stress may be higher.
There were no significant improvements from baseline to 6 month assessment and no
significant improvements from baseline to 12 month assessment on the Personal Care
subscale. This suggests workers should focus additional efforts on creative ways to
support personal care. However, it is also likely that the baby’s development
interacts with the mothers attention to personal care—as the baby changes, he or she
will require different kinds of parenting effort and it will affect available time for
personal care.
Exhibit 21. Change in Personal Care
Significant Significant Sub improvement Effect improvement Effect
Significance Significance scale from baseline size from baseline size
to 6 months to 12 months
Personal none none care
Mobilizing Resources
The prevailing social, cultural, and economic pressures that challenge families should
be examined when developing strategies to support families. There are many factors
at the societal level, such as poverty, unemployment, and norms that support
violence, that combine to make child-rearing difficult. (Wolfe, 1998: Prilletensky, et
al., 2001). Being a single parent, living in poverty, being unemployed, and/or living
in a stressed environment are more even more difficult when there are few resources
to help family members cope with these stressors. Social services often emphasize
“wrap around” services and resources that can be brought to families to help them
cope and parent more effectively. Research has demonstrated that having multiple
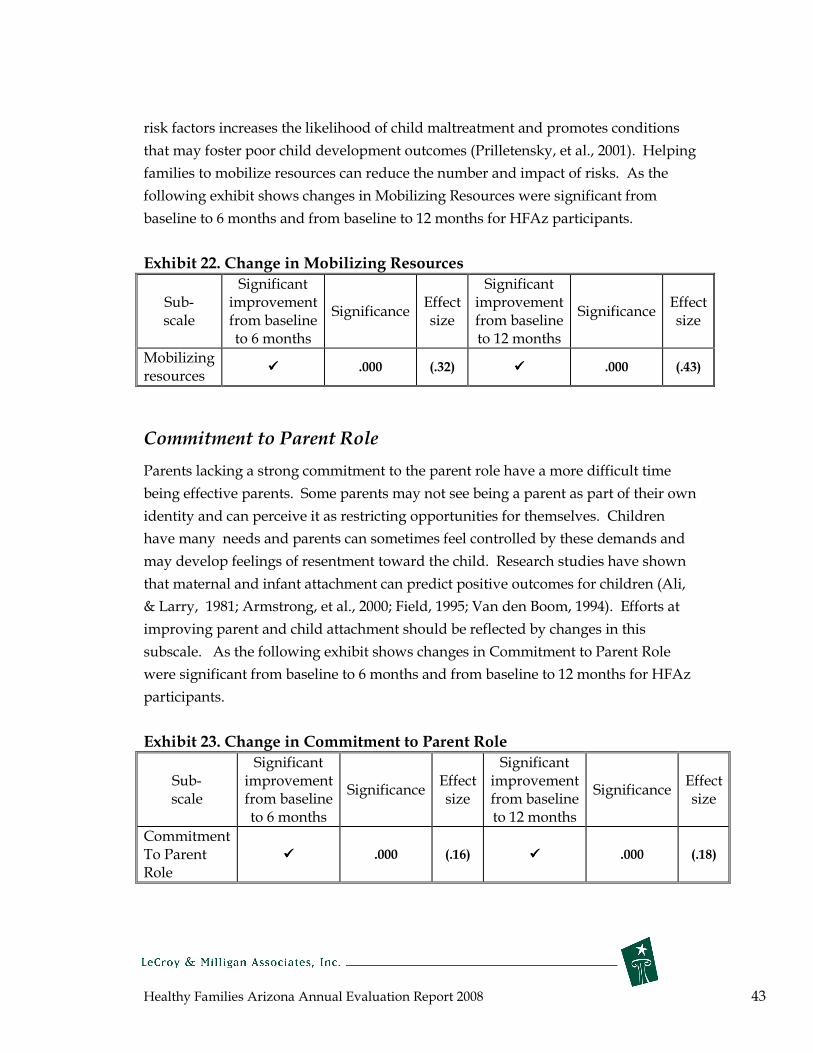
Healthy Families Arizona Annual Evaluation Report 2008 43
risk factors increases the likelihood of child maltreatment and promotes conditions
that may foster poor child development outcomes (Prilletensky, et al., 2001). Helping
families to mobilize resources can reduce the number and impact of risks. As the
following exhibit shows changes in Mobilizing Resources were significant from
baseline to 6 months and from baseline to 12 months for HFAz participants.
Exhibit 22. Change in Mobilizing Resources
Significant Significant Sub- improvement Effect improvement Effect
Significance Significance scale from baseline size from baseline size
to 6 months to 12 months
Mobilizing ���� .000 (.32) ���� .000 (.43)
resources
Commitment to Parent Role
Parents lacking a strong commitment to the parent role have a more difficult time
being effective parents. Some parents may not see being a parent as part of their own
identity and can perceive it as restricting opportunities for themselves. Children
have many needs and parents can sometimes feel controlled by these demands and
may develop feelings of resentment toward the child. Research studies have shown
that maternal and infant attachment can predict positive outcomes for children (Ali,
& Larry, 1981; Armstrong, et al., 2000; Field, 1995; Van den Boom, 1994). Efforts at
improving parent and child attachment should be reflected by changes in this
subscale. As the following exhibit shows changes in Commitment to Parent Role
were significant from baseline to 6 months and from baseline to 12 months for HFAz
participants.
Exhibit 23. Change in Commitment to Parent Role
Significant Significant Sub- improvement Effect improvement Effect
Significance Significance scale from baseline size from baseline size
to 6 months to 12 months
Commitment To Parent ���� .000 (.16) ���� .000 (.18) Role
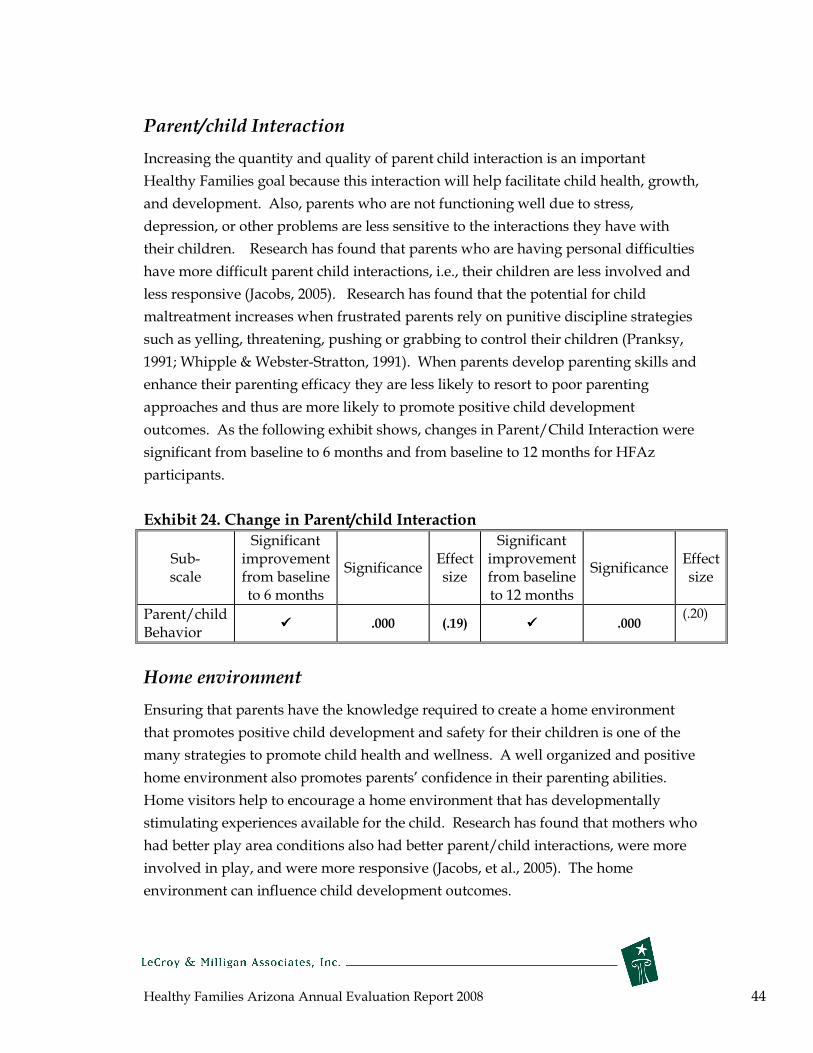
Healthy Families Arizona Annual Evaluation Report 2008 44
Parent/child Interaction
Increasing the quantity and quality of parent child interaction is an important
Healthy Families goal because this interaction will help facilitate child health, growth,
and development. Also, parents who are not functioning well due to stress,
depression, or other problems are less sensitive to the interactions they have with
their children. Research has found that parents who are having personal difficulties
have more difficult parent child interactions, i.e., their children are less involved and
less responsive (Jacobs, 2005). Research has found that the potential for child
maltreatment increases when frustrated parents rely on punitive discipline strategies
such as yelling, threatening, pushing or grabbing to control their children (Pranksy,
1991; Whipple & Webster-Stratton, 1991). When parents develop parenting skills and
enhance their parenting efficacy they are less likely to resort to poor parenting
approaches and thus are more likely to promote positive child development
outcomes. As the following exhibit shows, changes in Parent/Child Interaction were
significant from baseline to 6 months and from baseline to 12 months for HFAz
participants.
Exhibit 24. Change in Parent/child Interaction
Significant Significant Sub- improvement Effect improvement Effect
Significance Significance scale from baseline size from baseline size
to 6 months to 12 months
Parent/child (.20)
Behavior ���� .000 (.19) ���� .000
Home environment
Ensuring that parents have the knowledge required to create a home environment
that promotes positive child development and safety for their children is one of the
many strategies to promote child health and wellness. A well organized and positive
home environment also promotes parents’ confidence in their parenting abilities.
Home visitors help to encourage a home environment that has developmentally
stimulating experiences available for the child. Research has found that mothers who
had better play area conditions also had better parent/child interactions, were more
involved in play, and were more responsive (Jacobs, et al., 2005). The home
environment can influence child development outcomes.
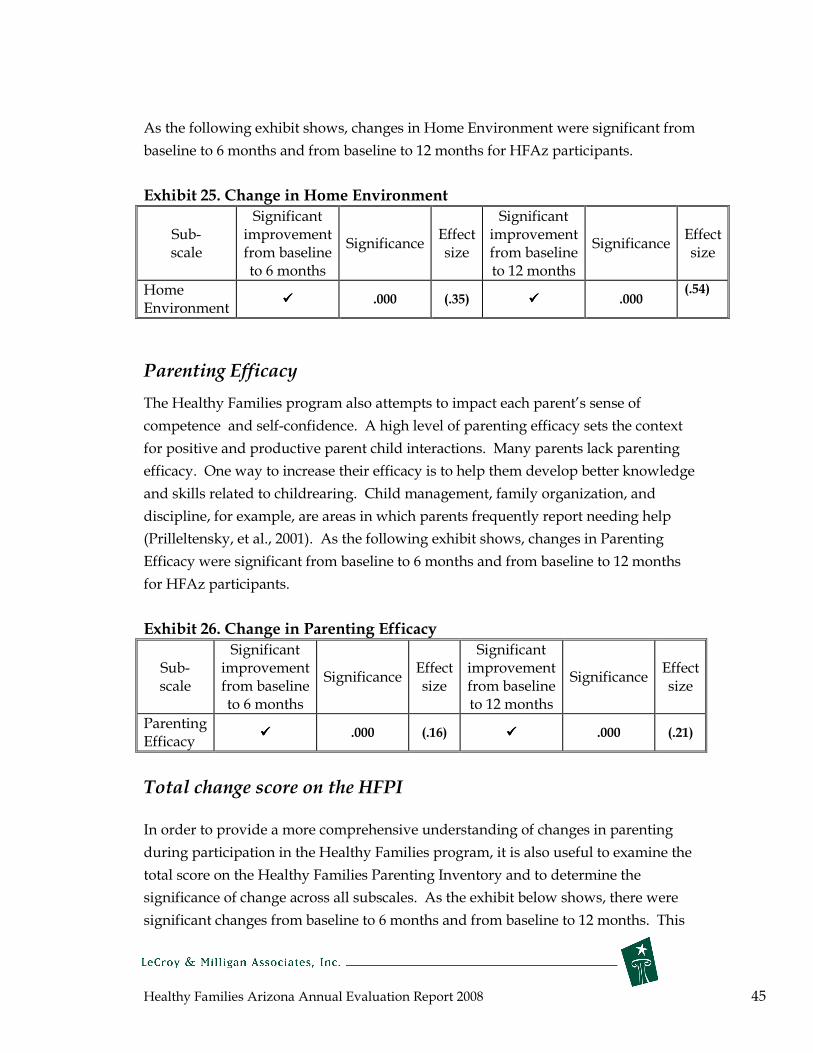
Healthy Families Arizona Annual Evaluation Report 2008 45
As the following exhibit shows, changes in Home Environment were significant from
baseline to 6 months and from baseline to 12 months for HFAz participants.
Exhibit 25. Change in Home Environment
Significant Significant Sub- improvement Effect improvement Effect
Significance Significance scale from baseline size from baseline size
to 6 months to 12 months
Home (.54)
Environment ���� .000 (.35) ���� .000
Parenting Efficacy
The Healthy Families program also attempts to impact each parent’s sense of
competence and self-confidence. A high level of parenting efficacy sets the context
for positive and productive parent child interactions. Many parents lack parenting
efficacy. One way to increase their efficacy is to help them develop better knowledge
and skills related to childrearing. Child management, family organization, and
discipline, for example, are areas in which parents frequently report needing help
(Prilleltensky, et al., 2001). As the following exhibit shows, changes in Parenting
Efficacy were significant from baseline to 6 months and from baseline to 12 months
for HFAz participants.
Exhibit 26. Change in Parenting Efficacy
Sub- scale
Significant improvement from baseline to 6 months
Significance Effect size
Significant improvement from baseline to 12 months
Significance Effect size
Parenting Efficacy
���� .000 (.16) ���� .000 (.21)
Total change score on the HFPI
In order to provide a more comprehensive understanding of changes in parenting
during participation in the Healthy Families program, it is also useful to examine the
total score on the Healthy Families Parenting Inventory and to determine the
significance of change across all subscales. As the exhibit below shows, there were
significant changes from baseline to 6 months and from baseline to 12 months. This

Healthy Families Arizona Annual Evaluation Report 2008 46
significance and the effect sizes support the conclusion that important changes were
taking place among families. Overall, the percent of individuals who showed
positive change from baseline to 12 months on the total score was 67 percent.
Exhibit 27. Overall Change in Healthy Families Parenting Inventory
outcomes
Significant Significant Sub- improvement Effect improvement Effect
Significance Significance scale from baseline size from baseline size
to 6 months to 12 months
Total Scale
���� .000 (.29) ���� .000 (.32)
Child abuse and neglect
This report includes data from CHILDS on the rates of child abuse and neglect for
Healthy Families Arizona participants. It is important to acknowledge that using
official child abuse data as an indicator of program success is complex and is unlikely
to fully answer the question about the effectiveness of Healthy Families in preventing
child abuse. There are several reasons for these limitations. First, child abuse is an
event that occurs infrequently and, therefore, changes are difficult to detect with
statistical methods. Second, using official incidents of child abuse and neglect does
not necessarily reflect actual behavior—using only reported and substantiated
incidents of abuse only captures incidents that rise to that level; some incidents of
child abuse or neglect are undetected and thus an fully accurate count is not
possible. Third, using official data requires a process whereby cases are “matched”
on available information such as mother’s name, social security number, and date of
child’s birth. When any of this information is missing such as the legal name, the
accuracy of the match decreases. Finally, because home visitors are trained in the
warning signs of abuse and neglect and are required to report abuse or neglect when
it is observed, this creates a “surveillance” effect—what might have gone unreported
had there been no home visitor shows up in the official data. Because of these issues,
many programs are beginning to not report actual rates of child abuse and neglect as
the standard, but instead rely on measures that document reducing risk factors and
increasing protective factors—factors shown to predict child maltreatment.

Healthy Families Arizona Annual Evaluation Report 2008 47
Because families with a history of child abuse and neglect are no longer excluded
from program participation, we expected to see an increase in substantiated reports
of child abuse. However, this was clearly not the case this year. For this year’s
report, 98.9% of the Healthy Families matched cases were without a substantiated
report as can be seen in Exhibit 28. Although 98.9% of the Healthy Families
participants have no substantiated reports, 43 of the families did have a substantiated
report (1.1% of families). Of these cases 29 were neglect, 10 were physical abuse, 3
were sexual abuse, and 1 was a case of child death. A comparison group was created
from families that were initially enrolled, but not successfully “engaged” in the
Healthy Families program. As the exhibit shows there were no clear differences
between the two groups.
Exhibit 28. Percent of families showing no child abuse and neglect
incidences Group Percent Without
Substantiated Report 2006-2007
Percent Without Substantiated Report
2007-2008 (n = 3,301) (n = 3,885)
All Families 99.7% 98.9% Comparison Group 98.6% 98.7%
Child Development and Wellness
Promoting optimal child growth and development is a key aspect of the Healthy
Families program. Home visitors are in a strategic position to help families obtain
access to health resources and promote wellness. Three indicators of child
development and wellness are reported in this report: immunizations, access to
medical doctors, and safety practices in the home.
Immunizations
Immunization of children is a primary public health objective nationwide —it is a
cornerstone of Healthy People 2010 and is also promoted by the Arizona Healthy
Families program. Healthy Families Arizona supports children obtaining all their
necessary immunizations which are key to preventing debilitating diseases. HFAz
home visitors regularly check each family’s immunization booklet to assess
completion of immunizations. Exhibit 29 presents the past three years of data on

Healthy Families Arizona Annual Evaluation Report 2008 48
immunization rates for the 2,4,6, and 12 month immunization periods. For 2008,
approximately 87% of the children in the Healthy Families Arizona program, for
whom we had data on immunizations, were reported to have received all 4
immunizations in the recommended series given by 18 months of age. This
percentage exceeds the immunization rate for 2-year olds in Arizona for 2006 (79%)
and the immunization rate for 2-year-olds in AHCCCS (82%) for 2006. Overall, this
suggests the program is successfully promoting immunization for the children served
by Healthy Families Arizona.
Exhibit 29. Immunization Rate of Healthy Families Arizona Children
Immunization Period
Percent Immunized
2006
Percent Immunized
2007
Percent Immunized
2008 Immunization
Rate for 2-year-olds in
Arizona (2006)*
Immunization Rate for
2-year-olds in AHCCCS in Arizona (2006)**
2 month 86.4% 91.3% 91.3%
4 month 83.9% 88.4% 88.5%
6 month 69.5% 77.7% 75.9%
12 month 87.4% 87.4% 90.2%
Received all 4 in the series
83.5% 87.5% 87.4% 79.0% 82.0% by 18 months of age *Source: 2006 data from the Arizona Department of Health Services **Source: 2007 report to Arizona Early Childhood Development and Health Board
Access to Medical Doctors
Health care access is an issue affecting children across the nation and linking children
to a primary medical care professional is a key to promoting health and wellness in
families. The Healthy Families program tracks the percent of families that are
considered linked to medical doctors. As the following exhibit shows, a large percent
of the families, over 94% across all time periods, for whom we had data on, are linked
to doctors.
Exhibit 30. Percentage of Children Linked to a Medical Doctor
6
months 12
months 18
months 24
months Percent of children with medical home 2006* 97.5% 97.1% 96.4% 97.8% Percent of children with medical home 2007* 96.0% 94.1% 92.4% 94.7% Percent of children with medical home 2008** 95.6% 96.7% 94.4% 94.0% *Postnatal only and **Prenatal and postnatal
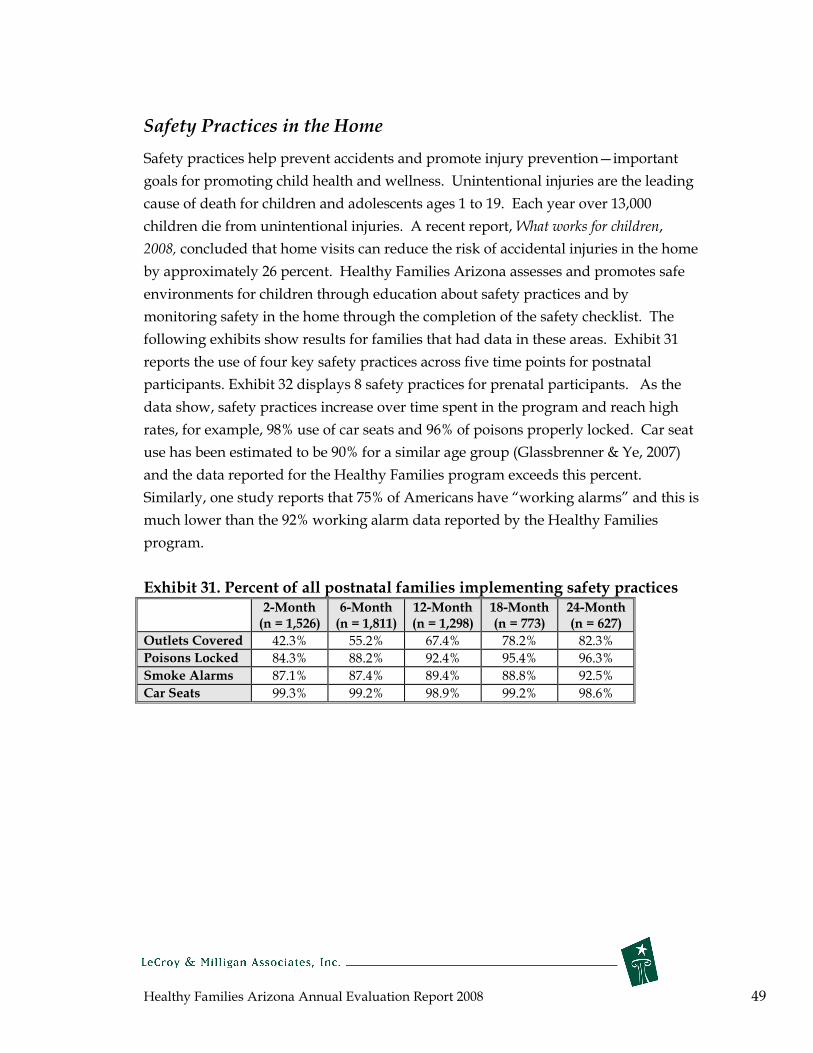
Healthy Families Arizona Annual Evaluation Report 2008 49
Safety Practices in the Home
Safety practices help prevent accidents and promote injury prevention—important
goals for promoting child health and wellness. Unintentional injuries are the leading
cause of death for children and adolescents ages 1 to 19. Each year over 13,000
children die from unintentional injuries. A recent report, What works for children,
2008, concluded that home visits can reduce the risk of accidental injuries in the home
by approximately 26 percent. Healthy Families Arizona assesses and promotes safe
environments for children through education about safety practices and by
monitoring safety in the home through the completion of the safety checklist. The
following exhibits show results for families that had data in these areas. Exhibit 31
reports the use of four key safety practices across five time points for postnatal
participants. Exhibit 32 displays 8 safety practices for prenatal participants. As the
data show, safety practices increase over time spent in the program and reach high
rates, for example, 98% use of car seats and 96% of poisons properly locked. Car seat
use has been estimated to be 90% for a similar age group (Glassbrenner & Ye, 2007)
and the data reported for the Healthy Families program exceeds this percent.
Similarly, one study reports that 75% of Americans have “working alarms” and this is
much lower than the 92% working alarm data reported by the Healthy Families
program.
Exhibit 31. Percent of all postnatal families implementing safety practices 2-Month 6-Month 12-Month 18-Month 24-Month
(n = 1,526) (n = 1,811) (n = 1,298) (n = 773) (n = 627)
Outlets Covered 42.3% 55.2% 67.4% 78.2% 82.3% Poisons Locked 84.3% 88.2% 92.4% 95.4% 96.3%
Smoke Alarms 87.1% 87.4% 89.4% 88.8% 92.5%
Car Seats 99.3% 99.2% 98.9% 99.2% 98.6%

Healthy Families Arizona Annual Evaluation Report 2008 50
Exhibit 32. Percent of prenatal families implementing prenatal safety
practices (N=241)
76.5
94.2
84.4
77.4
90.1
92.2
93
92.1
0 10 20 30 40 50 60 70 80 90 100
Follow s nutritional guidelines
Avoids alcohol and drugs
Avoids contact w ith cigarette smoke
Avoids stress
Attends all preantal care visits
Calls doctor w ith concerns
Consults medical doctor about use of medications
Has been tested for STDs
Percent
Mothers’ Health, Education, and Employment
The Healthy Families’ model extends beyond parenting outcomes and also attempts
to influence maternal life course outcomes. The Healthy Families program has the
opportunity to encourage and support families to seek new educational
opportunities, complete their high school education, obtain greater economic self-
sufficiency, and obtain better paying and better quality jobs.
Subsequent Pregnancies and Birth Spacing
The goal of promoting mothers’ health is addressed by efforts to prevent repeat
pregnancies and promote longer birth spacing for mothers. Multiple births for some
families can represent increased stress and parenting difficulties, especially if the
birth is unwanted or unplanned. The following exhibit shows that over the past three
years, the percent of HFAz mothers who reported subsequent pregnancies hovers
around 11 percent. Of the 11.5% (n=484) of mothers who had a subsequent
pregnancy in 2008, 29% (n=139) were 19 or younger.

Healthy Families Arizona Annual Evaluation Report 2008 51
Exhibit 33. Percentage of Mothers who reported subsequent pregnancies
2006 2007 2008
Percent of mothers with subsequent pregnancies
11.8% 10.4% 11.5%
Mothers with greater birth spacing have fewer pregnancy complications and are less
likely to give birth to low birth weight or premature babies (Kallan, 1997). The health
benefits of birth spacing are considerable and Healthy Families can support the new
public campaign about birth spacing that says, “three to five years saves lives” by
educating families about the benefits of longer time periods between births. The
following exhibit shows the length of time to subsequent pregnancy for those
mothers who do have subsequent births. The most important data is the percent of
mothers who waited over 24 months between births. This percent decreased 5.6%
from 2006 to 2007, and decreased by another 2.7% from 2007 to 2008, which means
that a smaller percentage of women are adhering to the “three to five years saves
lives” philosophy. Because this health benchmark has not gone in the desired
direction, more training for home visitors to better address this issue should be
considered.
Exhibit 34. Length of Time to Subsequent Pregnancy for Those Families
with Subsequent Births Length of Time
Subsequent Pregnancy
to 2005 Percent of Mother
2006 Percent of Mother
2007 Percent of Mother
2008 Percent of Mother
1 to 12 mos. 33.3% 37.7% 42.1% 40.2%
13 to 24 mos. 42.3% 38.1% 39.3% 43.9%
Over 24 mos. 24.4% 24.2% 18.6% 15.9%
School , Educational enrollment, and Employment
School and educational obtainment are also important to consider when examining
the program’s potential impact on maternal life course outcomes. Increased
education is associated with better overall well-being and greater family stability. As
the following Exhibit 35 shows, at 6 months, 21% of the mothers are enrolled in
school and that percent grows to almost 32% for mothers who participate in the
program at 36 months.

Healthy Families Arizona Annual Evaluation Report 2008 52
Exhibit 35. Percent of Mothers enrolled in school-2008
Percent enrolled part-
time
Percent enrolled fulltime
6 month 11.2% 21.2%
12 month 12.3% 24.9%
24month 13.6% 30.8%
36 month 13.3% 31.7%
Mothers who are actively engaged in the program show an increasing rate of
employment from initial assessment to 12 months of program participation. Almost
40% of the mothers are employed at 12 months and this is similar to the national
estimate of employment for mothers of young children, which is approximately 50%.
While increasing employment and income is fundamental for family well-being there
are complex realities facing families as they begin to increase their earnings. One
concern is that as mothers increase their income, there is the potential for families to
become ineligible for AHCCCS health insurance and also not be covered by
employers. Furthermore, the importance of home visitors working with families in
obtaining quality child care is critical given the limited child care options for families
with low incomes.
Exhibit 36. Mother’s employment status
100%
80%
60%
40%
20%
0%
Baseline 6 months 12 months
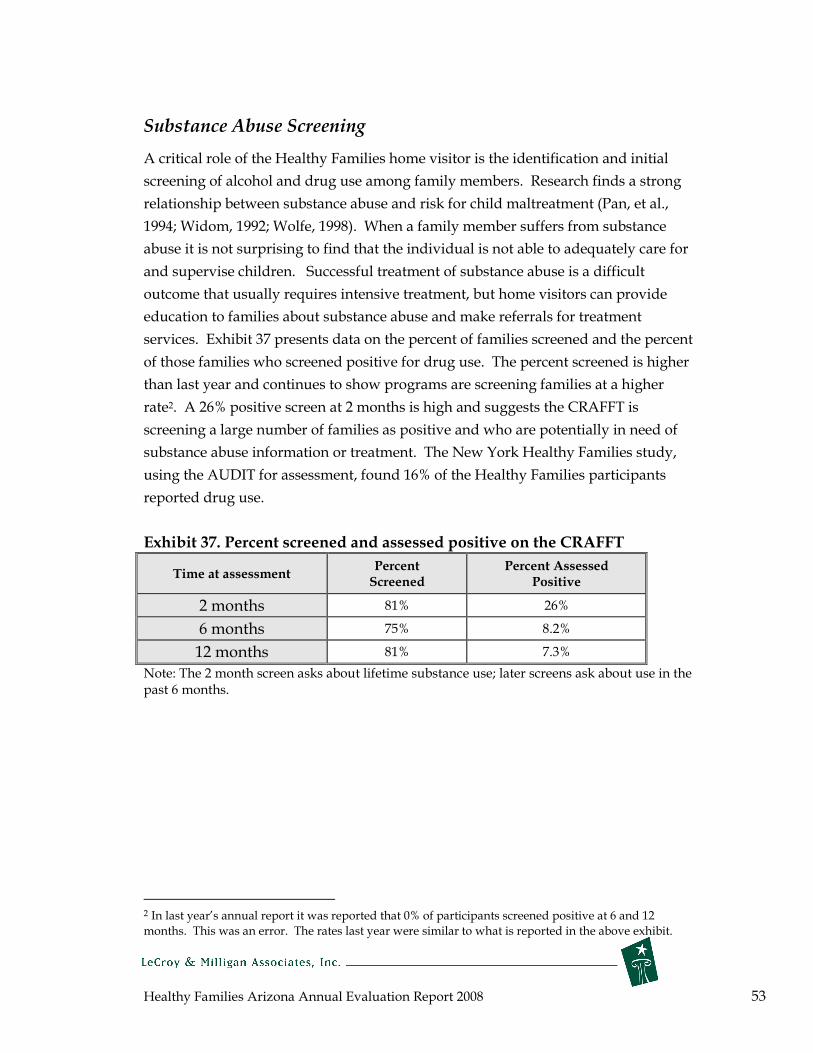
Healthy Families Arizona Annual Evaluation Report 2008 53
Substance Abuse Screening
A critical role of the Healthy Families home visitor is the identification and initial
screening of alcohol and drug use among family members. Research finds a strong
relationship between substance abuse and risk for child maltreatment (Pan, et al.,
1994; Widom, 1992; Wolfe, 1998). When a family member suffers from substance
abuse it is not surprising to find that the individual is not able to adequately care for
and supervise children. Successful treatment of substance abuse is a difficult
outcome that usually requires intensive treatment, but home visitors can provide
education to families about substance abuse and make referrals for treatment
services. Exhibit 37 presents data on the percent of families screened and the percent
of those families who screened positive for drug use. The percent screened is higher
than last year and continues to show programs are screening families at a higher
rate2. A 26% positive screen at 2 months is high and suggests the CRAFFT is
screening a large number of families as positive and who are potentially in need of
substance abuse information or treatment. The New York Healthy Families study,
using the AUDIT for assessment, found 16% of the Healthy Families participants
reported drug use.
Exhibit 37. Percent screened and assessed positive on the CRAFFT
Time at assessment Percent Screened
Percent Assessed Positive
2 months 81% 26%
6 months 75% 8.2%
12 months 81% 7.3%
Note: The 2 month screen asks about lifetime substance use; later screens ask about use in the past 6 months.
2 In last year’s annual report it was reported that 0% of participants screened positive at 6 and 12 months. This was an error. The rates last year were similar to what is reported in the above exhibit.
Healthy Families Arizona Annual Evaluation Report 2008 54
Continuous Program Improvement
The next sections of the report focus on the ongoing efforts toward continuous
program improvement for program learning and decision making. This section
includes information on program and policy updates for 2007-2008, the Building
Bridges newsletter, and knowledge contributions to the field. The following section
includes special sub-studies which focus on prenatal efforts, outreach efforts, and a
closer examination of families at higher risk for child abuse and neglect.
Program and Policy Updates
Healthy Families Arizona programs are responding to the Revised 2008 – 2010 Accreditation Standards from Healthy Families America/Prevent Child Abuse America.
Healthy Families Arizona programs are working diligently to prepare for accreditation which is scheduled for 2009. There are two sets of accreditation standards; one set of standards is designed specifically for the statewide system to assure that the system is performing to best practice measures; the other set of standards is designed to be completed by the individual Healthy Families Arizona (HFAz) programs. In order for Healthy Families Arizona programs to be accredited, both the state system and the programs within the system must meet standards of best practice.
The HFAz state system accreditation criteria include five functional areas. These functional areas include: 1) adherence to a system of statewide policies, 2) provision of both training and technical assistance, 3) monitoring and quality assurance services, 4) utilization of evaluation results to improve practice, and 5) administration services that assure appropriate oversight of service implementation.
The individual programs follow the best practice standards that operationalize the Healthy Families America 12 Critical Elements. These Critical Elements are broken into three major service activities: 1) initiation of services, 2) home visiting services, and 3) administration. There are 119 standards that indicate best practice-based upon over 30 years of research.
There are three major steps in the accreditation process. First, both the HFAz state system and the individual programs prepare a written self-study that enables HFAz to take a critical look at the services offered and improve practice as needed. This written self-study is submitted to the national office. The second step requires site visits by nationally trained peer reviewers. The HFAz state system receives a site visit first, and once the system meets the requirements for accreditation, the individual programs receive a site visit. The peer reviewer pairs that come to Arizona from other states and serve as outside, objective observers. Following the site visit, each program will receive an Accreditation Site Visit Report that will detail
Healthy Families Arizona Annual Evaluation Report 2008 55
the strengths of the program as well as areas in which services can be improved. Finally, each program can demonstrate improvement in practice and formally respond to the Healthy Families America Accreditation Panel, who will make the final decision to accredit. Peer review site visits are tentatively scheduled for May 2009 for the statewide system, and for July and August 2009 for the individual program sites.
Healthy Families Arizona Implements Analyses and Plans for Improvement During every supervisor meeting from October 2007 to present, the HFAz Accreditation Committee has offered training to programs to assist them in preparing their self-studies for accreditation. There are five formal analyses of program services that are a part of the accreditation process. These include program acceptance, family retention, staff retention, cultural sensitivity, and progress towards accomplishment of program goals. During the past year, the Accreditation Committee has prepared a sample and a template for each of these five analyses to assist programs in developing their own for their self-study. The analyses are very helpful to identify patterns and trends that impact quality of services and assist programs in improving their practices. Additionally, the Committee has reviewed these analyses and plans for improvement and offered feedback to strengthen each.
Advanced Training in Early Literacy
HFAz implemented the first series of advanced trainings for more seasoned staff in 2007 - 2008. Early literacy is directly related to language and social-emotional development, which is a foundation for school readiness. Early literacy and language acquisition are supported within the context of parent-child interactions and relationships. The communication between parents and their children is essential to determining relationship issues that can be addressed in a strength-based manner. Supporting parents in understanding how their child communicates within their unique developmental capacity offers home visitors and supervisors innovative methods of interventions or activities utilizing videotapes and observations. A series of three one-day sessions were offered through the HFAz semi-annual Institutes with an interim session offered in July. In order to attend the training, each Supervisor was encouraged to bring one or two home visitors and integrate activities over a seven-month timeframe. Training objectives included incorporating culture within language basics, assessment techniques anchored in observing, waiting, and listening, and how to adapt activities to further language/social-emotional development.
Utilizing the Initial Assessment as a Means to Promote Positive Change
Healthy Families Arizona has been focusing on how to use the information gathered from parents during initial contacts to develop opportunities to promote positive change in families based upon the concept of “change-talk”. Using “change-talk” allows staff to immediately begin to address some of the issues that a parent wishes to change. Wording such as “I do not want to parent the way my parents did” offers

Healthy Families Arizona Annual Evaluation Report 2008 56
important opportunities for the supervisor and home visitor to address issues very early on in home visiting services by exploring more what the parent means and constructing goals with the parent about what they want to do differently. Home visitors are encouraged to use motivational interviewing techniques to highlight discrepancies between what parents actually practice and how they want to be as parents. These goals become part of the guide to service delivery.
Final Revision of the Supervisor CORE Training
The Healthy Families Arizona Program Specialist team completed final revisions for the three sessions of Supervisor CORE training, each session designed to take place every six months for eighteen months. Each training provides core concepts of reflective, relationship-based practice which builds on each supervisor’s skills using the HFAz Supervisor Professional Development Guide. Training methods include a combination of lecture, use of videotapes, scenarios for practice, issues that supervisors are currently addressing, and self-assessment. Materials are designed to integrate all training content offered within the system and to anchor the HFAz philosophical approach in practice.
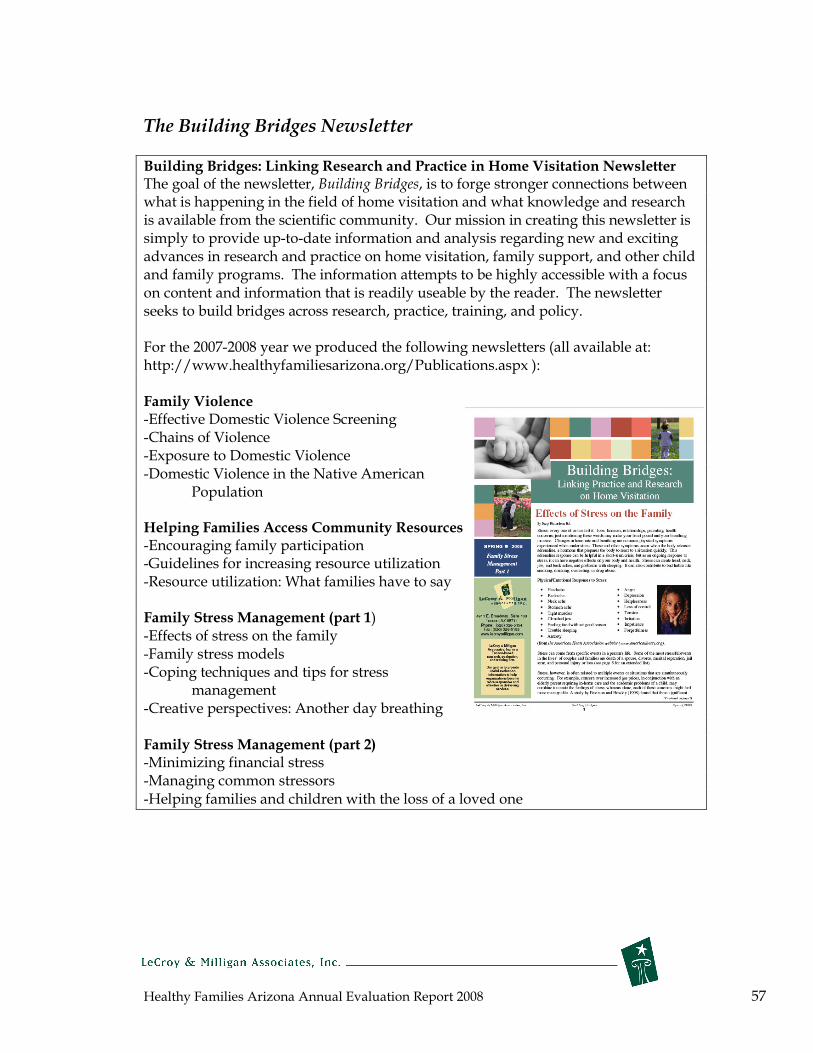
Healthy Families Arizona Annual Evaluation Report 2008 57
The Building Bridges Newsletter
Building Bridges: Linking Research and Practice in Home Visitation Newsletter The goal of the newsletter, Building Bridges, is to forge stronger connections between what is happening in the field of home visitation and what knowledge and research is available from the scientific community. Our mission in creating this newsletter is simply to provide up-to-date information and analysis regarding new and exciting advances in research and practice on home visitation, family support, and other child and family programs. The information attempts to be highly accessible with a focus on content and information that is readily useable by the reader. The newsletter seeks to build bridges across research, practice, training, and policy.
For the 2007-2008 year we produced the following newsletters (all available at: http://www.healthyfamiliesarizona.org/Publications.aspx ): Family Violence -Effective Domestic Violence Screening -Chains of Violence -Exposure to Domestic Violence -Domestic Violence in the Native American Population Helping Families Access Community Resources -Encouraging family participation -Guidelines for increasing resource utilization -Resource utilization: What families have to say Family Stress Management (part 1) -Effects of stress on the family -Family stress models -Coping techniques and tips for stress management -Creative perspectives: Another day breathing Family Stress Management (part 2) -Minimizing financial stress -Managing common stressors -Helping families and children with the loss of a loved one
Healthy Families Arizona Annual Evaluation Report 2008 58
Knowledge Contributions to the Field
In November of 2007, the Journal of Prevention and Intervention in the Community,
published a special issue entitled: Healthy Families America: Initiative: Integrating
Research, Theory, and Practice. Members of the evaluation team made the following
contributions to the special issue:
• Evaluation of Healthy Families Arizona: A Multisite Home Visitation Program
(Judy Krysik and Craig W. LeCroy)
• The Role of Community in Facilitating Service Utilization (Debra Daro, Karen
McCurdy, Lydia Falconnier, Carolyn Winje, Elizabeth Anisfeld, Aphra
Katzev, Ann Keim, Craig W. LeCroy, William McGuigan, and Carnot Nelson)
The evaluation team has also been involved in many aspects of program
improvement that will be shared with the research community. The following
manuscripts have been written and are being reviewed for possible publication:
• The Development and Initial Validation of an Outcome Measure for Home Visitation:
The Healthy Families Parenting Inventory (Judy Krysik and Craig W. LeCroy)
• Measurement Issues in Home Visitation: A Research Note (Craig W. LeCroy and
Judy Krysik)
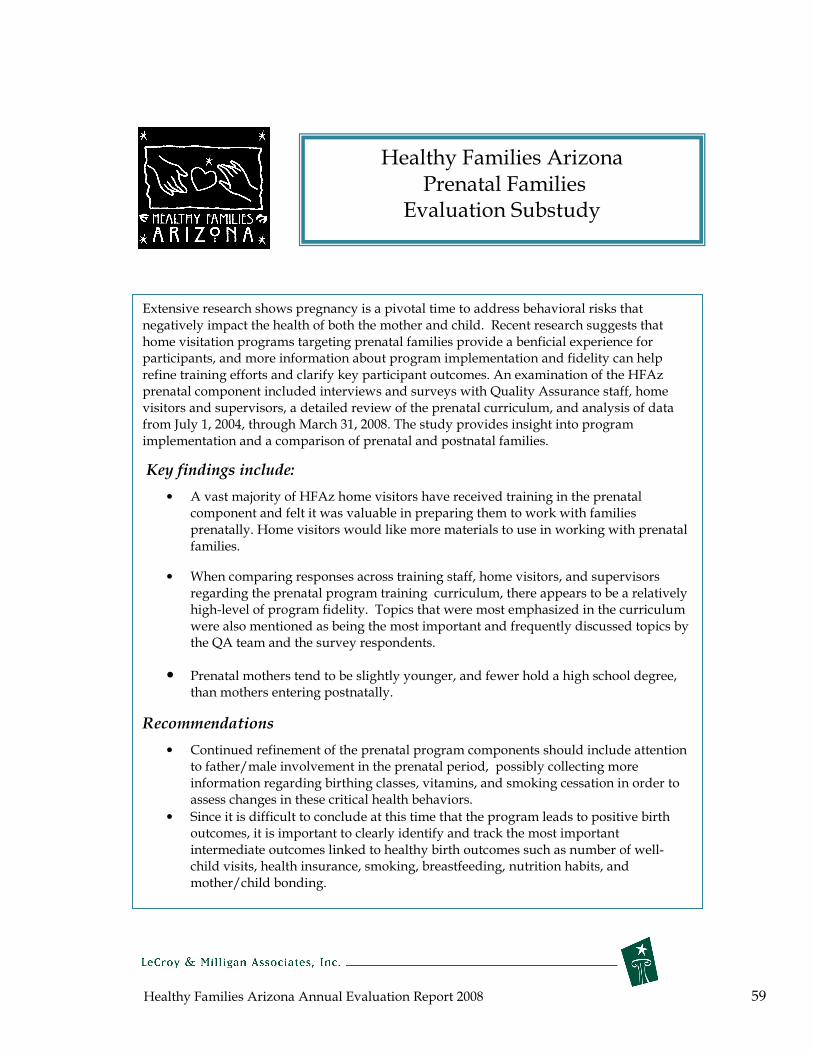
Healthy Families Arizona Annual Evaluation Report 2008 59
Healthy Families Arizona Prenatal Families
Evaluation Substudy
Extensive research shows pregnancy is a pivotal time to address behavioral risks that negatively impact the health of both the mother and child. Recent research suggests that home visitation programs targeting prenatal families provide a benficial experience for participants, and more information about program implementation and fidelity can help refine training efforts and clarify key participant outcomes. An examination of the HFAz prenatal component included interviews and surveys with Quality Assurance staff, home visitors and supervisors, a detailed review of the prenatal curriculum, and analysis of data from July 1, 2004, through March 31, 2008. The study provides insight into program implementation and a comparison of prenatal and postnatal families.
Key findings include:
• A vast majority of HFAz home visitors have received training in the prenatal component and felt it was valuable in preparing them to work with families prenatally. Home visitors would like more materials to use in working with prenatal families.
• When comparing responses across training staff, home visitors, and supervisors regarding the prenatal program training curriculum, there appears to be a relatively high-level of program fidelity. Topics that were most emphasized in the curriculum were also mentioned as being the most important and frequently discussed topics by the QA team and the survey respondents.
• Prenatal mothers tend to be slightly younger, and fewer hold a high school degree, than mothers entering postnatally.
Recommendations
• Continued refinement of the prenatal program components should include attention to father/male involvement in the prenatal period, possibly collecting more information regarding birthing classes, vitamins, and smoking cessation in order to assess changes in these critical health behaviors.
• Since it is difficult to conclude at this time that the program leads to positive birth outcomes, it is important to clearly identify and track the most important intermediate outcomes linked to healthy birth outcomes such as number of well-child visits, health insurance, smoking, breastfeeding, nutrition habits, and mother/child bonding.

Healthy Families Arizona Annual Evaluation Report 2008 60
Prenatal Sub-study
Extensive research shows pregnancy is a pivotal time to address behavioral risks that
negatively impact the health of both the mother and child (Herzig, Danley, Jackson,
Peterson, Chamberlain, and Gerbert, 2005). Harmful health activities such as
smoking, poor nutrition, and substance use are known risk factors for poor birth
outcomes such as spontaneous abortions, low birth weight, preterm delivery, and
eventually cognitive and behavioral problems in children (Chomitz, Cheung, and
Lieberman, 1995). Moreover, pregnant women in high stress situations often deliver
infants earlier and deliver infants who weigh less (Lobel, Cannella, DeVincent,
Schneider, Graham, and Meyer, 2008). Data from medical models show that
screening and counseling during pregnancy decrease risky behaviors (Herzig,
Danley, Jackson, Petersen, Chamberlain, and Gerbert, 2005). This theory extends to
the home visitation models as well, with the idea being that case managers following
evidence-based curricula will demonstrate improved pregnancy outcomes for the
mother and child.
Recent research suggests that home visitation programs targeting prenatal families
provide a beneficial experience for participants. The Healthy Families America
Prenatal Project concluded that parents found information on bonding with their
babies, setting personal goals, stress management, and information for fathers most
useful to their families (Prevent Child Abuse America, 2004). While participants
report positive experiences with home visitation programs, many evaluations find it
difficult to pinpoint and report positive outcomes attributed to the programs
themselves (Culp, Culp, Hechtner-Galvin, Howell, Saathoff-Wells, and Marr, 2004). It
becomes the formidable task of evaluations of home visitation programs like Healthy
Families to examine and analyze the effects of home visitation on prenatal families.
As a result, the evaluation team closely examined the HFAz prenatal component
during this past year. The following provides review of both process evaluation and
outcome evaluation measures as they apply to prenatal families. To gain further
insight into the prenatal component of Healthy Families Arizona, the evaluation team
interviewed HFAz Quality Assurance (QA) team members, who provide the prenatal
training statewide. A detailed review of the prenatal curriculum was done, which
highlighted key concepts stressed during program enrollment. Evaluators also
surveyed over 200 program staff statewide about their opinions regarding the
Healthy Families Arizona Annual Evaluation Report 2008 61
prenatal component and to gain a sense of program implementation. An extensive
review of data from July 1, 2004, through March 31, 2008, provides a direct
comparison of prenatal and postnatal families. The data profile includes basic
demographic information as well as birth and program outcomes. Finally,
conclusions are presented that encapsulate the lessons learned through this extensive
review to inform the Healthy Families program.
Interview with Quality Assurance Team Members
In April 2008, members of the evaluation team conducted an interview with two
members of the HFAz Quality Assurance Team who conduct prenatal trainings. The
purpose of the interview was to learn more about the prenatal component from their
perspective and it allowed the QA team to tell the HFAz prenatal story. Interview
questions focused on the HFAz prenatal training and reviewed the prenatal
component. The following section describes highlights of the interview.
The HFAz prenatal component of the program began in 2005 after the QA team
members were trained by Prevent Child Abuse America. Trainings occur every other
month in either Tucson or Phoenix to accommodate the HFAz employees located
throughout the state. The training is a requirement for all Family Support Specialists
(FSS), Family Assessment Workers (FAW), and supervisors. Attendees receive 24
hours of training, and sessions are limited to 15 people per training. The training
follows the HFAz Prenatal Training Manual by trimester and incorporates handouts
and materials from other sources. According to the interviewees, the most
emphasized topics include:
• The dangers of drug and alcohol use
• Bonding
• Support systems
• Depression (both prenatal and postnatal)
• Nutrition
• Parent/child activities
• Father involvement
• Safety issues
• Developmental stages for both the baby and the mother.

Healthy Families Arizona Annual Evaluation Report 2008 62
Some of the activities mentioned include:
• Reviewing things that happen in the pregnancy
• Simulating pregnancy/symptoms of pregnancy
• Small group discussions
• Reviewing handouts that can be used with families
• Preparing for and practicing home visits/role-playing.
Prenatal referrals to the program in rural areas usually come from prenatal clinics or
doctors’ offices, while there are few consistent referral sources in the urban areas
because of competing social service agencies that also serve prenatal families. It has
been a challenge getting families much earlier than the 3rd trimester, if at all. All
HFAz sites have the ability to serve families prenatally, but most prenatal work is
done with current postnatal families who have subsequent pregnancies.
The best parts of the prenatal component, as reported by the interviewees, include
helping the mother with bonding, having one-on-one attention with the mother,
having a good curriculum, and having a better relationship between the FSS and the
family. Some additional challenges with recruiting and retaining prenatal families
are very similar to postnatal families. Families have difficulty finding time and some
have to juggle work and school, especially teen mothers. It is difficult to have
regular, consistent home visits. Working with grandparents in the family can also be
a challenge.
Prenatal Curriculum Review
The focus of the prenatal curriculum review was the “Great Beginnings Start Before
Birth; Home Visitors’ Manual” published by Prevent Child Abuse America (2003).
HFAz does utilize two other supplemental prenatal curricula, but the focus lies on the
PCAA curriculum, as it is what HFAz program staff are trained with and encouraged
to use with their families. This curriculum was reviewed page by page, and primary
topics were tracked, the number of references to each topic were tallied, as were
number of handouts about each topic. Based on these tallies, each topic was given a
score based on how much it was emphasized in the curriculum, from “Mentioned”
(scored as a 1) to “Discussed in length” (scored as a 5). Each topic was also placed in
one of seven categories that emerged as primary themes from the curriculum.
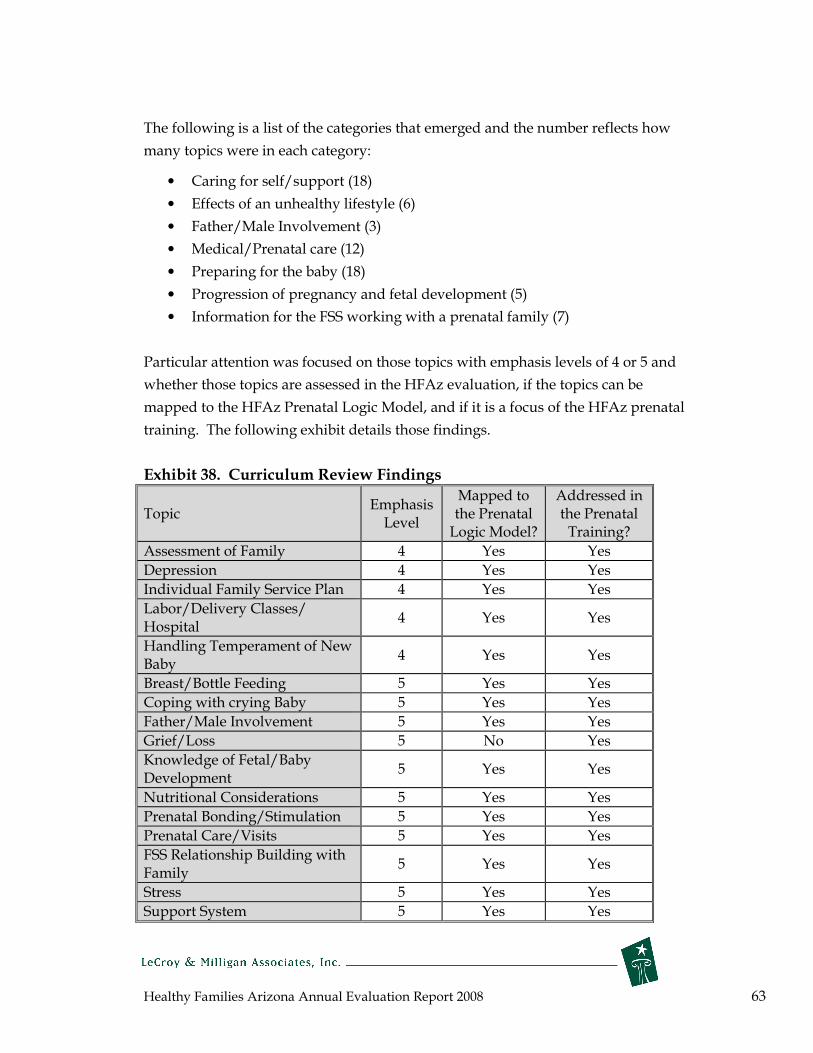
Healthy Families Arizona Annual Evaluation Report 2008 63
The following is a list of the categories that emerged and the number reflects how
many topics were in each category:
• Caring for self/support (18)
• Effects of an unhealthy lifestyle (6)
• Father/Male Involvement (3)
• Medical/Prenatal care (12)
• Preparing for the baby (18)
• Progression of pregnancy and fetal development (5)
• Information for the FSS working with a prenatal family (7)
Particular attention was focused on those topics with emphasis levels of 4 or 5 and
whether those topics are assessed in the HFAz evaluation, if the topics can be
mapped to the HFAz Prenatal Logic Model, and if it is a focus of the HFAz prenatal
training. The following exhibit details those findings.
Exhibit 38. Curriculum Review Findings
Topic Emphasis Level
Mapped to the Prenatal Logic Model?
Addressed in the Prenatal Training?
Assessment of Family 4 Yes Yes
Depression 4 Yes Yes
Individual Family Service Plan 4 Yes Yes
Labor/Delivery Classes/ Hospital
4 Yes Yes
Handling Temperament of New Baby
4 Yes Yes
Breast/Bottle Feeding 5 Yes Yes
Coping with crying Baby 5 Yes Yes
Father/Male Involvement 5 Yes Yes
Grief/Loss 5 No Yes
Knowledge of Fetal/Baby Development
5 Yes Yes
Nutritional Considerations 5 Yes Yes
Prenatal Bonding/Stimulation 5 Yes Yes
Prenatal Care/Visits 5 Yes Yes
FSS Relationship Building with Family
5 Yes Yes
Stress 5 Yes Yes
Support System 5 Yes Yes
Healthy Families Arizona Annual Evaluation Report 2008 64
This analysis provided a fundamental understanding of the prenatal curriculum
content. Healthy Families Staff were then surveyed to better understand how this
curriculum and training are used with prenatal families.
Healthy Families Staff Survey Responses
In May 2008, a web-based survey was sent to all HFAz sites for program staff to
complete. Over 200 responses were received from mostly Family Support Specialists
(FSS), Family Assessment Workers (FAW), supervisors, and managers. Of those
responding, 87% had experience working with a family prenatally as part of their
HFAz caseload and 92% had attended the HFAz prenatal training. Of those who had
attended the prenatal training, 91% felt the training prepared them to work with
prenatal families, however 47% indicated they would like additional training. All of
the suggestions for topics to include in additional training were shared with the
HFAz Quality Assurance Team.
HFAz staff were asked “How does your site decide if a family is prenatal?” The
overwhelming majority of respondents said families are considered prenatal if the
mother is pregnant or anytime between conception and birth, regardless of trimester.
Other answers indicated their enrollment was contingent on how many weeks
pregnant they were. Some sites may wait to enroll a family postnatally if they are
close to giving birth, while some may not enroll them if they are past their 1st
trimester. Some indicated that the supervisor or FAW decides.
HFAz staff were also asked to list up to 5 of the most important activities/discussions
they focus on with families during each trimester. The following exhibit shows the
top 5 topics for each trimester and the number of times each topic was mentioned.
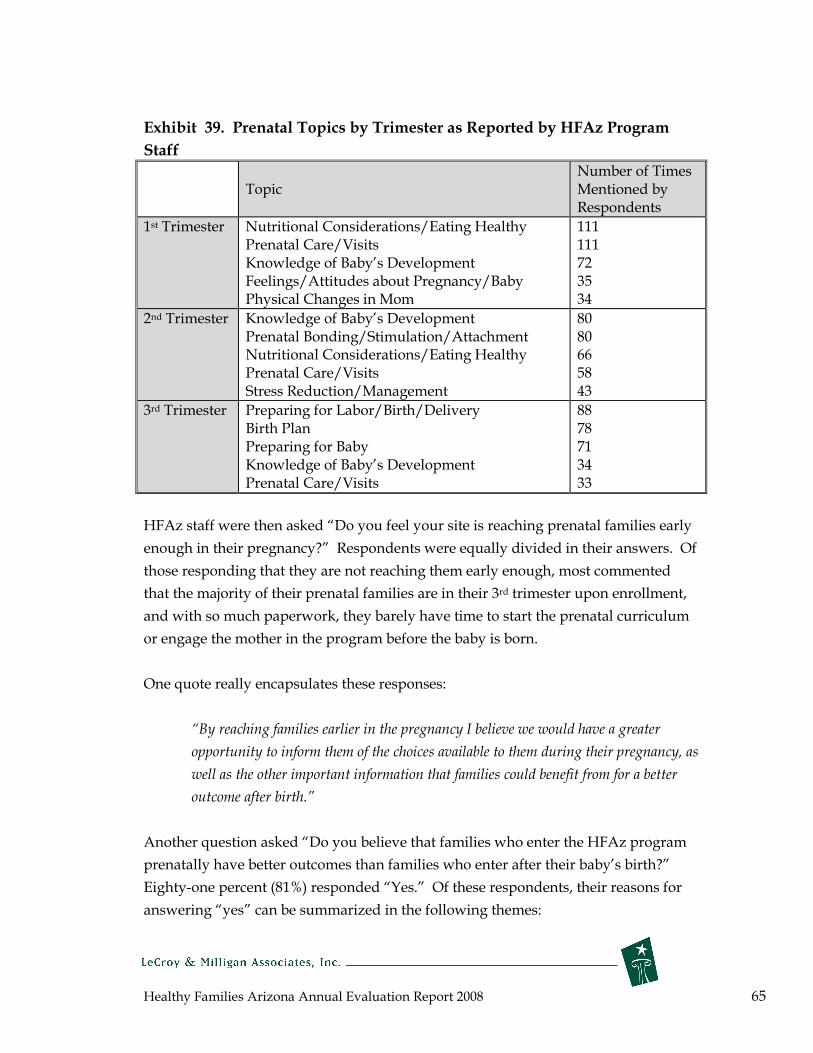
Healthy Families Arizona Annual Evaluation Report 2008 65
Exhibit 39. Prenatal Topics by Trimester as Reported by HFAz Program
Staff
Number of Times Topic Mentioned by
Respondents
1st Trimester Nutritional Considerations/Eating Healthy Prenatal Care/Visits Knowledge of Baby’s Development Feelings/Attitudes about Pregnancy/Baby Physical Changes in Mom
111 111 72 35 34
2nd Trimester Knowledge of Baby’s Development Prenatal Bonding/Stimulation/AttachNutritional Considerations/Eating HeaPrenatal Care/Visits Stress Reduction/Management
ment lthy
80 80 66 58 43
3rd Trimester Preparing for Labor/Birth/Delivery Birth Plan
88 78
Preparing for Baby Knowledge of Baby’s DevelPrenatal Care/Visits
opment 71 34 33
HFAz staff were then asked “Do you feel your site is reaching prenatal families early
enough in their pregnancy?” Respondents were equally divided in their answers. Of
those responding that they are not reaching them early enough, most commented
that the majority of their prenatal families are in their 3rd trimester upon enrollment,
and with so much paperwork, they barely have time to start the prenatal curriculum
or engage the mother in the program before the baby is born.
One quote really encapsulates these responses:
“By reaching families earlier in the pregnancy I believe we would have a greater
opportunity to inform them of the choices available to them during their pregnancy, as
well as the other important information that families could benefit from for a better
outcome after birth.”
Another question asked “Do you believe that families who enter the HFAz program
prenatally have better outcomes than families who enter after their baby’s birth?”
Eighty-one percent (81%) responded “Yes.” Of these respondents, their reasons for
answering “yes” can be summarized in the following themes:
Healthy Families Arizona Annual Evaluation Report 2008 66
• They are better able to provide more information regarding mom’s health,
prenatal care, substance abuse, domestic violence, and decreasing stress and
anxiety.
• There is more time for the FSS to build trust, a stronger bond, and become a
part of the family’s lives before the baby arrives. This could lead to families
staying in the program longer. It also allows time to try to build a support
network for mom before the baby arrives.
• It allows time to increase prenatal bonding and attachment and mother’s
confidence level in becoming a mom. They are better able to educate moms
on what the baby will be like, what they will need, breastfeeding, etc. “The
earlier the better. Some prenatal moms are already mad at their babies.”
Another notable quote from an FSS suggests that the prenatal period is a better time
to captivate and educate moms than the postnatal period.
“Families are already thinking of important development/safety/bonding/empathy
issues related to parenting before the baby comes and not when they are exhausted and
adjusting to huge life changes.”
Positive outcomes from prenatal programming in HFAz could be realized with
families who are in the program and have a subsequent pregnancy. Staff were asked
“How often do you use the prenatal curriculum with your postnatal families who
have a subsequent pregnancy?” Approximately 49% reported they “often” use it,
with 30% reporting “sometimes” and the remaining 21” reporting “rarely” or
“never”.
When respondents were asked to comment on successes, challenges, and suggestions
related to prenatal services, there was a wide variety of responses. Successes were
defined by useful curriculum and training, enjoyment in working with the prenatal
population, and importance of the program helping special populations. Challenges
included a need for more training, more activities, visuals, and resources to use
especially with early prenatal families, getting families too late in their pregnancy,
and difficultly in engaging this population. Suggestions were to include prenatal
curriculum on the HFAz website, to be able to show educational movies about baby’s
development to moms, to not consider 3rd trimester enrollees as prenatal, that
meeting with early prenatal moms four times per month is too often, and they need
more prenatal information in Spanish.

Healthy Families Arizona Annual Evaluation Report 2008 67
Profile of Prenatal Engaged Families
Of the total 5,248 families that were engaged (completed 4 home visits) in the Healthy
Families Arizona program between July 1, 2004 and March 31, 20083, 249 entered the
program on or before their fourth month of pregnancy. According to the March of
Dimes Foundation (2008), adequate prenatal care can begin in the fourth month of
pregnancy, and consequently, these families were examined in the following data
profile. The tables below compare these participants to women who enrolled in the
program postnatally (n=4,014). The profile includes demographic information, risk
factors, birth outcomes, and select program outcomes for both groups.
Demographics
Exhibit 40. Mothers Ethnicity for Prenatal Mothers Compared to Postnatal
Mothers
White/
Caucasian Hispanic
Native
American
African
American
Asian
American
Other/
Mixed
Prenatal
mothers 29.4% 51.0% 9.8% 2.4% 0.8% 6.5%
Postnatal
mothers 28.2% 54.5% 6.4% 5.5% 0.6% 4.8%
Exhibit 41. Demographics and Risk Factors for Prenatal Mothers Compared
to Postnatal Mothers
Characteristic Prenatal mothers Postnatal mothers
Median age 21 23
Marital status single 69.2% 69.9%
Not Employed 77.9% 83.1%
Less than high school education 70.3% 64.1%
No Health Insurance 14.8% 2.8%
Receives AHCCCS 72.0% 86.6%
Median Household Income* $14,040 $14,400
3 This only includes families who did not close before their baby was born.
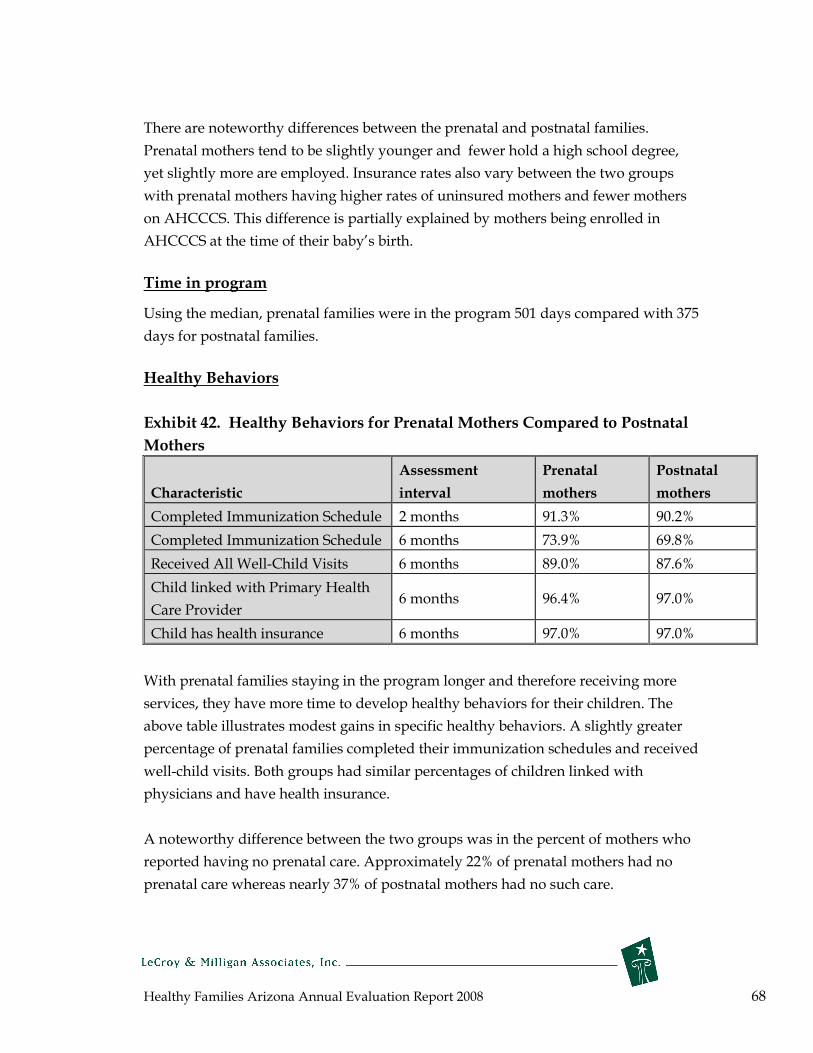
Healthy Families Arizona Annual Evaluation Report 2008 68
There are noteworthy differences between the prenatal and postnatal families.
Prenatal mothers tend to be slightly younger and fewer hold a high school degree,
yet slightly more are employed. Insurance rates also vary between the two groups
with prenatal mothers having higher rates of uninsured mothers and fewer mothers
on AHCCCS. This difference is partially explained by mothers being enrolled in
AHCCCS at the time of their baby’s birth.
Time in program
Using the median, prenatal families were in the program 501 days compared with 375
days for postnatal families.
Healthy Behaviors
Exhibit 42. Healthy Behaviors for Prenatal Mothers Compared to Postnatal
Mothers
Assessment Prenatal Postnatal
Characteristic interval mothers mothers
Completed Immunization Schedule 2 months 91.3% 90.2%
Completed Immunization Schedule 6 months 73.9% 69.8%
Received All Well-Child Visits 6 months 89.0% 87.6%
Child linked with Primary Health
Care Provider 6 months 96.4% 97.0%
Child has health insurance 6 months 97.0% 97.0%
With prenatal families staying in the program longer and therefore receiving more
services, they have more time to develop healthy behaviors for their children. The
above table illustrates modest gains in specific healthy behaviors. A slightly greater
percentage of prenatal families completed their immunization schedules and received
well-child visits. Both groups had similar percentages of children linked with
physicians and have health insurance.
A noteworthy difference between the two groups was in the percent of mothers who
reported having no prenatal care. Approximately 22% of prenatal mothers had no
prenatal care whereas nearly 37% of postnatal mothers had no such care.
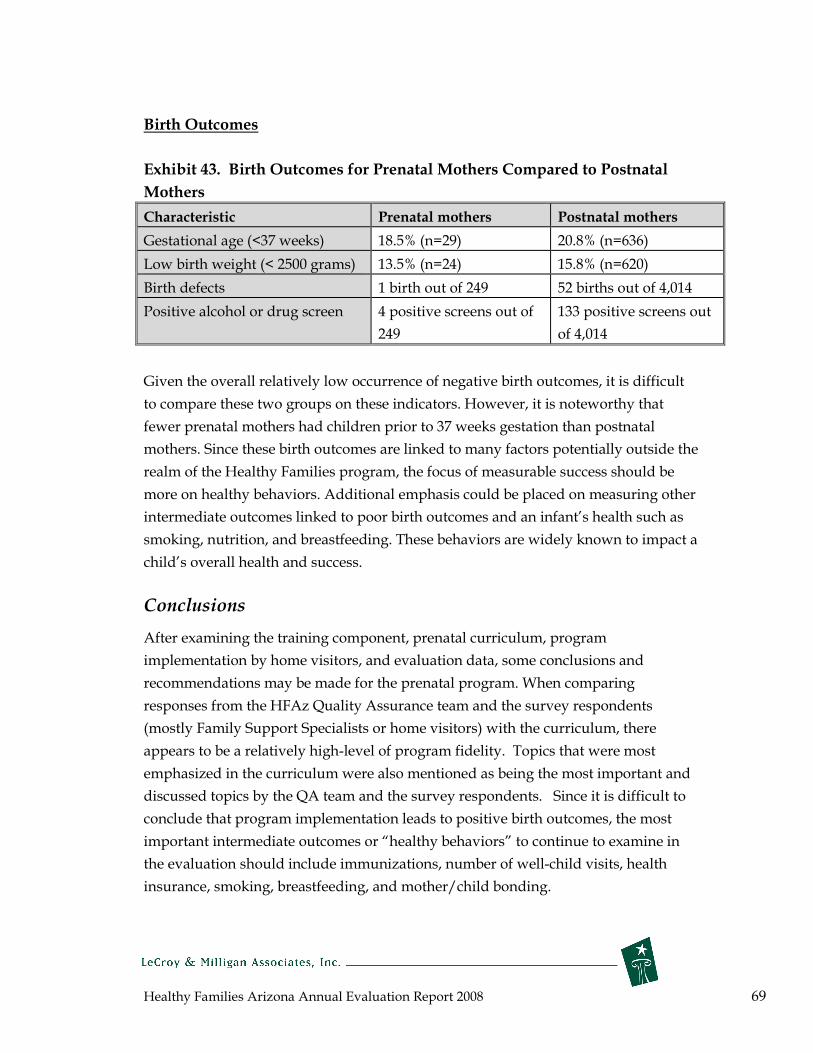
Healthy Families Arizona Annual Evaluation Report 2008 69
Birth Outcomes
Exhibit 43. Birth Outcomes for Prenatal Mothers Compared to Postnatal
Mothers
Characteristic Prenatal mothers Postnatal mothers
Gestational age (<37 weeks) 18.5% (n=29) 20.8% (n=636)
Low birth weight (< 2500 grams) 13.5% (n=24) 15.8% (n=620)
Birth defects 1 birth out of 249 52 births out of 4,014
Positive alcohol or drug screen 4 positive
249
screens out of 133 positive screens out
of 4,014
Given the overall relatively low occurrence of negative birth outcomes, it is difficult
to compare these two groups on these indicators. However, it is noteworthy that
fewer prenatal mothers had children prior to 37 weeks gestation than postnatal
mothers. Since these birth outcomes are linked to many factors potentially outside the
realm of the Healthy Families program, the focus of measurable success should be
more on healthy behaviors. Additional emphasis could be placed on measuring other
intermediate outcomes linked to poor birth outcomes and an infant’s health such as
smoking, nutrition, and breastfeeding. These behaviors are widely known to impact a
child’s overall health and success.
Conclusions
After examining the training component, prenatal curriculum, program
implementation by home visitors, and evaluation data, some conclusions and
recommendations may be made for the prenatal program. When comparing
responses from the HFAz Quality Assurance team and the survey respondents
(mostly Family Support Specialists or home visitors) with the curriculum, there
appears to be a relatively high-level of program fidelity. Topics that were most
emphasized in the curriculum were also mentioned as being the most important and
discussed topics by the QA team and the survey respondents. Since it is difficult to
conclude that program implementation leads to positive birth outcomes, the most
important intermediate outcomes or “healthy behaviors” to continue to examine in
the evaluation should include immunizations, number of well-child visits, health
insurance, smoking, breastfeeding, and mother/child bonding.
Healthy Families Arizona Annual Evaluation Report 2008 70
Healthy Families Arizona Creative Outreach Evaluation Substudy
Creative outreach remains an important component of the HFAz program. This substudy explored some seminal pieces of literature, reviewed current policies and procedures for creative outreach, analyzed perspectives from Healthy Families staff surveys and interviews, and examined historical outreach data collected from July 1, 2004 to March 31, 2008.
Key findings include:
• More families close on outreach during the initial six-month of being in the program,
but tend to re-engage more often at later time points, possibly indicating the
development of rapport with the family by HFAz workers.
• When comparing HFAz outreach and non-outreach families, there are some
demographic differences. Minority families who are younger, single parents, and
with higher parenting risk factors are more likely to be on outreach when compared
to non-outreach families.
• Based on this sub-study, it can be concluded that program staff seem to be practicing
creative outreach in ways that is consistent with the policies and procedures. They
seem to understand the purpose and intention of outreach, but there are many
frustrations and concerns with the level of effort put forth and the lack of success in
re-engaging families.
Recommendations
• Outreach needs to be systematically reviewed in light of this sub-study. Consider
shifting families who cannot receive services (request outreach for whatever reason)
to a less intensive program intervention. This intervention would likely consist of
follow- up phone calls and program material and careful referrals for additional
services.
• Explore the suggestions from home visitors that outreach should not last longer than
1 month and that transitioning a family to a new home visitor might be more
successful if the new home visitor could do at least one home visit together with the
departing home visitor.
Healthy Families Arizona Annual Evaluation Report 2008 71
Outreach Sub-Study
Creative outreach remains an important component of the HFAz program. Research
has shown creative outreach to be an efficient and effective tool to promote early
engagement and participation in home visiting programs. The purpose of this sub-
study on outreach was to explore some seminal pieces of literature, review the
current policies and procedures associated with creative outreach, explore
perspectives gained through a survey with HFAz program staff, detail the findings of
an interview with a QA team member, and explore the findings on creative outreach
by examining data collected from July 1, 2004 to March 31, 2008.
Some studies have attempted to explain the reasons that mothers engage in home
visitation programs and what barriers and drivers impact the decisions to participate.
Ammerman et al (2006) explored predictors of whether or not a mother will engage
in a home visitation program in the first year of service. Early program engagement
was explored by studying the length of time active in the program, number of home
visits received, and the length of time between visits. Findings of this study indicate
that almost 32% of mothers disengaged from the home visitation program prior to the
end of the first month of program service. However, white women and women with
increased parenting risk were more likely to engage and remain in the program.
Also, gaps in program service were common with one-two month gaps occurring
between visits quite often.
Other studies have looked more specifically at the rapport building component of a
home visitation program to see how rapport built at the initial visit is either extended
into future visits, or fails to make a substantial impact (Daro & Harding, 1999;
McCurdy & Daro, 2001). Another study (Kitzman et al., 1997) explored the time
management skills and commitment levels of individual mothers participating in a
home visitation program and found that time management skills and levels of
personal motivation also impact whether or not a mother will follow through with
previous home visitation commitments. Further, other studies (Baker et al., 1999;
Daro & Harding, 1999; Duggan et al., 1999) found maternal life circumstance such as
moving, relocation due to employment, and change in family housing situation as
key reasons for families not to receive the recommended number of home visits. In
terms of family refusals, as many as eight percent of families may refuse a visit
outright (Marcenko & Spence, 1994), but more important is the number of passive

Healthy Families Arizona Annual Evaluation Report 2008 72
refusals after agreeing to enroll in a home visitation program. These could be
anywhere from 12% on the low end to as much as 22% of families on the high end
(Duggan et al., 1999; Katzev, Pratt & McGuigan, 2001; Wagner et al., 2003). Reasons
for these active and passive refusals vary, but research in this area has revealed these
refusals may reflect a tendency toward social isolation or a higher level of risk for
parenting difficulties.
Given the importance of creative outreach to increase engagement and retention rates
in the HFAz program, it is critical to review the policies and procedures impacting
the implementation of this program component. This task will be accomplished both
by reviewing written documentation on the program and by surveying and
interviewing staff members on both program implementation and outcome-related
issues.
Review of Creative Outreach Policies and Procedures
To best understand how creative outreach works within the HFAz program, the
HFAz Policies and Procedures Manual was reviewed (there were no specific training
materials that addressed creative outreach). Creative outreach has several purposes,
but primarily it is used to engage or re-engage families who are not having regular
home visits. If there has been no face-to-face contact with a family for 30 days, they
are put on outreach. Creative outreach activities are to be continued for a minimum
of 90 days in an attempt to re-engage the family. If a home visit does not occur
during this time, the family’s file should be closed. There are three different levels of
outreach which are described below:
Level X – FSS will attempt to engage family through creative outreach for a minimum
of 3 months with weekly outreach efforts (phone calls, mailings, drop-bys, etc.).
Level Y – No home visits, mailings, or phone calls are required for a maximum of 90
days. This is used when a family informs the program that they will be out of the
service area for 30 or more consecutive days.
Level Z – No home visits or phone calls, just weekly outreach efforts via mailings for
90 days. This can also be used with families who have moved out of the service area.
Families who request closure are encouraged to participate on Level Z.

Healthy Families Arizona Annual Evaluation Report 2008 73
Families may go on and off of outreach throughout their time of enrollment with
HFAz, but they can only be on outreach for a maximum of 120 days per enrollment
year. Families who request closure and decline Level Z, are to have their files closed
immediately with no further outreach efforts.
Healthy Families Staff Perspectives on Outreach
In May 2008, a web-based survey was sent to all HFAz sites for program staff to
complete. Over 200 responses were received from mostly Family Support Specialists
(FSS), Family Assessment Workers (FAW), supervisors, and managers. Of those
responding, 78% said they had received training on when to place a family on
creative outreach. Of those who had received training, 80% felt the training prepared
them to use creative outreach effectively with families. All of the suggestions for
topics to include in additional training were shared with the HFAz Quality
Assurance Team.
Across all responses, respondents were very consistent with their definitions,
purposes of creative outreach, and criteria for placing a family on outreach. The
majority of respondents said that creative outreach is when no face-to-face contact
has been made with a family for 30 days and they try to re-engage families with a
variety of methods and creativity. Weekly contact is made via mailings, phone calls,
emails, or drop-bys. They also defined creative outreach by Levels X, Y, and Z.
Many respondents mentioned that the purpose is also to show families that they care;
they support them; they are thinking about them; they are not giving up on them;
they are a continuing resource; they would like to continue to be a part of their life;
and they are consistent, trustworthy, concerned, committed, and dependable. They
also said that creative outreach is an opportunity to build trust and rapport, to show
families the integrity of the program, to help them better understand the program, to
show the benefits of the program, and to help them feel like they are a part of
something. Some other noteworthy quotes include the following:
• “Allowing families flexibility and respect to stay in the program even if their lives
don’t allow weekly visits.”
• “To give families space and time if that is what they need.”
• “To allow life to happen, sometimes things that are beyond our control occur and
we need to allow our families time to deal with it on their own and then we can
celebrate with them and we can see growth in our families.”

Healthy Families Arizona Annual Evaluation Report 2008 74
HFAz staff were asked to list the 5 most common reasons a family might be placed on
creative outreach, their top 5 answers are listed below (the number reflects the
number of times it was mentioned):
1. Schedule changes – mom goes back to work or school, no time, too busy (119);
2. Attempted home visits and phone calls are met with no response, avoidance,
no contact, or the family is unreachable (59);
3. Family is away from home, out of town, on vacation, or out of the service area
for an extended period of time (57);
4. Family is inconsistent with home visits, they keep cancelling or not showing
up (55); and
5. A family moves and cannot be located (76).
Three different questions were asked of respondents related to what they do with
families while they are on creative outreach, and the responses were remarkably
similar across all three questions. All three questions essentially related to: “What
are some of the most effective strategies you’ve used to re-engage families?” The
creative ideas and responses are summarized below.
• Phone calls--can be personalized friendly messages, telling them you care and
let them know you are available to help, “selling” the program’s benefits,
providing information about upcoming ASQ or immunization, checking the
parent summary to find something they were interested in or needed help
with, offering a small token you have been wanting to give them, letting them
know that it’s okay that they haven’t been available if they are ready to pick
up again, remembering mom’s or child’s birthday by singing Happy Birthday
into answering machine.
• Drop bys--to talk; to take activities designed to get reengagement such as a
holiday craft activity; to do a fun family activity; to give special information
they need/have expressed interest in ; to give gifts, food box, clothes, diapers
donations, books.
• Letters/cards/creative mailings—that may include: message in a bottle,
mothers survival kit, unique individualized letters, what’s new with baby,
enthusiastic note about wanting to see them again, info about a topic family
had previously mentioned (e.g., fun summer activities), handwritten,
homemade cards with poems, inspirational poems, seeds to plant, invite to
family events and give info about community events, funny card with baby in
super hero costume, and/or closure letter.
Healthy Families Arizona Annual Evaluation Report 2008 75
• Providing child development information in person, by mail or over the
phone
• Get higher authority (supervisor) to call.
• Contact someone else who interacts with family such as relatives and
emergency contacts.
• Flexibility in scheduling or rescheduling appointments, offering to meet
with someone else who cares for the child
• Persistence--visit and call multiple times, at different/unusual times of day or
on their days off.
• Keep contact consistent--"prevention-is-the-best-medicine” type of answers,
need to establish rapport at first, stay in contact with no gaps; must focus on
them as individuals and their needs, following through with what you say
you’ll do, building trust and honesty.
• Offer to assist with transportation and connect to resources.
HFAz staff were also asked about the challenges they face when trying to re-engage
families. The most common responses are categorized below in order of most to least
mentioned:
• Being ignored—families not answering the phone or the door, not returning
calls creates a feeling of being unwanted that is difficult to deal with
• Being unable to locate—families move, change or disconnect their phone,
and don’t give you forwarding information.
• Families don’t want the program— families don’t feel they need the program;
they are too proud to participate in a program for needy families, the program
is different than what they expected, and they don’t understand the benefits
of the program.
• Working with difficult families—teenagers, transients, families moving back
and forth between Mexico or the reservation and the U.S., substance abusers,
families who are CPS involved, mothers who have gone back to work or
school and have no time.
• Feel like a stalker—feel like we are hounding the families, like bill collectors,
it’s embarrassing and dangerous doing unannounced drop-bys, irritates
families, and makes them feel less empowered.
• Takes too much time and too many resources—high gas prices, long travel
times, takes a lot of time to plan outreach efforts, waste of time to do drop-bys
when no one is home.
Healthy Families Arizona Annual Evaluation Report 2008 76
Respondents were asked “How often does Creative Outreach help families re-engage
with the program?” The majority of HFAz staff (77%) felt outreach helped “some of
the time”. When asked to explain their answers, responses were quite diverse; some
are included below.
• It really just depends on the family and the situation.
• If a family never engaged in the first place or never had a home visit, they
almost never engage through creative outreach.
• Some respondents have had some success, but usually just with families who
were engaged at one time, who just left the service area for an extended
period and returned, who really want the program, and who’s schedule
changed so they could re-engage.
• Some have no success at all with creative outreach.
• Some families are just too shy to tell you they don’t want the program, so they
will ignore you.
• Sometimes stressors are too severe for families to re-engage (CPS, work, child
care issues, finances, substance abuse).
• If an FSS tries their hardest and wants the family to re-engage, it usually
happens.
• More success is achieved through really creative outreach methods.
• Teenagers don’t respond well.
When asked about any other challenges or successes with creative outreach, many
HFAz staff expressed frustration with the process and questioned the ultimate
benefits of creative outreach. Some staff felt that long term (e.g. 90 days) efforts at
outreach to re-engage reluctant families might be more appropriately spent engaging
willing families. Many recommended that if families don’t respond after 1 month of
outreach efforts, their file should be closed.
• “I don't like it when families can 'string me along' on creative outreach and I go out
to see them over and over and they don't respond. Sometimes I feel like I'm doing
work, spending time and using gas that would be better spent elsewhere. I'm more
than willing to do what I can to reengage them, but if they don't respond to a card at
their door and letters mailed and a phone message, I come to believe that they have
made a choice already and I'm spinning my wheels.”
Healthy Families Arizona Annual Evaluation Report 2008 77
• “I would like to see us shortening the [outreach] time frame, even though I
understand the purpose behind trying to reengage the families who never had a
consistent, supportive and caring person in their lives and we want to be that person.
But what I see is that there seems to be little success in numbers of being able to
reengage them. Instead of knocking on somebody’s door or engaging in other efforts
for up to 3 months or longer, it would be nice if we could serve another family who is
participating and opening the door. Money and efforts can be spent more
appropriately in these cases. If we are not visiting, we can not work on prevention
services with families, which is our goal to prevent child abuse. FSSs are oftentimes
frustrated with continuing to reengage somebody who shows little or no interest.”
Profile of Families on Outreach
The table below shows the incidence of families on outreach over time in the Health
Families Arizona program. Almost 30% of families go on outreach within the first six
months of the program, this amount increases to 34% at twelve months, and then
tapers downward over the remaining time periods. It would appear that outreach is
more successful in the first 6 months, as the median time on outreach is 2 months,
compared to the full three months at all other intervals. Thirty to forty percent of
families re-engage from outreach. Many families close while on outreach (28-49%).
Exhibit 44. Incidence of Families on Outreach Over Time in HFAz Program
6 12 18 24 30 36 Months Months Months Months Months Months
(n=2826) (n=2174) (n=1476) (n=1038) (n=613) (n=263)
% of Families on Outreach
29% 34% 30% 28% 28% 21%
Median Time on 2 3 3 3 3 3 Outreach Months Months Months Months Months Months
Family reengaged from Outreach
31% 30% 30% 38% 40% 35%
Family Closed while on Outreach
49% 33% 32% 37% 28% 37%

Healthy Families Arizona Annual Evaluation Report 2008 78
Given that some research has shown demographic differences in early engagement of
families participating in home visitation programs, the table below shows mothers’
ethnicity for outreach families compared to non-outreach families. Fewer white
families and slightly more Hispanic, Native American and African American families
are on outreach when compared to non-outreach families. However, in general, there
do not seem to be any substantial differences between those participants on outreach
and those who are not.
Exhibit 45. Mothers’ Ethnicity among Outreach Families Compared to Non-
outreach Families
White Hispanic
Native
American
African
American Other
Outreach Family (n=1952) 24.5% 55.3% 8.0% 6.4% 5.8%
Non-Outreach Family (n=3232) 30.1% 52.5% 7.1% 4.4% 5.9%
There are also some other demographic differences between outreach and non-
outreach families. Outreach families are slightly younger (measured by mothers’
median age) and tend to be comprised of more single mothers. Employment rates are
quite similar between the two groups, but outreach mothers have less education than
do non-outreach mothers. Outreach mothers have less median household income,
but similar rates of health insurance and AHCCCS participation.
Exhibit 46. Demographics and Health Insurance Information for Outreach
Families Compared to Non-Outreach Families
Characteristic Outreach Family
(n=1952)
Non-Outreach Family
(n=3232)
Median age 22 24
Marital status single 75.2% 67.8%
Not employed 82.2% 82.8%
Less than high school
education 68.4% 62.4%
Median household income $12,000 $14,400
No health insurance 5.3% 5.0%
Receives AHCCCS 87.2% 85.2%
Healthy Families Arizona Annual Evaluation Report 2008 79
Conclusions
After reviewing key literature on home visitation programs, the HFAz Policies and
Procedures related to creative outreach, responses from HFAz program staff , an
interview with a member of the QA team, and data for outreach families, it can be
concluded that program staff seem to be practicing creative outreach in a way that is
consistent with the policies and procedures. They seem to understand the purpose
and intention of outreach, but there are many frustrations with the lack of success
and the amount of effort they put forth. Further exploration of reengagement rates
would be useful to the program, and focusing on sites that have high rates of
reengagement could inform the program statewide of effective strategies to use in
creative outreach.
The data collected from July 1, 2004 to March 31, 2008 for HFAz families show some
important trends. There are differences in how families respond to creative outreach
when examining outreach over the life of the program. More families close on
outreach during the initial six-month time point, but tend to re-engage more often at
later time points, possibly indicating the development of rapport with the family by
HFAz staff. When comparing HFAz outreach and non-outreach families, there are
also some demographic differences. Families on outreach are more likely to be
younger, single parents, and have less income and less schooling when compared to
non-outreach families.
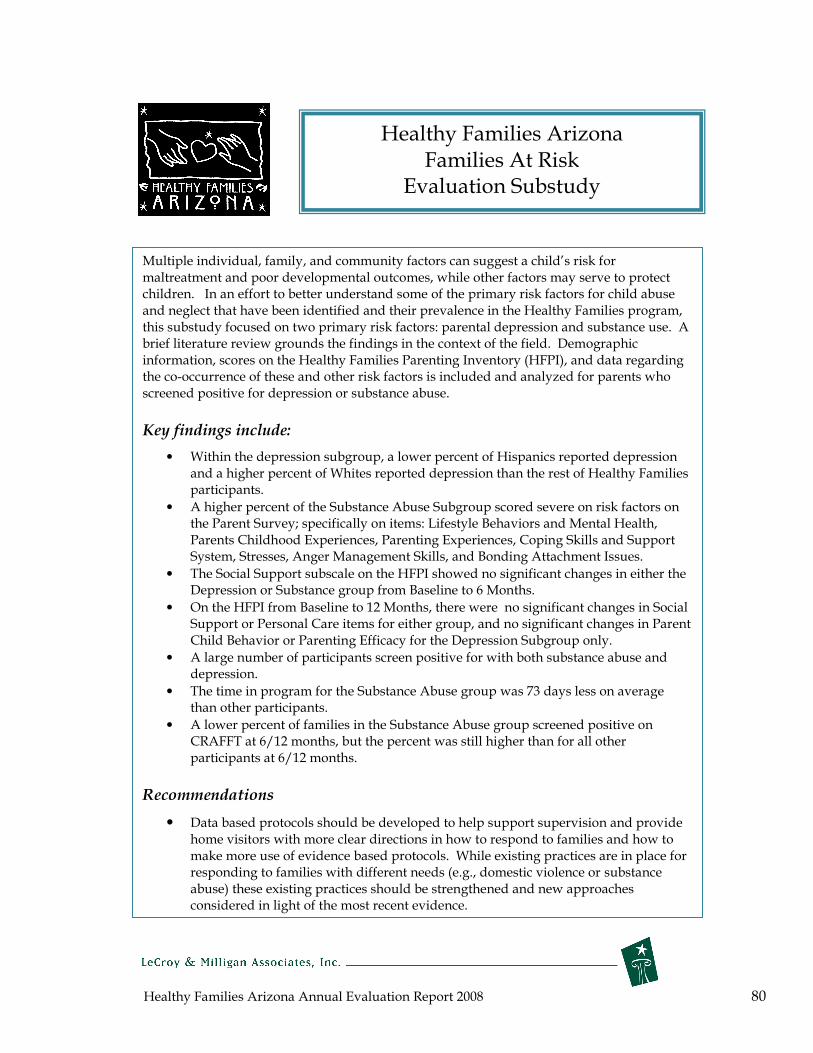
Healthy Families Arizona Annual Evaluation Report 2008 80
Healthy Families Arizona Families At Risk
Evaluation Substudy
Multiple individual, family, and community factors can suggest a child’s risk for maltreatment and poor developmental outcomes, while other factors may serve to protect children. In an effort to better understand some of the primary risk factors for child abuse and neglect that have been identified and their prevalence in the Healthy Families program, this substudy focused on two primary risk factors: parental depression and substance use. A brief literature review grounds the findings in the context of the field. Demographic information, scores on the Healthy Families Parenting Inventory (HFPI), and data regarding the co-occurrence of these and other risk factors is included and analyzed for parents who screened positive for depression or substance abuse. Key findings include:
• Within the depression subgroup, a lower percent of Hispanics reported depression and a higher percent of Whites reported depression than the rest of Healthy Families participants.
• A higher percent of the Substance Abuse Subgroup scored severe on risk factors on the Parent Survey; specifically on items: Lifestyle Behaviors and Mental Health, Parents Childhood Experiences, Parenting Experiences, Coping Skills and Support System, Stresses, Anger Management Skills, and Bonding Attachment Issues.
• The Social Support subscale on the HFPI showed no significant changes in either the Depression or Substance group from Baseline to 6 Months.
• On the HFPI from Baseline to 12 Months, there were no significant changes in Social Support or Personal Care items for either group, and no significant changes in Parent Child Behavior or Parenting Efficacy for the Depression Subgroup only.
• A large number of participants screen positive for with both substance abuse and depression.
• The time in program for the Substance Abuse group was 73 days less on average than other participants.
• A lower percent of families in the Substance Abuse group screened positive on CRAFFT at 6/12 months, but the percent was still higher than for all other participants at 6/12 months.
Recommendations
• Data based protocols should be developed to help support supervision and provide home visitors with more clear directions in how to respond to families and how to make more use of evidence based protocols. While existing practices are in place for responding to families with different needs (e.g., domestic violence or substance abuse) these existing practices should be strengthened and new approaches considered in light of the most recent evidence.

Healthy Families Arizona Annual Evaluation Report 2008 81
Families at Risk Sub-study
In order to better understand parents with significant risk factors two sub-studies
were conducted: one on depression and one on substance abuse. The goal of these
studies was to determine if particular characteristics could be discovered for the
participants who were found to be at significant risk for either depression or
substance abuse.
Literature Review
Research suggests that there may be an association been psychiatric/personality
disturbances of mothers and child abuse and neglect (Walsh, MacMillan, & Jamieson,
2002). A study by Chaffin, Kelleher, and Hollenberg (1996) found that depression
carried the highest risk of any disorder other than substance abuse. Depressed
parents in this study were nearly 3.5 times more likely to physically abuse their
children than parents who were not depressed, when other factors were statistically
controlled. One community-based study of 594 mothers at-risk for child
maltreatment showed that higher levels of maternal depression signaled increased
risk of severe physical assault. The odds of physical assault were incrementally
higher at more severe levels of depression (Windham, Rosenberg, Fuddy, McFarlane,
Sia, & Duggan 2004).
Maternal depression appears to be more closely related to child physical abuse than it
is to neglect, but some association may exist with neglect as well. This association
may be mediated by factors such as substance abuse (Chaffin, Kelleher, &
Hollenberg, 1996). Substance abuse and depression are often found to be highly inter-
related, as both are chronic relapsing problems that are relatively common among
adults of parenting age. Both have also been linked to childhood histories of
maltreatment (Malinosky-Rummel & Hansen, 1993).
One challenge in researching the relationships between depression, substance abuse,
and child abuse and neglect is determining the order of association. Studies suggest
that mothers abused as children are at higher risk for substance abuse, depression,
and abuse/neglect of their own children. Other research suggests that becoming
identified as a maltreating or at-risk parent may also predispose to depression
(Chaffin, Kelleher, & Hollenberg, 1996). In addition, some research shows that the
risk of child abuse and neglect may only increase for depressed mothers when a
Healthy Families Arizona Annual Evaluation Report 2008 82
substance abuse disorder is also present (Swanson, Holzer, Ganju, & Jono, 1990).
In summary, it is challenging to isolate which psychosocial factors put mothers at the
greatest risk for child abuse. Research suggests that substance abuse and psychiatric
disorders, such as depression, are associated in some way, though the exact
relationship is unclear. Also, it is likely that having multiple risk factors may
compound the risk of abuse (Brown, Cohen, Johnson, & Salzinger, 1998).
Implications for home visitation programs are that identification and response to
these types of problems may require a comprehensive approach designed to assess,
monitor, and treat across risk factors of the families served (Windham, Rosenberg,
Fuddy, McFarlane, Sia, & Duggan 2004)
Risk Profile -- Depression
In order to help inform the Healthy Families Arizona program on depression among
participants, a basic profile is provided of Healthy Families participants engaged in
the program from July 1, 2004 to March 31, 2008 who screened positive for depression
in the initial hospital intake screening provided by Family Assessment Workers to
determine program eligibility.
The following profile includes basic demographic information for these families, risk
scores, Healthy Families Parenting Inventory scores, and other information. When
feasible, multiple time points are presented and the data is compared to all other
families in the Healthy Families program.
Of the total 5,248 families that were engaged (had completed 4 home visits) in the
Healthy Families Arizona program between July 1, 2004 and March 31, 20084,
1,966 screened positive for current or prior depression on entry into the program.
Thus, nearly 38% of families screened positive at the time they entered the program.
The remaining 3,249 who were engaged in the program between July 1, 2004 and
March 31, 2008 are identified as the “All Other Healthy Families Participants” in the
following tables and sections.
4 This only includes families who did not close before their baby was born.
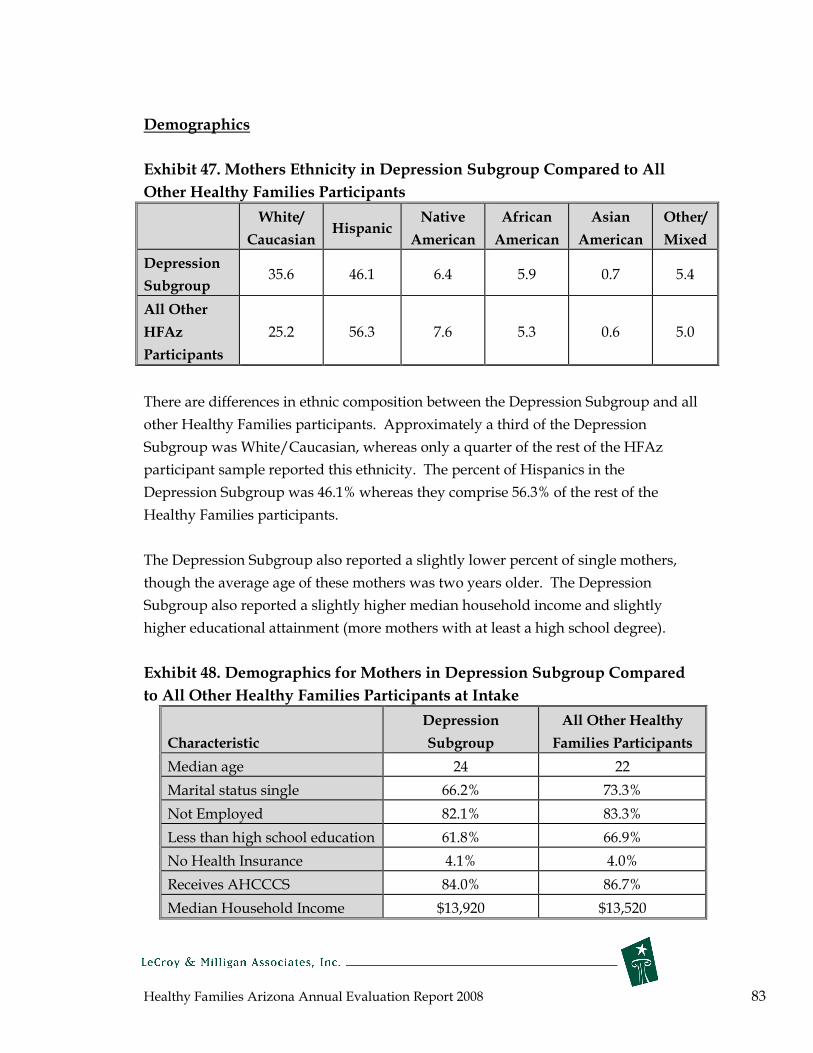
Healthy Families Arizona Annual Evaluation Report 2008 83
Demographics
Exhibit 47. Mothers Ethnicity in Depression Subgroup Compared to All
Other Healthy Families Participants
White/
Caucasian Hispanic
Native
American
African
American
Asian
American
Other/
Mixed
Depression
Subgroup 35.6 46.1 6.4 5.9 0.7 5.4
All Other
HFAz 25.2 56.3 7.6 5.3 0.6 5.0
Participants
There are differences in ethnic composition between the Depression Subgroup and all
other Healthy Families participants. Approximately a third of the Depression
Subgroup was White/Caucasian, whereas only a quarter of the rest of the HFAz
participant sample reported this ethnicity. The percent of Hispanics in the
Depression Subgroup was 46.1% whereas they comprise 56.3% of the rest of the
Healthy Families participants.
The Depression Subgroup also reported a slightly lower percent of single mothers,
though the average age of these mothers was two years older. The Depression
Subgroup also reported a slightly higher median household income and slightly
higher educational attainment (more mothers with at least a high school degree).
Exhibit 48. Demographics for Mothers in Depression Subgroup Compared
to All Other Healthy Families Participants at Intake
Characteristic
Depression
Subgroup
All Other Healthy
Families Participants
Median age 24 22
Marital status single 66.2% 73.3%
Not Employed 82.1% 83.3%
Less than high school education 61.8% 66.9%
No Health Insurance 4.1% 4.0%
Receives AHCCCS 84.0% 86.7%
Median Household Income $13,920 $13,520

Healthy Families Arizona Annual Evaluation Report 2008 84
Assessment of Risk
During the screening process, parents are assessed for child abuse risk factors using
the Parent Survey, a modified version of the Family Stress Checklist. A Family
Assessment Worker uses this tool to evaluate each parent’s level of stress across 10
domains. In one study validating the measure, of families that scored a 40 or higher
(severe rating) on this checklist, 76% were shown to later be involved in child abuse
and neglect. (Murphy, Orkow, Nicola, 1985).
Of families in the Depression Subgroup, 71.9% received a rating of 40 or higher. In
comparison, only 49.0% of all other Healthy Families participants scored severe
overall. The following chart shows a breakdown by the different survey items
included in this rating for the Depression Subgroup and Healthy Families overall.
Exhibit 49. Percentage of Parents Participants Rated Severe on the Parent
Survey Items: By Depression Subgroup and All Other Healthy Families
Participants
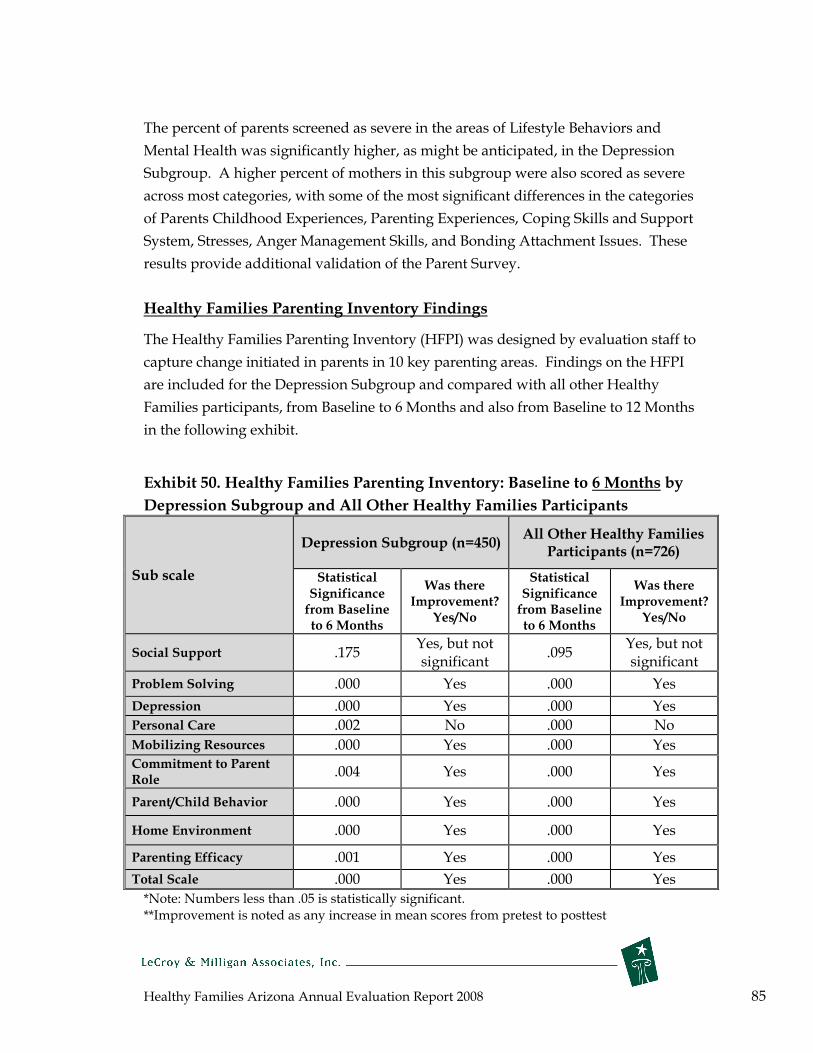
Healthy Families Arizona Annual Evaluation Report 2008 85
The percent of parents screened as severe in the areas of Lifestyle Behaviors and
Mental Health was significantly higher, as might be anticipated, in the Depression
Subgroup. A higher percent of mothers in this subgroup were also scored as severe
across most categories, with some of the most significant differences in the categories
of Parents Childhood Experiences, Parenting Experiences, Coping Skills and Support
System, Stresses, Anger Management Skills, and Bonding Attachment Issues. These
results provide additional validation of the Parent Survey.
Healthy Families Parenting Inventory Findings
The Healthy Families Parenting Inventory (HFPI) was designed by evaluation staff to
capture change initiated in parents in 10 key parenting areas. Findings on the HFPI
are included for the Depression Subgroup and compared with all other Healthy
Families participants, from Baseline to 6 Months and also from Baseline to 12 Months
in the following exhibit.
Exhibit 50. Healthy Families Parenting Inventory: Baseline to 6 Months by
Depression Subgroup and All Other Healthy Families Participants
Sub scale
Depression Subgroup (n=450) All Other Healthy Families
Participants (n=726)
Statistical Significance from Baseline to 6 Months
Was there Improvement?
Yes/No
Statistical Significance from Baseline to 6 Months
Was there Improvement?
Yes/No
Social Support .175 Yes, but not significant
.095 Yes, but not significant
Problem Solving .000 Yes .000 Yes
Depression .000 Yes .000 Yes Personal Care .002 No .000 No
Mobilizing Resources .000 Yes .000 Yes Commitment Role
to Parent .004 Yes .000 Yes
Parent/Child Behavior .000 Yes .000 Yes
Home Environment .000 Yes .000 Yes
Parenting Efficacy .001 Yes .000 Yes
Total Scale .000 Yes .000 Yes
*Note: Numbers less than .05 is statistically significant. **Improvement is noted as any increase in mean scores from pretest to posttest

Healthy Families Arizona Annual Evaluation Report 2008 86
These results suggest that significant gains are made by the depressed group—gains
that are similar to the other Healthy Family participants. However, the changes are a
bit less for the depressed group even though they are significant from pretest to
posttest. The following exhibit shows the same data but at the 12 month follow-up
period.
Exhibit 51. Healthy Families Parenting Inventory: Baseline to 12 Months by
Depression Subgroup and All Other Healthy Families Participants
Depression Subgroup (n=200)
All Other Healthy Families Participants (n=298)
Scale Significance level from
Baseline to 6 Months*
Was there Improvement?
Yes/No**
Significance level from
Baseline to 6 Months*
Was there Improvement?
Yes/No**
Social Support
.285 Yes, but not significant
.597 Yes, but not significant
Problem Solving
.002 Yes .000 Yes
Depression .032 Yes .001 Yes
Personal Care .556 No .311 No
Mobilizing Resources
.000 Yes .000 Yes
Commitment to Parent Role
.010 Yes .048 Yes
Parent/ Child .054 No .015 Yes Behavior
Home Environment
.000 Yes .000 Yes
Parenting Efficacy
.056 No .002 Yes
Total Scale .000 Yes .000 Yes
*Note: Numbers less than .05 is statistically significant. **Improvement is noted as any increase in mean scores from pretest to posttest
Data at the 12 month follow up appears to tell a different story. At 12 months, 4 of
the 9 subscales show results that fail to achieve significance for the Depression
Subgroup. However, for all other Healthy Families participants, only two subscales
(personal care and social support) fail to show a statistically significant change from
pretest to 12 months. Although the overall N is reduced in this analysis (N=200)
Healthy Families Arizona Annual Evaluation Report 2008 87
which makes significant finding more difficult to detect, it appears that many of the
previous positive changes for the depressed participants are not present at the 12
month marker. Ongoing and consistent work with mothers initially identified as
depressed is critical if significant changes are to be obtained one year after program
start.
Time in program
Families in the Depression Abuse Subgroup were, on average, in the program 369
days compared with 386 days for all Healthy Families participants.
Summary of Findings
• Within the depression subgroup, a lower percent of Hispanics reported
depression and a higher percent of Whites reported depression than the rest
of Healthy Families participants.
• A higher percent of the Substance Abuse Subgroup scored severe on risk
factors on the Parent Survey; specifically on items: Lifestyle Behaviors and
Mental Health, Parents Childhood Experiences, Parenting Experiences,
Coping Skills and Support System, Stresses, Anger Management Skills, and
Bonding Attachment Issues.
• The Social Support subscale on the HFPI showed no significant changes in
either group Baseline to 6 months.
• On the HFPI from Baseline to 12 Months, there where were no significant
changes in Social Support or Personal Care items for either group, and no
significant changes in Parent Child Behavior or Parenting Efficacy for the
Depression Subgroup only.
• A large number of participants have co-morbidity of substance abuse and
depression.
• The time in program for the Depression Subgroup was 17 days less on
average than other participants.

Healthy Families Arizona Annual Evaluation Report 2008 88
Risk Profile—Substance Abuse
Extensive research over the last few decades suggests that parental substance abuse is
associated with increased risk for child abuse. Some studies even suggest it increases
the risk twofold (Walsh, MacMillan, & Jamieson, 2003). This finding likely does not
come as a surprise to administrators and workers in the child abuse and substance
abuse fields. A study by Peddle and Wang (2001) showed that 85% of state
administrators rated substance abuse as one of the top two problems exhibited by
families reported for maltreatment. Studies also suggest that substance abuse by
caregivers significantly increases the likelihood of the substantiation of both physical
abuse and neglect cases (Sung, Shillington, Hohman, & Jones, 2001).
It is difficult to determine, however, whether other factors such as socioeconomic
status, race, family composition, housing insecurity, past experience of child abuse,
domestic violence or other factors are equally relevant predictors. Substance abuse
often occurs in the context of these and other socioeconomic problems (Sheridan,
1995). A study by Hogan, Myers, and Elswick (2006), showed that low-income
women with many risk factors are at high risk for child abuse, but that drug use did
not differentiate them from their non-user peers with similar social and demographic
backgrounds. Even studies that find significant differences once these and other
factors are controlled for, are still hesitant to presume that parental substance abuse
has a causal relationship with child abuse.
Even though causality and the mechanisms behind the association between parental
substance abuse and child abuse have yet to be fully established, the importance of
this association should not be disregarded. Substance abuse may only be one
problem a family is facing putting them at risk for child abuse, however, it is one that
can be identified and sometimes, treated successfully (Murphy, Jellinek, Quinn,
Smith, Poitrast, & Goshko, 1991). Substance abuse should be considered a significant
risk factor and addressed accordingly by the Healthy Families program.
In order to provide more information to the Healthy Families program about
substance abuse among participants, a basic profile is provided of Healthy Families
participants from July 1, 2004 to March 31, 2008 who screened positive for substance
abuse. The screening was based on their two month CRAFFT, a tool chosen by
program staff for assessment and increased communication with families on
substance abuse concerns. In order to screen positive on the CRAFFT, a mother must

Healthy Families Arizona Annual Evaluation Report 2008 89
mark at least 2 of 6 substance abuse-related questions as “yes.” These questions ask
for information on substance use at intake or within the past 6 months. A positive
screen does not necessarily indicate a substance abuse problem, though it is
considered a reliable indicator of a potential area of concern.
The following profile includes basic demographic information for these families, risk
scores, Healthy Families Parenting Inventory scores, and other information. When
feasible, multiple time points are presented and the data is compared to all families in
the Healthy Families program.
Profile of Substance Abuse Subgroup
Of the total 5,248 families that were engaged (had completed 4 home visits) in the
Healthy Families program between July 1, 2004 and March 31, 20085, 884 screened
positive for substance abuse at 2 months. That is, nearly 17% of families screened
positive for substance abuse at this time point. The remaining 4,364 who were
engaged during this time period are identified as the “All Other Healthy Families
Participants” in the following tables and sections.
Demographics
There are significant differences in ethnic composition between the Substance Abuse
Subgroup and all other Healthy Families participants. Nearly 50% of the Substance
Abuse Subgroup was White/Caucasian, whereas only a quarter of the rest of the
sample reported this ethnicity. The percent of Hispanics in the Substance Abuse
subgroup was 30.2%, whereas they comprise 57.0% of the rest of the Healthy Families
participants. Research suggests that minorities are less likely than Caucasians to
disclose substance abuse in self-reports, which may help to explain this racial
discrepancy (Sun, Shillington, Hohman & Jones, 2001).
The Substance Abuse Subgroup also reported a higher percent of single mothers and
a slightly higher median income. A higher percent of the mothers in this subgroup
group also had less than a high school education.
5 This only includes families who did not close before their baby was born.

Healthy Families Arizona Annual Evaluation Report 2008 90
Exhibit 52. Mothers’ Ethnicity in Substance Abuse Subgroup Compared to
All Other Healthy Families Participants
White/
Caucasian Hispanic Native
American African American
Asian American
Other/ Mixed
Substance Abuse 48.9% 30.2% 7.9% 6.2% 0.5% 6.5% Subgroup
All Other Healthy Families
25.1% 57.0% 7.1% 5.3% 0.7% 4.7%
Participants
Exhibit 53. Demographics for Mothers in Substance Abuse Subgroup
Compared to All Other Healthy Families Participants at Intake, 2008
Characteristic Substance Abuse
Subgroup All Other Healthy
Families Participants
Median age 23 23
Marital status single 75.0% 69.8%
Not Employed 81.3% 83.1%
Less than high school education
60.4% 65.9%
No Health Insurance 3.1% 4.2%
Receives AHCCCS 85.8% 85.7%
Median Household Income $14,000 $13,470
Assessment of Risk
Of families in the substance abuse subgroup, overall 75.4% received a rating of 40 ( or
higher (Severe) on the Parent Survey. In comparison, only 54.0% of all other Healthy
Families participants scored severe overall. The following Exhibit shows a
breakdown by the different survey items included in this rating, for the substance
abuse subgroup and Healthy Families group overall.

Healthy Families Arizona Annual Evaluation Report 2008 91
Exhibit 54. Percentage of Parents Rated Severe on the Parent Survey Items: By Substance Abuse Subgroup and All Other Healthy Families Participants
The percent of parents screened as severe in the areas of Lifestyle Behaviors and
Mental Health was significantly higher, as might be anticipated, in the Substance
Abuse Subgroup. A higher percent of mothers in this subgroup were also scored as
severe in the categories of Parents Childhood Experiences, Parenting Experiences,
Coping Skills and Support System, Stresses, Anger Management Skills, and Bonding
Attachment Issues.

Healthy Families Arizona Annual Evaluation Report 2008 92
HFPI and Substance Abuse
The Healthy Families Parenting Inventory (HFPI)was designed by evaluation staff to
show change among parents in 10 key parenting areas. Findings on the HFPI are
included for the substance abuse sub-group and compared with all other Healthy
Families participants.
Exhibit 55. Healthy Families Parenting Inventory: Baseline to 6 Months by
Substance Abuse Subgroup and All Other Healthy Families Participants
Scale
Substance Abuse Subgroup (n=291)
All Other Healthy Families Participants
(n=888)*
Statistical Significance
from Baseline 6 Months*
to
Was there Improvement?
Yes/No**
Statistical Significance
from Baseline 6 Months
to
Was there Improvement?
Yes/No
Social Support
.599 No .026 Yes
Problem Solving
.000 Yes .000 Yes
Depression .000 Yes .000 Yes
Personal Care .311 No .000 No
Mobilizing Resources
.000 Yes .000 Yes
Commitment to Parent Role
.016 Yes .000 Yes Parent/
Child .003 Yes .000 Yes Behavior
Home Environment
.000 Yes .000 Yes
Parenting Efficacy
.004 Yes .000 Yes
Total Scale .000 Yes .000 Yes
*Note: Numbers less than .05 indicate statistical significance **Improvement is noted as any increase in mean scores from pretest to posttest

Healthy Families Arizona Annual Evaluation Report 2008 93
These data suggest that 2 of the 9 subscales at baseline to 6 months do not change for
families with a substance abuse profile (social support and personal care), whereas all
the subscales showed significant change for the other Healthy Families participants.
There were not enough cases to examine this data at the 12 month period.
Time in program
Families in the Substance Abuse Subgroup were, on average, in the program 318 days
compared with 391 days for all Healthy Families participants.
Follow-up Substance Abuse Screenings—CRAFFT at 6 and 12 months
In addition to the 2 month screening, the CRAFFT is also administered at 6 and 12
months in the program. At each administration, the question asks the participant to
describe their substance use within the past 6 months. Of the families in the
Substance Abuse Subgroup, 15.8% screened positive at the 6 month time point, and
only 6.3% screened positive at 12 months.
Co-morbidity
Literature suggests that there is a high co-occurrence of substance abuse and mental
health issues such as depression. It was found that 396 participants that were
engaged between July 1, 2004 and March 31, 2008, screened positive for substance
abuse at 2 months (CRAFFT) and also screened positive for current or prior
depression upon entrance into the program. Thus, 20.1% of mothers (396 of 1,966)
who screened positive for depression also reported a substance abuse problem. And
44.8% of mothers (396 of 884) who screened positive for substance abuse also
screened positive for depression.
Summary of Findings
• Racial differences between groups may be based on low self-reporting of
substance abuse among minorities.
• A higher percent of Substance Abuse Subgroup scored severe on risk factors
on the Parent Survey; specifically on these items: Lifestyle Behaviors and
Mental Health, Parents Childhood Experiences, Parenting Experiences,
Coping Skills and Support System, Stresses, Anger Management Skills, and
Bonding/Attachment Issues.
Healthy Families Arizona Annual Evaluation Report 2008 94
• Social Support and Personal Care were scales on HFPI in which only the
Substance Abuse Subgroup showed no significant changes.
• The time in the program was 73 days less on average for the Substance Abuse
Subgroup than other participants.
• A lower percent of families in Substance Abuse Subgroup screened positive
on CRAFFT at 6/12 months, but the percent was still higher than for all other
participants at 6/12 months.
Healthy Families Arizona Annual Evaluation Report 2008 95
Conclusions and Recommendations
This annual report provides annual process and outcome results, as well as data and
findings from several special sub-studies, in an effort to provide useful information
for program accountability and program learning and improvement. Based on
recommendations for last year’s evaluation, sub-studies were completed on outreach,
the prenatal program, and families at risk. While there are multiple outcomes that
could be measured in home visitation programs, the Healthy Families Arizona
program focuses the evaluation on the following primary outcome indicators: parent
outcomes, child health and wellness, and child abuse and neglect. Based on results
from such measures as the Healthy Families Parenting Inventory, participant tracking
data, safety checklists, screening tools, child abuse and neglect rates, and participant
satisfaction surveys, Healthy Families Arizona continues to address and reach most
of its goals.
As the program matures, more clarity can be reached with continued examination of
the program theory (logic model), evolving literature about home visitation, and
deeper analysis of data related to the important concepts and outcomes of interest.
To capitalize on the potential for learning from the extensive and ongoing data
collection efforts, the evaluation continuously seeks to better understand the
relationship between Healthy Families Arizona processes or activities and participant
outcomes. For example, we have explored the nature and differences between the
highest risk participants (those with risk factors of depression and substance abuse)
and other Healthy Families participants with fewer risk factors. By posing and
answering questions related to the program objectives, the evaluation can help to
inform practice.
Recommendations based on this year’s evaluation activities include the following:
• Supervision has not been systematically studied in Healthy Families and it
should become a focus of ongoing program improvement. Supervision is a
critical part of effective service delivery. For example, families identified as
high risk should receive more direct supervision to address their level of risk.

Healthy Families Arizona Annual Evaluation Report 2008 96
• More data-based decision making should be included in the work with
families from both the home visitors and supervisors. While compliance
with outcome assessment like the HFPI has improved over time, significant
improvement should be an ongoing goal. Also, new efforts at training and
supervision should emphasize how data-based decisions can be made.
• Continued attention should be given to data collection and data submission
to decrease the amount of missing data. An examination of the quantity of
paperwork required of program staff should be made to determine the most
useful and relevant data to collect for case management, quality assurance
and evaluation.
• Data-based protocols should be developed to help support supervision and
provide home visitors with more clear directions on how to respond to
families and how to make more use of evidence-based protocols. While
existing practices are in place for responding to families with different needs
(e.g., domestic violence or substance abuse) these existing practices should be
strengthened and new approaches considered in light of the most recent
evidence.
• Clear policies should be in place for how home visitors can keep an
acceptable level of contact even when face-to-face contact is not occurring or
possible. More clear efforts and documentation should be provided in
assessing the amount of program utilization provided to families. This is a
critical and challenging objective, given that that expected service levels are
not being met by Healthy Families Arizona or other Healthy Families
programs around the country.
• Outreach needs to be systematically reviewed in light of the sub-study
conducted on this topic. Consider shifting families who cannot receive
services (request outreach for whatever reason) to a less intensive program
intervention. This intervention would likely consist of follow-up phone calls
and program material and careful referrals for additional services. This
would eliminate the issues associated with putting families on outreach and
would focus the home visitor’s efforts on providing services to families at
levels that best meet the family’s needs. Explore the suggestions from home
visitors that outreach should not last longer than one month and that
transitioning a family to a new home visitor might be more successful if the
new home visitor could do at least one home visit with departing home
visitor.
Healthy Families Arizona Annual Evaluation Report 2008 97
• Alternatives to creative outreach should be considered, such as providing
participants with an alternative to face-to-face contact. This would allow the
program to potentially meet the needs of participants who otherwise stay on
outreach and never fully re-engage with the program.
• Work should continue in defining high risk families and developing
protocols that match the level of risk the family is facing. Assessment of risk
level is a critical factor in providing supervision and responding effectively to
families in need.
• The evaluation should explore the ability of the HFPI depression subscale
to accurately assess depression. A separate analysis should be conducted of
the depression subscale including an analysis of the variability in scores and a
comparison of these results with other depression scales like the CES-D. A
determination should be made if additional depression screening tools are
necessary.
• New efforts should be made to help home visitors enhance the level of
social support that is provided. Social support has long been recognized as a
key construct for the Healthy Families program. High levels of social support
are associated with multiple benefits including reduced stress and more
effective parenting practices. Outcome data from last year and this year finds
the change in social support to be one of the weakest areas of improvement.
• Increased effort should be directed toward preventing repeat births and in
increasing the time between births. Because this health benchmark has gone
in the opposite direction than hoped for, program staff should redouble their
efforts to educate families. In addition, training efforts for home visitors
should be re-examined.
• Continued refinement of the prenatal program components should be
developed and implemented. Efforts should include attention to father/male
involvement in the prenatal period. In addition, changes in critical health
behaviors could be examined by collecting more participant information
about attendance in birthing classes, use of prenatal vitamins, and progress in
smoking cessation.
Healthy Families Arizona Annual Evaluation Report 2008 98
References Ali, Z., & Larry, M. (1981). Early maternal-child contact: Effects on later behavior. Dev. Med. Child Neurol., 23, 337-345. Ammerman, R. T., Stevens, J., Putnam, F. W., Altaye, M., Hulsmann, J. E., Lehmkuhl, H. D., Monroe, J. C., Gannon, T. A., & Van Ginkel, J. B. (2006). Predictors of early engagement in home visitation. Journal of Family Violence, 21 (2), 105-115. Armstrong, K.L., Fraser, J. A., Dadds, M.R., & Morris, J. (2000). Promoting secure attachment, maternal mood and child health in a vulnerable population: A randomized controlled trail. Journal of Paediatric. Child Health, 36, 555-562 Baker, A. J. L., Piotrkowski, C. S. & Brooks-Gunn, J. (1999). The home instruction program for preschool youngsters (HIPPY). Future Child 9, 116-133. Brown, J., Cohen, P., Johnson J.G., & Salzinger, S. (1998). A longitudinal analysis of risk factors for child maltreatment: Findings of a 17-year prospective study of officially recorded and self-reported child abuse and neglect. Child Abuse & Neglect, 22(11), 1065-1078. Chafin, M., Kelleher, K., & Hollenberg, J. (1996). Onset of physical abuse and neglect: Psychiatric, substance abuse, and social risk factors from prospective community data. Child Abuse & Neglect, 20 (3), 191-203. Chomitz, V.R., Cheung, L.W.Y., and Lieberman, E. (1995). The Role of Lifestyle in Preventing Low Birth Weight. The Future of Children, 5 (1), Spring 1995. Retrieved: September 10, 2008. http://www.futureofchildren.org/pubs-info2825/pubs-info_show.htm?doc_id=79872. Culp, A.M., Culp, R.E., Hechtner-Galvin, T., Howell, C.S., Saathoff-Wells, T., and Marr, P. (2004). First-time Mothers in Home Visitation Services Utilizing Child Development Specialists. Infant Mental Health Journal, 25 (1), 1-15. Daro, D. & Harding, K. (1999). Healthy families America: Using research in going to scale. The Future of Children 9 (1), 152-176. Daro, D., et al. (2007). The role of the community in facilitating service utilization. . Journal of Prevention & Intervention in the Community, 34, 181-204. Diaz, J., Oshana, D., & Harding, K. (2004). Healthy Families America: 2003 profile of program sites. Chicago: Prevent Child Abuse America.
Healthy Families Arizona Annual Evaluation Report 2008 99
Duggan, A. K., McFarlane, E. C., Windham, A., Rohde, C. A., Salkever, D. S., Fuddy, L., Rosenberg, L. A., Buchbinder, S. B., & Sia, C. C. J. (1999). Hawaii’s Healthy Start program of home visiting for at-risk families: Evaluation of family identification, family engagement, and service delivery. Future Child 9, 66-90. Field, T. (1995). Infants of depressed mothers. Infant Behavioral Development, 18, 1-13. Glassbrenner D. and Ye, J. (2007) Rear-seat belt use in 2006. Traffic Safety Facts Research Note. Report no. DOT HS-810-765. Washington, DC: National Highway Traffic Safety Administration. Gomby, D. S., Culross, P.I., & Behrman, R. E. (1999). Home visiting: Recent program evaluations—analysis and recommendations. The Future of children, 9, 4-26. Heppner, P. P., & Lee, D. G. (2002). Problem solving appraisal and psychological adjustment. In C. R. Snyder & S. J. Lopez (Eds.), Handbook of positive psychology. New York: Oxford University Press. Heppner, P. P., Cooper, C., Mulholland, A., & Wei, M. (2001). A brief, multidimensional, problem-solving psychotherapy outcome measure. Journal of Consulting Psychology, 48, 330-343. Harding, K., Galano,J., Martin, J., Huntington, L., & Schellenbach, D. (2007) Healthy Families America Effectiveness: A comprehensive review of outcomes. Journal of Prevention and Intervention in the Community, 24 (1/2), 149-179. Herzig, K., Danley, D., Jackson, R., Peterson, R., Chamberlain, L., and Gerbert, B. (2005). Seizing the 9-month moment: Addressing behavioral risks in prenatal patients. Patient Education and Counseling, 61 (2006), 228-235. Hogan,T., Myers, B., & Elswick, R.K. (2006). Child abuse among mothers of substance-exposed and non-exposed infants and toddlers. Child Abuse & Neglect, 30 (2006), 145-156. Jacobs, F., Easterbrooks, M. A., Brady, A., & Mistry, J. (2005). Healthy Families Massachusetts: Final Evaluation Report. Tufts University. Kallan, J. E. (1997). Reexamination of interpregnancy intervals and subsequent birth outcomes: Evidence from U. S. linked birth/infant death records. Social Biology, 44, 205-212. Katzev, A., Pratt, C., & McGuigan, W. (2001). Oregon healthy start 1999-2000 status report. Corvallis, OR: Oregon State University.
Healthy Families Arizona Annual Evaluation Report 2008 100
Kitzman, H. J., Cole, R., Yoos, H. L., & Olds, D. L. (1997). Challenges experienced by home visitors: A qualitative study of program implementation. Journal of Community Psychology 26, 95-109. Krysik J., & LeCroy, C. W. (2008). The Development and Initial Validation of an Outcome Measure for Home Visitation: The Healthy Families Parenting Inventory. Manuscript submitted for publication. Krysik, J., & LeCroy, C.W. (2007). The evaluation of Healthy Families Arizona: A multisite home visitation program. Journal of Prevention & Intervention in the Community, 34, 109-128. Leschied, A. W., Chiodo, D., Whitehead, P. C., & Hurley, D. (2005). The relationship between maternal depression and child outcomes in a child welfare sample: Implications for treatment and policy. Child and Family social Work, 10, 281-291. Leschied, A.W., Chiodo, D., Whitehead, P.C., and Hurley, D. (2005). The Relationship between Maternal Depression and Child Outcomes in a Child Welfare Sample: Implications for Policy and Treatment. Child and Family Social Work, 10, 281-291. Lobel, M., Cannella, D.L., DeVincent, C., Schneider, J., Graham, J.E., and Meyer, B.A. (2008). Pregnancy-Specific Stress, Prenatal Health Behaviors, and Birth Outcomes. Health Psychology, 27 (2008), 5, 604-615. Malinosky-Rummell, R., & Hansen, D.J. (1993). Long-term consequences of childhood physical abuse. Psychological Bulletin, 114, 68-79. Marcenko, M. & Spence, M. (1994). Home visitations services for at-risk pregnant and postpartum women: A randomized trial. American Journal of Orthopsychiatry 64 (3), 468-478. March of Dimes Foundation (2008). Arizona: Prenatal Care: Adequate/adeq+prenatal care. Accessed: June 13, 2008. http://www.marchofdimes.com/peristats/level1.aspx?dv=ms®=04&top=5&stop=29&lev=1&slev=4&obj=1. McCurdy, K. & Daro, D. (2001). Parent involvement in family support programs: An integrated theory. Family Relations 50 (2) 113-121. McCurdy, K., Daro, D., Anisfeld, E., Katzev, A., Keim, A., LeCroy, C., McAfee, C., Nelson, C., Falconnier, L., McGuigan, W. M., Park, J. K., Sandy, J. & Winje, C. (2006). Understanding maternal intentions to engage in home visiting programs. Children and Youth Services Review, 28, 1195-1212.

Healthy Families Arizona Annual Evaluation Report 2008 101
Mitchell-Herzfeld, Susan, Charles Izzo, Rose Greene, Eunju Lee, and Ann Lowenfels, Evaluation of Healthy Families New York (HFNY): First Year Program Impact (2005)., Rensselaer, N.Y.: New York State Office of Children and Family Services, Bureau of Evaluation and Research; Albany, N.Y.: Center for Human Services Research, University at Albany, February 2005. Murphy, J., Jellinek, M.,Quinn, D., Smith, G., Poitrast, F., & Goshko M. (1991). Substance abuse and serious child mistreatment: prevalence, risk, and outcome in a court sample. Child Abuse & Neglect, 15 (1991), 197-211. Myers, J. E. B., Berliner, L., Briere, J. N., Hendrix, C. T. (2002). APSAC Handbook on Child Maltreatment. Thousand Oaks, CA: Sage. Pan, H. S., Neidig, P. H., & O’Leary, K. D. (1994). Predicting mild and severe husband to wife physical aggression. Journal of Consulting and Clinical Psychology, 62, 975-981. Peddle, N., & Wang, C.T. (2001). Current trends in child abuse. Prevention, reporting, and fatalities: the 1999 fifty state survey. Chicago, Ill: National Committee for Prevention of Child Abuse. Pransky,, J. (1991). Prevention: The critical need. Springfield, MO: BurneFondatioo nd Paraadiggn Press. Prevent Child Abuse America. (2003). Great Beginnings Start Before Birth: Home Visitors’ Manual. Prevent Child Abuse America. Chicago, IL. Prevent Child Abuse America. (2004). Annual Report. Retrieved: October 8, 2008. http://www.preventchildabuse.org/about_us/downloads/PCAAmerica_2004_AR.pdf. Prilleltensky, I., Nelson, G., & Peirson, L. (2001). Promoting family wellness and preventing child maltreatment. Toronto: University of Toronto Press. Sheridan, M.J. (1995). A proposed intergenerational model of substance abuse, family functioning, and abuse/neglect. Child Abuse & Neglect, 19(5), 519-530. Shure, M. B. (2004). Thinking parent, thinking child. New York: McGraw-Hill. Shure, M. B. (1978). Problem solving techniques in child rearing: A training script for parents and children. New York: Jossey-Bass. Sun, A., Shillington, A., Hohman, M., and Jones, L. (2001). Caregiver AOD use, case substantiation, and AOD treatment: studies based on two southwestern counties. Child Welfare League of America, 151-178.
Healthy Families Arizona Annual Evaluation Report 2008 102
Swanson, J.W., Holzer, C.E., Ganju, V.K. & Jono, R.T. (1990). Violence and psychiatric disorders in the community: Evidence from the Epidemiologic Catchment Area surveys. Hospital and Community Psychiatry, 41, 761-770. Van den Boom, D.C. (1994). The influence of temperament and mothering on attachment and exploration: An experimental manipulation of sensitive responsiveness among lower-class mothers with irritable infants. Child Development, 65, 1449-1469. Wagner, M., Spiker, D., Linn, M. I., Gerlach-Downie, S., & Hernandez, F. (2003). Dimensions of parental engagement in home visiting programs: Exploratory study. Topics in Early Childhood Special Education 23, (4), 171-187. Walsh, C., MacMillan, H. & Jamieson, E. (2002). The relationship between parental psychiatric disorder and child physical and sexual abuse: findings from the Ontario Health Supplement. Child Abuse & Neglect, 26 (2002), 11-22. Walsh, C., MacMillan, H. & Jamieson, E. (2003). The relationship between parental substance abuse and child maltreatment: findings from the Ontario Health Supplement. Child Abuse & Neglect, 27 (2003), 1409-1425. Waltz, C. F., Strickland, O. L., & Lenz, E. R. (2004). Measurement in nursing and health research. New York: Springer Publishing. What works for children (2008). Retrieved from: www.whatworksforchildren.org.uk/ on October 23, 2008. Whipple, E.E., & Webster-Stratton, C. (1991). The role of parental stress in physically abusive families. Child Abuse and Neglect, 15, 279-291. Windham, A., Rosenberg, L., Fuddy, L., McFarlane, E., Sia, C., Duggan, A. (2004). Risk of mother-reported child abuse in the first 3 years. Child Abuse & Neglect, 28, 645-667. Windom, C. S. (1992). Child abuse and alcohol use. Paper presented to the National Institute on Alcohol Abuse and Alcoholism, Washington DC. Wolfe, D. A. (1998). Prevention of child abuse and neglect. Canada health action: Building on the legacy—Determinants of health, Vol. I-Children and youth (pp. 103-131). Ste Foy, Multimondes.

Healthy Families Arizona Annual Evaluation Report 2008 103
Appendix A: Site Level Data
� Age of Child at Entry ............................................................................................ 104
� Days to Program Exit ............................................................................................ 106
� Top Four Reasons for Exit .................................................................................... 108
� Health Insurance at Intake ................................................................................... 110
� Late or No Prenatal Care or Poor Compliance at Intake ................................. 112
� Ethnicity of Mother ............................................................................................... 114
� Gestational Age ...................................................................................................... 118
� Low Birth Weight .................................................................................................. 120
� Yearly Income ........................................................................................................ 122
� Parent Survey Score .............................................................................................. 124
� Trimester of Enrollment into Prenatal Program ............................................... 126
� Engaged Prenatal Families that Exited before Baby’s Birth ............................ 128

Healthy Families Arizona Annual Evaluation Report 2008 104
Age of Child at Entry by Site – 2008 (Age in Days)
Site Mean
(Age in Days) Number
Standard Deviation
Douglas 16.68 75 13.51 Central Phoenix 32.80 88 24.30 Maryvale 26.95 102 24.58 South Phoenix 30.30 86 25.19 East Valley 33.90 94 26.20 Nogales 18.31 105 20.72 Page 26.19 37 22.16 Casa de los Niños 37.90 80 22.18 CODAC 37.92 102 25.38 La Frontera 36.34 95 26.83 Sierra Vista 12.68 62 16.27 Tuba City 25.78 40 24.59 Verde Valley 13.15 73 14.95 Yuma 19.17 76 19.95 Pascua Yaqui 30.42 38 25.75 Lake Havasu City 24.54 85 15.56 Flagstaff 23.31 42 26.17 Sunnyslope 30.41 78 22.03 Prescott 27.46 127 24.76 Coolidge 23.65 82 25.72 Mesa 28.90 104 20.95 Southeast Phoenix 28.34 82 23.50 El Mirage 34.63 100 28.40 Blake Foundation 37.59 100 25.47 Marana 41.36 78 26.15 Safford 28.47 36 31.51 Stanfield 18.43 23 18.86 Apache Junction 33.50 74 26.96 Gila River 35.71 14 22.40 Winslow 27.91 23 23.40 Kingman 29.67 45 22.07 Globe/Miami 40.65 23 25.42 Kyrene 32.83 89 24.92 Metro Phoenix 31.62 99 24.85 Tolleson 30.21 85 21.61

Healthy Families Arizona Annual Evaluation Report 2008 105
Site Mean
(Age in Days) Number
Standard Deviation
South Mountain 26.18 111 21.06 Glendale 29.04 99 22.25 Deer Valley 27.50 82 23.07 East/SE Tucson 34.06 78 26.19 SW Tucson 40.31 75 28.27 Bullhead City 21.06 50 18.85 Northwest Phoenix 27.40 95 20.24 Tempe 30.14 98 22.40 Gilbert 30.88 65 21.30 Scottsdale 31.31 127 24.07 West Phoenix 29.13 97 24.65 East Mesa 38.08 78 20.88 Kinlani-Flagstaff 18.77 39 23.97 Southwest Phoenix 31.23 81 24.71 Peoria 33.67 69 32.56 Metro Tucson 34.58 86 21.67 Casa Family First 38.96 92 24.77 Wellspring 15.20 41 24.24 Primero Los Niños 17.91 64 14.47 Sierra Vista Blake 12.56 61 17.16 Total 29.22 4130 24.31
Note: total does not include missing data for 101 participant files.

Healthy Families Arizona Annual Evaluation Report 2008 106
Days to Program Exit by Site – 2008 (For families who left the program)
Site Prenatal Postnatal
Median Mean Standard Deviation
Number Median Mean Standard Deviation
Number
Douglas 226.00 242.00 168.31 5 507.00 718.44 635.64 25 Central Phoenix 455.00 455.00 115.31 4 303.00 393.68 352.14 34 Maryvale 250.00 317.83 181.23 6 292.00 430.31 370.35 32 South Phoenix 296.00 435.00 337.48 5 294.00 461.70 411.38 27 East Valley 700.50 700.50 152.03 2 558.00 742.13 522.46 31 Nogales 272.50 275.13 72.97 8 437.00 837.14 699.31 35 Page 293.50 376.50 353.06 4 522.00 809.91 779.60 11 Casa de los 262.00 319.11 179.77 9 378.00 464.36 355.37 28 Niños
CODAC 434.00 443.08 246.26 13 338.00 581.08 519.48 40 La Frontera 365.00 416.31 250.50 13 618.00 809.67 631.58 27 Sierra Vista 486.00 571.00 315.71 6 381.00 586.84 481.62 19 Tuba City 441.00 580.80 270.21 5 503.00 771.23 659.95 13 Verde Valley 572.00 519.95 296.61 19 288.00 571.70 625.29 27 Yuma 369.00 346.60 188.11 5 405.00 507.22 401.30 27 Pascua Yaqui 470.50 550.25 335.20 16 887.00 1037.53 733.02 15 Lake Havasu 219.00 307.35 262.89 23 292.50 639.39 619.45 38 City
Flagstaff 341.00 356.06 255.97 16 530.00 695.07 521.78 15 Sunnyslope 281.00 366.20 266.69 10 273.50 437.60 395.58 20 Prescott 148.00 279.67 325.54 6 663.00 731.26 543.70 46 Coolidge 263.00 459.40 385.19 5 674.50 757.04 589.89 26 Mesa 586.00 511.17 338.12 6 538.00 612.06 426.31 33 Southeast 555.00 570.57 295.22 7 826.00 836.17 595.41 30 Phoenix
El Mirage 593.00 494.33 206.51 3 498.00 589.47 431.02 36 Blake 407.50 446.13 246.47 8 483.50 614.59 432.63 46 Foundation
Marana 237.00 403.44 342.99 9 371.00 418.77 265.26 35 Safford 491.00 584.43 325.21 7 581.00 617.88 380.98 8 Stanfield 411.00 483.83 238.05 6 380.00 388.18 173.57 11 Apache Junction
449.00 475.17 289.71 12 379.00 425.94 255.86 35
Gila River 845.50 627.50 391.86 8 402.00 554.20 402.04 5 Winslow 566.50 553.83 291.75 6 212.00 335.00 345.25 12 Kingman 390.00 365.50 184.78 8 327.00 355.94 300.91 16 Globe/Miami 408.00 498.17 285.60 6 562.50 492.00 199.37 6 Kyrene 293.00 412.38 290.45 8 320.50 337.10 199.49 30 Metro Phoenix 498.50 498.50 47.38 2 207.00 329.76 335.84 25 Tolleson 597.50 597.50 86.97 2 639.00 608.43 388.61 28 South 330.00 342.70 158.69 10 388.00 410.71 252.45 45 Mountain
Glendale 231.50 335.60 221.36 10 720.00 741.41 489.81 32
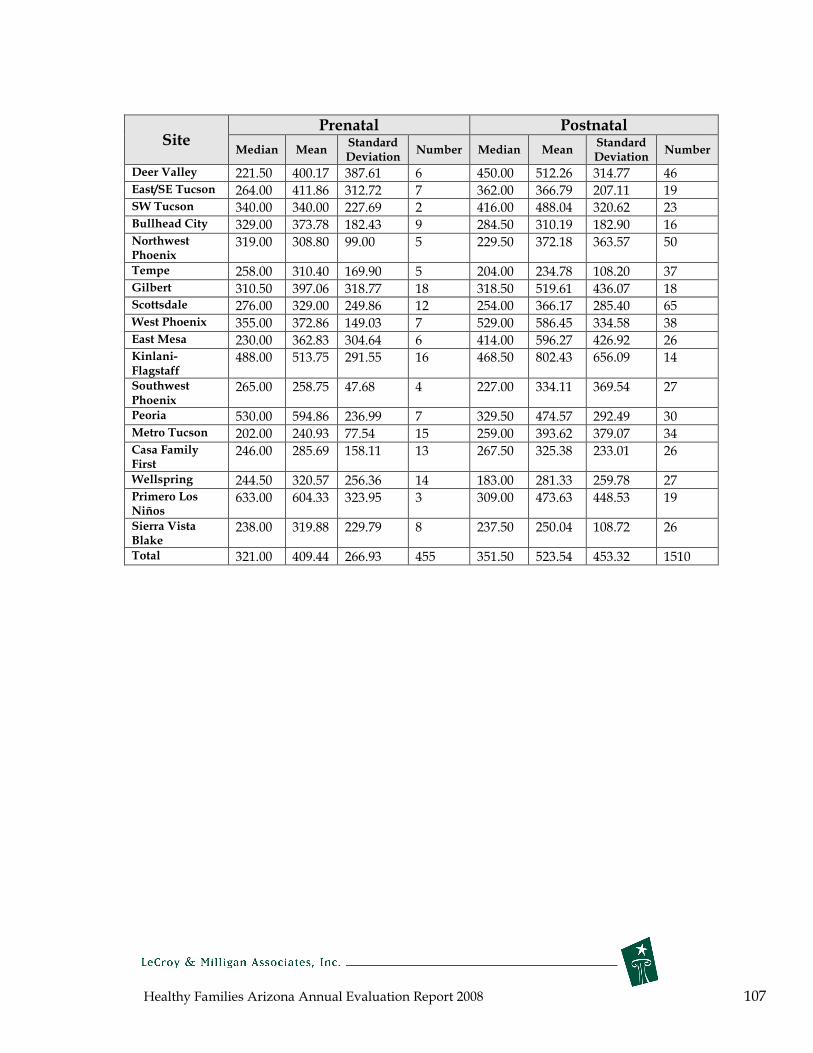
Healthy Families Arizona Annual Evaluation Report 2008 107
Prenatal Postnatal Site Standard Standard
Median Mean Number Median Mean Number Deviation Deviation
Deer Valley 221.50 400.17 387.61 6 450.00 512.26 314.77 46 East/SE Tucson 264.00 411.86 312.72 7 362.00 366.79 207.11 19 SW Tucson 340.00 340.00 227.69 2 416.00 488.04 320.62 23 Bullhead City 329.00 373.78 182.43 9 284.50 310.19 182.90 16 Northwest 319.00 308.80 99.00 5 229.50 372.18 363.57 50 Phoenix
Tempe 258.00 310.40 169.90 5 204.00 234.78 108.20 37 Gilbert 310.50 397.06 318.77 18 318.50 519.61 436.07 18 Scottsdale 276.00 329.00 249.86 12 254.00 366.17 285.40 65 West Phoenix 355.00 372.86 149.03 7 529.00 586.45 334.58 38 East Mesa 230.00 362.83 304.64 6 414.00 596.27 426.92 26 Kinlani- 488.00 513.75 291.55 16 468.50 802.43 656.09 14 Flagstaff
Southwest 265.00 258.75 47.68 4 227.00 334.11 369.54 27 Phoenix
Peoria 530.00 594.86 236.99 7 329.50 474.57 292.49 30 Metro Tucson 202.00 240.93 77.54 15 259.00 393.62 379.07 34 Casa Family 246.00 285.69 158.11 13 267.50 325.38 233.01 26 First
Wellspring 244.50 320.57 256.36 14 183.00 281.33 259.78 27 Primero Los 633.00 604.33 323.95 3 309.00 473.63 448.53 19 Niños
Sierra Vista 238.00 319.88 229.79 8 237.50 250.04 108.72 26 Blake
Total 321.00 409.44 266.93 455 351.50 523.54 453.32 1510

Healthy Families Arizona Annual Evaluation Report 2008 108
Top Four Reasons for Exit by Site – 2008 Percent and number within site
Site
Overall (Prenatal and Postnatal Combined) #1 Did Not Respond to Outreach Efforts
#2 Moved Away
#3 Family Refused Further Services
#4 Unable Contact
to Completed Program
(ranked #6)
% n % n % n % n % n Douglas 50% 13 30.8% 8 7.7% 2 0 0 0 0 Central Phoenix 23.7% 9 34.2% 13 23.7% 9 7.9% 3 2.6% 1 Maryvale 34.2% 13 26.3% 10 10.5% 4 5.3% 2 2.6% 1 South Phoenix 40.6% 13 15.6% 5 9.4% 3 12.5% 4 3.1% 1 East Valley 21.2% 7 27.3% 9 12.1% 4 3.0% 1 3.0% 1 Nogales 26.2% 11 35.7% 15 2.4% 1 7.1% 3 26.2% 11 Page 20.0% 3 33.3% 5 26.7% 4 0 0 20.0% 3 Casa de los 29.7% 11 24.3% 9 18.9% 7 5.4% 2 2.7% 1 Niños
CODAC 34.6% 18 21.2% 11 11.5% 6 0 0 9.6% 5 La Frontera 33.3% 13 23.1% 9 5.1% 2 2.6% 1 12.8% 5 Sierra Vista 28.0% 7 40.0% 10 4.0% 1 0 0 4.0% 1 Tuba City 23.5% 4 17.6% 3 23.5% 4 5.9% 1 11.8% 2 Verde Valley 15.6% 7 37.8% 17 0 0 6.7% 3 6.7% 3 Yuma 37.5% 12 31.3% 19 15.6% 5 6.3% 2 3.1% 1 Pascua Yaqui 32.1% 9 17.9% 5 7.1% 2 0 0 21.4% 6 Lake Havasu 23.3% 14 31.7% 19 23.3% 14 3.3% 2 8.3% 5 City
Flagstaff 22.6% 7 48.4% 15 19.4% 6 6.5% 2 0 0 Sunnyslope 37.9% 11 13.8% 4 27.6% 8 10.3% 3 3.4% 1 Prescott 21.2% 11 36.5% 19 9.6% 5 1.9% 1 15.4% 8 Coolidge 19.4% 6 22.6% 7 6.5% 2 12.9% 4 9.7% 3 Mesa 23.1% 9 41.0% 16 10.3% 4 10.3% 4 2.6% 1 Southeast 33.3% 12 8.3% 3 13.9% 5 13.9% 5 8.3% 3 Phoenix
El Mirage 51.3% 20 5.1% 2 7.7% 3 10.3% 4 2.6% 1 Blake 16.7% 9 22.2% 12 3.7% 2 14.8% 8 13.0% 7 Foundation
Marana 15.9% 8 31.8% 14 13.6% 6 9.1% 4 2.3% 1 Safford 13.3% 2 26.7% 4 6.7% 1 0 0 0 0 Stanfield (Pinal) 70.6% 12 17.6% 3 5.9% 1 0 0 0 0 Apache Junction 34.0% 16 31.9% 15 19.1% 9 4.3% 2 0 0 Gila River 38.5% 5 23.1% 3 7.7% 1 0 0 0 0 Winslow 38.9% 7 11.1% 2 11.1% 2 11.1% 2 0 0 Kingman 25.0% 6 25.0% 6 16.7% 4 29.2% 7 0 0 Globe/Miami 75.0% 9 0 0 8.3% 1 8.3% 1 0 0 Kyrene 18.4% 7 31.6% 12 21.1% 8 5.3% 2 0 0 Metro Phoenix 51.9% 14 33.3% 9 3.7% 1 11.1% 3 0 0 Tolleson 26.7% 8 26.7% 8 26.7% 8 0 0 3.3% 1 South Mountain 47.2% 25 13.2% 7 11.3% 6 9.4% 5 0 0
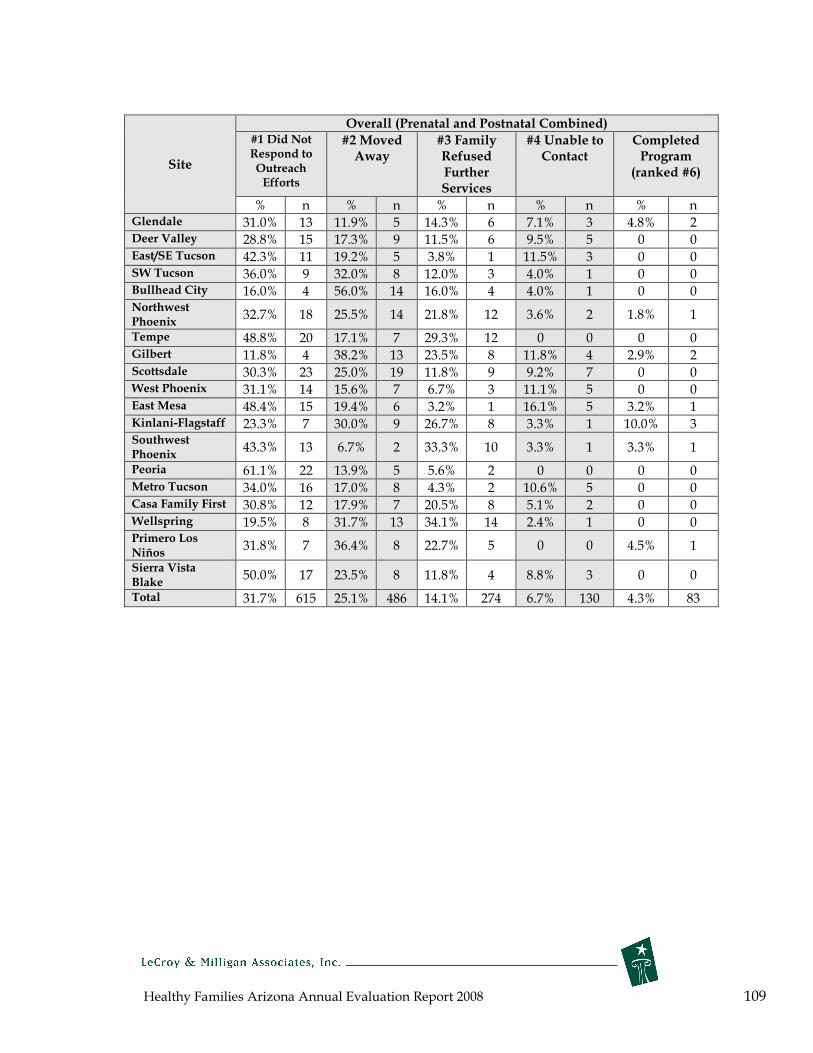
Healthy Families Arizona Annual Evaluation Report 2008 109
Site
Overall (Prenatal and Postnatal Combined) #1 Did Not Respond to Outreach Efforts
#2 Moved Away
#3 Family Refused Further Services
#4 Unable Contact
to Completed Program
(ranked #6)
% n % n % n % n % n Glendale 31.0% 13 11.9% 5 14.3% 6 7.1% 3 4.8% 2 Deer Valley 28.8% 15 17.3% 9 11.5% 6 9.5% 5 0 0 East/SE Tucson 42.3% 11 19.2% 5 3.8% 1 11.5% 3 0 0 SW Tucson 36.0% 9 32.0% 8 12.0% 3 4.0% 1 0 0 Bullhead City 16.0% 4 56.0% 14 16.0% 4 4.0% 1 0 0 Northwest Phoenix
32.7% 18 25.5% 14 21.8% 12 3.6% 2 1.8% 1
Tempe 48.8% 20 17.1% 7 29.3% 12 0 0 0 0 Gilbert 11.8% 4 38.2% 13 23.5% 8 11.8% 4 2.9% 2 Scottsdale 30.3% 23 25.0% 19 11.8% 9 9.2% 7 0 0 West Phoenix 31.1% 14 15.6% 7 6.7% 3 11.1% 5 0 0 East Mesa 48.4% 15 19.4% 6 3.2% 1 16.1% 5 3.2% 1 Kinlani-Flagstaff 23.3% 7 30.0% 9 26.7% 8 3.3% 1 10.0% 3 Southwest Phoenix
43.3% 13 6.7% 2 33.3% 10 3.3% 1 3.3% 1
Peoria 61.1% 22 13.9% 5 5.6% 2 0 0 0 0 Metro Tucson 34.0% 16 17.0% 8 4.3% 2 10.6% 5 0 0 Casa Family First 30.8% 12 17.9% 7 20.5% 8 5.1% 2 0 0 Wellspring 19.5% 8 31.7% 13 34.1% 14 2.4% 1 0 0 Primero Niños
Los 31.8% 7 36.4% 8 22.7% 5 0 0 4.5% 1
Sierra Blake
Vista 50.0% 17 23.5% 8 11.8% 4 8.8% 3 0 0
Total 31.7% 615 25.1% 486 14.1% 274 6.7% 130 4.3% 83

Healthy Families Arizona Annual Evaluation Report 2008 110
Health Insurance by Site at Intake – 2008
Percent and number within Site*
Site
PRENATAL POSTNATAL
None AHCCCS Private None AHCCCS Private % n % n % n % n % n % n
Douglas 7.7% 2 88.5% 23 0 0 1.3% 1 94.7% 71 4.0% 3 Central Phoenix 5.3% 1 84.2% 16 10.5% 2 8.0% 7 87.4% 76 3.4% 3 Maryvale 4.8% 1 90.5% 19 4.8% 1 4.9% 5 85.3% 87 9.8% 10 South Phoenix 11.8% 2 82.4% 14 5.9% 1 2.3% 2 89.5% 77 8.1% 7 East Valley 27.3% 3 72.7% 8 0 0 4.0% 4 82.8% 82 13.1% 13 Nogales 20.7% 6 72.4% 12 3.4% 1 10.4% 11 84.9% 90 3.8% 4 Page 0 0 100.0% 7 0 0 0 0 100.0% 37 0 0 Casa de Niños
los 3.7% 1 96.3% 26 0 0 2.5% 2 91.1% 72 2.5% 2
CODAC 7.3% 3 85.4% 35 4.9% 2 3.0% 3 89.1% 90 5.9% 6 La Frontera 4.9% 2 90.2% 37 2.4% 1 1.0% 1 94.8% 91 3.1% 3 Sierra Vista 0 0 72.7% 8 27.3% 3 3.8% 2 67.3% 35 23.1% 12 Tuba City 0 0 93.8% 15 0 0 2.4% 1 95.2% 40 0 0 Verde Valley 12.7% 8 73.0% 46 14.3% 9 5.4% 4 86.5% 64 8.1% 6 Yuma 15.4% 2 76.9% 10 7.7% 1 1.4% 1 94.6% 70 4.1% 3 Pascua Yaqui 0 0 95.7% 45 2.1% 1 0 0 97.3% 36 2.7% 1 Lake City
Havasu 2.1% 1 81.3% 39 16.7% 8 5.8% 5 88.4% 76 5.8% 5
Flagstaff 14.3% 5 71.4% 25 11.4% 4 2.4% 1 85.7% 36 11.9% 5 Sunnyslope 16.7% 5 83.3% 25 0 0 3.9% 3 84.2% 64 10.5% 8 Prescott 11.1% 2 72.2% 13 11.1% 2 3.4% 3 83.9% 99 10.2% 12 Coolidge 8.3% 1 83.3% 10 8.3% 1 1.2% 1 86.7% 72 12.0% 10 Mesa 0 0 76.2% 16 19.0% 4 5.8% 6 75.0% 78 18.3% 19 Southeast Phoenix
15.4% 2 84.6% 11 0 0 2.4% 2 88.1% 74 9.5% 8
El Mirage 10.0% 1 80.0% 8 10.0% 1 2.0% 2 70.0% 70 26.0% 26 Blake Foundation
7.1% 2 85.7% 24 7.1% 2 3.8% 4 89.4% 93 5.8% 6
Marana 4.8% 1 76.2% 16 14.3% 3 3.8% 3 85.9% 67 3.8% 3 Safford 0 0 81.3% 13 18.8% 3 0 0 87.9% 29 12.1% 4 Stanfield (Pinal) 8.3% 1 83.3% 10 8.3% 1 9.5% 2 90.5% 19 0 0 Apache Junction 7.4% 2 81.5% 22 11.1% 3 2.7% 2 80.8% 59 13.7% 10 Gila River 0 0 94.1% 16 5.9% 1 0 0 100.0% 16 0 0 Winslow 14.3% 1 85.7% 6 0 0 0 0 100.0% 29 0 0 Kingman 13.6% 3 68.2% 15 18.2% 4 2.1% 1 87.5% 42 10.4% 5 Globe/Miami 0 0 100.0% 9 0 0 0 0 83.3% 20 16.7% 4 Kyrene 8.3% 2 83.3% 20 8.3% 2 3.4% 3 78.4% 69 15.9% 14 Metro Phoenix 0 0 100.0% 10 0 0 3.1% 3 85.7% 84 11.2% 11 Tolleson 7.7% 1 84.6% 11 0 0 10.8% 9 74.7% 62 13.3% 11 South Mountain 15.8% 8 68.4% 13 15.8% 3 3.6% 4 84.8% 95 9.8% 11 Glendale 11.1% 2 88.9% 16 0 0 2.0% 2 82.8% 82 13.1% 13 Deer Valley 15.4% 2 42.6% 6 38.5% 5 4.8% 4 83.1% 69 12.0% 10

Healthy Families Arizona Annual Evaluation Report 2008 111
Site
PRENATAL POSTNATAL
None AHCCCS Private None AHCCCS Private % n % n % n % n % n % n
East/SE Tucson 2.8% 1 77.8% 28 13.9% 5 3.4% 3 85.2% 75 10.2% 9 SW Tucson 8.7% 2 91.3% 21 0 0 5.3% 4 90.7% 68 4.0% 3 Bullhead City 6.7% 1 80.0% 12 13.3% 2 8.3% 4 85.4% 41 6.3% 3 Northwest Phoenix
11.8% 2 41.2% 7 47.1% 8 6.4% 6 85.1% 80 8.5% 8
Tempe 11.1% 2 88.9% 16 0 0 3.0% 3 82.8% 82 14.1% 14 Gilbert 2.3% 1 95.5% 42 2.3% 1 4.6% 3 66.2% 43 23.1% 15 Scottsdale 0 0 84.0% 21 12.0% 3 1.6% 2 80.6% 104 17.8% 23 West Phoenix 11.8% 2 88.2% 15 0 0 5.1% 5 85.9% 85 9.1% 9 East Mesa 8.0% 2 88.0% 22 4.0% 1 1.3% 1 90.9% 70 6.5% 5 Kinlani-Flagstaff 9.3% 4 90.7% 39 0 0 0 0 86.5% 32 13.5% 5 Southwest Phoenix
7.7% 1 84.6% 11 0 0 2.5% 2 83.8% 67 13.8% 11
Peoria 16.7% 3 72.2% 13 5.6% 1 1.5% 1 79.4% 54 17.6% 12 Metro Tucson 7.7% 2 84.6% 22 3.8% 1 5.8% 5 87.2% 75 4.7% 4 Casa Family First 11.4% 4 80.0% 28 2.9% 1 0 0 91.5% 86 7.4% 7 Wellspring 11.1% 3 77.8% 21 7.4% 2 0 0 88.4% 38 11.6% 5 Primero Niños
Los 16.7% 1 83.3% 5 0 0 7.8% 5 89.1% 57 3.1% 2
Sierra Blake
Vista 4.8% 1 66.7% 14 23.8% 5 7.5% 4 64.2% 34 24.5% 13
Total 8.1% 100 82.3% 1021 8.0% 99 3.7% 153 85.1% 3513 10.1% 416 *”Other” insurance percentages are not listed in this table but can be estimated by subtracting the sum of the other insurance categories from 100.
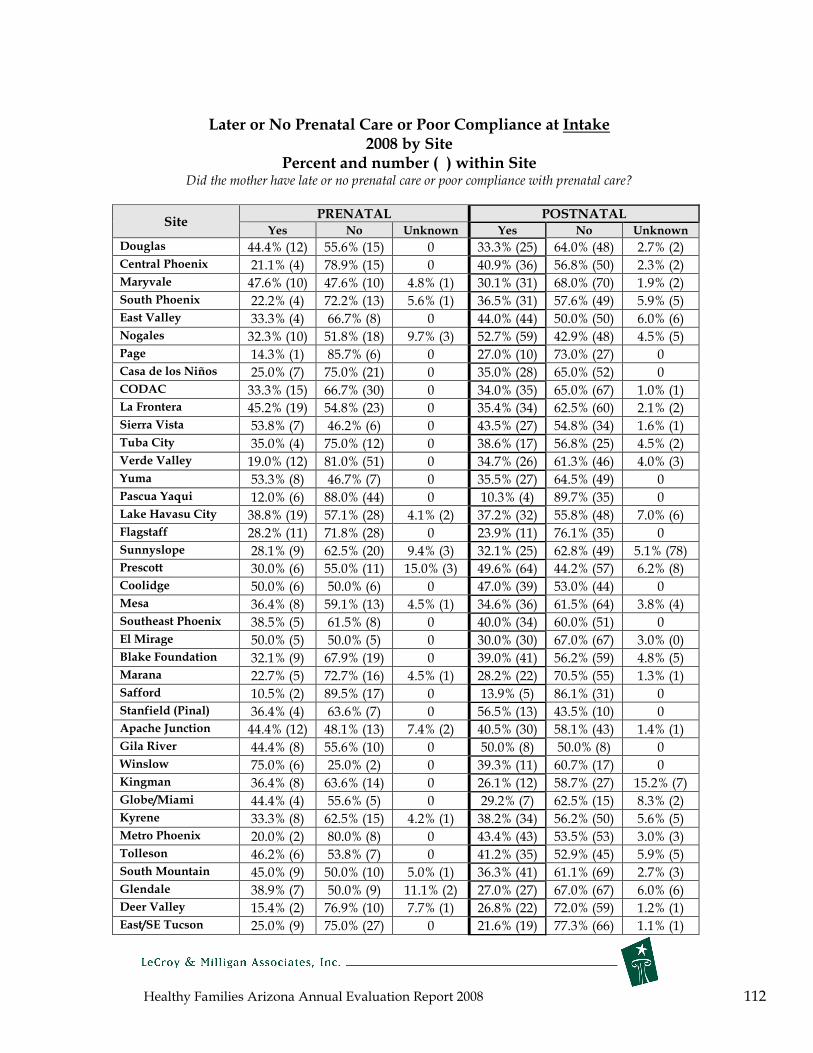
Healthy Families Arizona Annual Evaluation Report 2008 112
Later or No Prenatal Care or Poor Compliance at Intake 2008 by Site
Percent and number ( ) within Site Did the mother have late or no prenatal care or poor compliance with prenatal care?
Site PRENATAL POSTNATAL
Yes No Unknown Yes No Unknown
Douglas 44.4% (12) 55.6% (15) 0 33.3% (25) 64.0% (48) 2.7% (2) Central Phoenix 21.1% (4) 78.9% (15) 0 40.9% (36) 56.8% (50) 2.3% (2) Maryvale 47.6% (10) 47.6% (10) 4.8% (1) 30.1% (31) 68.0% (70) 1.9% (2) South Phoenix 22.2% (4) 72.2% (13) 5.6% (1) 36.5% (31) 57.6% (49) 5.9% (5) East Valley 33.3% (4) 66.7% (8) 0 44.0% (44) 50.0% (50) 6.0% (6) Nogales 32.3% (10) 51.8% (18) 9.7% (3) 52.7% (59) 42.9% (48) 4.5% (5) Page 14.3% (1) 85.7% (6) 0 27.0% (10) 73.0% (27) 0 Casa de los Niños 25.0% (7) 75.0% (21) 0 35.0% (28) 65.0% (52) 0 CODAC 33.3% (15) 66.7% (30) 0 34.0% (35) 65.0% (67) 1.0% (1) La Frontera 45.2% (19) 54.8% (23) 0 35.4% (34) 62.5% (60) 2.1% (2) Sierra Vista 53.8% (7) 46.2% (6) 0 43.5% (27) 54.8% (34) 1.6% (1) Tuba City 35.0% (4) 75.0% (12) 0 38.6% (17) 56.8% (25) 4.5% (2) Verde Valley 19.0% (12) 81.0% (51) 0 34.7% (26) 61.3% (46) 4.0% (3) Yuma 53.3% (8) 46.7% (7) 0 35.5% (27) 64.5% (49) 0 Pascua Yaqui 12.0% (6) 88.0% (44) 0 10.3% (4) 89.7% (35) 0 Lake Havasu City 38.8% (19) 57.1% (28) 4.1% (2) 37.2% (32) 55.8% (48) 7.0% (6) Flagstaff 28.2% (11) 71.8% (28) 0 23.9% (11) 76.1% (35) 0 Sunnyslope 28.1% (9) 62.5% (20) 9.4% (3) 32.1% (25) 62.8% (49) 5.1% (78) Prescott 30.0% (6) 55.0% (11) 15.0% (3) 49.6% (64) 44.2% (57) 6.2% (8) Coolidge 50.0% (6) 50.0% (6) 0 47.0% (39) 53.0% (44) 0 Mesa 36.4% (8) 59.1% (13) 4.5% (1) 34.6% (36) 61.5% (64) 3.8% (4) Southeast Phoenix 38.5% (5) 61.5% (8) 0 40.0% (34) 60.0% (51) 0 El Mirage 50.0% (5) 50.0% (5) 0 30.0% (30) 67.0% (67) 3.0% (0) Blake Foundation 32.1% (9) 67.9% (19) 0 39.0% (41) 56.2% (59) 4.8% (5) Marana 22.7% (5) 72.7% (16) 4.5% (1) 28.2% (22) 70.5% (55) 1.3% (1) Safford 10.5% (2) 89.5% (17) 0 13.9% (5) 86.1% (31) 0 Stanfield (Pinal) 36.4% (4) 63.6% (7) 0 56.5% (13) 43.5% (10) 0 Apache Junction 44.4% (12) 48.1% (13) 7.4% (2) 40.5% (30) 58.1% (43) 1.4% (1) Gila River 44.4% (8) 55.6% (10) 0 50.0% (8) 50.0% (8) 0 Winslow 75.0% (6) 25.0% (2) 0 39.3% (11) 60.7% (17) 0 Kingman 36.4% (8) 63.6% (14) 0 26.1% (12) 58.7% (27) 15.2% (7) Globe/Miami 44.4% (4) 55.6% (5) 0 29.2% (7) 62.5% (15) 8.3% (2) Kyrene 33.3% (8) 62.5% (15) 4.2% (1) 38.2% (34) 56.2% (50) 5.6% (5) Metro Phoenix 20.0% (2) 80.0% (8) 0 43.4% (43) 53.5% (53) 3.0% (3) Tolleson 46.2% (6) 53.8% (7) 0 41.2% (35) 52.9% (45) 5.9% (5) South Mountain 45.0% (9) 50.0% (10) 5.0% (1) 36.3% (41) 61.1% (69) 2.7% (3) Glendale 38.9% (7) 50.0% (9) 11.1% (2) 27.0% (27) 67.0% (67) 6.0% (6) Deer Valley 15.4% (2) 76.9% (10) 7.7% (1) 26.8% (22) 72.0% (59) 1.2% (1) East/SE Tucson 25.0% (9) 75.0% (27) 0 21.6% (19) 77.3% (66) 1.1% (1)
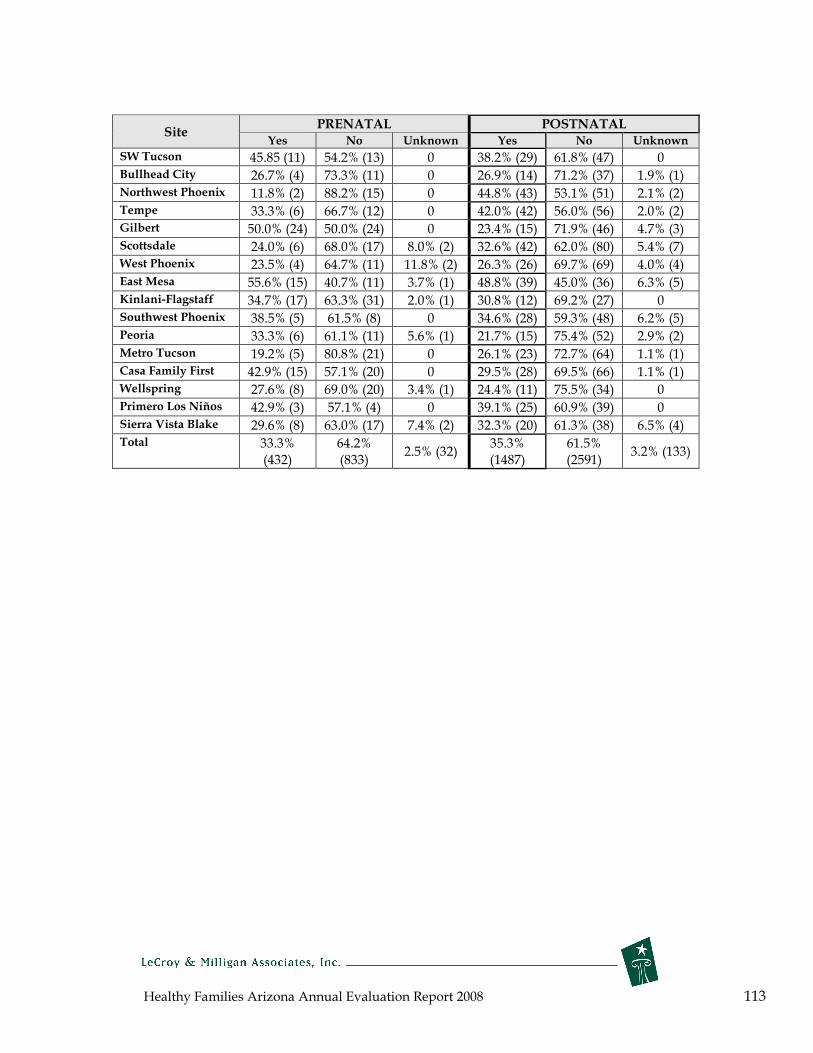
Healthy Families Arizona Annual Evaluation Report 2008 113
Site PRENATAL POSTNATAL
Yes No Unknown Yes No Unknown
SW Tucson 45.85 (11) 54.2% (13) 0 38.2% (29) 61.8% (47) 0 Bullhead City 26.7% (4) 73.3% (11) 0 26.9% (14) 71.2% (37) 1.9% (1) Northwest Phoenix 11.8% (2) 88.2% (15) 0 44.8% (43) 53.1% (51) 2.1% (2) Tempe 33.3% (6) 66.7% (12) 0 42.0% (42) 56.0% (56) 2.0% (2) Gilbert 50.0% (24) 50.0% (24) 0 23.4% (15) 71.9% (46) 4.7% (3) Scottsdale 24.0% (6) 68.0% (17) 8.0% (2) 32.6% (42) 62.0% (80) 5.4% (7) West Phoenix 23.5% (4) 64.7% (11) 11.8% (2) 26.3% (26) 69.7% (69) 4.0% (4) East Mesa 55.6% (15) 40.7% (11) 3.7% (1) 48.8% (39) 45.0% (36) 6.3% (5) Kinlani-Flagstaff 34.7% (17) 63.3% (31) 2.0% (1) 30.8% (12) 69.2% (27) 0 Southwest Phoenix 38.5% (5) 61.5% (8) 0 34.6% (28) 59.3% (48) 6.2% (5) Peoria 33.3% (6) 61.1% (11) 5.6% (1) 21.7% (15) 75.4% (52) 2.9% (2) Metro Tucson 19.2% (5) 80.8% (21) 0 26.1% (23) 72.7% (64) 1.1% (1) Casa Family First 42.9% (15) 57.1% (20) 0 29.5% (28) 69.5% (66) 1.1% (1) Wellspring 27.6% (8) 69.0% (20) 3.4% (1) 24.4% (11) 75.5% (34) 0 Primero Los Niños 42.9% (3) 57.1% (4) 0 39.1% (25) 60.9% (39) 0 Sierra Vista Blake 29.6% (8) 63.0% (17) 7.4% (2) 32.3% (20) 61.3% (38) 6.5% (4) Total 33.3%
(432) 64.2% (833)
2.5% (32) 35.3% (1487)
61.5% (2591)
3.2% (133)
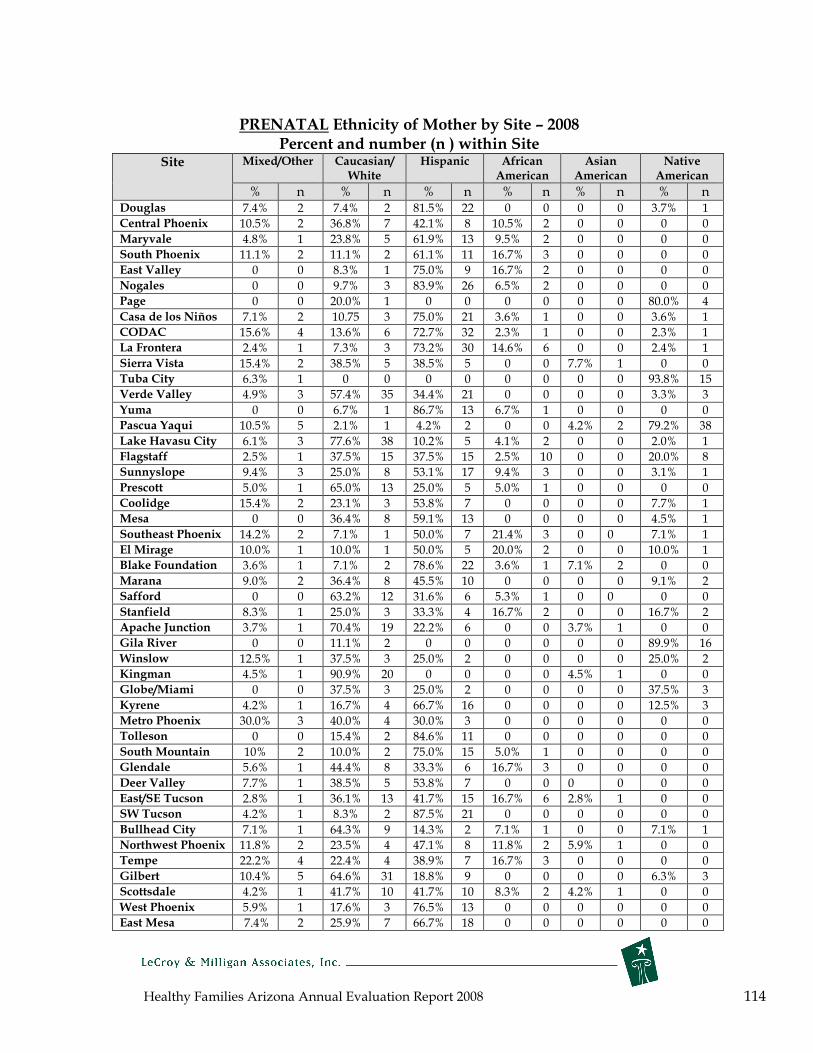
Healthy Families Arizona Annual Evaluation Report 2008 114
PRENATAL Ethnicity of Mother by Site – 2008 Percent and number (n ) within Site
Site Mixed/Other Caucasian/ White
Hispanic African American
Asian American
Native American
% n % n % n % n % n % n Douglas 7.4% 2 7.4% 2 81.5% 22 0 0 0 0 3.7% 1 Central Phoenix 10.5% 2 36.8% 7 42.1% 8 10.5% 2 0 0 0 0 Maryvale 4.8% 1 23.8% 5 61.9% 13 9.5% 2 0 0 0 0 South Phoenix 11.1% 2 11.1% 2 61.1% 11 16.7% 3 0 0 0 0 East Valley 0 0 8.3% 1 75.0% 9 16.7% 2 0 0 0 0 Nogales 0 0 9.7% 3 83.9% 26 6.5% 2 0 0 0 0 Page 0 0 20.0% 1 0 0 0 0 0 0 80.0% 4 Casa de los Niños 7.1% 2 10.75 3 75.0% 21 3.6% 1 0 0 3.6% 1 CODAC 15.6% 4 13.6% 6 72.7% 32 2.3% 1 0 0 2.3% 1 La Frontera 2.4% 1 7.3% 3 73.2% 30 14.6% 6 0 0 2.4% 1 Sierra Vista 15.4% 2 38.5% 5 38.5% 5 0 0 7.7% 1 0 0 Tuba City 6.3% 1 0 0 0 0 0 0 0 0 93.8% 15 Verde Valley 4.9% 3 57.4% 35 34.4% 21 0 0 0 0 3.3% 3 Yuma 0 0 6.7% 1 86.7% 13 6.7% 1 0 0 0 0 Pascua Yaqui 10.5% 5 2.1% 1 4.2% 2 0 0 4.2% 2 79.2% 38 Lake Havasu City 6.1% 3 77.6% 38 10.2% 5 4.1% 2 0 0 2.0% 1 Flagstaff 2.5% 1 37.5% 15 37.5% 15 2.5% 10 0 0 20.0% 8 Sunnyslope 9.4% 3 25.0% 8 53.1% 17 9.4% 3 0 0 3.1% 1 Prescott 5.0% 1 65.0% 13 25.0% 5 5.0% 1 0 0 0 0 Coolidge 15.4% 2 23.1% 3 53.8% 7 0 0 0 0 7.7% 1 Mesa 0 0 36.4% 8 59.1% 13 0 0 0 0 4.5% 1 Southeast Phoenix 14.2% 2 7.1% 1 50.0% 7 21.4% 3 0 0 7.1% 1 El Mirage 10.0% 1 10.0% 1 50.0% 5 20.0% 2 0 0 10.0% 1 Blake Foundation 3.6% 1 7.1% 2 78.6% 22 3.6% 1 7.1% 2 0 0 Marana 9.0% 2 36.4% 8 45.5% 10 0 0 0 0 9.1% 2 Safford 0 0 63.2% 12 31.6% 6 5.3% 1 0 0 0 0 Stanfield 8.3% 1 25.0% 3 33.3% 4 16.7% 2 0 0 16.7% 2 Apache Junction 3.7% 1 70.4% 19 22.2% 6 0 0 3.7% 1 0 0 Gila River 0 0 11.1% 2 0 0 0 0 0 0 89.9% 16 Winslow 12.5% 1 37.5% 3 25.0% 2 0 0 0 0 25.0% 2 Kingman 4.5% 1 90.9% 20 0 0 0 0 4.5% 1 0 0 Globe/Miami 0 0 37.5% 3 25.0% 2 0 0 0 0 37.5% 3 Kyrene 4.2% 1 16.7% 4 66.7% 16 0 0 0 0 12.5% 3 Metro Phoenix 30.0% 3 40.0% 4 30.0% 3 0 0 0 0 0 0 Tolleson 0 0 15.4% 2 84.6% 11 0 0 0 0 0 0 South Mountain 10% 2 10.0% 2 75.0% 15 5.0% 1 0 0 0 0 Glendale 5.6% 1 44.4% 8 33.3% 6 16.7% 3 0 0 0 0 Deer Valley 7.7% 1 38.5% 5 53.8% 7 0 0 0 0 0 0 East/SE Tucson 2.8% 1 36.1% 13 41.7% 15 16.7% 6 2.8% 1 0 0 SW Tucson 4.2% 1 8.3% 2 87.5% 21 0 0 0 0 0 0 Bullhead City 7.1% 1 64.3% 9 14.3% 2 7.1% 1 0 0 7.1% 1 Northwest Phoenix 11.8% 2 23.5% 4 47.1% 8 11.8% 2 5.9% 1 0 0 Tempe 22.2% 4 22.4% 4 38.9% 7 16.7% 3 0 0 0 0 Gilbert 10.4% 5 64.6% 31 18.8% 9 0 0 0 0 6.3% 3 Scottsdale 4.2% 1 41.7% 10 41.7% 10 8.3% 2 4.2% 1 0 0 West Phoenix 5.9% 1 17.6% 3 76.5% 13 0 0 0 0 0 0 East Mesa 7.4% 2 25.9% 7 66.7% 18 0 0 0 0 0 0

Healthy Families Arizona Annual Evaluation Report 2008 115
Site Mixed/Other Caucasian/ White
Hispanic African American
Asian American
Native American
% n % n % n % n % n % n Kinlani-Flagstaff 0 0 12.2% 6 61.2% 30 0 0 0 0 26.5% 13 Southwest Phoenix 7.7% 1 7.7% 1 76.9% 10 7.7% 1 0 0 0 0 Peoria 5.6% 1 33.3% 6 55.6% 10 5.6% 1 0 0 0 0 Metro Tucson 3.8% 1 38.5% 10 50.0% 13 3.8% 1 0 0 3.8% 1 Casa Family First 0 0 20.0% 7 71.4% 25 2.9% 1 0 0 5.7% 2 Wellspring 7.2% 2 25.0% 7 28.6% 8 3.6% 1 0 0 35.7% 10 Primero Los Niños 0 0 16.7% 1 83.3% 5 0 0 0 0 0 0 Sierra Vista Blake 0 0 70.4% 19 22.2% 6 7.4% 2 0 0 0 0 Total 5.9% 76 31.0% 399 47.1% 607 4.7% 61 .8% 10 10.5% 135

Healthy Families Arizona Annual Evaluation Report 2008 116
POSTNATAL Ethnicity of Mother by Site – 2008 Percent and number ( ) within Site
Site Mixed/Other Caucasian/ White
Hispanic African American
Asian American
Native American
% n % n % n % n % n % n Douglas 2.6% 2 8.0% 6 88.0% 66 0 0 1.3% 1 0 0 Central Phoenix 2.2% 2 20.2% 18 69.7% 62 5.6% 5 0 0 2.2% 2 Maryvale 3.0% 3 18.4% 19 66.0% 68 9.7% 10 1.0% 1 1.9% 2 South Phoenix 4.8% 4 16.5% 14 57.6% 49 18.8% 16 1.2% 1 1.2% 1 East Valley 3.0% 3 34.3% 34 52.5% 52 7.1% 7 1.0% 1 2.0% 2 Nogales 0 0 .9% 1 98.2% 110 0 0 0 0 .9% 1 Page 0 0 2.9% 1 0 0 0 0 0 0 97.1% 34 Casa de los Niños 1.3% 1 13.8% 11 75.0% 60 2.5% 2 2.5% 2 5.0% 4 CODAC 7.9% 8 25.5% 26 60.8% 62 2.0% 2 1.0% 1 2.9% 3 La Frontera 8.3% 8 14.6% 14 71.9% 69 4.2% 4 0 0 1.0% 1 Sierra Vista 4.8% 3 43.5% 27 48.4% 30 3.2% 2 0 0 0 0 Tuba City 2.3% 1 0 0 0 0 0 0 2.3% 1 95.5% 42 Verde Valley 0 0 52.1% 38 42.5% 31 1.4% 1 0 0 4.1% 3 Yuma 3.2% 2 4.7% 3 89.1% 57 1.6% 1 1.6% 1 0 0 Pascua Yaqui 13.1% 5 0 0 15.8% 6 2.6% 1 2.6% 1 65.8% 25 Lake Havasu City 8.2% 7 45.3% 39 40.7% 35 0 0 0 0 5.8% 5 Flagstaff 11.1% 5 33.3% 15 35.6% 16 0 0 0 0 20.0% 9 Sunnyslope 7.7% 6 33.3% 26 52.6% 41 5.1% 4 0 0 1.3% 1 Prescott 3.1% 4 43.4% 56 51.2% 66 .8% 1 .8% 1 .8% 1 Coolidge 0 0 33.3% 27 51.9% 42 3.7% 3 0 0 11.1% 9 Mesa 7.7% 8 30.5% 32 55.2% 58 3.8% 4 1.0% 1 1.9% 2 Southeast 2.4% 2 14.3% 12 72.6% 61 8.3% 7 0 0 2.4% 2 Phoenix
El Mirage 8.0% 8 38.4% 38 42.4% 42 7.1% 7 3.0% 3 1.0% 1 Blake Foundation 5.9% 6 24.5% 25 62.7% 64 6.9% 7 0 0 0 0 Marana 11.5% 9 35.9% 28 48.7% 38 2.6% 2 0 0 1.3% 1 Safford 5.9% 2 64.7% 22 23.5% 8 5.9% 2 0 0 0 0 Stanfield 4.5% 1 22.7% 5 50.0% 11 13.6% 3 0 0 9.1% 2 Apache Junction 1.4% 1 60.3% 44 34.2% 25 2.7% 2 0 0 1.4% 1 Gila River 0 0 12.5% 2 0 0 0 0 0 0 87.5% 14 Winslow 3.4% 1 10.3% 3 17.2% 5 6.9% 2 0 0 62.1% 18 Kingman 6.8% 3 77.3% 34 13.6% 2 0 0 2.3% 1 0 0 Globe/Miami 9.1% 2 50.0% 11 9.1% 2 0 0 0 0 31.8% 7 Kyrene 2.2% 2 24.7% 22 59.6% 53 5.6% 5 1.1% 1 6.7% 6 Metro Phoenix 5.0% 5 27.3% 27 52.5% 52 11.1% 11 0 0 4.0% 4 Tolleson 1.2% 1 8.2% 7 83.5% 71 5.9% 5 0 0 1.2% 1 South Mountain 3.6% 4 9.8% 11 74.1% 83 8.9% 10 .9% 1 2.7% 3 Glendale 7.0% 7 35.0% 35 48.0% 48 7.0% 7 1.0% 1 2.0% 2 Deer Valley 6.0% 5 42.4% 35 44.6% 37 3.6% 3 2.4% 2 1.2% 1 East/SE Tucson 8.4% 7 36.9% 31 45.2% 38 6.0% 5 1.2% 1 2.4% 2 SW Tucson 1.4% 1 6.8% 5 86.5% 64 2.7% 2 0 0 2.7% 2 Bullhead City 8.0% 4 64.0% 32 26.0% 13 2.0% 1 0 0 0 0 Northwest 8.2% 8 39.6% 38 40.6% 39 7.3% 7 0 0 4.2% 4 Phoenix
Tempe 9.0% 9 27.0% 27 55.0% 55 5.0% 5 1.0% 1 3.0% 3 Gilbert 7.7% 5 58.5% 38 21.5% 14 6.2% 4 0 0 6.2% 4 Scottsdale 10.1% 13 44.2% 57 36.4% 47 4.7% 6 0 0 4.7% 6
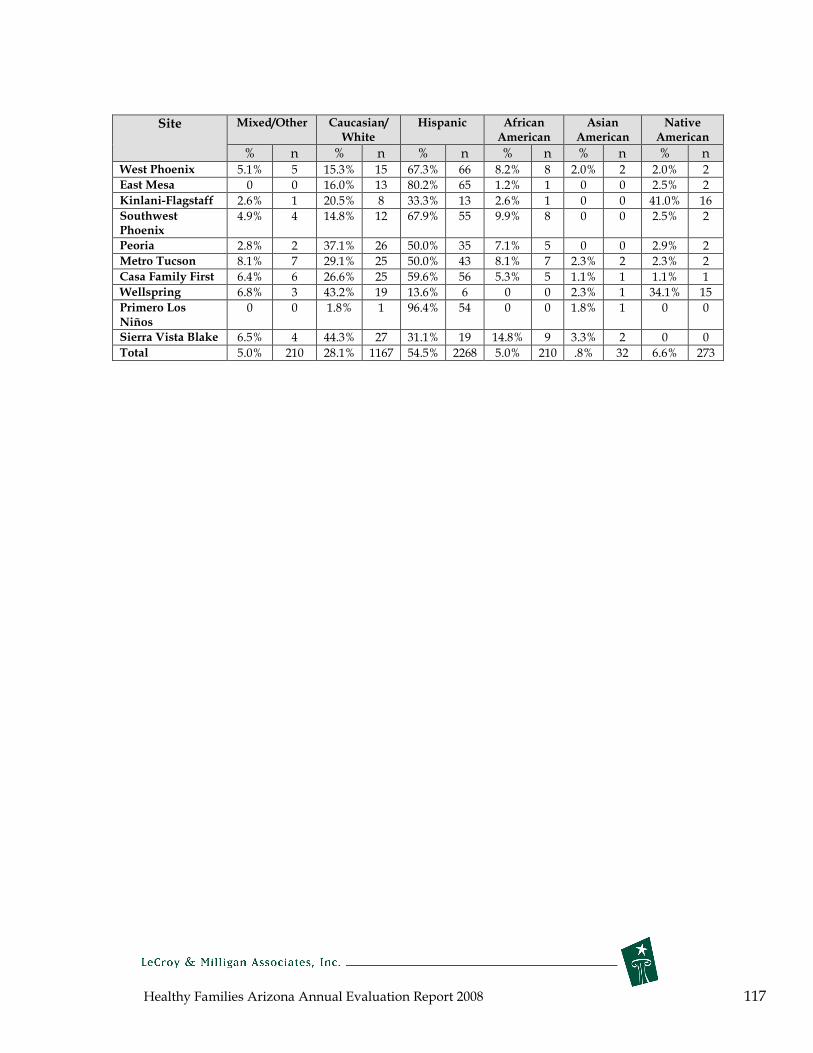
Healthy Families Arizona Annual Evaluation Report 2008 117
Site Mixed/Other Caucasian/ White
Hispanic African American
Asian American
Native American
% n % n % n % n % n % n West Phoenix 5.1% 5 15.3% 15 67.3% 66 8.2% 8 2.0% 2 2.0% 2 East Mesa 0 0 16.0% 13 80.2% 65 1.2% 1 0 0 2.5% 2 Kinlani-Flagstaff 2.6% 1 20.5% 8 33.3% 13 2.6% 1 0 0 41.0% 16 Southwest 4.9% 4 14.8% 12 67.9% 55 9.9% 8 0 0 2.5% 2 Phoenix
Peoria 2.8% 2 37.1% 26 50.0% 35 7.1% 5 0 0 2.9% 2 Metro Tucson 8.1% 7 29.1% 25 50.0% 43 8.1% 7 2.3% 2 2.3% 2 Casa Family First 6.4% 6 26.6% 25 59.6% 56 5.3% 5 1.1% 1 1.1% 1 Wellspring 6.8% 3 43.2% 19 13.6% 6 0 0 2.3% 1 34.1% 15 Primero Los 0 0 1.8% 1 96.4% 54 0 0 1.8% 1 0 0 Niños
Sierra Vista Blake 6.5% 4 44.3% 27 31.1% 19 14.8% 9 3.3% 2 0 0 Total 5.0% 210 28.1% 1167 54.5% 2268 5.0% 210 .8% 32 6.6% 273
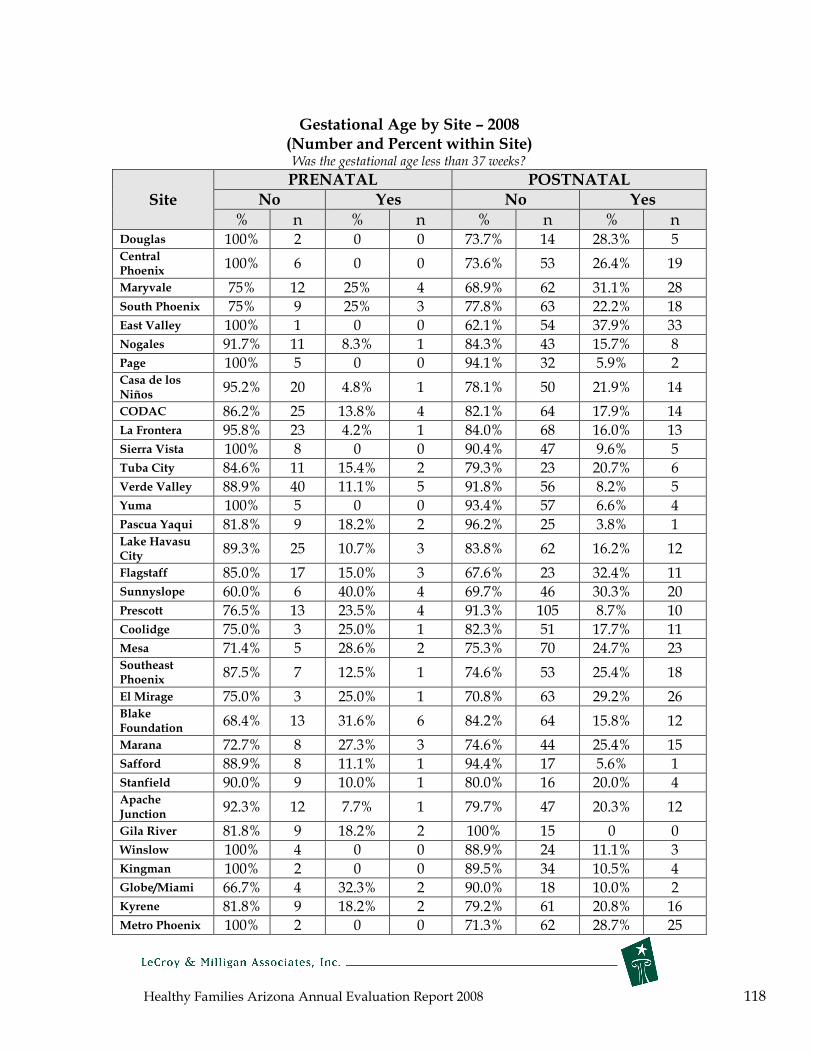
Healthy Families Arizona Annual Evaluation Report 2008 118
Gestational Age by Site – 2008 (Number and Percent within Site) Was the gestational age less than 37 weeks?
Site
PRENATAL POSTNATAL No Yes No Yes
% n % n % n % n Douglas 100% 2 0 0 73.7% 14 28.3% 5 Central Phoenix
100% 6 0 0 73.6% 53 26.4% 19
Maryvale 75% 12 25% 4 68.9% 62 31.1% 28 South Phoenix 75% 9 25% 3 77.8% 63 22.2% 18 East Valley 100% 1 0 0 62.1% 54 37.9% 33 Nogales 91.7% 11 8.3% 1 84.3% 43 15.7% 8 Page 100% 5 0 0 94.1% 32 5.9% 2 Casa de Niños
los 95.2% 20 4.8% 1 78.1% 50 21.9% 14
CODAC 86.2% 25 13.8% 4 82.1% 64 17.9% 14 La Frontera 95.8% 23 4.2% 1 84.0% 68 16.0% 13 Sierra Vista 100% 8 0 0 90.4% 47 9.6% 5 Tuba City 84.6% 11 15.4% 2 79.3% 23 20.7% 6 Verde Valley 88.9% 40 11.1% 5 91.8% 56 8.2% 5 Yuma 100% 5 0 0 93.4% 57 6.6% 4 Pascua Yaqui 81.8% 9 18.2% 2 96.2% 25 3.8% 1 Lake City
Havasu 89.3% 25 10.7% 3 83.8% 62 16.2% 12
Flagstaff 85.0% 17 15.0% 3 67.6% 23 32.4% 11 Sunnyslope 60.0% 6 40.0% 4 69.7% 46 30.3% 20 Prescott 76.5% 13 23.5% 4 91.3% 105 8.7% 10 Coolidge 75.0% 3 25.0% 1 82.3% 51 17.7% 11 Mesa 71.4% 5 28.6% 2 75.3% 70 24.7% 23 Southeast Phoenix
87.5% 7 12.5% 1 74.6% 53 25.4% 18
El Mirage 75.0% 3 25.0% 1 70.8% 63 29.2% 26 Blake Foundation
68.4% 13 31.6% 6 84.2% 64 15.8% 12
Marana 72.7% 8 27.3% 3 74.6% 44 25.4% 15 Safford 88.9% 8 11.1% 1 94.4% 17 5.6% 1 Stanfield 90.0% 9 10.0% 1 80.0% 16 20.0% 4 Apache Junction
92.3% 12 7.7% 1 79.7% 47 20.3% 12
Gila River 81.8% 9 18.2% 2 100% 15 0 0 Winslow 100% 4 0 0 88.9% 24 11.1% 3 Kingman 100% 2 0 0 89.5% 34 10.5% 4 Globe/Miami 66.7% 4 32.3% 2 90.0% 18 10.0% 2 Kyrene 81.8% 9 18.2% 2 79.2% 61 20.8% 16 Metro Phoenix 100% 2 0 0 71.3% 62 28.7% 25

Healthy Families Arizona Annual Evaluation Report 2008 119
Site
PRENATAL POSTNATAL
No Yes No Yes
% n % n % n % n Tolleson 100% 3 0 0 85.1% 63 14.9% 11 South Mountain
75.0% 9 25.0% 3 77.7% 80 22.3% 23
Glendale 75.0% 6 25.0% 2 75.6% 59 24.4% 19 Deer Valley 83.3% 5 16.7% 1 77.0% 47 23.0% 14 East/SE Tucson 80.0% 16 20.0% 4 69.5% 41 30.5% 18 SW Tucson 63.6% 7 36.4% 4 89.4% 59 10.6% 7 Bullhead City 0 0 100% 1 76.5% 13 23.5% 4 Northwest Phoenix
40.0% 2 60.0% 3 67.9% 57 32.1% 27
Tempe 60.0% 3 40.0% 2 77.8% 70 22.2% 20 Gilbert 89.5% 34 10.5% 4 60.3% 35 39.7% 23 Scottsdale 75.0% 9 25.0% 3 75.2% 85 24.8% 28 West Phoenix 100% 11 0 0 73.3% 55 26.7% 20 East Mesa 86.7% 13 13.3% 2 69.6% 48 30.4% 21 Kinlani-Flagstaff
84.4% 27 15.5% 5 95.8% 23 4.2% 1
Southwest Phoenix
50.0% 2 50.0% 2 80.3% 57 19.7% 14
Peoria 85.7% 6 14.3% 1 81.0% 51 19.0% 12 Metro Tucson 70.6% 12 29.4% 5 85.3% 64 14.7% 11 Casa First
Family 78.3% 18 21.7% 5 83.1% 64 16.9% 13
Wellspring 94.1% 16 5.9% 1 89.5% 17 10.5% 2 Primero Niños
Los 66.7% 2 33.3% 1 87.5% 42 12.5% 6
Sierra Blake
Vista 78.6% 11 21.4% 3 84.9% 45 15.1% 8
Total 83.3% 558 16.7% 112 79.1% 2,661 20.9% 702
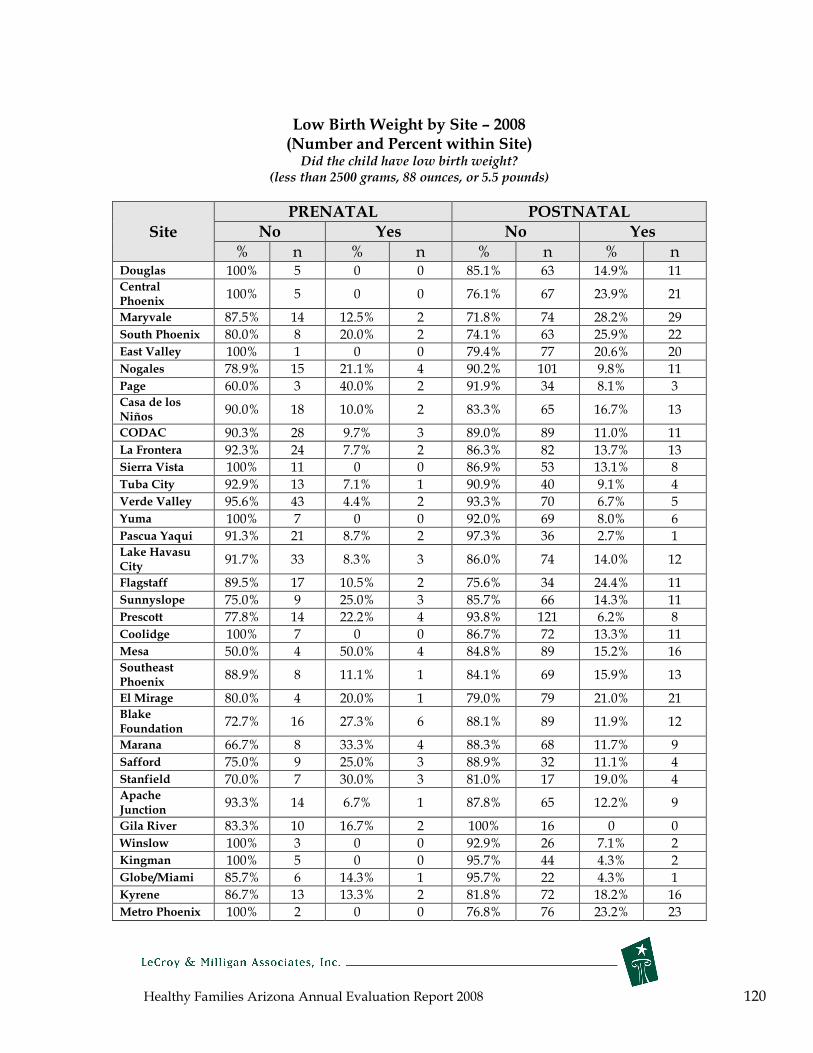
Healthy Families Arizona Annual Evaluation Report 2008 120
Low Birth Weight by Site – 2008 (Number and Percent within Site) Did the child have low birth weight?
(less than 2500 grams, 88 ounces, or 5.5 pounds)
Site
PRENATAL POSTNATAL No Yes No Yes
% n % n % n % n Douglas 100% 5 0 0 85.1% 63 14.9% 11 Central Phoenix
100% 5 0 0 76.1% 67 23.9% 21
Maryvale 87.5% 14 12.5% 2 71.8% 74 28.2% 29 South Phoenix 80.0% 8 20.0% 2 74.1% 63 25.9% 22 East Valley 100% 1 0 0 79.4% 77 20.6% 20 Nogales 78.9% 15 21.1% 4 90.2% 101 9.8% 11 Page 60.0% 3 40.0% 2 91.9% 34 8.1% 3 Casa de Niños
los 90.0% 18 10.0% 2 83.3% 65 16.7% 13
CODAC 90.3% 28 9.7% 3 89.0% 89 11.0% 11 La Frontera 92.3% 24 7.7% 2 86.3% 82 13.7% 13 Sierra Vista 100% 11 0 0 86.9% 53 13.1% 8 Tuba City 92.9% 13 7.1% 1 90.9% 40 9.1% 4 Verde Valley 95.6% 43 4.4% 2 93.3% 70 6.7% 5 Yuma 100% 7 0 0 92.0% 69 8.0% 6 Pascua Yaqui 91.3% 21 8.7% 2 97.3% 36 2.7% 1 Lake City
Havasu 91.7% 33 8.3% 3 86.0% 74 14.0% 12
Flagstaff 89.5% 17 10.5% 2 75.6% 34 24.4% 11 Sunnyslope 75.0% 9 25.0% 3 85.7% 66 14.3% 11 Prescott 77.8% 14 22.2% 4 93.8% 121 6.2% 8 Coolidge 100% 7 0 0 86.7% 72 13.3% 11 Mesa 50.0% 4 50.0% 4 84.8% 89 15.2% 16 Southeast Phoenix
88.9% 8 11.1% 1 84.1% 69 15.9% 13
El Mirage 80.0% 4 20.0% 1 79.0% 79 21.0% 21 Blake Foundation
72.7% 16 27.3% 6 88.1% 89 11.9% 12
Marana 66.7% 8 33.3% 4 88.3% 68 11.7% 9 Safford 75.0% 9 25.0% 3 88.9% 32 11.1% 4 Stanfield 70.0% 7 30.0% 3 81.0% 17 19.0% 4 Apache Junction
93.3% 14 6.7% 1 87.8% 65 12.2% 9
Gila River 83.3% 10 16.7% 2 100% 16 0 0 Winslow 100% 3 0 0 92.9% 26 7.1% 2 Kingman 100% 5 0 0 95.7% 44 4.3% 2 Globe/Miami 85.7% 6 14.3% 1 95.7% 22 4.3% 1 Kyrene 86.7% 13 13.3% 2 81.8% 72 18.2% 16 Metro Phoenix 100% 2 0 0 76.8% 76 23.2% 23
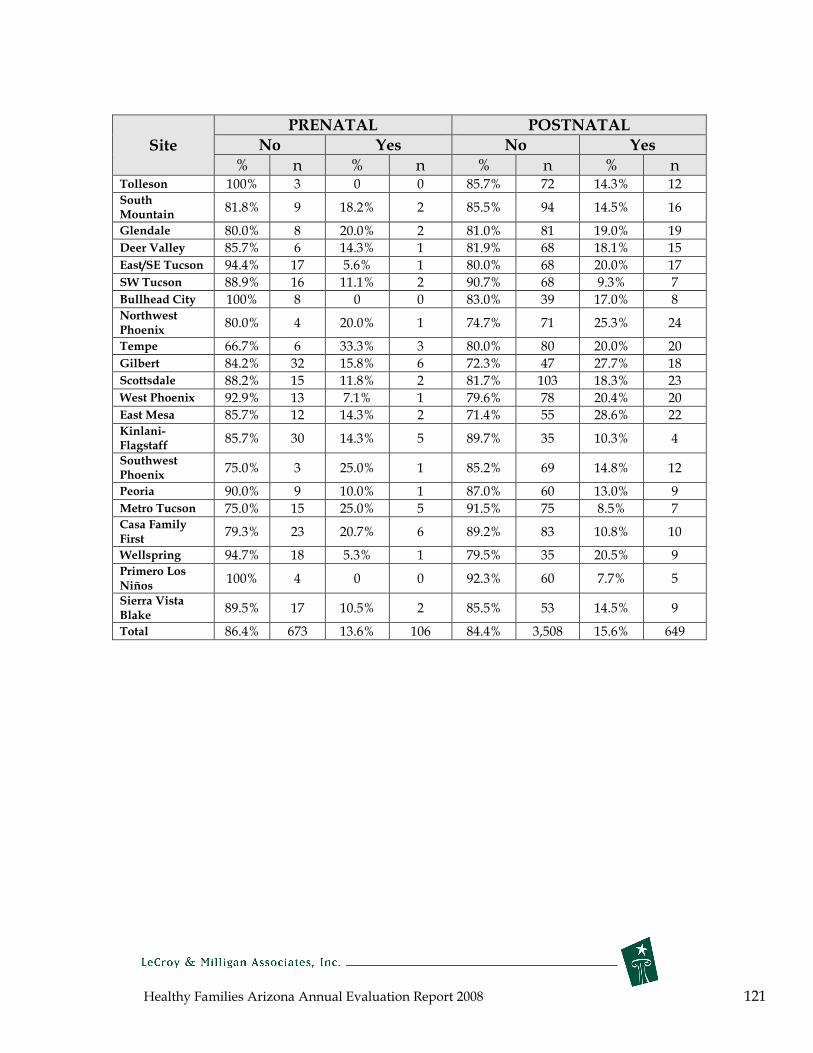
Healthy Families Arizona Annual Evaluation Report 2008 121
Site
PRENATAL POSTNATAL
No Yes No Yes
% n % n % n % n Tolleson 100% 3 0 0 85.7% 72 14.3% 12 South Mountain
81.8% 9 18.2% 2 85.5% 94 14.5% 16
Glendale 80.0% 8 20.0% 2 81.0% 81 19.0% 19 Deer Valley 85.7% 6 14.3% 1 81.9% 68 18.1% 15 East/SE Tucson 94.4% 17 5.6% 1 80.0% 68 20.0% 17 SW Tucson 88.9% 16 11.1% 2 90.7% 68 9.3% 7 Bullhead City 100% 8 0 0 83.0% 39 17.0% 8 Northwest Phoenix
80.0% 4 20.0% 1 74.7% 71 25.3% 24
Tempe 66.7% 6 33.3% 3 80.0% 80 20.0% 20 Gilbert 84.2% 32 15.8% 6 72.3% 47 27.7% 18 Scottsdale 88.2% 15 11.8% 2 81.7% 103 18.3% 23 West Phoenix 92.9% 13 7.1% 1 79.6% 78 20.4% 20 East Mesa 85.7% 12 14.3% 2 71.4% 55 28.6% 22 Kinlani-Flagstaff
85.7% 30 14.3% 5 89.7% 35 10.3% 4
Southwest Phoenix
75.0% 3 25.0% 1 85.2% 69 14.8% 12
Peoria 90.0% 9 10.0% 1 87.0% 60 13.0% 9 Metro Tucson 75.0% 15 25.0% 5 91.5% 75 8.5% 7 Casa First
Family 79.3% 23 20.7% 6 89.2% 83 10.8% 10
Wellspring 94.7% 18 5.3% 1 79.5% 35 20.5% 9 Primero Niños
Los 100% 4 0 0 92.3% 60 7.7% 5
Sierra Blake
Vista 89.5% 17 10.5% 2 85.5% 53 14.5% 9
Total 86.4% 673 13.6% 106 84.4% 3,508 15.6% 649
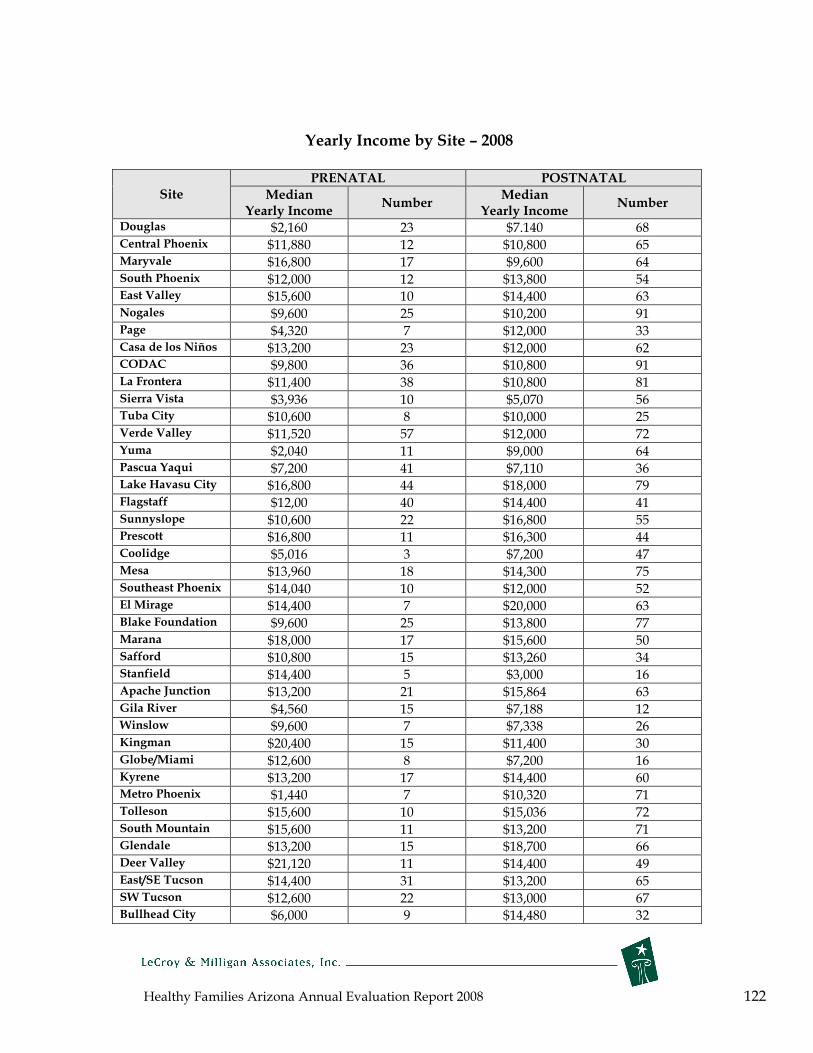
Healthy Families Arizona Annual Evaluation Report 2008 122
Yearly Income by Site – 2008
Site PRENATAL POSTNATAL
Median Yearly Income
Number Median
Yearly Income Number
Douglas $2,160 23 $7.140 68 Central Phoenix $11,880 12 $10,800 65 Maryvale $16,800 17 $9,600 64 South Phoenix $12,000 12 $13,800 54 East Valley $15,600 10 $14,400 63 Nogales $9,600 25 $10,200 91 Page $4,320 7 $12,000 33 Casa de los Niños $13,200 23 $12,000 62 CODAC $9,800 36 $10,800 91 La Frontera $11,400 38 $10,800 81 Sierra Vista $3,936 10 $5,070 56 Tuba City $10,600 8 $10,000 25 Verde Valley $11,520 57 $12,000 72 Yuma $2,040 11 $9,000 64 Pascua Yaqui $7,200 41 $7,110 36 Lake Havasu City $16,800 44 $18,000 79 Flagstaff $12,00 40 $14,400 41 Sunnyslope $10,600 22 $16,800 55 Prescott $16,800 11 $16,300 44 Coolidge $5,016 3 $7,200 47 Mesa $13,960 18 $14,300 75 Southeast Phoenix $14,040 10 $12,000 52 El Mirage $14,400 7 $20,000 63 Blake Foundation $9,600 25 $13,800 77 Marana $18,000 17 $15,600 50 Safford $10,800 15 $13,260 34 Stanfield $14,400 5 $3,000 16 Apache Junction $13,200 21 $15,864 63 Gila River $4,560 15 $7,188 12 Winslow $9,600 7 $7,338 26 Kingman $20,400 15 $11,400 30 Globe/Miami $12,600 8 $7,200 16 Kyrene $13,200 17 $14,400 60 Metro Phoenix $1,440 7 $10,320 71 Tolleson $15,600 10 $15,036 72 South Mountain $15,600 11 $13,200 71 Glendale $13,200 15 $18,700 66 Deer Valley $21,120 11 $14,400 49 East/SE Tucson $14,400 31 $13,200 65 SW Tucson $12,600 22 $13,000 67 Bullhead City $6,000 9 $14,480 32

Healthy Families Arizona Annual Evaluation Report 2008 123
Site PRENATAL POSTNATAL
Median Yearly Income
Number Median
Yearly Income Number
Northwest Phoenix
$19,200 13 $14,400 65
Tempe $9,600 15 $15,000 64 Gilbert 0 * 26 $16,800 38 Scottsdale $12,600 14 $14,400 71 West Phoenix $17,640 14 $17,040 72 East Mesa $15,520 18 $16,180 58 Kinlani-Flagstaff $9,600 45 $14,400 36 Southwest Phoenix
$11,622 8 $15,600 57
Peoria $7,680 11 $19,200 53 Metro Tucson $7,200 21 $12,000 74 Casa Family First $10,140 31 $13,476 73 Wellspring $12,000 24 $8,960 40 Primero Los Niños $12,000 3 $9,816 54 Sierra Vista Blake $6,480 25 $15,600 53 Total $11,832 1,014 $13,200 3,066
*17 families reported no income

Healthy Families Arizona Annual Evaluation Report 2008 124
Parent Survey Score by Site – 2008 PRENATAL POSTNATAL
Percent of Number of Percent of Number of mothers mothers mothers mothers
Site Mean whose whose Mean whose whose Score score was score was Score score was score was
greater than 40
greater than 40
greater than 40
greater than 40
Douglas 40.93 63.0% 17 36.07 37.3% 28 Central Phoenix
54.74 89.5% 17 46.18 71.9% 64
Maryvale 50.00 76.2% 16 45.49 68.9% 71 South Phoenix
46.67 66.7% 12 44.94 66.3% 57
East Valley 45.00 58.3% 7 42.65 63.0% 63 Nogales 41.29 51.6% 16 35.49 39.3% 44 Page 49.29 85.7% 6 33.24 27.0% 10 Casa de Niños
los 43.57 57.1% 16 37.00 40.0% 32
CODAC 41.00 51.1% 23 38.69 54.4% 56 La Frontera 42.14 59.5% 25 39.01 46.9% 45 Sierra Vista 41.15 46.2% 6 36.61 41.9% 26 Tuba City 36.25 56.3% 9 33.30 34.1% 15 Verde Valley 37.78 46.0% 29 39.13 53.3% 40 Yuma 37.00 46.7% 7 31.88 20.8% 16 Pascua Yaqui 31.60 22.0% 11 32.95 28.2% 11 Lake City
Havasu 48.70 73.5% 36 39.65 50.0% 43
Flagstaff 39.50 52.5% 21 41.63 60.9% 28 Sunnyslope 41.41 53.1% 17 41.22 59.0% 46 Prescott 51.00 80.0% 16 38.41 41.1% 53 Coolidge 42.69 61.5% 8 37.77 47.0% 39 Mesa 50.00 81.8% 18 40.42 50.9% 54 Southeast Phoenix
36.79 50.0% 7 44.41 64.7% 55
El Mirage 43.50 80.0% 8 41.90 64.0% 64 Blake Foundation
45.18 64.3% 18 40.57 48.6% 51
Marana 45.00 68.2% 15 38.46 47.4% 37 Safford 32.63 36.8% 7 28.19 22.2% 8 Stanfield 44.58 83.3% 10 36.96 39.1% 9 Apache Junction
53.33 92.6% 25 47.09 71.6% 53
Gila River 42.50 55.6% 10 37.19 50.0% 8 Winslow 38.13 50.0% 4 36.11 51.7% 15 Kingman 48.64 77.3% 17 45.64 64.6% 31 Globe/Miami 30.56 55.6% 5 37.27 41.7% 10 Kyrene 41.67 50.0% 12 45.67 69.7% 62 Metro Phoenix
42.00 70.0% 7 47.73 74.7% 74
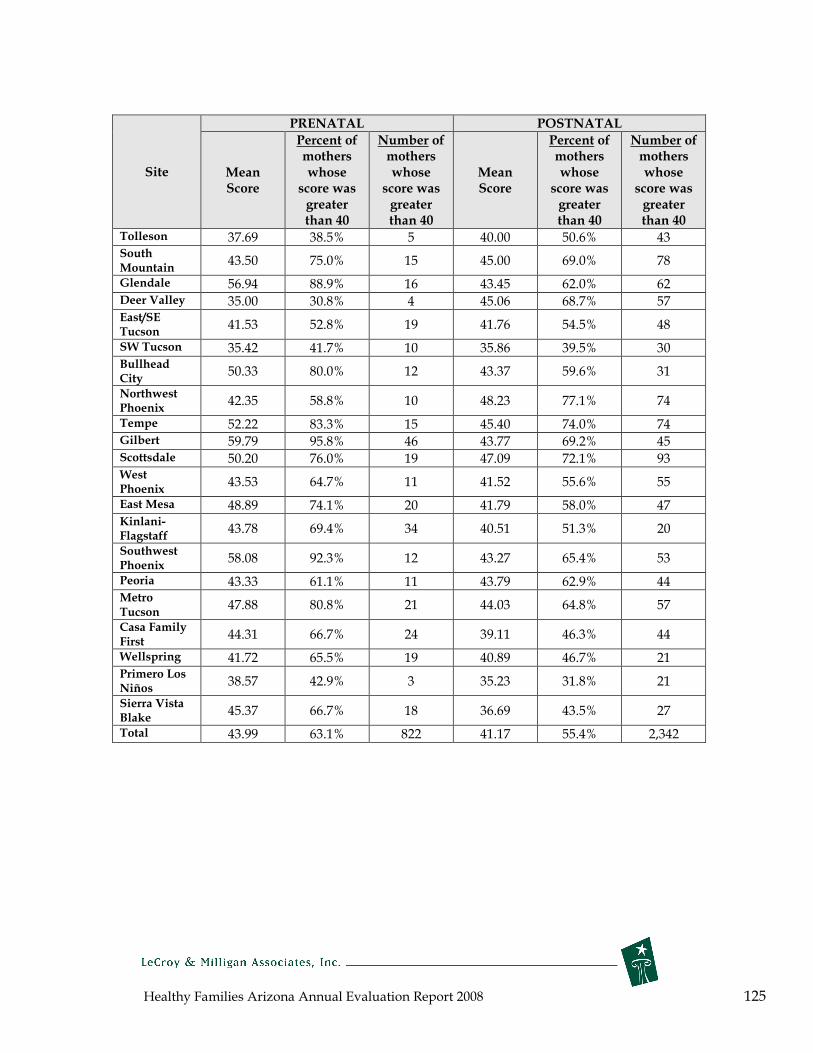
Healthy Families Arizona Annual Evaluation Report 2008 125
PRENATAL POSTNATAL
Percent of Number of Percent of Number of mothers mothers mothers mothers
Site Mean whose whose Mean whose whose Score score was score was Score score was score was
greater than 40
greater than 40
greater than 40
greater than 40
Tolleson 37.69 38.5% 5 40.00 50.6% 43 South Mountain
43.50 75.0% 15 45.00 69.0% 78
Glendale 56.94 88.9% 16 43.45 62.0% 62 Deer Valley 35.00 30.8% 4 45.06 68.7% 57 East/SE Tucson
41.53 52.8% 19 41.76 54.5% 48
SW Tucson 35.42 41.7% 10 35.86 39.5% 30 Bullhead City
50.33 80.0% 12 43.37 59.6% 31
Northwest Phoenix
42.35 58.8% 10 48.23 77.1% 74
Tempe 52.22 83.3% 15 45.40 74.0% 74 Gilbert 59.79 95.8% 46 43.77 69.2% 45 Scottsdale 50.20 76.0% 19 47.09 72.1% 93 West Phoenix
43.53 64.7% 11 41.52 55.6% 55
East Mesa 48.89 74.1% 20 41.79 58.0% 47 Kinlani-Flagstaff
43.78 69.4% 34 40.51 51.3% 20
Southwest Phoenix
58.08 92.3% 12 43.27 65.4% 53
Peoria 43.33 61.1% 11 43.79 62.9% 44 Metro Tucson
47.88 80.8% 21 44.03 64.8% 57
Casa First
Family 44.31 66.7% 24 39.11 46.3% 44
Wellspring 41.72 65.5% 19 40.89 46.7% 21 Primero Niños
Los 38.57 42.9% 3 35.23 31.8% 21
Sierra Blake
Vista 45.37 66.7% 18 36.69 43.5% 27
Total 43.99 63.1% 822 41.17 55.4% 2,342
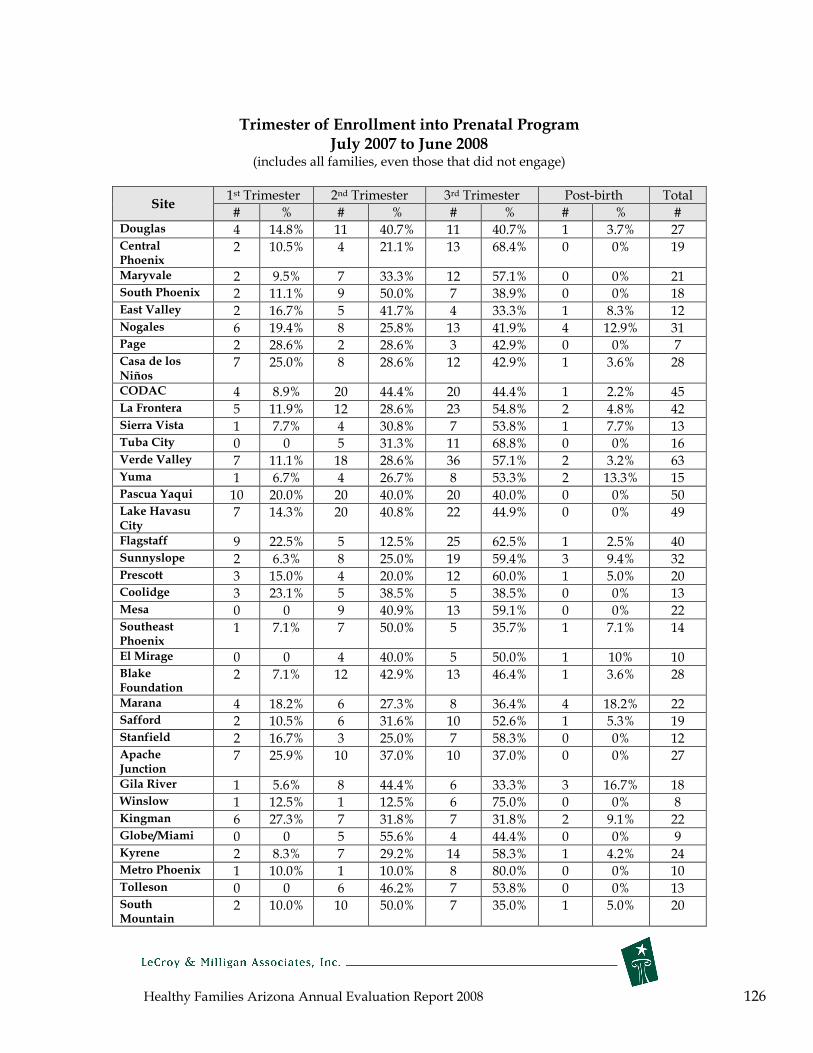
Healthy Families Arizona Annual Evaluation Report 2008 126
Trimester of Enrollment into Prenatal Program July 2007 to June 2008
(includes all families, even those that did not engage)
Site 1st Trimester 2nd Trimester 3rd Trimester Post-birth Total
# % # % # % # % # Douglas 4 14.8% 11 40.7% 11 40.7% 1 3.7% 27 Central 2 10.5% 4 21.1% 13 68.4% 0 0% 19 Phoenix
Maryvale 2 9.5% 7 33.3% 12 57.1% 0 0% 21 South Phoenix 2 11.1% 9 50.0% 7 38.9% 0 0% 18 East Valley 2 16.7% 5 41.7% 4 33.3% 1 8.3% 12 Nogales 6 19.4% 8 25.8% 13 41.9% 4 12.9% 31 Page 2 28.6% 2 28.6% 3 42.9% 0 0% 7 Casa de los 7 25.0% 8 28.6% 12 42.9% 1 3.6% 28 Niños
CODAC 4 8.9% 20 44.4% 20 44.4% 1 2.2% 45 La Frontera 5 11.9% 12 28.6% 23 54.8% 2 4.8% 42 Sierra Vista 1 7.7% 4 30.8% 7 53.8% 1 7.7% 13 Tuba City 0 0 5 31.3% 11 68.8% 0 0% 16 Verde Valley 7 11.1% 18 28.6% 36 57.1% 2 3.2% 63 Yuma 1 6.7% 4 26.7% 8 53.3% 2 13.3% 15 Pascua Yaqui 10 20.0% 20 40.0% 20 40.0% 0 0% 50 Lake Havasu 7 14.3% 20 40.8% 22 44.9% 0 0% 49 City
Flagstaff 9 22.5% 5 12.5% 25 62.5% 1 2.5% 40 Sunnyslope 2 6.3% 8 25.0% 19 59.4% 3 9.4% 32 Prescott 3 15.0% 4 20.0% 12 60.0% 1 5.0% 20 Coolidge 3 23.1% 5 38.5% 5 38.5% 0 0% 13 Mesa 0 0 9 40.9% 13 59.1% 0 0% 22 Southeast 1 7.1% 7 50.0% 5 35.7% 1 7.1% 14 Phoenix
El Mirage 0 0 4 40.0% 5 50.0% 1 10% 10 Blake 2 7.1% 12 42.9% 13 46.4% 1 3.6% 28 Foundation
Marana 4 18.2% 6 27.3% 8 36.4% 4 18.2% 22 Safford 2 10.5% 6 31.6% 10 52.6% 1 5.3% 19 Stanfield 2 16.7% 3 25.0% 7 58.3% 0 0% 12 Apache Junction
7 25.9% 10 37.0% 10 37.0% 0 0% 27
Gila River 1 5.6% 8 44.4% 6 33.3% 3 16.7% 18 Winslow 1 12.5% 1 12.5% 6 75.0% 0 0% 8 Kingman 6 27.3% 7 31.8% 7 31.8% 2 9.1% 22 Globe/Miami 0 0 5 55.6% 4 44.4% 0 0% 9 Kyrene 2 8.3% 7 29.2% 14 58.3% 1 4.2% 24 Metro Phoenix 1 10.0% 1 10.0% 8 80.0% 0 0% 10 Tolleson 0 0 6 46.2% 7 53.8% 0 0% 13 South 2 10.0% 10 50.0% 7 35.0% 1 5.0% 20 Mountain
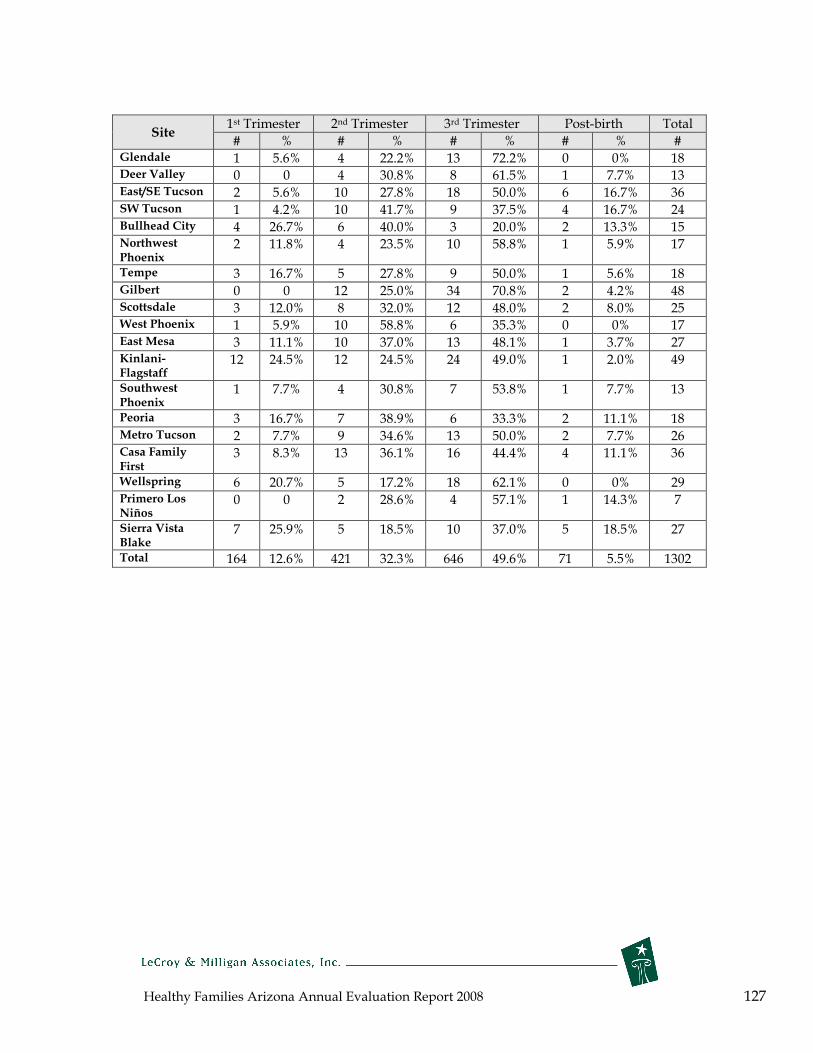
Healthy Families Arizona Annual Evaluation Report 2008 127
Site 1st Trimester 2nd Trimester 3rd Trimester Post-birth Total
# % # % # % # % # Glendale 1 5.6% 4 22.2% 13 72.2% 0 0% 18 Deer Valley 0 0 4 30.8% 8 61.5% 1 7.7% 13 East/SE Tucson 2 5.6% 10 27.8% 18 50.0% 6 16.7% 36 SW Tucson 1 4.2% 10 41.7% 9 37.5% 4 16.7% 24 Bullhead City 4 26.7% 6 40.0% 3 20.0% 2 13.3% 15 Northwest 2 11.8% 4 23.5% 10 58.8% 1 5.9% 17 Phoenix
Tempe 3 16.7% 5 27.8% 9 50.0% 1 5.6% 18 Gilbert 0 0 12 25.0% 34 70.8% 2 4.2% 48 Scottsdale 3 12.0% 8 32.0% 12 48.0% 2 8.0% 25 West Phoenix 1 5.9% 10 58.8% 6 35.3% 0 0% 17 East Mesa 3 11.1% 10 37.0% 13 48.1% 1 3.7% 27 Kinlani- 12 24.5% 12 24.5% 24 49.0% 1 2.0% 49 Flagstaff
Southwest 1 7.7% 4 30.8% 7 53.8% 1 7.7% 13 Phoenix
Peoria 3 16.7% 7 38.9% 6 33.3% 2 11.1% 18 Metro Tucson 2 7.7% 9 34.6% 13 50.0% 2 7.7% 26 Casa First
Family 3 8.3% 13 36.1% 16 44.4% 4 11.1% 36
Wellspring 6 20.7% 5 17.2% 18 62.1% 0 0% 29 Primero Los 0 0 2 28.6% 4 57.1% 1 14.3% 7 Niños
Sierra Vista 7 25.9% 5 18.5% 10 37.0% 5 18.5% 27 Blake
Total 164 12.6% 421 32.3% 646 49.6% 71 5.5% 1302
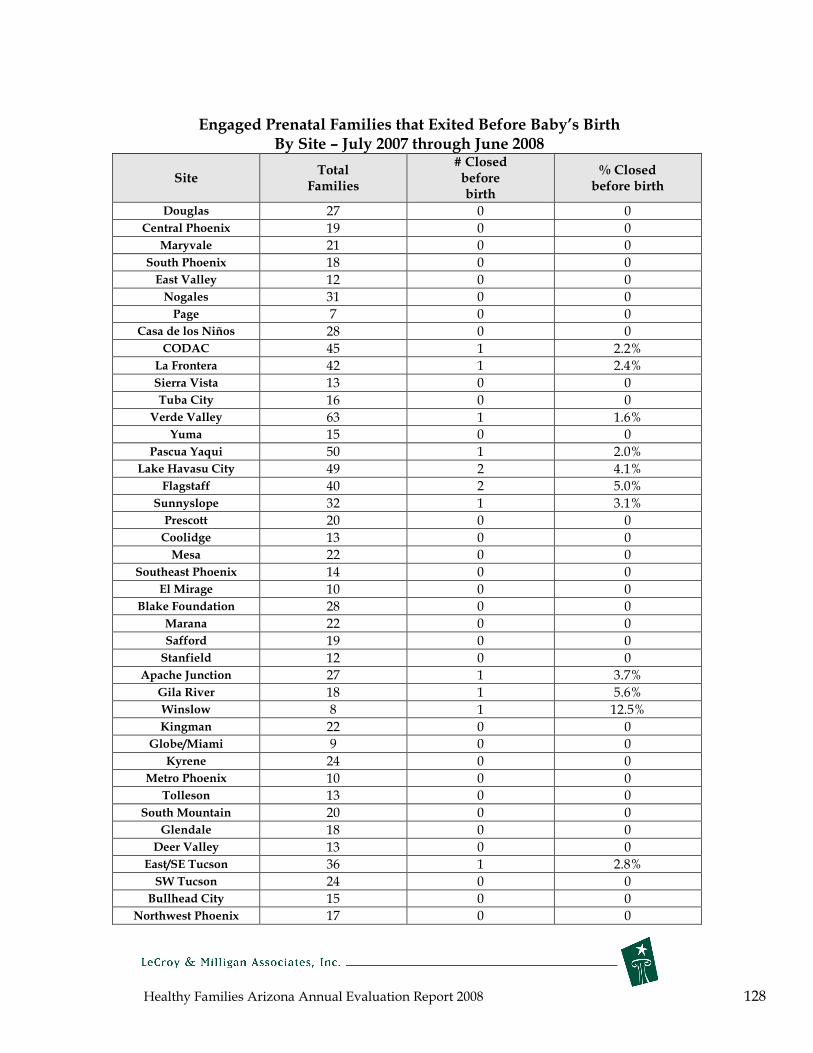
Healthy Families Arizona Annual Evaluation Report 2008 128
Engaged Prenatal Families that Exited Before Baby’s Birth By Site – July 2007 through June 2008
Site Total
Families
# Closed before birth
% Closed before birth
Douglas 27 0 0 Central Phoenix 19 0 0
Maryvale 21 0 0 South Phoenix 18 0 0 East Valley 12 0 0 Nogales 31 0 0 Page 7 0 0
Casa de los Niños 28 0 0 CODAC 45 1 2.2%
La Frontera 42 1 2.4% Sierra Vista 13 0 0 Tuba City 16 0 0
Verde Valley 63 1 1.6% Yuma 15 0 0
Pascua Yaqui 50 1 2.0% Lake Havasu City 49 2 4.1%
Flagstaff 40 2 5.0% Sunnyslope 32 1 3.1% Prescott 20 0 0 Coolidge 13 0 0 Mesa 22 0 0
Southeast Phoenix 14 0 0 El Mirage 10 0 0
Blake Foundation 28 0 0 Marana 22 0 0 Safford 19 0 0 Stanfield 12 0 0
Apache Junction 27 1 3.7% Gila River 18 1 5.6% Winslow 8 1 12.5% Kingman 22 0 0
Globe/Miami 9 0 0 Kyrene 24 0 0
Metro Phoenix 10 0 0 Tolleson 13 0 0
South Mountain 20 0 0 Glendale 18 0 0
Deer Valley 13 0 0 East/SE Tucson 36 1 2.8% SW Tucson 24 0 0
Bullhead City 15 0 0 Northwest Phoenix 17 0 0

Healthy Families Arizona Annual Evaluation Report 2008 129
Site Total
Families
# Closed before birth
% Closed before birth
Tempe 18 1 5.6% Gilbert 48 1 2.1%
Scottsdale 25 0 0 West Phoenix 17 0 0 East Mesa 27 0 0
Kinlani-Flagstaff 49 0 0 Southwest Phoenix 13 0 0
Peoria 18 0 0 Metro Tucson 26 0 0
Casa Family First 36 0 0 Wellspring 29 1 3.4%
Primero Los Niños 7 0 0 Sierra Vista Blake 27 0 0
Total 1,302 16 1.2%

Healthy Families Arizona Annual Evaluation Report 2008 130
Appendix B. Instrument Properties
Parent Survey* Problem Areas and Interpretation (Mother & Father)
Areas (Scales) Range Interpretation/ Administration
1. Parent Childhood
Childhood history of
deprivation)
Experiences (e.g.,
physical abuse and 0,
5, or 10 The Parent Survey comprises a 10-item
rating scale. A score of 0 represents
normal, 5 represents a mild degree of
the problem, and a 10 represents severe
for both the Mother and Father Parent
Survey Checklist items. The Parent
Survey is an assessment tool and is
administered to the mother and father
prior to enrollment through an interview
by a Family Assessment Worker from the
Healthy Families Arizona Program. A
family is considered eligible to receive
the Healthy Families Arizona program if
either parent scores 25 or higher.
2. Lifestyle, Behaviors and Mental Health
(e.g., substance abuse, mental illness, or
criminal history) 0, 5, or 10
3. Parenting
current CPS
Experiences (e.g.,
involvement)
Previous or
0, 5, or 10
4. Coping Skills and Support Systems (e.g.,
Self-esteem, available lifelines, possible
depression)
0, 5, or 10
5. Stresses (e.g., Stresses,
domestic violence)
concerns,
0, 5, or 10
6. Anger Management
Potential for violence)
Skills (e.g.,
0, 5, or 10
7. Expectations
Milestones and
of Infant’s
Behaviors
Developmental
0, 5, or 10
8. Plans for
and child)
Discipline (e.g., infant, toddler,
0, 5, or 10
9.
Perception of New Infant 0, 5, or 10
10.
Bonding/Attachment Issues 0, 5, or 10
Total Score 0 - 100
A score over 25 is considered medium
risk for child abuse and neglect, and a
score over 40 is considered high-risk for
child abuse.
* Modified from the Family Stress Checklist

Healthy Families Arizona Annual Evaluation Report 2008 131
Healthy Families Parenting Inventory Cronbach’s Alpha Scores Subscale Alpha*
2 month Alpha* 6 month
Alpha* 12 month
Social Support r=.84 r=.86 r=.88 Problem Solving r=.81 r=.80 r=.86 Depression r=.84 r=.82 r=.85 Personal Care r=.82 r=.80 r=.83 Mobilizing Resources
r=.78 r=.81 r=.82
Accepting the parent role
r=.77 r=.80 r=.81
Parent Child Behaviors
r=.78 r=.79 r=.82
Home Environment
r=.78 r=.80 r=.83
Parenting Efficacy
r=.84 r=.87 r=.88
*Alpha scores represent the correlation of items on a scale, and indicate how well the items in a subscale related to each other.

Healthy Families Arizona Annual Evaluation Report 2008 132
Appendix C. Healthy Families Arizona Prenatal Logic Model Long Term Outcomes Program Resources
Î Reduced child abuse and neglect Ï Increased child wellness and development Ð Strengthened family relations
Ñ Enhanced family unity Ò Reduced abuse of drugs and alcohol
Family Support Specialists; Family Assessment Workers; Clinical consultants; Quality Assurance/Training/Evaluation; Funding; Community based services, e.g., prenatal support & education programs, hospital programs, nutrition services, translation & transportation services, mental health, domestic violence, substance abuse services
Prenatal Program Objectives
Increase the family’s support
network
Improve mother’s mental health
Increase parents’ health
behaviors
Increase the family
members’ problem
solving skills
Improve nutrition
Increase empathy for the unborn baby
Increase father involvement
Increase safety in the home environment
Increase the delivery of
healthy babies, free from birth complications
Program Activities and Strategies Assess family’s
support systems
Model relationship
skills
Foster
connections to
positive support
sources
Identify signs
and history of
depression,
abuse, mental
illness,
substance
abuse
Review
history of
birthing
Encourage
medical
assessment,
referral and
treatment if
needed
Encourage
exercise,
personal care,
rest
Educate on
post partum
depression
Assess
personal risk
behaviors
Educate on
risk behaviors,
lifestyle
choices,
community
resources,
affect of drugs,
medicines on
fetus
Explore
domestic
violence, form
safety plan
Encourage
help seeking
and adoption
of healthy
behaviors
Identify major
life stressors
Educate on
problem-solving,
goal setting.
Use IFSP to
review progress
Educate on
access to
community
resources, how
to reach out
Make referrals
as needed for
anger and
stress
management
Teach stress
reduction
Educate and
provide
materials on
nutrition during
pregnancy,
buying and
choosing
healthy foods,
and
requirements for
healthy fetal
development
Provide
referrals to
WIC, other
resources
Encourage
healthy
celebrations
Explore and
assess issues
around
pregnancy,
relationships,
hopes, fears
Discuss and
educate about
changes in body,
sexuality during
pregnancy
Share
developmental
information about
stages of
development of
fetus
Encourage pre-
birth bonding and
stimulation
exercises
(reading, touch,
etc)
Explore father’s
feelings,
childhood
experiences,
expectations,
hopes and fears
about baby and
goals for
fatherhood
Educate about
changes in
intimacy, ways
father can support
mother
Encourage
supportive
relationships for
father
Educate on
father’s legal
rights and
responsibilities
Assess,
encourage and
guide family in
making needed
safety
arrangements,
e.g. crib safety,
car seat, pets,
SIDS, child care,
feeding
Educate on baby
temperaments,
how to calm baby,
Shaken Baby
Syndrome,
medical concerns
Refer to
parenting
workshops
Explore cultural
beliefs about
discipline
Connect mother
to prenatal care
and encourage
compliance with
visits
Encourage STD
testing
Educate on
symptoms
requiring medical
attention
Promote
breastfeeding
and refer to
resources
Outcome Evaluation Measures H.F. Parenting Inventory-Prenatal (HFPIP); FSS-23
HFPIP; FSS-23 HFPIP; FSS-23; CRAFFT
HFPIP; FSS-23 HFPIP; FSS-23 HFPIP; FSS-23 HFPIP; FSS-23; father involvement scale
HFPIP; FSS-23; Safety checklist
HFPIP; FSS-23; FSS20P

Healthy Families Arizona Annual Evaluation Report 2008 133
Appendix D. Healthy Families Arizona Postnatal Logic Model Long Term Outcomes Program Resources
Î Reduced child abuse and neglect Family Support Specialists; Family Assessment Workers; Clinical consultants;
Ï Increased child wellness and development Quality Assurance/Training/Evaluation; Funding; Community based services,
Ð Strengthened family relations e.g., parenting support & education programs, nutrition services, translation &
Ñ Enhanced family unity transportation services, mental health, domestic violence, substance abuse
Ò Reduced abuse of drugs and alcohol services
Postnatal Program Objectives
Increase the
family’s support
network
Improve
mother’s mental health
Increase
parents’ health
behaviors
Increase the family
members’ problem solving
skills
Improve family stability
Increase
parental competence
Increase
positive parent-child interaction
Improve child health
and
Optimize child
development
Prevent child
abuse and neglect
Program Activities and Strategies Assess family’s Identify signs and Assess Identify major Assess basic Provide Promote and Complete Assess risk of support systems history of personal risk life stressors living skills and empathy and teach developmental child abuse and depression, abuse, behaviors; needs; help support to developmentally assessments and neglect Model mental illness, Educate on Educate on family access parent in appropriate make referrals relationship substance abuse dangers of problem-solving, housing, parenting role stimulation Coach and skills specific risk goal setting. Use education, job, activities Address medical guide in choices Address issues of behaviors IFSP to review and budget Teach child screenings, for child care Foster grief and loss progress management development, Educate about support well child connections Support services. early brain rhythm and checks, Educate about to positive Encourage medical family in Educate on development, reciprocity, immunizations, consequences of support sources assessment, referral making access to Coach parent to temperament reading baby’s and good nutrition child abuse and and treatment if lifestyle community set and evaluate cues habits neglect Educate on needed changes and resources, how to goals; teach Address communication adopting reach out basic living skills parental Promote reading, Promote play, skills Encourage/coach healthy expectations of bonding during reading; provide on exercise, behaviors Make referrals Promote use of child feeding links to early personal care, rest as needed for community childhood Educate on anger and stress resources for self Educate about Encourage programs Educate on post-
partum depression community resources Explore domestic violence, create safety plan
management Educate about effect of stress on child
sufficiency Explore family planning decisions
importance of routines and rules Refer to parenting groups and classes
family activities, celebrations Coach on father involvement
Assess and Guide family in making safety arrangements, e.g., home and car safety
Outcome Evaluation Measures Healthy Families
Parenting Inventory (HFPI); FSS-23
HFPI; FSS-23 HFPI; FSS-23;
CRAFFT HFPI; FSS-23 HFPI; FSS-23 HFPI; FSS-23
HFPI; FSS-23; father
involvement scale
HFPI; FSS-23; Safety checklist;
ASQ
HFPI; FSS-23; FSS20

Healthy Families Arizona Annual Evaluation Report 2008 134
Appendix E. Healthy Families Participant Satisfaction Survey © Site #_______
Thank you so much for completing our survey. The Healthy Families staff know how busy
your life is and we truly appreciate you taking the time to complete this survey. This survey
is anonymous (we do not collect names), and it is designed to gather your feelings and
opinions. There are no right or wrong answers. The results will help us know what is
working in the program and what needs improving.
Directions: Please choose ONE answer that best fits how you
feel and color in the circle.
Strongly
Disagree Disagree Agree
Strongly
Agree
1. I feel I receive the help and services I want and need. � � � �
2. I feel my home visits happen on a regular and
consistent basis. � � � �
3. I feel my home visitor spends enough time with me. � � � �
4. I am confident in my home visitor’s skills. � � � �
5. My home visitor shows she/he cares about my child and
me. � � � �
6. I feel my home visitor is supportive of me. � � � �
7. I feel comfortable talking with my home visitor. � � � �
8. I feel my home visitor listens to me and my concerns. � � � �
9. I feel my home visitor treats me with respect. � � � �
10.
My home visitor accepts me and my family as the
ultimate decision makers for the well being of my
child(ren) and the services we receive.
� � � �
11.
My home visitor shares healthy ways males (fathers,
grandfathers, partners, etc.) can be involved in my
child’s life.
� � � �
12. I feel my home visitor is respectful of my cultural
beliefs and practices. � � � �
13.
My home visitor has been able to assist me in accessing
community services based on language and cultural
needs as needed.
� � � �

Healthy Families Arizona Annual Evaluation Report 2008 135
Directions: Please choose ONE answer that best fits how you
feel and color in the circle.
Strongly
Disagree Disagree Agree
Strongly
Agree
14. I am interested in pursuing the goals my home visitor
helped me create. � � � �
15. I understand the information provided to me on child
development and parenting. � � � �
16. The educational materials, handouts, and activities are
helpful. � � � �
17. I am able to use the information from the educational
materials, handouts and activities with my family. � � � �
18. Forms and written materials (like letters, brochures,
and notices) are easy for me to understand. � � � �
19. The educational materials, handouts, and activities are
respectful of my cultural beliefs and practices. � � � �
20. I feel I receive high quality services in Healthy
Families. � � � �
21. As a result of Healthy Families, I feel I am a better
parent. � � � �
22. I would recommend this program to others. � � � �
23. Do you speak another language other than English?
� Yes � No
24. Were the program materials provided to you in a language that you read and understand?
� Yes � No
25. Did your home visitor speak a language you understand?
� Yes � No
26. How long have you been in the Healthy Families program?
_____ ears _____ onths
y m
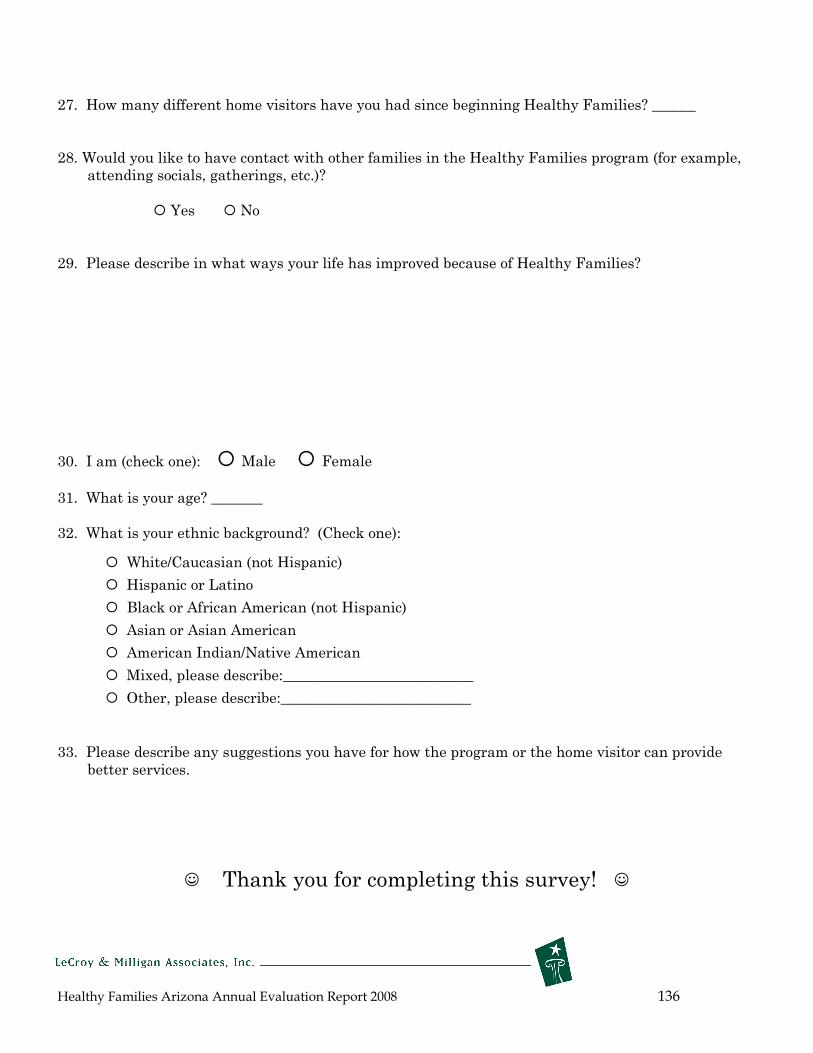
Healthy Families Arizona Annual Evaluation Report 2008 136
27. How many different home visitors have you had since beginning Healthy Families? ______
28. Would you like to have contact with other families in the Healthy Families program (for example,
attending socials, gatherings, etc.)?
� Yes � No
29. Please describe in what ways your life has improved because of Healthy Families?
30. I am (check one): � Male � Female
31. What is your age? _______
32. What is your ethnic background? (Check one):
� White/Caucasian (not Hispanic)
� Hispanic or Latino
� Black or African American (not Hispanic)
� Asian or Asian American
� American Indian/Native American
� Mixed, please describe:__________________________
� Other, please describe:__________________________
33. Please describe any suggestions you have for how the program or the home visitor can provide
better services.
( Thank you for completing this survey! (
Related Documents