Health, Social Roles, and Life Cycle: A Gender Approach in the Tropics Karen Watkins UPAEP

Health, Social Roles, and Life Cycle: A Gender Approach in the Tropics Karen Watkins UPAEP.
Dec 17, 2015
Welcome message from author
This document is posted to help you gain knowledge. Please leave a comment to let me know what you think about it! Share it to your friends and learn new things together.
Transcript
Health, Social Roles, and Life Cycle: A Gender Approach in the Tropics
Karen Watkins
UPAEP
Gender and Health
Differences in illnesses and drug use between men and women.
Explanations: Biological, socioeconomic, and psychological factors.
Biological issues: Women more likely to have infections and mental
diseases (Bird and Rieker, 1999; Mechanic, 1995; Bardel et al., 2000; Green and Pope, 1999).
Men possess more chronic disorders; partially explains their lower life expectancy (Macintyre et al., 1996).
Gender and Health Socioeconomic factors:
Multiple roles associated with womens´ poor health conditions. More stress-related diseases (Bird and Rieker,1999; Brooker and Eakin, 2001) and less leisure time.
Others argue that busy lives imply less symptoms perceived and better health (van Wijk et al.,1999; Janzen and Muhajarine, 2003).
Gender and Health
Socioeconomic factors: Healthy women are the ones who can have
multiple roles. How do multiple roles relate with health? 1)
Stress hypothesis: An additional role implies more stress and deteriorates health; 2) Accumulation hypothesis: Valid only for complementary roles; an additional role improves well-being.
Gender and Health
Socioeconomic factors: Sexual discrimination both at work and at home
are harmful for health (Kawachi et al.,1999; O’Campo et al.,2004; Strazdins et al.,2004).
Less liberty to leave their houses reduces exposure to health services (Vlassoff and Garcia, 2002).
Health relates with power; at a micro level, it depends on household resource allocation.

Gender and Health
Socioeconomic factors: Studies for developing nations show that paid work
betters vulnerable women's´ health: provides control of resources, power, and status.
Negative outcomes on health related to badly paid, sedentary and monotonous jobs, lack of education and economic autonomy, poor political participation and protection, and little free time (van Wijk et al.,1999; Mechanic,1995; Messing et al., 2003).
Status negatively related with mortality (Kawachi et al.,1999); income positively correlates with health.
Gender and Health Socioeconomic factors:
Differences in social roles: Men are expected to be strong and suffer without
complaint (Vlassoff and Garcia, 2002). Women expected to protect their families,
therefore they pay more attention to symptoms and health (Bardel et al, 2000; Green and Pope, 1999).
More men compared to women have full time jobs; less flexibility to attend medical services (van Wijk et al., 1999).
Gender and Health
Phycological factors:
Women tend to be more pessimistic than men, which is prejudicial for quality of life and health (in particular mental): Brooker and Eakin, 2001.
Women more likely to search for help, follow medical treatments, and preventive services, as well as to adopt the sick role (Green and Pope, 1999).
Objectives
Add a new case study (Costa Rica) to the literature on gender and health.
Provide further robustness to existing hypotheses on health, gender, social roles, quality of life, and life cycle, and add new ideas for future research.
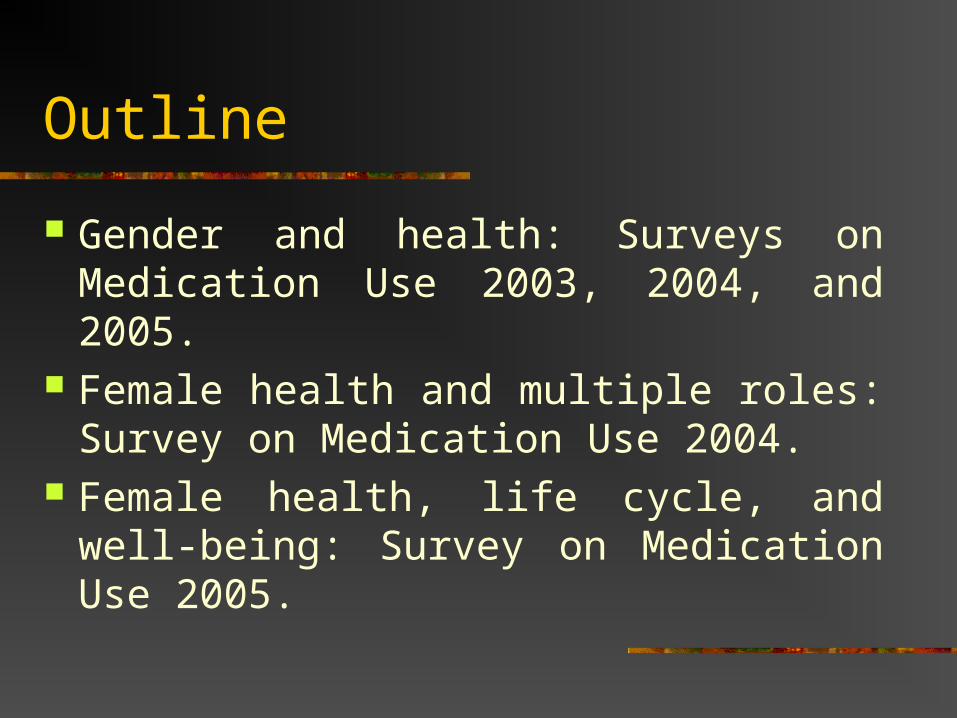
Outline
Gender and health: Surveys on Medication Use 2003, 2004, and 2005.
Female health and multiple roles: Survey on Medication Use 2004.
Female health, life cycle, and well-being: Survey on Medication Use 2005.
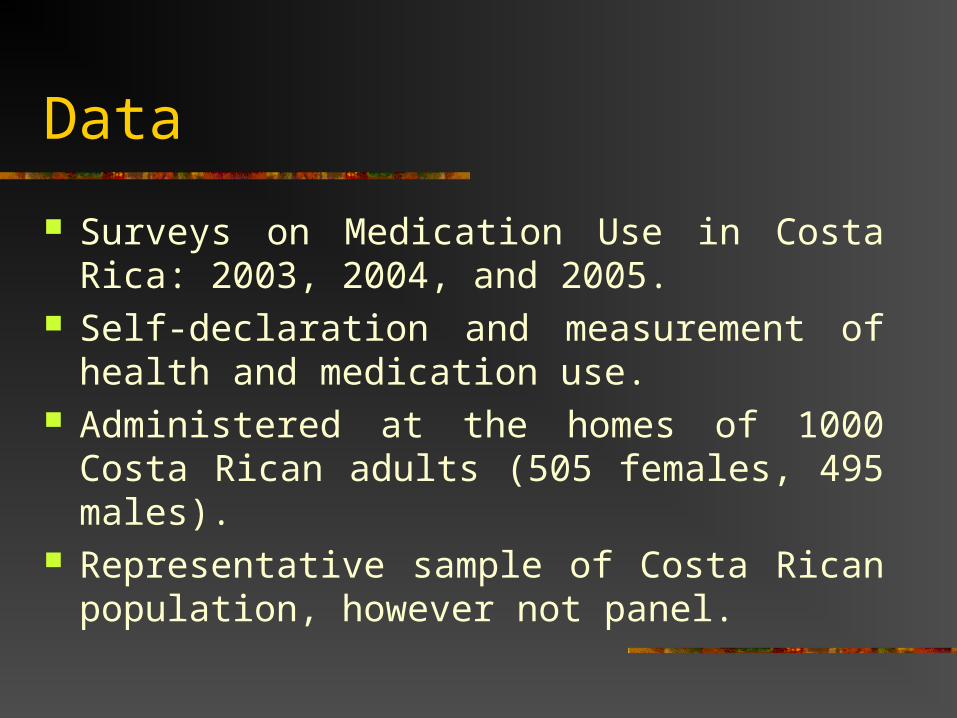
Data
Surveys on Medication Use in Costa Rica: 2003, 2004, and 2005.
Self-declaration and measurement of health and medication use.
Administered at the homes of 1000 Costa Rican adults (505 females, 495 males).
Representative sample of Costa Rican population, however not panel.
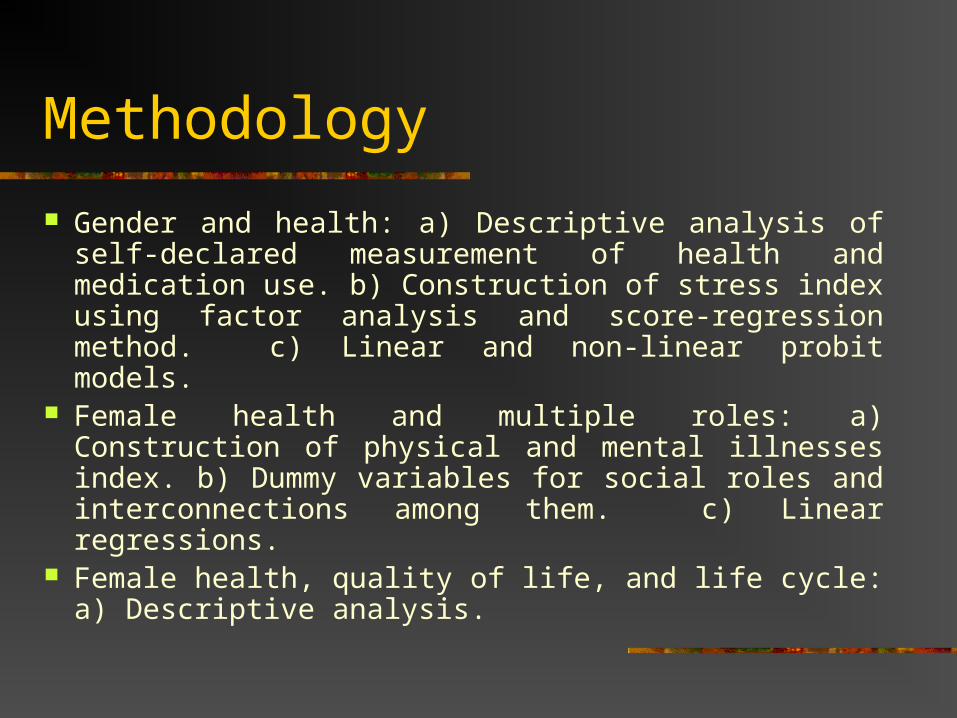
Methodology
Gender and health: a) Descriptive analysis of self-declared measurement of health and medication use. b) Construction of stress index using factor analysis and score-regression method. c) Linear and non-linear probit models.
Female health and multiple roles: a) Construction of physical and mental illnesses index. b) Dummy variables for social roles and interconnections among them. c) Linear regressions.
Female health, quality of life, and life cycle: a) Descriptive analysis.
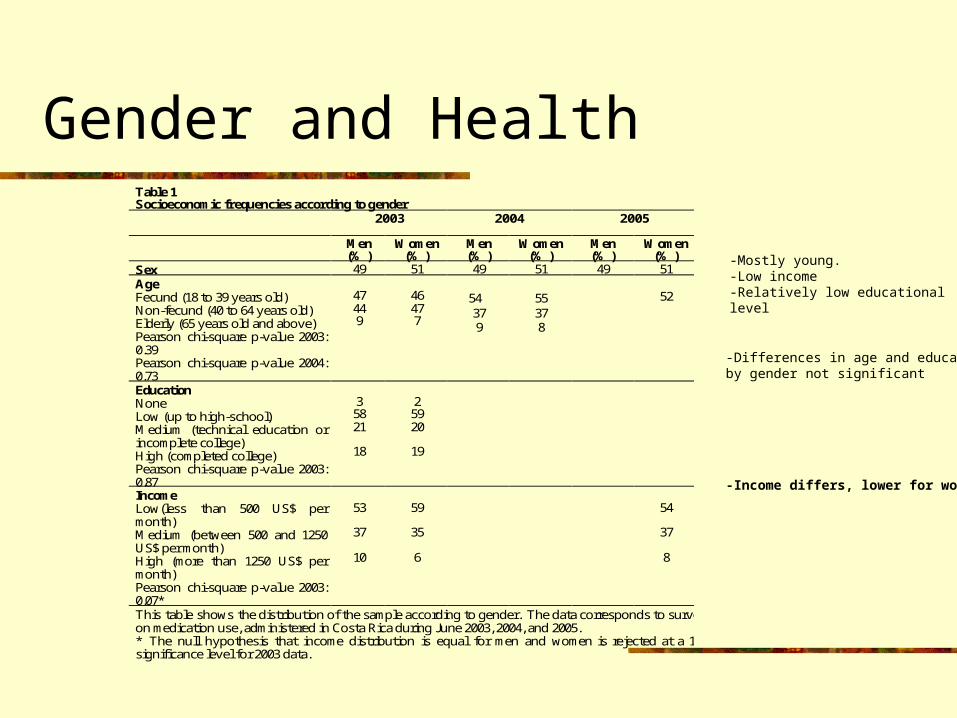
Gender and HealthTable 1 Socioeconomic frequencies according to gender 2003 2004 2005
Men
(% ) Women
(% ) Men (% )
Women (% )
Men (% )
Women (% )
Sex 49 51 49 51 49 51 Age Fecund (18 to 39 years old) Non-fecund (40 to 64 years old) Elderly (65 years old and above) Pearson chi-square p-value 2003: 0.39 Pearson chi-square p-value 2004: 0.73
47 44 9
46 47 7
54
37 9
55 37 8
52
Education None Low (up to high-school) Medium (technical education or incomplete college) High (completed college) Pearson chi-square p-value 2003: 0.87
3 58 21
18
2 59 20
19
Income Low(less than 500 US$ per month) Medium (between 500 and 1250 US$ per month) High (more than 1250 US$ per month) Pearson chi-square p-value 2003: 0.07*
53
37
10
59
35 6
54
37 8
This table shows the distribution of the sample according to gender. The data corresponds to surveys on medication use, administered in Costa Rica during June 2003, 2004, and 2005. * The null hypothesis that income distribution is equal for men and women is rejected at a 10% significance level for 2003 data.
-Mostly young.-Low income-Relatively low educational level
-Differences in age and educationby gender not significant
-Income differs, lower for women
Gender and Health
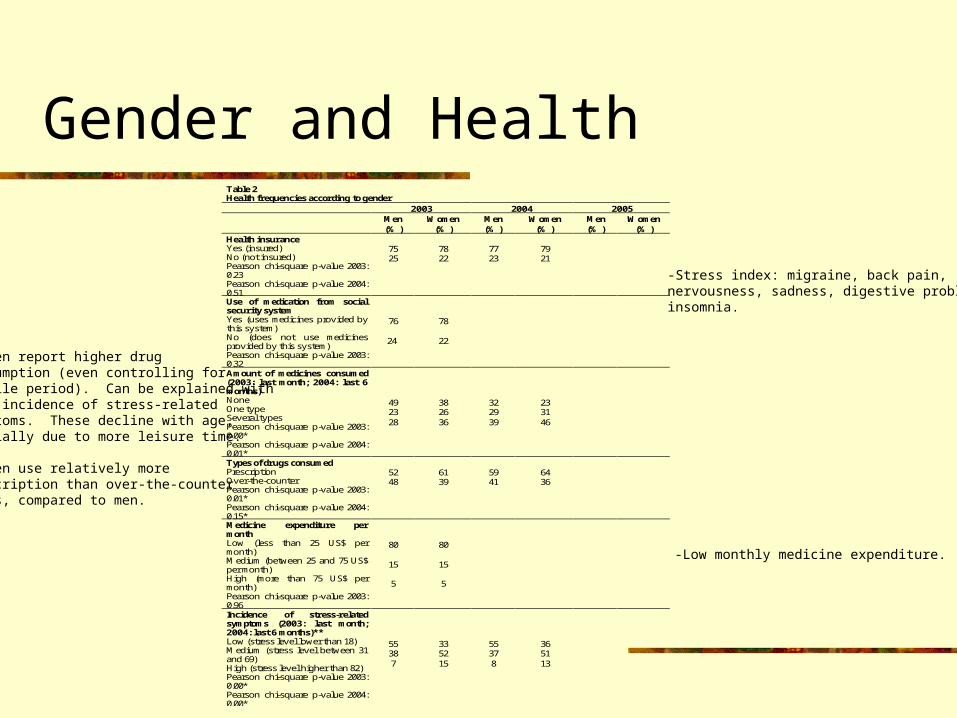
Table 2 Health frequencies according to gender 2003 2004 2005 Men
(% ) Women
(% ) Men (% )
Women (% )
Men (% )
Women (% )
Health insurance Yes (insured) No (not insured) Pearson chi-square p-value 2003: 0.23 Pearson chi-square p-value 2004: 0.51
75 25
78 22
77 23
79 21
Use of medication from social security system Yes (uses medicines provided by this system) No (does not use medicines provided by this system) Pearson chi-square p-value 2003: 0.32
76 24
78
22
Amount of medicines consumed (2003: last month; 2004: last 6 months) None One type Several types Pearson chi-square p-value 2003: 0.00* Pearson chi-square p-value 2004: 0.01*
49 23 28
38 26 36
32 29 39
23 31 46
Types of drugs consumed Prescription Over-the-counter Pearson chi-square p-value 2003: 0.01* Pearson chi-square p-value 2004: 0.15*
52 48
61 39
59 41
64 36
Medicine expenditure per month Low (less than 25 US$ per month) Medium (between 25 and 75 US$ per month) High (more than 75 US$ per month) Pearson chi-square p-value 2003: 0.96
80
15 5
80
15 5
Incidence of stress-related symptoms (2003: last month; 2004: last 6 months)** Low (stress level lower than 18) Medium (stress level between 31 and 69) High (stress level higher than 82) Pearson chi-square p-value 2003: 0.00* Pearson chi-square p-value 2004: 0.00*
55 38 7
33 52 15
55 37 8
36 51 13
-Stress index: migraine, back pain, nervousness, sadness, digestive problems,insomnia.
-Low monthly medicine expenditure.
-Women report higher drug consumption (even controlling forfertile period). Can be explained with more incidence of stress-related symptoms. These decline with age,partially due to more leisure time.
-Women use relatively more prescription than over-the-counterdrugs, compared to men.
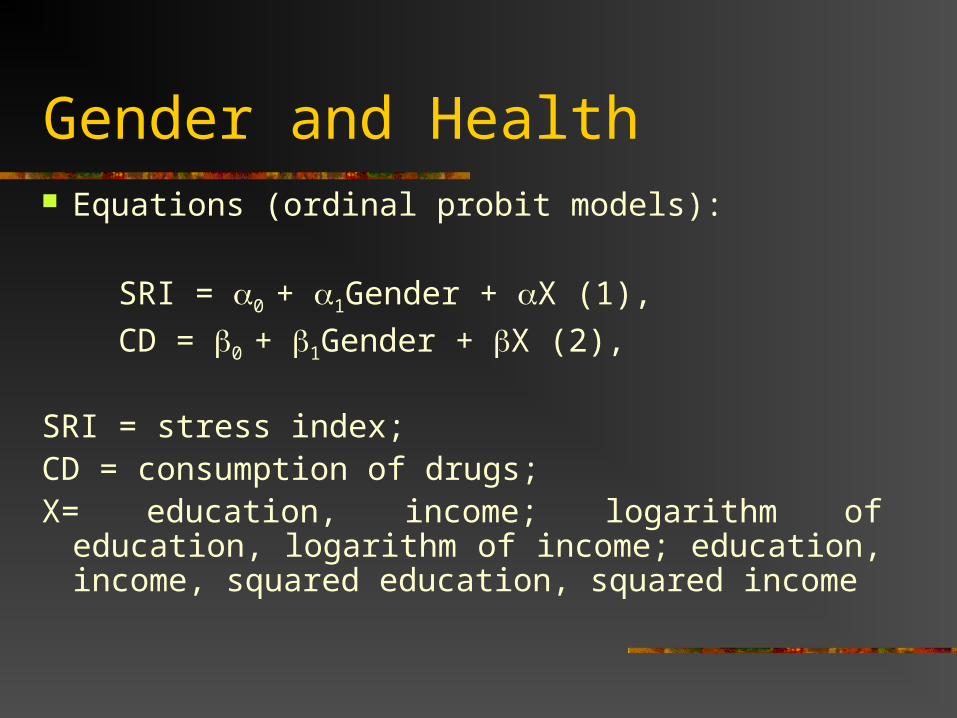
Gender and Health Equations (ordinal probit models):
SRI = 0 + 1Gender + X (1),
CD = 0 + 1Gender + X (2),
SRI = stress index; CD = consumption of drugs; X= education, income; logarithm of education, logarithm
of income; education, income, squared education, squared income
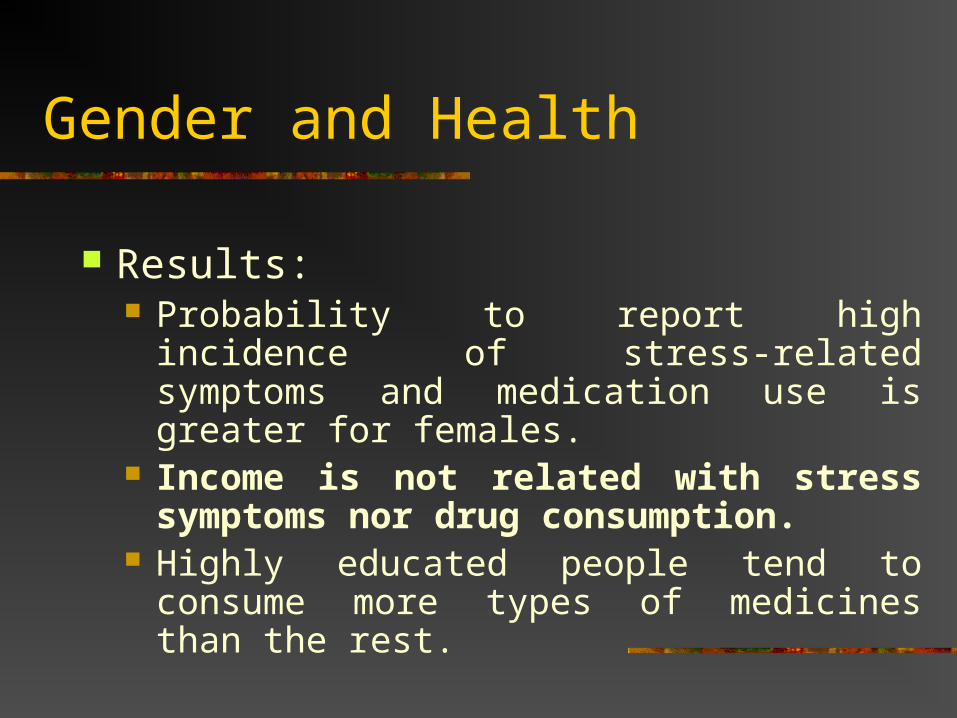
Gender and Health
Results: Probability to report high incidence of stress-
related symptoms and medication use is greater for females.
Income is not related with stress symptoms nor drug consumption.
Highly educated people tend to consume more types of medicines than the rest.
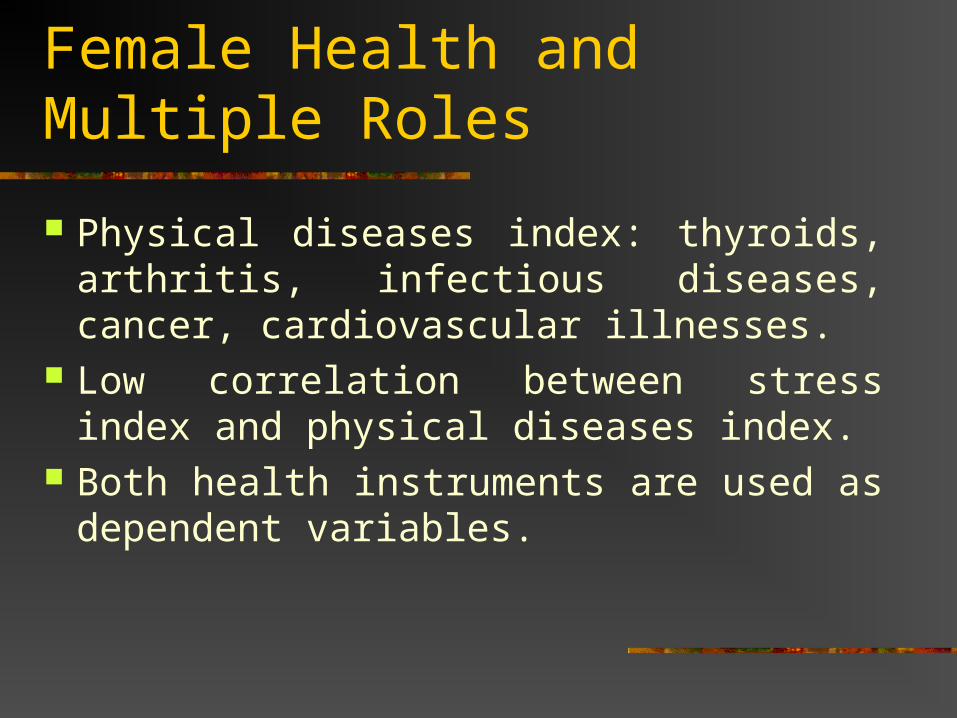
Female Health and Multiple Roles
Physical diseases index: thyroids, arthritis, infectious diseases, cancer, cardiovascular illnesses.
Low correlation between stress index and physical diseases index.
Both health instruments are used as dependent variables.

Female Health and Multiple Roles
Independent variables (social roles): Employment (ES-1 unemployed, 0 others) Civil status (CS-1 single, 0 married) Maternity (MO-1 no children in the home, 0
others) Interconections: ES*CS, ES*MO, CS*MO,
ES*CS*MO
Female Health and Multiple Roles
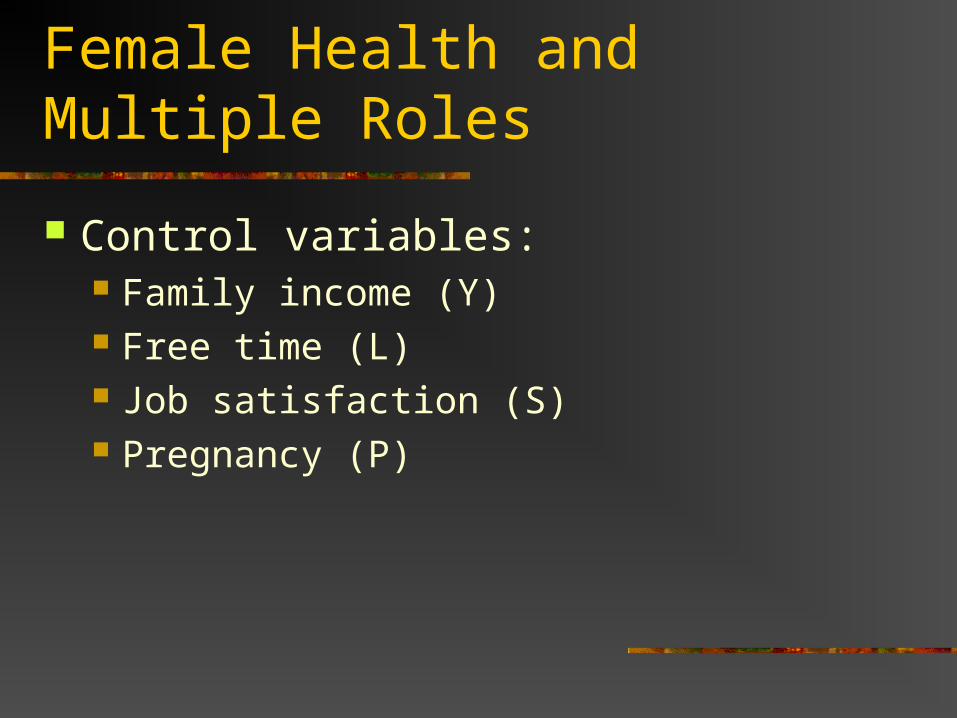
Control variables: Family income (Y) Free time (L) Job satisfaction (S) Pregnancy (P)
Female Health and Multiple Roles
PSLYMOCSESMOCSMOESCSESMOCSESSRI 11109876543210 *****
PSLYMOCSESMOCSMOESCSESMOCSESPDI 11109876543210 *****
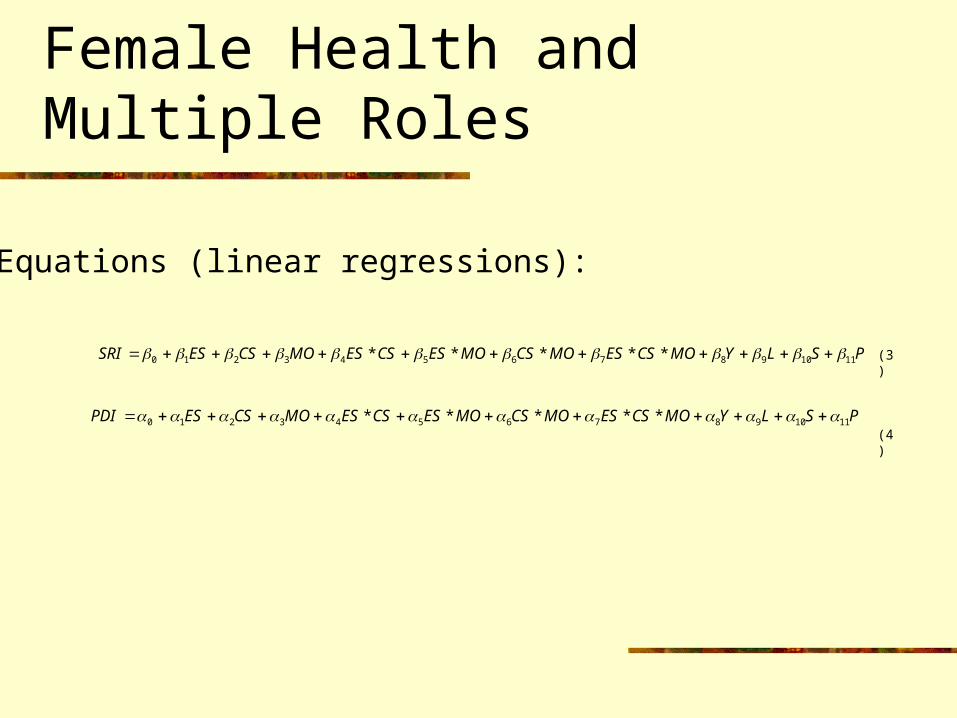
Equations (linear regressions):
(3)
(4)
Female Health and Multiple Roles
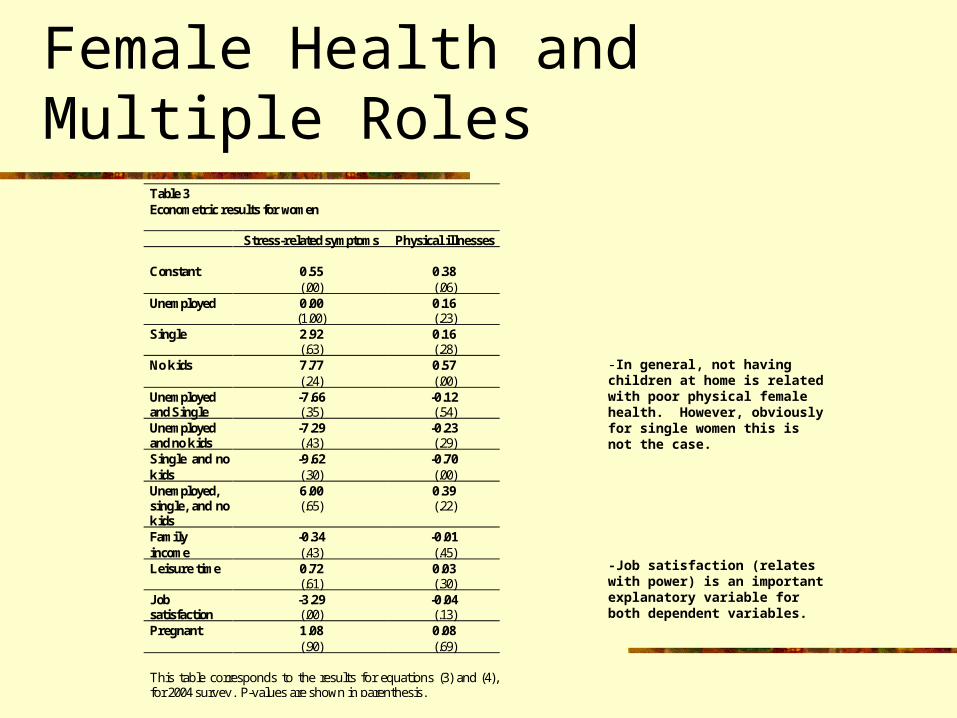
Table 3 Econometric results for women Stress-related symptoms Physical illnesses Constant
0.55 (.00)
0.38 (.06)
Unemployed 0.00 (1.00)
0.16 (.23)
Single 2.92 (.63)
0.16 (.28)
No kids 7.77 (.24)
0.57 (.00)
Unemployed and Single
-7.66 (.35)
-0.12 (.54)
Unemployed and no kids
-7.29 (.43)
-0.23 (.29)
Single and no kids
-9.62 (.30)
-0.70 (.00)
Unemployed, single, and no kids
6.00 (.65)
0.39 (.22)
Family income
-0.34 (.43)
-0.01 (.45)
Leisure time 0.72 (.61)
0.03 (.30)
Job satisfaction
-3.29 (.00)
-0.04 (.13)
Pregnant 1.08 (.90)
0.08 (.69)
This table corresponds to the results for equations (3) and (4), for 2004 survey. P-values are shown in parenthesis.
-In general, not having children at home is related with poor physical female health. However, obviously for single women this is not the case.
-Job satisfaction (relates with power) is an important explanatory variable for both dependent variables.
Female Health and Multiple Roles
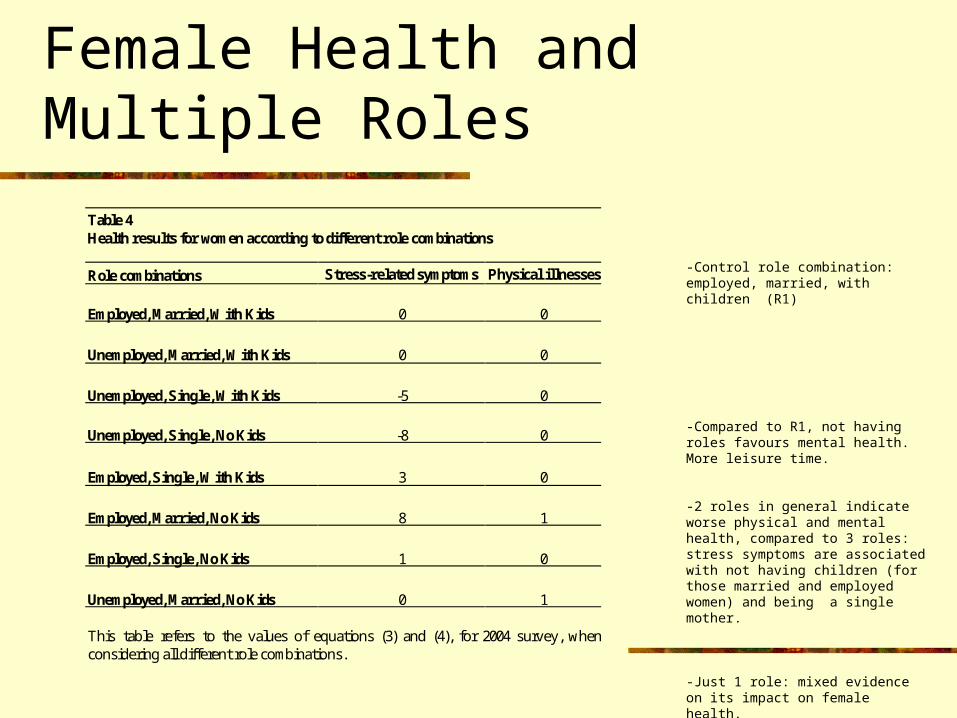
Table 4 Health results for women according to different role combinations Role combinations Stress-related symptoms Physical illnesses
Employed, Married, With Kids 0 0
Unemployed, Married, With Kids 0 0
Unemployed, Single, With Kids -5 0
Unemployed, Single, No Kids -8 0
Employed, Single, With Kids 3 0
Employed, Married, No Kids 8 1
Employed, Single, No Kids 1 0
Unemployed, Married, No Kids 0 1 This table refers to the values of equations (3) and (4), for 2004 survey, when considering all different role combinations.
-Control role combination: employed, married, with children (R1)
-Compared to R1, not having roles favours mental health. More leisure time.
-2 roles in general indicate worse physical and mental health, compared to 3 roles: stress symptoms are associated with not having children (for those married and employed women) and being a single mother.
-Just 1 role: mixed evidence on its impact on female health.
Female Health, Life Cycle, and Well-being
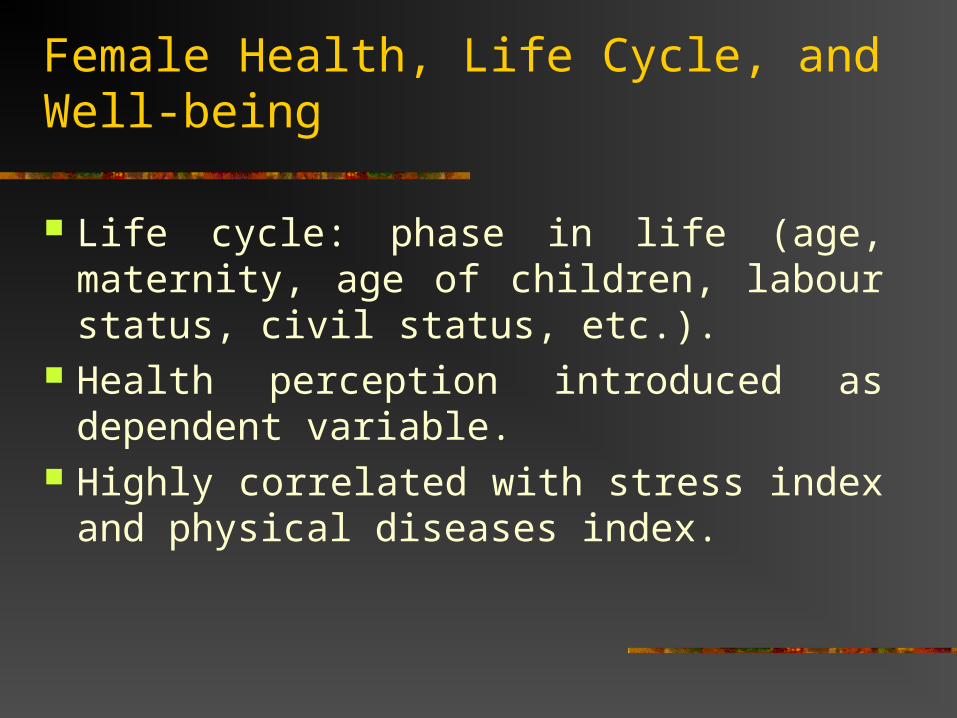
Life cycle: phase in life (age, maternity, age of children, labour status, civil status, etc.).
Health perception introduced as dependent variable.
Highly correlated with stress index and physical diseases index.
Female Health, Life Cycle, and Well-being
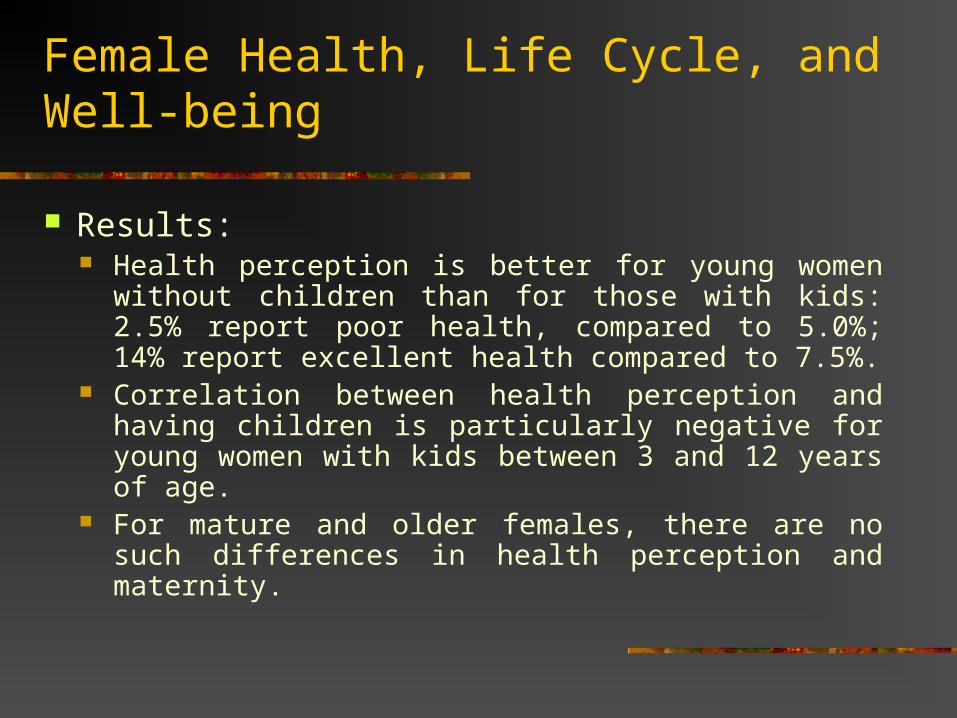
Results: Health perception is better for young women without
children than for those with kids: 2.5% report poor health, compared to 5.0%; 14% report excellent health compared to 7.5%.
Correlation between health perception and having children is particularly negative for young women with kids between 3 and 12 years of age.
For mature and older females, there are no such differences in health perception and maternity.

Female Health, Life Cycle, and Well-being
-Most women with kids between 3and 12 years are married, contrary to the restwho in general are single.
-Those women with children in this age interval have comparatively lower educational and income levels.
-Almost half the women without kids between 3 and 12 years old are students,compared to 70% of the rest who workoutside the house..
Table 5: Distribution of the young female sample, with and without children between three and twelve years old With children (3-12 years) Without children (3-12 years) Characteristic
Frequency
Percentage
Frequency
Percentage
Area Rural Urban
28 75
27,2 72,8
37
123
23,1 76,9
Civil Status* Married Divorced Free Union Widow Separate Single
63 10 13 0 3
14
61,2 9,7
12,6 0,0 2,9
13,6
32 2 8 0 3
113
20,2 1,3 5,1 0,0 1,9
71,5 Education Level* Low Medium High
35 49 19
34,0 47,6 18,4
23 61 76
14,4 38,1 47,5
O cupation* Unemployed Housekeeper Non-qualified Worker Low-qualified Worker Medium-qualified Worker Student Profesional
1 5 7 9 6 7 8
2,3
11,6 16,3 20,9 14,0 16,3 18,6
2 9 4
21 17 57 20
1,5 6,9 3,1
16,2 13,1 43,8 15,4
Income Level* Low Medium High
62 27 3
67,4 29,3 3,3
53 58 18
41,0 45,0 14,0
Female Health, Life Cycle, and Well-being
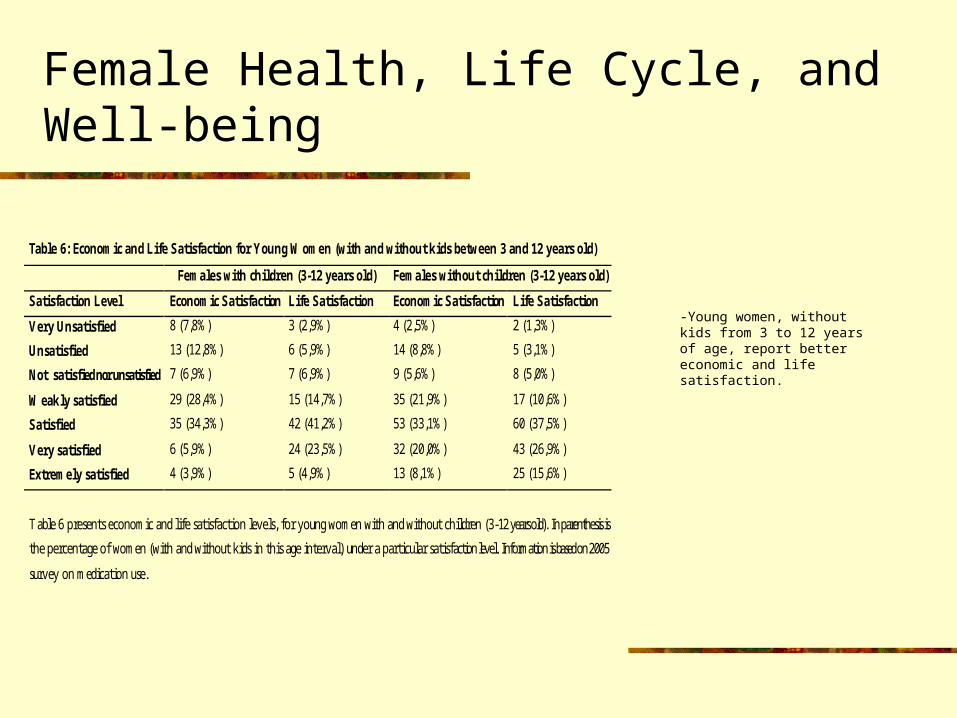
Table 6: Economic and Life Satisfaction for Young Women (with and without kids between 3 and 12 years old)
Females with children (3-12 years old) Females without children (3-12 years old)
Satisfaction Level Economic Satisfaction Life Satisfaction Economic Satisfaction Life Satisfaction
Very Unsatisfied 8 (7,8%) 3 (2,9%) 4 (2,5%) 2 (1,3%)
Unsatisfied 13 (12,8%) 6 (5,9%) 14 (8,8%) 5 (3,1%)
Not satisfied nor unsatisfied 7 (6,9%) 7 (6,9%) 9 (5,6%) 8 (5,0%)
Weakly satisfied 29 (28,4%) 15 (14,7%) 35 (21,9%) 17 (10,6%)
Satisfied 35 (34,3%) 42 (41,2%) 53 (33,1%) 60 (37,5%)
Very satisfied 6 (5,9%) 24 (23,5%) 32 (20,0%) 43 (26,9%)
Extremely satisfied 4 (3,9%) 5 (4,9%) 13 (8,1%) 25 (15,6%)
Table 6 presents economic and life satisfaction levels, for young women with and without children (3-12 years old). In parenthesis is
the percentage of women (with and without kids in this age interval) under a particular satisfaction level. Information is based on 2005
survey on medication use.
-Young women, without kids from 3 to 12 years of age, report better economic and life satisfaction.
Conclusions
Women use more medicines than men, independently of the life cycle.
Females are more likely to manifest stress symptoms than men.
Drug expenditure does not differ significantly according to gender.
Income is not related with health. Job satisfaction is important. The key is empowerment.
Conclusions
Highly educated people consume more types of medicines than the rest.
In general women with only 1 or 2 roles report worse health than those with multiple roles. It seems that being married, with children, and employed are complementary roles. But lack of roles is also positive for females´ well-being, partially due to more leisure time.
Conclusions
Female health differs significantly for young women with and without kids from 3 to 12 years of age.
This is related to particular socioeconomic differences: those without children in this age interval have more education and better economic conditions (empowerment, job satisfaction).

Acknowledgements
This study was financially supported by an unrestricted educational grant from the Merck Company Foundation, the philanthropic arm of Merck & Company Inc., White House Station, New Jersey, USA.

Related Documents


