Health Planning Solutions: Medical Staff Planning A Presentation for ICAHN and IHA

Health Planning Solutions: Medical Staff Planning
Jul 10, 2015
Welcome message from author
This document is posted to help you gain knowledge. Please leave a comment to let me know what you think about it! Share it to your friends and learn new things together.
Transcript
Health Planning Solutions: Medical Staff Planning
A Presentation for ICAHN and IHA
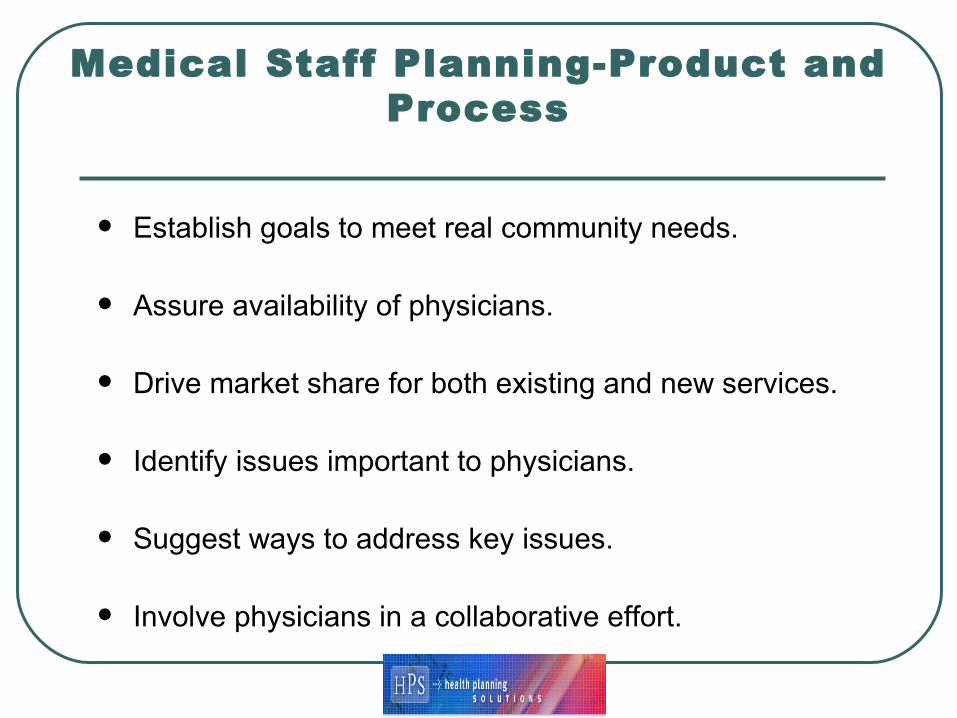
Medical Staff Planning-Product and Process
Establish goals to meet real community needs.
Assure availability of physicians.
Drive market share for both existing and new services.
Identify issues important to physicians.
Suggest ways to address key issues.
Involve physicians in a collaborative effort.

Medical Staff Planning:A Component of Strategic
Planning
Integral part of strategic planning and competitive analysis.
A complete understanding of the market informs physician needs.
Detailed clinical service line approach.
Detailed market share scenarios.
Physician office visit share.
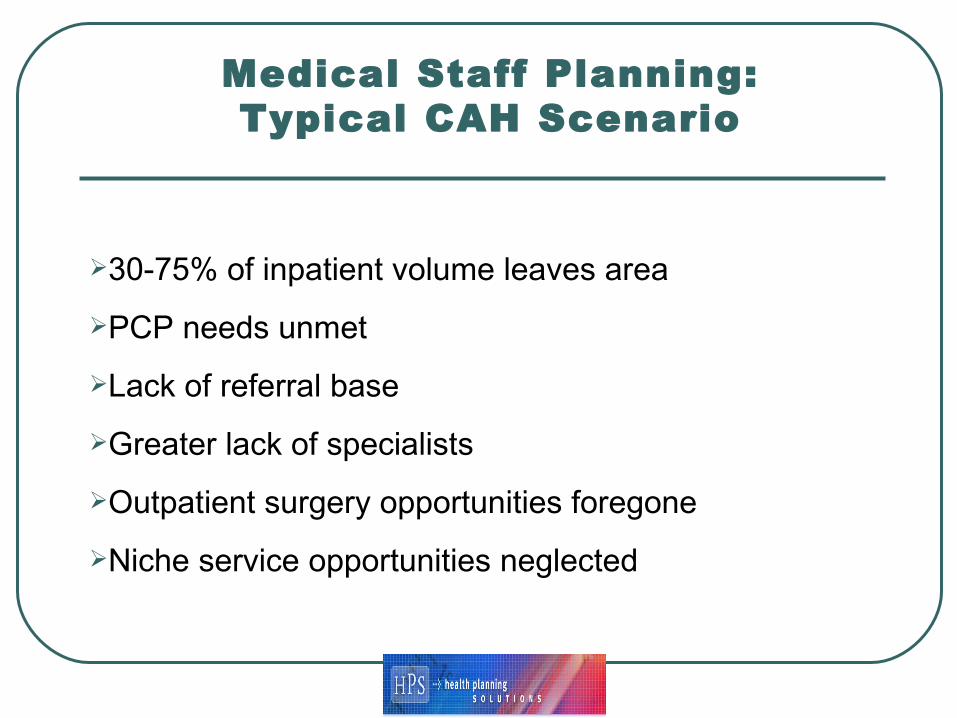
Medical Staff Planning:Typical CAH Scenario
30-75% of inpatient volume leaves area
PCP needs unmet
Lack of referral base
Greater lack of specialists
Outpatient surgery opportunities foregone
Niche service opportunities neglected

Medical Staff Planning:What Does the Market Require?
Clinical Service Line Planning
Inpatient Discharges
Outpatient Volumes (Visits and Procedures)
Physician Visits
Current and Projected
Population Growth
Demographic Composition
Financial Access

Medical Staff Planning:What Does the Market Require?
Market Share Goals and Scenarios
Existing Clinical Service Base
Success in physician recruitment
Low-Hanging Fruit
The 20-80 rule
Geographic Imperative
Competition
Profit potential

Medical Staff Planning:Demand for Services
Market Share Driven by Physicians
Determining the Number and Type of Physicians Needed
Standard Methodologies
Medical Professional Society-Generated Norms
Efficiency Benchmarks
Population to Physician Ratios
Empirical Models
Age Distribution
Gender Distribution
Specialty Specific
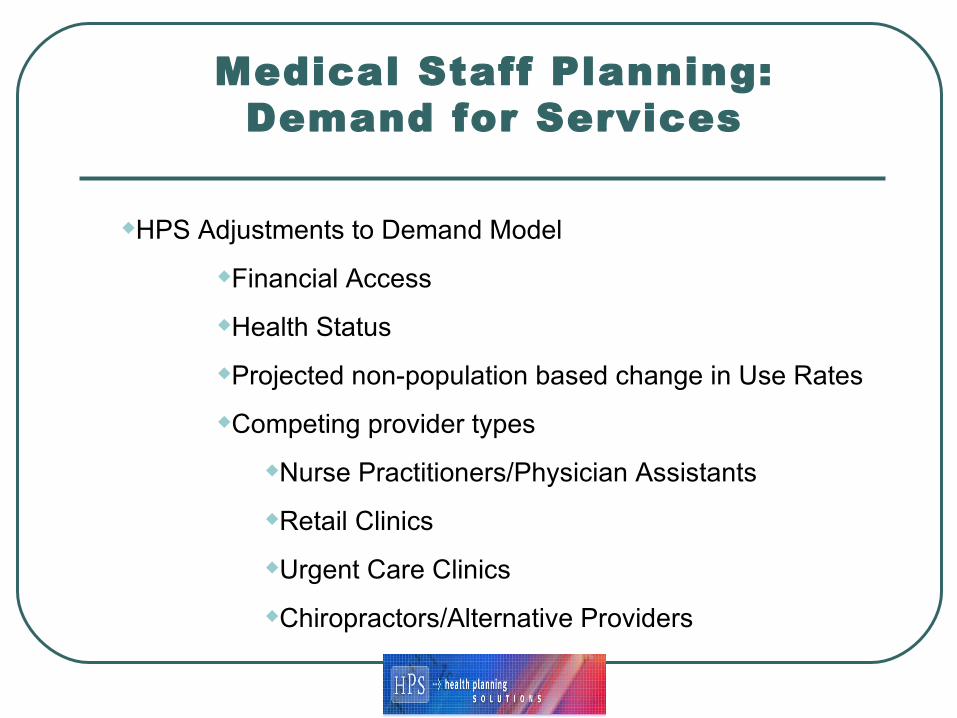
Medical Staff Planning:Demand for Services
HPS Adjustments to Demand Model
Financial Access
Health Status
Projected non-population based change in Use Rates
Competing provider types
Nurse Practitioners/Physician Assistants
Retail Clinics
Urgent Care Clinics
Chiropractors/Alternative Providers

Medical Staff Planning:Provider Supply
Supply of Providers
Determining current and future FTEs
Standard Methodologies
AMA Socioeconomic data
Productivity
By Age
By Region
Specialty-Specific

Medical Staff Planning: Provider Supply
HPS Supply Methodology
Face to Face Survey
Actual current productivity
Actual type of practice
Estimated future provider productivity
Projected retention and recruitment
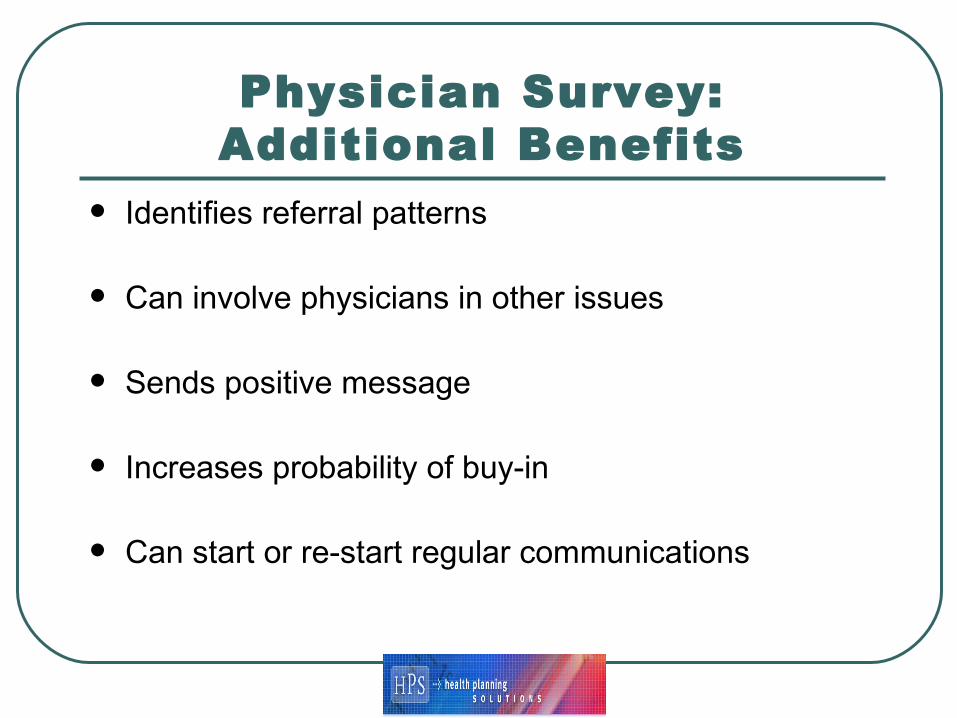
Physician Survey:Additional Benefits
Identifies referral patterns
Can involve physicians in other issues
Sends positive message
Increases probability of buy-in
Can start or re-start regular communications

Demographics
Population Counts, Estimates and Projections for the Primary Service Area and Secondary Service Area: 2005-2010
64,084 65,143
27870 28208
91954 93351
0
10,000
20,000
30,000
40,000
50,000
60,000
70,000
80,000
90,000
100,000
2005 2011
Year
Po
pu
atio
n
PSA SSA
Total
Sources: U.S. Census Bureau; Claritas
Chart 1
1.7% growth
1.2% growth
1.5% growth
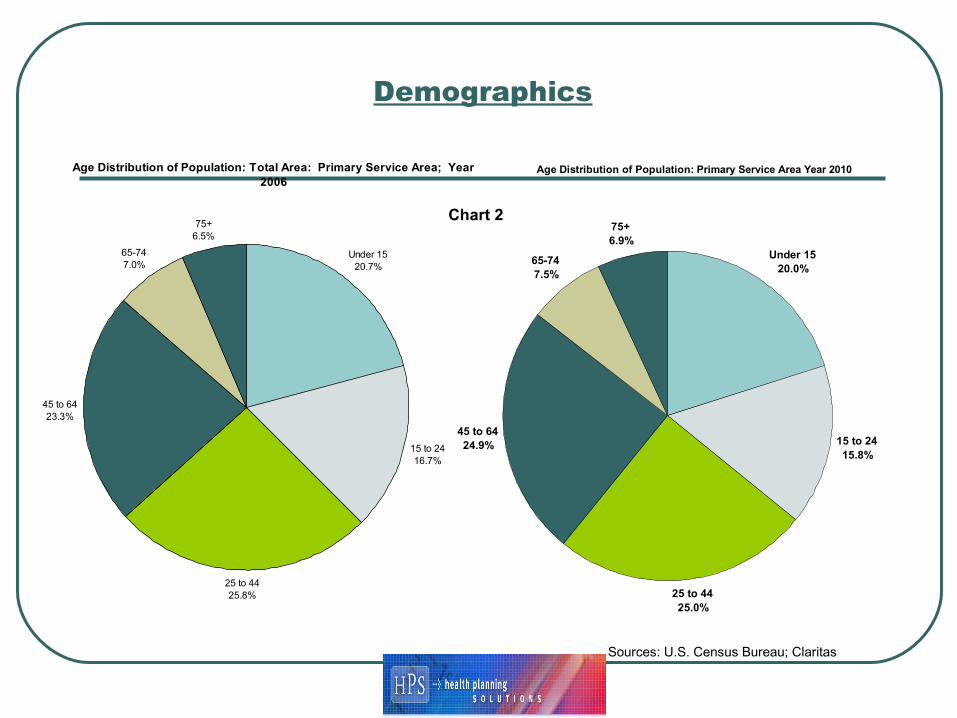
Demographics
Age Distribution of Population: Total Area: Primary Service Area; Year 2006
Under 1520.7%
15 to 2416.7%
25 to 4425.8%
45 to 6423.3%
65-747.0%
75+6.5%
Age Distribution of Population: Primary Service Area Year 2010
Under 1520.0%
15 to 2415.8%
25 to 4425.0%
45 to 6424.9%
65-747.5%
75+6.9%
Sources: U.S. Census Bureau; Claritas
Chart 2
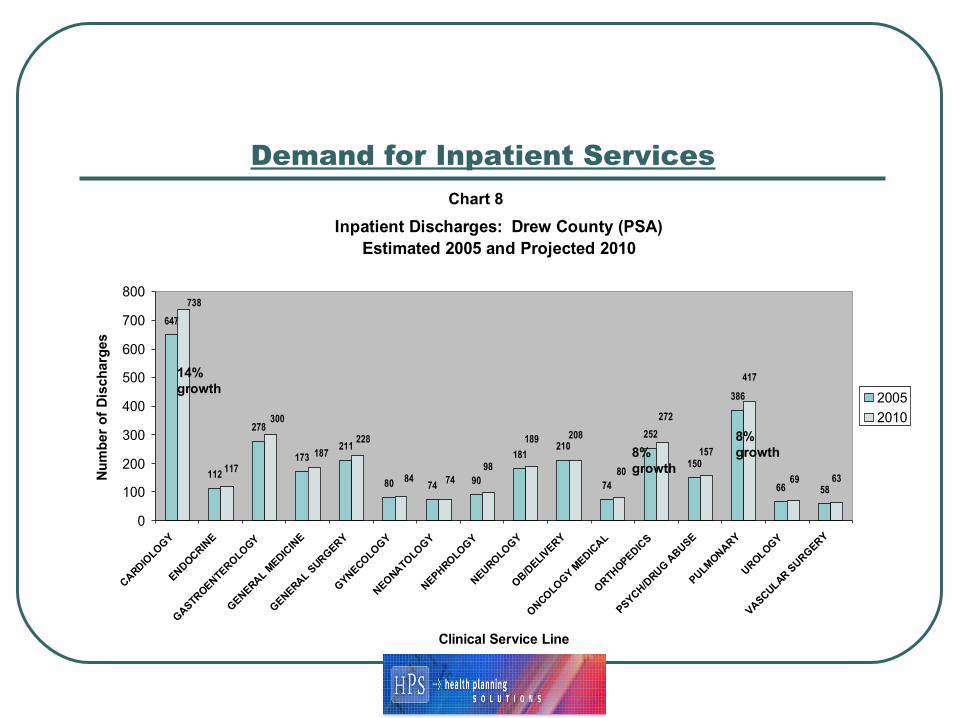
Demand for Inpatient Services
Inpatient Discharges: Drew County (PSA)Estimated 2005 and Projected 2010
647
112
278
173211
80 74 90
181210
74
252
150
386
66 58
1176369
417
157
272
80
208189
987484
228
300
187
738
0
100
200
300
400
500
600
700
800
CARDIOLOGY
ENDOCRINE
GASTROENTEROLOGY
GENERAL MEDIC
INE
GENERAL SURGERY
GYNECOLOGY
NEONATOLOGY
NEPHROLOGY
NEUROLOGY
OB/DELIV
ERY
ONCOLOGY MEDIC
AL
ORTHOPEDICS
PSYCH/DRUG A
BUSE
PULMONARY
UROLOGY
VASCULAR SURGERY
Clinical Service Line
Nu
mb
er o
f D
isch
arg
es
2005
2010
Chart 8
14% growth
8% growth8%
growth
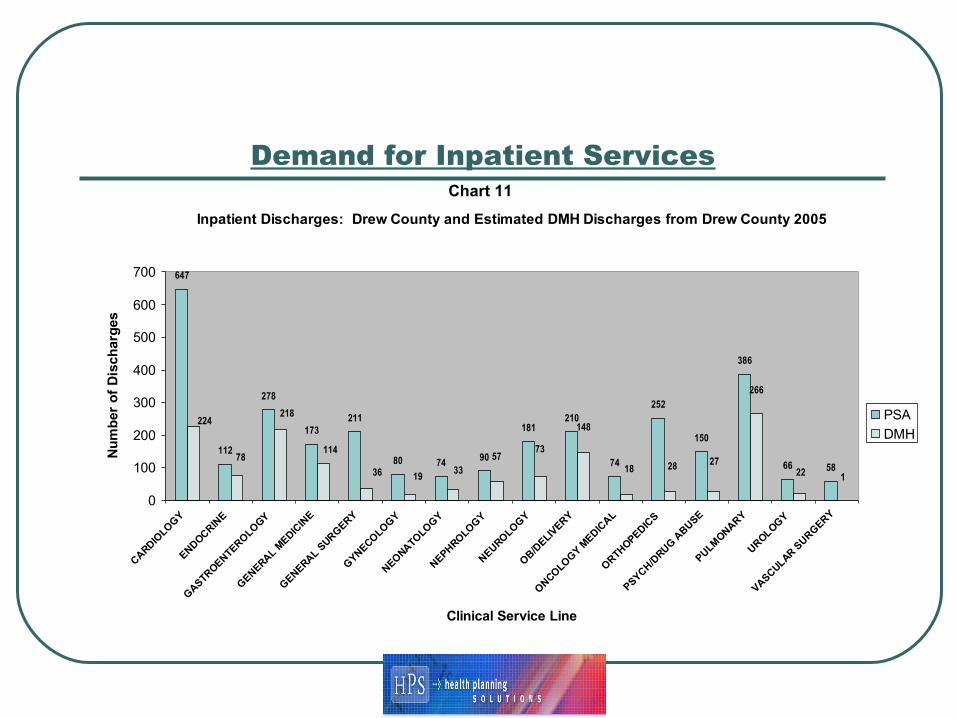
Demand for Inpatient Services
Inpatient Discharges: Drew County and Estimated DMH Discharges from Drew County 2005
647
112
278
173211
80 74 90
181210
74
252
150
386
66 5878
122
266
272818
148
7357
331936
218
114
224
0
100
200
300
400
500
600
700
CARDIOLO
GY
ENDOCRINE
GASTROENTERO
LOGY
GENERAL M
EDICIN
E
GENERAL S
URGERY
GYNECO
LOG
Y
NEONATO
LOG
Y
NEPHROLO
GY
NEUROLO
GY
OB/D
ELIVERY
ONCO
LOG
Y MEDIC
AL
ORTHOPEDIC
S
PSYCH/DRUG
ABUSE
PULMONARY
UROLOGY
VASCULAR SURG
ERY
Clinical Service Line
Nu
mb
er o
f D
isch
arg
es
PSA
DMH
Chart 11
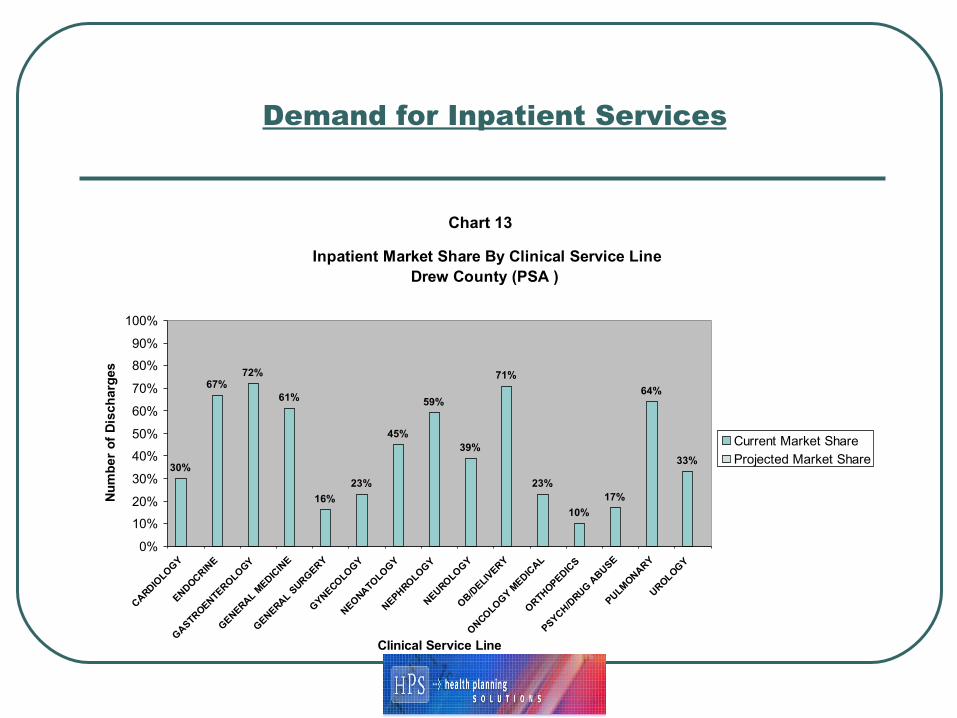
Demand for Inpatient Services
Inpatient Market Share By Clinical Service LineDrew County (PSA )
30%
67%72%
61%
16%
23%
45%
59%
39%
71%
23%
10%
17%
64%
33%
0%
10%
20%
30%
40%
50%
60%
70%
80%
90%
100%
CARDIOLO
GY
ENDOCRINE
GASTROENTERO
LOGY
GENERAL M
EDICIN
E
GENERAL S
URGERY
GYNECO
LOG
Y
NEONATO
LOG
Y
NEPHROLO
GY
NEUROLO
GY
OB/D
ELIVERY
ONCO
LOG
Y MEDIC
AL
ORTHOPEDIC
S
PSYCH/DRUG
ABUSE
PULMONARY
UROLOGY
Clinical Service Line
Nu
mb
er o
f D
isch
arg
es
Current Market Share
Projected Market Share
Chart 13
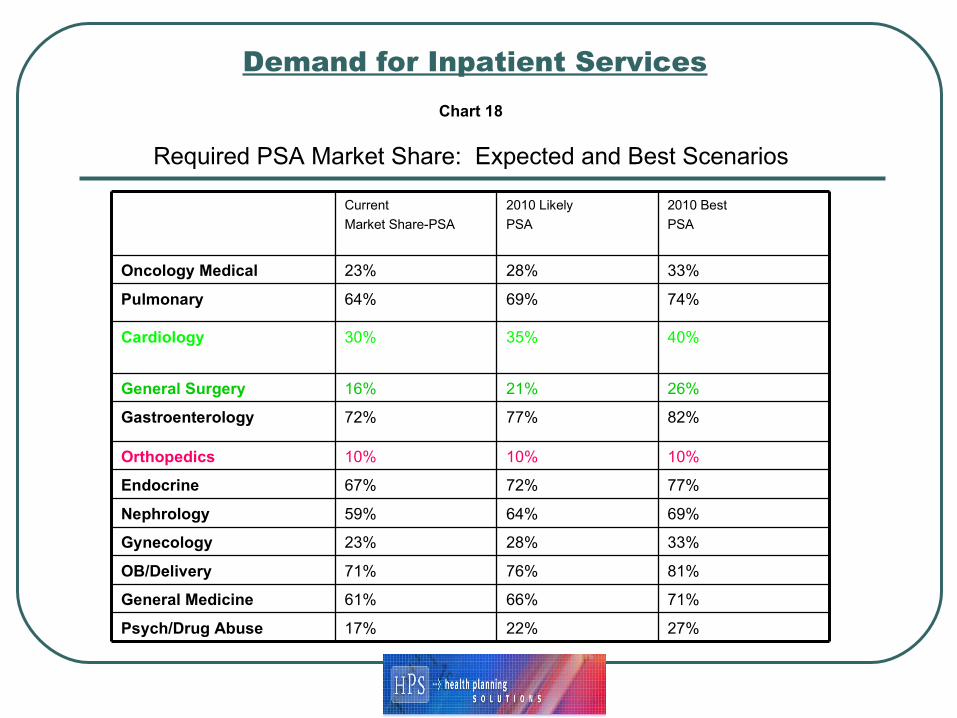
Demand for Inpatient Services
33%28%23%Oncology Medical
40%35%30%Cardiology
74%69%64%Pulmonary
77%72%67%Endocrine
10%10%10%Orthopedics
82%77%72%Gastroenterology
26%21%16%General Surgery
17%
61%
71%
23%
59%
Current
Market Share-PSA
22%
66%
76%
28%
64%
2010 Likely
PSA
27%Psych/Drug Abuse
81%OB/Delivery
71%General Medicine
33%
69%
2010 Best
PSA
Gynecology
Nephrology
Chart 18
Required PSA Market Share: Expected and Best Scenarios

Demand for Outpatient Surgery Services Surgical Outpatient Procedure Volumes: Drew, Ashley, Lincoln, and Desha
CountiesEstimated 2005 and Market Share
2407
716
2048
6,317
11,488
368 167 58 263856
3% 4% 8%23%15%0
2000
4000
6000
8000
10000
12000
14000
Surgery-Digestive Surgery-Ophthalmology
Surgery-Orthopedics
Surgery-All Other Surgery-Total
Num
ber
of P
roce
dure
s
Market
DMH
Market Share
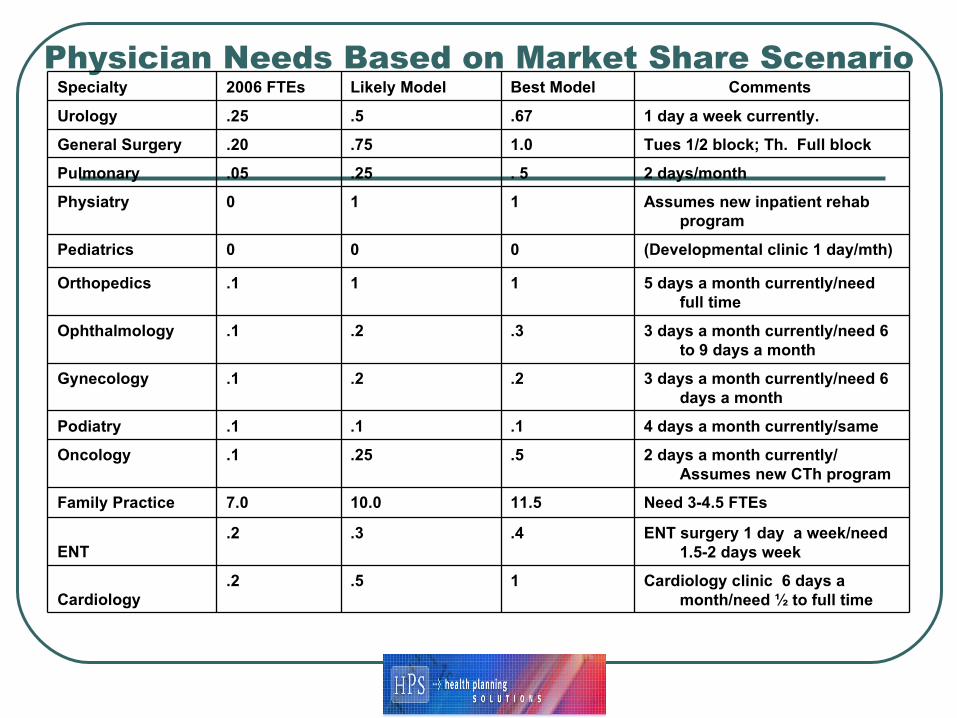
Physician Needs Based on Market Share Scenario
.5
.3
10.0
.25
.1
.2
.2
1
0
1
.25
.75
.5
Likely Model
4 days a month currently/same.1.1Podiatry
2 days a month currently/ Assumes new CTh program
.5.1Oncology
Cardiology clinic 6 days a month/need ½ to full time
1.2Cardiology
ENT surgery 1 day a week/need 1.5-2 days week
.4.2ENT
Need 3-4.5 FTEs11.57.0Family Practice
3 days a month currently/need 6 days a month
.2.1Gynecology
3 days a month currently/need 6 to 9 days a month
.3.1Ophthalmology
5 days a month currently/need full time
1.1Orthopedics
(Developmental clinic 1 day/mth)00Pediatrics
Assumes new inpatient rehab program
10Physiatry
2 days/month. 5.05Pulmonary
Tues 1/2 block; Th. Full block1.0.20General Surgery
1 day a week currently..67.25Urology
Comments Best Model2006 FTEsSpecialty

Expected Need for PhysiciansVisits Required Current FTEs Staffing
Expected FTEs MD Retire/Relocate Additons RequiredFP/IM 116,098 14.74 13.20 3.80 6-10 -.66 to -.4.66General Surgery 6,785 3.53 4.00 0.00 1.00 -1.47Orthopedic Surgery 13,946 3.43 1.00 0.00 2.00 0.43Pediatrics 25,831 5.71 4.00 0.00 3.00 -1.29Ob/Gyn 15,309 3.93 4.40 0.50 0.00 0.03Otolaryngology 6,722 1.63 1.00 0.00 0.00 0.63Ophthalmology 16,188 3.52 3.00 0.00 0.00 0.52Urology 5,496 2.05 0.00 0.00 1.00 1.05Cardiology 6,855 3.01 3.00 0.00 0.00 0.01Neurology 3,930 1.19 0.70 0.00 0.00 0.49Dermatology 11,174 1.51 1.00 0.00 0.00 0.51Podiatry 17,835 2.32 1.00 0.00 0.00 1.32Nephrology N/A 1.00 1.00 0.00 0.00 0.00Hospitalists N/A 3.00 2.00 1.00 2.00 1.00Physiatry N/A 1.00 1.00 0.00 0.00 0.00Vascular Surgery 2,499 0.56 1.00 1.00 0.00 0.56Gastroenterology 2,598 1.18 1.00 1.00 0.00 1.18Pulmonology 4,605 1.32 1.00 1.00 0.00 1.32Psychiatry 10,017 6.96 0.00 0.00 1.00 5.96Endocrinology 2,757 0.92 1.00 1.00 0.00 0.92Oncology 2,765 1.54 1.00 1.00 1.00 0.54Pathology N/A 1.00 1.00 0.00 0.00 0.00Radiology N/A 1.00 1.00 0.00 0.00 0.00Emergency Department N/A 6.00 6.00 0.00 0.00 0.00Oral and Maxillofacial Surgery N/A 2.00 2.00 0.00 0.00 0.00Total 271,411 74.06 55.30 10.30 19.00 11.48-15.48
Physician Capacity - Clovis, Roosevelt, Quay, Bailey, Parmer

Questions or Comments-Now or Later
Peter Strauss Health Planning Solutions 8310 Gannon Avenue, Suite 200. St. Louis, MO
63132 314-583-9023 [email protected] www.healthplanningsolutions.com
Related Documents