Health Care Associated Infections in 2016 Acute Care Hospitals Alfred DeMaria, Jr., M.D. State Epidemiologist Bureau of Infectious Disease and Laboratory Sciences Katherine T. Fillo, Ph.D, RN-BC Director of Clinical Quality Improvement Bureau of Health Care Safety & Quality Eileen McHale, RN, BSN Healthcare Associated Infection Coordinator Bureau of Health Care Safety and Quality Public Health Council September 13, 2017

Welcome message from author
This document is posted to help you gain knowledge. Please leave a comment to let me know what you think about it! Share it to your friends and learn new things together.
Transcript
Health Care Associated Infections in 2016 Acute Care Hospitals
Alfred DeMaria, Jr., M.D. State Epidemiologist
Bureau of Infectious Disease and Laboratory Sciences
Katherine T. Fillo, Ph.D, RN-BC
Director of Clinical Quality Improvement
Bureau of Health Care Safety & Quality
Eileen McHale, RN, BSN
Healthcare Associated Infection Coordinator
Bureau of Health Care Safety and Quality
Public Health Council September 13, 2017
Introduction
Healthcare-associated infections (HAIs) are infections that patients acquire during the course of receiving treatment for other conditions within a healthcare setting. HAIs are among the leading causes of preventable death in the United States, affecting 1 in 25 hospitalized patients, accounting for an estimated 722,000 infections and an associated 75,000 deaths during hospitalization.* The Massachusetts Department of Public Health (DPH) developed this data update as a component of the Statewide Infection Prevention and Control Program created pursuant to Chapter 58 of the Acts of 2006.
• Massachusetts law provides DPH with the legal authority to conduct surveillance, and to investigate and control the spread of communicable and infectious diseases. (MGL c. 111,sections 6 & 7)
• DPH implements this responsibility in hospitals through the hospital licensing regulation.
(105 CMR 130.000)
• Section 51H of chapter 111 of the Massachusetts General Laws authorizes the Department to collect HAI data and disseminate the information publicly to encourage quality improvement. (https://malegislature.gov/Laws/GeneralLaws/PartI/TitleXVI/Chapter111/Section51H)
Magill SS, Edwards JR, Bamberg W, et al. Multistate point-prevalence survey of health care-associated infections. N Engl J Med. 2014; 370:1198-208.
*
2
Introduction
This HAI presentation is the eighth annual Public Health Council update:
• It is an important component of larger efforts to reduce preventable
infections in health care settings;
• It presents an analysis of progress on infection prevention within Massachusetts acute care hospitals; and
• It is based upon work supported by state funds and the Centers for Disease Control and Prevention (CDC).
3
Methods
This data summary includes the following statewide measures for the 2016 calendar year (January 1, 2016 – December 31, 2016) as reported to the CDC’s National Healthcare Safety Network (NHSN). The DPH required measures are consistent with the Centers for Medicare and Medicaid Services quality reporting measures. • Central line associated bloodstream infections (CLABSI) in intensive care units • Catheter associated urinary tract infections (CAUTI) in intensive care units
• Specific surgical site infections (SSI); and
• Specific facility wide laboratory identified events (LabID)
*National baseline data for each measure are based on a statistical risk model derived from 2015 national data.
*All data were extracted from NHSN on August 11, 2017.
4
NEW: NHSN Rebaseline
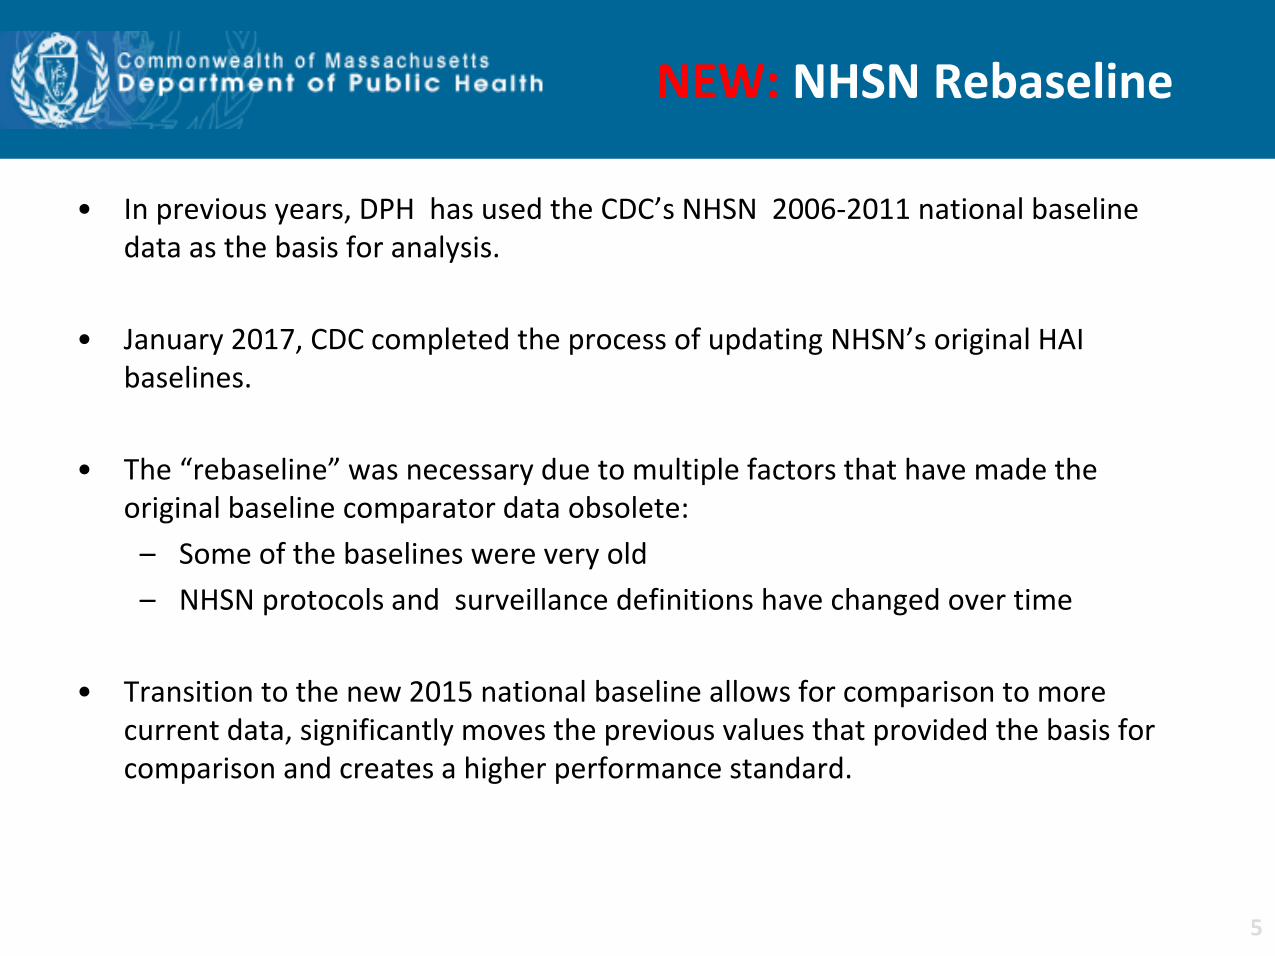
• In previous years, DPH has used the CDC’s NHSN 2006-2011 national baseline data as the basis for analysis.
• January 2017, CDC completed the process of updating NHSN’s original HAI baselines.
• The “rebaseline” was necessary due to multiple factors that have made the original baseline comparator data obsolete:
– Some of the baselines were very old
– NHSN protocols and surveillance definitions have changed over time
• Transition to the new 2015 national baseline allows for comparison to more current data, significantly moves the previous values that provided the basis for comparison and creates a higher performance standard.
5

• Standardized Infection Ratio (SIR)*
• When the actual number is equal to the predicted number the SIR = 1.0
• Central Line Utilization Ratio
• Urinary Catheter Utilization Ratio
Measures
Central Line Utilization Ratio = Number of Central Line Days
Number of Patient Days
Standardized Infection Ratio (SIR) = Actual Number of Infections
Predicted Number of Infections
Urinary Catheter Utilization Ratio = Number of Urinary Catheter Days
Number of Patient Days
6
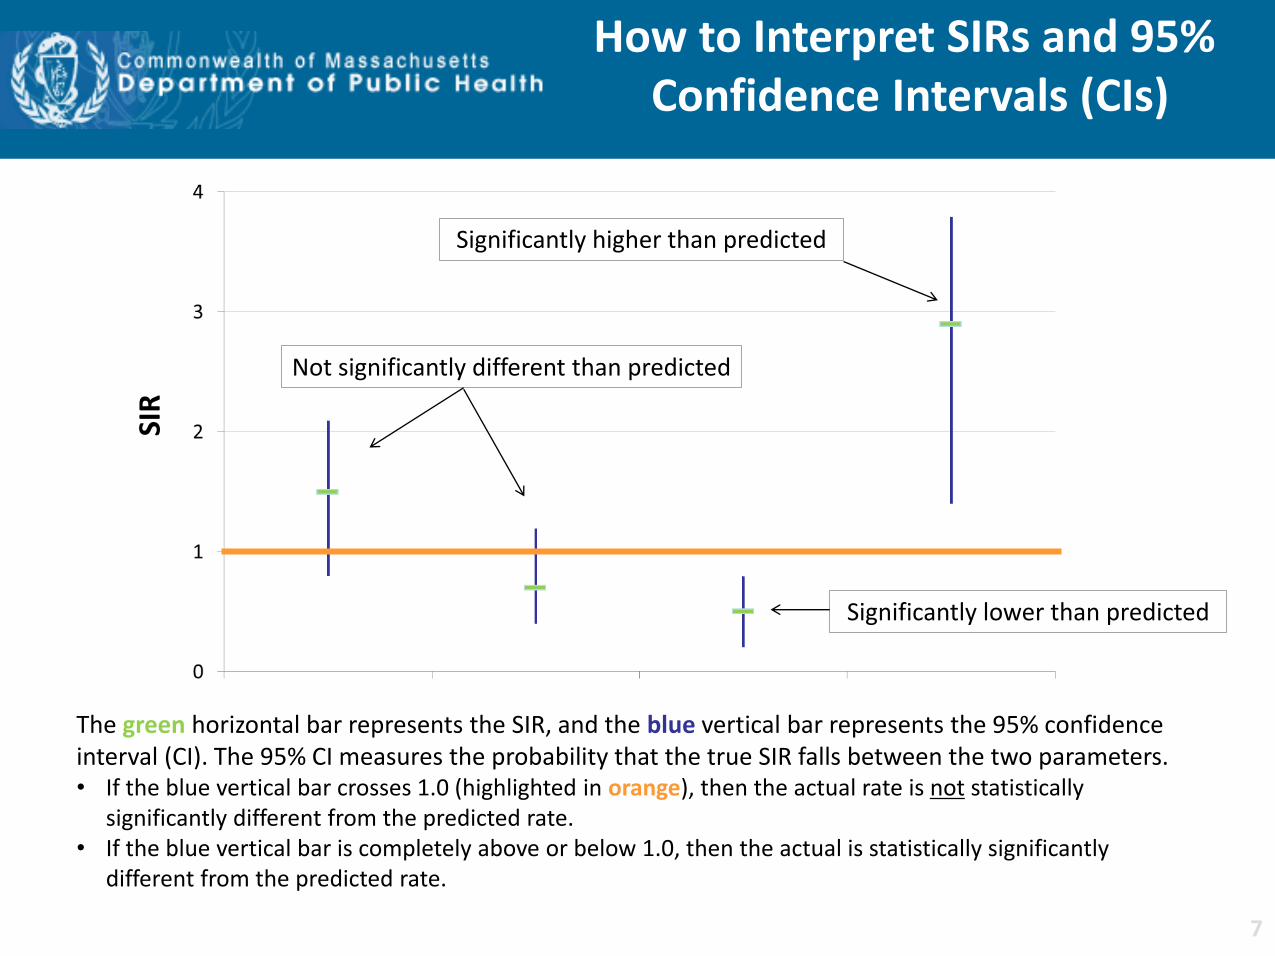
How to Interpret SIRs and 95% Confidence Intervals (CIs)
SIR
The green horizontal bar represents the SIR, and the blue vertical bar represents the 95% confidence interval (CI). The 95% CI measures the probability that the true SIR falls between the two parameters. • If the blue vertical bar crosses 1.0 (highlighted in orange), then the actual rate is not statistically
significantly different from the predicted rate. • If the blue vertical bar is completely above or below 1.0, then the actual is statistically significantly
different from the predicted rate.
Not significantly different than predicted
Significantly lower than predicted
Significantly higher than predicted
7
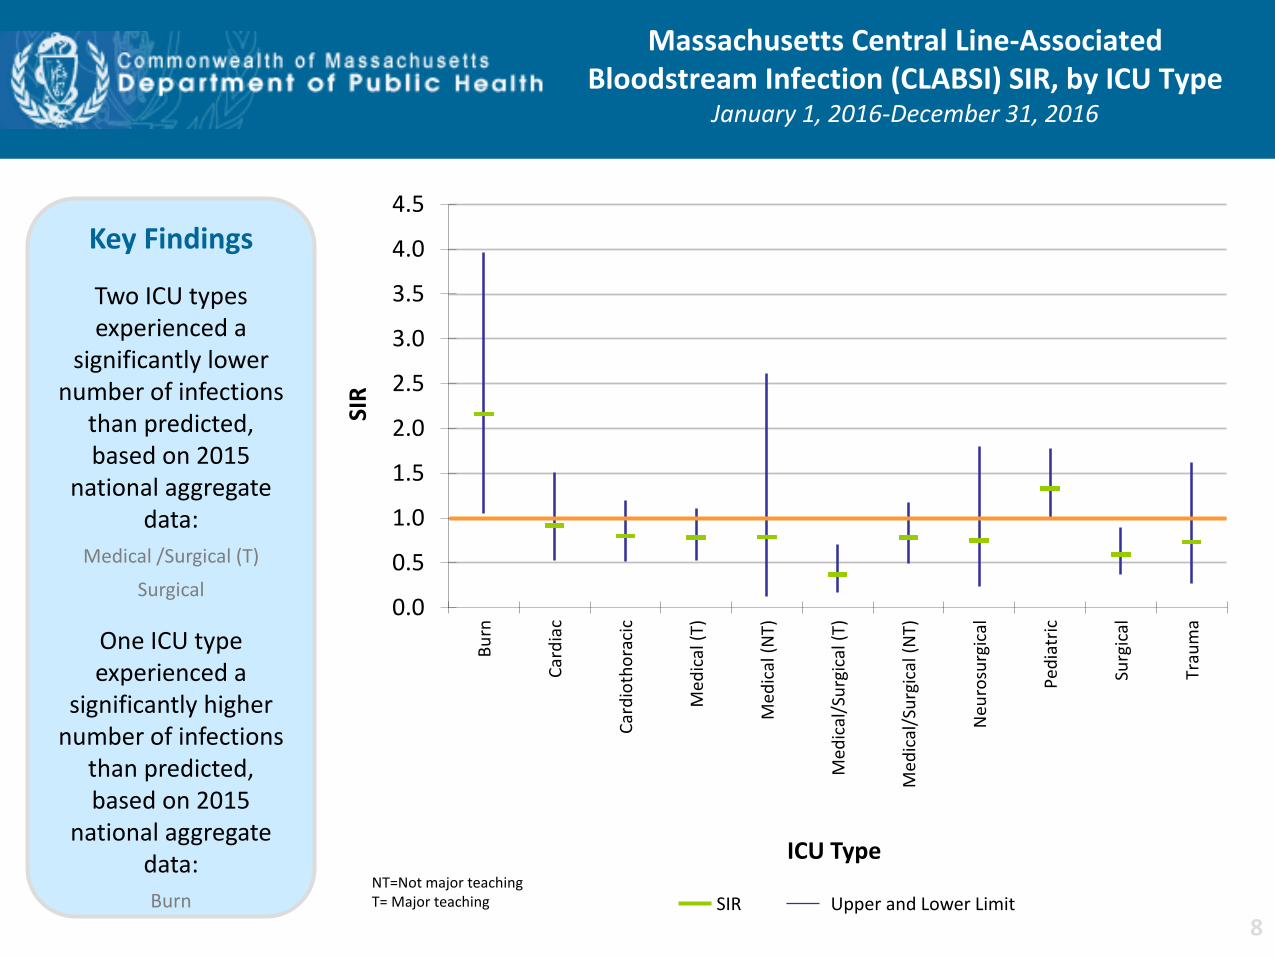
Massachusetts Central Line-Associated Bloodstream Infection (CLABSI) SIR, by ICU Type
January 1, 2016-December 31, 2016
NT=Not major teaching T= Major teaching SIR Upper and Lower Limit
0.0
0.5
1.0
1.5
2.0
2.5
3.0
3.5
4.0
4.5
Bu
rn
Car
dia
c
Car
dio
tho
raci
c
Med
ical
(T)
Med
ical
(N
T)
Me
dic
al/S
urg
ical
(T)
Med
ical
/Su
rgic
al (
NT)
Neu
rosu
rgic
al
Ped
iatr
ic
Surg
ical
Trau
ma
SIR
ICU Type
Key Findings
Two ICU types experienced a
significantly lower number of infections
than predicted, based on 2015
national aggregate data:
Medical /Surgical (T)
Surgical
One ICU type experienced a
significantly higher number of infections
than predicted, based on 2015
national aggregate data:
Burn
8
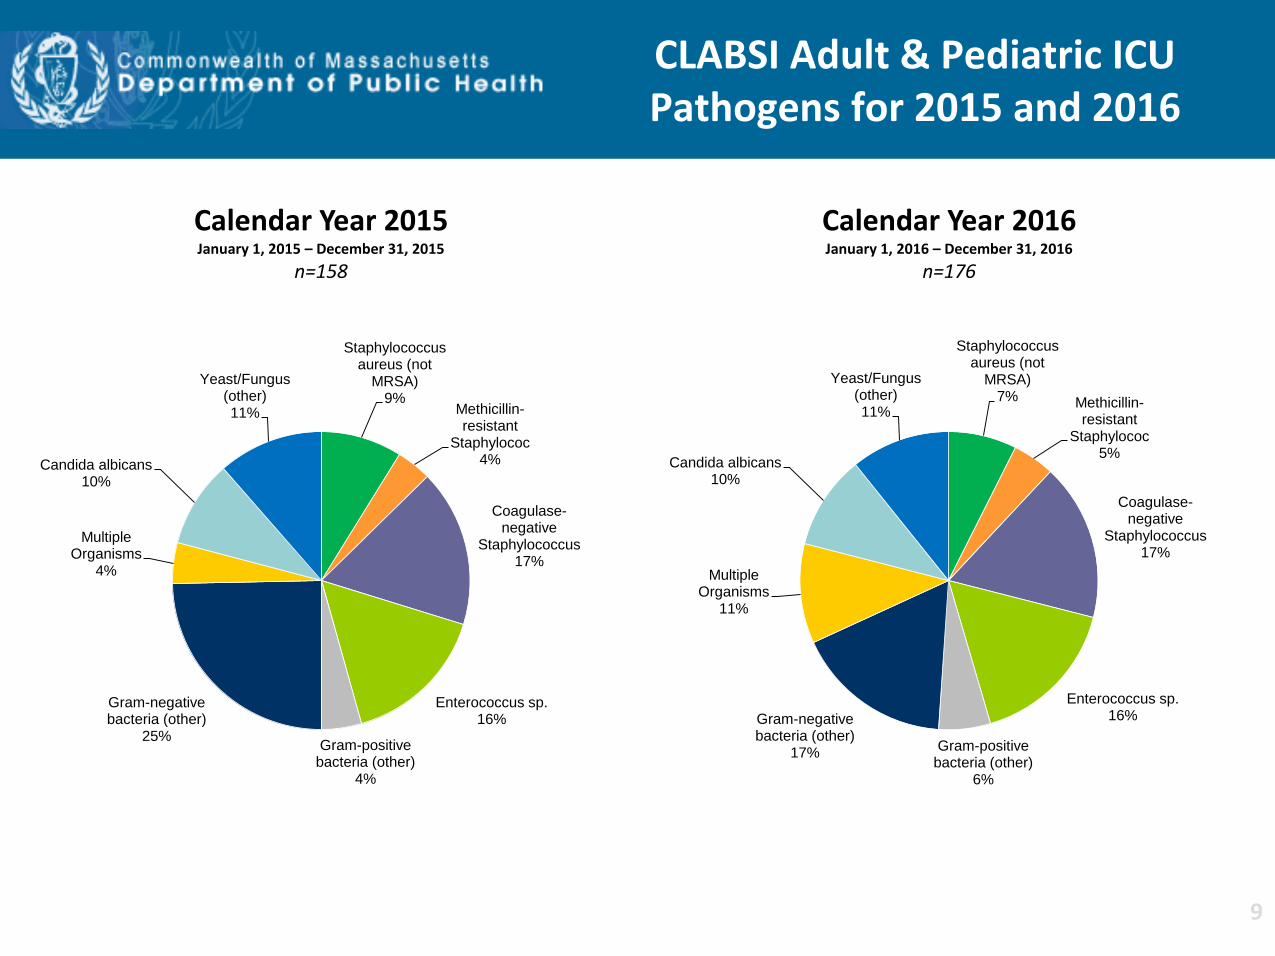
CLABSI Adult & Pediatric ICU Pathogens for 2015 and 2016
Calendar Year 2016 January 1, 2016 – December 31, 2016
n=176
Staphylococcus aureus (not
MRSA) 7% Methicillin-
resistant Staphylococ
5%
Coagulase-negative
Staphylococcus 17%
Enterococcus sp. 16%
Gram-positive bacteria (other)
6%
Gram-negative bacteria (other)
17%
Multiple Organisms
11%
Candida albicans 10%
Yeast/Fungus (other) 11%
Calendar Year 2015 January 1, 2015 – December 31, 2015
n=158
Staphylococcus aureus (not
MRSA) 9%
Methicillin-resistant
Staphylococ 4%
Coagulase-negative
Staphylococcus 17%
Enterococcus sp. 16%
Gram-positive bacteria (other)
4%
Gram-negative bacteria (other)
25%
Multiple Organisms
4%
Candida albicans 10%
Yeast/Fungus (other) 11%
9
0.0
1.0
2.0
3.0
4.0
5.0
≤750 g 751-1000 g 1001-1500 g 1501-2500 g >2500 g
SIR
Birth Weight
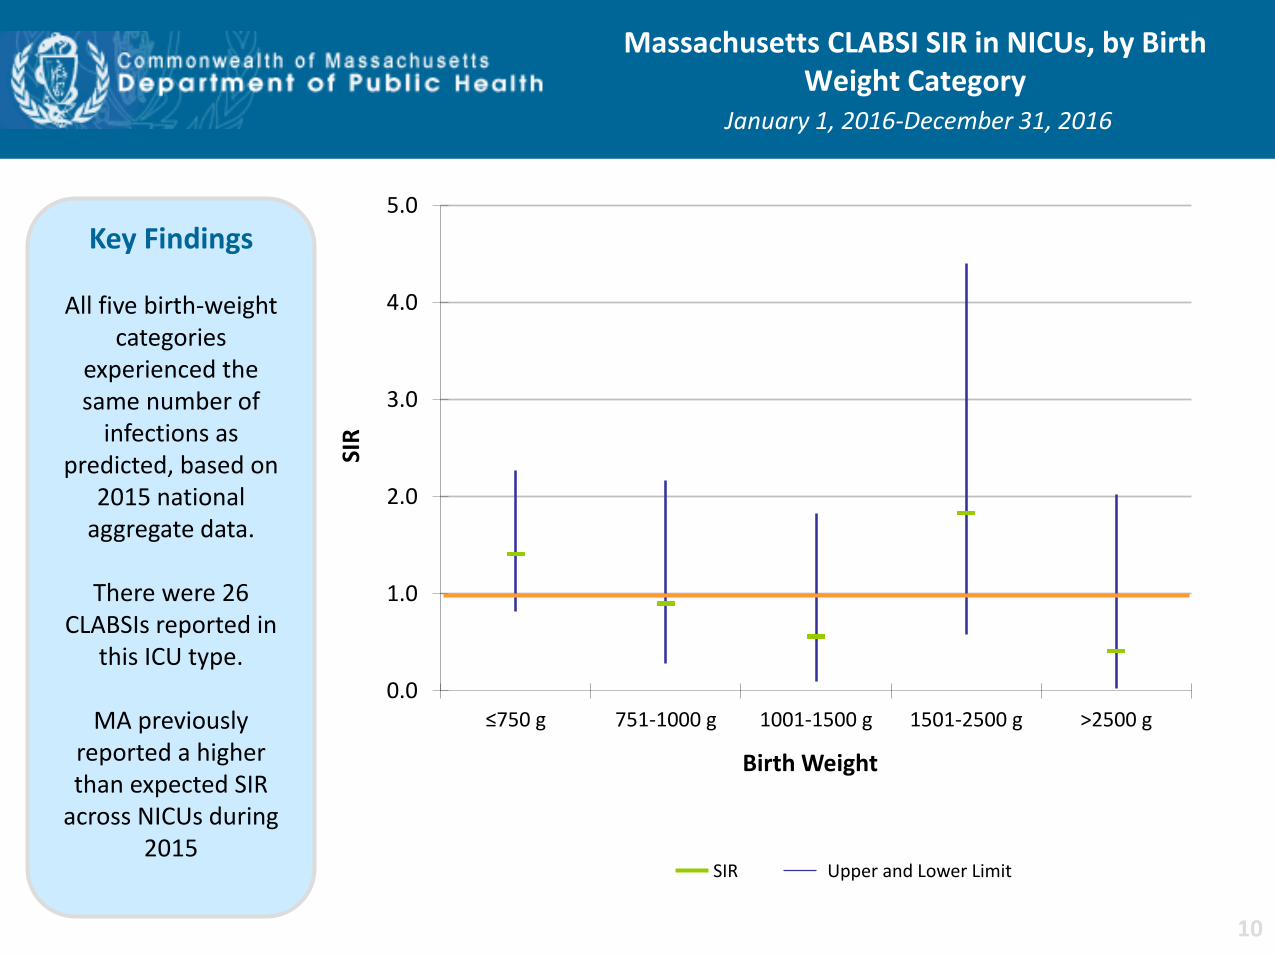
Massachusetts CLABSI SIR in NICUs, by Birth Weight Category
January 1, 2016-December 31, 2016
Key Findings
All five birth-weight categories
experienced the same number of
infections as predicted, based on
2015 national aggregate data.
There were 26
CLABSIs reported in this ICU type.
MA previously
reported a higher than expected SIR
across NICUs during 2015
SIR Upper and Lower Limit
10
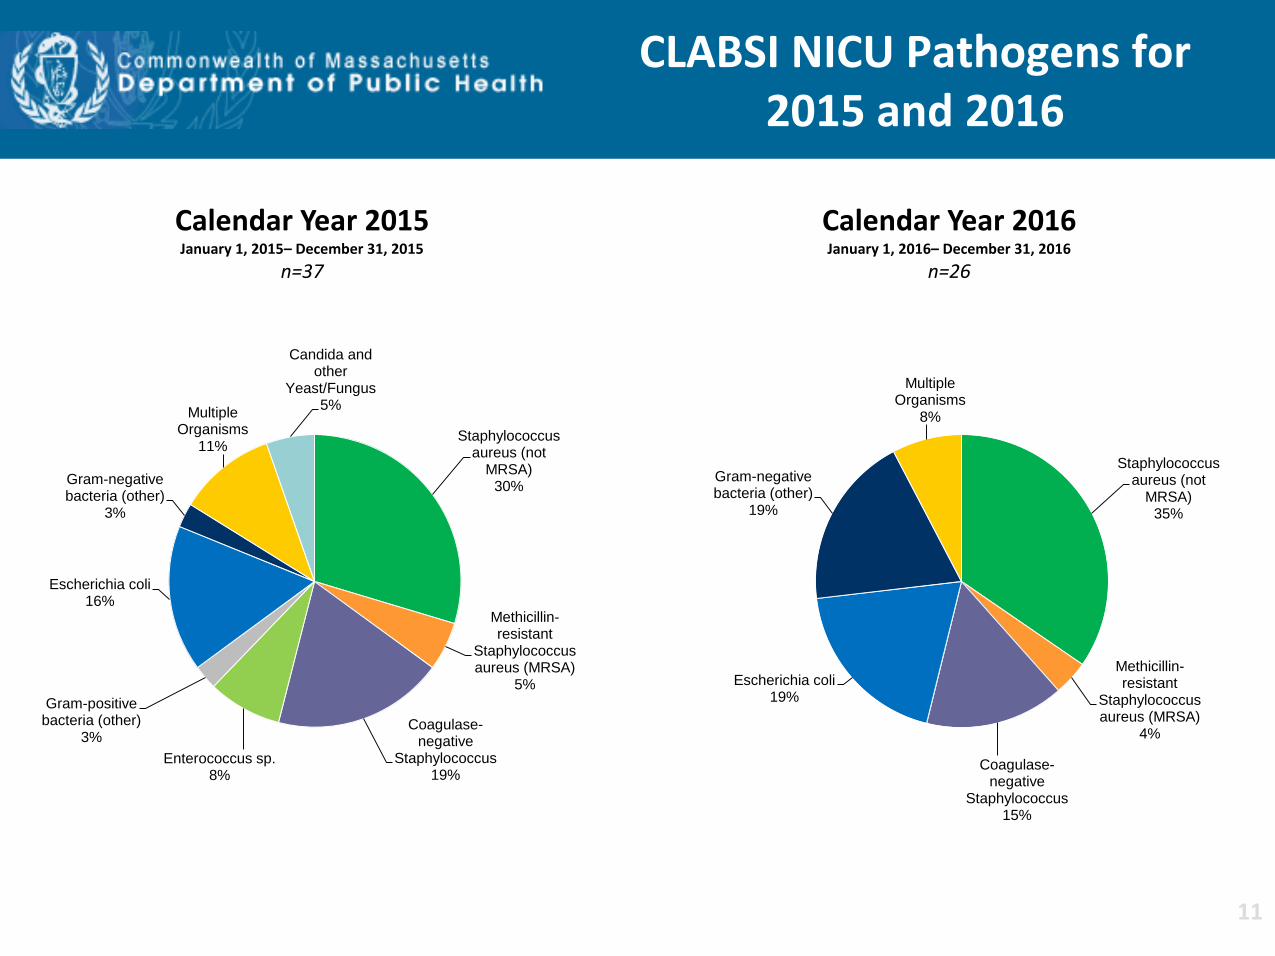
CLABSI NICU Pathogens for 2015 and 2016
Calendar Year 2016 January 1, 2016– December 31, 2016
n=26
Staphylococcus aureus (not
MRSA) 35%
Methicillin-resistant
Staphylococcus aureus (MRSA)
4%
Coagulase-negative
Staphylococcus 15%
Escherichia coli 19%
Gram-negative bacteria (other)
19%
Multiple Organisms
8%
Calendar Year 2015 January 1, 2015– December 31, 2015
n=37
Staphylococcus aureus (not
MRSA) 30%
Methicillin-resistant
Staphylococcus aureus (MRSA)
5%
Coagulase-negative
Staphylococcus 19%
Enterococcus sp. 8%
Gram-positive bacteria (other)
3%
Escherichia coli 16%
Gram-negative bacteria (other)
3%
Multiple Organisms
11%
Candida and other
Yeast/Fungus 5%
11

0.0
0.5
1.0
1.5
2.0
2015 2016
SIR
Calendar Year Adult Pediatric Neonatal
State CLABSI SIR
Key Findings
For the past two years, adult ICUs
experienced a significantly lower
number of infections than predicted, based on 2015
national aggregate data.
In 2016, neonatal
ICUs experienced the same number of infections than
predicted, based on 2015 national
aggregate data. .
12
0.0
0.1
0.2
0.3
0.4
0.5
0.6
0.7
2015 2016
Uti
lizat
ion
Rat
io
Calendar Year
Adult Pediatric Neonatal
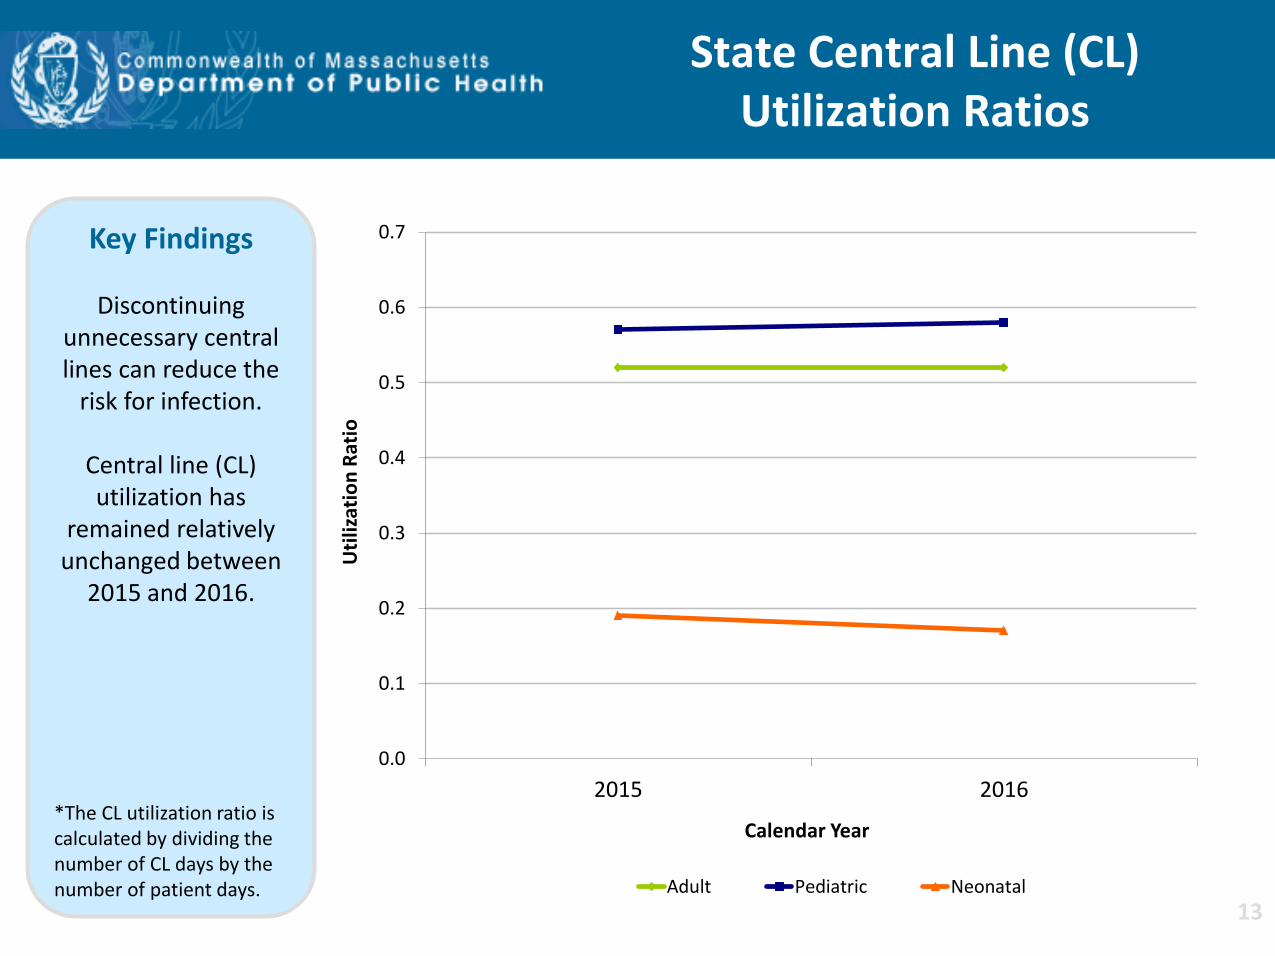
State Central Line (CL) Utilization Ratios
Key Findings
Discontinuing unnecessary central lines can reduce the
risk for infection.
Central line (CL) utilization has
remained relatively unchanged between
2015 and 2016.
*The CL utilization ratio is calculated by dividing the number of CL days by the number of patient days.
13
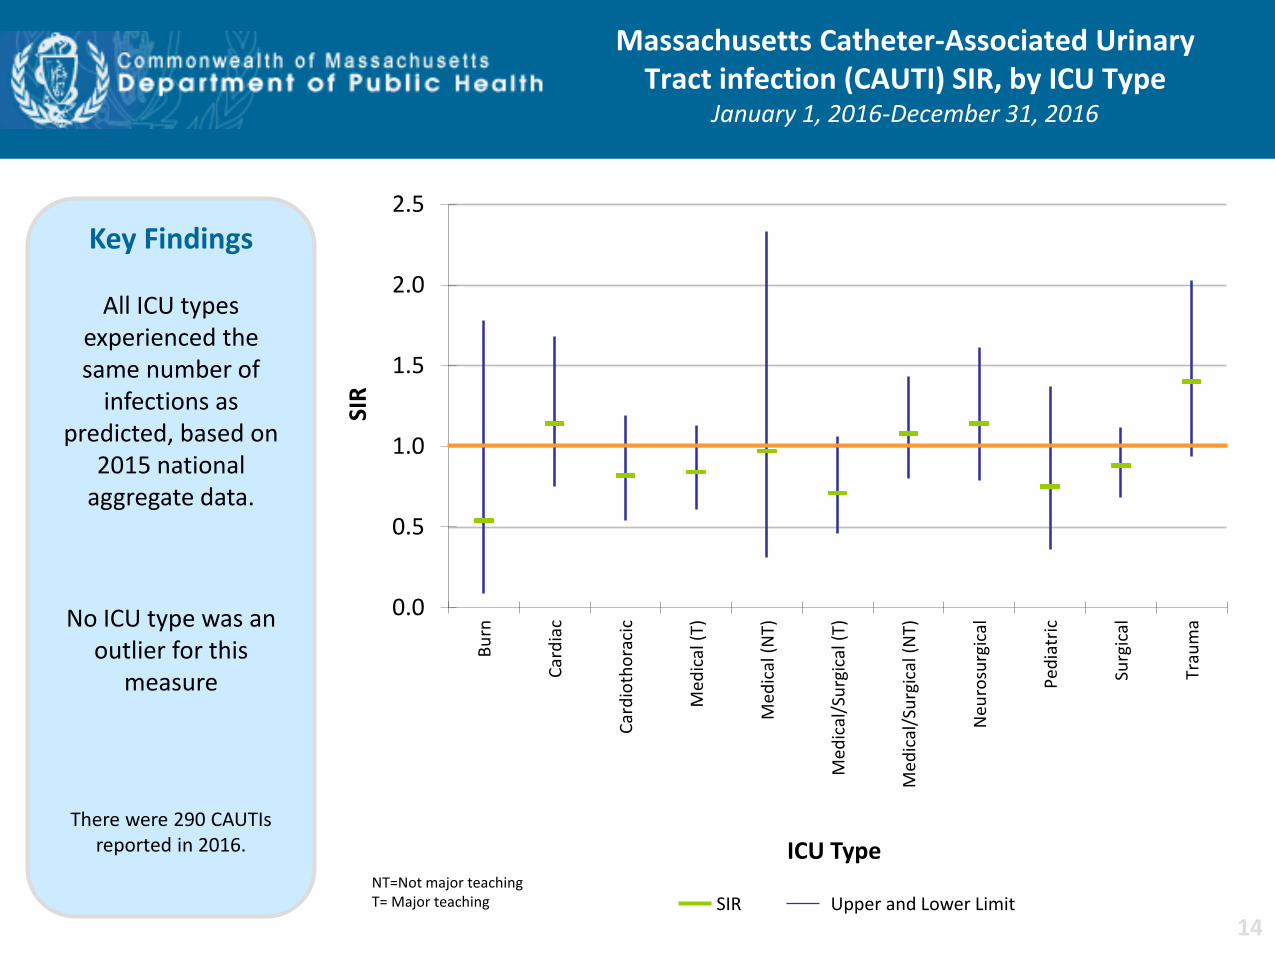
Massachusetts Catheter-Associated Urinary Tract infection (CAUTI) SIR, by ICU Type
January 1, 2016-December 31, 2016
NT=Not major teaching T= Major teaching SIR Upper and Lower Limit
0.0
0.5
1.0
1.5
2.0
2.5
Bu
rn
Car
dia
c
Car
dio
tho
raci
c
Med
ical
(T)
Med
ical
(N
T)
Me
dic
al/S
urg
ical
(T)
Med
ical
/Su
rgic
al (
NT)
Neu
rosu
rgic
al
Ped
iatr
ic
Surg
ical
Trau
ma
SIR
ICU Type
Key Findings
All ICU types experienced the same number of
infections as predicted, based on
2015 national aggregate data.
No ICU type was an outlier for this
measure
There were 290 CAUTIs reported in 2016.
14

CAUTI Adult & Pediatric ICU Pathogens for 2015 and 2016
Calendar Year 2016 January 1, 2016 – December 31, 2016
n=290
Escherichia coli 35%
Pseudomonas aeruginosa
13% Klebsiella
pneumoniae 12%
Coagulase-negative
Staphylococcus 2%
Enterococcus sp. 8%
Gram-positive bacteria (other)
10%
Gram-negative bacteria (other)
14%
Multiple Organisms
6%
Calendar Year 2015 January 1, 2015 – December 31, 2015
n=391
Escherichia coli 36%
Pseudomonas aeruginosa
11% Klebsiella
pneumoniae 6%
Coagulase-negative
Staphylococcus 6%
Enterococcus sp. 11%
Gram-positive bacteria (other)
9%
Gram-negative bacteria (other)
14%
Multiple Organisms
7%
15
0.0
0.5
1.0
1.5
2.0
2015 2016
SIR
Calendar Year
Adult Pediatric
State CAUTI SIR
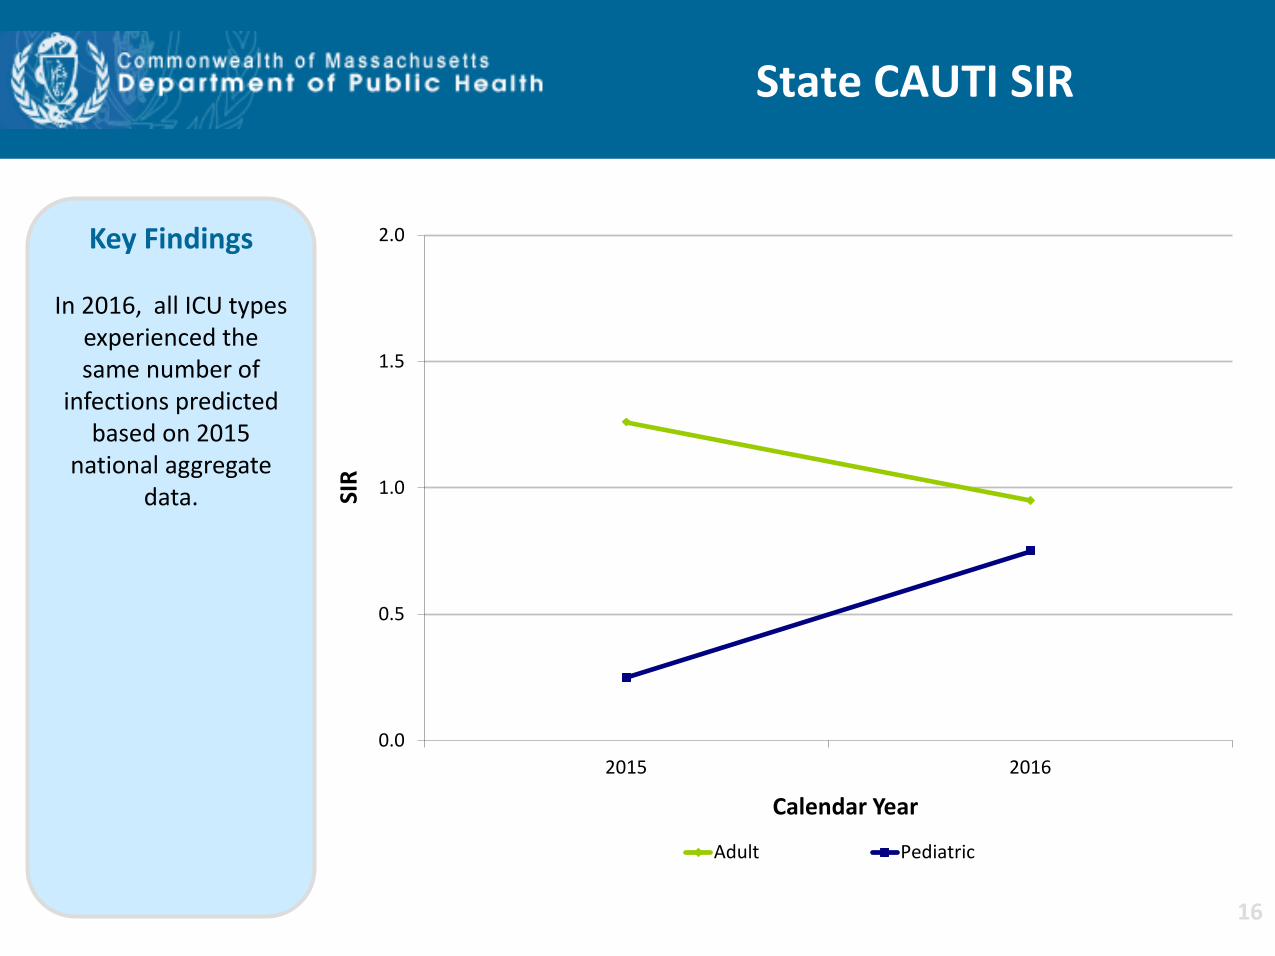
Key Findings
In 2016, all ICU types experienced the same number of
infections predicted based on 2015
national aggregate data.
16
0.0
0.1
0.2
0.3
0.4
0.5
0.6
0.7
2015 2016
Uti
lizat
ion
Rat
io
Calendar Year
Adult Pediatric
State Urinary Catheter Utilization Ratios
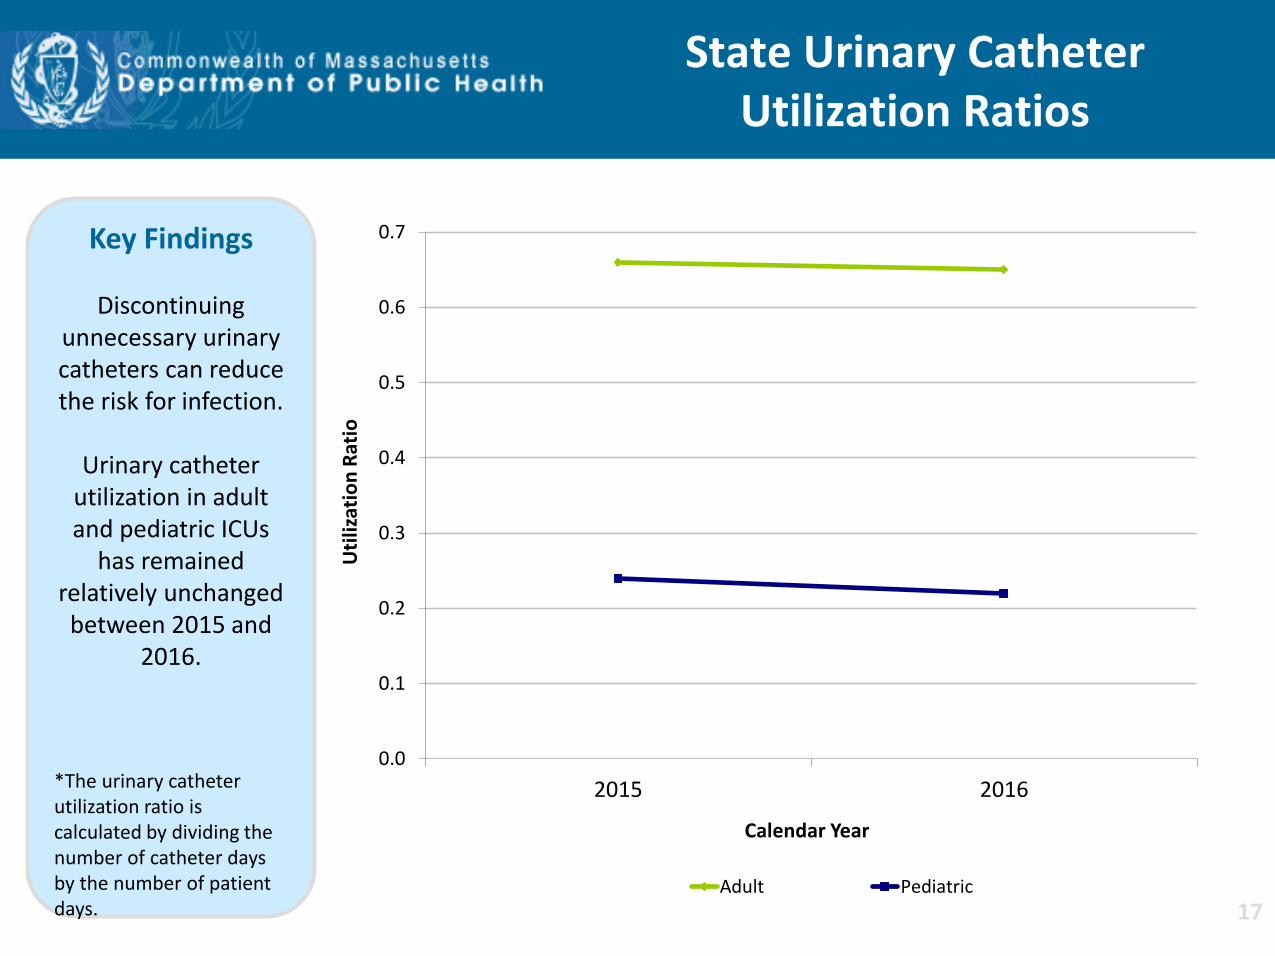
Key Findings
Discontinuing unnecessary urinary catheters can reduce the risk for infection.
Urinary catheter
utilization in adult and pediatric ICUs
has remained relatively unchanged between 2015 and
2016.
*The urinary catheter utilization ratio is calculated by dividing the number of catheter days by the number of patient days. 17

Key Findings
For the past two years, MA acute care hospitals performing
coronary artery bypass graft
procedures (CABG) and colon procedures (COLO) experienced the same number of
infections as predicted, based on
2015 national aggregate data.
There were 23 CABG SSIs reported in 2016.
There were 158 COLO SSIs
reported in 2016.
Surgical Site Infections (SSI) Coronary Artery Bypass Graft (CABG) SIR
and Colon Procedure (COLO) SIR
0.0
0.5
1.0
1.5
2.0
2015 2016
SIR
CABG
SIR Upper and Lower Limit
0.0
0.5
1.0
1.5
2.0
2015 2016
SIR
COLO
18
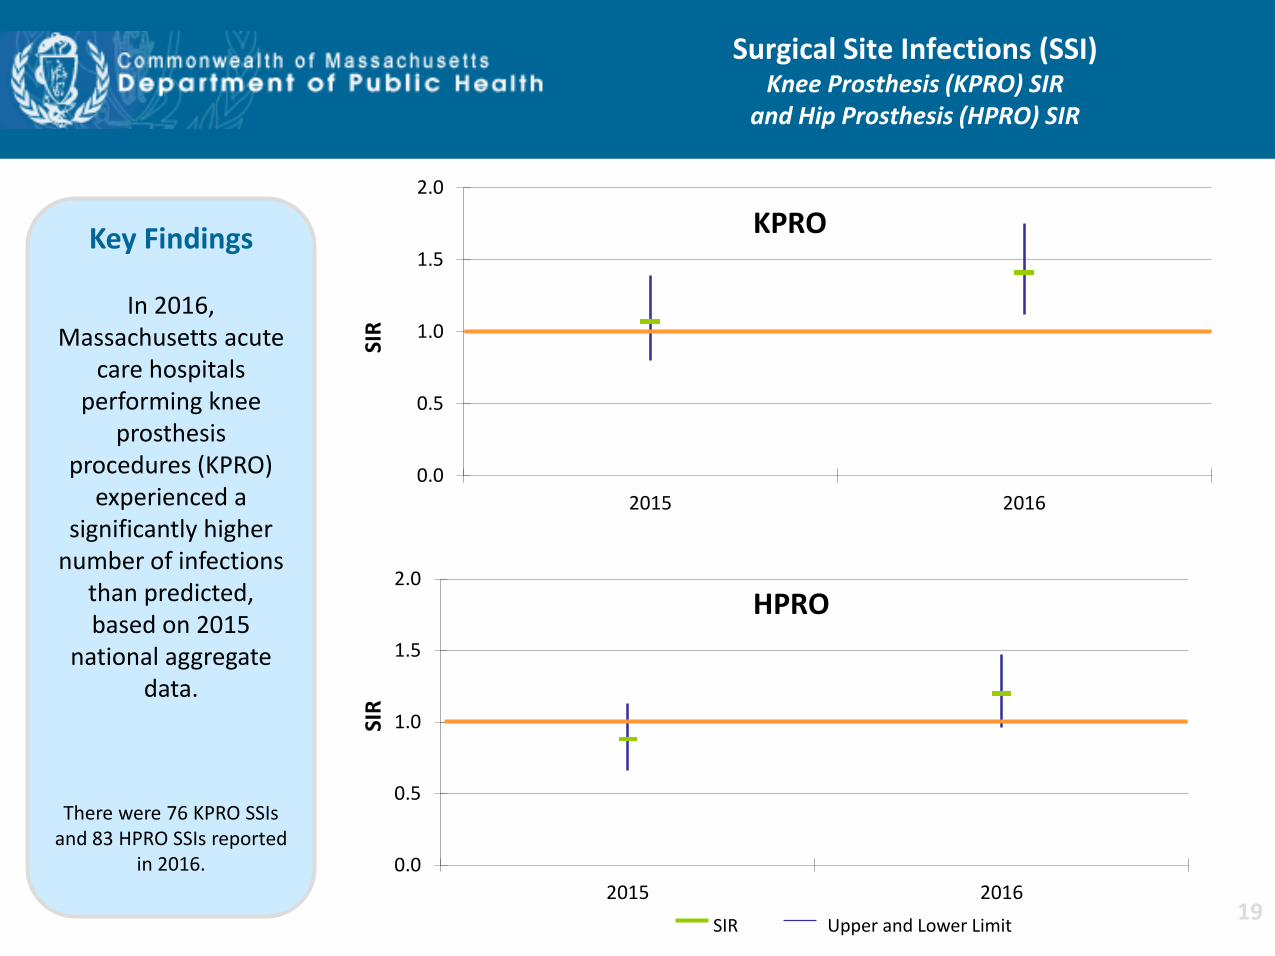
Key Findings
In 2016, Massachusetts acute
care hospitals performing knee
prosthesis procedures (KPRO)
experienced a significantly higher
number of infections than predicted, based on 2015
national aggregate data.
There were 76 KPRO SSIs and 83 HPRO SSIs reported
in 2016.
Surgical Site Infections (SSI) Knee Prosthesis (KPRO) SIR
and Hip Prosthesis (HPRO) SIR
0.0
0.5
1.0
1.5
2.0
2015 2016
SIR
KPRO
SIR Upper and Lower Limit
0.0
0.5
1.0
1.5
2.0
2015 2016
SIR
HPRO
19
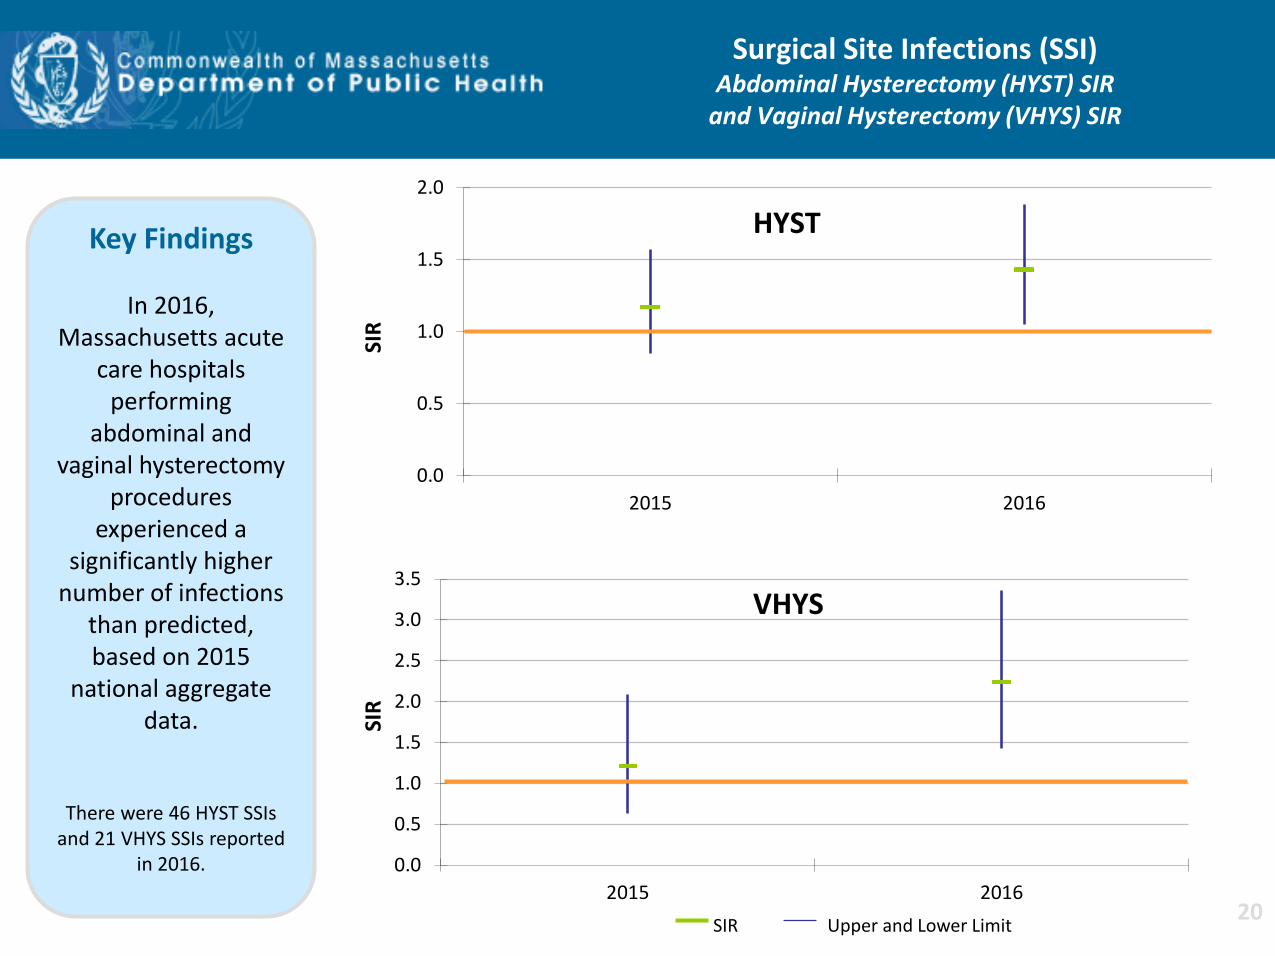
Key Findings
In 2016, Massachusetts acute
care hospitals performing
abdominal and vaginal hysterectomy
procedures experienced a
significantly higher number of infections
than predicted, based on 2015
national aggregate data.
There were 46 HYST SSIs and 21 VHYS SSIs reported
in 2016.
Surgical Site Infections (SSI) Abdominal Hysterectomy (HYST) SIR
and Vaginal Hysterectomy (VHYS) SIR
0.0
0.5
1.0
1.5
2.0
2015 2016
SIR
HYST
SIR Upper and Lower Limit
0.0
0.5
1.0
1.5
2.0
2.5
3.0
3.5
2015 2016
SIR
VHYS
20
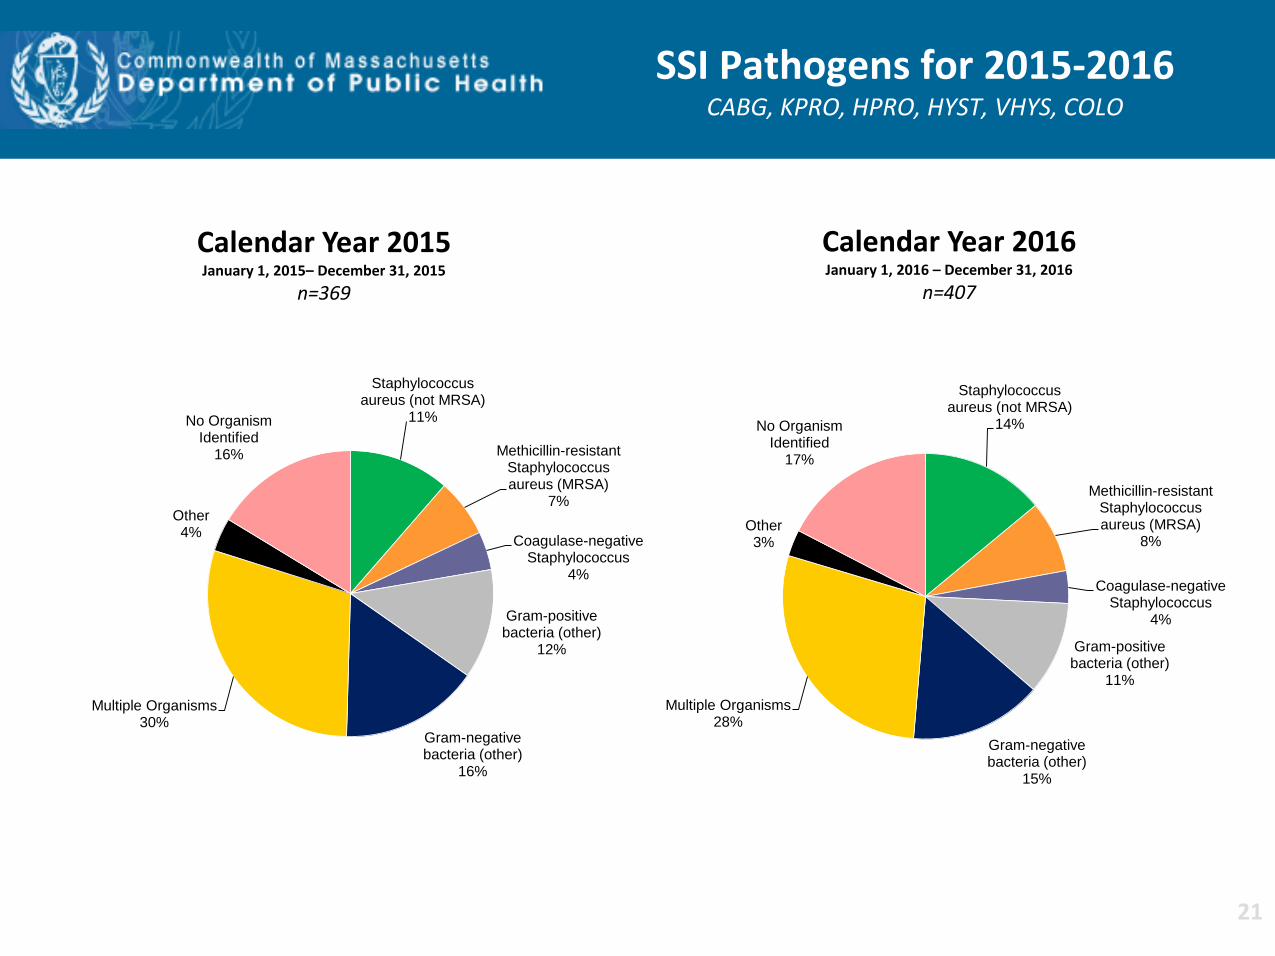
Staphylococcus aureus (not MRSA)
11%
Methicillin-resistant Staphylococcus aureus (MRSA)
7%
Coagulase-negative Staphylococcus
4%
Gram-positive bacteria (other)
12%
Gram-negative bacteria (other)
16%
Multiple Organisms 30%
Other 4%
No Organism Identified
16%
SSI Pathogens for 2015-2016 CABG, KPRO, HPRO, HYST, VHYS, COLO
Calendar Year 2015 January 1, 2015– December 31, 2015
n=369
Calendar Year 2016 January 1, 2016 – December 31, 2016
n=407
Staphylococcus aureus (not MRSA)
14%
Methicillin-resistant Staphylococcus aureus (MRSA)
8%
Coagulase-negative Staphylococcus
4%
Gram-positive bacteria (other)
11%
Gram-negative bacteria (other)
15%
Multiple Organisms 28%
Other 3%
No Organism Identified
17%
21
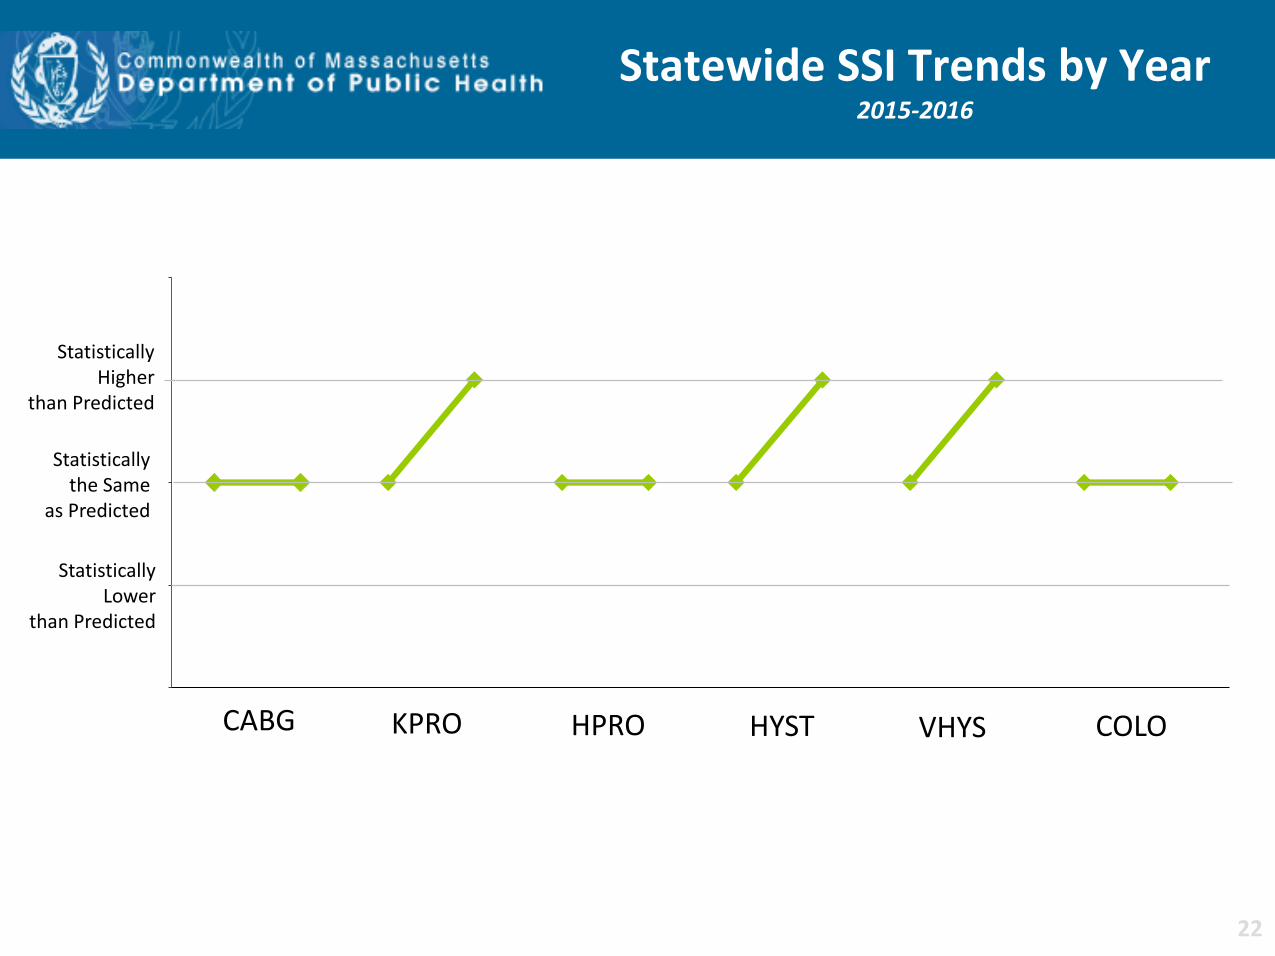
Statewide SSI Trends by Year 2015-2016
Statistically Higher
than Predicted
Statistically the Same
as Predicted
Statistically Lower
than Predicted
CABG KPRO HPRO HYST VHYS COLO
22
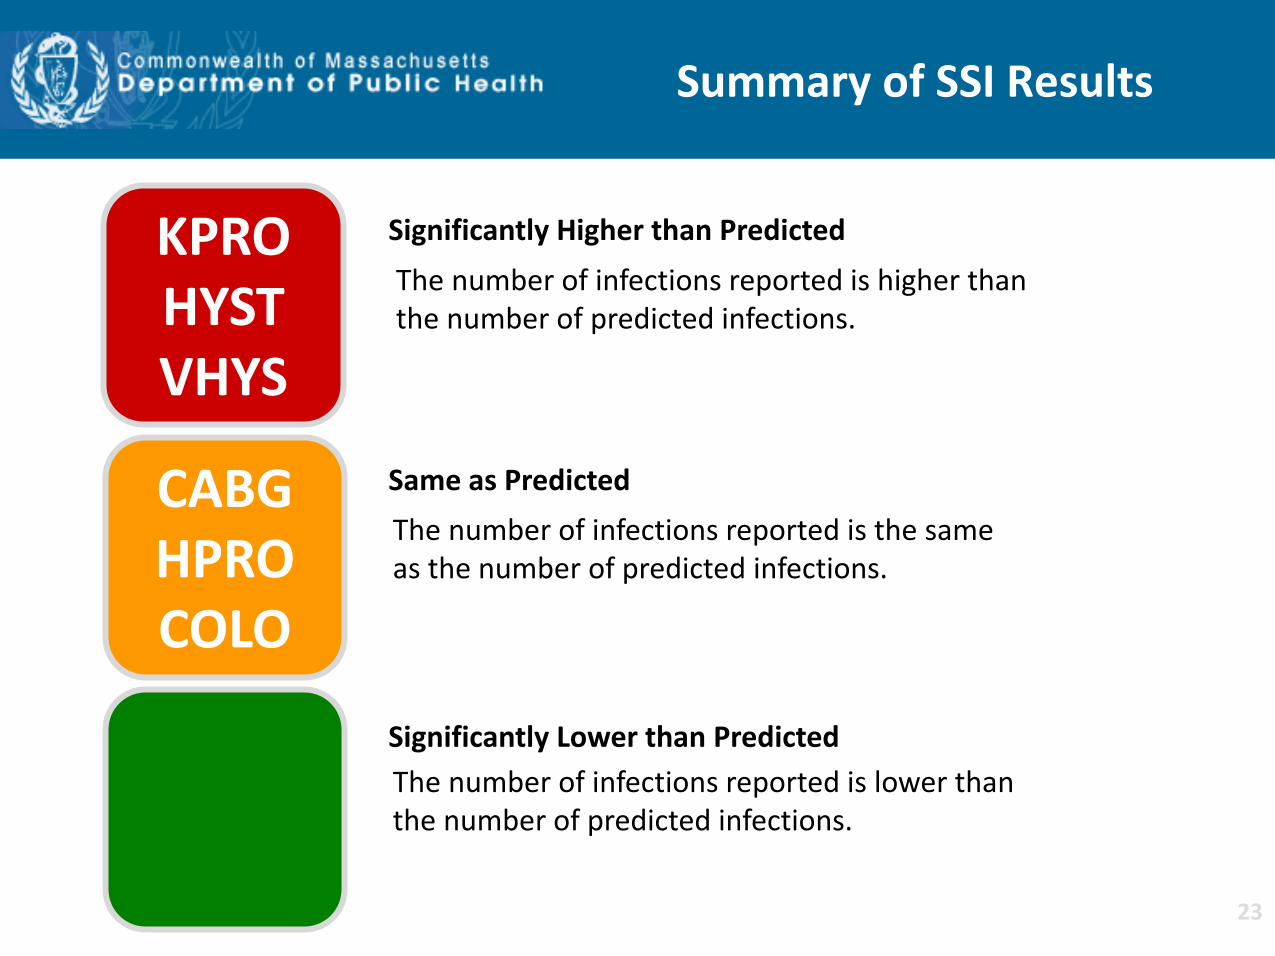
Summary of SSI Results
KPRO HYST VHYS
CABG HPRO COLO
Same as Predicted
Significantly Lower than Predicted
Significantly Higher than Predicted
The number of infections reported is lower than the number of predicted infections.
The number of infections reported is higher than the number of predicted infections.
The number of infections reported is the same as the number of predicted infections.
23
DPH Response to SSI
• DPH has conducted outreach to individual hospitals to determine action taken to address higher than expected SIRs.
• Selected examples of hospital actions: conducting root-cause analyses for each infection to identify the cause; re-education to ensure adherence to evidence based practices; observation of OR practices; limiting OR traffic; preoperative chlorhexidine baths and implementation of mandatory “joint class boot camp” for patients having elective surgery.
• DPH has consulted with hospitals in the investigation of higher than expected rates of KPRO SSIs.
24
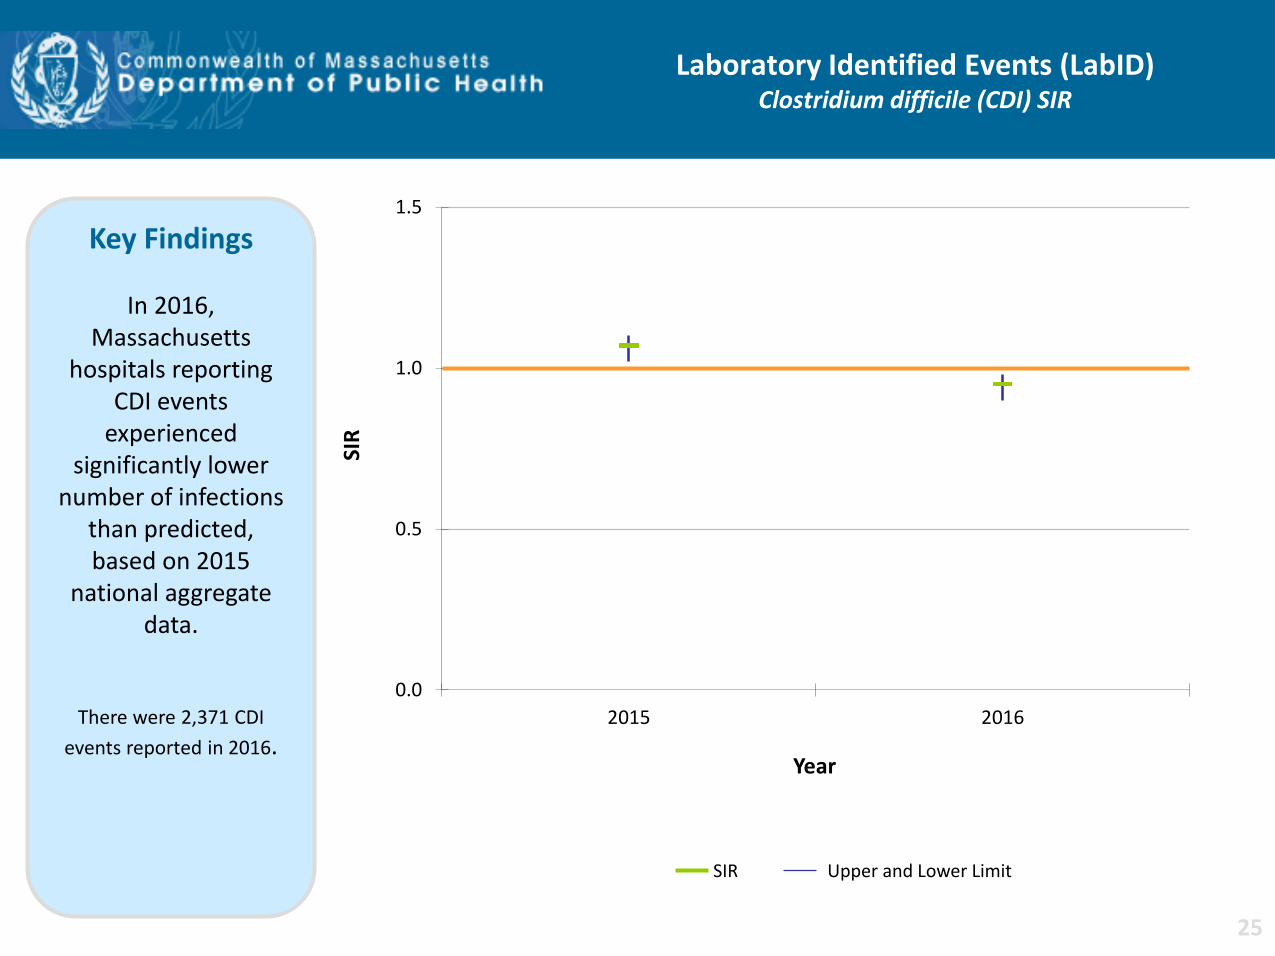
Laboratory Identified Events (LabID) Clostridium difficile (CDI) SIR
0.0
0.5
1.0
1.5
2015 2016
SIR
Year
Key Findings
In 2016, Massachusetts
hospitals reporting CDI events
experienced significantly lower
number of infections than predicted, based on 2015
national aggregate data.
There were 2,371 CDI
events reported in 2016.
SIR Upper and Lower Limit
25
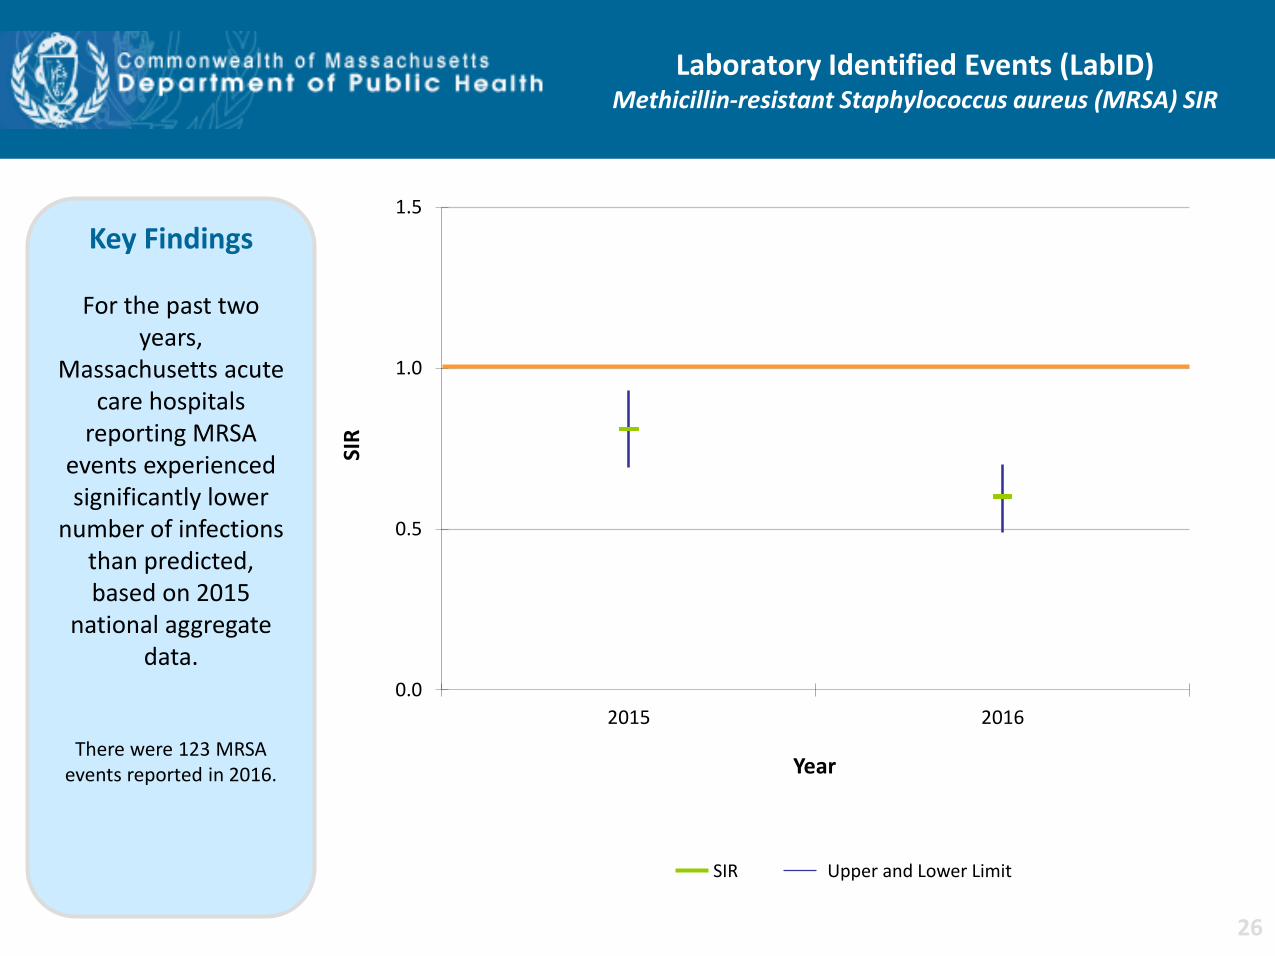
Laboratory Identified Events (LabID) Methicillin-resistant Staphylococcus aureus (MRSA) SIR
0.0
0.5
1.0
1.5
2015 2016
SIR
Year
Key Findings
For the past two years,
Massachusetts acute care hospitals
reporting MRSA events experienced significantly lower
number of infections than predicted, based on 2015
national aggregate data.
There were 123 MRSA events reported in 2016.
SIR Upper and Lower Limit
26
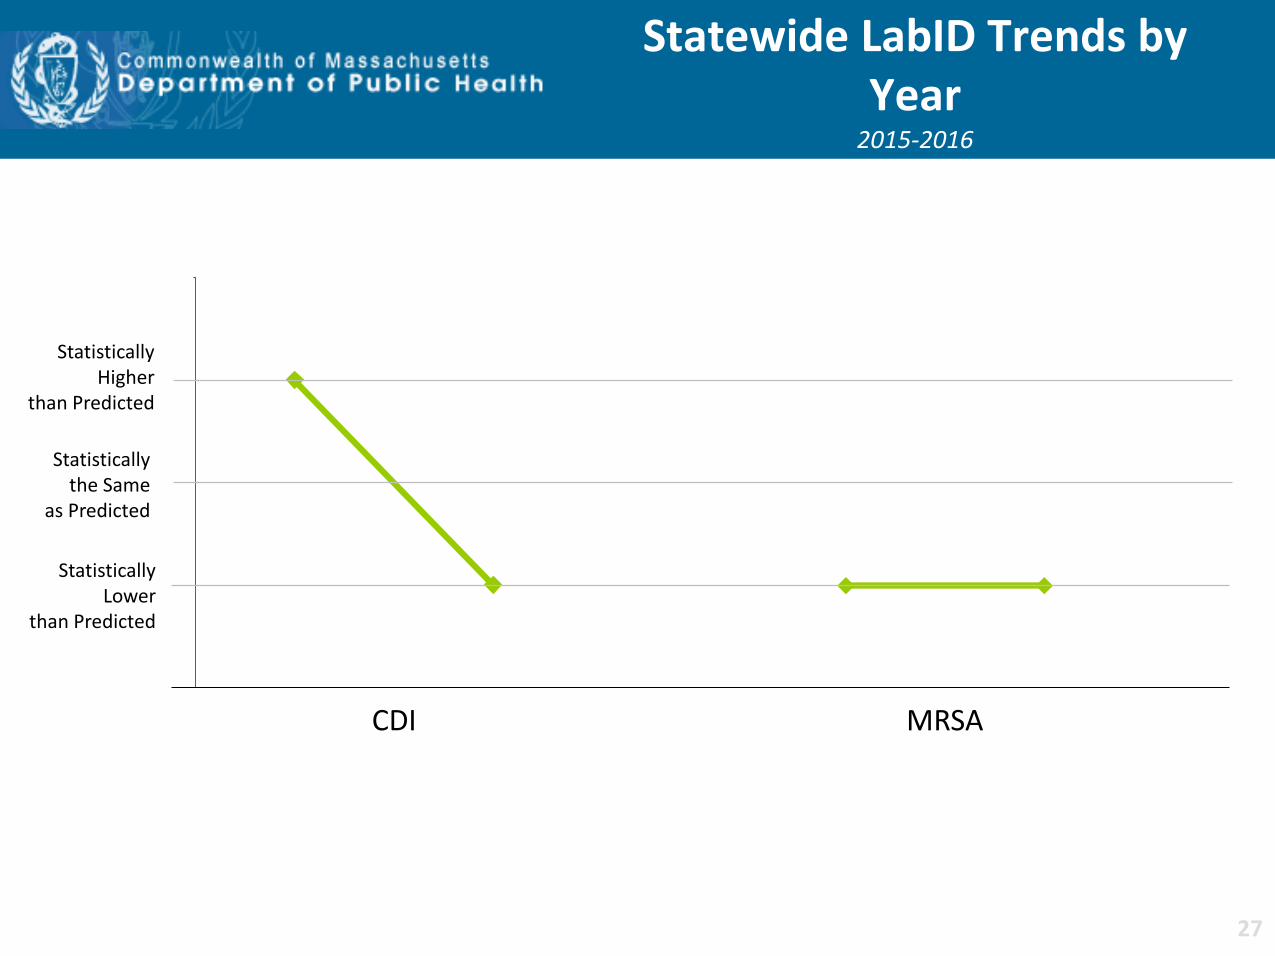
Statewide LabID Trends by Year
2015-2016
Statistically Higher
than Predicted
Statistically the Same
as Predicted
Statistically Lower
than Predicted
CDI MRSA
27
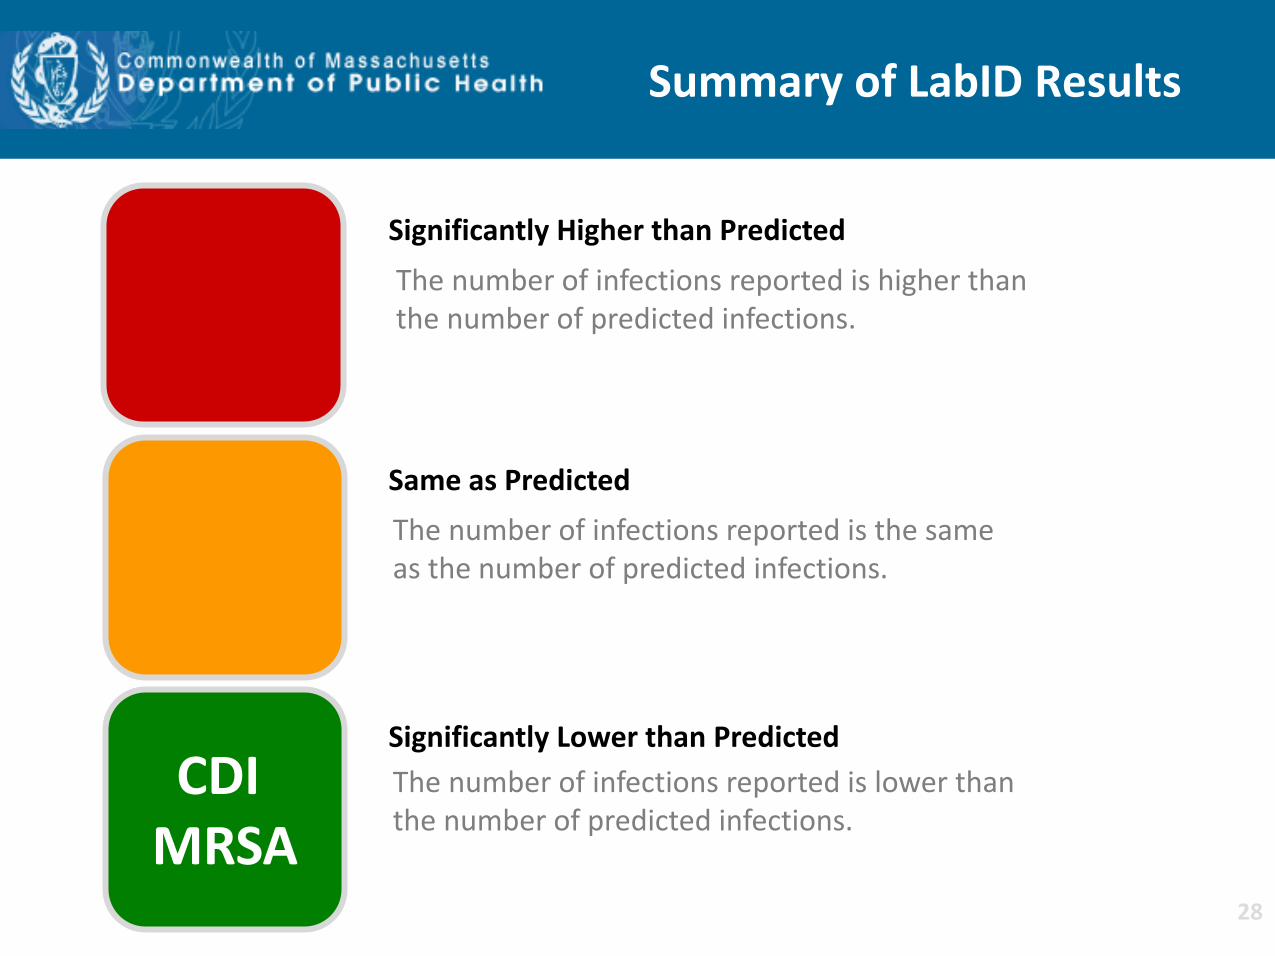
Summary of LabID Results
CDI MRSA
Same as Predicted
Significantly Lower than Predicted
Significantly Higher than Predicted
The number of infections reported is lower than the number of predicted infections.
The number of infections reported is higher than the number of predicted infections.
The number of infections reported is the same as the number of predicted infections.
28
HAI Prevention Activities
• External data validation of catheter-associated urinary tract infections conducted at 20 hospitals
• Hemodialysis infection prevention simulation training initiative for hemodialysis nurses was expanded to include dialysis technicians
• Clostridium difficile initiative in the long-term care setting
• Antimicrobial stewardship across the continuum of care
• On-site Infection Control Assessment and Response (ICAR) visits in nursing homes
29
• Hospitals with higher than expected SIRs have been contacted to ensure the need for improvement has been addressed.
• DPH will continue to monitor progress by providing quarterly Data Cleaning Reports and Targeted Assessment for Prevention (TAP) Reports for all hospitals to identify areas where focused infection prevention efforts are needed.
• DPH will continue to conduct on-site data validation of specific NHSN
measures to ensure completeness and accuracy of reported data. • DPH plans to provide educational webinars for hospitals in order that they
may effectively use the data obtained from the surveillance system to improve patient and healthcare personnel safety.
• DPH will continue to collaborate with state and national organizations to provide educational programs that address multi-drug resistant organisms and antibiotic resistance.
• This update will be available on the MDPH website:
www.mass.gov/dph/dhcq
Next Steps
30
Related Documents