Paper presented at ‘Deutscher Luft- und Raumfahrt-Kongress 2003’, München, 17-20.November 2003 1 HAZARD CRITERIA FOR WAKE VORTEX ENCOUNTERS DURING APPROACH R. Luckner, G.Höhne, M. Fuhrmann Airbus Deutschland GmbH Kreetslag 10, 21129 Hamburg SUMMARY Airbus has prepared a methodology to assess the severity of a Wake Vortex Encounter, WVE. This methodology is called Vortex Encounter Severity Assessment (VESA). VESA makes it possible to compare the effect of wake vortices generated by various aircraft on an aircraft that encounters such a vortex. Important elements of VESA are the hazard criteria that rate particular aircraft reactions during WVEs. They are used to compare WVEs in batch simulations. This paper describes how piloted flight simulations for WVE investiga- tions during landing approach were prepared and how the hazard criteria were developed. This work was part of the European S-WAKE program. NOMENCLATURE a/c Aircraft AIM Aerodynamic Interaction Model b Wing span b v Vortex span CRIT Criterion EC European Commission EF Encounter Fix FAR False Alarm Rate GA Go around GS Glide slope H Height above ground H EF Encounter Height HTR Hit Rate ICAO International Civil Aviation Organisation ILS Instrumented Landing System IMC Instrument meteorological conditions KSS Kuiper's Skill Score LSM Lifting Surface Method MTOW Maximum Take-off Weight NLR National Aerospace Laboratory OHR Overall Hazard Rating r c Vortex core radius RG Combined RCR and ∆GS Criterion SM Strip Method POP GA Probability of prediction (go around) POP NOGA Probability of prediction (non go around) RCR Roll Control Ratio VMC Visual meteorological conditions WV Wake Vortex WVE Wake Vortex Encounter WVM Wake Vortex Model VESA Vortex Encounter Severity Assessment TUB Technical University of Berlin Γ, Γ 0 Vortex strength, initial vortex strength ∆GS Glide Slope Deviation ∆γ WV Vertical encounter angle ∆Ψ WV Horizontal encounter angle Φ Bank angle 1. INTRODUCTION 1.1. Background and objectives Every aircraft generates a pair of counter rotating vortices trailing from the wing tips. These vortices can adversely influence other aircraft that encounter them in flight. Espe- cially in areas with dense air traffic and where aircraft of different weight classes operate, e.g. major airports or densely flown routes, a potential safety hazard due to wake vortices exists. In order to avoid severe Wake Vortex Encounters (WVEs), the separation distances for take-off, cruise, approach, and landing have to ensure that an encounter is unlikely or sufficiently weak. Current air traffic regulations relate the hazard potential due to wake vortices only to the maximum take-off weight (MTOW) of the preceding (wake generat- ing) aircraft against the weight of the following aircraft. This is reflected in the ICAO separation distances, which were defined to maintain an acceptable safety standard, FIG.1. B747 0 Leading aircraft heavy > 136 t medium 7 - 136 t (small)/ light < 7 t heavy medium small Separation, miles 3 4 5 6 DHC-8 DHC-8 DHC-8 A320 A320 A320 B747 followed by No vortex-related separation for heavy aircraft aircraft to scale A320 DHC-8 FIG.1: ICAO separation distances The existing separation rules do not take into account details of wake formations or the influence of meteorologi- cal conditions on wake vortex transport and decay. Also not considered are detailed flight mechanical characteris- tics including the actual weight of the wake-generating aircraft or the control capabilities of that which follows. Since so many factors are neglected, the existing separa- tion rules are rather conservative for certain conditions and therefore they restrict future air traffic growth. The development of large transport airplanes such as the Airbus A380 requires that air traffic services providers and national aviation safety regulators assure the adequacy of current operational standards. The Airbus Wake Vortex Program addresses both: the verification of current standards regarding A380 and the

Welcome message from author
This document is posted to help you gain knowledge. Please leave a comment to let me know what you think about it! Share it to your friends and learn new things together.
Transcript
Paper presented at ‘Deutscher Luft- und Raumfahrt-Kongress 2003’, München, 17-20.November 2003
1
HAZARD CRITERIA FOR WAKE VORTEX ENCOUNTERS DURING APPROACH
R. Luckner, G.Höhne, M. Fuhrmann Airbus Deutschland GmbH
Kreetslag 10, 21129 Hamburg
SUMMARY
Airbus has prepared a methodology to assess the severity of a Wake Vortex Encounter, WVE. This methodology is called Vortex Encounter Severity Assessment (VESA). VESA makes it possible to compare the effect of wake vortices generated by various aircraft on an aircraft that encounters such a vortex.
Important elements of VESA are the hazard criteria that rate particular aircraft reactions during WVEs. They are used to compare WVEs in batch simulations. This paper describes how piloted flight simulations for WVE investiga-tions during landing approach were prepared and how the hazard criteria were developed. This work was part of the European S-WAKE program.
NOMENCLATURE a/c Aircraft AIM Aerodynamic Interaction Model b Wing span bv Vortex span CRIT Criterion EC European Commission EF Encounter Fix FAR False Alarm Rate GA Go around GS Glide slope H Height above ground HEF Encounter Height HTR Hit Rate ICAO International Civil Aviation Organisation ILS Instrumented Landing System IMC Instrument meteorological conditions KSS Kuiper's Skill Score LSM Lifting Surface Method MTOW Maximum Take-off Weight NLR National Aerospace Laboratory OHR Overall Hazard Rating rc Vortex core radius RG Combined RCR and ∆GS Criterion SM Strip Method POPGA Probability of prediction (go around) POPNOGA Probability of prediction (non go around) RCR Roll Control Ratio VMC Visual meteorological conditions WV Wake Vortex WVE Wake Vortex Encounter WVM Wake Vortex Model VESA Vortex Encounter Severity Assessment TUB Technical University of Berlin Γ, Γ0 Vortex strength, initial vortex strength ∆GS Glide Slope Deviation ∆γWV Vertical encounter angle ∆ΨWV Horizontal encounter angle Φ Bank angle
1. INTRODUCTION
1.1. Background and objectives
Every aircraft generates a pair of counter rotating vortices trailing from the wing tips. These vortices can adversely influence other aircraft that encounter them in flight. Espe-cially in areas with dense air traffic and where aircraft of different weight classes operate, e.g. major airports or densely flown routes, a potential safety hazard due to wake vortices exists.
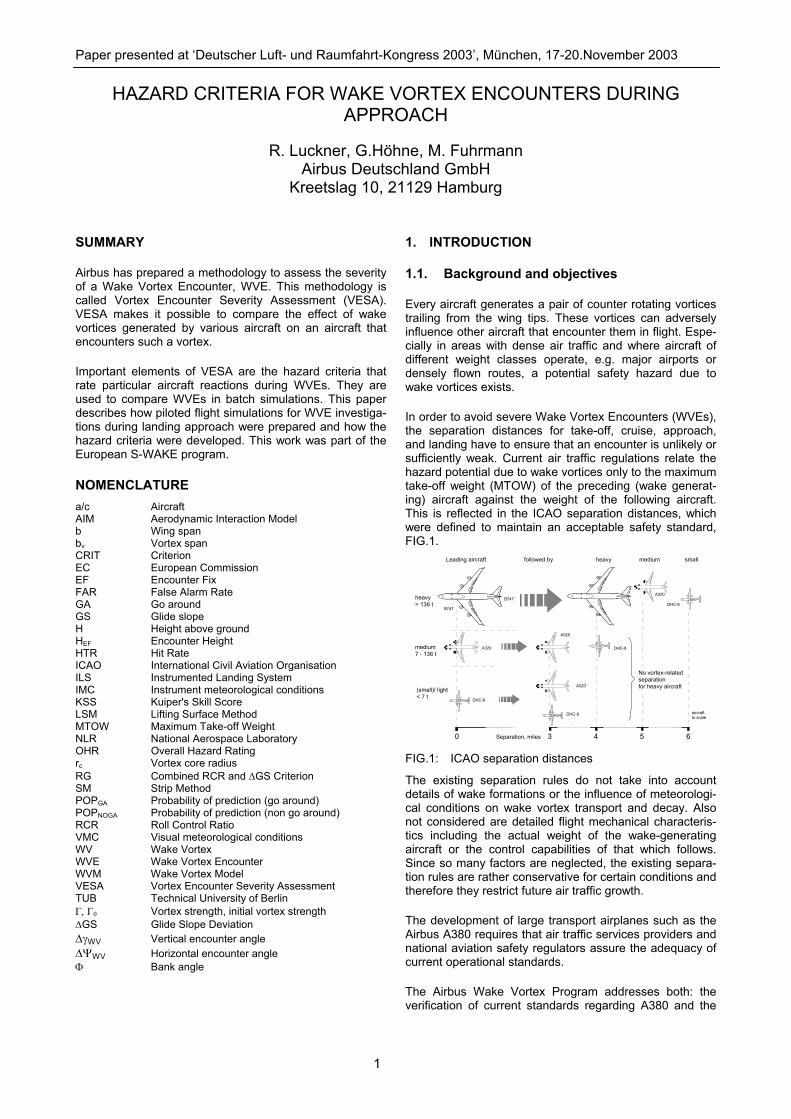
In order to avoid severe Wake Vortex Encounters (WVEs), the separation distances for take-off, cruise, approach, and landing have to ensure that an encounter is unlikely or sufficiently weak. Current air traffic regulations relate the hazard potential due to wake vortices only to the maximum take-off weight (MTOW) of the preceding (wake generat-ing) aircraft against the weight of the following aircraft. This is reflected in the ICAO separation distances, which were defined to maintain an acceptable safety standard, FIG.1.
B747
0
Leading aircraft
heavy> 136 t
medium7 - 136 t
(small)/ light< 7 t
heavy medium small
Separation, miles 3 4 5 6
DHC-8
DHC-8
DHC-8
A320
A320
A320
B747
followed by
No vortex-related separationfor heavy aircraft
aircraftto scale
A320
DHC-8
FIG.1: ICAO separation distances
The existing separation rules do not take into account details of wake formations or the influence of meteorologi-cal conditions on wake vortex transport and decay. Also not considered are detailed flight mechanical characteris-tics including the actual weight of the wake-generating aircraft or the control capabilities of that which follows. Since so many factors are neglected, the existing separa-tion rules are rather conservative for certain conditions and therefore they restrict future air traffic growth.
The development of large transport airplanes such as the Airbus A380 requires that air traffic services providers and national aviation safety regulators assure the adequacy of current operational standards.
The Airbus Wake Vortex Program addresses both: the verification of current standards regarding A380 and the
2
long-term task to refine existing separation rules. An es-sential part of the Airbus program is the development of a methodology to assess the encounter severity, called VESA (see below).
1.2. State of the art
Vernon Rossow gives an excellent overview on wake vortex research for transport aircraft during the last century in [2].
Flight-testing for research of wake vortex encounters started in the 1950s. Tests, using the B52, C-5A, CV-990, DC9 and U-3A as wake-generating aircraft and the F-104, U-3A, Lear-Jet-23, Cessna-210 as trailing aircraft, were conducted in the 50s and 60s [3]. Encounters were made possible by injecting smoke, vaporized oil or powder from the wake-generating aircraft into the vortices, so that they were visible for the pilot of the following aircraft. These tests were used to determine the hazard posed by a wake vortex on an encountering aircraft in order to define safe separation distances. This work was to finally result in the definition of safe separation distances. The Boeing Com-pany initiated a study of large jet airplane wake vortices in mid-1969 [4]. The objective was to obtain a direct com-parison between the vortices of a B747 and 707-320C. A fully instrumented B737-100 was used as the primary wake probing aircraft. Additional tests were conducted with a Boeing owned F-86 and NASA’s CV-990.
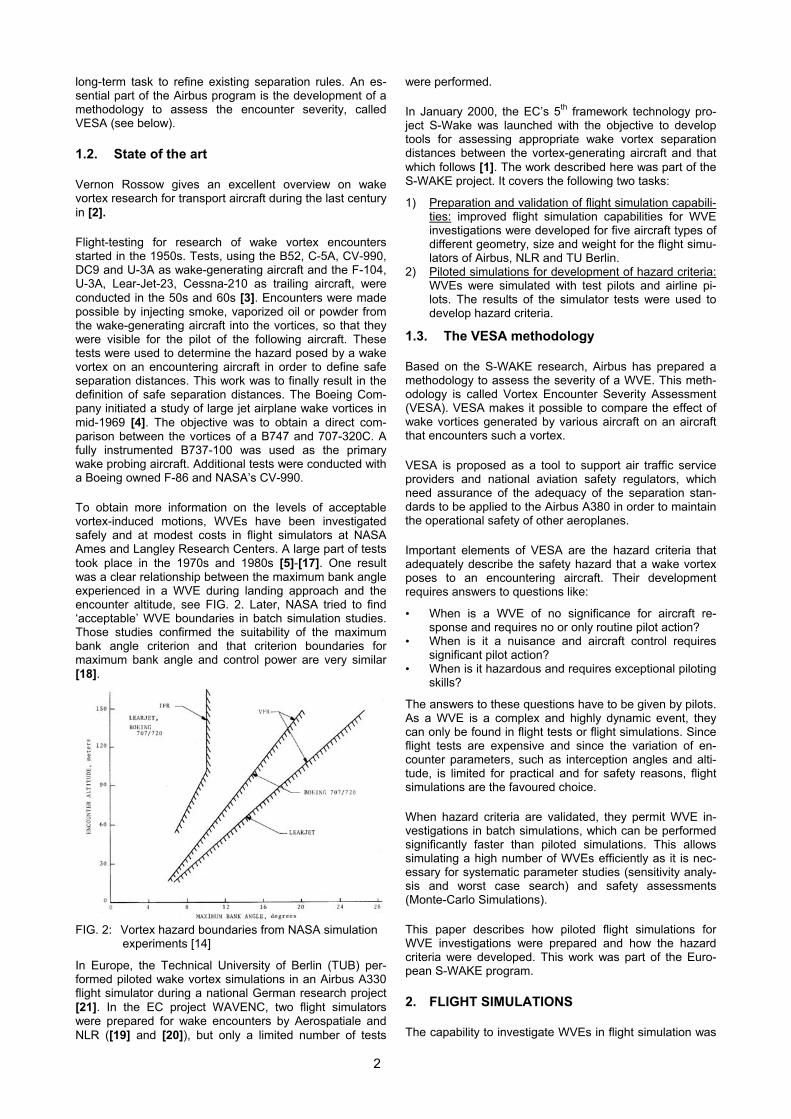
To obtain more information on the levels of acceptable vortex-induced motions, WVEs have been investigated safely and at modest costs in flight simulators at NASA Ames and Langley Research Centers. A large part of tests took place in the 1970s and 1980s [5]-[17]. One result was a clear relationship between the maximum bank angle experienced in a WVE during landing approach and the encounter altitude, see FIG. 2. Later, NASA tried to find ‘acceptable’ WVE boundaries in batch simulation studies. Those studies confirmed the suitability of the maximum bank angle criterion and that criterion boundaries for maximum bank angle and control power are very similar [18].
FIG. 2: Vortex hazard boundaries from NASA simulation
experiments [14]
In Europe, the Technical University of Berlin (TUB) per-formed piloted wake vortex simulations in an Airbus A330 flight simulator during a national German research project [21]. In the EC project WAVENC, two flight simulators were prepared for wake encounters by Aerospatiale and NLR ([19] and [20]), but only a limited number of tests
were performed.
In January 2000, the EC’s 5th framework technology pro-ject S-Wake was launched with the objective to develop tools for assessing appropriate wake vortex separation distances between the vortex-generating aircraft and that which follows [1]. The work described here was part of the S-WAKE project. It covers the following two tasks:
1) Preparation and validation of flight simulation capabili-ties: improved flight simulation capabilities for WVE investigations were developed for five aircraft types of different geometry, size and weight for the flight simu-lators of Airbus, NLR and TU Berlin.
2) Piloted simulations for development of hazard criteria: WVEs were simulated with test pilots and airline pi-lots. The results of the simulator tests were used to develop hazard criteria.
1.3. The VESA methodology
Based on the S-WAKE research, Airbus has prepared a methodology to assess the severity of a WVE. This meth-odology is called Vortex Encounter Severity Assessment (VESA). VESA makes it possible to compare the effect of wake vortices generated by various aircraft on an aircraft that encounters such a vortex.
VESA is proposed as a tool to support air traffic service providers and national aviation safety regulators, which need assurance of the adequacy of the separation stan-dards to be applied to the Airbus A380 in order to maintain the operational safety of other aeroplanes.
Important elements of VESA are the hazard criteria that adequately describe the safety hazard that a wake vortex poses to an encountering aircraft. Their development requires answers to questions like:
• When is a WVE of no significance for aircraft re-sponse and requires no or only routine pilot action?
• When is it a nuisance and aircraft control requires significant pilot action?
• When is it hazardous and requires exceptional piloting skills?
The answers to these questions have to be given by pilots. As a WVE is a complex and highly dynamic event, they can only be found in flight tests or flight simulations. Since flight tests are expensive and since the variation of en-counter parameters, such as interception angles and alti-tude, is limited for practical and for safety reasons, flight simulations are the favoured choice.
When hazard criteria are validated, they permit WVE in-vestigations in batch simulations, which can be performed significantly faster than piloted simulations. This allows simulating a high number of WVEs efficiently as it is nec-essary for systematic parameter studies (sensitivity analy-sis and worst case search) and safety assessments (Monte-Carlo Simulations).
This paper describes how piloted flight simulations for WVE investigations were prepared and how the hazard criteria were developed. This work was part of the Euro-pean S-WAKE program.
2. FLIGHT SIMULATIONS
The capability to investigate WVEs in flight simulation was
3
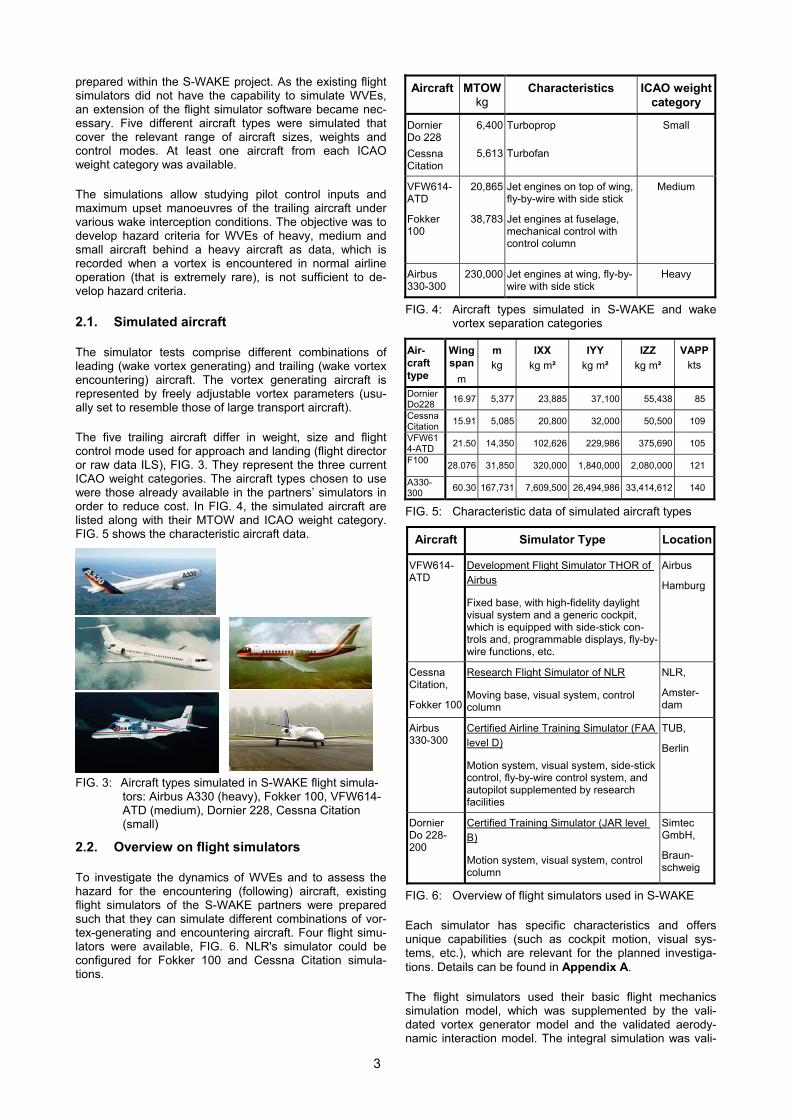
prepared within the S-WAKE project. As the existing flight simulators did not have the capability to simulate WVEs, an extension of the flight simulator software became nec-essary. Five different aircraft types were simulated that cover the relevant range of aircraft sizes, weights and control modes. At least one aircraft from each ICAO weight category was available.
The simulations allow studying pilot control inputs and maximum upset manoeuvres of the trailing aircraft under various wake interception conditions. The objective was to develop hazard criteria for WVEs of heavy, medium and small aircraft behind a heavy aircraft as data, which is recorded when a vortex is encountered in normal airline operation (that is extremely rare), is not sufficient to de-velop hazard criteria.
2.1. Simulated aircraft
The simulator tests comprise different combinations of leading (wake vortex generating) and trailing (wake vortex encountering) aircraft. The vortex generating aircraft is represented by freely adjustable vortex parameters (usu-ally set to resemble those of large transport aircraft).
The five trailing aircraft differ in weight, size and flight control mode used for approach and landing (flight director or raw data ILS), FIG. 3. They represent the three current ICAO weight categories. The aircraft types chosen to use were those already available in the partners’ simulators in order to reduce cost. In FIG. 4, the simulated aircraft are listed along with their MTOW and ICAO weight category. FIG. 5 shows the characteristic aircraft data.
FIG. 3: Aircraft types simulated in S-WAKE flight simula-
tors: Airbus A330 (heavy), Fokker 100, VFW614-ATD (medium), Dornier 228, Cessna Citation (small)
2.2. Overview on flight simulators
To investigate the dynamics of WVEs and to assess the hazard for the encountering (following) aircraft, existing flight simulators of the S-WAKE partners were prepared such that they can simulate different combinations of vor-tex-generating and encountering aircraft. Four flight simu-lators were available, FIG. 6. NLR's simulator could be configured for Fokker 100 and Cessna Citation simula-tions.
Aircraft MTOW kg
Characteristics ICAO weight category
Dornier Do 228 Cessna Citation
6,400
5,613
Turboprop
Turbofan
Small
VFW614-ATD
Fokker 100
20,865
38,783
Jet engines on top of wing, fly-by-wire with side stick
Jet engines at fuselage, mechanical control with control column
Medium
Airbus 330-300
230,000 Jet engines at wing, fly-by-wire with side stick
Heavy
FIG. 4: Aircraft types simulated in S-WAKE and wake vortex separation categories
Air-craft type
Wing span
m
m kg
IXX kg m²
IYY kg m²
IZZ kg m²
VAPPkts
Dornier Do228 16.97 5,377 23,885 37,100 55,438 85
Cessna Citation 15.91 5,085 20,800 32,000 50,500 109
VFW614-ATD 21.50 14,350 102,626 229,986 375,690 105
F100 28.076 31,850 320,000 1,840,000 2,080,000 121
A330-300 60.30 167,731 7,609,500 26,494,986 33,414,612 140
FIG. 5: Characteristic data of simulated aircraft types
Aircraft Simulator Type Location
VFW614-ATD
Development Flight Simulator THOR of Airbus
Fixed base, with high-fidelity daylight visual system and a generic cockpit, which is equipped with side-stick con-trols and, programmable displays, fly-by-wire functions, etc.
Airbus
Hamburg
Cessna Citation,
Fokker 100
Research Flight Simulator of NLR
Moving base, visual system, control column
NLR,
Amster-dam
Airbus 330-300
Certified Airline Training Simulator (FAA level D)
Motion system, visual system, side-stick control, fly-by-wire control system, and autopilot supplemented by research facilities
TUB,
Berlin
Dornier Do 228-200
Certified Training Simulator (JAR level B)
Motion system, visual system, control column
Simtec GmbH,
Braun-schweig
FIG. 6: Overview of flight simulators used in S-WAKE
Each simulator has specific characteristics and offers unique capabilities (such as cockpit motion, visual sys-tems, etc.), which are relevant for the planned investiga-tions. Details can be found in Appendix A.
The flight simulators used their basic flight mechanics simulation model, which was supplemented by the vali-dated vortex generator model and the validated aerody-namic interaction model. The integral simulation was vali-
4
dated by engineering judgement (analysing specific test cases) and by qualitative pilot assessment.
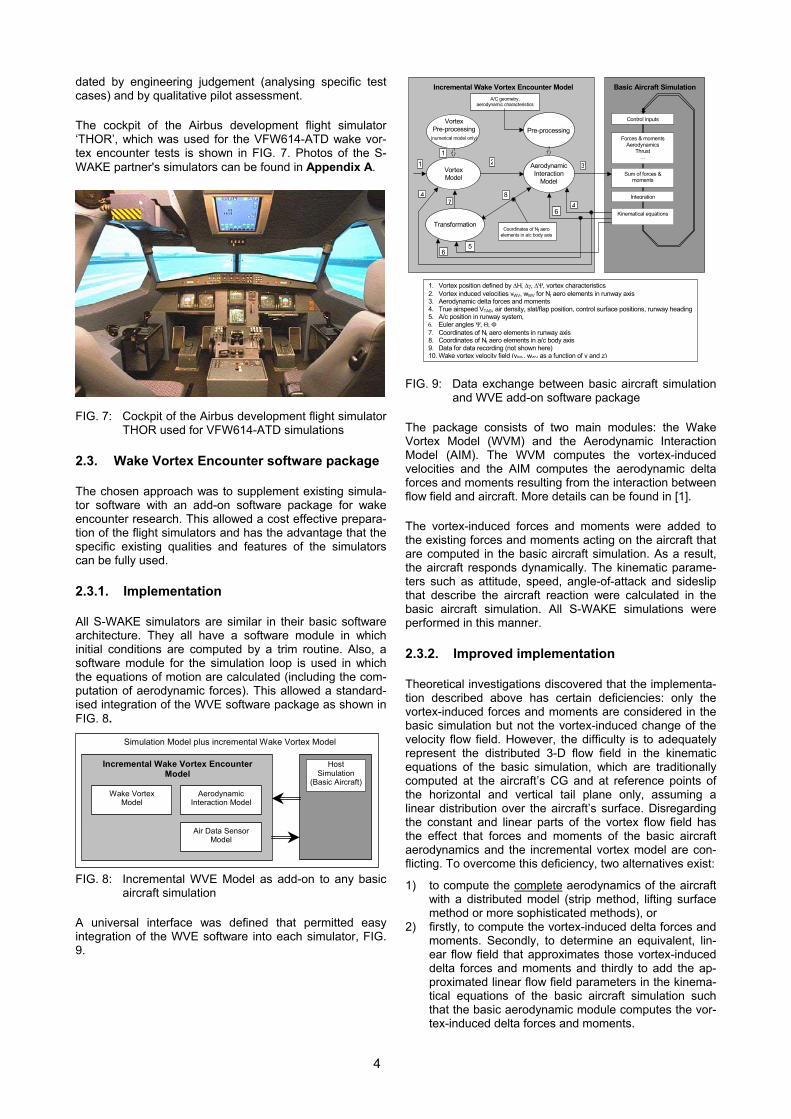
The cockpit of the Airbus development flight simulator ‘THOR’, which was used for the VFW614-ATD wake vor-tex encounter tests is shown in FIG. 7. Photos of the S-WAKE partner's simulators can be found in Appendix A.
FIG. 7: Cockpit of the Airbus development flight simulator THOR used for VFW614-ATD simulations
2.3. Wake Vortex Encounter software package
The chosen approach was to supplement existing simula-tor software with an add-on software package for wake encounter research. This allowed a cost effective prepara-tion of the flight simulators and has the advantage that the specific existing qualities and features of the simulators can be fully used.
2.3.1. Implementation
All S-WAKE simulators are similar in their basic software architecture. They all have a software module in which initial conditions are computed by a trim routine. Also, a software module for the simulation loop is used in which the equations of motion are calculated (including the com-putation of aerodynamic forces). This allowed a standard-ised integration of the WVE software package as shown in FIG. 8. Simulation Model plus incremental Wake Vortex Model
Host Simulation
(Basic Aircraft)
Incremental Wake Vortex Encounter Model
Aerodynamic Interaction Model
Air Data Sensor Model
Wake Vortex Model
FIG. 8: Incremental WVE Model as add-on to any basic
aircraft simulation
A universal interface was defined that permitted easy integration of the WVE software into each simulator, FIG. 9.
Vortex Model
Aerodynamic Interaction
Model
Coordinates of Nt aero elements in a/c body axis
Pre-processing Vortex
Pre-processing (numerical model only)
A/C geometry, aerodynamic characteristics
Transformation
2 3
5
1
87
6
4
64
Sum of forces & moments
Integration
Kinematical equations
Forces & moments Aerodynamics
Thrust …
Basic Aircraft Simulation
Control inputs
Incremental Wake Vortex Encounter Model
1. Vortex position defined by ∆H, ∆γ, ∆Ψ, vortex characteristics 2. Vortex induced velocities vWV, wWV for Nt aero elements in runway axis 3. Aerodynamic delta forces and moments 4. True airspeed VTAS, air density, slat/flap position, control surface positions, runway heading5. A/c position in runway system, 6. Euler angles Ψ, Θ, Φ 7. Coordinates of Nt aero elements in runway axis 8. Coordinates of Nt aero elements in a/c body axis 9. Data for data recording (not shown here) 10. Wake vortex velocity field (vWV, wWV as a function of y and z)
1
FIG. 9: Data exchange between basic aircraft simulation and WVE add-on software package
The package consists of two main modules: the Wake Vortex Model (WVM) and the Aerodynamic Interaction Model (AIM). The WVM computes the vortex-induced velocities and the AIM computes the aerodynamic delta forces and moments resulting from the interaction between flow field and aircraft. More details can be found in [1].
The vortex-induced forces and moments were added to the existing forces and moments acting on the aircraft that are computed in the basic aircraft simulation. As a result, the aircraft responds dynamically. The kinematic parame-ters such as attitude, speed, angle-of-attack and sideslip that describe the aircraft reaction were calculated in the basic aircraft simulation. All S-WAKE simulations were performed in this manner.
2.3.2. Improved implementation
Theoretical investigations discovered that the implementa-tion described above has certain deficiencies: only the vortex-induced forces and moments are considered in the basic simulation but not the vortex-induced change of the velocity flow field. However, the difficulty is to adequately represent the distributed 3-D flow field in the kinematic equations of the basic simulation, which are traditionally computed at the aircraft’s CG and at reference points of the horizontal and vertical tail plane only, assuming a linear distribution over the aircraft’s surface. Disregarding the constant and linear parts of the vortex flow field has the effect that forces and moments of the basic aircraft aerodynamics and the incremental vortex model are con-flicting. To overcome this deficiency, two alternatives exist:
1) to compute the complete aerodynamics of the aircraft with a distributed model (strip method, lifting surface method or more sophisticated methods), or
2) firstly, to compute the vortex-induced delta forces and moments. Secondly, to determine an equivalent, lin-ear flow field that approximates those vortex-induced delta forces and moments and thirdly to add the ap-proximated linear flow field parameters in the kinema-tical equations of the basic aircraft simulation such that the basic aerodynamic module computes the vor-tex-induced delta forces and moments.
5
As solution 1 would require a major revision of the flight simulator software, solution 2 was selected. It requires a linearization of the basic aerodynamics, which can be done in each simulation cycle or only once if flight condi-tions stay close to the reference conditions. Both options are available, as continuous repetition of the linearization requires substantial computation time. This feature is especially useful if high numbers of simulations are re-quired.
The differences between the original and the improved simulation resulted in slightly different responses during a WVE, which could only be observed under laboratory test conditions. In the flight simulator, the aircraft upsets were qualitatively similar. Simulations with airline and test pilots were performed and it was concluded that the impact on the hazard criteria, which were determined with the original implementation, is negligible.
2.4. Visualisation and analysis tools
Various tools were developed for monitoring the simulator tests, for visualisation and analysis of test results. AIRBUS used 2-D display formats to visualise online, the spatial situation of the vortex and encountering aircraft. The view of the vortex plane showing the aircraft trajectory relative to the vortex was very useful, FIG. 10. NLR and TUB de-veloped similar tools.
FIG. 10: Visualisation of aircraft trajectory in the vortex plane
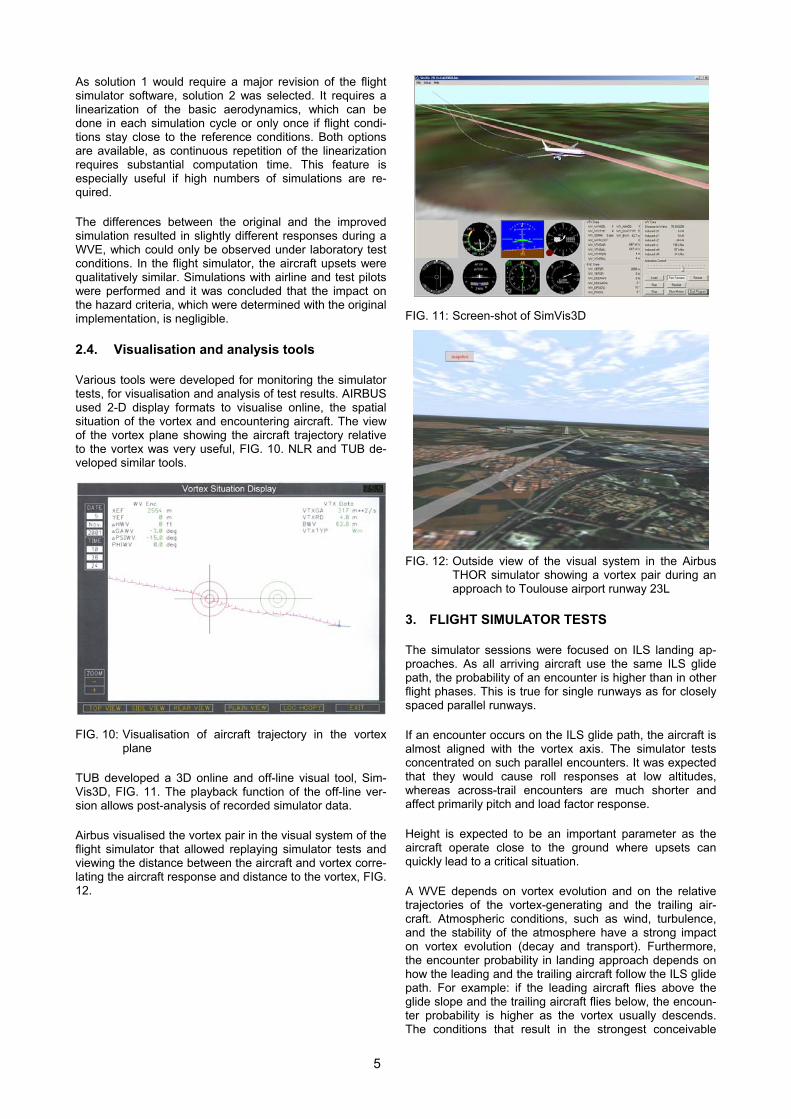
TUB developed a 3D online and off-line visual tool, Sim-Vis3D, FIG. 11. The playback function of the off-line ver-sion allows post-analysis of recorded simulator data.
Airbus visualised the vortex pair in the visual system of the flight simulator that allowed replaying simulator tests and viewing the distance between the aircraft and vortex corre-lating the aircraft response and distance to the vortex, FIG. 12.
FIG. 11: Screen-shot of SimVis3D
FIG. 12: Outside view of the visual system in the Airbus
THOR simulator showing a vortex pair during an approach to Toulouse airport runway 23L
3. FLIGHT SIMULATOR TESTS
The simulator sessions were focused on ILS landing ap-proaches. As all arriving aircraft use the same ILS glide path, the probability of an encounter is higher than in other flight phases. This is true for single runways as for closely spaced parallel runways.
If an encounter occurs on the ILS glide path, the aircraft is almost aligned with the vortex axis. The simulator tests concentrated on such parallel encounters. It was expected that they would cause roll responses at low altitudes, whereas across-trail encounters are much shorter and affect primarily pitch and load factor response.
Height is expected to be an important parameter as the aircraft operate close to the ground where upsets can quickly lead to a critical situation.
A WVE depends on vortex evolution and on the relative trajectories of the vortex-generating and the trailing air-craft. Atmospheric conditions, such as wind, turbulence, and the stability of the atmosphere have a strong impact on vortex evolution (decay and transport). Furthermore, the encounter probability in landing approach depends on how the leading and the trailing aircraft follow the ILS glide path. For example: if the leading aircraft flies above the glide slope and the trailing aircraft flies below, the encoun-ter probability is higher as the vortex usually descends. The conditions that result in the strongest conceivable
6
WVE during final approach for a given aircraft pair can be summarised as follows:
• The vortex has to stay in the approach flight corridor, which requires specific wind conditions (wind shear) or a rebound of the vortex in ground effect.
• The decay of the vortex has to be minimal. • The trailing aircraft has to encounter the vortex under
worst geometric conditions.
Atmospheric parameters (wind speed, turbulence level, temperature profiles etc.) and vortex evolution parameters (vortex transport and decay) are related in a very complex way. With today's knowledge it is possible to define mete-orological conditions for a worst-case encounter in gen-eral. However, it is not possible to precisely specify the true worst-case values for atmospheric parameters. Nor is it possible to exactly predict the resulting vortex strength (or decay), core radius and vortex location. The impact of atmospheric parameters on those quantities is not yet entirely understood. Therefore, S-WAKE simulator investi-gations did not consider vortex transport and decay, but used arbitrarily defined ('realistic'1) vortex parameters to determine hazard criteria.
3.1. Test objectives
The objectives of the simulator tests were:
• to determine metrics that can be used to define the hazard of a WVE,
• to develop criteria that assess the encounter severity.
3.2. Simulation scenarios
The investigated encounter scenarios were as follows:
• The aircraft encountered a vortex during an ILS ap-proach.
• The vortex pair was generated by a large transport aircraft. It was modelled by two straight vortices.
• The Winckelmans vortex velocity model was used. • The vortex axes were nearly parallel to the ILS glide
path, intersecting at a point that is called Encounter Fix (EF);
• The vortex strength was determined such that a rea-sonable number of critical encounters (with GAs) could be expected,
• Trailing aircraft were Do 228, Cessna Citation, F100, VFW614-ATD, and A330
• Minimum aircraft weight was chosen, as light aircraft are more vulnerable to the effects of WVEs.
• Pilots were asked to follow the ILS precisely in order to encounter the vortex close to the centre. This led to stronger or weaker encounters depending on the ac-curacy with which the ILS was maintained.
• Parameters of the encounter geometry were varied.
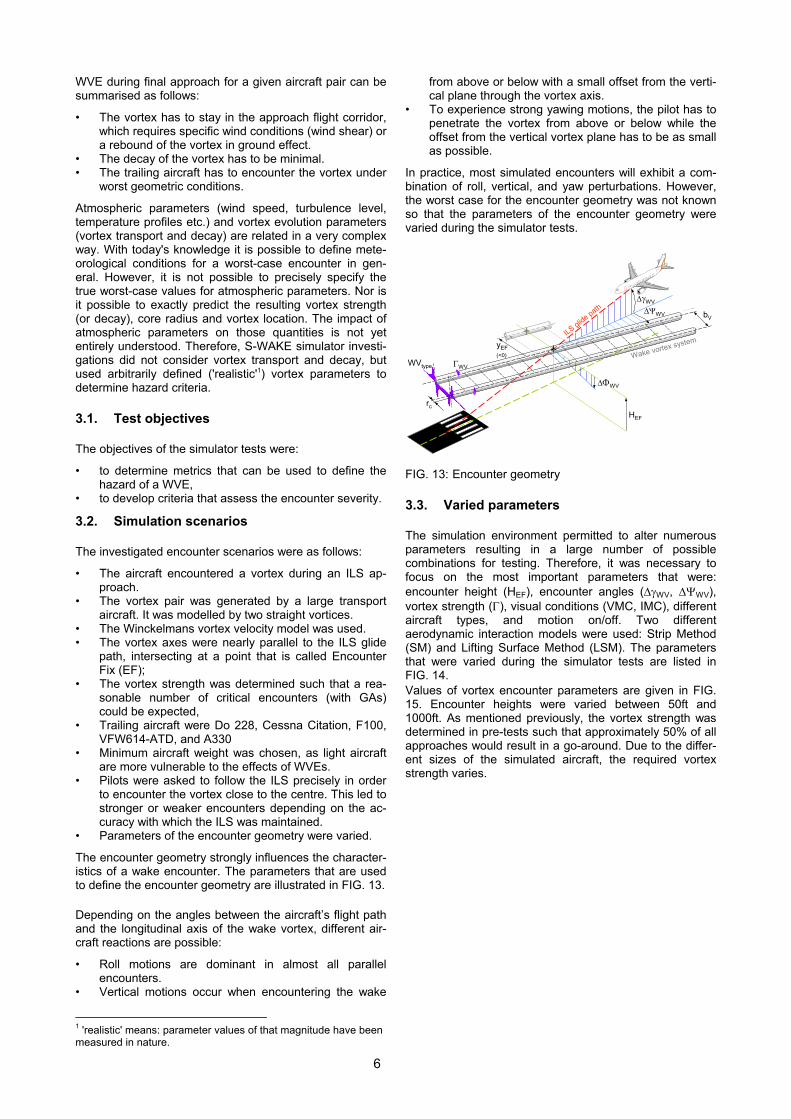
The encounter geometry strongly influences the character-istics of a wake encounter. The parameters that are used to define the encounter geometry are illustrated in FIG. 13.
Depending on the angles between the aircraft’s flight path and the longitudinal axis of the wake vortex, different air-craft reactions are possible:
• Roll motions are dominant in almost all parallel encounters.
• Vertical motions occur when encountering the wake
1 'realistic' means: parameter values of that magnitude have been measured in nature.
from above or below with a small offset from the verti-cal plane through the vortex axis.
• To experience strong yawing motions, the pilot has to penetrate the vortex from above or below while the offset from the vertical vortex plane has to be as small as possible.
In practice, most simulated encounters will exhibit a com-bination of roll, vertical, and yaw perturbations. However, the worst case for the encounter geometry was not known so that the parameters of the encounter geometry were varied during the simulator tests.
∆γWV
∆ΨWV bV
rc
WVtype ΓWV
HEF
yEF(<0)
∆ΦWV
ILS glide path
Wake vortex system
FIG. 13: Encounter geometry
3.3. Varied parameters
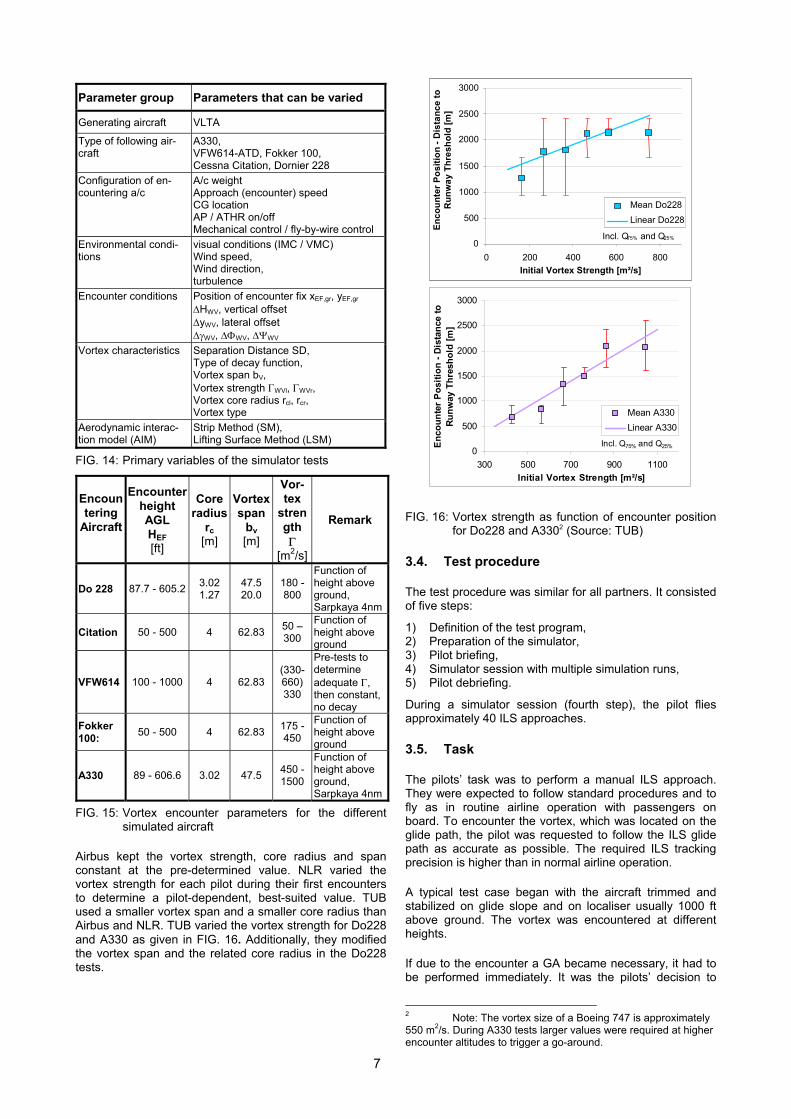
The simulation environment permitted to alter numerous parameters resulting in a large number of possible combinations for testing. Therefore, it was necessary to focus on the most important parameters that were: encounter height (HEF), encounter angles (∆γWV, ∆ΨWV), vortex strength (Γ), visual conditions (VMC, IMC), different aircraft types, and motion on/off. Two different aerodynamic interaction models were used: Strip Method (SM) and Lifting Surface Method (LSM). The parameters that were varied during the simulator tests are listed in FIG. 14. Values of vortex encounter parameters are given in FIG. 15. Encounter heights were varied between 50ft and 1000ft. As mentioned previously, the vortex strength was determined in pre-tests such that approximately 50% of all approaches would result in a go-around. Due to the differ-ent sizes of the simulated aircraft, the required vortex strength varies.
7
FIG. 14: Primary variables of the simulator tests
Encountering
Aircraft
Encounter height AGL HEF [ft]
Core radius
rc [m]
Vortex span
bv [m]
Vor-tex
strength Γ
[m2/s]
Remark
Do 228 87.7 - 605.2 3.02 1.27
47.5 20.0
180 - 800
Function of height above ground, Sarpkaya 4nm
Citation 50 - 500 4 62.83 50 – 300
Function of height above ground
VFW614 100 - 1000 4 62.83 (330-660) 330
Pre-tests to determine adequate Γ, then constant, no decay
Fokker 100: 50 - 500 4 62.83 175 -
450
Function of height above ground
A330 89 - 606.6 3.02 47.5 450 - 1500
Function of height above ground, Sarpkaya 4nm
FIG. 15: Vortex encounter parameters for the different simulated aircraft
Airbus kept the vortex strength, core radius and span constant at the pre-determined value. NLR varied the vortex strength for each pilot during their first encounters to determine a pilot-dependent, best-suited value. TUB used a smaller vortex span and a smaller core radius than Airbus and NLR. TUB varied the vortex strength for Do228 and A330 as given in FIG. 16. Additionally, they modified the vortex span and the related core radius in the Do228 tests.
0
500
1000
1500
2000
2500
3000
0 200 400 600 800Initial Vortex Strength [m²/s]
Enco
unte
r Pos
ition
- D
ista
nce
to
Run
way
Thr
esho
ld [m
]
Mean Do228Linear Do228
Incl. Q 75% and Q25%
0
500
1000
1500
2000
2500
3000
300 500 700 900 1100Initial Vortex Strength [m²/s]
Enco
unte
r Pos
ition
- Di
stan
ce to
Ru
nway
Thr
esho
ld [m
]
Mean A330Linear A330
Incl. Q75% and Q25%
FIG. 16: Vortex strength as function of encounter position for Do228 and A3302 (Source: TUB)
3.4. Test procedure
The test procedure was similar for all partners. It consisted of five steps:
1) Definition of the test program, 2) Preparation of the simulator, 3) Pilot briefing, 4) Simulator session with multiple simulation runs, 5) Pilot debriefing.
During a simulator session (fourth step), the pilot flies approximately 40 ILS approaches.
3.5. Task
The pilots’ task was to perform a manual ILS approach. They were expected to follow standard procedures and to fly as in routine airline operation with passengers on board. To encounter the vortex, which was located on the glide path, the pilot was requested to follow the ILS glide path as accurate as possible. The required ILS tracking precision is higher than in normal airline operation.
A typical test case began with the aircraft trimmed and stabilized on glide slope and on localiser usually 1000 ft above ground. The vortex was encountered at different heights.
If due to the encounter a GA became necessary, it had to be performed immediately. It was the pilots’ decision to
2 Note: The vortex size of a Boeing 747 is approximately 550 m2/s. During A330 tests larger values were required at higher encounter altitudes to trigger a go-around.
Parameter group Parameters that can be varied
Generating aircraft VLTA
Type of following air-craft
A330, VFW614-ATD, Fokker 100, Cessna Citation, Dornier 228
Configuration of en-countering a/c
A/c weight Approach (encounter) speed CG location AP / ATHR on/off Mechanical control / fly-by-wire control
Environmental condi-tions
visual conditions (IMC / VMC) Wind speed, Wind direction, turbulence
Encounter conditions Position of encounter fix xEF,gr, yEF,gr ∆HWV, vertical offset ∆yWV, lateral offset ∆γWV, ∆ΦWV, ∆ΨWV
Vortex characteristics Separation Distance SD, Type of decay function, Vortex span bV, Vortex strength ΓWVl, ΓWVr, Vortex core radius rcl, rcr, Vortex type
Aerodynamic interac-tion model (AIM)
Strip Method (SM), Lifting Surface Method (LSM)
8
initiate the GA when they believed that a safe landing was compromised. The test ended when either the vortices were passed and the aircraft was re-established on the glide path or when a go-around was performed and the aircraft stabilised again.
3.6. Pilot questionnaire
After each test run the pilot had to fill in two question-naires:
1. the Overall Hazard Rating (OHR) questionnaire with a rating scale between 1 and 6, where higher ratings mean higher hazard (Appendix B);
2. the 'Importance to Hazard' questionnaire, with a rating scale between 0 and 3 for various flight pa-rameters (bank angle, roll rate, etc.)
During the first test sessions, it was observed that pilots interpreted the rating scale differently: some rated the contribution of the parameter to the OHR, others the influ-ence of a parameter on their OHR. The contribution rating relates the rating of a parameter to the encounter severity. The importance rating is independent of the encounter severity as it indicates which flight parameter was impor-tant for a pilots’ OHR – and might be a good metric. For example, if an encounter is rated with OHR=1, (no distur-bance experienced) an importance rating could be high or low (e.g. 'low' for side stick roll input if it was not important; or 'high' if it was very important for their rating, even if they did not make any input in this case). In the same case, a contribution rating would always be on the lower end of the scale. After identifying this issue, Airbus clarified its ques-tionnaires by explaining how to use the importance rating and, as a rating scale with 10 values proved to be too large, reduced the scale to four values ranging from 0 to 3. Furthermore, the meaning of each rating number was specified more precisely. The final Airbus questionnaires are given in Appendix B.
3.7. Data acquisition
In addition to the pilot's assessment and comments, 192 parameters were recorded at sample times of 20ms (A330: 16.6ms, Do 228: 33.3ms). They were used for time history plots and further analysis. Each partner analysed and assessed only the simulator tests that they had per-formed.
3.8. Overview on flight simulator tests
Aircraft No. of pilots
Simulator sessions
No. of encoun-ters
A330 12 14 497 VFW614-ATD 14 14 502 F100 4 4 163 Citation II 4 4 153 Do 228 6 12 308
Total 40 48 1623 FIG. 17: Overview on simulator sessions
In total: 40 airline and test pilots flew 1623 encounters, FIG. 17. All participating pilots regarded the wake vortex simulation as very realistic. This was true for all five simu-lators.
4. ANALYSIS OF SIMULATOR TEST RESULTS
4.1. Trajectories
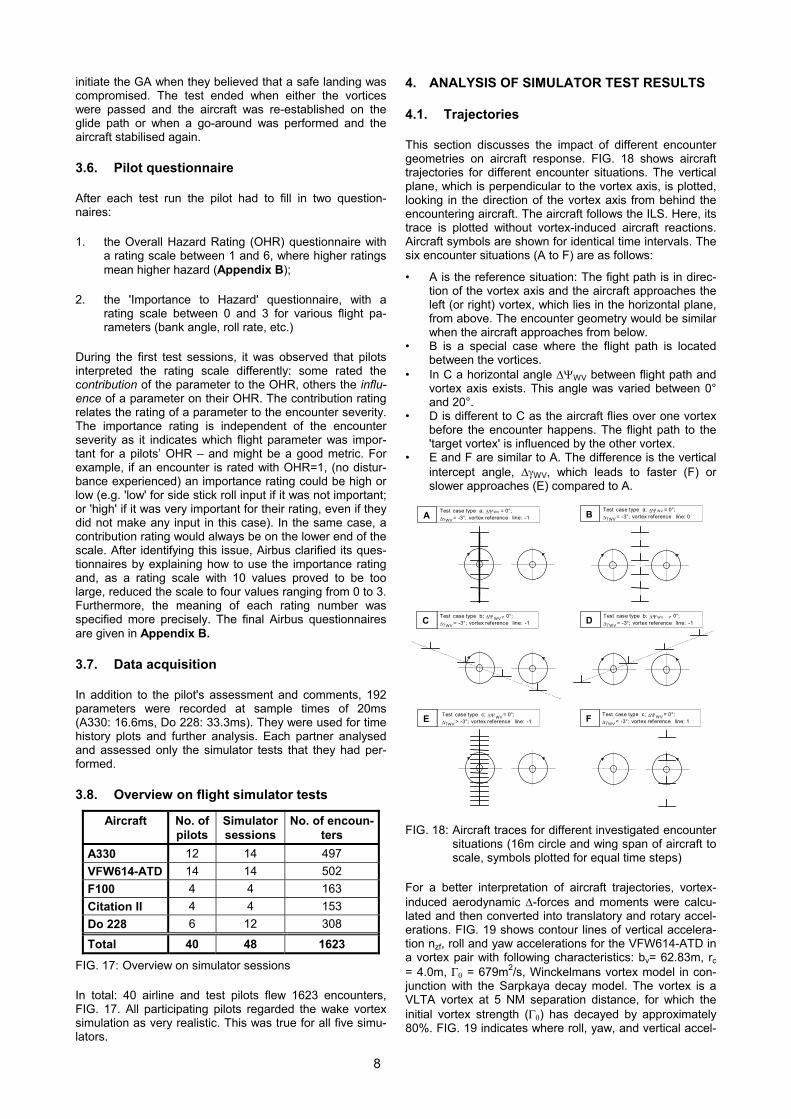
This section discusses the impact of different encounter geometries on aircraft response. FIG. 18 shows aircraft trajectories for different encounter situations. The vertical plane, which is perpendicular to the vortex axis, is plotted, looking in the direction of the vortex axis from behind the encountering aircraft. The aircraft follows the ILS. Here, its trace is plotted without vortex-induced aircraft reactions. Aircraft symbols are shown for identical time intervals. The six encounter situations (A to F) are as follows:
• A is the reference situation: The fight path is in direc-tion of the vortex axis and the aircraft approaches the left (or right) vortex, which lies in the horizontal plane, from above. The encounter geometry would be similar when the aircraft approaches from below.
• B is a special case where the flight path is located between the vortices.
• In C a horizontal angle ∆ΨWV between flight path and vortex axis exists. This angle was varied between 0° and 20°.
• D is different to C as the aircraft flies over one vortex before the encounter happens. The flight path to the 'target vortex' is influenced by the other vortex.
• E and F are similar to A. The difference is the vertical intercept angle, ∆γWV, which leads to faster (F) or slower approaches (E) compared to A.
Test case type a; ∆Ψ WV = 0°;∆γ WV = - 3°; vortex reference line: 0B
Test case type b; ∆Ψ WV ≠ 0°;∆γWV = -3°; vortex reference line: -1C Test case type b; ∆Ψ WV ≠ 0°;
∆γ WV = - 3°; vortex reference line: -1D
Test case type c; ∆Ψ WV = 0°;∆γWV > -3°; vortex reference line: -1E Test case type c; ∆ΨWV = 0°;
∆γ WV < - 3°; vortex reference line: 1F
A Test case type a; ∆Ψ WV = 0°;∆γWV = -3°; vortex reference line: -1
FIG. 18: Aircraft traces for different investigated encounter situations (16m circle and wing span of aircraft to scale, symbols plotted for equal time steps)
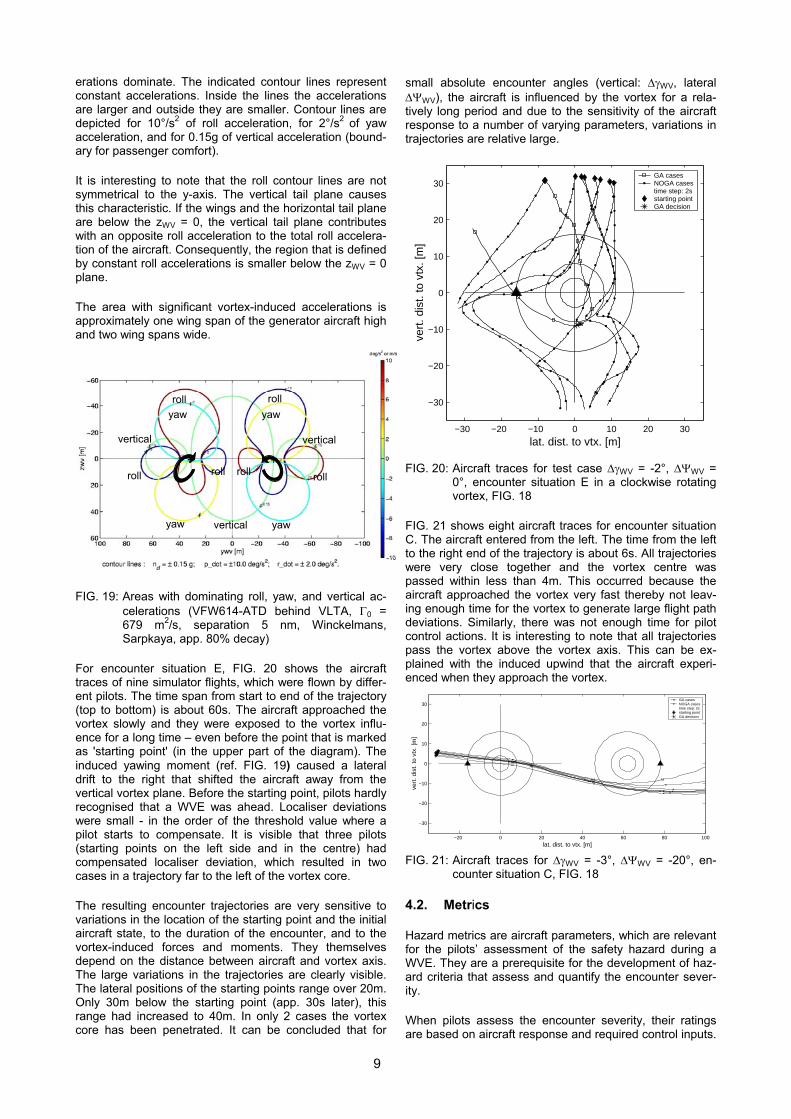
For a better interpretation of aircraft trajectories, vortex-induced aerodynamic ∆-forces and moments were calcu-lated and then converted into translatory and rotary accel-erations. FIG. 19 shows contour lines of vertical accelera-tion nzf, roll and yaw accelerations for the VFW614-ATD in a vortex pair with following characteristics: bv= 62.83m, rc = 4.0m, Γ0 = 679m2/s, Winckelmans vortex model in con-junction with the Sarpkaya decay model. The vortex is a VLTA vortex at 5 NM separation distance, for which the initial vortex strength (Γ0) has decayed by approximately 80%. FIG. 19 indicates where roll, yaw, and vertical accel-
9
erations dominate. The indicated contour lines represent constant accelerations. Inside the lines the accelerations are larger and outside they are smaller. Contour lines are depicted for 10°/s2 of roll acceleration, for 2°/s2 of yaw acceleration, and for 0.15g of vertical acceleration (bound-ary for passenger comfort).
It is interesting to note that the roll contour lines are not symmetrical to the y-axis. The vertical tail plane causes this characteristic. If the wings and the horizontal tail plane are below the zWV = 0, the vertical tail plane contributes with an opposite roll acceleration to the total roll accelera-tion of the aircraft. Consequently, the region that is defined by constant roll accelerations is smaller below the zWV = 0 plane.
The area with significant vortex-induced accelerations is approximately one wing span of the generator aircraft high and two wing spans wide.
FIG. 19: Areas with dominating roll, yaw, and vertical ac-
celerations (VFW614-ATD behind VLTA, Γ0 = 679 m2/s, separation 5 nm, Winckelmans, Sarpkaya, app. 80% decay)
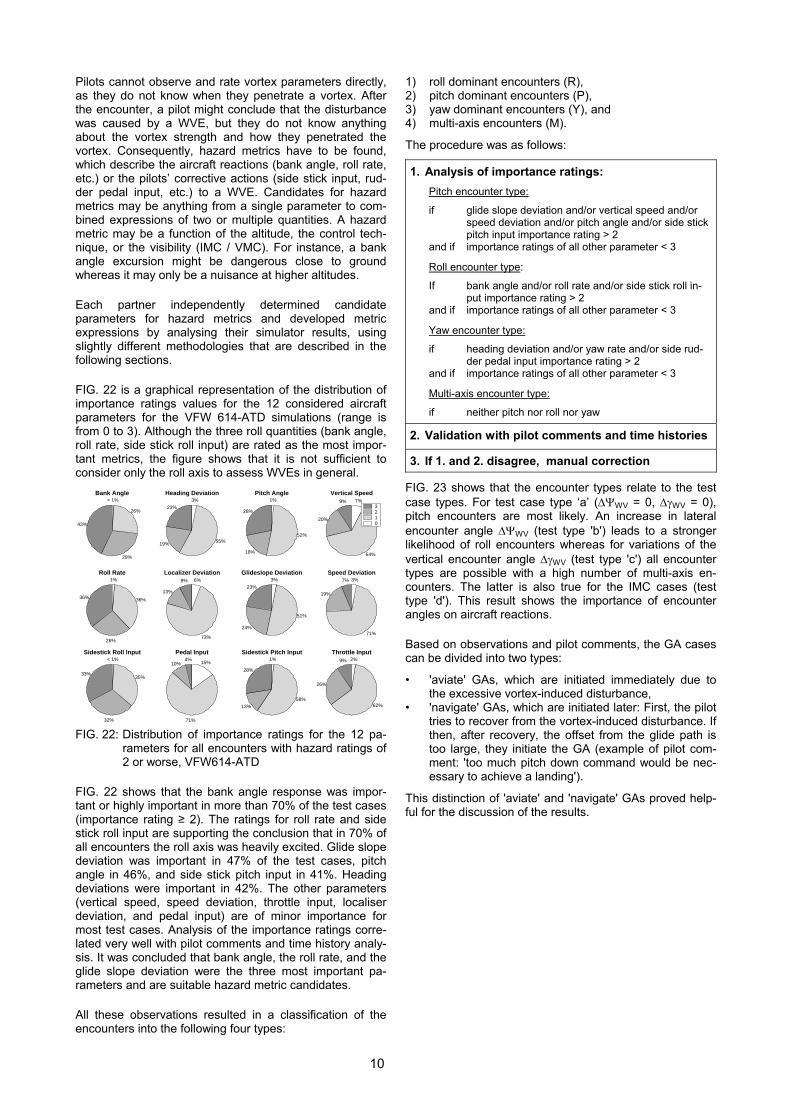
For encounter situation E, FIG. 20 shows the aircraft traces of nine simulator flights, which were flown by differ-ent pilots. The time span from start to end of the trajectory (top to bottom) is about 60s. The aircraft approached the vortex slowly and they were exposed to the vortex influ-ence for a long time – even before the point that is marked as 'starting point' (in the upper part of the diagram). The induced yawing moment (ref. FIG. 19) caused a lateral drift to the right that shifted the aircraft away from the vertical vortex plane. Before the starting point, pilots hardly recognised that a WVE was ahead. Localiser deviations were small - in the order of the threshold value where a pilot starts to compensate. It is visible that three pilots (starting points on the left side and in the centre) had compensated localiser deviation, which resulted in two cases in a trajectory far to the left of the vortex core.
The resulting encounter trajectories are very sensitive to variations in the location of the starting point and the initial aircraft state, to the duration of the encounter, and to the vortex-induced forces and moments. They themselves depend on the distance between aircraft and vortex axis. The large variations in the trajectories are clearly visible. The lateral positions of the starting points range over 20m. Only 30m below the starting point (app. 30s later), this range had increased to 40m. In only 2 cases the vortex core has been penetrated. It can be concluded that for
small absolute encounter angles (vertical: ∆γWV, lateral ∆ΨWV), the aircraft is influenced by the vortex for a rela-tively long period and due to the sensitivity of the aircraft response to a number of varying parameters, variations in trajectories are relative large.
−30 −20 −10 0 10 20 30
−30
−20
−10
0
10
20
30
vert
. dis
t. to
vtx
. [m
]
lat. dist. to vtx. [m]
GA casesNOGA casestime step: 2sstarting pointGA decision
FIG. 20: Aircraft traces for test case ∆γWV = -2°, ∆ΨWV = 0°, encounter situation E in a clockwise rotating vortex, FIG. 18
FIG. 21 shows eight aircraft traces for encounter situation C. The aircraft entered from the left. The time from the left to the right end of the trajectory is about 6s. All trajectories were very close together and the vortex centre was passed within less than 4m. This occurred because the aircraft approached the vortex very fast thereby not leav-ing enough time for the vortex to generate large flight path deviations. Similarly, there was not enough time for pilot control actions. It is interesting to note that all trajectories pass the vortex above the vortex axis. This can be ex-plained with the induced upwind that the aircraft experi-enced when they approach the vortex.
−20 0 20 40 60 80 100
−30
−20
−10
0
10
20
30
vert
. dis
t. to
vtx
. [m
]
lat. dist. to vtx. [m]
GA casesNOGA casestime step: 2sstarting pointGA decision
FIG. 21: Aircraft traces for ∆γWV = -3°, ∆ΨWV = -20°, en-
counter situation C, FIG. 18
4.2. Metrics
Hazard metrics are aircraft parameters, which are relevant for the pilots’ assessment of the safety hazard during a WVE. They are a prerequisite for the development of haz-ard criteria that assess and quantify the encounter sever-ity.
When pilots assess the encounter severity, their ratings are based on aircraft response and required control inputs.
roll
vertical
roll
roll rollroll roll
yaw
yaw
yaw
yaw
vertical
vertical
10
Pilots cannot observe and rate vortex parameters directly, as they do not know when they penetrate a vortex. After the encounter, a pilot might conclude that the disturbance was caused by a WVE, but they do not know anything about the vortex strength and how they penetrated the vortex. Consequently, hazard metrics have to be found, which describe the aircraft reactions (bank angle, roll rate, etc.) or the pilots’ corrective actions (side stick input, rud-der pedal input, etc.) to a WVE. Candidates for hazard metrics may be anything from a single parameter to com-bined expressions of two or multiple quantities. A hazard metric may be a function of the altitude, the control tech-nique, or the visibility (IMC / VMC). For instance, a bank angle excursion might be dangerous close to ground whereas it may only be a nuisance at higher altitudes.
Each partner independently determined candidate parameters for hazard metrics and developed metric expressions by analysing their simulator results, using slightly different methodologies that are described in the following sections.
FIG. 22 is a graphical representation of the distribution of importance ratings values for the 12 considered aircraft parameters for the VFW 614-ATD simulations (range is from 0 to 3). Although the three roll quantities (bank angle, roll rate, side stick roll input) are rated as the most impor-tant metrics, the figure shows that it is not sufficient to consider only the roll axis to assess WVEs in general.
33%
32%
35%
< 1%Sidestick Roll Input
36%
26%
36%
1%Roll Rate
43%
29%
26%
< 1%Bank Angle
4%10%
71%
15%
Pedal Input
8%
13%
73%
6%Localizer Deviation
23%
19% 55%
3%Heading Deviation
28%
13%
58%
1%Sidestick Pitch Input
23%
24%
51%
3%Glideslope Deviation
28%
18%
52%
1%Pitch Angle
9%
26%
62%
2%Throttle Input
7%
19%
71%
3%Speed Deviation
9%
20%
64%
7%
Vertical Speed
3210
FIG. 22: Distribution of importance ratings for the 12 pa-
rameters for all encounters with hazard ratings of 2 or worse, VFW614-ATD
FIG. 22 shows that the bank angle response was impor-tant or highly important in more than 70% of the test cases (importance rating ≥ 2). The ratings for roll rate and side stick roll input are supporting the conclusion that in 70% of all encounters the roll axis was heavily excited. Glide slope deviation was important in 47% of the test cases, pitch angle in 46%, and side stick pitch input in 41%. Heading deviations were important in 42%. The other parameters (vertical speed, speed deviation, throttle input, localiser deviation, and pedal input) are of minor importance for most test cases. Analysis of the importance ratings corre-lated very well with pilot comments and time history analy-sis. It was concluded that bank angle, the roll rate, and the glide slope deviation were the three most important pa-rameters and are suitable hazard metric candidates.
All these observations resulted in a classification of the encounters into the following four types:
1) roll dominant encounters (R), 2) pitch dominant encounters (P), 3) yaw dominant encounters (Y), and 4) multi-axis encounters (M).
The procedure was as follows:
1. Analysis of importance ratings: Pitch encounter type:
if glide slope deviation and/or vertical speed and/or speed deviation and/or pitch angle and/or side stick pitch input importance rating > 2
and if importance ratings of all other parameter < 3
Roll encounter type:
If bank angle and/or roll rate and/or side stick roll in-put importance rating > 2
and if importance ratings of all other parameter < 3
Yaw encounter type:
if heading deviation and/or yaw rate and/or side rud-der pedal input importance rating > 2
and if importance ratings of all other parameter < 3
Multi-axis encounter type:
if neither pitch nor roll nor yaw
2. Validation with pilot comments and time histories
3. If 1. and 2. disagree, manual correction
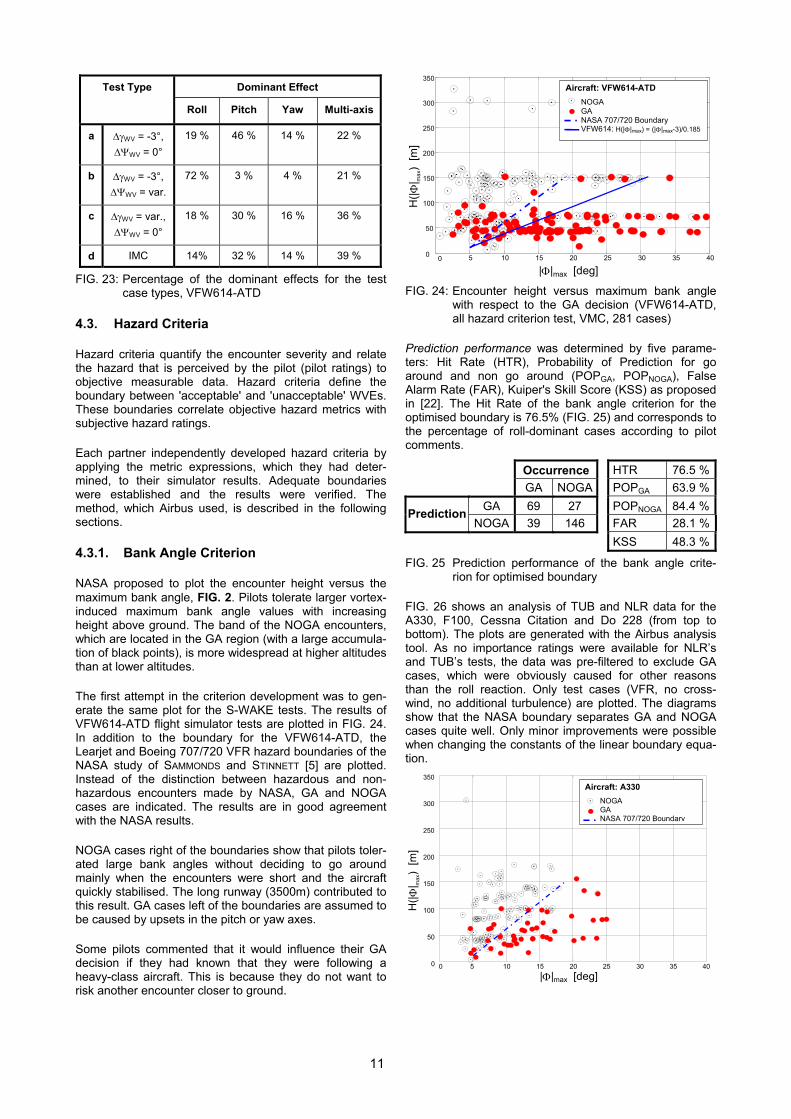
FIG. 23 shows that the encounter types relate to the test case types. For test case type ‘a’ (∆ΨWV = 0, ∆γWV = 0), pitch encounters are most likely. An increase in lateral encounter angle ∆ΨWV (test type 'b') leads to a stronger likelihood of roll encounters whereas for variations of the vertical encounter angle ∆γWV (test type 'c') all encounter types are possible with a high number of multi-axis en-counters. The latter is also true for the IMC cases (test type 'd'). This result shows the importance of encounter angles on aircraft reactions.
Based on observations and pilot comments, the GA cases can be divided into two types:
• 'aviate' GAs, which are initiated immediately due to the excessive vortex-induced disturbance,
• 'navigate' GAs, which are initiated later: First, the pilot tries to recover from the vortex-induced disturbance. If then, after recovery, the offset from the glide path is too large, they initiate the GA (example of pilot com-ment: 'too much pitch down command would be nec-essary to achieve a landing').
This distinction of 'aviate' and 'navigate' GAs proved help-ful for the discussion of the results.
11
Dominant Effect Test Type
Roll Pitch Yaw Multi-axis
a ∆γWV = -3°, ∆ΨWV = 0°
19 % 46 % 14 % 22 %
b ∆γWV = -3°, ∆ΨWV = var.
72 % 3 % 4 % 21 %
c ∆γWV = var., ∆ΨWV = 0°
18 % 30 % 16 % 36 %
d IMC 14% 32 % 14 % 39 %
FIG. 23: Percentage of the dominant effects for the test case types, VFW614-ATD
4.3. Hazard Criteria
Hazard criteria quantify the encounter severity and relate the hazard that is perceived by the pilot (pilot ratings) to objective measurable data. Hazard criteria define the boundary between 'acceptable' and 'unacceptable' WVEs. These boundaries correlate objective hazard metrics with subjective hazard ratings.
Each partner independently developed hazard criteria by applying the metric expressions, which they had deter-mined, to their simulator results. Adequate boundaries were established and the results were verified. The method, which Airbus used, is described in the following sections.
4.3.1. Bank Angle Criterion
NASA proposed to plot the encounter height versus the maximum bank angle, FIG. 2. Pilots tolerate larger vortex-induced maximum bank angle values with increasing height above ground. The band of the NOGA encounters, which are located in the GA region (with a large accumula-tion of black points), is more widespread at higher altitudes than at lower altitudes.
The first attempt in the criterion development was to gen-erate the same plot for the S-WAKE tests. The results of VFW614-ATD flight simulator tests are plotted in FIG. 24. In addition to the boundary for the VFW614-ATD, the Learjet and Boeing 707/720 VFR hazard boundaries of the NASA study of SAMMONDS and STINNETT [5] are plotted. Instead of the distinction between hazardous and non-hazardous encounters made by NASA, GA and NOGA cases are indicated. The results are in good agreement with the NASA results.
NOGA cases right of the boundaries show that pilots toler-ated large bank angles without deciding to go around mainly when the encounters were short and the aircraft quickly stabilised. The long runway (3500m) contributed to this result. GA cases left of the boundaries are assumed to be caused by upsets in the pitch or yaw axes.
Some pilots commented that it would influence their GA decision if they had known that they were following a heavy-class aircraft. This is because they do not want to risk another encounter closer to ground.
0 5 10 15 20 25 30 35 400
50
100
150
200
250
300
350
H(| Φ
| max)
[m]
Aircraft: VFW614-ATD NOGA GA NASA 707/720 Boundary VFW614: H(|Φ|max) = (|Φ|max-3)/0.185
|Φ|max [deg] FIG. 24: Encounter height versus maximum bank angle
with respect to the GA decision (VFW614-ATD, all hazard criterion test, VMC, 281 cases)
Prediction performance was determined by five parame-ters: Hit Rate (HTR), Probability of Prediction for go around and non go around (POPGA, POPNOGA), False Alarm Rate (FAR), Kuiper's Skill Score (KSS) as proposed in [22]. The Hit Rate of the bank angle criterion for the optimised boundary is 76.5% (FIG. 25) and corresponds to the percentage of roll-dominant cases according to pilot comments.
Occurrence HTR 76.5 % GA NOGA POPGA 63.9 %
GA 69 27 POPNOGA 84.4 %PredictionNOGA 39 146 FAR 28.1 %
KSS 48.3 %
FIG. 25 Prediction performance of the bank angle crite-rion for optimised boundary
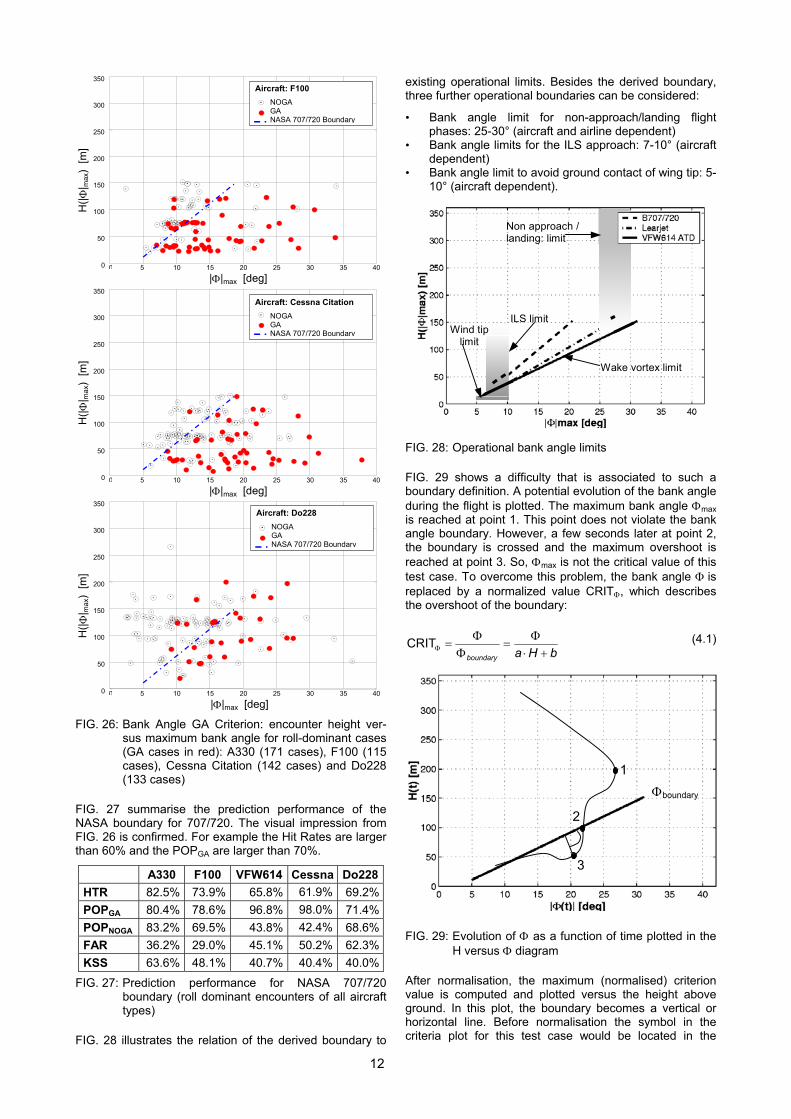
FIG. 26 shows an analysis of TUB and NLR data for the A330, F100, Cessna Citation and Do 228 (from top to bottom). The plots are generated with the Airbus analysis tool. As no importance ratings were available for NLR’s and TUB’s tests, the data was pre-filtered to exclude GA cases, which were obviously caused for other reasons than the roll reaction. Only test cases (VFR, no cross-wind, no additional turbulence) are plotted. The diagrams show that the NASA boundary separates GA and NOGA cases quite well. Only minor improvements were possible when changing the constants of the linear boundary equa-tion.
|Φ|max [deg]
Aircraft: A330 NOGA GA NASA 707/720 Boundary
0 5 10 15 20 25 30 35 400
50
100
150
200
250
300
350
H(| Φ
| max)
[m]
12
|Φ|max [deg]
Aircraft: F100 NOGA GA NASA 707/720 Boundary
0 5 10 15 20 25 30 35 400
50
100
150
200
250
300
350 H
(| Φ| m
ax)
[m]
|Φ|max [deg]
Aircraft: Cessna CitationNOGA GA NASA 707/720 Boundary
0 5 10 15 20 25 30 35 400
50
100
150
200
250
300
350
H(| Φ
| max
) [m
]
|Φ|max [deg]
Aircraft: Do228 NOGA GA NASA 707/720 Boundary
0 5 10 15 20 25 30 35 400
50
100
150
200
250
300
350
H(| Φ
| max
) [m
]
FIG. 26: Bank Angle GA Criterion: encounter height ver-
sus maximum bank angle for roll-dominant cases (GA cases in red): A330 (171 cases), F100 (115 cases), Cessna Citation (142 cases) and Do228 (133 cases)
FIG. 27 summarise the prediction performance of the NASA boundary for 707/720. The visual impression from FIG. 26 is confirmed. For example the Hit Rates are larger than 60% and the POPGA are larger than 70%.
A330 F100 VFW614 Cessna Do228HTR 82.5% 73.9% 65.8% 61.9% 69.2%POPGA 80.4% 78.6% 96.8% 98.0% 71.4%POPNOGA 83.2% 69.5% 43.8% 42.4% 68.6%FAR 36.2% 29.0% 45.1% 50.2% 62.3%KSS 63.6% 48.1% 40.7% 40.4% 40.0%
FIG. 27: Prediction performance for NASA 707/720 boundary (roll dominant encounters of all aircraft types)
FIG. 28 illustrates the relation of the derived boundary to
existing operational limits. Besides the derived boundary, three further operational boundaries can be considered:
• Bank angle limit for non-approach/landing flight phases: 25-30° (aircraft and airline dependent)
• Bank angle limits for the ILS approach: 7-10° (aircraft dependent)
• Bank angle limit to avoid ground contact of wing tip: 5-10° (aircraft dependent).
Non approach / landing: limit
Wake vortex limit
ILS limitWind tip
limit
FIG. 28: Operational bank angle limits
FIG. 29 shows a difficulty that is associated to such a boundary definition. A potential evolution of the bank angle during the flight is plotted. The maximum bank angle Φmax is reached at point 1. This point does not violate the bank angle boundary. However, a few seconds later at point 2, the boundary is crossed and the maximum overshoot is reached at point 3. So, Φmax is not the critical value of this test case. To overcome this problem, the bank angle Φ is replaced by a normalized value CRITΦ, which describes the overshoot of the boundary:
bHaboundary +⋅Φ
=Φ
Φ=ΦCRIT (4.1)
FIG. 29: Evolution of Φ as a function of time plotted in the H versus Φ diagram
After normalisation, the maximum (normalised) criterion value is computed and plotted versus the height above ground. In this plot, the boundary becomes a vertical or horizontal line. Before normalisation the symbol in the criteria plot for this test case would be located in the
3
2
1
Φboundary
13
NOGA region while after normalisation it would be in the GA region.
4.3.2. Further hazard criteria The metric study has concluded that bank angle, roll rate, and glide slope deviation are the best parameters to indi-cate the WVE hazard. Furthermore, four different encoun-ter types were observed: roll, pitch, yaw and multi-axis encounters. As the bank angle criterion achieved satisfac-tory prediction performance in roll encounters, but not in pitch encounters, a cascade structure is proposed.
In general, a criterion with a cascade structure consists of several sub-criteria, which all have to fulfil certain sub-conditions that together define the overall condition. For example: let us consider three sub-criteria for three met-rics A, B, and C. Only if all three criteria values are below a limit, a NOGA situation is predicted:
(A<Acritical) and (B<Bcritical) and (C<Ccitical)⇒ NOGA (4.2)
(A>Acritical) or (B>Bcritical) or (C>Ccritical)⇒ GA (4.3)
4.3.2.1. Glide Slope Deviation Criterion
In order to improve the bank angle criterion performance, Airbus used the glide slope deviation as the second sub-criterion, because the glide slope is related to the pitch axis that was dominant in a substantial number of encoun-ters. A detailed analysis revealed that the sum of the glide slope deviation plus the expected deviation after 4 sec-onds was best suited to describe longitudinal effects caused by vortex-induced up- and downdrafts.
( ) GSGS KSG4GSCRIT ∆∆ ⋅∆⋅+∆= & (4.4)
In the following, CRIT∆GS will be denoted as the glide slope criterion. The factor K∆GS compensates the natural in-crease of the glide slope deviation when the aircraft is less than 100ft (30.5m) above ground. It also takes into ac-count that the significance of ∆GS decreases for the pilot immediately before touch down. FIG. 30 shows the defini-tion for K∆GS versus the height above ground.
FIG. 30: Definition of K∆GS
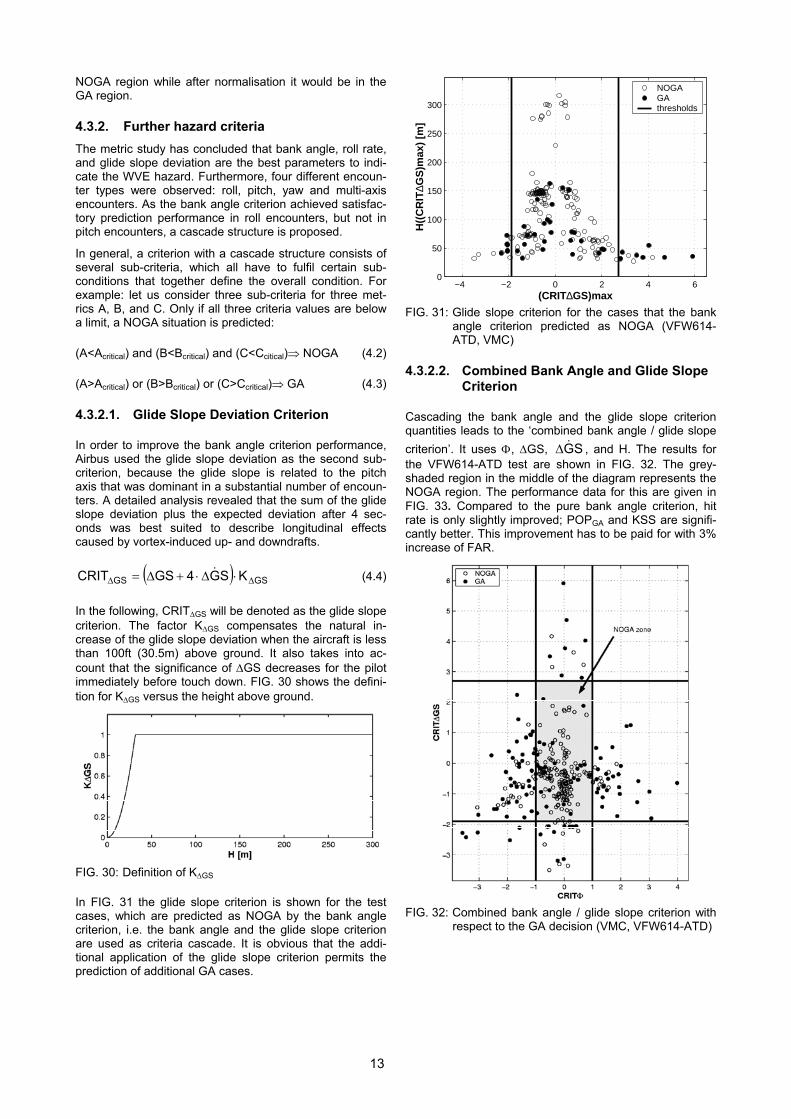
In FIG. 31 the glide slope criterion is shown for the test cases, which are predicted as NOGA by the bank angle criterion, i.e. the bank angle and the glide slope criterion are used as criteria cascade. It is obvious that the addi-tional application of the glide slope criterion permits the prediction of additional GA cases.
−4 −2 0 2 4 60
50
100
150
200
250
300
(CRIT∆GS)max
H((
CR
IT∆G
S)m
ax)
[m]
NOGAGAthresholds
FIG. 31: Glide slope criterion for the cases that the bank
angle criterion predicted as NOGA (VFW614-ATD, VMC)
4.3.2.2. Combined Bank Angle and Glide Slope Criterion
Cascading the bank angle and the glide slope criterion quantities leads to the ‘combined bank angle / glide slope criterion’. It uses Φ, ∆GS, SG&∆ , and H. The results for the VFW614-ATD test are shown in FIG. 32. The grey-shaded region in the middle of the diagram represents the NOGA region. The performance data for this are given in FIG. 33. Compared to the pure bank angle criterion, hit rate is only slightly improved; POPGA and KSS are signifi-cantly better. This improvement has to be paid for with 3% increase of FAR.
FIG. 32: Combined bank angle / glide slope criterion with
respect to the GA decision (VMC, VFW614-ATD)
14
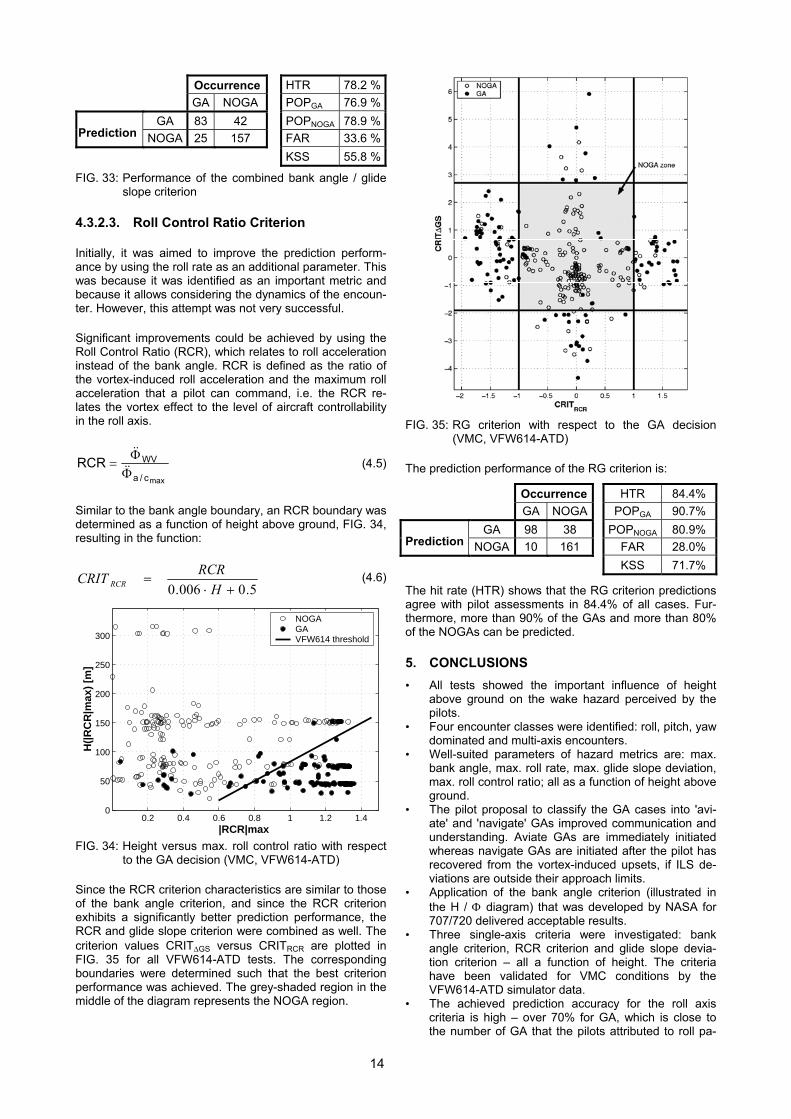
Occurrence HTR 78.2 % GA NOGA POPGA 76.9 %
GA 83 42 POPNOGA 78.9 %Prediction NOGA 25 157 FAR 33.6 % KSS 55.8 %
FIG. 33: Performance of the combined bank angle / glide slope criterion
4.3.2.3. Roll Control Ratio Criterion
Initially, it was aimed to improve the prediction perform-ance by using the roll rate as an additional parameter. This was because it was identified as an important metric and because it allows considering the dynamics of the encoun-ter. However, this attempt was not very successful.
Significant improvements could be achieved by using the Roll Control Ratio (RCR), which relates to roll acceleration instead of the bank angle. RCR is defined as the ratio of the vortex-induced roll acceleration and the maximum roll acceleration that a pilot can command, i.e. the RCR re-lates the vortex effect to the level of aircraft controllability in the roll axis.
maxc/a
WVRCRΦ
Φ= &&
&& (4.5)
Similar to the bank angle boundary, an RCR boundary was determined as a function of height above ground, FIG. 34, resulting in the function:
5.0006.0 +⋅=
HRCRCRIT RCR (4.6)
0.2 0.4 0.6 0.8 1 1.2 1.40
50
100
150
200
250
300
|RCR|max
H(|
RC
R|m
ax)
[m]
NOGAGAVFW614 threshold
FIG. 34: Height versus max. roll control ratio with respect
to the GA decision (VMC, VFW614-ATD)
Since the RCR criterion characteristics are similar to those of the bank angle criterion, and since the RCR criterion exhibits a significantly better prediction performance, the RCR and glide slope criterion were combined as well. The criterion values CRIT∆GS versus CRITRCR are plotted in FIG. 35 for all VFW614-ATD tests. The corresponding boundaries were determined such that the best criterion performance was achieved. The grey-shaded region in the middle of the diagram represents the NOGA region.
FIG. 35: RG criterion with respect to the GA decision
(VMC, VFW614-ATD)
The prediction performance of the RG criterion is:
Occurrence HTR 84.4% GA NOGA POPGA 90.7%
GA 98 38 POPNOGA 80.9% Prediction NOGA 10 161 FAR 28.0%
KSS 71.7%
The hit rate (HTR) shows that the RG criterion predictions agree with pilot assessments in 84.4% of all cases. Fur-thermore, more than 90% of the GAs and more than 80% of the NOGAs can be predicted.
5. CONCLUSIONS • All tests showed the important influence of height
above ground on the wake hazard perceived by the pilots.
• Four encounter classes were identified: roll, pitch, yaw dominated and multi-axis encounters.
• Well-suited parameters of hazard metrics are: max. bank angle, max. roll rate, max. glide slope deviation, max. roll control ratio; all as a function of height above ground.
• The pilot proposal to classify the GA cases into 'avi-ate' and 'navigate' GAs improved communication and understanding. Aviate GAs are immediately initiated whereas navigate GAs are initiated after the pilot has recovered from the vortex-induced upsets, if ILS de-viations are outside their approach limits.
• Application of the bank angle criterion (illustrated in the H / Φ diagram) that was developed by NASA for 707/720 delivered acceptable results.
• Three single-axis criteria were investigated: bank angle criterion, RCR criterion and glide slope devia-tion criterion – all a function of height. The criteria have been validated for VMC conditions by the VFW614-ATD simulator data.
• The achieved prediction accuracy for the roll axis criteria is high – over 70% for GA, which is close to the number of GA that the pilots attributed to roll pa-
15
rameters. • The combination of roll and glide slope criteria im-
proved the performance further. The roll control ratio / glide slope deviation tested on VFW614-ATD data achieved 92% for GA prediction and 89% for NOGA prediction.
• It can be concluded that criterion for the landing ap-proach are defined that clearly relate pilot perception of vortex encounters and aircraft reaction.
• For quantitative computations, the criteria boundaries have to be further validated. Additionally, the limits of what is 'acceptable' and what is 'unacceptable' have to be agreed between the involved parties.
• For comparative studies as they are intended to be performed with the Airbus tool VESA, the criteria are ready for use.
ACKNOWLEDGEMENT
Most of this work was performed within the S-WAKE (As-sessment of Wake Vortex Safety) project that was carried out under contract G4RD-CT-1999-00099 to the European Commission.
6. REFERENCES [1] deBruin A., et al: 'S-WAKE Assessment of Wake
Vortex Safety'; Publishable Summary Report, Provi-sional Issue, NLR, May 2003
[2] Rossow V.J.: 'Lift-generated vortex wakes of subsonic transport aircraft'; in Progress in Aerospace Sciences 35 (1999), p507-660, Pergamon, 1999
[3] Andrews W.H., Robinson G.H., Larson R.R.: 'Aircraft response to the trailing vortices generated by large jet transports'; NASA Aircraft Safety and Operating Prob-lems, Vol 1 NASA SP-270, May 1971, p115-126
[4] Condit P.M. Tracy P.W.: 'Results of the Boeing com-pany wake turbulence test programme', In Olsen J.H., Goldburg A., Rogers M. editors, Aircraft wake turbu-lence and its detection, 1st Ed. New York: Plenum Press, 1971, p473-508
[5] Sammonds R.I., Stinnett Jr G.W., Larsen WE: 'Wake vortex encounter hazard criteria for two aircraft classes'; NASA TM X-73,113, June 1976 (also FAA-RD-75-206)
[6] Rossow V.J., Tinling B.E., 'Research on aircraft vor-tex-wake interactions to determine acceptable levels of wake intensity'; AIAA Journal of Aircraft, Vol 25, No. 4, p481-492, 1988
[7] Nelson R.C.: 'The dynamic response of aircraft en-countering aircraft wake turbulence'; Tech. Report AFFDL-TR-74-29, Air Force Flight Dynamics Labora-tory, Wright Patterson Airforce Base, OH, June 1974
[8] Nelson R.C.: 'Dynamic behavior of an aircraft encoun-tering aircraft wake turbulence'; AIAA Journal of Air-craft, Vol 13, No. 9, p704-708, 1976
[9] Hastings Jr. R.C., Keyser Jr. G.L.: 'Simulated vortex encounters by a twin-engine commercial aircraft dur-ing final approach', SAE Technical Paper 800775, May 1980 (also NASA TM-81782)
[10] Johnson W.A., Teper G.L., Rediess H.A.: 'Study of control system effectiveness in alleviating wake up-sets', AIAA Journal of Aircraft, Vol. 11, No. 3, p148-154, August 1974
[11] Sammonds R.I., Stinnett Jr. G.W.: 'Hazard Criteria for Wake Vortex Encounters', NASA TM X-62.473, Moffet Field, CA, 1976
[12] Tinling B.E.: 'Estimation of vortex-induced roll excur-sions based on flight and simulation results'. In: Hal-lock H.N. (editor), Proceedings of the Wake Vortices
Conference, Report No. FAA-RD-77-68, US Dept. of Transportation, Match 15-17,1977, p11-22
[13] Tinling B.E.: 'Estimates of the effectiveness of auto-matic control in alleviating wake vortex induced roll excursions' NASA TM-73,267, August 1977
[14] Tinling B.E.: 'Estimates of the effect of the delayed flap approach on the wake vortex hazard' NASA TM-73,179, September 1977
[15] Stewart E.C.: 'A piloted simulation study of wake tur-bulence on final approach'; AIAA Paper 98-4339
[16] Hallock, J.N., Eberle, W.R.: 'Aircraft Wake Vortices, a State-of-the-Art Review of the United States', FAA-RD-77-23, 1977
[17] Vicroy, D.D., Brandon, J., Greene G.: ‘Characterizing the Hazard of Wake Vortex Encounter’. AIAA Paper 97-0055, Reno, NV, January 1997
[18] Vicroy, D.D., Nguyen T.: ‘A simulation study to de-velop an acceptable wake encounter boundary for a B737-100 Airplane’, AIAA Paper 96-3372, San Diego, CA, July 1996
[19] Liot D.: 'Flight Simulation of Wake Vortex Encounter'; WAVENC Report Note R9, AM Airbus, Toulouse, 15-02-2000.
[20] Liot D.: 'Wake vortex encounter model implementation and validation in the online (piloted) flight simulation environment'; WAVENC Technical Note TN-19, AM Airbus, Toulouse, 15-02-2000.
[21] Kulwatz N., Kindel W., Dahms M.: 'Auswirkungen von Wirbelschleppen sehr großer Flugzeuge auf nachfol-gende Flugzeuge'; Presented at DGLR Congress, Berlin, Sept. 1999.
[22] Hoad, D.J., Pickersgill, A.O.: ‘Initial Investigation of Forecasts of Wake Vortex Behaviour Classes’, Fore-casting Research Technical Report No. 372, Met Of-fice, Berkshire, 2001
16
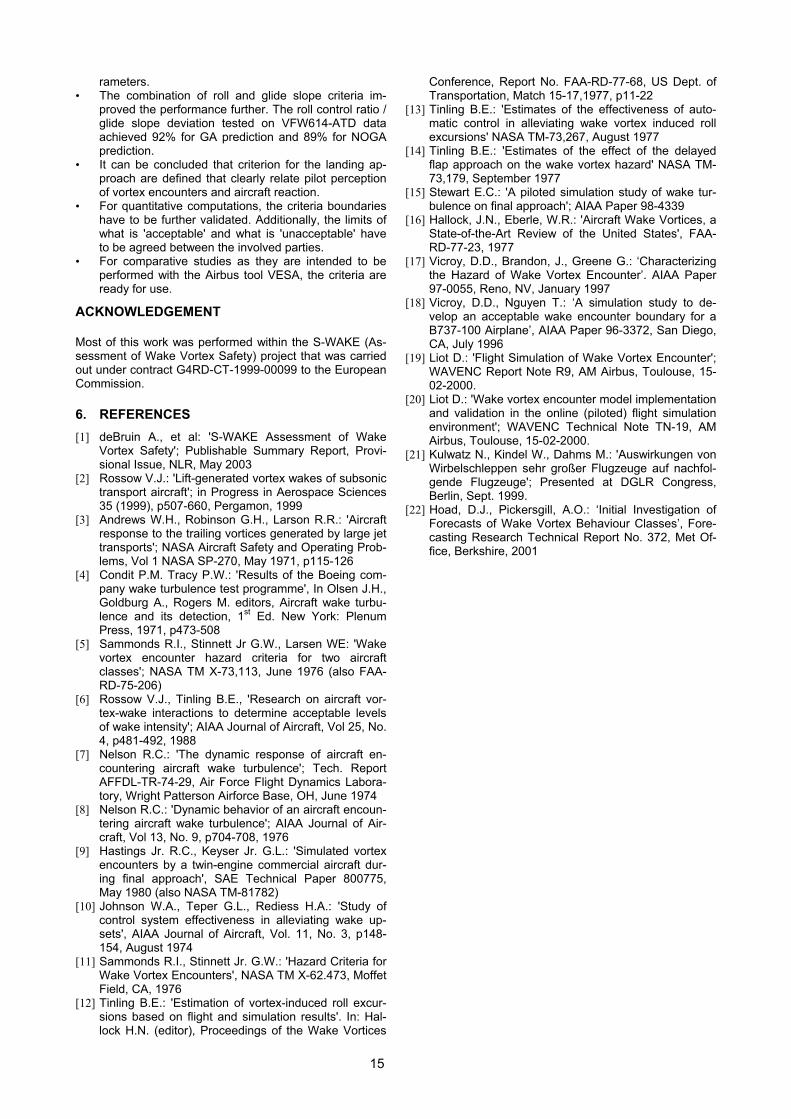
APPENDIX A: FLIGHT SIMULATORS
FIG. 36 gives an overview of the specific characteristics of the S-WAKE flight simulators. Airbus and NLR used de-velopment or research simulators while the TU Berlin simulators were mainly used for pilot training.
The cockpit and motion system of NLR’s Research Flight Simulator used for Citation and F100 simulator tests is shown in FIG. 37.
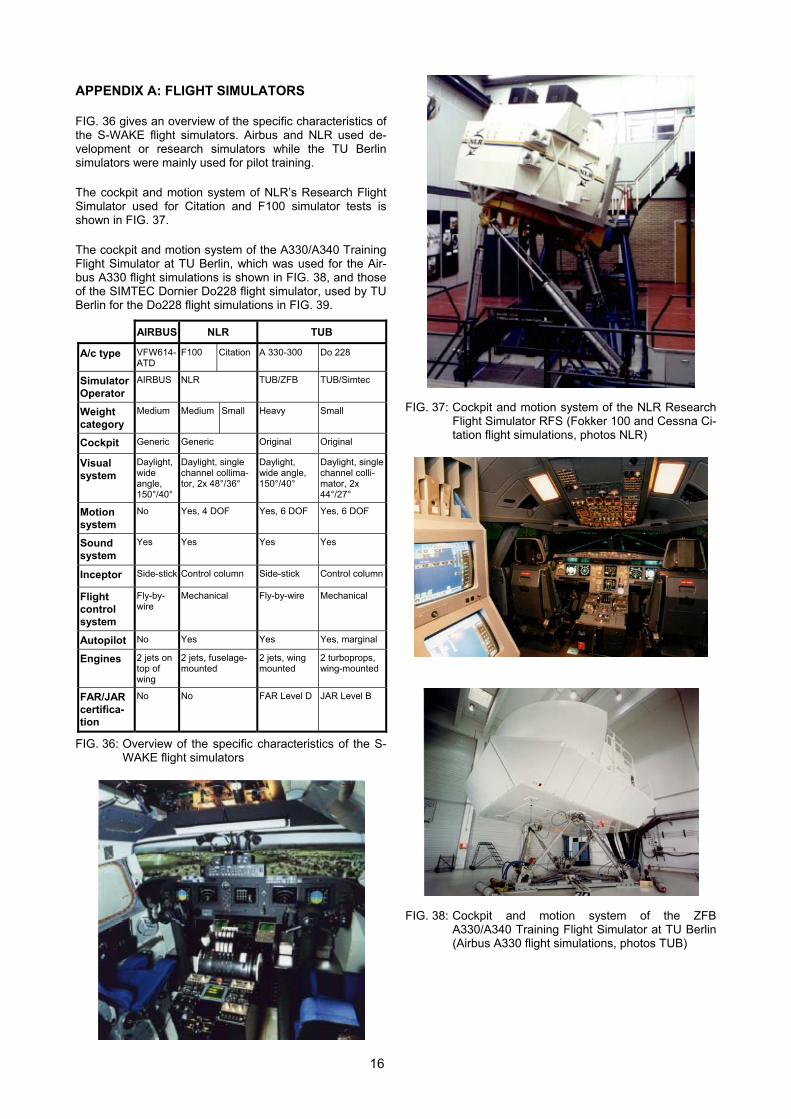
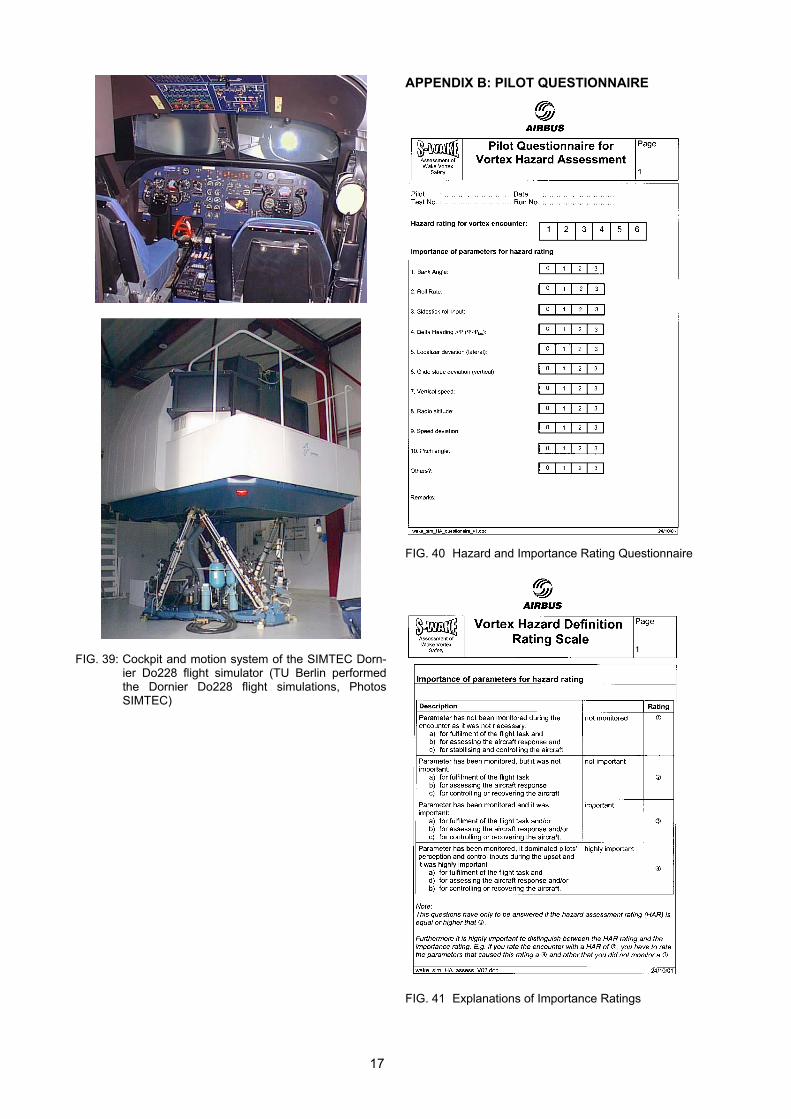
The cockpit and motion system of the A330/A340 Training Flight Simulator at TU Berlin, which was used for the Air-bus A330 flight simulations is shown in FIG. 38, and those of the SIMTEC Dornier Do228 flight simulator, used by TU Berlin for the Do228 flight simulations in FIG. 39.
AIRBUS NLR TUB
A/c type VFW614-ATD
F100 Citation A 330-300 Do 228
Simulator Operator
AIRBUS NLR TUB/ZFB TUB/Simtec
Weight category
Medium Medium Small Heavy Small
Cockpit Generic Generic Original Original
Visual system
Daylight, wide angle, 150°/40°
Daylight, single channel collima-tor, 2x 48°/36°
Daylight, wide angle, 150°/40°
Daylight, single channel colli-mator, 2x 44°/27°
Motion system
No Yes, 4 DOF Yes, 6 DOF Yes, 6 DOF
Sound system
Yes Yes Yes Yes
Inceptor Side-stick Control column Side-stick Control column
Flight control system
Fly-by-wire
Mechanical Fly-by-wire Mechanical
Autopilot No Yes Yes Yes, marginal
Engines 2 jets on top of wing
2 jets, fuselage-mounted
2 jets, wing mounted
2 turboprops, wing-mounted
FAR/JAR certifica-tion
No No FAR Level D JAR Level B
FIG. 36: Overview of the specific characteristics of the S-WAKE flight simulators
FIG. 37: Cockpit and motion system of the NLR Research Flight Simulator RFS (Fokker 100 and Cessna Ci-tation flight simulations, photos NLR)
FIG. 38: Cockpit and motion system of the ZFB A330/A340 Training Flight Simulator at TU Berlin (Airbus A330 flight simulations, photos TUB)
17
FIG. 39: Cockpit and motion system of the SIMTEC Dorn-ier Do228 flight simulator (TU Berlin performed the Dornier Do228 flight simulations, Photos SIMTEC)
APPENDIX B: PILOT QUESTIONNAIRE
FIG. 40 Hazard and Importance Rating Questionnaire
FIG. 41 Explanations of Importance Ratings
18
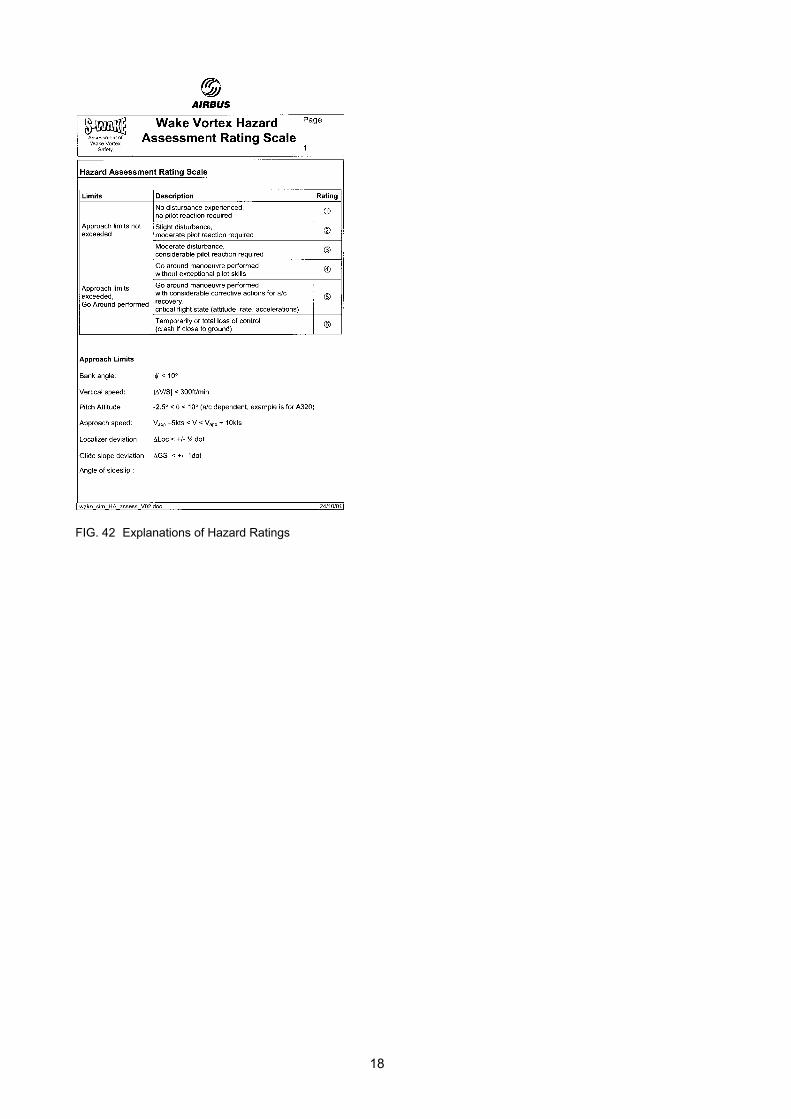
FIG. 42 Explanations of Hazard Ratings
Related Documents