ISSN 2042-2695 CEP Discussion Paper No 987 June 2010 Has ICT Polarized Skill Demand? Evidence from Eleven Countries over 25 Years Guy Michaels, Ashwini Natraj and John Van Reenen

Welcome message from author
This document is posted to help you gain knowledge. Please leave a comment to let me know what you think about it! Share it to your friends and learn new things together.
Transcript
ISSN 2042-2695
CEP Discussion Paper No 987
June 2010
Has ICT Polarized Skill Demand?
Evidence from Eleven Countries over 25 Years
Guy Michaels, Ashwini Natraj and John Van Reenen
Abstract OECD labor markets have become more “polarized” with employment in the middle of the skill
distribution falling relative to the top and (in recent years) also the bottom of the skill distribution. We
test the hypothesis of Autor, Levy, and Murnane (2003) that this is partly due to information and
communication technologies (ICT) complementing the analytical tasks primarily performed by highly
educated workers and substituting for routine tasks generally performed by middle educated workers
(with little effect on low educated workers performing manual non-routine tasks). Using industry
level data on the US, Japan, and nine European countries 1980-2004 we find evidence consistent with
ICT-based polarization. Industries with faster growth of ICT had greater increases in relative demand
for high educated workers and bigger falls in relative demand for middle educated workers. Trade
openness is also associated with polarization, but this is not robust to controls for technology (like
R&D). Technologies can account for up to a quarter of the growth in demand for the college educated
in the quarter century since 1980.
Keywords: Technology, trade, skill demand, wage inequality
JEL Classifications: J23, J24, O33
This paper was published as part of the Centre’s Productivity and Innovation Programme. The Centre
for Economic Performance is financed by the Economic and Social Research Council.
Acknowledgements This paper is produced as part of the project Science, Innovation, Firms and Markets in a Globalised
World (SCIFI-GLOW), a Collaborative Project funded by the European Commission’s Seventh
Research Framework Programme, Contract number SSH7-CT-2008-217436. Any opinions expressed
here are those of the author(s) and not those of the European Commission.
Finance was provided by the ESRC through the Centre for Economic Performance.
We thank David Autor, Tim Brenahan, David Dorn, Liran Einav, Maarten Goos, Larry Katz,
Paul Krugman, Alan Manning, Denis Nekipelov, Stephen Redding, Anna Salomons, and seminar
participants at various universities for extremely helpful comments. David Autor kindly provided the
data on routine tasks.
Guy Michaels is a Research Associate for the Centre for Economic Performance and Lecturer
in the Department of Economics, London School of Economics. He is also a Research Affiliate with
CEPR. Ashwini Natraj is a Research Assistant at the Centre for Economic Performance, London
School of Economics. John Van Reenen is Director of the Centre for Economic Performance and
Professor of Economics, London School of Economics.
Published by
Centre for Economic Performance
London School of Economics and Political Science
Houghton Street
London WC2A 2AE
All rights reserved. No part of this publication may be reproduced, stored in a retrieval system or
transmitted in any form or by any means without the prior permission in writing of the publisher nor
be issued to the public or circulated in any form other than that in which it is published.
Requests for permission to reproduce any article or part of the Working Paper should be sent to the
editor at the above address.
G. Michaels, A. Natraj and J. Van Reenen, submitted 2010
1. Introduction
The demand for more highly educated workers appears to have risen for many
decades across OECD countries. Despite a large increase in the supply of such
workers, the return to college education has not fallen. Instead, it has risen
significantly since the early 1980s in the US, UK, and many other nations (see
Machin and Van Reenen, 2008). The consensus view is that this increase in skill
demand is linked to technological progress (e.g. Goldin and Katz, 2008) rather
than increased trade with low wage countries (although see Krugman, 2008, for a
more revisionist view).
Recent analyses of data through the 2000s, however, suggest a more nuanced
view of the change in demand for skills. Autor, Katz, and Kearney (2007, 2008)
use US data to show that although “upper tail” inequality (between the 90th and
50th percentiles of the wage distribution) has continued to rise in an almost secular
way over the last thirty years, “lower tail” inequality (between the 50th and 10th
percentiles of the distribution) increased during the 1980s but has stayed relatively
flat from around 1990. They also show a related pattern for different education
groups, with the hourly wages of college graduates’ rising relative to high school
graduates since 1980, and high school graduates gaining relative to high school
dropouts during the 1980s but not since then. When considering occupations,
rather than education groups, Goos and Manning (2007) describe a polarization
of the workforce. In the UK middle skilled occupations have declined relative to
both the highly skilled and low skilled occupations. Spietz-Oener (2006) finds
related results for Germany and Goos, Manning and Salomons (2009) find similar
results for several OECD countries1.
What could account for these trends? One explanation is that new technolo-
1See also Dustmann, Ludsteck and Schonberg (2009) and Smith (2008).
2
gies, such as information and communication technologies (ICT), are complemen-
tary with human capital and rapid falls in quality-adjusted ICT prices have there-
fore increased skill demand. There is a large body of literature broadly consistent
with this notion2. A more sophisticated view has been offered by Autor, Levy
and Murnane (2003) who emphasize that ICT substitutes for routine tasks but
complements non-routine analytical tasks. Many routine tasks were traditionally
performed by less educated workers, such as assembly workers in a car factory, and
many of the analytical non-routine tasks are performed by more educated workers
such as consultants, advertising executives and physicians. However, many rou-
tine tasks are also performed in occupations employing middle educated workers,
such as bank clerks, and these groups may find demand for their services falling as
a result of computerization. Similarly many less educated workers are employed in
non-routine manual tasks such as janitors or cab drivers, and these tasks are much
less affected by ICT. Since the numbers of routine jobs in the traditional manufac-
turing sectors (like car assembly) declined substantially in the 1970s, subsequent
ICT growth may have primarily increased demand for highly educated workers
at the expense of those in the middle of the educational distribution and left the
least educated (mainly working in non-routine manual jobs) largely unaffected.
Although this theory is attractive there is currently little direct international
evidence that ICT causes a substitution frommiddle-skilled workers to high-skilled
workers. Autor, Levy and Murnane (2003) show some consistent trends for the
US and Autor and Dorn (2009) exploit spatial variation across the US to show
that the growth in low skilled services has been faster in areas where initially there
were high proportions of routine jobs.3
2See Bond and Van Reenen (2007) for a survey. Industry level data are used by Berman,Bound and Griliches (1994), Autor, Katz and Krueger (1998) and Machin and Van Reenen(1998). Krueger (1993), DiNardo and Pischke (1997) and Lang (2002) use individual data.
3The closest antecedent of our paper is perhaps Autor, Katz and Krueger (1998, Table V)who found that in the US the industry level growth of demand for US high school graduates
3
In this paper we test the hypothesis that ICT may be behind the polarization
of the labor market by implementing a simple test using 25 years of international
cross-industry data. If the ICT-based explanation for polarization is correct, then
we would expect that industries and countries that had a faster growth in ICT
also experienced an increase in demand for college educated workers, relative to
workers with intermediate levels of education. In this paper we show that this is
indeed a robust feature of the international data.
We exploit the new EUKLEMS database, which provides data on college grad-
uates and disaggregates non-college workers into two groups: those with low ed-
ucation and those with “middle level” education. For example, in the US the
middle education group includes those with some college and high school gradu-
ates, but excludes high school drop-outs and GEDs (see Timmer et al, 2007, Table
5.3 for the country specific breakdown). The EUKLEMS database covers eleven
developed economies (US, Japan, and nine countries in Western Europe) from
1980-2004 and also contains data on ICT capital. In analyzing the data we con-
sider not only the potential role of ICT, but also several alternative explanations.
In particular, we examine whether the role of trade in changing skill demand could
have become more important in recent years (most of the early studies pre-dated
the growth of China and India as major players).
The idea behind our empirical strategy is that the rapid fall in quality-adjusted
ICT prices will have a greater effect in some country-industry pairs that are more
reliant on ICT. This is because some industries are for technological reasons inher-
ently more reliant on ICT than others. We have no compelling natural experiment,
however, so our results should be seen as conditional correlations. We do, how-
between 1993 and 1979 was negatively correlated with the growth of computer use between 1993and 1984. We find this is a robust feature of 11 OECD countries over a much longer time period.For other related work see Black and Spitz-Oener (2010), Firpo, Fortin and Lemieux (2009),and work surveyed by Acemoglu and Autor (2010).
4
ever, implement some instrumental variable strategies using the industry-specific
base year levels of US ICT intensity and/or routine tasks as an instrument for
subsequent ICT increases in other countries. These support the OLS results.
We conclude that technology - both ICT and Research and Development
(R&D) - has raised relative demand for college educated workers and, consistent
with the ICT-based polarization hypothesis, this increase has come mainly from
reducing the relative demand for middle skilled workers rather than low skilled
workers.
The paper is laid out as follows. Section II describes the empirical model,
Section III the data and Section IV the empirical results. Section V offers some
concluding comments.
2. Empirical Model
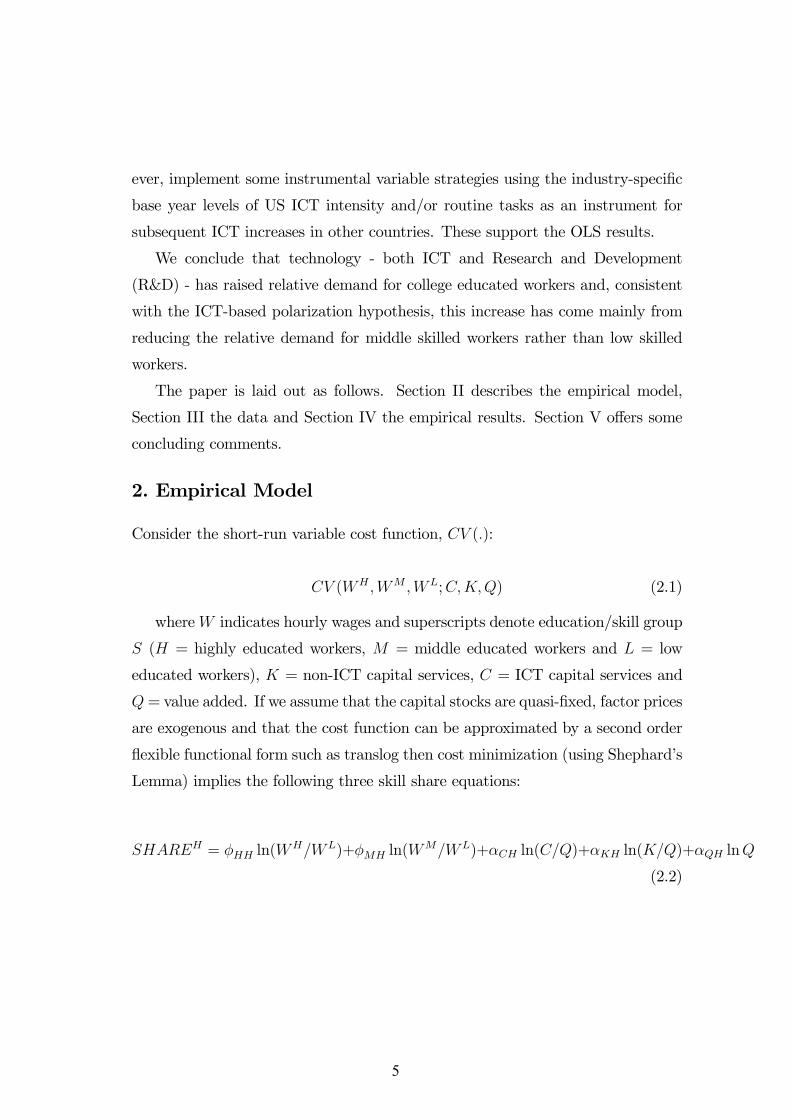
Consider the short-run variable cost function, CV (.):
CV (WH ,WM ,WL;C,K,Q) (2.1)
whereW indicates hourly wages and superscripts denote education/skill group
S (H = highly educated workers, M = middle educated workers and L = low
educated workers), K = non-ICT capital services, C = ICT capital services and
Q= value added. If we assume that the capital stocks are quasi-fixed, factor prices
are exogenous and that the cost function can be approximated by a second order
flexible functional form such as translog then cost minimization (using Shephard’s
Lemma) implies the following three skill share equations:
SHAREH = φHH ln(WH/WL)+φMH ln(W
M/WL)+αCH ln(C/Q)+αKH ln(K/Q)+αQH lnQ
(2.2)
5
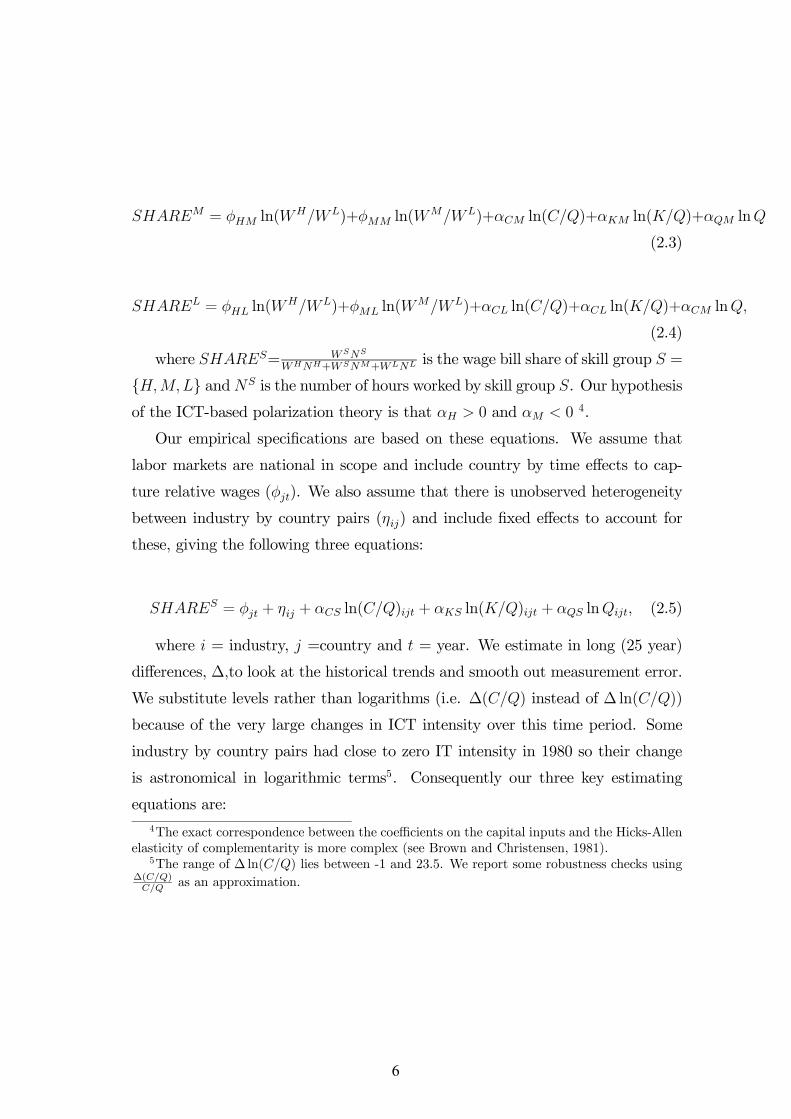
SHAREM = φHM ln(WH/WL)+φMM ln(W
M/WL)+αCM ln(C/Q)+αKM ln(K/Q)+αQM lnQ
(2.3)
SHAREL = φHL ln(WH/WL)+φML ln(W
M/WL)+αCL ln(C/Q)+αCL ln(K/Q)+αCM lnQ,
(2.4)
where SHARES= WSNS
WHNH+WSNM+WLNL is the wage bill share of skill group S =
{H,M,L} andNS is the number of hours worked by skill group S. Our hypothesis
of the ICT-based polarization theory is that αH > 0 and αM < 0 4.
Our empirical specifications are based on these equations. We assume that
labor markets are national in scope and include country by time effects to cap-
ture relative wages (φjt). We also assume that there is unobserved heterogeneity
between industry by country pairs (ηij) and include fixed effects to account for
these, giving the following three equations:
SHARES = φjt + ηij + αCS ln(C/Q)ijt + αKS ln(K/Q)ijt + αQS lnQijt, (2.5)
where i = industry, j =country and t = year. We estimate in long (25 year)
differences, ∆,to look at the historical trends and smooth out measurement error.
We substitute levels rather than logarithms (i.e. ∆(C/Q) instead of ∆ ln(C/Q))
because of the very large changes in ICT intensity over this time period. Some
industry by country pairs had close to zero IT intensity in 1980 so their change
is astronomical in logarithmic terms5. Consequently our three key estimating
equations are:4The exact correspondence between the coefficients on the capital inputs and the Hicks-Allen
elasticity of complementarity is more complex (see Brown and Christensen, 1981).5The range of ∆ ln(C/Q) lies between -1 and 23.5. We report some robustness checks using
∆(C/Q)C/Q as an approximation.
6
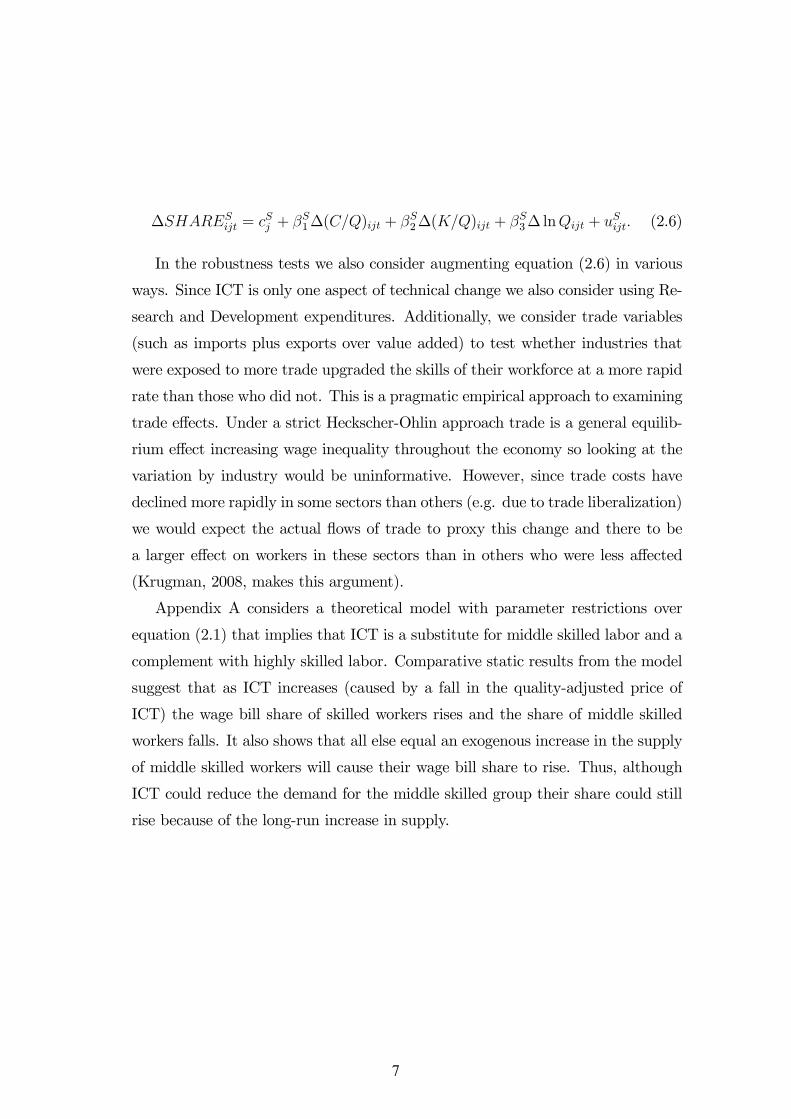
∆SHARESijt = cSj + βS1∆(C/Q)ijt + βS2∆(K/Q)ijt + βS3∆ lnQijt + uSijt. (2.6)
In the robustness tests we also consider augmenting equation (2.6) in various
ways. Since ICT is only one aspect of technical change we also consider using Re-
search and Development expenditures. Additionally, we consider trade variables
(such as imports plus exports over value added) to test whether industries that
were exposed to more trade upgraded the skills of their workforce at a more rapid
rate than those who did not. This is a pragmatic empirical approach to examining
trade effects. Under a strict Heckscher-Ohlin approach trade is a general equilib-
rium effect increasing wage inequality throughout the economy so looking at the
variation by industry would be uninformative. However, since trade costs have
declined more rapidly in some sectors than others (e.g. due to trade liberalization)
we would expect the actual flows of trade to proxy this change and there to be
a larger effect on workers in these sectors than in others who were less affected
(Krugman, 2008, makes this argument).
Appendix A considers a theoretical model with parameter restrictions over
equation (2.1) that implies that ICT is a substitute for middle skilled labor and a
complement with highly skilled labor. Comparative static results from the model
suggest that as ICT increases (caused by a fall in the quality-adjusted price of
ICT) the wage bill share of skilled workers rises and the share of middle skilled
workers falls. It also shows that all else equal an exogenous increase in the supply
of middle skilled workers will cause their wage bill share to rise. Thus, although
ICT could reduce the demand for the middle skilled group their share could still
rise because of the long-run increase in supply.
7
3. Data
3.1. Data Construction
The main source of data for this paper is the EUKLEMS dataset, which con-
tains data on value added, labor, capital, skills and ICT for various industries in
many developed countries (see Timmer et al, 2007). The EUKLEMS data are
constructed using data from each country’s National Statistical Office (e.g. the
US Census Bureau) and harmonized with each country’s national accounts. EU-
KLEMS contains some data on most OECD countries. But since we require data
on skill composition, investment and value added between 1980 and 2004, our
sample of countries is restricted to eleven: Austria, Denmark, Finland, France,
Germany, Italy, Japan, the Netherlands, Spain, the UK and the USA6.
Another choice we had to make regards the set of industries we analyze. Since
our baseline year (1980) was close to the peak of the oil boom, we have dropped
energy-related sectors - mining and quarrying, coke manufactures and the sup-
ply of natural gas - from the sample (we report results that are very robust to
the inclusion of these sectors). The remaining sample includes 27 industries in
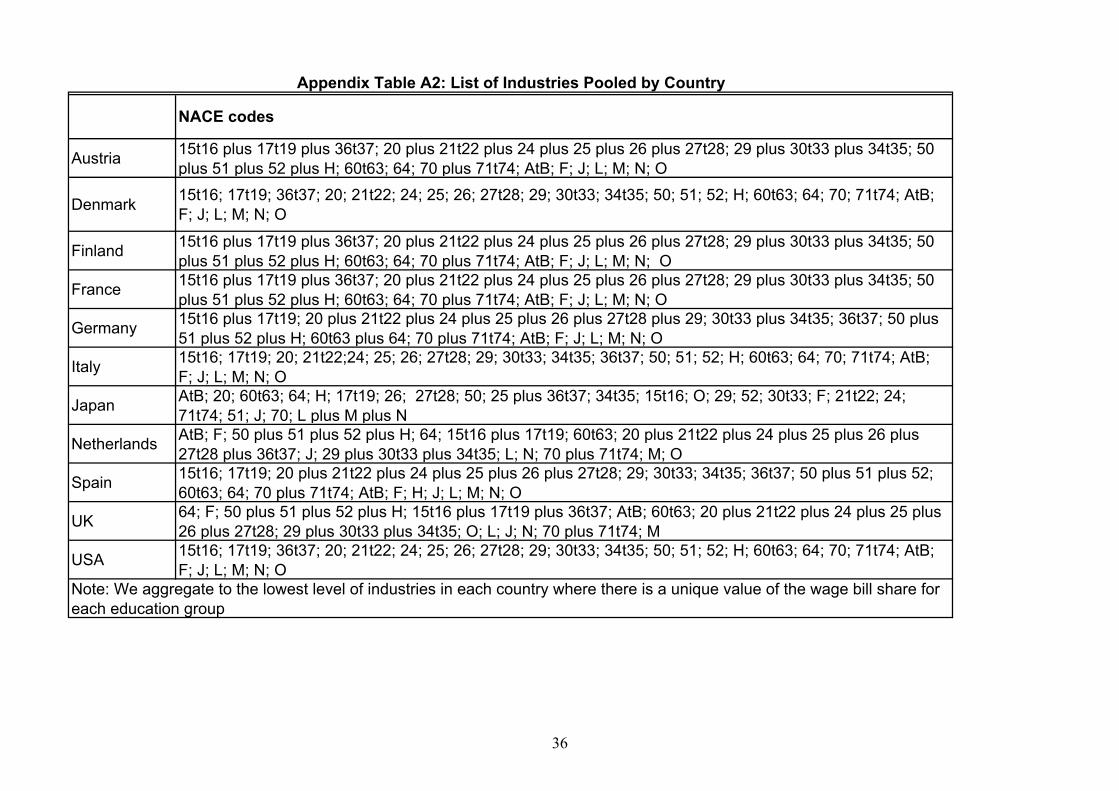
each country (see Appendix Table A1). But wage data by skill category are only
reported separately by industry in some countries. We therefore aggregate in-
dustries to the lowest possible level of aggregation for which all the variables we
use could be constructed — the precise level of disaggregation varied by country
(see Appendix Table A2)7. Our final sample has 208 observations on country-
industry cells for each of the years between 1980 and 2004. We also have data for
6In order to increase the number of countries we would need to considerably shorten theperiod we analyze. For example, limiting our analysis to 1992-2004 (12 years instead of 25) onlyadds Belgium. To further add Czech Republic, Slovenia and Sweden we would need to restrictthe sample to 1995-2004. In order to preserve the longer time series we focused on the 11 coreOECD countries.
7Results are robust to throwing away information and harmonizing all countries at the samelevel of industry aggregation.
8
intervening years, which we use in some of the robustness checks.
For each country-industry-year cell in our dataset we construct a number of
variables. Our main outcome is the wage bill share of workers of different edu-
cational groups, which is a standard indicator for skill demand. In 9 of the 11
countries, the high skilled group indicates whether an employee has attained a
college degree8. A novel feature of our analysis is that we also consider the wage
bill of middle skill workers. The precise composition of this group varies across
countries, since educational systems differ considerably. But typically, this group
consists of high school graduates, people with some college education, and people
with non-academic professional degrees.
Our main measure for use of new technology is Information and Communi-
cation Technology (ICT) capital divided by value added. Similarly, we also use
the measure of non-ICT capital divided by value added. EUKLEMS builds these
variables using the perpetual inventory method from the underlying investment
flow data for several types of capital (see Data Appendix). For the tradable in-
dustries (Agriculture and Manufacturing) we construct measures of trade flows
using UN COMTRADE data (21st March 2008 updates)9. Details are contained
in the Data Appendix.
3.2. Descriptive statistics
3.2.1. Cross Country Trends
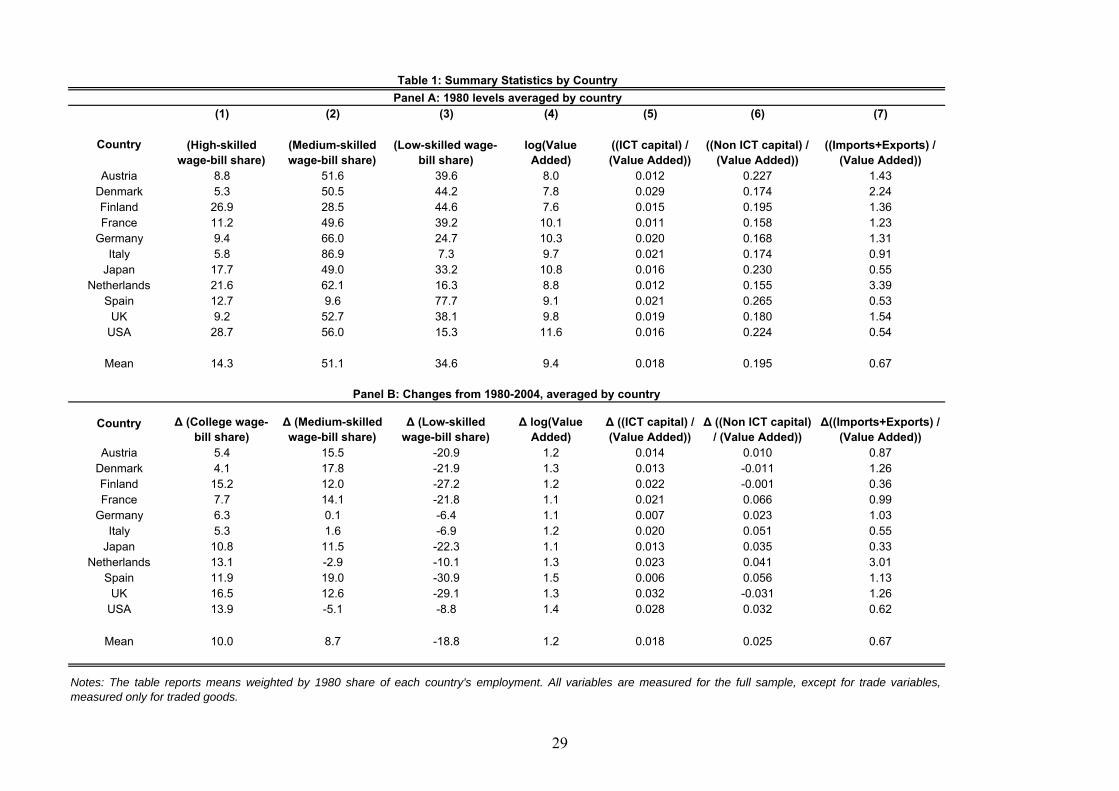
Panel A of Table 1 shows summary statistics for the levels of the key variables in
1980 across each country and Panel B presents the same for the changes through
8In two countries the classification of high skilled workers is different: in Denmark it includespeople in “long cycle” higher education and in Finland it includes people with tertiary educationor higher.
9Using a crosswalk (available from the authors upon request) we calculate the value of totaltrade, imports and exports with the rest of the world and separately with OECD and non-OECDcountries. We identify all 30 countries that were OECD members in 2007 as part of the OECD.
9
2004. The levels have to be interpreted with care as exact comparison of qual-
ifications between countries is difficult, which is why wage bill shares are useful
summary measures as each qualification is weighted by its price (the wage)10.
The ranking of countries looks sensible with the US having the highest share of
high-skilled (29 percent), followed by Finland (27 percent). All countries have ex-
perienced significant skill upgrading as indicated by the growth in the high skilled
wage bill share in column (1) of Panel B, on average the share increased form 14.3
percent in 1980 to 24.3 in 2004.
The UK had the fastest absolute increase in the high-skilled wage bill share
(16.5 percentage points) and is also the country with the largest increase in ICT
intensity. The US had the second largest growth of ICT and the third largest
increase in the high-skilled wage bill share (13.9 percentage points), but all coun-
tries have experienced rapid increases in ICT intensity, which doubled its 1980
share of value added.
The change of the middle education share in column (2) is more uneven. Al-
though the mean growth is positive, it is relatively small compared to the highly
educated (8.7 percentage points on a base of 51.1 percent), with several countries
experiencing no growth or a decrease (the US and the Netherlands). The model
in Appendix A shows how the wage bill share of the middle skilled could rise as
the supply of this type of skill increases, so this supply increase can offset the fall
in relative demand caused by technical change. Moreover, as Figure 2A shows,
although the wage bill share of the middle group rose more rapidly (in percentage
point terms) between 1980 and 1986, it subsequently decelerated. Indeed, in the
last six year sub-period, 1998-2004, the wage bill share of middle skilled workers
actually fell. At the same time, the wage bill share of low skilled workers continued
10Estimating in differences also reduces the suspected bias from international differences asthe definitions are stable within country over time.
10
to decline throughout the period 1980-2004, but at an increasingly slower rate.
Figure 2B shows the US, the technology leader that is often a future indicator
for other nations. From 1998-2004 the wage bill share of the middle educated
declined more rapidly than that of the low skilled workers. Figure 2B is in line
with the finding that while college educated US workers continued to gain rela-
tive to high-school graduates, high-school graduates gained relatively to college
dropouts in the 1980s but not in the 1990s (see Autor, Katz and Kearney, 2008,
Figure 5).
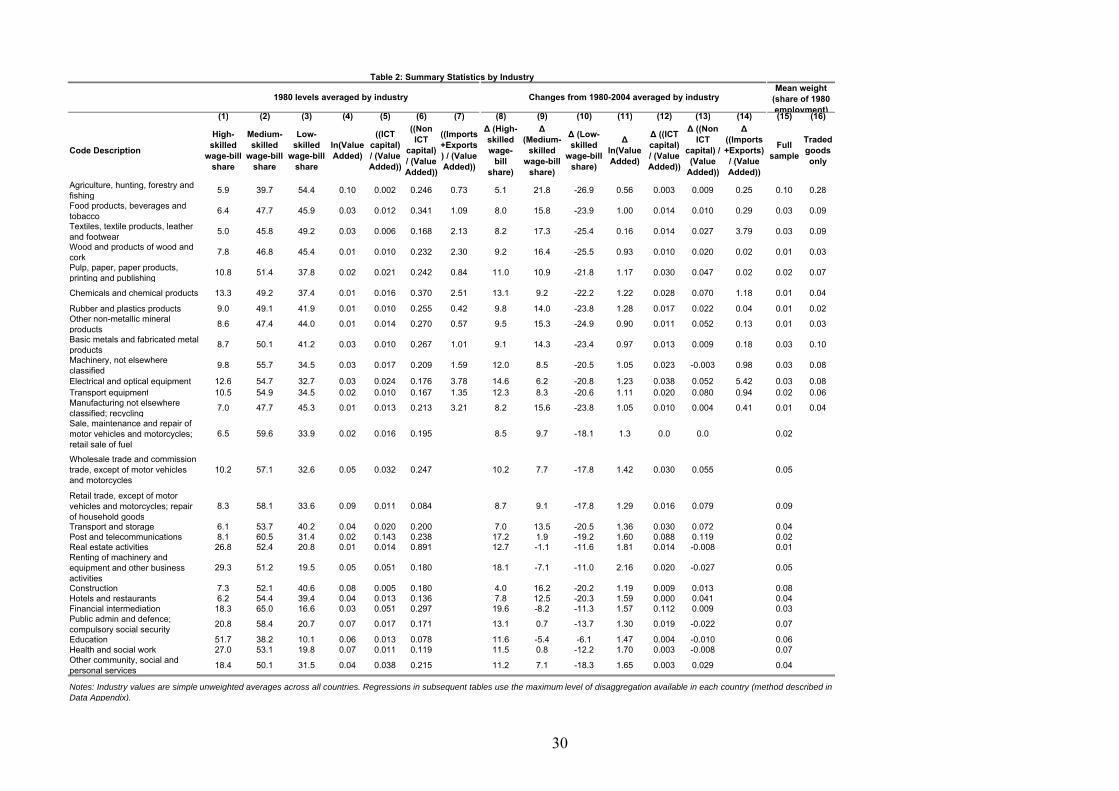
3.2.2. Cross Industry Trends
Table 2 breaks down the data by industry. In levels (column (1)) the highly ed-
ucated were disproportionately clustered into services both in the public sector
(especially education) and private sector (e.g. real estate and business services).
The industries that upgraded rapidly (column (8)) were also mainly services (e.g.
finance, telecoms and business services), but also in manufacturing (e.g. chem-
icals and electrical equipment). At the other end of the skill distribution, the
textile industry, which initially had the lowest wage bill share of skilled workers,
upgraded somewhat more than other low skill industries (transport and storage,
construction, hotels and restaurants, and agriculture). This raises the issue of
mean reversion, so we are careful to later show robustness tests to conditioning
on the initial levels of the skill shares in our regressions. In fact, the ranking of
industries in terms of skill intensity in 1980 and their skill upgrading over the next
25 years was quite similar across countries. This is striking, because the countries
we analyze had different labor market institutions and different institutional ex-
periences over the period we analyze. This suggests something fundamental is at
play that cuts across different sets of institutions.
ICT grew dramatically from 1980-2004, accounting for more than 42 percent
11
of the average increase in capital services. The increased ICT diffusion was also
quite uneven: financial intermediation and telecoms experienced rapid increases
in ICT intensity, while in other industries, such as agriculture, there was almost
no increase.
Figures 3, 4, and 5 plot changes by industry in the wage bill shares of high,
medium, and low skilled workers respectively against changes in ICT intensity.
The top panel of each figure includes all industries with fitted regression lines
(solid line for all industry and dashed line for non-traded sectors only). The
bottom panel (Figure 3B) restricts attention to the traded sectors. Figure 3A
shows that the industries with the fastest ICT upgrading had the largest increase
in the high skilled wage bill share. One might be worried that two service sectors,
Post and Telecoms and Finance, are driving this result, which is one reason Figure
3B drops all the non-traded sectors. In fact, the relationship between high skill
and ICT growth is actually stronger in these “well measured” sectors.
Figure 4 repeats this analysis for the middle educated groups. We observe
the exact opposite relationship to Figure 3: the industries with the faster ICT
growth had the largest fall in the middle skilled share whether we look at the
whole economy (Figure 4A) or just the traded sectors (Figure 4B). Finally, Figure
5 shows that there is essentially no relationship (Figure 5A) or a mildly positive
one (Figure 5B) between the change of the share of the least educated and ICT
growth.
These figures are highly suggestive of empirical support for the hypothesis that
ICT polarizes the skill structure: increasing demand at the top, reducing demand
in the middle and having little effect at the bottom. To examine this link more
rigorously, we now turn to the econometric analysis.
12
4. Econometric Results
4.1. Basic Results
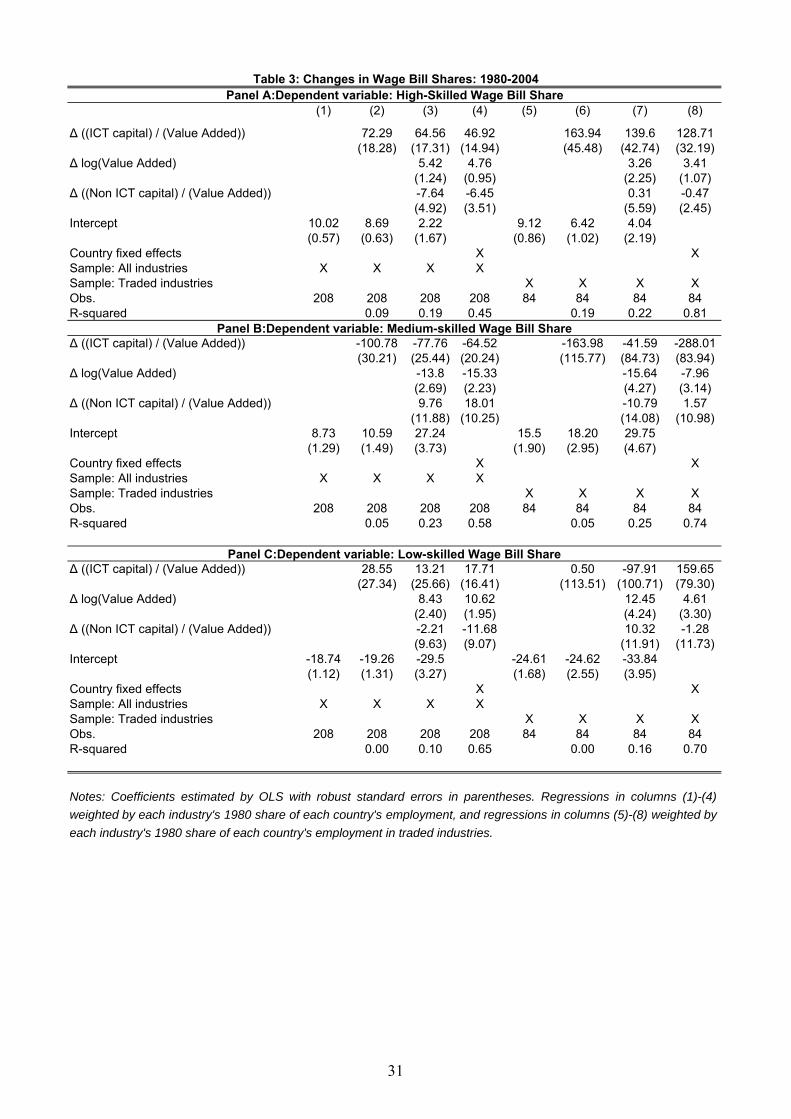
Our first set of results for the skill share regressions at the industry by country pair
level is contained in Table 3. The dependent variable is the change of the wage bill
share of the college-educated in Panel A, the share of the middle educated group
in Panel B and the share of the least educated group in Panel C. All equations are
estimated in 24 year long differences. The first four columns look across the entire
economy and the last four columns condition on the sub-sample of “tradable”
sectors where we have information on imports and exports.
Column (1) of Panel A simply reports the coefficient on the constant that in-
dicates that, on average there was a ten percentage point increase in the college
wage bill share. This is a very large increase, considering the average skill share
in 1980 (across our sample of countries) was only 14%. Column (2) includes the
growth in ICT capital intensity. The technology variable has a large, positive and
significant coefficient and reduces the regression constant to 8.7. The importance
of technology for skill upgrading is consistent with other work, which has found
technology-skill complementarity. Column (3) includes the growth of non-ICT
capital intensity and value added. The coefficient on non-ICT capital is negative
and insignificant, suggesting that there is no sign of capital-skill complementar-
ity. Some studies have found capital-skill complementarity (e.g. Griliches, 1969)
but few of these studies have disaggregated capital into its ICT and non-ICT
components, so the evidence for capital-skill complementarity may be due to ag-
gregating over high-tech capital that is complementary with skills and lower tech
capital that is not. Similarly few studies have looked over such a long time span as
we do in this paper. The coefficient on value added growth is positive and signifi-
cant suggesting that skill upgrading has been occurring more rapidly in the fastest
13
growing sectors (this is consistent with Berman, Rohini and Tan, 2005). Column
(4) includes country fixed effects. This is a demanding specification because the
specification is already in differences so this specification essentially allows for
country specific trends. The coefficient on ICT falls (from 65 to 47) but remains
significant at conventional levels11.
We repeat these specifications for the tradeable industries in the next four
columns. Column (5) shows that the overall increase in the college wage-bill share
from 1980-2004 was 9 percentage points - similar to that in the whole sample.
Columns (6) - (8) add in our measure of ICT and other controls. The coefficient
on ICT in the tradeable sector is positive, highly significant and larger than in
the overall sample (e.g. 129 in column (8)).
Panel B of Table 3 repeats these specifications for middle-skilled workers. Col-
umn (1) shows that overall, the growth of the wage bill share of middle skilled
workers has been 8.7 percentage points over this time period. But as the rest
of the panel shows, the association between the change in middle-skilled workers
and ICT is strongly negative. In column (4), for example, a one percentage point
increase in ICT intensity is associated with a 0.8 percentage point fall in the pro-
portion of middle skilled workers. The absolute magnitudes of the coefficients for
the sample that includes all industries is quite similar to those for college educated
workers.
Panel C holds the low-skilled worker results - the coefficients can all be deduced
from the rest of Table 3, but the standard errors are useful to see. Importantly,
the technology measures appear to be insignificant for this group of workers illus-
trating the point that the main role of ICT appears to be in changing demand
11Including the mineral extraction sectors caused the ICT coefficient to fall from 47 to 45.We also tried including a set of industry dummies in column (4). All the variables becameinsignificant in this specification. This suggests that it is the same industries that are upgradingacross countries.
14
between the top and the middle skill groups12. Since the adding up requirement
means that the coefficients for the least skilled group can be deduced from the
other two skill groups we save space by omitting Panel C in the rest of the Tables.
4.2. Robustness and Extensions
4.2.1. Initial conditions
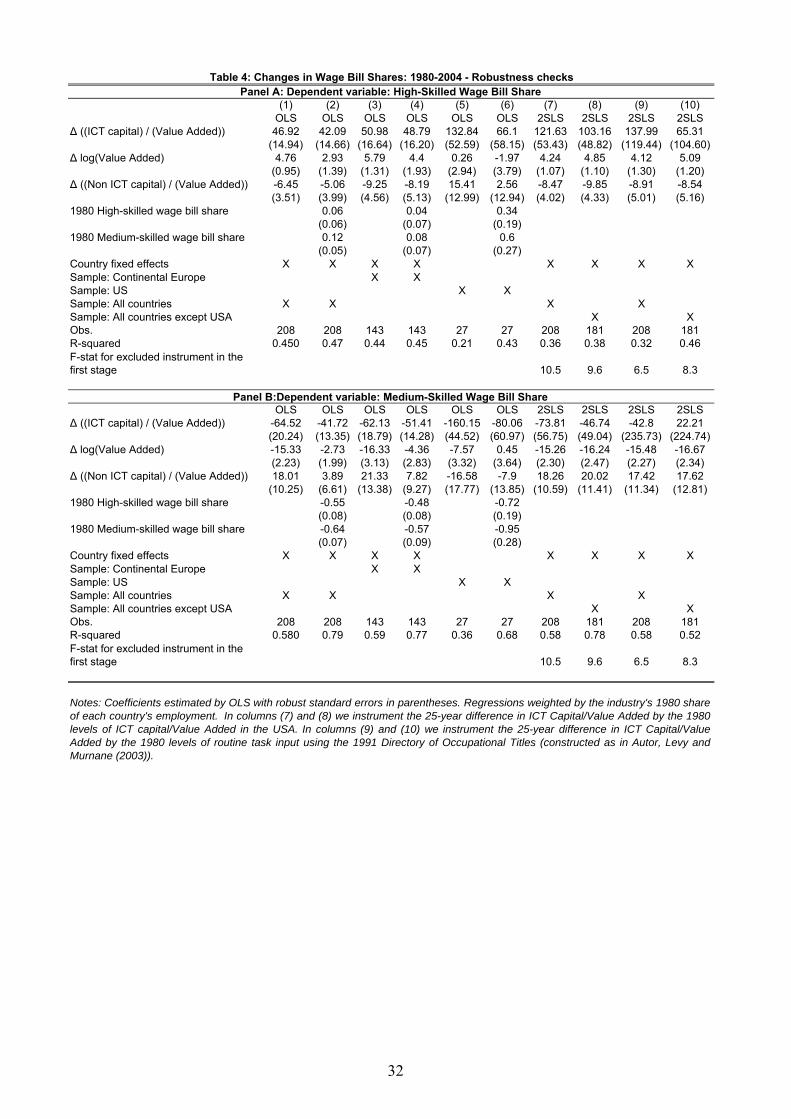
Table 4 examines some robustness checks using the results in our preferred speci-
fication of column (4) of Table 3 (reproduced in the first column). Since there may
be mean reversion we include the level of initial share of skills in 1980 in column
(2). This does not qualitatively alter the results, although coefficient on ICT for
the middle skilled does fall somewhat.
4.2.2. Heterogeneity in the coefficients across countries
Wage inequality rose less in Continental Europe than elsewhere, so it is interesting
to explore whether technological change induced polarization even there. Columns
(3) and (4) restrict the sample to the eight Continental European countries (i.e.
Austria, Denmark, Finland, France, Germany, Italy, Netherlands and Spain) and
show qualitatively similar results to the pooled sample. Unfortunately, the sample
size for most individual countries is rather small preventing a full country by
country analysis13. For example, column (5) shows that the correlation between
ICT and polarization is larger for the US than for the full sample, though column
(5) shows that the estimates become imprecise when we control for baseline levels
of skill composition.
12The difference in the importance of ICT for the middle and lowest skill groups implies thathigh school graduates are not perfect substitutes for college graduates as Card (2009) arguesin the US context. The majority of our data is from outside the US, however, where there arerelatively fewer high school graduates.13Due to the above-mentioned restriction that wage bill data is aggregated for some industries
in most countries.
15
4.2.3. Instrumental variables
One concern is that measurement error in the right hand side variables, especially
ICT, causes attenuation bias14. To mitigate this concern, we use the industry-level
measures of ICT in the US in 1980 as an instrument for ICT upgrading over the
whole sample. The intuition behind this instrument is that the dramatic global
fall in quality-adjusted ICT prices since 1980 (some 15-30% per annum) will dis-
proportionately benefit those industries that (for exogenous technological reasons)
have a greater potential for using ICT inputs. An indicator of this potential is the
initial ICT intensity in the technological leader, the US. In the 2SLS estimates of
column (7) the coefficient on ICT is roughly twice as large as the OLS coefficients
for the college educated group (and significant at the 5 percent level), and a little
bigger for the middle skill group. Column (8) report estimates the same specifica-
tion but this time excluding the US itself, and the results are very similar. We also
considered using the proportion of routine manual tasks in the industry (in the US
in the base year) as an instrument for future ICT growth as these industries were
most likely to be affected by falling ICT prices (see Autor and Dorn, 2009). The
results of using this instrument are shown in columns (9) and (10). Although the
first stages are weaker with this instrument15, these columns again suggest that
we may be under-estimating the importance of ICT by just using OLS - there is
certainly no evidence of downward bias.
14Estimates of the ICT coefficient for the two 12-year sub-periods of our data are typicallyabout half of the absolute magnitude of those for the full period. In general, our estimates forshorter time periods are smaller and less precise, consistent with the importance of measurementerror in the ICT data. For example, in the specification of column (4) of Panel A in Table 3, thecoefficient (standard error) on ICT was 18.30 (10.30) in a pooled 12 year regression. We couldnot reject the hypothesis that the ICT coefficient was stable over time (p-value=0.35).15The signs of the instruments in the first stage are correct. The F-tests is 6.5 in column (7)
compared to 10.5 in column (10).
16
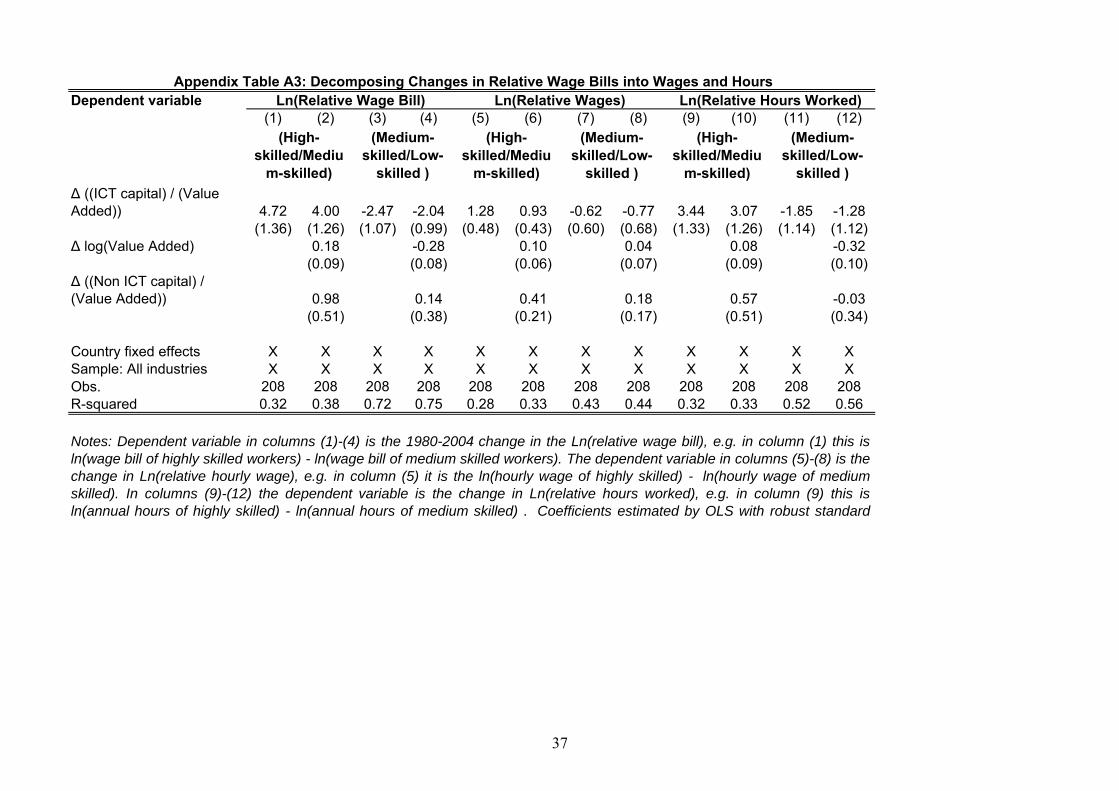
4.2.4. Disaggregating the wage bill into wages and hours
The wage bill share of each skill group reflects its hourly wage and hours worked,
and those of the other skill groups. We now discuss estimates of specifications
that are identical to those in Table 3, except that they allow for a disaggregation
of the dependent variable into the growth of relative skill prices and quantities.
In the first two columns of Appendix Table A3 we reproduce the baseline specifi-
cations using the log relative wage bill (which can be exactly decomposed) as the
dependent variable16. Columns (1) - (4) confirm what we have already seem using
a slightly different functional form: ICT growth is associated with a significant
increase in the demand for high skilled workers relative to middle skilled workers
(first two columns) and with a significant (but smaller) increase for low skilled
workers relative to middle skilled workers (third and fourth column).
For the high vs. middle skill group, ICT growth is significantly associated with
increases in relative wages and relative hours (columns (5), (6), (9) and (10)). In
comparing the middle vs. low groups, the coefficients are also all correctly signed,
but not significant at conventional levels. Overall this suggests that our results
are robust to functional form and the shifting pattern of demand operates both
through wages and hours worked17.
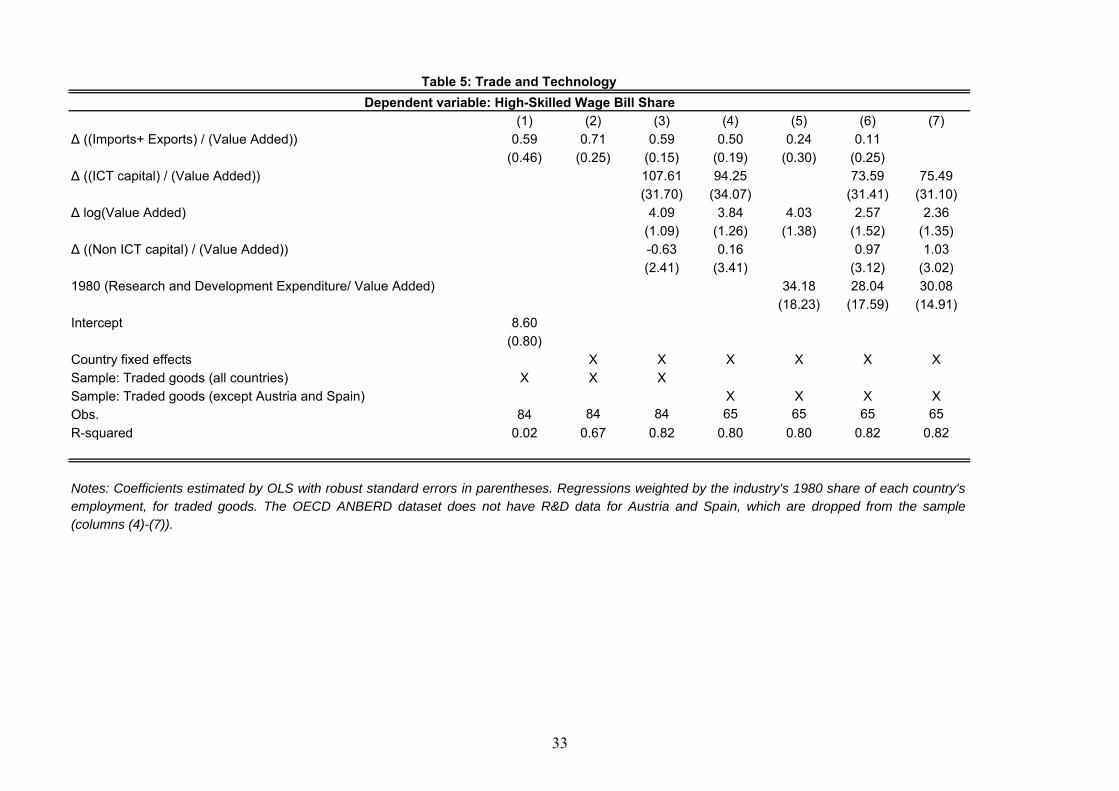
4.3. Trade, R&D and skill upgrading
Having found that technology upgrading is associated with substitution of college-
educated workers for middle-skilled workers, we now examine whether changes in
16Another functional form check was using the growth rate of ICT intensity. For the specifi-cation in column (3) of Panel A in Table 3 we replaced ∆(C/Q) with ∆(C/Q)C/Q . The coefficient(standard error) on ICT growth was 2.586 (1.020). The marginal effect of a one standard devi-ation increase (0.581) is 1.50 (=0.581*2.586), compared with 1.55 (=0.024*64.6) in Table 3.17In examining these results across countries there was some evidence that the adjustment in
wages was stronger in the US and the adjustment in hours was stronger in Continental Europe.This is consistent with the idea of great wage flexibility in the US than in Europe.
17
trade exhibit similar patterns. The first two columns of Table 5 suggest that more
trade openness (measured as the ratio of imports plus exports to value added) is
associated with increases in the wage bill share of college educated workers, at
least once we control for country time trends in column (2). Adding our measures
of ICT, value added and non-ICT capital weakens this result in column (3), but
the trade measure remains significant. However, the last two columns of Table 5
suggests that when we control for initial R&D intensity the association between
trade and skill upgrading becomes much smaller and ceases to be statistically
significant. Column (4) repeats the specification of column (3) for the sub-sample
where we have R&D data and shows that the trade coefficient is robust. Column
(5) includes R&D intensity in a simple specification and shows that the coefficient
on trade halves (from 0.5 to 0.24) and is insignificant, whereas the coefficient on
R&D is positive and significant at the 10 percent level. In column (6) we include
the ICT and non-ICT capital stocks and the coefficient on trade is now 0.11 with
a standard error of 0.25. The final column drops the insignificant trade variable
and shows that ICT and R&D and individually (and jointly) significant.
These findings are consistent with most of the literature that finds that tech-
nology variables have more explanatory power than trade in these kinds of skill
demand equations18. Of course, trade could be influencing skill demand through
affecting the incentives to innovate and adopt new technologies, which is why trade
ceases to be important after we condition on technology (e.g. Draca, Bloom and
Van Reenen, 2009, argue in favor of this trade-induced technical change hypothe-
sis)19. Furthermore, there could be many general equilibrium effects of trade that
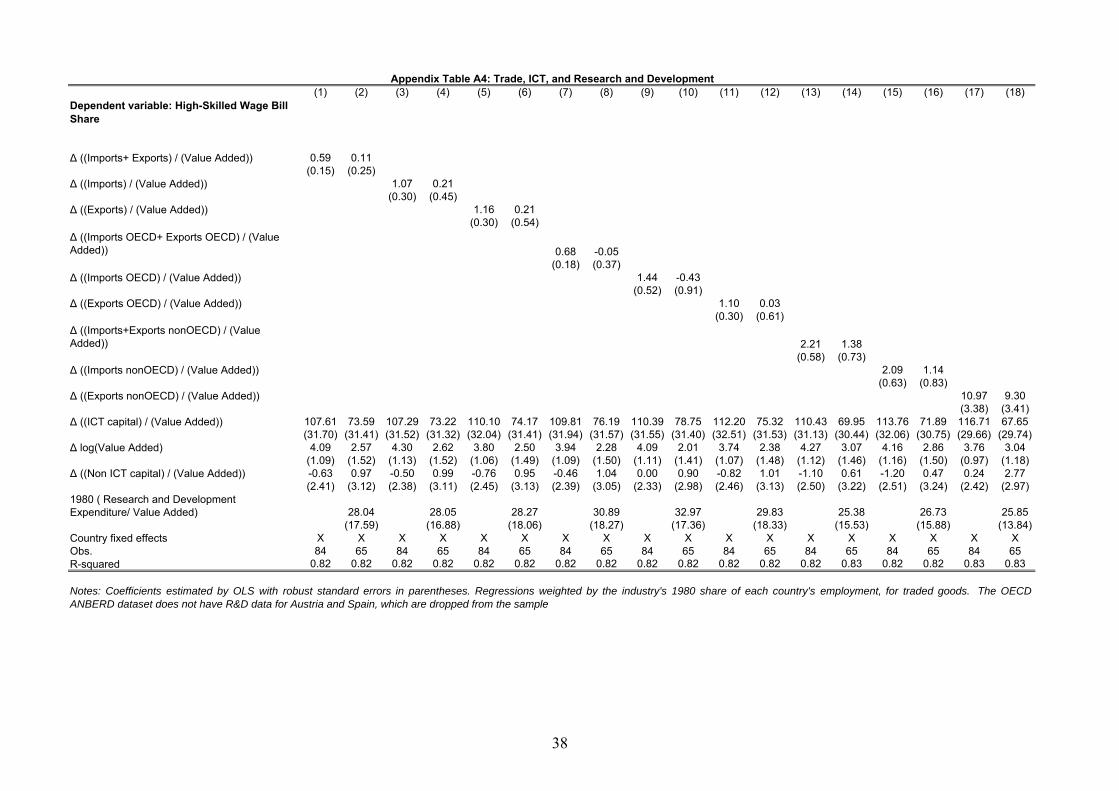
18These are simple industry-level correlations and not general equilibrium calculations, so wemay be missing out the role of trade through other routes.19We further test whether the association between trade and skill upgrading remains similar
when we examine different components of trade separately. Appendix Table A4 suggests thatwhen we examine imports and exports separately, the picture is quite similar. Greater tradeis associated with an increase in the college wage bill share until we control for initial R&D
18
we have not accounted for (these are controlled for by the country time effects).
4.4. Magnitudes
We perform some “back of the envelope” calculations in Table 6 to gauge the
magnitude of the effect of technology on the demand for highly skilled workers.
Column (1) estimates that ICT accounts for 13.2 percent of the increase in the
college share in the whole sample without controls and column (2) reduces this to
8.5 percent with controls. Many authors (e.g. Jorgenson, Ho and Stiroh, 2008)
have argued that value added growth has been strongly affected by ICT growth,
especially in the later period, so column (2) probably underestimates the effect of
ICT. Column (3) reports equivalent calculations for the tradeable sectors. Here,
ICT accounts for 16.5 percent of the change and R&D a further 16.1 percent,
suggesting that observable technology measures by account for almost a third of
the increase in demand for highly skilled workers. If we include controls in column
(4) this falls to 23.1 percent. Finally, columns (5) and (6) reports results for the
IV specification for the whole sample, showing an ICT contribution of ICT of
between 22.1 percent and 27.7 percent20.
We have no general equilibrium model, so these are only “back of the enve-
lope” calculations to give an idea of magnitudes. Furthermore, measurement error
probably means that we are probably underestimating the importance of the vari-
ables. Nevertheless, it seems that our measures of technology are important in
intensity, in which case the coefficient on trade falls and becomes insignificant. Results aresimilar when we analyze separately imports to (or exports from) OECD countries. For non-OECD countries the results are again the same, except for exports to non-OECD countries,which remains positively associated with changes in the college wage-bill share even after weadd all the controls, including R&D. However, it should be noted that the change in exports todeveloping countries is on average very small.20The IV specifications for tradeables show an even larger magnitude. For example in a
specification with full controls, R&D and ICT combined account for over half of all the changein the college wage bill share. The first stage for the IV is weak, however, with an F-statistic of6, these cannot be relied on.
19
explaining a significant proportion of the increase in demand for college educated
workers at the expense of the middle skilled.
5. Conclusions
Recent investigations into the changing demand for skills in OECD countries have
found some evidence for “polarization” in the labour market in the sense that
workers in the middle of the wage and skills distribution appear to have fared
more poorly than those at the bottom and the top. One explanation that has
been advanced for this is that ICT has complemented non-routine analytic tasks
but substituted for routine tasks whilst not affecting non-routine manual tasks
(like cleaning, gardening, childcare, etc.). This implies that many middle-skilled
groups like bank clerks and para-legals performing routine tasks have suffered a
fall in demand. To test this we have estimated industry-level skill share equations
distinguishing three education groups and related this to ICT (and R&D) invest-
ments in eleven countries over 25 years using newly available data. Our findings
are supportive of the ICT-based polarization hypothesis as industries that experi-
enced the fastest growth in ICT also experienced the fastest growth in the demand
for the most educated workers and the fastest falls in demand for workers with
intermediate levels of education. The effects are nontrivial: technical change (as
proxied by ICT and R&D) can account for up to a quarter of the growth of the
college wage bill share in the economy as a whole (and more in the tradeable
sectors).
Although our method is simple and transparent, there are many extensions
that need to be made. First, alternative instrumental variables for ICT would
help identify the causal impact of ICT. As with the existing literature, we do
not have strong instruments for ICT. Second, although we find no direct role
for trade variables, there may be other ways in which globalization influences the
20

labour market, for example by causing firms to “defensively innovate” (Acemoglu,
2003). Third, there are alternative explanations for the improved performance of
the least skilled group through for example, greater demand from richer skilled
workers for the services they provide as market production substitutes for house-
hold production (e.g. childcare, eating out in restaurants, domestic work, etc.)21.
These explanations may complement the mechanism we address here. Finally, we
have not used richer occupational data that would focus on the skill content of
tasks due to the need to have international comparability across countries. The
work of Autor and Dorn (2009) is an important contribution here.
21See Ngai and Pissarides (2007) and Mazzolari and Ragusa (2008).
21
ReferencesAcemoglu, Daron (2003) “Patterns of Skill Premia” Review of Economic Stud-ies, 70(2): 199—230.
Acemoglu, Daron and David Autor (2010) “Skills, Tasks and Technologies:Implications for Employment and Earnings” MIT mimeo
Autor, David, Katz, Lawrence and Krueger, Alan (1998) “ComputingInequality: Have Computers Changed the Labor Market?” Quarterly Journal ofEconomics, 113 (4), 1169-1214
Autor, David H., Katz, Lawrence F. and Kearney, Melissa S. (2006)“The Polarization Of The U.S. Labor Market” American Economic Review vol.96(2), 189-194,
Autor, David H., Katz, Lawrence F. and Kearney, Melissa S. (2008)“Trends in U.S. Wage Inequality: Revising the Revisionists” Review of Economicsand Statistics 90(2), 300-323
Autor, David H., Levy, Frank and Murnane, Richard J. (2003) “The SkillContent Of Recent Technological Change: An Empirical Exploration” QuarterlyJournal of Economics, 118(4), 1279-1333
Autor, David and Dorn, David (2009) “Inequality and Specialization: TheGrowth of Low-Skill Service Jobs in the United States” NBER Working Paper15150Berman, Eli, Bound John and Griliches, Zvi (1994) “Changes in the de-mand for skilled labor within US manufacturing industries: Evidence from theAnnual Survey of Manufacturing”, Quarterly Journal of Economics, 109, 367-98.
Berman, Eli, Rohini Somanathan and Hong Tan. (2005). “Is skill-biasedtechnological change here yet? Evidence from Indian manufacturing in the 1990”Policy Research Working Paper Series 3761, The World Bank.
Black, Sandra E. and Alexandra Spitz-Oener (2010). “Explaining Women’sSuccess: Technological Change and the Skill Content of Women’s Work” Reviewof Economics and Statistics 92(1), 187-194.
Bloom, Nick, Draca, Mirko and Van Reenen, John (2009) “Trade InducedTechnical Change? The impact of Chinese imports on technology, jobs and plantsurvival”, CEP/LSE mimeo
Bond, Stephen and Van Reenen, John (2007) “Micro-econometric models ofinvestment and employment” Chapter 65 in Heckman, J. and Leamer. E. (eds)Handbook of Econometrics Volume 6A, 4417-4498
Brown, R. and L. Christensen (1981), “Estimating elasticities of substitution
22
in a model of partial static equilibrium: an application to US agriculture 1947-74”, in: C. Field and E. Berndt, eds., Modelling and Measuring Natural ResourceSubstitution (MIT Press, Cambridge).
Card, David (2009) “Immigration and Inequality”, NBER Working Paper No.14683Desjonqueres, Thibaut, Machin, Stephen and Van Reenen, John (1999)“Another Nail in the Coffin? Or Can the Trade Based Explanation of ChangingSkill Structures Be Resurrected?” The Scandinavian Journal of Economics, Vol.101, No. 4, pp. 533-554.
DiNardo, John, Fortin, Nicole and Lemieux, Thomas (1996) “LaborMarket Institutions and the Distribution of Wages, 1973-1992: A SemiparametricApproach” Econometrica 64(5), 1001-1044.
DiNardo, John and Pischke, Jorn-Steffen (1997) “The Returns to Com-puter Use Revisited: Have Pencils Changed the Wage Structure Too?” QuarterlyJournal of Economics 112(1), 291-303
Dustmann, Christian, Ludsteck, Johannes and Schonberg, Uta (2009)“Revisiting the GermanWage Structure.”Quarterly Journal of Economics, 124(2),843-881.Feenstra, Robert and Gordon Hanson. (1996) “Foreign Investment, Out-sourcing and Relative Wages” in Robert Feenstra and Gene Grossman, eds., Polit-ical Economy of Trade Policy: Essays in Honor of Jagdish Bhagwati, CambridgeMA: MIT Press.Firpo, Sergio, Nicole Fortin and Thomas Lemieux (2009) “OccupationalTasks and Changes in the Wage Structure” UBC Mimeo.
Goldin, Claudia and Katz, Lawrence F. (2008) The Race between Educationand Technology. Cambridge, MA: Harvard University Press
Goos, Maarten, Manning, Alan and Salomons, Anna (2009) The Polar-ization of the European Labor Market, American Economic Review Papers andProceedings, forthcoming
Goos, Maarten and Manning, Alan (2007) “Lousy and Lovely Jobs: TheRising Polarization of Work in Britain” Review of Economics and Statistics, 89(1),118-133Griliches, Zvi (1969) “Capital-Skill complementarity” Review of Economics andStatistics 51:465-468.Jorgenson, Dale, Mun Ho, and Kevin Stiroh (2008) “A Retrospective Lookat the US Productivity Growth Resurgence”, Journal of Economic Perspectives,22(1), 3-24.
23
Krueger, Alan. (1993) “How computers have changed the wage structure”,Quarterly Journal of Economics., 108, 33-60.
Krugman, Paul. (2008) “Trade and Wages reconsidered”, mimeo prepared forBrookings Panel of Economic Activity, http://www.princeton.edu/~pkrugman/pk-bpea-draft.pdf
Lang, Kevin (2002) “Of Pencils and Computers”, Boston University mimeo
Machin, Stephen and Van Reenen, John (1998) “Technology and Changesin Skill Structure: Evidence from Seven OECD Countries” Quarterly Journal ofEconomics 113, 1215-44.
Matsuyama, Kiminori. (2007) “Beyond Icebergs: Towards a Theory of BiasedGlobalization” Review of Economic Studies 74, 237—253
Mazzolari, Francesca and Giuseppe Ragusa (2008) “Spillovers from High-Skill Consumption to Low-Skill Labor Markets.” Mimeograph, University of Cal-ifornia at IrvineNgai, L. Rachel and Pissarides, Christopher (2007) “Structural Change ina Multisector Model of Growth.” American Economic Review, 97(1), 429-443.
Spitz-Oener, Alexandra (2006) “Technical Change, Job Tasks, and Rising Ed-ucational Demands: Looking Outside the Wage Structure,” Journal of Labor Eco-nomics 24(2) 235—270.
Smith, Christopher L. (2008) “Implications of Adult Labor Market Polariza-tion for Youth Employment Opportunities.” MIT working paper
Timmer, Marcel, Ton van Moergastel, Edwin Stuivenwold , GeradYpma, Mary O’Mahony andMari Kangasniemi (2007) “EUKLEMSGrowthand Productivity Accounts Version 1.0”, University of Gronigen mimeo
Wood, Adrian. (1994) North-South Trade, Employment and Inequality, Chang-ing Fortunes in a Skill-Driven World, Clarendon, Oxford.
A. Theory Appendix: A simple model of the effect of ICTon demand for three skill groups.
We present a simple model that illustrates how we could derive the relationshipswe observe in the data. The exogenous variable is an increase in ICT capitalgenerated by a large fall in ICT prices. The prediction is that we can observe anincrease in the share of the high skilled and a decline in the share of the middle
24
skilled. Note that an increase in the supply of the middle skilled will also generatean increase in their wage bill share.The model below considers an aggregate (sectoral) production function using
three labor inputs: low skilled (L), middle skilled (M), and high skilled (H)workers and ICT capital (C). The model also assumes a constant elasticity ofsubstitution σ = 1
1−ρ > 1 between the three types of (ICT-augmented) laborinputs, so ρ ∈ (0, 1). We assume that output, Q, is produced using the followingproduction function:
Q =hαLL
ρ + (αMM + βC)ρ + (αHHμ + γCμ)ρ/μ
i 1ρ,
where αj denotes the effectiveness of each type of labor, j ∈ {L,M,H}. β mea-sures the effectiveness of ICT in substituting middle skilled labor and γ measuresICT effectiveness in complementing high skilled labor. The model assumes thatICT capital (C) is a substitute for middle skilled workers, and a complement tohigh skilled labor, where η = 1
1−μ ∈ (0, 1), so μ < 0. Note that the model onlytreats the relationship between C and H in exactly the opposite way from therelationship between C and M if η −→ 0 (or equivalently μ −→ −∞).Assuming perfect competition, the wage of the three types of labor and the
cost of ICT are:
wH =hαLL
ρ + (αMM + βC)ρ + (αHHμ + γCμ)ρ/μ
i 1ρ−1(αHH
μ + γCμ)(ρ/μ)−1 αHHμ−1
wM =hαLL
ρ + (αMM + βC)ρ + (αHHμ + γCμ)ρ/μ
i 1ρ−1(αMM + βC)ρ−1 αM
wL =hαLL
ρ + (αMM + βC)ρ + (αHHμ + γCμ)ρ/μ
i 1ρ−1
αLLρ−1
p =hαLL
ρ + (αMM + βC)ρ + (αHHμ + γCμ)ρ/μ
i 1ρ−1
∗h(αMM + βC)ρ−1 β + (αHH
μ + γCμ)(ρ/μ)−1 γCμ−1i
=β
αMwM +
γCμ−1
αHHμ−1wH
In this model an increase in ICT raises the wage of high skilled and low skilledworkers, but has an ambiguous effect on the wage of middle skilled workers:
∂wH
∂C> 0,
∂wL
∂C> 0.
25

The wage bill shares of the three types of labor are:
θH =wHH
wLL+ wMM + wHH=
=(αHH
μ + γCμ)(ρ/μ)−1 αHHμ
αLLρ + αM
³αMM
−ρ1−ρ + βCM
−11−ρ´ρ−1
+ (αHHμ + γCμ)(ρ/μ)−1 αHHμ
θM =wMM
wLL+ wMM + wHH=
=αM
³αMM
−ρ1−ρ + βCM
−11−ρ´ρ−1
αLLρ + αM
³αMM
−ρ1−ρ + βCM
−11−ρ´ρ−1
+ (αHHμ + γCμ)(ρ/μ)−1 αHHμ
θL =wLL
wLL+ wMM + wHH=
=αLL
ρ
αLLρ + αM
³αMM
−ρ1−ρ + βCM
−11−ρ´ρ−1
+ (αHHμ + γCμ)(ρ/μ)−1 αHHμ
One can verify that in this specification:
∂θH∂C
> 0,∂θM∂C
< 0,
so increased supply of ICT raises the college wage bill share and reduces the middleskilled wage bill share. The ratio of the wage bill of high (middle) skilled workersto low skilled workers increases (decreases) with ICT:
∂
∂C
µwHH
wLL
¶=
∂
∂C
"(αHH
μ + γCμ)(ρ/μ)−1 αHHμ
αLLρ
#> 0
∂
∂C
µwMM
wLL
¶=
∂
∂C
⎡⎢⎣αM
³αMM
−ρ1−ρ + βCM
−11−ρ´ρ−1
αLLρ
⎤⎥⎦ < 0
Note that an increase in the supply of middle skilled workers raises their wagebill relative to low skilled workers:
∂
∂M
µwMM
wLL
¶=
∂
∂M
⎡⎢⎣αM
³αMM
−ρ1−ρ + βCM
−11−ρ´ρ−1
αLLρ
⎤⎥⎦ > 0
26
B. Data Appendix
Our main dataset is EUKLEMS (http://www.euklems.net/), which is an industry-level panel dataset created by economic researchers funded by the European Com-mission. It covers the European Union, the US, Japan, and other countries, andcontains a wealth of information on productivity-related variables. These wereconstructed through joint work with census bureaus in each country and aredesigned to be internationally comparable. Details of the methodology are inTimmer et al (2007).In the construction of our sample we faced a number of technical issues. First,
although college wage bill shares are reported for 30 industries in each country,these reported wage bill shares are not unique within each country. For example, ina certain country the reported college wage bill share for industry A and industryB may be (college wage bill in A + college wage bill in B)/(total wage bill in A +total wage bill in B). The identity and number of industries pooled together varyacross countries. In order to use as much of variation as possible, we aggregateindustries within each country up to the lowest level of aggregation that ensuresthat the college wage bill share is unique across the aggregated observations. Thisis also sufficient to ensure that other variables we use, such as our ICT and valueadded measures, have unique values across observations.Second, as a measure of ICT intensity we use ICT capital compensation divided
by value added directly from EUKLEMs. ICT capital is built using the PerpetualInventory method based on real ICT investment flows (using a quality-adjustedprice deflator). ICT capital compensation is the stock of ICT capital multipliedby its user cost. Non-ICT capital compensation is built in the same way22.Third, matching trade variables into our main dataset required data required
currency conversions, since EUKLEMS reports data in historical local currencyand COMTRADE reports data in historical dollars. To overcome this difference,we convert nominal values to current US Dollars using exchange rates from theIMF IFS website. To convert national currency to the Euro (for Eurozone coun-tries), we use exchange rates from the website:http://ec.europa.eu/economy_finance/euro/transition/conversion_rates.htm
22Because EUKLEMS calculates capital compensation as a residual in a few cases observationscan have negative capital compensation. Of the 208 country-industry cells we use, negativecapital compensation occurs in 12 cases in 1980 and in 3 cases in 2004. These are typicallyagriculture (which is heavily subsidized and becomes smaller over time) and industries wherepublic services play an important role (e.g. education and health). To overcome this problem,we bottom-coded negative values of ICT and non-ICT capital compensation to zero. Our resultsare robust to dropping these observations from the sample.
27
We use trade figures from the UN’s COMTRADE dataset. Data is downloadedin the four digit Standard International Trade Classification format (revision 2),and converted to the European NACE Rev 1 classification used in the EUKLEMSdataset (concordance available on request). Our trade regressions contain theupdated data from 21st March 2008.To decompose trade into OECD versus non-OECD, we use the 2007 defin-
ition of OECD countries (Austria, Australia, Belgium, Canada, the Czech Re-public, Denmark, Finland, France, Germany, Greece, Hungary, Iceland, Ireland,Italy, Japan, Korea, Luxembourg, Mexico, the Netherlands, New Zealand, Nor-way, Poland, Portugal, the Slovak Republic, Spain, Sweden, Switzerland, Turkey,the UK and the USA). This means that Czechoslovakia and Belgium-Luxembourgwere treated as OECD countries in 1980.Finally, we account for the fact that the (aggregated) industries we use differ
substantially in their employment shares within each country’s population. Wetherefore use the employment shares of each industry in 1980 (our base year)in total employment as analytical weights in the regressions using both tradableand non-tradable industries. For trade regressions, which use only the tradedindustries, each industry’s weight is its employment share in the traded industriesfor that country, so that the sum of weights for each country is still equal to one.
28
(1) (2) (3) (4) (5) (6) (7)
Country (High-skilled wage-bill share)
(Medium-skilled wage-bill share)
(Low-skilled wage-bill share)
log(Value Added)
((ICT capital) / (Value Added))
((Non ICT capital) / (Value Added))
((Imports+Exports) / (Value Added))
Austria 8.8 51.6 39.6 8.0 0.012 0.227 1.43Denmark 5.3 50.5 44.2 7.8 0.029 0.174 2.24Finland 26.9 28.5 44.6 7.6 0.015 0.195 1.36France 11.2 49.6 39.2 10.1 0.011 0.158 1.23
Germany 9.4 66.0 24.7 10.3 0.020 0.168 1.31Italy 5.8 86.9 7.3 9.7 0.021 0.174 0.91
Japan 17.7 49.0 33.2 10.8 0.016 0.230 0.55Netherlands 21.6 62.1 16.3 8.8 0.012 0.155 3.39
Spain 12.7 9.6 77.7 9.1 0.021 0.265 0.53UK 9.2 52.7 38.1 9.8 0.019 0.180 1.54
USA 28.7 56.0 15.3 11.6 0.016 0.224 0.54
Mean 14.3 51.1 34.6 9.4 0.018 0.195 0.67
Country Δ (College wage-bill share)
Δ (Medium-skilled wage-bill share)
Δ (Low-skilled wage-bill share)
Δ log(Value Added)
Δ ((ICT capital) / (Value Added))
Δ ((Non ICT capital) / (Value Added))
Δ((Imports+Exports) / (Value Added))
Austria 5.4 15.5 -20.9 1.2 0.014 0.010 0.87Denmark 4.1 17.8 -21.9 1.3 0.013 -0.011 1.26Finland 15.2 12.0 -27.2 1.2 0.022 -0.001 0.36France 7.7 14.1 -21.8 1.1 0.021 0.066 0.99
Germany 6.3 0.1 -6.4 1.1 0.007 0.023 1.03Italy 5.3 1.6 -6.9 1.2 0.020 0.051 0.55
Japan 10.8 11.5 -22.3 1.1 0.013 0.035 0.33Netherlands 13.1 -2.9 -10.1 1.3 0.023 0.041 3.01
Spain 11.9 19.0 -30.9 1.5 0.006 0.056 1.13UK 16.5 12.6 -29.1 1.3 0.032 -0.031 1.26
USA 13.9 -5.1 -8.8 1.4 0.028 0.032 0.62
Mean 10.0 8.7 -18.8 1.2 0.018 0.025 0.67
Notes: The table reports means weighted by 1980 share of each country's employment. All variables are measured for the full sample, except for trade variables,measured only for traded goods.
Panel A: 1980 levels averaged by countryTable 1: Summary Statistics by Country
Panel B: Changes from 1980-2004, averaged by country
29
(1) (2) (3) (4) (5) (6) (7) (8) (9) (10) (11) (12) (13) (14) (15) (16)
Code Description
High-skilled
wage-bill share
Medium-skilled
wage-bill share
Low-skilled
wage-bill share
ln(Value Added)
((ICT capital) / (Value Added))
((Non ICT
capital) / (Value Added))
((Imports+Exports) / (Value Added))
Δ (High-skilled wage-
bill share)
Δ (Medium-
skilled wage-bill
share)
Δ (Low-skilled
wage-bill share)
Δ ln(Value Added)
Δ ((ICT capital) / (Value Added))
Δ ((Non ICT
capital) / (Value
Added))
Δ ((Imports+Exports) / (Value Added))
Full sample
Traded goods only
Agriculture, hunting, forestry and fishing 5.9 39.7 54.4 0.10 0.002 0.246 0.73 5.1 21.8 -26.9 0.56 0.003 0.009 0.25 0.10 0.28
Food products, beverages and tobacco 6.4 47.7 45.9 0.03 0.012 0.341 1.09 8.0 15.8 -23.9 1.00 0.014 0.010 0.29 0.03 0.09
Textiles, textile products, leather and footwear 5.0 45.8 49.2 0.03 0.006 0.168 2.13 8.2 17.3 -25.4 0.16 0.014 0.027 3.79 0.03 0.09
Wood and products of wood and cork 7.8 46.8 45.4 0.01 0.010 0.232 2.30 9.2 16.4 -25.5 0.93 0.010 0.020 0.02 0.01 0.03
Pulp, paper, paper products, printing and publishing 10.8 51.4 37.8 0.02 0.021 0.242 0.84 11.0 10.9 -21.8 1.17 0.030 0.047 0.02 0.02 0.07
Chemicals and chemical products 13.3 49.2 37.4 0.01 0.016 0.370 2.51 13.1 9.2 -22.2 1.22 0.028 0.070 1.18 0.01 0.04
Rubber and plastics products 9.0 49.1 41.9 0.01 0.010 0.255 0.42 9.8 14.0 -23.8 1.28 0.017 0.022 0.04 0.01 0.02Other non-metallic mineral products 8.6 47.4 44.0 0.01 0.014 0.270 0.57 9.5 15.3 -24.9 0.90 0.011 0.052 0.13 0.01 0.03
Basic metals and fabricated metal products 8.7 50.1 41.2 0.03 0.010 0.267 1.01 9.1 14.3 -23.4 0.97 0.013 0.009 0.18 0.03 0.10
Machinery, not elsewhere classified 9.8 55.7 34.5 0.03 0.017 0.209 1.59 12.0 8.5 -20.5 1.05 0.023 -0.003 0.98 0.03 0.08
Electrical and optical equipment 12.6 54.7 32.7 0.03 0.024 0.176 3.78 14.6 6.2 -20.8 1.23 0.038 0.052 5.42 0.03 0.08Transport equipment 10.5 54.9 34.5 0.02 0.010 0.167 1.35 12.3 8.3 -20.6 1.11 0.020 0.080 0.94 0.02 0.06Manufacturing not elsewhere classified; recycling 7.0 47.7 45.3 0.01 0.013 0.213 3.21 8.2 15.6 -23.8 1.05 0.010 0.004 0.41 0.01 0.04
Sale, maintenance and repair of motor vehicles and motorcycles; retail sale of fuel
6.5 59.6 33.9 0.02 0.016 0.195 8.5 9.7 -18.1 1.3 0.0 0.0 0.02
Wholesale trade and commission trade, except of motor vehicles and motorcycles
10.2 57.1 32.6 0.05 0.032 0.247 10.2 7.7 -17.8 1.42 0.030 0.055 0.05
Retail trade, except of motor vehicles and motorcycles; repair of household goods
8.3 58.1 33.6 0.09 0.011 0.084 8.7 9.1 -17.8 1.29 0.016 0.079 0.09
Transport and storage 6.1 53.7 40.2 0.04 0.020 0.200 7.0 13.5 -20.5 1.36 0.030 0.072 0.04 Post and telecommunications 8.1 60.5 31.4 0.02 0.143 0.238 17.2 1.9 -19.2 1.60 0.088 0.119 0.02 Real estate activities 26.8 52.4 20.8 0.01 0.014 0.891 12.7 -1.1 -11.6 1.81 0.014 -0.008 0.01 Renting of machinery and equipment and other business activities
29.3 51.2 19.5 0.05 0.051 0.180 18.1 -7.1 -11.0 2.16 0.020 -0.027 0.05
Construction 7.3 52.1 40.6 0.08 0.005 0.180 4.0 16.2 -20.2 1.19 0.009 0.013 0.08 Hotels and restaurants 6.2 54.4 39.4 0.04 0.013 0.136 7.8 12.5 -20.3 1.59 0.000 0.041 0.04 Financial intermediation 18.3 65.0 16.6 0.03 0.051 0.297 19.6 -8.2 -11.3 1.57 0.112 0.009 0.03 Public admin and defence; compulsory social security 20.8 58.4 20.7 0.07 0.017 0.171 13.1 0.7 -13.7 1.30 0.019 -0.022 0.07
Education 51.7 38.2 10.1 0.06 0.013 0.078 11.6 -5.4 -6.1 1.47 0.004 -0.010 0.06 Health and social work 27.0 53.1 19.8 0.07 0.011 0.119 11.5 0.8 -12.2 1.70 0.003 -0.008 0.07 Other community, social and personal services 18.4 50.1 31.5 0.04 0.038 0.215 11.2 7.1 -18.3 1.65 0.003 0.029 0.04
Notes: Industry values are simple unweighted averages across all countries. Regressions in subsequent tables use the maximum level of disaggregation available in each country (method described inData Appendix).
1980 levels averaged by industryMean weight
(share of 1980 employment)
Table 2: Summary Statistics by Industry
Changes from 1980-2004 averaged by industry
30
(1) (2) (3) (4) (5) (6) (7) (8)
Δ ((ICT capital) / (Value Added)) 72.29 64.56 46.92 163.94 139.6 128.71(18.28) (17.31) (14.94) (45.48) (42.74) (32.19)
Δ log(Value Added) 5.42 4.76 3.26 3.41(1.24) (0.95) (2.25) (1.07)
Δ ((Non ICT capital) / (Value Added)) -7.64 -6.45 0.31 -0.47(4.92) (3.51) (5.59) (2.45)
Intercept 10.02 8.69 2.22 9.12 6.42 4.04(0.57) (0.63) (1.67) (0.86) (1.02) (2.19)
Country fixed effects X XSample: All industries X X X XSample: Traded industries X X X XObs. 208 208 208 208 84 84 84 84R-squared 0.09 0.19 0.45 0.19 0.22 0.81
Δ ((ICT capital) / (Value Added)) -100.78 -77.76 -64.52 -163.98 -41.59 -288.01(30.21) (25.44) (20.24) (115.77) (84.73) (83.94)
Δ log(Value Added) -13.8 -15.33 -15.64 -7.96(2.69) (2.23) (4.27) (3.14)
Δ ((Non ICT capital) / (Value Added)) 9.76 18.01 -10.79 1.57(11.88) (10.25) (14.08) (10.98)
Intercept 8.73 10.59 27.24 15.5 18.20 29.75(1.29) (1.49) (3.73) (1.90) (2.95) (4.67)
Country fixed effects X XSample: All industries X X X XSample: Traded industries X X X XObs. 208 208 208 208 84 84 84 84R-squared 0.05 0.23 0.58 0.05 0.25 0.74
Δ ((ICT capital) / (Value Added)) 28.55 13.21 17.71 0.50 -97.91 159.65(27.34) (25.66) (16.41) (113.51) (100.71) (79.30)
Δ log(Value Added) 8.43 10.62 12.45 4.61(2.40) (1.95) (4.24) (3.30)
Δ ((Non ICT capital) / (Value Added)) -2.21 -11.68 10.32 -1.28(9.63) (9.07) (11.91) (11.73)
Intercept -18.74 -19.26 -29.5 -24.61 -24.62 -33.84(1.12) (1.31) (3.27) (1.68) (2.55) (3.95)
Country fixed effects X XSample: All industries X X X XSample: Traded industries X X X XObs. 208 208 208 208 84 84 84 84R-squared 0.00 0.10 0.65 0.00 0.16 0.70
Notes: Coefficients estimated by OLS with robust standard errors in parentheses. Regressions in columns (1)-(4)weighted by each industry's 1980 share of each country's employment, and regressions in columns (5)-(8) weighted byeach industry's 1980 share of each country's employment in traded industries.
Table 3: Changes in Wage Bill Shares: 1980-2004
Panel B:Dependent variable: Medium-skilled Wage Bill Share
Panel A:Dependent variable: High-Skilled Wage Bill Share
Panel C:Dependent variable: Low-skilled Wage Bill Share
31
(1) (2) (3) (4) (5) (6) (7) (8) (9) (10)OLS OLS OLS OLS OLS OLS 2SLS 2SLS 2SLS 2SLS
Δ ((ICT capital) / (Value Added)) 46.92 42.09 50.98 48.79 132.84 66.1 121.63 103.16 137.99 65.31(14.94) (14.66) (16.64) (16.20) (52.59) (58.15) (53.43) (48.82) (119.44) (104.60)
Δ log(Value Added) 4.76 2.93 5.79 4.4 0.26 -1.97 4.24 4.85 4.12 5.09(0.95) (1.39) (1.31) (1.93) (2.94) (3.79) (1.07) (1.10) (1.30) (1.20)
Δ ((Non ICT capital) / (Value Added)) -6.45 -5.06 -9.25 -8.19 15.41 2.56 -8.47 -9.85 -8.91 -8.54(3.51) (3.99) (4.56) (5.13) (12.99) (12.94) (4.02) (4.33) (5.01) (5.16)
1980 High-skilled wage bill share 0.06 0.04 0.34(0.06) (0.07) (0.19)
1980 Medium-skilled wage bill share 0.12 0.08 0.6(0.05) (0.07) (0.27)
Country fixed effects X X X X X X X XSample: Continental Europe X XSample: US X XSample: All countries X X X XSample: All countries except USA X XObs. 208 208 143 143 27 27 208 181 208 181R-squared 0.450 0.47 0.44 0.45 0.21 0.43 0.36 0.38 0.32 0.46F-stat for excluded instrument in the first stage 10.5 9.6 6.5 8.3
OLS OLS OLS OLS OLS OLS 2SLS 2SLS 2SLS 2SLSΔ ((ICT capital) / (Value Added)) -64.52 -41.72 -62.13 -51.41 -160.15 -80.06 -73.81 -46.74 -42.8 22.21
(20.24) (13.35) (18.79) (14.28) (44.52) (60.97) (56.75) (49.04) (235.73) (224.74)Δ log(Value Added) -15.33 -2.73 -16.33 -4.36 -7.57 0.45 -15.26 -16.24 -15.48 -16.67
(2.23) (1.99) (3.13) (2.83) (3.32) (3.64) (2.30) (2.47) (2.27) (2.34)Δ ((Non ICT capital) / (Value Added)) 18.01 3.89 21.33 7.82 -16.58 -7.9 18.26 20.02 17.42 17.62
(10.25) (6.61) (13.38) (9.27) (17.77) (13.85) (10.59) (11.41) (11.34) (12.81)1980 High-skilled wage bill share -0.55 -0.48 -0.72
(0.08) (0.08) (0.19)1980 Medium-skilled wage bill share -0.64 -0.57 -0.95
(0.07) (0.09) (0.28)Country fixed effects X X X X X X X XSample: Continental Europe X XSample: US X XSample: All countries X X X XSample: All countries except USA X XObs. 208 208 143 143 27 27 208 181 208 181R-squared 0.580 0.79 0.59 0.77 0.36 0.68 0.58 0.78 0.58 0.52F-stat for excluded instrument in the first stage 10.5 9.6 6.5 8.3
Notes: Coefficients estimated by OLS with robust standard errors in parentheses. Regressions weighted by the industry's 1980 shareof each country's employment. In columns (7) and (8) we instrument the 25-year difference in ICT Capital/Value Added by the 1980levels of ICT capital/Value Added in the USA. In columns (9) and (10) we instrument the 25-year difference in ICT Capital/ValueAdded by the 1980 levels of routine task input using the 1991 Directory of Occupational Titles (constructed as in Autor, Levy andMurnane (2003)).
Table 4: Changes in Wage Bill Shares: 1980-2004 - Robustness checksPanel A: Dependent variable: High-Skilled Wage Bill Share
Panel B:Dependent variable: Medium-Skilled Wage Bill Share
32
(1) (2) (3) (4) (5) (6) (7)Δ ((Imports+ Exports) / (Value Added)) 0.59 0.71 0.59 0.50 0.24 0.11
(0.46) (0.25) (0.15) (0.19) (0.30) (0.25)Δ ((ICT capital) / (Value Added)) 107.61 94.25 73.59 75.49
(31.70) (34.07) (31.41) (31.10)Δ log(Value Added) 4.09 3.84 4.03 2.57 2.36
(1.09) (1.26) (1.38) (1.52) (1.35)Δ ((Non ICT capital) / (Value Added)) -0.63 0.16 0.97 1.03
(2.41) (3.41) (3.12) (3.02)1980 (Research and Development Expenditure/ Value Added) 34.18 28.04 30.08
(18.23) (17.59) (14.91)Intercept 8.60
(0.80)Country fixed effects X X X X X XSample: Traded goods (all countries) X X XSample: Traded goods (except Austria and Spain) X X X XObs. 84 84 84 65 65 65 65R-squared 0.02 0.67 0.82 0.80 0.80 0.82 0.82
Table 5: Trade and TechnologyDependent variable: High-Skilled Wage Bill Share
Notes: Coefficients estimated by OLS with robust standard errors in parentheses. Regressions weighted by the industry's 1980 share of each country'semployment, for traded goods. The OECD ANBERD dataset does not have R&D data for Austria and Spain, which are dropped from the sample(columns (4)-(7)).
33
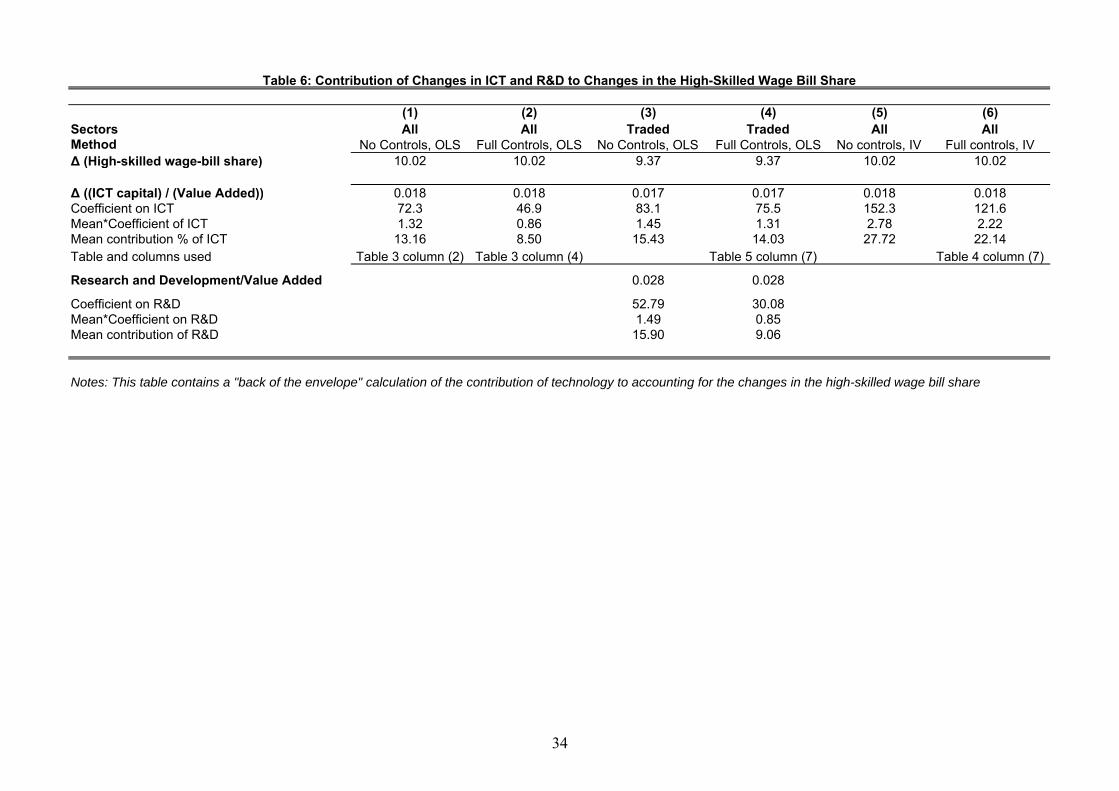
(1) (2) (3) (4) (5) (6)Sectors All All Traded Traded All AllMethod No Controls, OLS Full Controls, OLS No Controls, OLS Full Controls, OLS No controls, IV Full controls, IVΔ (High-skilled wage-bill share) 10.02 10.02 9.37 9.37 10.02 10.02
Δ ((ICT capital) / (Value Added)) 0.018 0.018 0.017 0.017 0.018 0.018Coefficient on ICT 72.3 46.9 83.1 75.5 152.3 121.6Mean*Coefficient of ICT 1.32 0.86 1.45 1.31 2.78 2.22Mean contribution % of ICT 13.16 8.50 15.43 14.03 27.72 22.14Table and columns used Table 3 column (2) Table 3 column (4) Table 5 column (7) Table 4 column (7)
Research and Development/Value Added 0.028 0.028
Coefficient on R&D 52.79 30.08Mean*Coefficient on R&D 1.49 0.85Mean contribution of R&D 15.90 9.06
Table 6: Contribution of Changes in ICT and R&D to Changes in the High-Skilled Wage Bill Share
Notes: This table contains a "back of the envelope" calculation of the contribution of technology to accounting for the changes in the high-skilled wage bill share
34
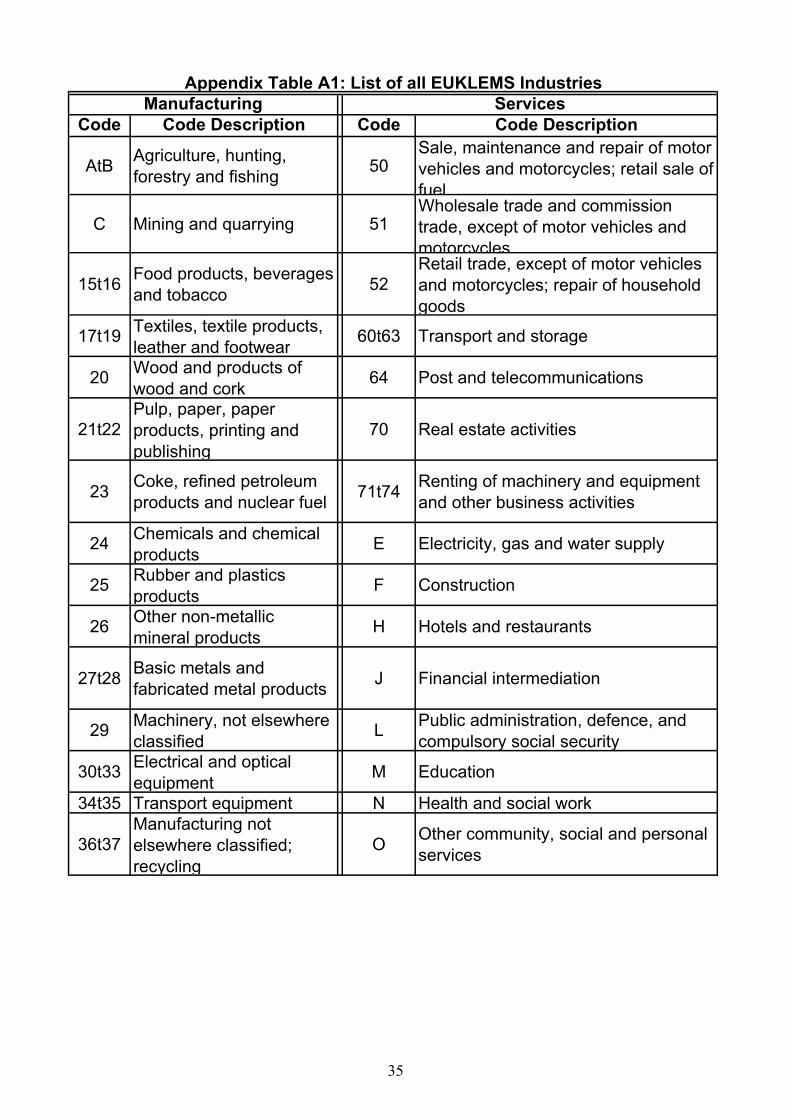
Code Code Description Code Code Description
AtB Agriculture, hunting, forestry and fishing 50
Sale, maintenance and repair of motor vehicles and motorcycles; retail sale of fuel
C Mining and quarrying 51Wholesale trade and commission trade, except of motor vehicles and motorcycles
15t16 Food products, beverages and tobacco 52
Retail trade, except of motor vehicles and motorcycles; repair of household goods
17t19 Textiles, textile products, leather and footwear 60t63 Transport and storage
20 Wood and products of wood and cork 64 Post and telecommunications
21t22Pulp, paper, paper products, printing and publishing
70 Real estate activities
23 Coke, refined petroleum products and nuclear fuel 71t74 Renting of machinery and equipment
and other business activities
24 Chemicals and chemical products E Electricity, gas and water supply
25 Rubber and plastics products F Construction
26 Other non-metallic mineral products H Hotels and restaurants
27t28 Basic metals and fabricated metal products J Financial intermediation
29 Machinery, not elsewhere classified L Public administration, defence, and
compulsory social security
30t33 Electrical and optical equipment M Education
34t35 Transport equipment N Health and social work
36t37Manufacturing not elsewhere classified; recycling
O Other community, social and personal services
Appendix Table A1: List of all EUKLEMS IndustriesManufacturing Services
35
NACE codes
Austria 15t16 plus 17t19 plus 36t37; 20 plus 21t22 plus 24 plus 25 plus 26 plus 27t28; 29 plus 30t33 plus 34t35; 50 plus 51 plus 52 plus H; 60t63; 64; 70 plus 71t74; AtB; F; J; L; M; N; O
Denmark 15t16; 17t19; 36t37; 20; 21t22; 24; 25; 26; 27t28; 29; 30t33; 34t35; 50; 51; 52; H; 60t63; 64; 70; 71t74; AtB; F; J; L; M; N; O
Finland 15t16 plus 17t19 plus 36t37; 20 plus 21t22 plus 24 plus 25 plus 26 plus 27t28; 29 plus 30t33 plus 34t35; 50 plus 51 plus 52 plus H; 60t63; 64; 70 plus 71t74; AtB; F; J; L; M; N; O
France 15t16 plus 17t19 plus 36t37; 20 plus 21t22 plus 24 plus 25 plus 26 plus 27t28; 29 plus 30t33 plus 34t35; 50 plus 51 plus 52 plus H; 60t63; 64; 70 plus 71t74; AtB; F; J; L; M; N; O
Germany 15t16 plus 17t19; 20 plus 21t22 plus 24 plus 25 plus 26 plus 27t28 plus 29; 30t33 plus 34t35; 36t37; 50 plus 51 plus 52 plus H; 60t63 plus 64; 70 plus 71t74; AtB; F; J; L; M; N; O
Italy 15t16; 17t19; 20; 21t22;24; 25; 26; 27t28; 29; 30t33; 34t35; 36t37; 50; 51; 52; H; 60t63; 64; 70; 71t74; AtB; F; J; L; M; N; O
Japan AtB; 20; 60t63; 64; H; 17t19; 26; 27t28; 50; 25 plus 36t37; 34t35; 15t16; O; 29; 52; 30t33; F; 21t22; 24; 71t74; 51; J; 70; L plus M plus N
Netherlands AtB; F; 50 plus 51 plus 52 plus H; 64; 15t16 plus 17t19; 60t63; 20 plus 21t22 plus 24 plus 25 plus 26 plus 27t28 plus 36t37; J; 29 plus 30t33 plus 34t35; L; N; 70 plus 71t74; M; O
Spain 15t16; 17t19; 20 plus 21t22 plus 24 plus 25 plus 26 plus 27t28; 29; 30t33; 34t35; 36t37; 50 plus 51 plus 52; 60t63; 64; 70 plus 71t74; AtB; F; H; J; L; M; N; O
UK 64; F; 50 plus 51 plus 52 plus H; 15t16 plus 17t19 plus 36t37; AtB; 60t63; 20 plus 21t22 plus 24 plus 25 plus 26 plus 27t28; 29 plus 30t33 plus 34t35; O; L; J; N; 70 plus 71t74; M
USA 15t16; 17t19; 36t37; 20; 21t22; 24; 25; 26; 27t28; 29; 30t33; 34t35; 50; 51; 52; H; 60t63; 64; 70; 71t74; AtB; F; J; L; M; N; O
Appendix Table A2: List of Industries Pooled by Country
Note: We aggregate to the lowest level of industries in each country where there is a unique value of the wage bill share for each education group
36
Dependent variable(1) (2) (3) (4) (5) (6) (7) (8) (9) (10) (11) (12)
Δ ((ICT capital) / (Value Added)) 4.72 4.00 -2.47 -2.04 1.28 0.93 -0.62 -0.77 3.44 3.07 -1.85 -1.28
(1.36) (1.26) (1.07) (0.99) (0.48) (0.43) (0.60) (0.68) (1.33) (1.26) (1.14) (1.12)Δ log(Value Added) 0.18 -0.28 0.10 0.04 0.08 -0.32
(0.09) (0.08) (0.06) (0.07) (0.09) (0.10)Δ ((Non ICT capital) / (Value Added)) 0.98 0.14 0.41 0.18 0.57 -0.03
(0.51) (0.38) (0.21) (0.17) (0.51) (0.34)
Country fixed effects X X X X X X X X X X X XSample: All industries X X X X X X X X X X X XObs. 208 208 208 208 208 208 208 208 208 208 208 208R-squared 0.32 0.38 0.72 0.75 0.28 0.33 0.43 0.44 0.32 0.33 0.52 0.56
Appendix Table A3: Decomposing Changes in Relative Wage Bills into Wages and HoursLn(Relative Wages) Ln(Relative Hours Worked)Ln(Relative Wage Bill)
Notes: Dependent variable in columns (1)-(4) is the 1980-2004 change in the Ln(relative wage bill), e.g. in column (1) this isln(wage bill of highly skilled workers) - ln(wage bill of medium skilled workers). The dependent variable in columns (5)-(8) is thechange in Ln(relative hourly wage), e.g. in column (5) it is the ln(hourly wage of highly skilled) - ln(hourly wage of mediumskilled). In columns (9)-(12) the dependent variable is the change in Ln(relative hours worked), e.g. in column (9) this isln(annual hours of highly skilled) - ln(annual hours of medium skilled) . Coefficients estimated by OLS with robust standard
(High-skilled/Mediu
m-skilled)
(Medium-skilled/Low-
skilled )
(High-skilled/Mediu
m-skilled)
(Medium-skilled/Low-
skilled )
(High-skilled/Mediu
m-skilled)
(Medium-skilled/Low-
skilled )
37
(1) (2) (3) (4) (5) (6) (7) (8) (9) (10) (11) (12) (13) (14) (15) (16) (17) (18)Dependent variable: High-Skilled Wage Bill Share
Δ ((Imports+ Exports) / (Value Added)) 0.59 0.11(0.15) (0.25)
Δ ((Imports) / (Value Added)) 1.07 0.21(0.30) (0.45)
Δ ((Exports) / (Value Added)) 1.16 0.21(0.30) (0.54)
Δ ((Imports OECD+ Exports OECD) / (Value Added)) 0.68 -0.05
(0.18) (0.37)Δ ((Imports OECD) / (Value Added)) 1.44 -0.43
(0.52) (0.91)Δ ((Exports OECD) / (Value Added)) 1.10 0.03
(0.30) (0.61)Δ ((Imports+Exports nonOECD) / (Value Added)) 2.21 1.38
(0.58) (0.73)Δ ((Imports nonOECD) / (Value Added)) 2.09 1.14
(0.63) (0.83)Δ ((Exports nonOECD) / (Value Added)) 10.97 9.30
(3.38) (3.41)Δ ((ICT capital) / (Value Added)) 107.61 73.59 107.29 73.22 110.10 74.17 109.81 76.19 110.39 78.75 112.20 75.32 110.43 69.95 113.76 71.89 116.71 67.65
(31.70) (31.41) (31.52) (31.32) (32.04) (31.41) (31.94) (31.57) (31.55) (31.40) (32.51) (31.53) (31.13) (30.44) (32.06) (30.75) (29.66) (29.74)Δ log(Value Added) 4.09 2.57 4.30 2.62 3.80 2.50 3.94 2.28 4.09 2.01 3.74 2.38 4.27 3.07 4.16 2.86 3.76 3.04
(1.09) (1.52) (1.13) (1.52) (1.06) (1.49) (1.09) (1.50) (1.11) (1.41) (1.07) (1.48) (1.12) (1.46) (1.16) (1.50) (0.97) (1.18)Δ ((Non ICT capital) / (Value Added)) -0.63 0.97 -0.50 0.99 -0.76 0.95 -0.46 1.04 0.00 0.90 -0.82 1.01 -1.10 0.61 -1.20 0.47 0.24 2.77
(2.41) (3.12) (2.38) (3.11) (2.45) (3.13) (2.39) (3.05) (2.33) (2.98) (2.46) (3.13) (2.50) (3.22) (2.51) (3.24) (2.42) (2.97)1980 ( Research and Development Expenditure/ Value Added) 28.04 28.05 28.27 30.89 32.97 29.83 25.38 26.73 25.85
(17.59) (16.88) (18.06) (18.27) (17.36) (18.33) (15.53) (15.88) (13.84)Country fixed effects X X X X X X X X X X X X X X X X X XObs. 84 65 84 65 84 65 84 65 84 65 84 65 84 65 84 65 84 65R-squared 0.82 0.82 0.82 0.82 0.82 0.82 0.82 0.82 0.82 0.82 0.82 0.82 0.82 0.83 0.82 0.82 0.83 0.83
Appendix Table A4: Trade, ICT, and Research and Development
Notes: Coefficients estimated by OLS with robust standard errors in parentheses. Regressions weighted by the industry's 1980 share of each country's employment, for traded goods. The OECDANBERD dataset does not have R&D data for Austria and Spain, which are dropped from the sample
38
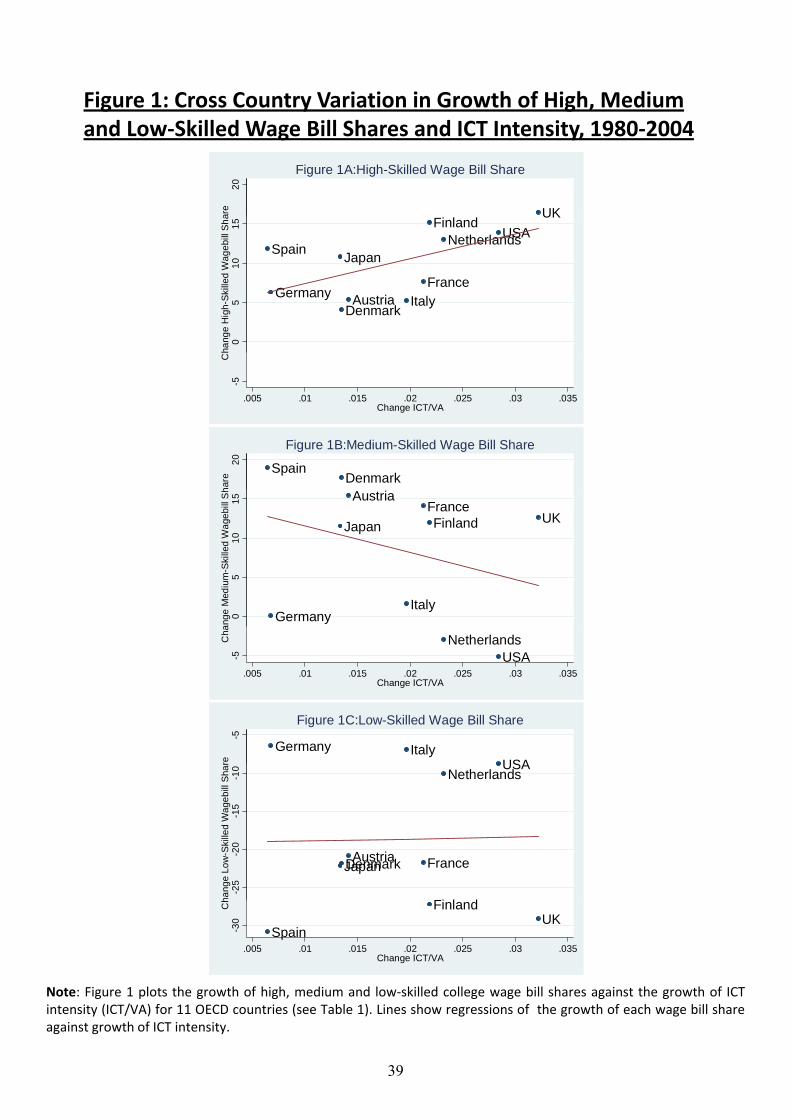
Figure 1: Cross Country Variation in Growth of High, Medium and Low-Skilled Wage Bill Shares and ICT Intensity, 1980-2004
UK20
are
Figure 1A:High-Skilled Wage Bill Share
AustriaDenmark
Finland
FranceGermany Italy
JapanNetherlands
Spain
UKUSA
05
1015
hang
e H
igh-
Skill
ed W
ageb
ill S
h a-5
C
.005 .01 .015 .02 .025 .03 .035Change ICT/VA
DenmarkSpain20
hare
Figure 1B:Medium-Skilled Wage Bill Share
Austria
FinlandFrance
GermanyItaly
Japan UK
05
1015
ange
Med
ium
-Ski
lled
Wag
ebill
Sh
NetherlandsUSA-5
Cha
.005 .01 .015 .02 .025 .03 .035Change ICT/VA
Germany ItalyUSA
-5re
Figure 1C:Low-Skilled Wage Bill Share
AustriaDenmark
Fi l d
FranceJapan
NetherlandsUSA
-25
-20
-15
-10
hang
e Lo
w-S
kille
d W
ageb
ill Sh
ar
Note: Figure 1 plots the growth of high, medium and low-skilled college wage bill shares against the growth of ICTintensity (ICT/VA) for 11 OECD countries (see Table 1). Lines show regressions of the growth of each wage bill shareagainst growth of ICT intensity.
Finland
SpainUK
-30
Ch
.005 .01 .015 .02 .025 .03 .035Change ICT/VA
39

Figure 2: Average Annual Percentage Point Changes in High, Medium and Low-Skilled Wage Bill Shares over Six-Year Intervals from 1980-
2004 (Eleven Country Average and US).5
1
Six
-Yea
r Diff
eren
cell
Sha
re
Figure 2A: Eleven Country Average
Medium
High
-1-.5
0
Ave
rage
Ann
ualis
ed S
in W
ageb
i
1986 1992 1998 2004
Medium
Low
1986 1992 1998 2004End Year of Six Year Interval
High MediumLow
1ce
Figure 2B: US Average
0.5
ualis
ed S
ix-Y
ear D
iffer
enc
Wag
ebill
Sha
re
M di
High
Low
-1-.5
Ave
rage
Ann
uin
W
1986 1992 1998 2004End Year of Six Year Interval
High Medium
Medium
Note: Figure 2 shows annualised six-year average growth rates of high, medium and low-skilled wage bill shares from1980-2004, weighted by employment share in the starting year of the six-year interval (e.g. The 1980-1986annualised difference is weighted by each industry’s share in the 1980 employment of the country).
High MediumLow
40
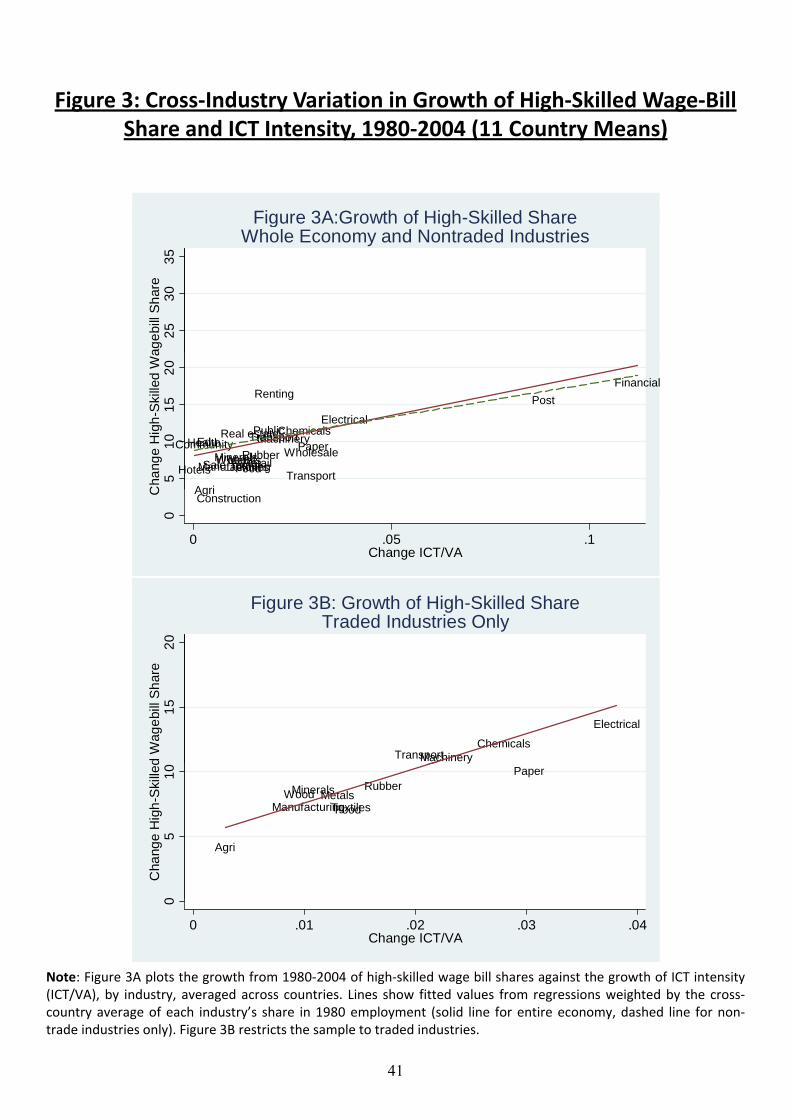
Figure 3: Cross-Industry Variation in Growth of High-Skilled Wage-Bill Share and ICT Intensity, 1980-2004 (11 Country Means)
Figure 3A:Growth of High Skilled Share
2530
35ag
ebill
Sha
re
Figure 3A:Growth of High-Skilled ShareWhole Economy and Nontraded Industries
Agri
FoodTextilesWoodPaper
Chemicals
RubberMineralsMetals
Machinery
ElectricalTransport
ManufacturingSale_motorWholesale
RetailTransport
Post
Real estate
Renting
Hotels
Financial
PublicEduHealthCommunity
510
1520
Cha
nge
Hig
h-S
kille
d W
a
AgriConstruction
0C
0 .05 .1Change ICT/VA
Figure 3B: Growth of High-Skilled ShareTraded Industries Only
ChemicalsMachinery
Electrical
Transport
1520
d W
ageb
ill S
hare
Traded Industries Only
Agri
FoodTextilesWood
PaperRubberMineralsMetals
Manufacturing
05
10C
hang
e H
igh-
Ski
lled
Note: Figure 3A plots the growth from 1980-2004 of high-skilled wage bill shares against the growth of ICT intensity(ICT/VA), by industry, averaged across countries. Lines show fitted values from regressions weighted by the cross-country average of each industry’s share in 1980 employment (solid line for entire economy, dashed line for non-trade industries only). Figure 3B restricts the sample to traded industries.
0
0 .01 .02 .03 .04Change ICT/VA
41
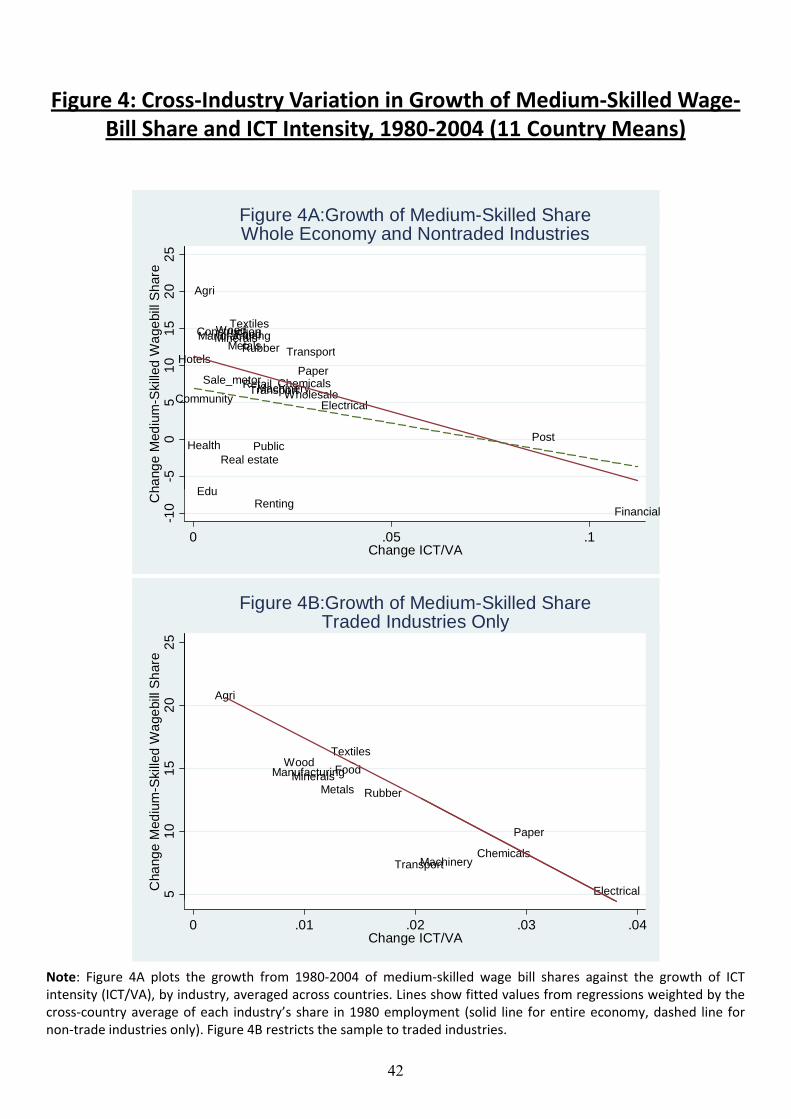
Figure 4: Cross-Industry Variation in Growth of Medium-Skilled Wage-Bill Share and ICT Intensity, 1980-2004 (11 Country Means)
Figure 4A:Growth of Medium-Skilled Share
Agri
FoodTextilesWood
RubberMinerals
MetalsManufacturing
Transport
Construction1520
25W
ageb
ill S
hare
Figure 4A:Growth of Medium-Skilled ShareWhole Economy and Nontraded Industries
PaperChemicalsMachinery
ElectricalTransport
Sale_motorWholesale
Retail
Transport
Post
Real estate
Hotels
Public
Edu
Health
Community
-50
510
hang
e M
ediu
m-S
kille
d W
Figure 4B:Growth of Medium-Skilled ShareTraded Industries Only
RentingFinancial
Edu
-10C
h
0 .05 .1Change ICT/VA
Agri
TextilesWood5
2025
led
Wag
ebill
Sha
re
Traded Industries Only
FoodWood
Paper
Chemicals
RubberMinerals
Metals
Machinery
Electrical
Transport
Manufacturing
510
15C
hang
e M
ediu
m-S
kill
Note: Figure 4A plots the growth from 1980-2004 of medium-skilled wage bill shares against the growth of ICTintensity (ICT/VA), by industry, averaged across countries. Lines show fitted values from regressions weighted by thecross-country average of each industry’s share in 1980 employment (solid line for entire economy, dashed line fornon-trade industries only). Figure 4B restricts the sample to traded industries.
0 .01 .02 .03 .04Change ICT/VA
42
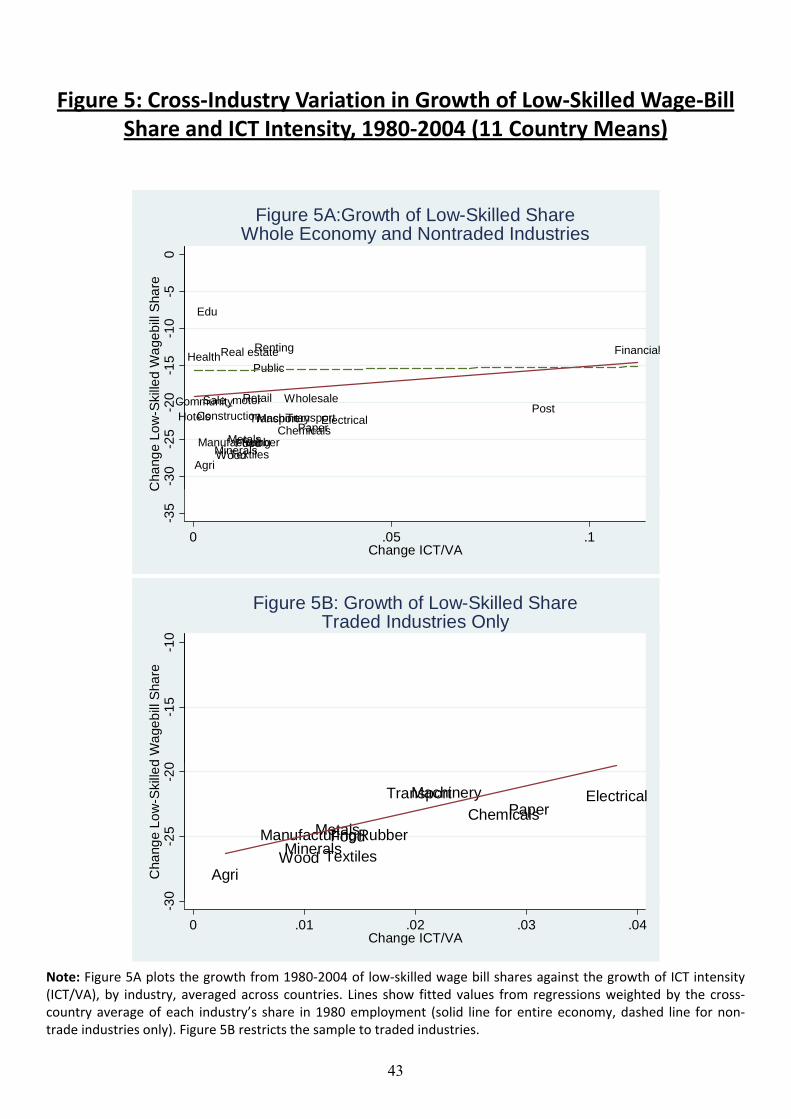
Figure 5: Cross-Industry Variation in Growth of Low-Skilled Wage-Bill Share and ICT Intensity, 1980-2004 (11 Country Means)
Figure 5A:Growth of Low-Skilled Share
Real estateRenting Financial
Edu
H lth
-10
-50
ageb
ill S
hare
Figure 5A:Growth of Low-Skilled ShareWhole Economy and Nontraded Industries
Agri
FoodTextilesWood
PaperChemicalsRubber
MineralsMetals
Machinery ElectricalTransport
Manufacturing
Sale_motor WholesaleRetail
TransportPost
Real estate g
ConstructionHotels
FinancialPublic
Health
Community
-30
-25
-20
-15
Cha
nge
Low
-Ski
lled
Wa
-35
C
0 .05 .1Change ICT/VA
Figure 5B: Growth of Low-Skilled ShareTraded Industries Only
0-1
5-1
0d
Wag
ebill
Sha
re
Traded Industries Only
Agri
FoodTextilesWood
PaperChemicalsRubber
MineralsMetals
Machinery ElectricalTransport
Manufacturing
30-2
5-2
0C
hang
e Lo
w-S
kille
d
Note: Figure 5A plots the growth from 1980-2004 of low-skilled wage bill shares against the growth of ICT intensity(ICT/VA), by industry, averaged across countries. Lines show fitted values from regressions weighted by the cross-country average of each industry’s share in 1980 employment (solid line for entire economy, dashed line for non-trade industries only). Figure 5B restricts the sample to traded industries.
-3
0 .01 .02 .03 .04Change ICT/VA
43

CENTRE FOR ECONOMIC PERFORMANCE Recent Discussion Papers
986 J. M. C. Santos Silva Silvana Tenreyro
Currency Unions in Prospect and Retrospect
985 Fabian Waldinger Quality Matters – The Expulsion of Professors and Ph.D. Student Outcomes in Nazi Germany
984 Brian Bell Stephen Machin Francesco Fasani
Crime and Immigration: Evidence from Large Immigrant Waves
983 Nicholas Bloom Carol Propper Stephan Seiler John Van Reenen
The Impact of Competition on Management Quality: Evidence from Public Hospitals
982 Nicholas Bloom John Van Reenen
Human Resource Management and Productivity
981 Alan Manning Imperfect Competition in the Labour Market
980 Ana Fernandes Heiwai Tang
The Determinants of Vertical Integration in Export Processing: Theory and Evidence from China
979 Stephen Machin Olivier Marie Sunčica Vujić
The Crime Reducing Effect of Education
978 Andrew B. Bernard J. Bradford Jensen Stephen Redding Peter K. Schott
Intra-Firm Trade and Product Contractibility (Long Version)
977 Albrecht Ritschl Samad Sarferaz
Crisis? What Crisis? Currency vs Banking in the Financial Crisis of 1931
976 Joshua D. Angrist Jörn-Steffen Pischke
The Credibility Revolution in Empirical Economics: How Better Research Design is taking the Con out of Econometrics
975 Holger Breinlich Alejandro Cuñat
Trade Liberalization and Heterogeneous Firm Models: An Evaluation Using the Canada – US Free Trade Agreement
974 Facundo Albornoz Hector Calvo-Pardo Gregory Corcos Emanuel Ornelas
Sequential Exporting

973 Marco Fugazza Frédéric Robert-Nicoud
The ‘Emulator Effect’ of the Uruguay Round on US Regionalism
972 Andreas Georgiadis Christos N. Pitelis
The Interrelationship between HR, Strategy and Profitability in Service SMEs: Empirical Evidence from the UK Tourism Hospitality and Leisure Sector
971 John T. Addison Alex Bryson Paulino Teixeira André Pahnke
Slip Sliding Away: Further Union Decline in Germany and Britain
970 Nicholas Bloom Raffaella Sadun John Van Reenen
Recent Advances in the Empirics of Organizational Economics
969 Nicholas Bloom John Van Reenen
New Approaches to Measuring Management and Firm Organiz\ation
968 Andrew B. Bernard J. Bradford Jensen Stephen J. Redding Peter K. Schott
Wholesalers and Retailers in U.S. Trade (Long Version)
967 Pooyan Amir Ahmadi Albrecht Ritschl
Depression Econometrics: A FAVAR Model of Monetary Policy During the Great Depression
966 Nicholas Bloom Raffaella Sadun John Van Reenen
Does Product Market Competition Lead Firms to Decentralize?
965 Ralf Martin Why is the US so Energy Intensive? Evidence from Multinationals in the UK
964 Christian A. L. Hilber Frédéric Robert-Nicoud
Origins of Land Use Regulations: Theory and Evidence from US Metro Areas
963 Maria Bas Juan Carluccio
Wage Bargaining and the Boundaries of the Multinational Firm
962 L. Rachel Ngai Christopher A. Pissarides
Welfare Policy and the Distribution of Hours of Work
961 Caroline Freund Emanuel Ornelas
Regional Trade Agreements
960 Francesco Caselli Guy Michaels
Do Oil Windfalls Improve Living Standards? Evidence from Brazil
The Centre for Economic Performance Publications Unit Tel 020 7955 7284 Fax 020 7955 7595
Email [email protected] Web site http://cep.lse.ac.uk
Related Documents