HAL Id: hal-03534219 https://hal.archives-ouvertes.fr/hal-03534219 Submitted on 19 Jan 2022 HAL is a multi-disciplinary open access archive for the deposit and dissemination of sci- entific research documents, whether they are pub- lished or not. The documents may come from teaching and research institutions in France or abroad, or from public or private research centers. L’archive ouverte pluridisciplinaire HAL, est destinée au dépôt et à la diffusion de documents scientifiques de niveau recherche, publiés ou non, émanant des établissements d’enseignement et de recherche français ou étrangers, des laboratoires publics ou privés. Handling Radar Cross-Section Performance in Monitoring Vital Signs Under Constraint Conditions Faheem Khan, Saleh M Sherazi, Naeem Khan, Imran Ashraf, Fahad Khan To cite this version: Faheem Khan, Saleh M Sherazi, Naeem Khan, Imran Ashraf, Fahad Khan. Handling Radar Cross- Section Performance in Monitoring Vital Signs Under Constraint Conditions. Frontiers in Signal Processing, Frontiers, 2021, 1, 10.3389/frsip.2021.742441. hal-03534219

Welcome message from author
This document is posted to help you gain knowledge. Please leave a comment to let me know what you think about it! Share it to your friends and learn new things together.
Transcript
HAL Id: hal-03534219https://hal.archives-ouvertes.fr/hal-03534219
Submitted on 19 Jan 2022
HAL is a multi-disciplinary open accessarchive for the deposit and dissemination of sci-entific research documents, whether they are pub-lished or not. The documents may come fromteaching and research institutions in France orabroad, or from public or private research centers.
L’archive ouverte pluridisciplinaire HAL, estdestinée au dépôt et à la diffusion de documentsscientifiques de niveau recherche, publiés ou non,émanant des établissements d’enseignement et derecherche français ou étrangers, des laboratoirespublics ou privés.
Handling Radar Cross-Section Performance inMonitoring Vital Signs Under Constraint Conditions
Faheem Khan, Saleh M Sherazi, Naeem Khan, Imran Ashraf, Fahad Khan
To cite this version:Faheem Khan, Saleh M Sherazi, Naeem Khan, Imran Ashraf, Fahad Khan. Handling Radar Cross-Section Performance in Monitoring Vital Signs Under Constraint Conditions. Frontiers in SignalProcessing, Frontiers, 2021, 1, �10.3389/frsip.2021.742441�. �hal-03534219�
Handling Radar Cross-SectionPerformance in Monitoring Vital SignsUnder Constraint ConditionsFaheem Khan1*, Saleh M. Sherazi 2, Naeem Khan1*, Imran Ashraf 3* and Fahad Khan1
1Lab STICC, Communications Engineering, UBO, Brest, France, 2Electrical Engineering Department, UET Bannu Campus,University of Engineering and Technology, Bannu, Pakistan, 3Electrical Engineering Department, HITEC, Islamabad, Pakistan
Two vital signs including heartbeat and respiratory rate are monitored in this work undertwo constraint situations; namely noise disturbance and intermittent observations. Theexisting scheme for finding, measuring and monitoring vital signs was Fourier Transformwhich could not deal with non-stationary process. As an alternative, theWavelet Transformis used in this work which is equally applicable to both stationary and non-stationaryprocesses. Additionally, the loss of output data may result in crucial implications inobserving vital signs. Formerly, only un-interrupted data has been amalgamated intracing vital signs. A novel adaptive ARMA-based scheme is proposed to obtainoptimum estimated results in the presence of the above two critical scenarios.Simulation results obtained on real (practical) data show that the ARMA-based modelproduces similar vital signs as shown by clean and un-distorted data. It is shown that theproposed ARMA-based algorithm improves the breathing rate accuracy by 0.3% andheart rate accuracy by 2.5% as compared to the existing AR-based vital signalreconstruction algorithm.
Keywords: vital signs, radar-cross section, ARMA-model, kalman filtering, intermittent observations
1 INTRODUCTION
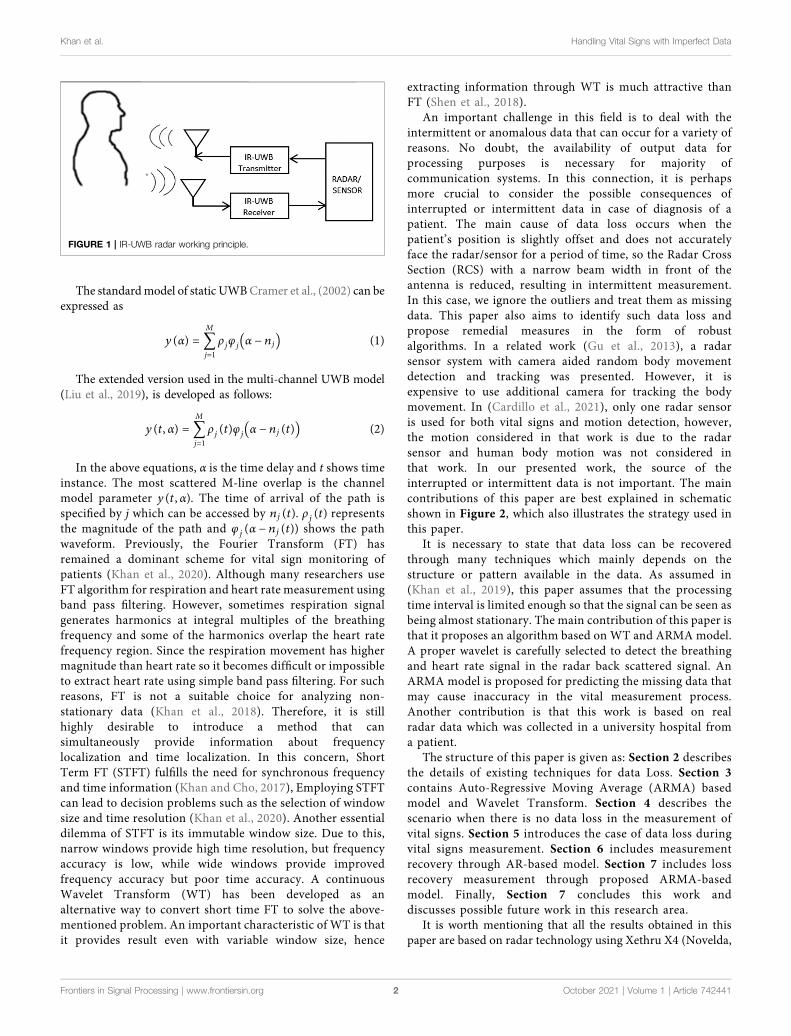
Formerly, the Ultra-Wide Band (UWB) standards were allowed unauthorized operation in the areaof 3.1–10.6 GHz (Fernandes and Wentzloff, 2010). Since the authorization of UWB by the FederalCommunication Commission in 2002, Ultra-Wide Band has a huge contribution in wirelesscommunication (Fontana, 2004; Li et al., 2010; Choliz et al., 2011) and radar sensor applications(Oziel et al., 2017; Fear et al., 2002; Buehrer et al., 2003; Lazaro et al., 2009; Thiel et al., 2010). Ultra-Wide Band has many advantages namely strength in harsh environments, location accuracy and highpenetration capability (Briso et al., 2019), etc.With the help of IR-UWB radar, both micro andmacromovements can be sensed inside the human body (Staderini, 2002). For such reasons, UWB has largeapplications in the medical field because it consumes less power and provides higher extensionalquality (Grewal and Andrews, 2001). The monitoring of vital signs has acquired greater attention incase of surveillance of non-communicable patients and the search for people after natural disasters(Khan et al., 2020; Le, 2020; Yang et al., 2020). Figure 1 shows the experimental setup for this work.The patient is sitting in front of the radar in a range of around 1 m. The radar signal is back scatteredfrom the human body as well as the background environment. The background signal is consideredas clutter and removed using a moving averaging filter while the moving part of the signal containsthe displacement caused by the human lungs and heart. These periodic motions are extracted fromthe signal using signal processing techniques explained in Section 2 of this work.
Edited by:Shekh Md Mahmudul Islam,
University of Dhaka, Bangladesh
Reviewed by:Wei Pu,
University College London,United Kingdom
Md Zobaer Islam,Oklahoma State University,
United States
*Correspondence:Naeem Khan
[email protected] Khan
[email protected] Ashraf
Specialty section:This article was submitted to
Radar Signal Processing,a section of the journal
Frontiers in Signal Processing
Received: 16 July 2021Accepted: 23 September 2021
Published: 25 October 2021
Citation:Khan F, Sherazi SM, Khan N, Ashraf I
and Khan F (2021) Handling RadarCross-Section Performance inMonitoring Vital Signs Under
Constraint Conditions.Front. Sig. Proc. 1:742441.
doi: 10.3389/frsip.2021.742441
Frontiers in Signal Processing | www.frontiersin.org October 2021 | Volume 1 | Article 7424411
ORIGINAL RESEARCHpublished: 25 October 2021
doi: 10.3389/frsip.2021.742441
The standardmodel of static UWBCramer et al., (2002) can beexpressed as
y(α) � ∑Mj�1
ρjφj α − nj( ) (1)
The extended version used in the multi-channel UWB model(Liu et al., 2019), is developed as follows:
y(t, α) � ∑Mj�1
ρj(t)φj α − nj(t)( ) (2)
In the above equations, α is the time delay and t shows timeinstance. The most scattered M-line overlap is the channelmodel parameter y(t, α). The time of arrival of the path isspecified by j which can be accessed by nj(t). ρj(t) representsthe magnitude of the path and φj(α − nj(t)) shows the pathwaveform. Previously, the Fourier Transform (FT) hasremained a dominant scheme for vital sign monitoring ofpatients (Khan et al., 2020). Although many researchers useFT algorithm for respiration and heart rate measurement usingband pass filtering. However, sometimes respiration signalgenerates harmonics at integral multiples of the breathingfrequency and some of the harmonics overlap the heart ratefrequency region. Since the respiration movement has highermagnitude than heart rate so it becomes difficult or impossibleto extract heart rate using simple band pass filtering. For suchreasons, FT is not a suitable choice for analyzing non-stationary data (Khan et al., 2018). Therefore, it is stillhighly desirable to introduce a method that cansimultaneously provide information about frequencylocalization and time localization. In this concern, ShortTerm FT (STFT) fulfills the need for synchronous frequencyand time information (Khan and Cho, 2017), Employing STFTcan lead to decision problems such as the selection of windowsize and time resolution (Khan et al., 2020). Another essentialdilemma of STFT is its immutable window size. Due to this,narrow windows provide high time resolution, but frequencyaccuracy is low, while wide windows provide improvedfrequency accuracy but poor time accuracy. A continuousWavelet Transform (WT) has been developed as analternative way to convert short time FT to solve the above-mentioned problem. An important characteristic of WT is thatit provides result even with variable window size, hence
extracting information through WT is much attractive thanFT (Shen et al., 2018).
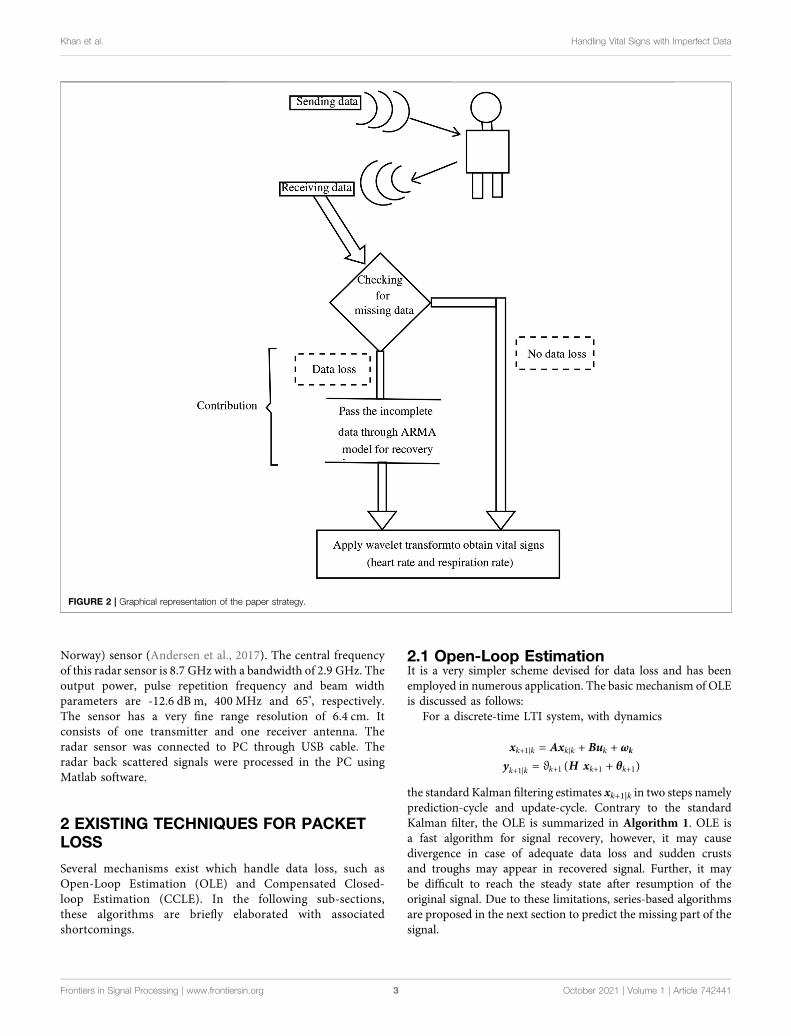
An important challenge in this field is to deal with theintermittent or anomalous data that can occur for a variety ofreasons. No doubt, the availability of output data forprocessing purposes is necessary for majority ofcommunication systems. In this connection, it is perhapsmore crucial to consider the possible consequences ofinterrupted or intermittent data in case of diagnosis of apatient. The main cause of data loss occurs when thepatient’s position is slightly offset and does not accuratelyface the radar/sensor for a period of time, so the Radar CrossSection (RCS) with a narrow beam width in front of theantenna is reduced, resulting in intermittent measurement.In this case, we ignore the outliers and treat them as missingdata. This paper also aims to identify such data loss andpropose remedial measures in the form of robustalgorithms. In a related work (Gu et al., 2013), a radarsensor system with camera aided random body movementdetection and tracking was presented. However, it isexpensive to use additional camera for tracking the bodymovement. In (Cardillo et al., 2021), only one radar sensoris used for both vital signs and motion detection, however,the motion considered in that work is due to the radarsensor and human body motion was not considered inthat work. In our presented work, the source of theinterrupted or intermittent data is not important. The maincontributions of this paper are best explained in schematicshown in Figure 2, which also illustrates the strategy used inthis paper.
It is necessary to state that data loss can be recoveredthrough many techniques which mainly depends on thestructure or pattern available in the data. As assumed in(Khan et al., 2019), this paper assumes that the processingtime interval is limited enough so that the signal can be seen asbeing almost stationary. The main contribution of this paper isthat it proposes an algorithm based on WT and ARMA model.A proper wavelet is carefully selected to detect the breathingand heart rate signal in the radar back scattered signal. AnARMA model is proposed for predicting the missing data thatmay cause inaccuracy in the vital measurement process.Another contribution is that this work is based on realradar data which was collected in a university hospital froma patient.
The structure of this paper is given as: Section 2 describesthe details of existing techniques for data Loss. Section 3contains Auto-Regressive Moving Average (ARMA) basedmodel and Wavelet Transform. Section 4 describes thescenario when there is no data loss in the measurement ofvital signs. Section 5 introduces the case of data loss duringvital signs measurement. Section 6 includes measurementrecovery through AR-based model. Section 7 includes lossrecovery measurement through proposed ARMA-basedmodel. Finally, Section 7 concludes this work anddiscusses possible future work in this research area.
It is worth mentioning that all the results obtained in thispaper are based on radar technology using Xethru X4 (Novelda,
FIGURE 1 | IR-UWB radar working principle.
Frontiers in Signal Processing | www.frontiersin.org October 2021 | Volume 1 | Article 7424412
Khan et al. Handling Vital Signs with Imperfect Data
Norway) sensor (Andersen et al., 2017). The central frequencyof this radar sensor is 8.7 GHz with a bandwidth of 2.9 GHz. Theoutput power, pulse repetition frequency and beam widthparameters are -12.6 dB m, 400 MHz and 65°, respectively.The sensor has a very fine range resolution of 6.4 cm. Itconsists of one transmitter and one receiver antenna. Theradar sensor was connected to PC through USB cable. Theradar back scattered signals were processed in the PC usingMatlab software.
2 EXISTING TECHNIQUES FOR PACKETLOSS
Several mechanisms exist which handle data loss, such asOpen-Loop Estimation (OLE) and Compensated Closed-loop Estimation (CCLE). In the following sub-sections,these algorithms are briefly elaborated with associatedshortcomings.
2.1 Open-Loop EstimationIt is a very simpler scheme devised for data loss and has beenemployed in numerous application. The basic mechanism of OLEis discussed as follows:
For a discrete-time LTI system, with dynamics
xk+1|k � Axk|k + Buk + ωk
yk+1|k � ϑk+1 H xk+1 + θk+1( )the standard Kalman filtering estimates xk+1|k in two steps namelyprediction-cycle and update-cycle. Contrary to the standardKalman filter, the OLE is summarized in Algorithm 1. OLE isa fast algorithm for signal recovery, however, it may causedivergence in case of adequate data loss and sudden crustsand troughs may appear in recovered signal. Further, it maybe difficult to reach the steady state after resumption of theoriginal signal. Due to these limitations, series-based algorithmsare proposed in the next section to predict the missing part of thesignal.
FIGURE 2 | Graphical representation of the paper strategy.
Frontiers in Signal Processing | www.frontiersin.org October 2021 | Volume 1 | Article 7424413
Khan et al. Handling Vital Signs with Imperfect Data
Algorithm 1. Open loop estimation
2.2 Series-Based AlgorithmsThe compensated closed-loop scheme has efficiently reconstructedthe missing data and promising estimation results have beenachieved. The recent achievements obtained through this modelcan be seen in Khan et al. (2013) and Khan et al. (2010). Data lossoccurred in series which may have any trend are more expected tobe recovered through Autoregressive (AR) series. These seriesinclude AR, MA, and ARMA to name but a few. Human vitalsignal possess a periodic trend, therefore it can be recoveredthrough AR series. AR model employed for compensation ofmeasurement has the mathematical formulation as
�yk � ∑Wj�1
γjyk−j (3)
where γj are prediction coefficients, yk−j are previous samples ofobservation stored in memory stack, andW is the order of linearprediction filter. The optimum values of the predictioncoefficients can be computed as
Ar � R−1r rr (4)
where,
Ar� γ1 γ2 . . . . . . . . . ‥ γW[ ]T (5)
is the vector containing the unknown coefficients,
ri� rr[1] . . . . . . . . . . . . . . . rr[W][ ] T (6)
is the linear prediction array and
Rr �Rr[0] Rr[1] . . . Rr[W − 1]Rr[1] Rr[0] . . . Rr[W − 2]«
Rr[W − 1]«
Rr[W − 2]1. . .
«Rr[0]
⎡⎢⎢⎢⎢⎢⎢⎢⎢⎢⎢⎢⎢⎢⎢⎣ ⎤⎥⎥⎥⎥⎥⎥⎥⎥⎥⎥⎥⎥⎥⎥⎦ (7)
is the auto-correlation matrix. The elements of linear predictionarray and auto-correlation matrix can be obtained as
E yTk−jyk−i[ ] � Rr[0], if j � i;
Rr[|j − i|], if j≠ i.{ (8)
With the help of Equation 4, the optimal values of linear predictioncoefficients are computed which are then employed in finding the
lost samples using Eq. 3. The AR model uses only measurementvector for linear prediction coefficient (LPC) computation, however,in our proposed ARMA-based reconstruction of vital signal theinput as well as measurement vector are used for LPC computationwhich improves the prediction accuracy.
3 PROPOSED ARMA-BASED MODEL ANDWAVELET TRANSFORM
In the subsequent section, we present the proposed model whichis based on ARMA series.
3.1 Proposed ARMA-Based ModelThe data recovery scheme used in this paper is based on ARMAbased model. The mathematical description of ARMA basedmodel is as follows;
�yk � ∑Wj�1
γjyk−j +∑Wj�1
δjuk−j (9)
where,In the above equations, W represent filter linear prediction
order, yk−j shows sensor readings and uk−j shows the input signalto the plant/system. The symbols cj and δj represent weights given
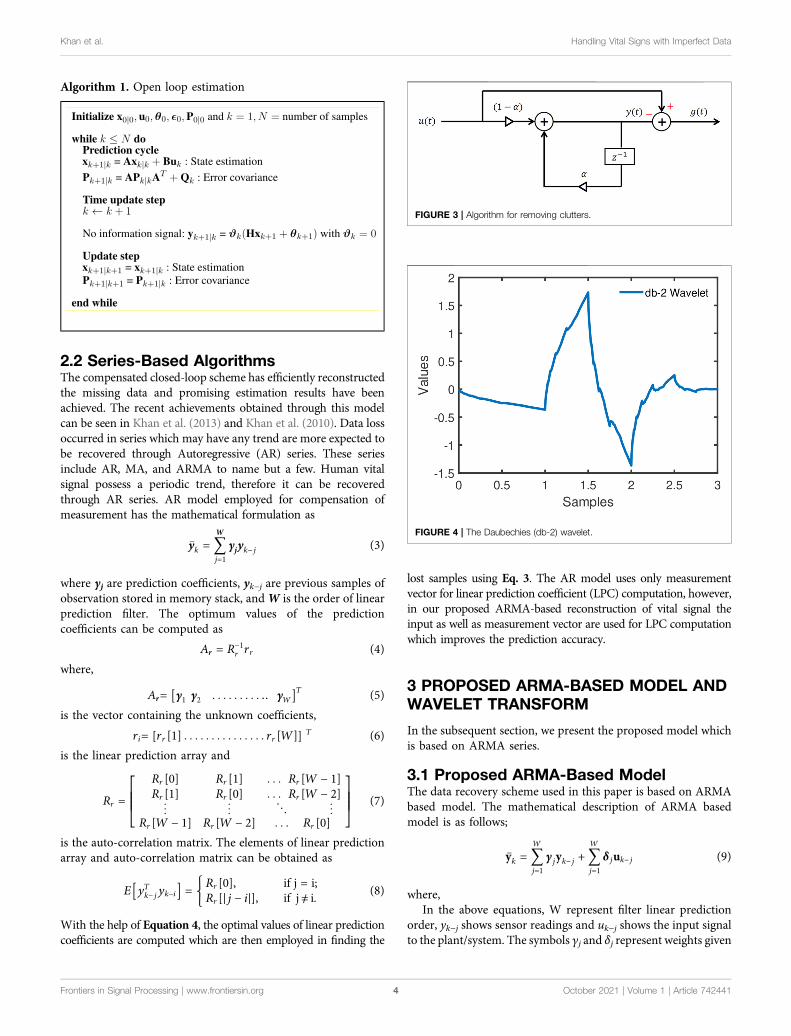
FIGURE 3 | Algorithm for removing clutters.
FIGURE 4 | The Daubechies (db-2) wavelet.
Frontiers in Signal Processing | www.frontiersin.org October 2021 | Volume 1 | Article 7424414
Khan et al. Handling Vital Signs with Imperfect Data
to measurements and input respectively. The error resulting bythis compensating vector would be
ek � yk − �yk (10)
where yk is the actual observation vector. In order to computelinear prediction coefficients efficiently, the cost function consistsof mean square prediction error as;
J �defE e2k[ ] (11)
or
J � E yk −∑Wj�1
γjyk−j −∑Wj�1
δjuk−j⎛⎝ ⎞⎠2⎡⎢⎢⎢⎣ ⎤⎥⎥⎥⎦ (12)
In order to find the optimal value of γj, which will result in theminimum cost function, we proceed as
zJ
zcj� 2E yk −∑W
j�1γjyk−j −∑W
j�1δjuk−j⎛⎝ ⎞⎠⎡⎢⎢⎣ ⎤⎥⎥⎦yk−i � 0 (13)
E γj ∑Wj�1
yk−jyk−i⎡⎢⎢⎣ ⎤⎥⎥⎦ + E δj ∑Wj�1
uk−jyk−i⎡⎢⎢⎣ ⎤⎥⎥⎦ � E ykyk−i[ ] (14)
Let
E ykyk−j[ ] � l1E yk−jyk−i[ ] � L1
E uk−jyk−i[ ] � L2
(15)
Substituting Eq. 15 in Eq. 14 will result in
L1γj + L2δj � l1 (16)
In the similar way, the optimal value of δj are calculated as
zJ
zδj� 2E yk −∑W
j�1γjyk−j +∑W
j�1δjuk−j⎛⎝ ⎞⎠⎡⎢⎢⎣ ⎤⎥⎥⎦uk−i � 0 (17)
E γj ∑Wj�1
yk−juk−i⎡⎢⎢⎣ ⎤⎥⎥⎦ + E δj ∑Wj�1
uk−juk−i⎡⎢⎢⎣ ⎤⎥⎥⎦ � E ykuk−i[ ] (18)
E ykuk−j[ ] � l2E yk−juk−i[ ] � L3
E uk−juk−i[ ] � L4
(19)
Substituting Eq. 19 in Eq. 18 will result in
L3γj + L4δj � l2 (20)
Multiply Eq. 16 by L4 and Eq. 20 by L2 and solvesimultaneously i.e.
γj � L1L4 − L2L3[ ]−1 L4l1 − L2l2[ ] (21)
Multiply Eq. 16 by L3 and Eq. 20 by L1 and solvesimultaneously i.e.
δj � L2L3 − L1L4[ ]−1 L3l1 − L1l2[ ] (22)
Using Eq. 21 and Eq. 22, the auxiliary measurement vectorcan be reconstructed through a model depicted in Eq. 9.
Algorithm 2. Filter order selection
Additionally, it is fundamental to decide the optimal valueof prediction filter orderW. Various schemes can be proposedto compute this important parameter. The importance ofthis parameter can be judged from the fact that a highvalue of W will take a large number of samples toreconstruct the missing sample and hence will consumemore computational time. On the other hand, a smallervalue of W may generate degraded results at the price ofless computational time. Hence, it is a task for the designer todevise an optimal value of W to result in optimumachievements. In Algorithm 2, a simple andstraightforward mechanism is proposed to decide the orderof prediction filter, when samples start missing at kthinstance.
3.2 Clutter Removal and Wavelet TransformDue to the vital limitations of FT-based scheme, this paper aimsto employ Wavelet Transform (WT) as an alternate, and hence, abrief review of WT is considered to be beneficial. IR-UWB radarsurrounds the body under study. From the patient’s body,constant reflected rays are received. The received signal fromthe body contains data, stored in an m ×n matrix, where m is thesample size in the slow time and n represents the occurrence ofthe sample in the fast time. First, search for the column with thehighest power. For clutter cancellation, the signal must passthrough a filter, such as a notch filter (Sifuzzaman et al., 2009;Chia et al., 2005; Grewal and Andrews, 2001. From a graphicalperspective, the clutter removal process can be seen in Figure 3.Mathematically, the separator can be described as follows (Wanget al., 2017.
y(t) � ay(t − 1) + (1 − a)u(t) (23)
g(t) � u(t) − y(t) (24)
where, y(t), u(t) and g(t) represent the clutter signal, originalsignal and clutter free signal respectively.
The Wavelet coefficients are achieved by applying WT on theclutter free signal. In addition, the mother Wavelet used in this
Frontiers in Signal Processing | www.frontiersin.org October 2021 | Volume 1 | Article 7424415
Khan et al. Handling Vital Signs with Imperfect Data
case is Daubechies-2. The pictorial view of db-2 Wavelet is givenin Figure 4.
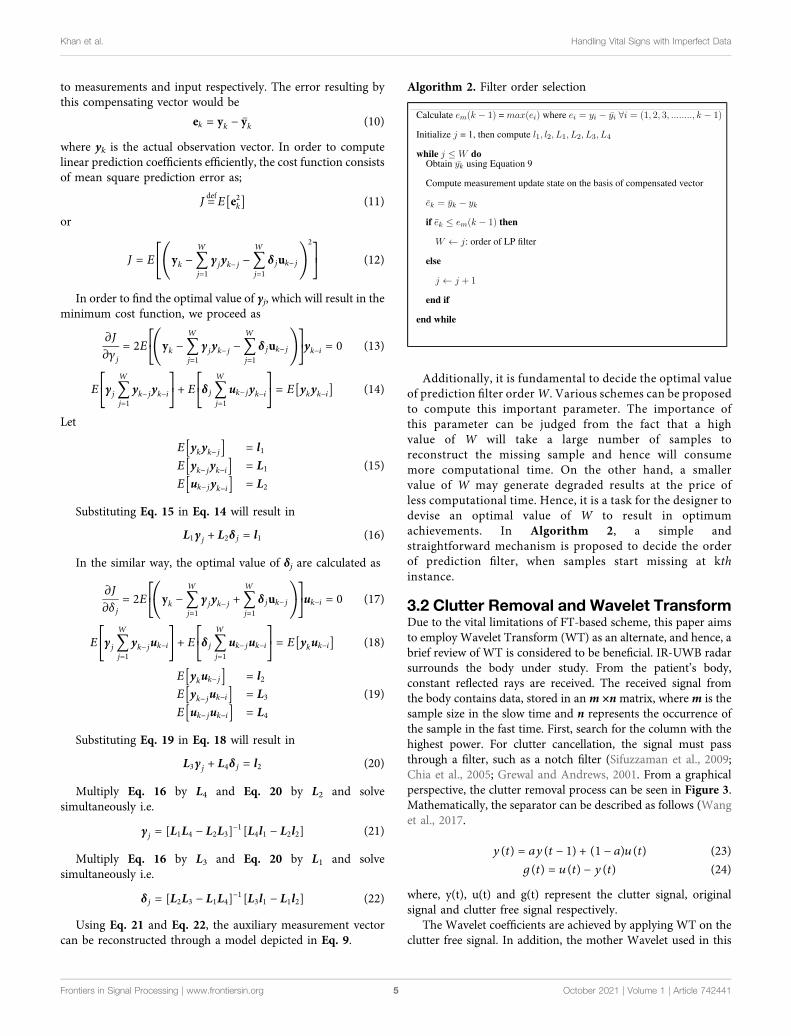
The Wavelet coefficients are obtained after the Wavelet isapplied to the clutter-free signal. It needs to be noted that theWavelet coefficients, when plotted on Energy-Spectral Density(ESD) graph, provide scale value. Another commending featureof Wavelet transform is that it gives Scale-to-Frequency graphs(for example Figure 5) Tariq et al. (2017). So, core objective ofFigure 5, is to locate the corresponding frequency of scale factorrelated to heart rate or respiration rate. This strategy is adoptedfor the detection of vital signs in the following four scenarios:
1. Analysis of Normal Scenario (discussed in Section 4)2. Consequences of data loss (discussed in Section 5)3. Analysis after Recovery of Data Loss through AR-based Model
(discussed in Section 6)4. Analysis after Recovery of Data Loss through ARMA-based
model (discussed in Section 7)
4 ANALYSIS OF NORMAL SCENARIO
Initially, smoothly arrived data has been analyzed which will serveas a baseline for comparison. After removing the clutter by anyconvenient method (such as notch filter), the clutter-free signalwill consist of two parts (heart rate and respiration rate), and theWavelet coefficients are obtained by applying Wavelet transformto the clutter-free signal. This results in the scale-frequency plot
depicted in Figure 5. From this figure, the frequency can be foundwhich corresponds to the density of the Wavelet coefficients.
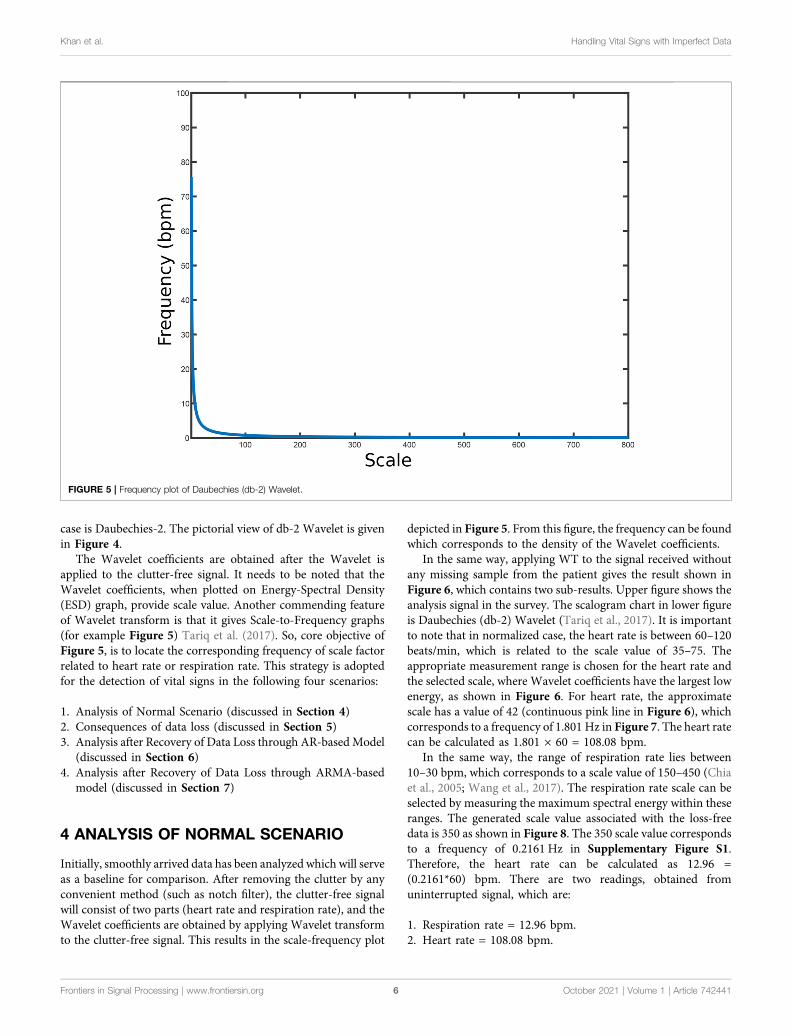
In the same way, applying WT to the signal received withoutany missing sample from the patient gives the result shown inFigure 6, which contains two sub-results. Upper figure shows theanalysis signal in the survey. The scalogram chart in lower figureis Daubechies (db-2) Wavelet (Tariq et al., 2017). It is importantto note that in normalized case, the heart rate is between 60–120beats/min, which is related to the scale value of 35–75. Theappropriate measurement range is chosen for the heart rate andthe selected scale, where Wavelet coefficients have the largest lowenergy, as shown in Figure 6. For heart rate, the approximatescale has a value of 42 (continuous pink line in Figure 6), whichcorresponds to a frequency of 1.801 Hz in Figure 7. The heart ratecan be calculated as 1.801 × 60 � 108.08 bpm.
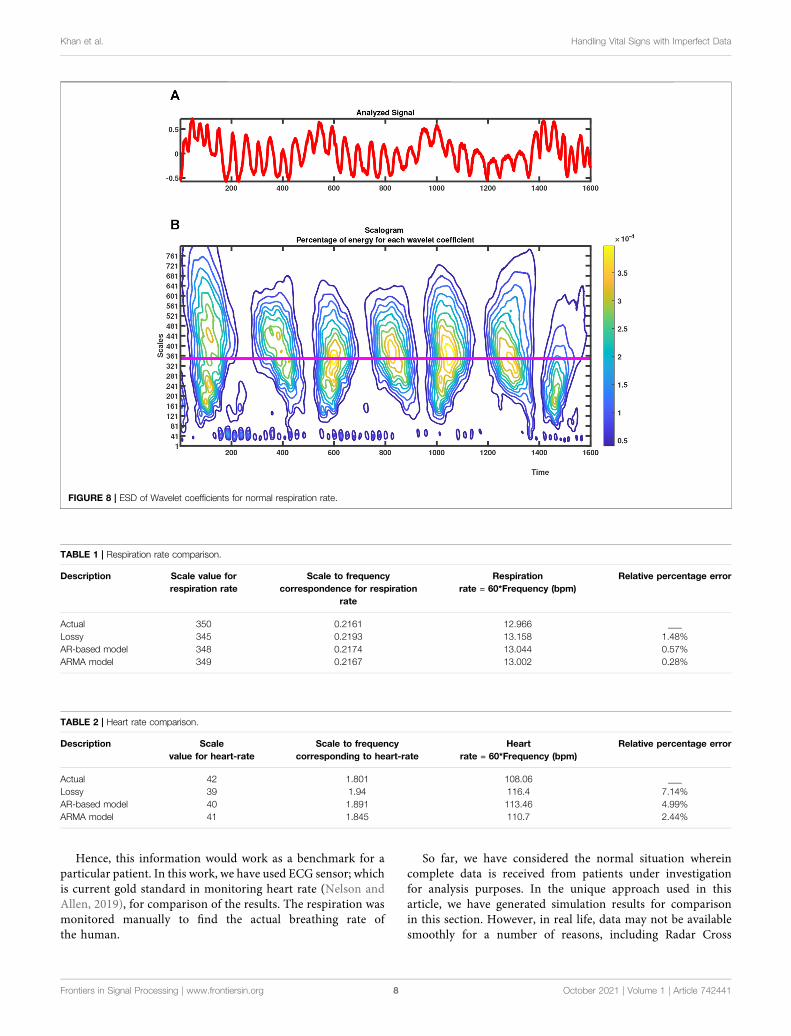
In the same way, the range of respiration rate lies between10–30 bpm, which corresponds to a scale value of 150–450 (Chiaet al., 2005; Wang et al., 2017). The respiration rate scale can beselected by measuring the maximum spectral energy within theseranges. The generated scale value associated with the loss-freedata is 350 as shown in Figure 8. The 350 scale value correspondsto a frequency of 0.2161 Hz in Supplementary Figure S1.Therefore, the heart rate can be calculated as 12.96 �(0.2161*60) bpm. There are two readings, obtained fromuninterrupted signal, which are:
1. Respiration rate � 12.96 bpm.2. Heart rate � 108.08 bpm.
FIGURE 5 | Frequency plot of Daubechies (db-2) Wavelet.
Frontiers in Signal Processing | www.frontiersin.org October 2021 | Volume 1 | Article 7424416
Khan et al. Handling Vital Signs with Imperfect Data
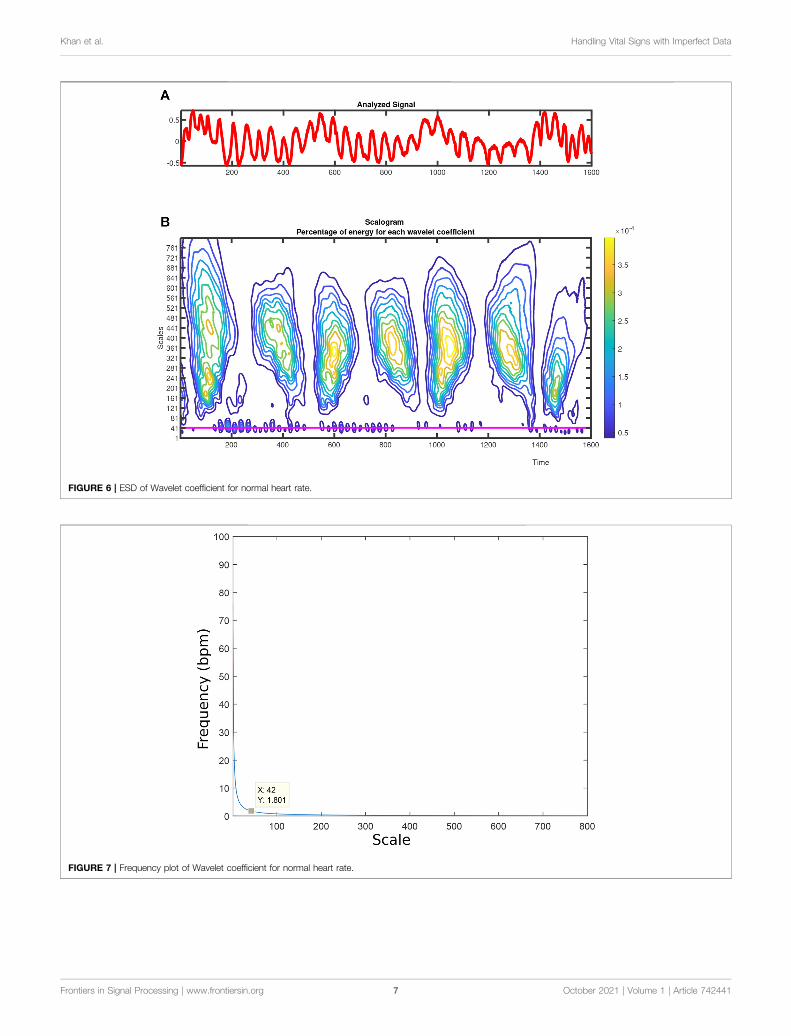
FIGURE 6 | ESD of Wavelet coefficient for normal heart rate.
FIGURE 7 | Frequency plot of Wavelet coefficient for normal heart rate.
Frontiers in Signal Processing | www.frontiersin.org October 2021 | Volume 1 | Article 7424417
Khan et al. Handling Vital Signs with Imperfect Data
Hence, this information would work as a benchmark for aparticular patient. In this work, we have used ECG sensor; whichis current gold standard in monitoring heart rate (Nelson andAllen, 2019), for comparison of the results. The respiration wasmonitored manually to find the actual breathing rate ofthe human.
So far, we have considered the normal situation whereincomplete data is received from patients under investigationfor analysis purposes. In the unique approach used in thisarticle, we have generated simulation results for comparisonin this section. However, in real life, data may not be availablesmoothly for a number of reasons, including Radar Cross
FIGURE 8 | ESD of Wavelet coefficients for normal respiration rate.
TABLE 1 | Respiration rate comparison.
Description Scale value forrespiration rate
Scale to frequencycorrespondence for respiration
rate
Respirationrate = 60*Frequency (bpm)
Relative percentage error
Actual 350 0.2161 12.966 ___Lossy 345 0.2193 13.158 1.48%AR-based model 348 0.2174 13.044 0.57%ARMA model 349 0.2167 13.002 0.28%
TABLE 2 | Heart rate comparison.
Description Scalevalue for heart-rate
Scale to frequencycorresponding to heart-rate
Heartrate = 60*Frequency (bpm)
Relative percentage error
Actual 42 1.801 108.06 ___Lossy 39 1.94 116.4 7.14%AR-based model 40 1.891 113.46 4.99%ARMA model 41 1.845 110.7 2.44%
Frontiers in Signal Processing | www.frontiersin.org October 2021 | Volume 1 | Article 7424418
Khan et al. Handling Vital Signs with Imperfect Data
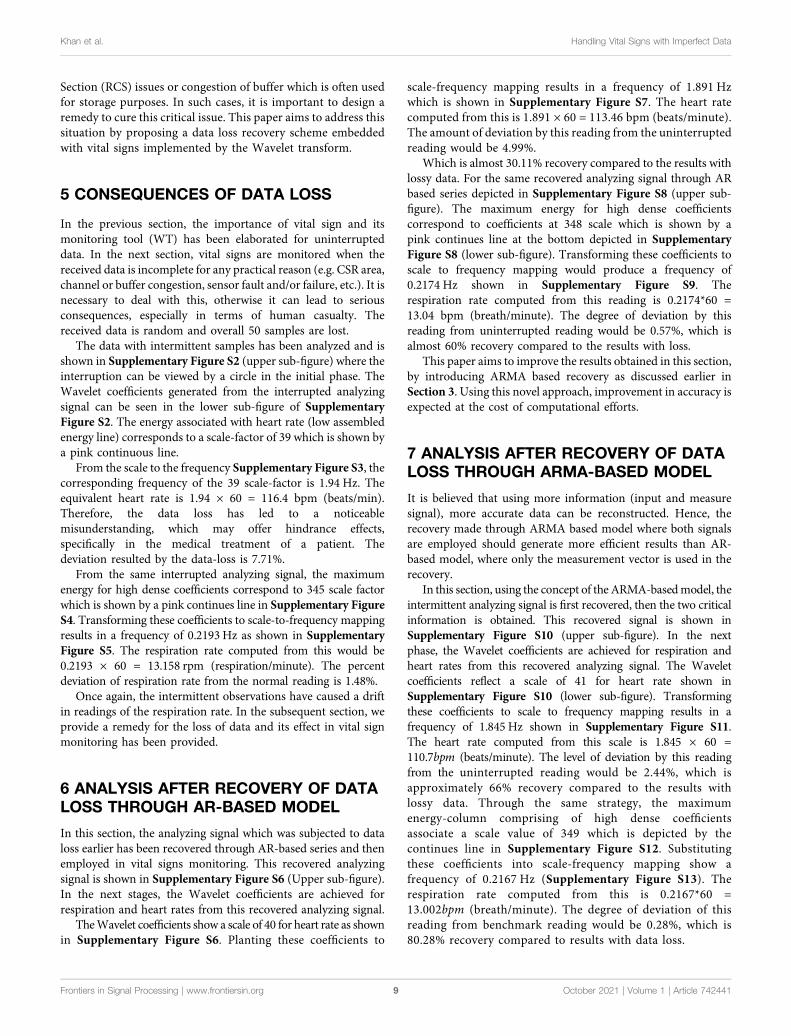
Section (RCS) issues or congestion of buffer which is often usedfor storage purposes. In such cases, it is important to design aremedy to cure this critical issue. This paper aims to address thissituation by proposing a data loss recovery scheme embeddedwith vital signs implemented by the Wavelet transform.
5 CONSEQUENCES OF DATA LOSS
In the previous section, the importance of vital sign and itsmonitoring tool (WT) has been elaborated for uninterrupteddata. In the next section, vital signs are monitored when thereceived data is incomplete for any practical reason (e.g. CSR area,channel or buffer congestion, sensor fault and/or failure, etc.). It isnecessary to deal with this, otherwise it can lead to seriousconsequences, especially in terms of human casualty. Thereceived data is random and overall 50 samples are lost.
The data with intermittent samples has been analyzed and isshown in Supplementary Figure S2 (upper sub-figure) where theinterruption can be viewed by a circle in the initial phase. TheWavelet coefficients generated from the interrupted analyzingsignal can be seen in the lower sub-figure of SupplementaryFigure S2. The energy associated with heart rate (low assembledenergy line) corresponds to a scale-factor of 39 which is shown bya pink continuous line.
From the scale to the frequency Supplementary Figure S3, thecorresponding frequency of the 39 scale-factor is 1.94 Hz. Theequivalent heart rate is 1.94 × 60 � 116.4 bpm (beats/min).Therefore, the data loss has led to a noticeablemisunderstanding, which may offer hindrance effects,specifically in the medical treatment of a patient. Thedeviation resulted by the data-loss is 7.71%.
From the same interrupted analyzing signal, the maximumenergy for high dense coefficients correspond to 345 scale factorwhich is shown by a pink continues line in Supplementary FigureS4. Transforming these coefficients to scale-to-frequency mappingresults in a frequency of 0.2193 Hz as shown in SupplementaryFigure S5. The respiration rate computed from this would be0.2193 × 60 � 13.158 rpm (respiration/minute). The percentdeviation of respiration rate from the normal reading is 1.48%.
Once again, the intermittent observations have caused a driftin readings of the respiration rate. In the subsequent section, weprovide a remedy for the loss of data and its effect in vital signmonitoring has been provided.
6 ANALYSIS AFTER RECOVERY OF DATALOSS THROUGH AR-BASED MODEL
In this section, the analyzing signal which was subjected to dataloss earlier has been recovered through AR-based series and thenemployed in vital signs monitoring. This recovered analyzingsignal is shown in Supplementary Figure S6 (Upper sub-figure).In the next stages, the Wavelet coefficients are achieved forrespiration and heart rates from this recovered analyzing signal.
TheWavelet coefficients show a scale of 40 for heart rate as shownin Supplementary Figure S6. Planting these coefficients to
scale-frequency mapping results in a frequency of 1.891 Hzwhich is shown in Supplementary Figure S7. The heart ratecomputed from this is 1.891 × 60 � 113.46 bpm (beats/minute).The amount of deviation by this reading from the uninterruptedreading would be 4.99%.
Which is almost 30.11% recovery compared to the results withlossy data. For the same recovered analyzing signal through ARbased series depicted in Supplementary Figure S8 (upper sub-figure). The maximum energy for high dense coefficientscorrespond to coefficients at 348 scale which is shown by apink continues line at the bottom depicted in SupplementaryFigure S8 (lower sub-figure). Transforming these coefficients toscale to frequency mapping would produce a frequency of0.2174 Hz shown in Supplementary Figure S9. Therespiration rate computed from this reading is 0.2174*60 �13.04 bpm (breath/minute). The degree of deviation by thisreading from uninterrupted reading would be 0.57%, which isalmost 60% recovery compared to the results with loss.
This paper aims to improve the results obtained in this section,by introducing ARMA based recovery as discussed earlier inSection 3. Using this novel approach, improvement in accuracy isexpected at the cost of computational efforts.
7 ANALYSIS AFTER RECOVERY OF DATALOSS THROUGH ARMA-BASED MODEL
It is believed that using more information (input and measuresignal), more accurate data can be reconstructed. Hence, therecovery made through ARMA based model where both signalsare employed should generate more efficient results than AR-based model, where only the measurement vector is used in therecovery.
In this section, using the concept of the ARMA-basedmodel, theintermittent analyzing signal is first recovered, then the two criticalinformation is obtained. This recovered signal is shown inSupplementary Figure S10 (upper sub-figure). In the nextphase, the Wavelet coefficients are achieved for respiration andheart rates from this recovered analyzing signal. The Waveletcoefficients reflect a scale of 41 for heart rate shown inSupplementary Figure S10 (lower sub-figure). Transformingthese coefficients to scale to frequency mapping results in afrequency of 1.845 Hz shown in Supplementary Figure S11.The heart rate computed from this scale is 1.845 × 60 �110.7bpm (beats/minute). The level of deviation by this readingfrom the uninterrupted reading would be 2.44%, which isapproximately 66% recovery compared to the results withlossy data. Through the same strategy, the maximumenergy-column comprising of high dense coefficientsassociate a scale value of 349 which is depicted by thecontinues line in Supplementary Figure S12. Substitutingthese coefficients into scale-frequency mapping show afrequency of 0.2167 Hz (Supplementary Figure S13). Therespiration rate computed from this is 0.2167*60 �13.002bpm (breath/minute). The degree of deviation of thisreading from benchmark reading would be 0.28%, which is80.28% recovery compared to results with data loss.
Frontiers in Signal Processing | www.frontiersin.org October 2021 | Volume 1 | Article 7424419
Khan et al. Handling Vital Signs with Imperfect Data
To summarize, four compact scenarios have been compiled formonitoring of vital signs, namely;
1. When normal data arrives (without any loss).2. When there is random data loss.3. When the data is recovered through AR-based model (existing
method)4. When data is recovered through ARMA-based model
(proposed technique)
A total of 50 samples are manually lost at a particular location.Although various scenarios may be introduced and describedthrough this case study. In this paper, a chunk of data, collectivelyat one location is considered to be lost. Table 1 and Table 2summarize the performance of two algorithms (existing AR-based model and proposed ARMA-based model) for therespiration and heart rates, respectively. As can be viewedfrom the last row of the two tables, the proposed ARMA-based model efficiently reproduced the lost information andthe vital signs (the two rates) are very much close to actualreadings. Hence it results in minimum error.
CONCLUSION
In this paper, vital signs monitoring has been considered forpractically achieved data. Due to its direct link with humanbeings, the importance of vital signs is very clear. The loss ofsuch information needs to be efficiently handled in order to avoidcatastrophic results. Initially, the vital signs are monitored fromnormal data, where there is no data loss. This provides abenchmark to perform comparison for later stages wheremeasurement data is intermittent in nature after striking thepatient. This lossy data has been observed in vital sign monitoring(heart and respiration rates) with degrading outcomes. This dataloss is then attempted to be recovered through the AR-basedmodel which gives much better results compared to lossy results.However, the AR-based model entertained only the measurementvector in the recovery process. An improved version is introducedin this paper, which implies both measurement vector and inputdata in the recovery phase. After recovery, when implanted in thevital sign monitoring, the simulation results show that moreefficient and closer to actual data is obtained through this scheme.In other words, the reproduced data is less affected by data-losswhich is verified by vital sign monitoring results.
It can be concluded that, if any data has a certain level of atrend in its structure, the data can be reproduced through the AR-based or ARMA-based model. If not, then piece-wise similaritymay be assumed in the recovery process. It is necessary tomention that both AR and ARMA-based models arecomputationally expensive. In future, non-stationary attitudemay be investigated in the same context as it could givefurther insights into the problem.
DATA AVAILABILITY STATEMENT
The raw data supporting the conclusion of this article will bemade available by the authors, without undue reservation.
AUTHOR CONTRIBUTIONS
NK designed the experiments, wrote the paper and supervised thealgorithm development. SS worked on the implementation ofalgorithms. IA and FK (1st author) helped in experiments todesign and write the manuscript. FK (5th author) participated indata collection and paper writing.
FUNDING
This research work was jointly supported by the EU H2020MSCA project UWB-IODA SF-PC (project no. 838037) andLab-STICC (UBO, Brest France), CNRS, UMR 6285.
SUPPLEMENTARY MATERIAL
The SupplementaryMaterial for this article can be found online at:https://www.frontiersin.org/articles/10.3389/frsip.2021.742441/full#supplementary-material
Supplementary Figure S1 | Frequency plot of Wavelet coefficients for normalrespiration rate.
Supplementary Figure S2 | ESD of Wavelet coefficients for heart rate (Lossy Data).
Supplementary Figure S3 | Frequency plot of Wavelet coefficients for heart rate(Lossy Data).
Supplementary Figure S4 | ESD of Wavelet coefficients for respiration rate (Lossydata).
Supplementary Figure S5 | Frequency plot of Wavelet coefficients for respirationrate (Lossy data).
Supplementary Figure S6 | ESD of Wavelet coefficients for heart rate (AR-basedapproach).
Supplementary Figure S7 | Frequency plot for Wavelet coefficients for heart rate(AR-based approach).
Supplementary Figure S8 | ESD of Wavelet coefficients for respiration rate (AR-based approach).
Supplementary Figure S9 | Frequency plot of Wavelet coefficients for respirationrate (AR-based model).
Supplementary Figure S10 | ESD of Wavelet coefficients for heart rate (ARMA-based approach).
Supplementary Figure S11 | Frequency plot for Wavelet coefficients for heart rate(ARMA-based approach).
Supplementary Figure S12 | ESD of Wavelet coefficients for respiration rate(ARMA-based approach).
Supplementary Figure S13 | Frequency plot of Wavelet coefficients for respirationrate (ARMA-based model).
Frontiers in Signal Processing | www.frontiersin.org October 2021 | Volume 1 | Article 74244110
Khan et al. Handling Vital Signs with Imperfect Data
REFERENCES
Andersen, N., Granhaug, K., Michaelsen, J. A., Bagga, S., Hjortland, H. A., Knutsen,M. R., et al. (2017). A 118-mw Pulse-Based Radar Soc in 55-nm Cmos for Non-Contact Human Vital Signs Detection. IEEE J. Solid-State Circuits 52,3421–3433. doi:10.1109/jssc.2017.2764051
Briso, C., Calvo, C., and Xu, Y. (2019). Uwb Propagation Measurements andModelling in Large Indoor Environments. IEEE Access 7, 41913–41920.doi:10.1109/access.2019.2905142
Buehrer, R. M., Davis, W. A., Safaai-Jazi, A., and Sweeney, D. (2003).“Characterization of the Ultra-Wideband Channel,” in IEEE Conference onUltra Wideband Systems and Technologies, Reston, VA, 26–31. doi:10.1109/UWBST.2003.1267796
Cardillo, E., Li, C., and Caddemi, A. (2021). Vital Sign Detection and Radar Self-Motion Cancellation through Clutter Identification. IEEE Trans. MicrowaveTheor. Techn. 69, 1932–1942. doi:10.1109/tmtt.2021.3049514
Chia, M. Y. W., Leong, S. W., Sim, C. K., and Chan, K. M. (2005). “Through-wallUWB Radar Operating within FCC’s Mask for Sensing Heart Beat andBreathing Rate,” in European Radar Conference, Paris, France, 267.doi:10.1109/EUMC.2005.1610358
Chóliz, J., Hernández, Á., and Valdovinos, A. (2011). A Framework for Uwb-BasedCommunication and Location Tracking Systems for Wireless Sensor Networks.Sensors 11, 9045–9068. doi:10.3390/s110909045
Cramer, R. J.-M., Scholtz, R. A., and Win, M. Z. (2002). Evaluation of an Ultra-Wide-Band Propagation Channel. IEEE Trans. Antennas Propagat. 50,561–570. doi:10.1109/tap.2002.1011221
Fear, E. C., Li, X., Hagness, S. C., and Stuchly, M. A. (2002). Confocal MicrowaveImaging for Breast Cancer Detection: Localization of Tumors in ThreeDimensions. IEEE Trans. Biomed. Eng. 49, 812–822. doi:10.1109/tbme.2002.800759
Fernandes, J. R., and Wentzloff, D. (2010). “Recent Advances in Ir-UwbTransceivers: An Overview,” in Proceedings of 2010 IEEE InternationalSymposium on Circuits and Systems, Paris, France, 3284–3287. doi:10.1109/ISCAS.2010.5537916
Fontana, R. J. (2004). Recent System Applications of Short-Pulse Ultra-Wideband(Uwb) Technology. IEEE Trans. Microwave Theor. Techn. 52, 2087–2104.doi:10.1109/tmtt.2004.834186
Grewal, M., and Andrews, A. (2001). Kalman Filtering: Theory and Practice UsingMATLAB. Hoboken, New Jersey: John Wiley & Sons.
Gu, C., Wang, G., Inoue, T., and Li, C. (2013). “Doppler Radar Vital Sign Detectionwith Random Body Movement Cancellation Based on Adaptive PhaseCompensation,” in IEEE MTT-S International Microwave SymposiumDigest (MTT), Seattle, WA, 1–3. doi:10.1109/mwsym.2013.6697618
Khan, F., and Cho, S. (2017). A Detailed Algorithm for Vital Sign Monitoring of aStationary/Non-Stationary Human through IR-UWB Radar. Sensors 17, 290.doi:10.3390/s17020290
Khan, F., Ghaffar, A., Khan, N., and Cho, S. H. (2020). An Overview of SignalProcessing Techniques for Remote Health Monitoring Using Impulse RadioUwb Transceiver. Sensors 20, 2479. doi:10.3390/s20092479
Khan, F., Leem, S. K., and Cho, S. H. (2018). Human-Computer Interaction UsingRadio Sensor for People with Severe Disability. Sensors Actuators A: Phys. 282,39–54. doi:10.1016/j.sna.2018.08.051
Khan, N., Fekri, S., and Gu, D. (2010). Improvement on State Estimation forDiscrete-Time Lti Systems with Measurement Loss. Measurement 43,1609–1622. doi:10.1016/j.measurement.2010.09.011
Khan, N., Khan, K., Khan, A., Alam, I., Khan, F. U., Khan, S. U., et al. (2019).Accommodate Data Loss in Monitoring Vital Signs through AutoregressiveModel. J Med. Imaging Hlth Inform. 9, 1205–1214. doi:10.1166/jmihi.2019.2712
Khan, N., Khattak, M. I., Khan, M. N., Khan, F., Khan, L. U., Salam, S. A., and Gu,D.-W. (2013). “Implementation of Linear Prediction Techniques in StateEstimation,” in Proceedings of 2013 10th International Bhurban Conference
on Applied Sciences Technology (IBCAST), Islamabad, Pakistan, 77–83.doi:10.1109/IBCAST.2013.6512134
Lazaro, A., Girbau, D., and Villarino, R. (2009). Wavelet-Based Breast TumorLocalization Technique Using a Uwb Radar. Prog. Electromagnetics Res. 98,75–95. doi:10.2528/pier09100705
Le, M. (2020). Heart Rate Extraction Based on Eigenvalues Using Uwb ImpulseRadar Remote Sensing. Sensors Actuators A: Phys. 303, 111689. doi:10.1016/j.sna.2019.111689
Li, B., Zhou, Z., Zou, W., Li, D., and Zhao, C. (2010). Optimal Waveforms Designfor Ultra-Wideband Impulse Radio Sensors. Sensors 10, 11038–11063.doi:10.3390/s101211038
Liu, H., Allen, J., Zheng, D., and Chen, F. (2019). Recent Development ofRespiratory Rate Measurement Technologies. Physiol. Meas. 40, 07TR01–28.doi:10.1088/1361-6579/ab299e
Nelson, B. W., and Allen, N. B. (2019). Accuracy of Consumer Wearable Heart RateMeasurement during an Ecologically Valid 24-Hour Period: IntraindividualValidation Study. JMIR Mhealth Uhealth 7, e10828. doi:10.2196/10828
Oziel, M., Korenstein, R., and Rubinsky, B. (2017). Radar Based Technology forNon-Contact Monitoring of Accumulation of Blood in the Head: A NumericalStudy. PLOS ONE 12, e0186381–20. doi:10.1371/journal.pone.0186381
Shen, H., Xu, C., Yang, Y., Sun, L., Cai, Z., Bai, L., et al. (2018). Respiration andHeartbeat Rates Measurement Based on Autocorrelation Using Ir-Uwb Radar.IEEE Trans. Circuits Syst. 65, 1470–1474. doi:10.1109/tcsii.2018.2860015
Sifuzzaman, M., Islam, M. R., and Ali, M. Z. (2009). Application of WaveletTransform and its Advantages Compared to Fourier Transform. J. Phys. Sci. 13,121–134.
Staderini, E. M. (2002). Uwb Radars in Medicine. IEEE Aerosp. Electron. Syst. Mag.17, 13–18. doi:10.1109/62.978359
Tariq, A., Zahid, A., Khan, U., Khan, N., and Khan, F. (2017). “Implementation ofWavelet Transform for Monitoring of Vital Signs through Ir-Uwb Radar,” in2017 International Conference on Communication, Computing andDigital Systems (C-CODE), Islamabad, Pakistan, 337–340. doi:10.1109/C-CODE.2017.7918953
Thiel, F., Kosch, O., and Seifert, F. (2010). Ultra-Wideband Sensors for ImprovedMagnetic Resonance Imaging, Cardiovascular Monitoring and TumourDiagnostics. Sensors 10, 10778–10802. doi:10.3390/s101210778
Wang, G. R., Han, H. G., Kim, S. Y., and Kim, T. W. (2017). Wireless Vital SignMonitoring Using Penetrating Impulses. IEEE Microw. Wireless Compon. Lett.27, 94–96. doi:10.1109/lmwc.2016.2630001
Yang, X., Zhang, X., Qian, H., Ding, Y., and Zhang, L. (2020). “Mmt-Hear: MultipleMoving Targets Heartbeats Estimation and Recovery Using Ir-Uwb Radars,” in42nd Annual International Conference of the IEEE Engineering in Medicineand Biology Society (EMBC), Montreal, QC, 5733–5736. doi:10.1109/EMBC44109.2020.9175318
Conflict of Interest: The authors declare that the research was conducted in theabsence of any commercial or financial relationships that could be construed as apotential conflict of interest.
Publisher’s Note: All claims expressed in this article are solely those of the authorsand do not necessarily represent those of their affiliated organizations, or those ofthe publisher, the editors and the reviewers. Any product that may be evaluated inthis article, or claim that may be made by its manufacturer, is not guaranteed orendorsed by the publisher.
Copyright © 2021 Khan, Sherazi, Khan, Ashraf and Khan. This is an open-accessarticle distributed under the terms of the Creative Commons Attribution License (CCBY). The use, distribution or reproduction in other forums is permitted, provided theoriginal author(s) and the copyright owner(s) are credited and that the originalpublication in this journal is cited, in accordance with accepted academic practice.No use, distribution or reproduction is permitted which does not comply withthese terms.
Frontiers in Signal Processing | www.frontiersin.org October 2021 | Volume 1 | Article 74244111
Khan et al. Handling Vital Signs with Imperfect Data
Related Documents