© Hamburger Hafen und Logistik AG ANALYST CONFERENCE ON 2012 FINANCIAL YEAR RESULTS Hamburg, 27 March 2013 HAMBURGER HAFEN UND LOGISTIK AG

Welcome message from author
This document is posted to help you gain knowledge. Please leave a comment to let me know what you think about it! Share it to your friends and learn new things together.
Transcript

© Hamburger Hafen und Logistik AG
ANALYST CONFERENCE ON 2012 FINANCIAL YEAR RESULTS
Hamburg, 27 March 2013
HAMBURGER HAFEN UND LOGISTIK AG

2Analyst Conference, 27 March 2013 © Hamburger Hafen und Logistik AG
� Business Development 2012 Klaus-Dieter Peters
CEO
� Annual Financial Statements 2012 Dr. Roland Lappin
CFO
� Outlook 2013 Klaus-Dieter Peters
CEO
� Questions & Answers Klaus-Dieter Peters
Dr. Roland Lappin
Agenda

3
The 2012 Financial Year at a GlanceMarket position strengthened, course set for future earnings power
Business Development 2012
� Market position expanded against
competing European ports
� Comparably high earnings level maintained
� Updated forecast (summer 2012) met,
with EBIT margin close to initial target
� Company’s value further increased
� Future earnings power enhanced by
► automation in the Container segment
► realignment of the Intermodal segment
Proposal of an unchanged dividend of € 0.65 per Class A share.
Revenue € 1,128.5 million
EBIT € 186.3 million
EBIT margin 16.5 %
Investments € 196.5 million
Free cash flow € 49.6 million
Value
contribution € 43.1 million (EBIT less cost of capital)
Analyst Conference, 27 March 2013 © Hamburger Hafen und Logistik AG

4
Enhanced Market Position in Northern EuropeVolume trend at HHLA’s container terminals in Hamburg in comparison
Largest ports in the North Range
Throughput in million TEU / growth rates in %
Antwerp
Bremen ports
Hamburg
HHLA
Rotterdam
8.6
8.9
7.0
6.1
11.9
- 1.7 %
+ 1.6 %
- 0.3 %
+ 3.4 %
- 0.1 %� Economic slowdown
over the course of the year
� Surplus capacity
at competing ports
� Further delay in dredging
the river Elbe
� Increase in container
mega-ships (ultra large
carriers)
HHLA improved its market share from 19.3 % to 19.6 %.
Market environment in 2012
Business Development 2012
Analyst Conference, 27 March 2013 © Hamburger Hafen und Logistik AG

5
Baltic Sea(Eastern Europe)
+ 15.7 %
Far East- 8.3 %
Central and Eastern Europe
+ 0.1 %
North America+ 19.4 %
Regional split of seaborne throughputFar East 43.3 %
Eastern Europe/Baltic Sea 13.5 %
North America 7.8 %
� High utilisation grade on North America services
� Increase in Baltic Sea traffic based on attractive feeder network
� Considerable drop in Far East traffic due to macro environment
� Stable volume in HHLA’shinterland traffic despite a shrinking market thanks to new connections
HHLA’s Large International Gateway HubVolume trends on key transport routes (2012)
Throughput
Transportation
Business Development 2012
Analyst Conference, 27 March 2013 © Hamburger Hafen und Logistik AG
*
*
* based on new ownership structure inIntermodal Segment

6
Container Segment
Container throughput 7,183 thousand TEU + 1.4 %
Revenue € 697.5 million - 2.2 %
EBIT € 146.2 million - 25.2 %
Investments € 132.4 million + 50.8 %
Capabilities for mega-ship handling improved
Key figures 2012
� Investments
- Focus on improving performance and ship size development
- Extending the timescale of further capacity expansion
� Revenue development
- Slightly behind throughput development due to a strong
rise in the feeder ratio (from 24.7 % to 26.7 %)
- Sharp fall in storage fees (reduced container dwell times)
� Earnings burdened by
- Further delay in dredging the river Elbe
- Cost inflation (e.g. for staff, energy)
- Ramp-up and lead-lag costs for the new operating
system at CTB
Business Development 2012
Analyst Conference, 27 March 2013 © Hamburger Hafen und Logistik AG

7
Terminal controlcentreIntegrated terminalmanagement in 24/7shifts.
Status on CTB UpgradeLate 2012: The components of the ‘new CTB’ are working as an integrated system
Tandem gantry cranesThese handle 2 FEU respectively 4 TEU per move.
Container rail head8 tracks, each over 700 mlong enabling completeblock trains to be handled.
Automatedstorage blocksBoost capacity with high-density storage.
Automatic operation with3 cranes per block.
Business Development 2012
Analyst Conference, 27 March 2013 © Hamburger Hafen und Logistik AG

8
Intermodal Segment
� ..\..\Bilder\Final\jpg_rgb_ppt\Container_12x7cm.jpg
Container transport pro forma 993 thousand TEU + 0.1 %
Container transport 1,213 thousand TEU - 35.7 %
Revenue € 299.7 million - 16.2 %
EBIT € 41.3 million + 68.0 %
Investments € 46.9 million + 45.7 %
Substantial investments in expanding network and service capabilities
Key figures 2012
� Container volume (pro forma) kept stable by HHLA companies following realignment against a shrinking market (Germany - 2.7 %, Czech Republic - 6.7 %)
� Reduced transport volume due to the sale of the stake in loss-making TFG Transfracht
� Comparably high revenue base despite deconsolidation of TFG Transfracht thanks to new long-haul connections and price increases
� EBIT improvement includes one-off gain of € 17.6 million (primarily from the sale of TFG Transfracht)
Business Development 2012
Analyst Conference, 27 March 2013 © Hamburger Hafen und Logistik AG

9
Network Expansion for CEERail terminals and connections covering Central and Eastern Europe (CEE)
Selective connections (trains per week)
Hamburg–Prague 76
Hamburg–Munich 10
Hamburg–Leipzig 12
Hamburg–Poznan 22
Poznan–Gdynia 6
Adriatic trains 48
Business Development 2012
Analyst Conference, 27 March 2013 © Hamburger Hafen und Logistik AG
Germany
Connections established to Munich, Nuremberg and Leipzig, with Dresden to follow
Austria
Own terminal in Krems, connections extended to Enns and Salzburg
Poland
Links to Polish seaports

10
Logistics Segment
Revenue € 91.9 million - 27.4 %
EBIT € 4.4 million FY11 neg.
Investments € 3.3 million - 15.4 %
Extensive portfolio complements HHLA’s service range
Key figures 2012
� Revenue: Down due to a accounting change in
fruit logistics (at-equity method), which is no longer included
in the segment reporting for 2012
� Earnings development: Operating earnings roughly on
a par with the previous year (2011: impairment charge of
€ 5.8 million for fruit logistics)
� Developments in the various areas:
- Dynamic developments in vehicle logistics
- Temporary fall in demand for dry bulk logistics
(coal due to audit of North German coal-fired power plants)
- Restructuring in contract logistics
- Strong growth in cruise logistics
- Increase in earnings and contracts in consultancy
Business Development 2012
Analyst Conference, 27 March 2013 © Hamburger Hafen und Logistik AG

11
Real Estate Segment Stable course of success based on sustainable portfolio development
Revenue € 32.4 million + 2.3 %
EBIT € 12.8 million + 7.7 %
Investments € 10.3 million + 134.1 %
Key figures 2012
� High occupancy rate maintained, earnings increased
� Substantial investments in new projects
(incl. renovating a building designed by Kallmorgen in the
historical warehouse district Speicherstadt)
� Market environment: Above-average fall in new lets and
slight drop in rents on the market for office space in
Hamburg
� Change in planning law enables additional property usage
in the historical warehouse district Speicherstadt
Business Development 2012
Analyst Conference, 27 March 2013 © Hamburger Hafen und Logistik AG

12
Sustainability: Focal Points in 2012Reporting in line with GSC and GRI; further progress on climate protection
CO2 emissions
Per container handled and
transported
- 24.5 %.
2008–2012
� Use of renewable energy
� Further process optimisation (dual cycle, twin operation)
Fleet of vehicles
Largest fleet of electric cars
of all North Range ports
0.0 local emissions
� 24 new cars powered by electricity alone
� Reliable and quiet
Professional training
HHLA invests in the qualification
of its employees
€ 5.2 million.
� Training commitment strengthened further with ca. € 400 per employee
High standards in sustainability reporting
� First company in maritime logistics to issue a declaration of
compliance with the German Sustainability Code (GSC)
� Audited reporting in line with the requirements of the
Global Reporting Initiative (GRI)
Business Development 2012
Analyst Conference, 27 March 2013 © Hamburger Hafen und Logistik AG

13Analyst Conference, 27 March 2013 © Hamburger Hafen und Logistik AG
� Business Development 2012 Klaus-Dieter Peters
CEO
� Annual Financial Statements 2012 Dr. Roland Lappin
CFO
� Outlook 2013 Klaus-Dieter Peters
CEO
� Questions & Answers Klaus-Dieter Peters
Dr. Roland Lappin
Agenda

14
Key FiguresImpact of consolidation effects, reorganisation and peak loads
HHLA Group 2012 2011 Change
Revenue € million 1,128.5 1,217.3 - 7.3 %
Earnings (EBIT) € million 186.3 207.0 - 10.0 %
ROCE % 13.7 15.4 - 1.7 pp
Investments € million 196.5 128.7 + 52.6 %
Employees as of 31.12. 4,915 4,797 + 2.4 %
Container throughput thousand TEU 7,183 7,087 + 1.4 %
Container transportpro forma
thousand TEU 993 992 + 0.1 %
Annual Financial Statements 2012
Analyst Conference, 27 March 2013 © Hamburger Hafen und Logistik AG

15
Operating Expenses
Personnel expenses
Cost of material
� Significant decline as a result of consolidation
� Mainly variable expense item
� Without one-off effects: slight volume-related
increase
Personnel expenses
� Wage increase with almost unchanged headcount
� Comparatively low consolidation effects
� Elevated work input caused by reorganisation and
peak load conditions
Other operating expenses
� Largely unchanged lease expenses
� Considerably lower external maintenance expenses
� Higher consultancy fees for development projects
Depreciation and amortisation
� Moderate increase in property, plant and equipment
� Absence of previous year’s impairment
Cost of materials
366.3
373.7
140.0
121.2
in € million
Other operating expenses
Depreciation and amortisation
2012
Throughput / transport growth: + 1.4 % / - 35.7 % Total operating expenses: - 5.7 %
432.9
359.5
142.9
2011
126.4 - 4.1 %
- 2.0 %
+ 4.0 %
- 15.4 %
Continuous cost management
Annual Financial Statements 2012
Analyst Conference, 27 March 2013 © Hamburger Hafen und Logistik AG

16
Financial PositionSolid financial fundament
Balance sheet as of 31 December 2012
Property, plant and equipment
Assets Liabilities2011
Free cash flow
2012
in € million
Othernon-current
assets
Currentassets
Equity
Pensionprovisions
Othernon-currentliabilities
Currentliabilities
25 %18 %
18 % 28 %
57 %
22 %
32 %
� Operating cash flow down 20.9 %
on the previous year at € 210.5 million
following earnings development
� Liquidity reserves of € 230.1 million
on the reporting date
128.1
49.6
€ 1,768.5 million
Annual Financial Statements 2012
Analyst Conference, 27 March 2013 © Hamburger Hafen und Logistik AG

17Analyst Conference, 27 March 2013 © Hamburger Hafen und Logistik AG
� Business Development 2012 Klaus-Dieter Peters
CEO
� Annual Financial Statements 2012 Dr. Roland Lappin
CFO
� Outlook 2013 Klaus-Dieter Peters
CEO
� Questions & Answers Klaus-Dieter Peters
Dr. Roland Lappin
Agenda
18
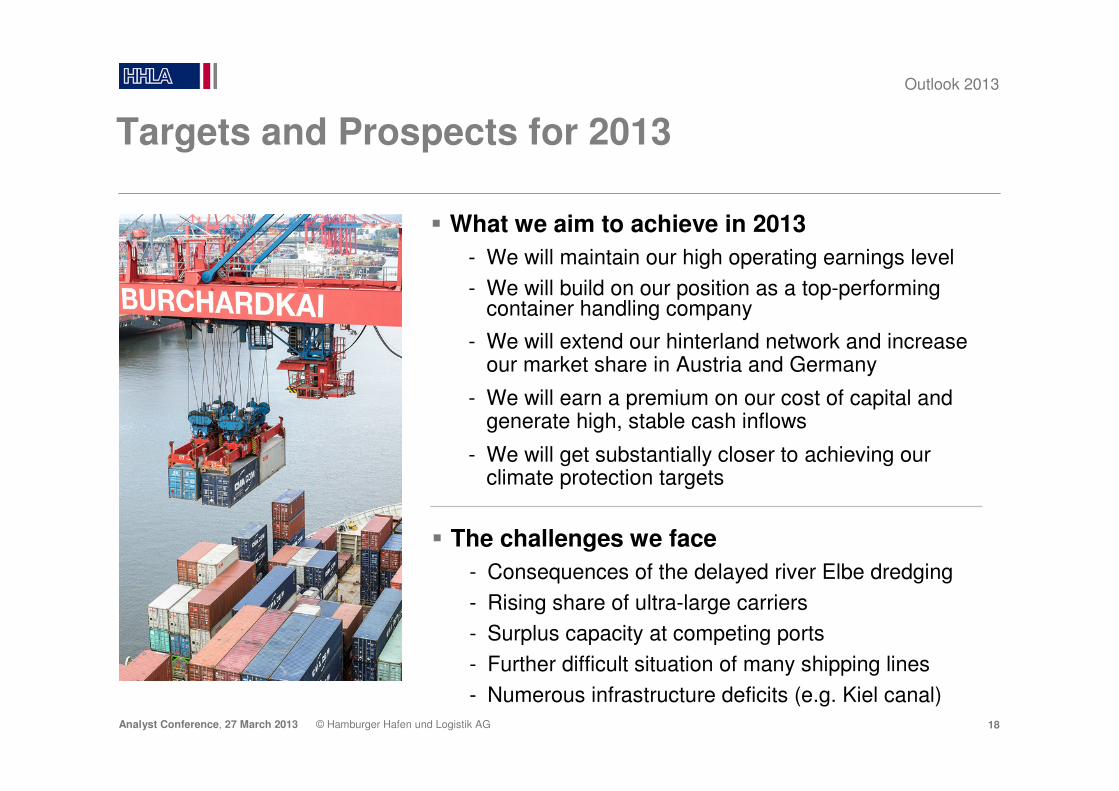
Targets and Prospects for 2013
Outlook 2013
� What we aim to achieve in 2013
- We will maintain our high operating earnings level
- We will build on our position as a top-performing container handling company
- We will extend our hinterland network and increase our market share in Austria and Germany
- We will earn a premium on our cost of capital and generate high, stable cash inflows
- We will get substantially closer to achieving our climate protection targets
� The challenges we face
- Consequences of the delayed river Elbe dredging
- Rising share of ultra-large carriers
- Surplus capacity at competing ports
- Further difficult situation of many shipping lines
- Numerous infrastructure deficits (e.g. Kiel canal)
Analyst Conference, 27 March 2013 © Hamburger Hafen und Logistik AG

19
Forecast 2013
Volumes
� Throughput roughly similar to previous year’s level of 7.2 million TEU (2012: 7.2 million TEU)
� Growth in transport volume to a level in the region of 1.1 million TEU (2012: 1.0 million TEU**)
Revenue
� Revenue in a range of € 1.1 billion to € 1.2 billion (2012: € 1.1 billion)
EBIT
� EBIT in a range of € 155 million and € 175 million (2012: adjusted EBIT of € 169 million***)
Investments
� Investments in the region of € 160 million (2012: € 197 million)
� Global economy (GDP) 3.5 %
� Global trade 3.8 %
� Container throughput, worldwide 4.6 %
� Container throughputNorthern Europe 0.6 %
� Transport volume, Germany 2.5 %
Currently incalculable risks
� Instability in the financial sector
� Escalation of the sovereign debt crisis
� Economic slowdown in key markets
� Market behaviour and strategies of shipping companies
Market environment * Group development
* IMF, Drewry, Federal Office for Freight Transport
Outlook 2013
** based on new ownership structure in Intermodal Segment *** EBIT 2012 of € 168.7 million after adjustment for one-off gain
of € 17.6 million (mainly on sale of stake in TFG Transfracht) Analyst Conference, 27 March 2013 © Hamburger Hafen und Logistik AG

20
Summary of Business Developments in 2012
� We expanded our market position in container
handling and at our transport companies
� We maintained a high level of profitability
despite the difficult operating environment
� We paved the way for future growth and higher
earnings by making forward-looking investments
in the container terminals and realigning the
Intermodal segment
� We increased our payout ratio in order to deliver
an unchanged dividend compared with the
previous year
Analyst Conference, 27 March 2013 © Hamburger Hafen und Logistik AG

21Analyst Conference, 27 March 2013 © Hamburger Hafen und Logistik AG
� Business Development 2012 Klaus-Dieter Peters
CEO
� Annual Financial Statements 2012 Dr. Roland Lappin
CFO
� Outlook 2013 Klaus-Dieter Peters
CEO
� Questions & Answers Klaus-Dieter Peters
Dr. Roland Lappin
Agenda

22Analyst Conference, 27 March 2013 © Hamburger Hafen und Logistik AG
27 Mar 2013 Annual Results 2012 Tel.: +49 40 3088 3100
14 May 2013 Interim Report Jan-Mar 2013 Fax: +49 40 3088 55 3100
13 June 2013 Annual General Meeting E-mail: [email protected]
14 Aug 2013 Interim Report Jan-Jun 2013 Web: www.hhla.de
13 Nov 2013 Interim Report Jan-Sep 2013
Financial Calendar IR Contact

23Analyst Conference, 27 March 2013 © Hamburger Hafen und Logistik AG
Appendix

24
Revenue Development
Annual Financial Statements 2012
Reconciliation from the previous year
in € million
2011
1,217.3
2012
1,128.5
Deconsolidation of TFG Transfracht(previously 50 %)
Full consolidation ofPolzug
(previously 33.3 %)
Net consolidationeffect since Q2 2012
- 73.2- 14.2
Virtuallyunchangedoperatingrevenue
- 1.4
At-equityaccounting
of fruit logisticssince January 2012
(previously fullyconsolidated)
- 7.3 %
Analyst Conference, 27 March 2013 © Hamburger Hafen und Logistik AG

25
Absence of a one-timecompensation payment
received in 2011
EBIT DevelopmentReconciliation from the previous year
in € million
2011
207.0
2012
186.3
One-off gainprimarily from the sale
of the stake in TFGTransfracht as part of
the Intermodal realignment
Deconsolidationof TFG Transfracht
Full consolidationof Polzug
At-equityaccounting of fruit logistics
+ 17.6+ 11.4
Effect of load mixand storage fees plusadditional expenses
caused by peak loads, reorganisation
and cost inflation
- 15.0
- 10.0 %
- 34.7
Annual Financial Statements 2012
Analyst Conference, 27 March 2013 © Hamburger Hafen und Logistik AG

26
Net Profit after Minority InterestsReconciliation from EBIT
in € million
EBIT Net profitafter minority interests
72.4
- 41.6
- 39.4Financial result
almost unchangedto the previous year
Effective tax rate
down 5.0 pp to 27.1 %
186.3 - 32.8
Tax expenses Minority interests
Share of net earnings up 10.4 ppto 35.2 %
Financial result
Affected by the Intermodal realignment
and profit distribution at CTA
Annual Financial Statements 2012
Analyst Conference, 27 March 2013 © Hamburger Hafen und Logistik AG

27
� Demand-based adjust-ments to investments and postponed expan-sion of the Container Terminal Odessa (CTO)
� Advanced completionof a new quay wall (finance lease)
InvestmentsActive utilisation of the expansion programme’s flexibility
Forecast at March 2012
~ 280
+ 30.5 196.5
- 114.0
Actual2012
Forecast2013
2011
128.7
in the region of ~ 160
Annual Financial Statements 2012
in € million
Analyst Conference, 27 March 2013 © Hamburger Hafen und Logistik AG
~ 250

28
Dividend
Dividend per Class A share / Payout ratio
in € / in %
2011
Earnings per Class A share
in €
2012
1.20
0.95
2011 2012
0.65 0.65*
1,6
1,3
* Dividend proposal
Payout ratio
54
68
◄ 50 %
◄ 70 %
� Income-based
dividend policy
maintained
� Unchanged dividend
proposed despite
lower earnings
� Sufficient liquidity
reserves retained
Increased payout ratio in the Port Logistics Subgroup
Annual Financial Statements 2012
29Analyst Conference, 27 March 2013 © Hamburger Hafen und Logistik AG
Disclaimer
The facts and information contained herein are as up to date as is reasonably possible and are subject to revision in the future. Neither the Company
nor any of its parent or subsidiary undertakings nor any of such person’s directors, officers, employees or advisors nor any other person makes any
representation or warranty, express or implied as to, and no reliance should be placed on, the accuracy or completeness of the information contained
in this presentation. Neither the Company, nor any of its parents or subsidiary undertakings nor any of their directors, employees and advisors nor any
other person shall have any liability whatsoever for loss howsoever arising, directly or indirectly, from any use of this presentation. The same applies to
information contained in other material made available at the presentation.
While all reasonable care has been taken to ensure that the facts stated herein are accurate and that the opinions contained herein are fair and
reasonable, this document is selective in nature. Where any information and statistics are quoted from any external source, such information or
statistics should not be interpreted as having been adopted or endorsed by the Company as being accurate.
This presentation contains forward-looking statements relating to the business, financial performance and results of the Company and/or the industry
in which the Company operates. These statements generally are identified by words such as “believes”, “expects”, “predicts”, “intends”, “projects”,
“plans”, “estimates”, “aims”, “foresees”, “anticipates”, “targets” and similar expressions. The forward-looking statements, including but not limited to
assumptions, opinions and views of the Company for information from third party sources, contained in this presentation are based on current plans,
estimates, assumptions and projections and involve uncertainties and risks. Various factors could cause actual future results, performance or events to
differ materially from those described in these statements. The Company does not represent or guarantee that the assumptions underlying such
forward-looking statements are free from errors and the Company does not accept any responsibility for the future accuracy of the opinions expressed
in this presentation. No obligation is assumed to update any forward-looking statements.
By accepting this presentation you acknowledge that you will be solely responsible for your own assessment of the market and the market position of
the Company and that you will conduct your own analysis and be solely responsible for forming your own view of the potential future performance of
the Company’s business.
This presentation is not a prospectus and does not constitute an offer or an invitation or solicitation to subscribe for, or purchase, any shares of the
Company and neither this presentation nor anything contained herein shall form the basis of, or be relied on in connection with, any offer or
commitment whatsoever.
Related Documents