© Hamburger Hafen und Logistik AG HAMBURGER HAFEN UND LOGISTIK AG Investor Presentation Sixth German Corporate Conference Munich, 19 September 2017

Welcome message from author
This document is posted to help you gain knowledge. Please leave a comment to let me know what you think about it! Share it to your friends and learn new things together.
Transcript
© Hamburger Hafen und Logistik AG
HAMBURGERHAFEN UND LOGISTIK AG
Investor Presentation
Sixth German Corporate Conference
Munich, 19 September 2017
© Hamburger Hafen und Logistik AG
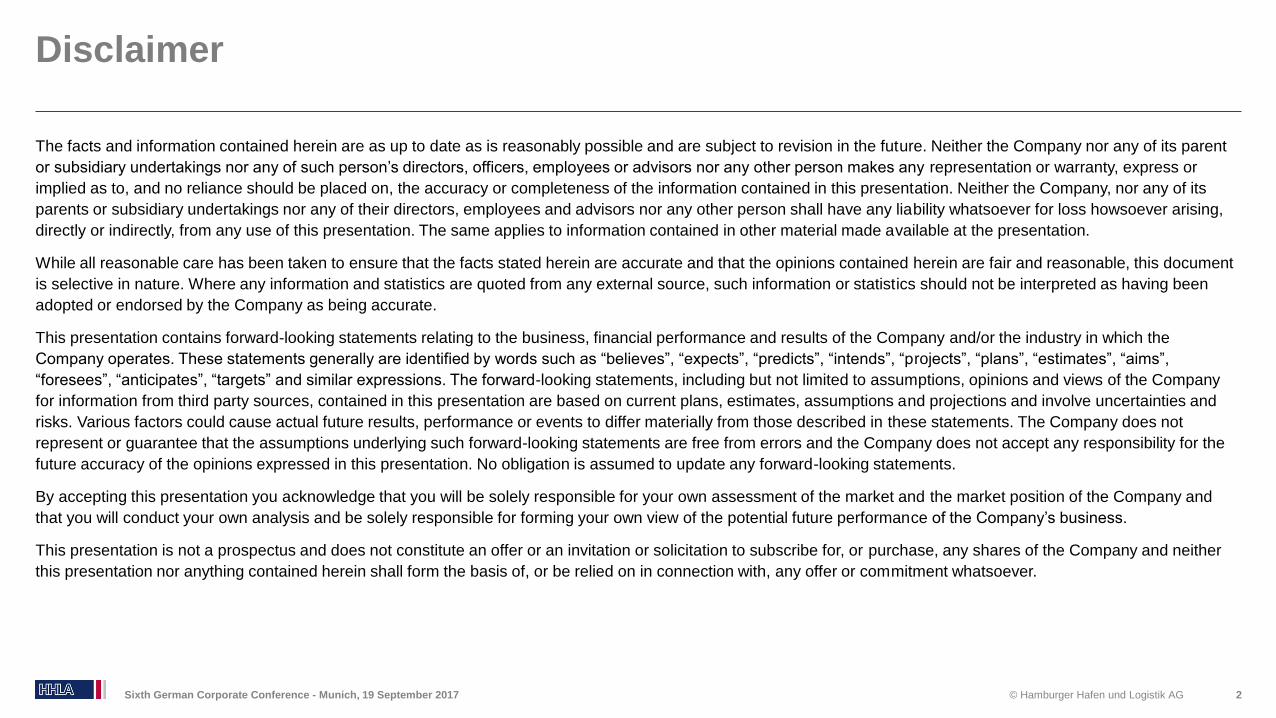
Disclaimer
The facts and information contained herein are as up to date as is reasonably possible and are subject to revision in the future. Neither the Company nor any of its parent
or subsidiary undertakings nor any of such person’s directors, officers, employees or advisors nor any other person makes any representation or warranty, express or
implied as to, and no reliance should be placed on, the accuracy or completeness of the information contained in this presentation. Neither the Company, nor any of its
parents or subsidiary undertakings nor any of their directors, employees and advisors nor any other person shall have any liability whatsoever for loss howsoever arising,
directly or indirectly, from any use of this presentation. The same applies to information contained in other material made available at the presentation.
While all reasonable care has been taken to ensure that the facts stated herein are accurate and that the opinions contained herein are fair and reasonable, this document
is selective in nature. Where any information and statistics are quoted from any external source, such information or statistics should not be interpreted as having been
adopted or endorsed by the Company as being accurate.
This presentation contains forward-looking statements relating to the business, financial performance and results of the Company and/or the industry in which the
Company operates. These statements generally are identified by words such as “believes”, “expects”, “predicts”, “intends”, “projects”, “plans”, “estimates”, “aims”,
“foresees”, “anticipates”, “targets” and similar expressions. The forward-looking statements, including but not limited to assumptions, opinions and views of the Company
for information from third party sources, contained in this presentation are based on current plans, estimates, assumptions and projections and involve uncertainties and
risks. Various factors could cause actual future results, performance or events to differ materially from those described in these statements. The Company does not
represent or guarantee that the assumptions underlying such forward-looking statements are free from errors and the Company does not accept any responsibility for the
future accuracy of the opinions expressed in this presentation. No obligation is assumed to update any forward-looking statements.
By accepting this presentation you acknowledge that you will be solely responsible for your own assessment of the market and the market position of the Company and
that you will conduct your own analysis and be solely responsible for forming your own view of the potential future performance of the Company’s business.
This presentation is not a prospectus and does not constitute an offer or an invitation or solicitation to subscribe for, or purchase, any shares of the Company and neither
this presentation nor anything contained herein shall form the basis of, or be relied on in connection with, any offer or commitment whatsoever.
Sixth German Corporate Conference - Munich, 19 September 2017 2
© Hamburger Hafen und Logistik AG
Agenda
Company Profile and Strategy
Business Update and Financial Performance 1H2017
Outlook 2017
Appendix
3Sixth German Corporate Conference - Munich, 19 September 2017
© Hamburger Hafen und Logistik AG
A Leading Port and Transport Logistics Group
4
Segments of the listed Port Logistics subgroup
Company Profile and Strategy
Sixth German Corporate Conference - Munich, 19 September 2017
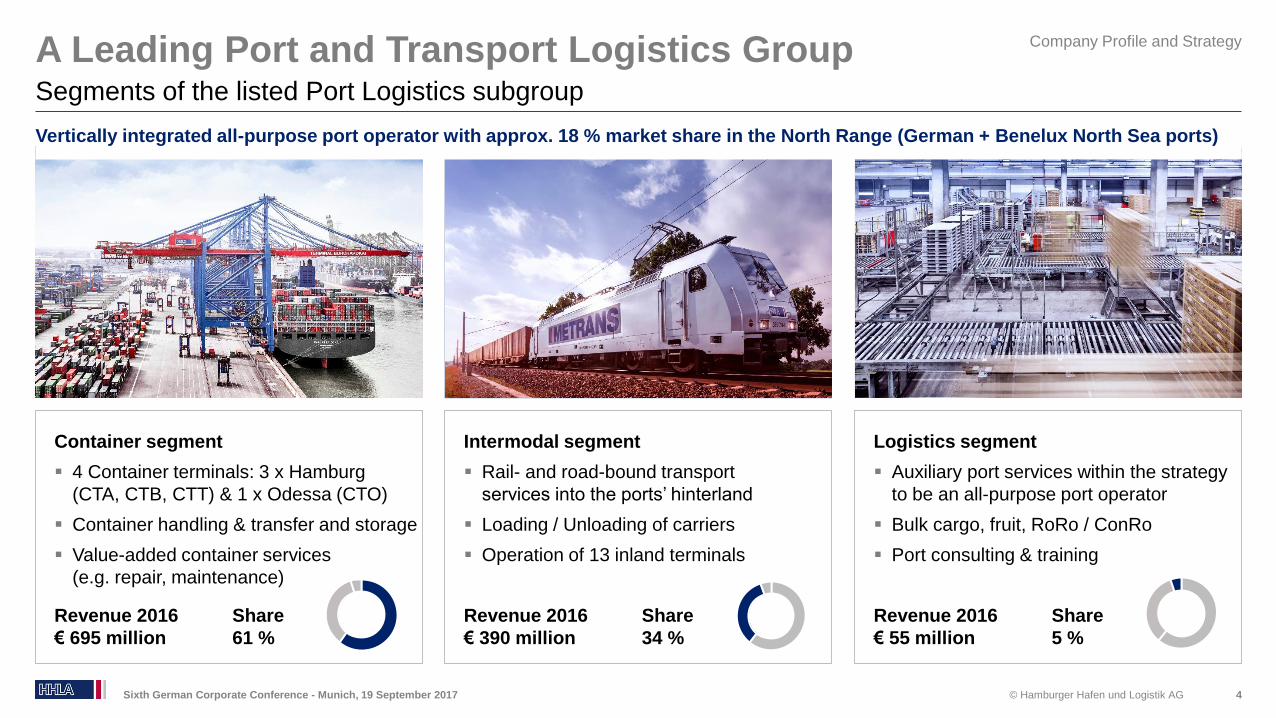
Logistics segment
Auxiliary port services within the strategy
to be an all-purpose port operator
Bulk cargo, fruit, RoRo / ConRo
Port consulting & training
Revenue 2016 Share
€ 55 million 5 %
Container segment
4 Container terminals: 3 x Hamburg
(CTA, CTB, CTT) & 1 x Odessa (CTO)
Container handling & transfer and storage
Value-added container services
(e.g. repair, maintenance)
Revenue 2016 Share
€ 695 million 61 %
Intermodal segment
Rail- and road-bound transport
services into the ports’ hinterland
Loading / Unloading of carriers
Operation of 13 inland terminals
Revenue 2016 Share
€ 390 million 34 %
Vertically integrated all-purpose port operator with approx. 18 % market share in the North Range (German + Benelux North Sea ports)
© Hamburger Hafen und Logistik AG
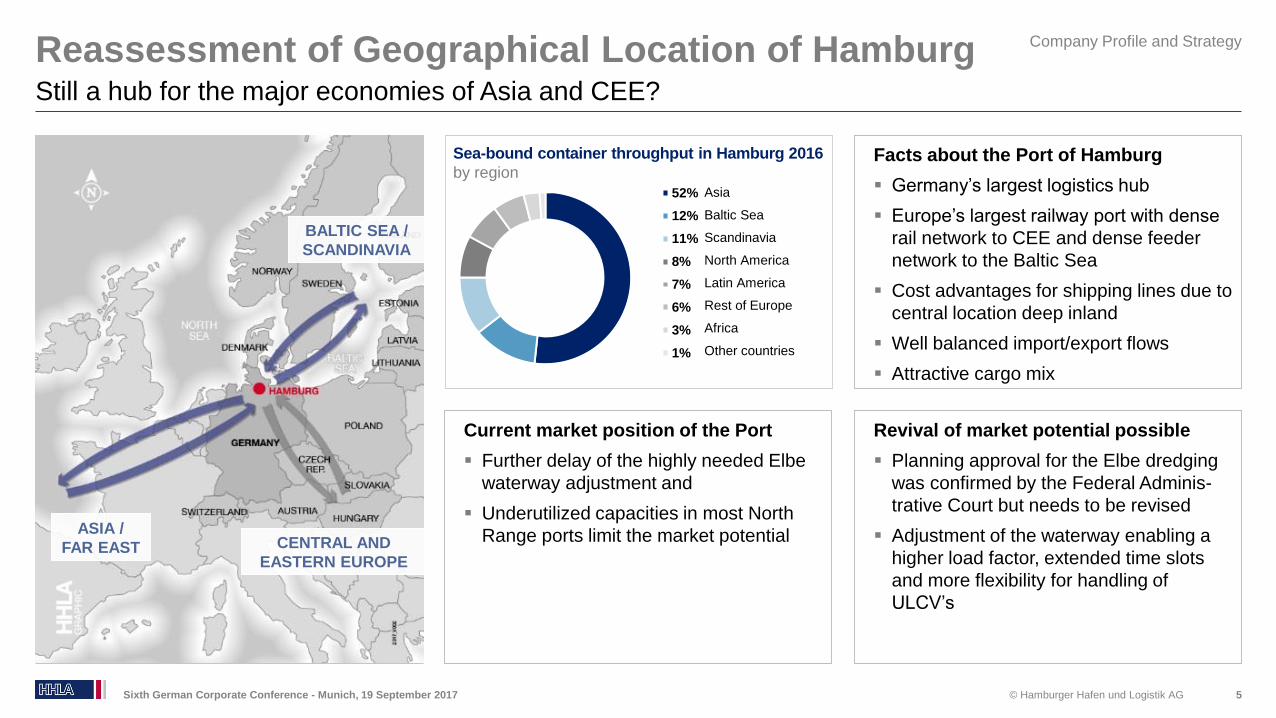
52%
12%
11%
8%
7%
6%
3%
1%
Reassessment of Geographical Location of Hamburg
5
Still a hub for the major economies of Asia and CEE?
Company Profile and Strategy
Sixth German Corporate Conference - Munich, 19 September 2017
Current market position of the Port
Further delay of the highly needed Elbe
waterway adjustment and
Underutilized capacities in most North
Range ports limit the market potential
Facts about the Port of Hamburg
Germany’s largest logistics hub
Europe’s largest railway port with dense
rail network to CEE and dense feeder
network to the Baltic Sea
Cost advantages for shipping lines due to
central location deep inland
Well balanced import/export flows
Attractive cargo mix
Revival of market potential possible
Planning approval for the Elbe dredging
was confirmed by the Federal Adminis-
trative Court but needs to be revised
Adjustment of the waterway enabling a
higher load factor, extended time slots
and more flexibility for handling of
ULCV’s
BALTIC SEA /
SCANDINAVIA
CENTRAL AND
EASTERN EUROPE
ASIA /
FAR EAST
Sea-bound container throughput in Hamburg 2016
by region
Asia
Baltic Sea
Scandinavia
North America
Latin America
Rest of Europe
Africa
Other countries
© Hamburger Hafen und Logistik AG
Advanced Terminal Technology
6
High automation level with mega-carrier berths in operation
Sixth German Corporate Conference - Munich, 19 September 2017
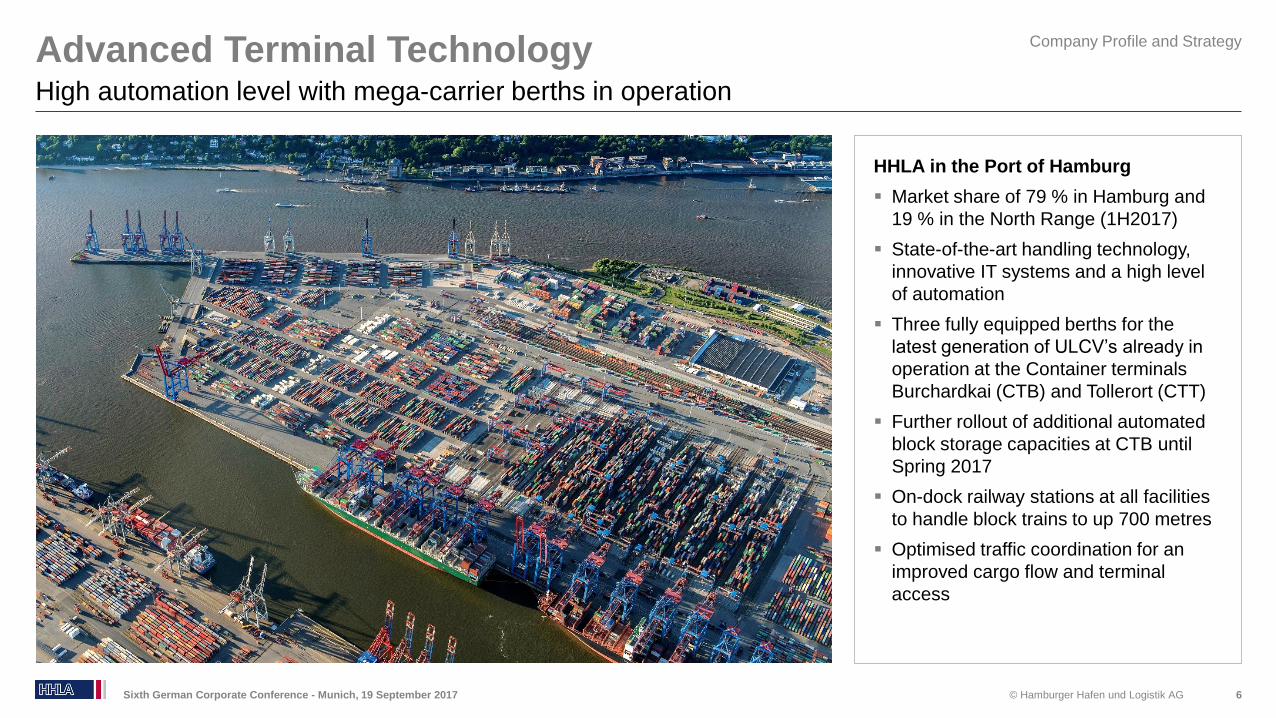
HHLA in the Port of Hamburg
Market share of 79 % in Hamburg and
19 % in the North Range (1H2017)
State-of-the-art handling technology,
innovative IT systems and a high level
of automation
Three fully equipped berths for the
latest generation of ULCV’s already in
operation at the Container terminals
Burchardkai (CTB) and Tollerort (CTT)
Further rollout of additional automated
block storage capacities at CTB until
Spring 2017
On-dock railway stations at all facilities
to handle block trains to up 700 metres
Optimised traffic coordination for an
improved cargo flow and terminal
access
Company Profile and Strategy
© Hamburger Hafen und Logistik AG
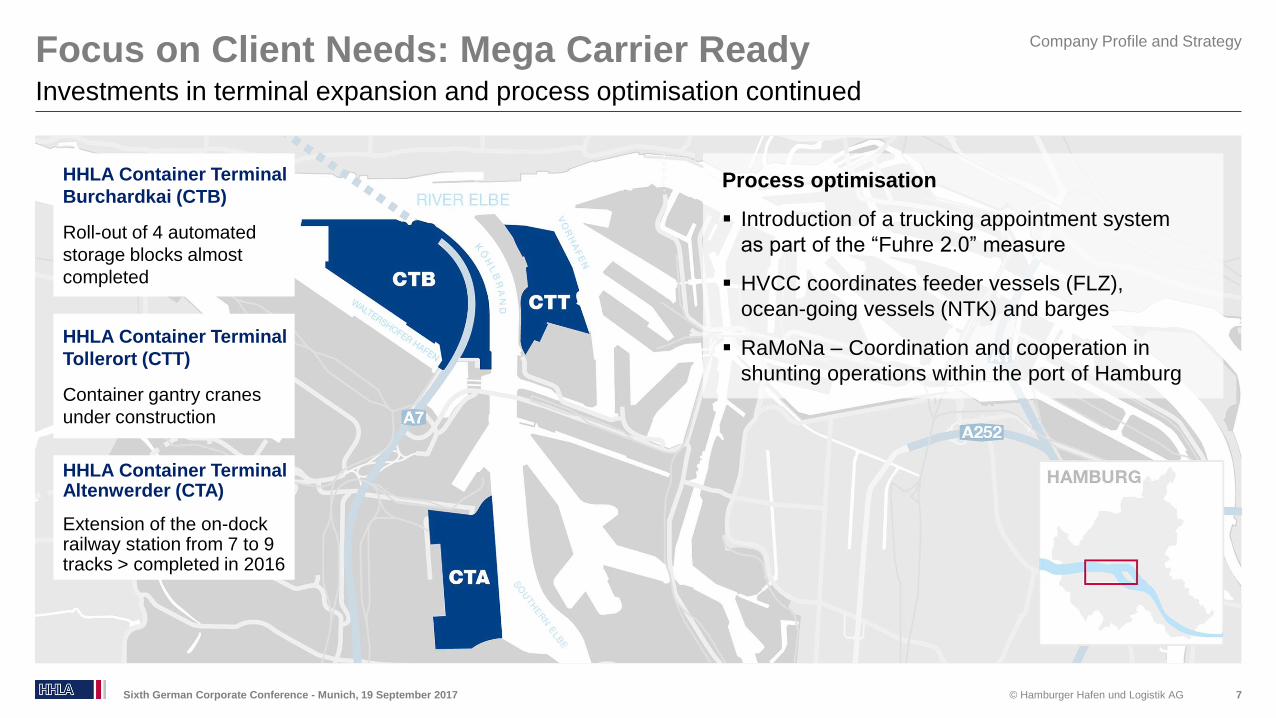
Focus on Client Needs: Mega Carrier Ready
7
Investments in terminal expansion and process optimisation continued
Sixth German Corporate Conference - Munich, 19 September 2017
HHLA Container Terminal Altenwerder (CTA)
Extension of the on-dock railway station from 7 to 9 tracks > completed in 2016
HHLA Container Terminal
Burchardkai (CTB)
Roll-out of 4 automated
storage blocks almost
completed
HHLA Container Terminal
Tollerort (CTT)
Container gantry cranes
under construction
Process optimisation
Introduction of a trucking appointment system
as part of the “Fuhre 2.0” measure
HVCC coordinates feeder vessels (FLZ),
ocean-going vessels (NTK) and barges
RaMoNa – Coordination and cooperation in
shunting operations within the port of Hamburg
Company Profile and Strategy
© Hamburger Hafen und Logistik AG
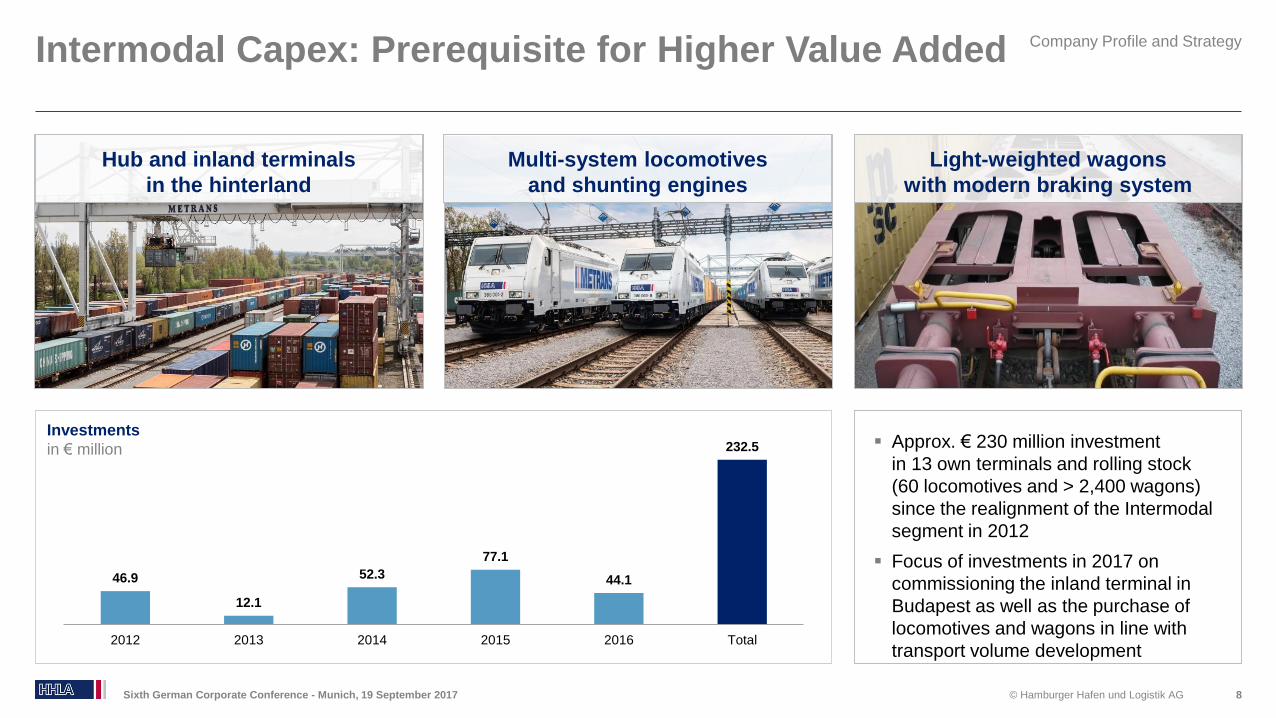
46.9
12.1
52.3
77.1
44.1
232.5
2012 2013 2014 2015 2016 Total
Intermodal Capex: Prerequisite for Higher Value Added
8
Company Profile and Strategy
Sixth German Corporate Conference - Munich, 19 September 2017
Approx. € 230 million investment
in 13 own terminals and rolling stock
(60 locomotives and > 2,400 wagons)
since the realignment of the Intermodal
segment in 2012
Focus of investments in 2017 on
commissioning the inland terminal in
Budapest as well as the purchase of
locomotives and wagons in line with
transport volume development
Hub and inland terminals
in the hinterland
Multi-system locomotives
and shunting engines
Light-weighted wagons
with modern braking system
Investments
in € million
© Hamburger Hafen und Logistik AG
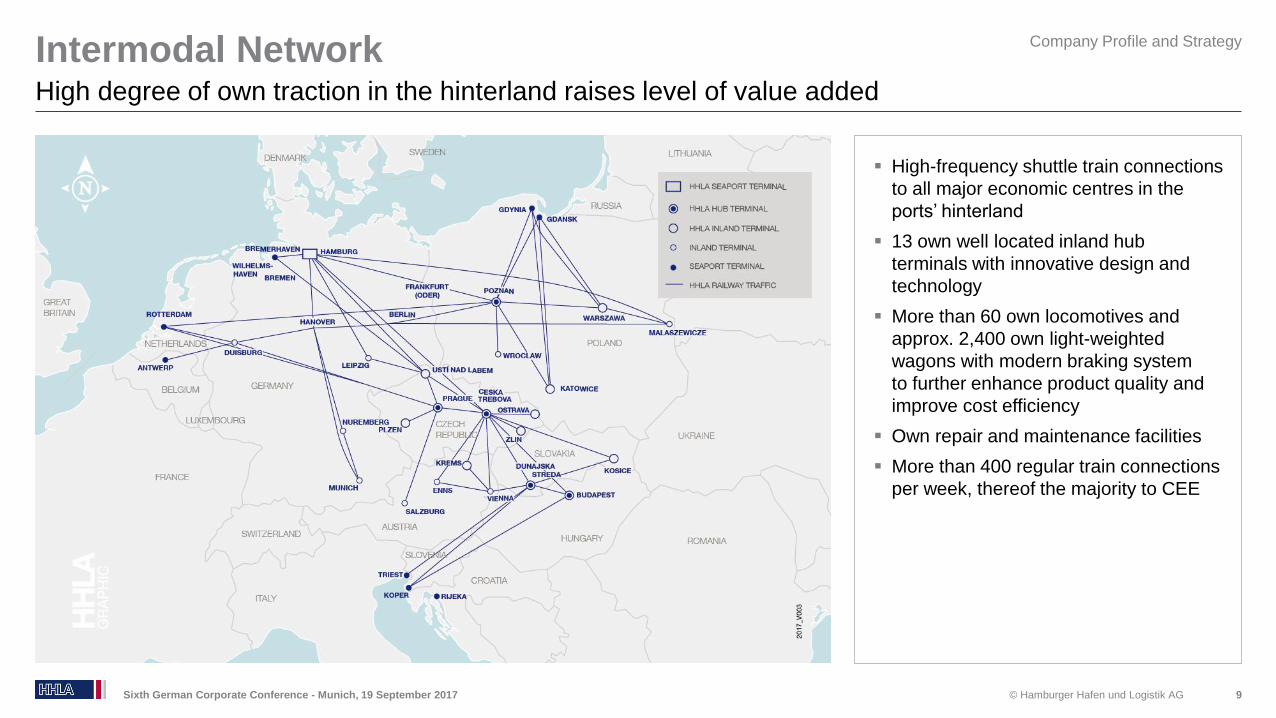
Intermodal Network
9
High degree of own traction in the hinterland raises level of value added
Company Profile and Strategy
Sixth German Corporate Conference - Munich, 19 September 2017
High-frequency shuttle train connections
to all major economic centres in the
ports’ hinterland
13 own well located inland hub
terminals with innovative design and
technology
More than 60 own locomotives and
approx. 2,400 own light-weighted
wagons with modern braking system
to further enhance product quality and
improve cost efficiency
Own repair and maintenance facilities
More than 400 regular train connections
per week, thereof the majority to CEE
© Hamburger Hafen und Logistik AG
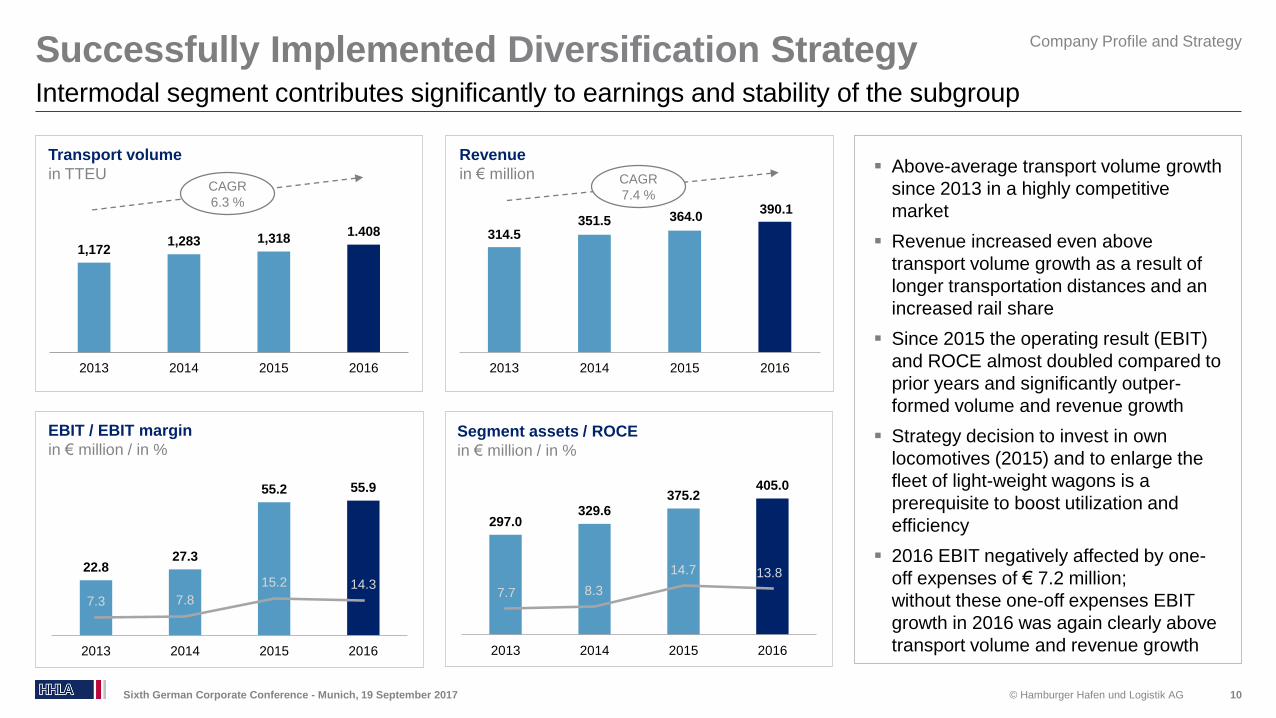
Successfully Implemented Diversification Strategy
10
Intermodal segment contributes significantly to earnings and stability of the subgroup
Company Profile and Strategy
Sixth German Corporate Conference - Munich, 19 September 2017
Above-average transport volume growth
since 2013 in a highly competitive
market
Revenue increased even above
transport volume growth as a result of
longer transportation distances and an
increased rail share
Since 2015 the operating result (EBIT)
and ROCE almost doubled compared to
prior years and significantly outper-
formed volume and revenue growth
Strategy decision to invest in own
locomotives (2015) and to enlarge the
fleet of light-weight wagons is a
prerequisite to boost utilization and
efficiency
2016 EBIT negatively affected by one-
off expenses of € 7.2 million;
without these one-off expenses EBIT
growth in 2016 was again clearly above
transport volume and revenue growth
22.827.3
55.2 55.9
7.3 7.8
15.2 14.3
2013 2014 2015 2016
EBIT / EBIT margin
in € million / in %
314.5351.5 364.0
390.1
2013 2014 2015 2016
Revenue
in € million
1,1721,283 1,318
1.408
2013 2014 2015 2016
Transport volume
in TTEU
297.0329.6
375.2405.0
2013 2014 2015 2016
Segment assets / ROCE
in € million / in %
CAGR
6.3 %
CAGR
7.4 %
7.7 8.3
14.7 13.8
© Hamburger Hafen und Logistik AG
Financial Stability
Sixth German Corporate Conference - Munich, 19 September 2017 11
Solid financial foundation
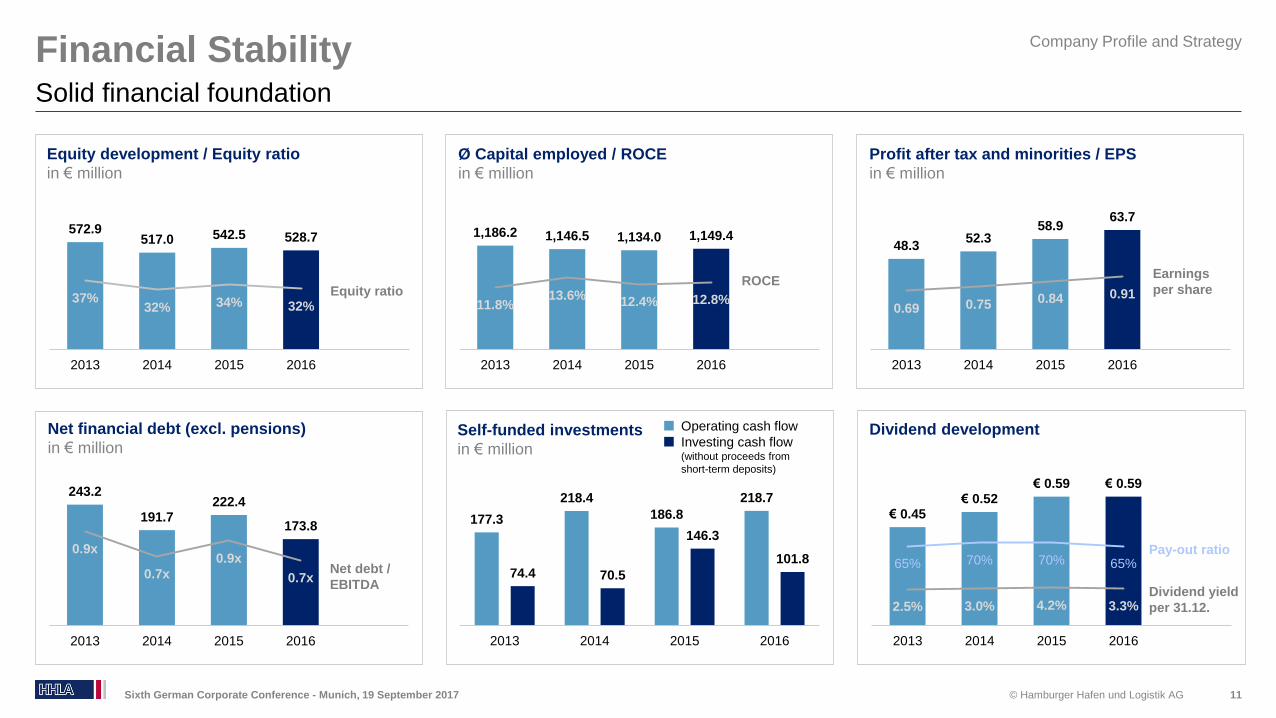
48.352.3
58.963.7
0.69 0.75 0.84 0.91
2013 2014 2015 2016
Profit after tax and minorities / EPS
in € million
572.9517.0 542.5 528.7
37%32% 34% 32%
2013 2014 2015 2016
Equity development / Equity ratio
in € million
177.3
218.4
186.8
218.7
74.4 70.5
146.3
101.8
2013 2014 2015 2016
Self-funded investments
in € million
243.2
191.7222.4
173.8
0.9x
0.7x
0.9x
0.7x
2013 2014 2015 2016
Net financial debt (excl. pensions)
in € million
Equity ratio
Operating cash flow
Investing cash flow (without proceeds from
short-term deposits)
Earnings
per share
Net debt /
EBITDA
€ 0.45€ 0.52
€ 0.59 € 0.59
2.5% 3.0% 4.2% 3.3%
65% 70% 70% 65%
2013 2014 2015 2016
Dividend development
Dividend yield
per 31.12.
1,186.2 1,146.5 1,134.0 1,149.4
11.8%13.6%
12.4% 12.8%
2013 2014 2015 2016
Ø Capital employed / ROCE
in € million
ROCE
Pay-out ratio
Company Profile and Strategy
© Hamburger Hafen und Logistik AG
Agenda
Company Profile and Strategy
Business Update and Financial Performance 1H2017
Outlook 2017
Appendix
12Sixth German Corporate Conference - Munich, 19 September 2017
© Hamburger Hafen und Logistik AG
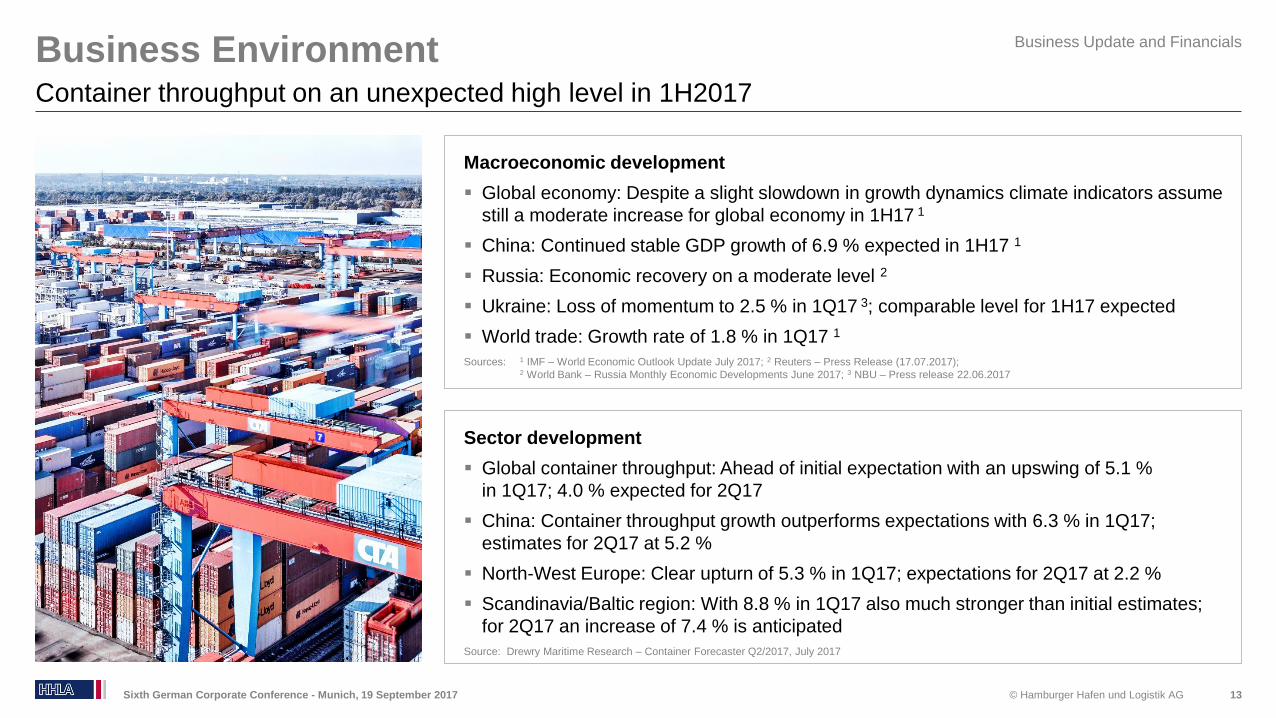
Macroeconomic development
Global economy: Despite a slight slowdown in growth dynamics climate indicators assume
still a moderate increase for global economy in 1H17 1
China: Continued stable GDP growth of 6.9 % expected in 1H17 1
Russia: Economic recovery on a moderate level 2
Ukraine: Loss of momentum to 2.5 % in 1Q17 3; comparable level for 1H17 expected
World trade: Growth rate of 1.8 % in 1Q17 1
Sources: 1 IMF – World Economic Outlook Update July 2017; 2 Reuters – Press Release (17.07.2017); 2 World Bank – Russia Monthly Economic Developments June 2017; 3 NBU – Press release 22.06.2017
Business Environment
13
Container throughput on an unexpected high level in 1H2017
Sixth German Corporate Conference - Munich, 19 September 2017
Sector development
Global container throughput: Ahead of initial expectation with an upswing of 5.1 %
in 1Q17; 4.0 % expected for 2Q17
China: Container throughput growth outperforms expectations with 6.3 % in 1Q17;
estimates for 2Q17 at 5.2 %
North-West Europe: Clear upturn of 5.3 % in 1Q17; expectations for 2Q17 at 2.2 %
Scandinavia/Baltic region: With 8.8 % in 1Q17 also much stronger than initial estimates;
for 2Q17 an increase of 7.4 % is anticipated
Source: Drewry Maritime Research – Container Forecaster Q2/2017, July 2017
Business Update and Financials
© Hamburger Hafen und Logistik AG
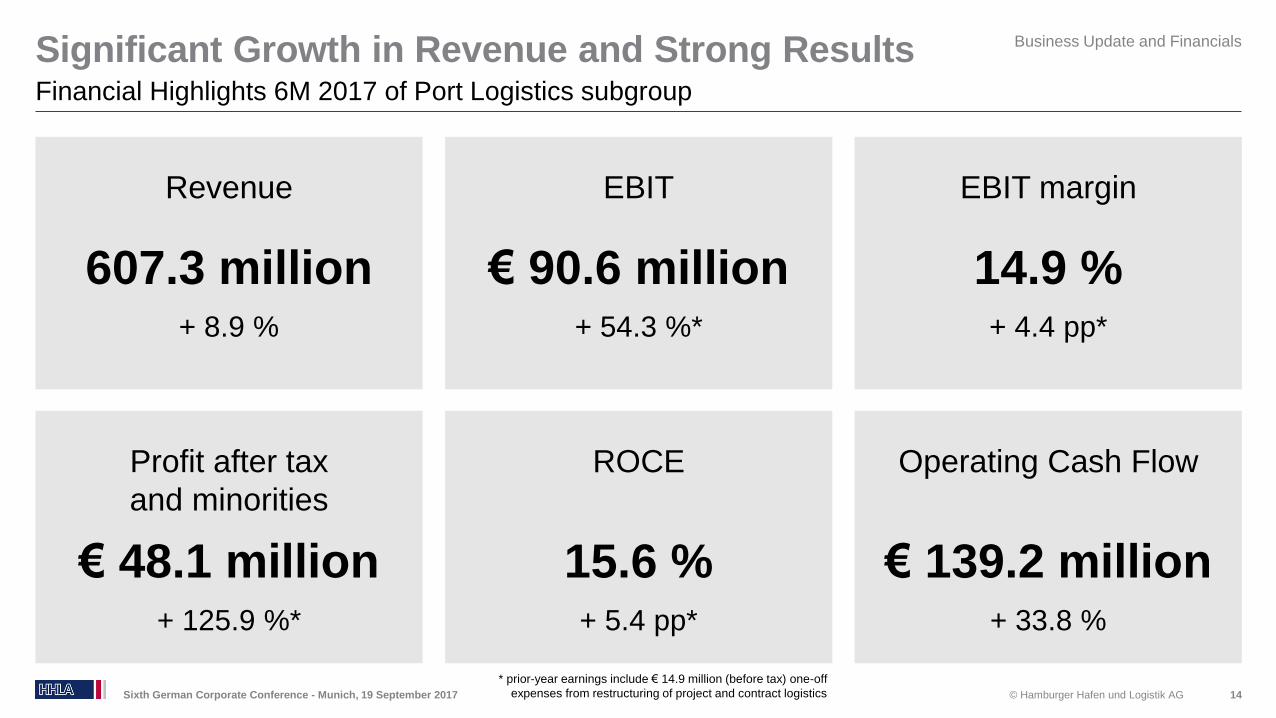
Significant Growth in Revenue and Strong Results
14
Financial Highlights 6M 2017 of Port Logistics subgroup
Business Update and Financials
Sixth German Corporate Conference - Munich, 19 September 2017
Profit after tax
and minorities
€ 48.1 million+ 125.9 %*
Revenue
607.3 million+ 8.9 %
EBIT
€ 90.6 million+ 54.3 %*
EBIT margin
14.9 %+ 4.4 pp*
* prior-year earnings include € 14.9 million (before tax) one-off
expenses from restructuring of project and contract logistics
ROCE
15.6 %+ 5.4 pp*
Operating Cash Flow
€ 139.2 million+ 33.8 %
© Hamburger Hafen und Logistik AG
Throughput and Transport Development
15
Strong increase in container throughput as well as in container transport
Business Update and Financials
Sixth German Corporate Conference - Munich, 19 September 2017
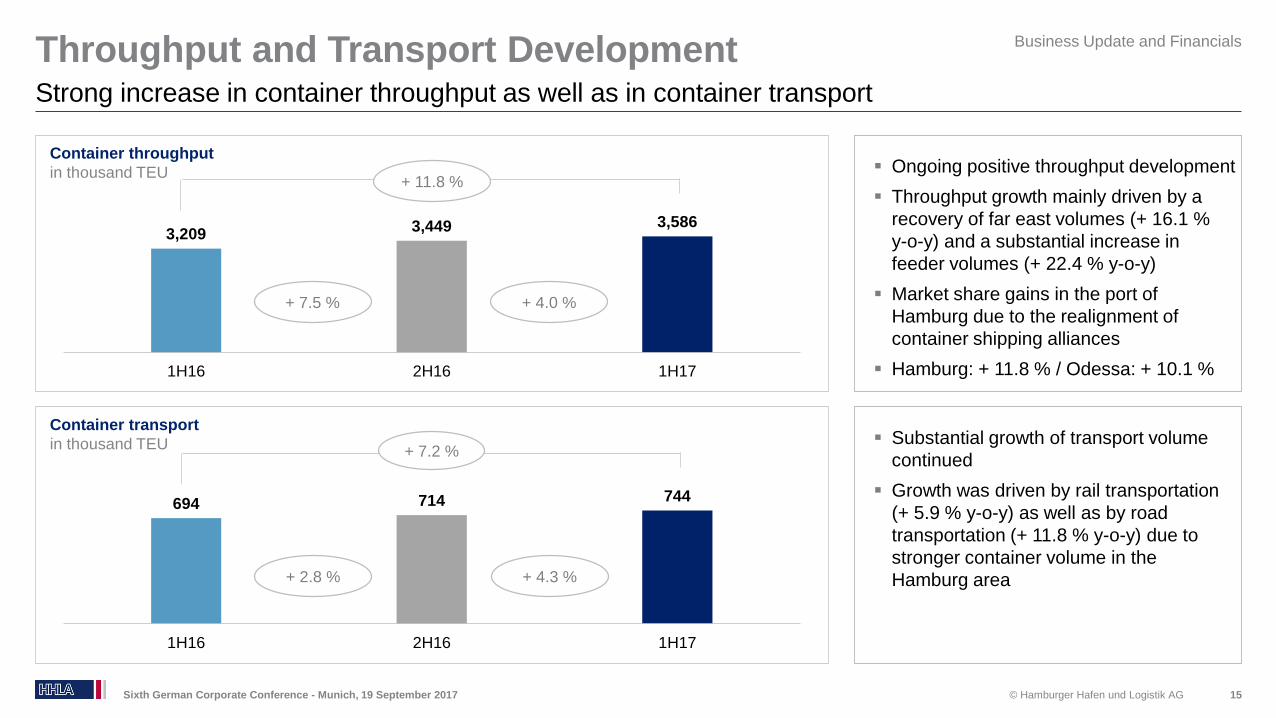
Ongoing positive throughput development
Throughput growth mainly driven by a
recovery of far east volumes (+ 16.1 %
y-o-y) and a substantial increase in
feeder volumes (+ 22.4 % y-o-y)
Market share gains in the port of
Hamburg due to the realignment of
container shipping alliances
Hamburg: + 11.8 % / Odessa: + 10.1 %
3,2093,449 3,586
1H16 2H16 1H17
Container throughput
in thousand TEU+ 11.8 %
694 714 744
1H16 2H16 1H17
Container transport
in thousand TEU Substantial growth of transport volume
continued
Growth was driven by rail transportation
(+ 5.9 % y-o-y) as well as by road
transportation (+ 11.8 % y-o-y) due to
stronger container volume in the
Hamburg area
+ 7.5 % + 4.0 %
+ 2.8 % + 4.3 %
+ 7.2 %
© Hamburger Hafen und Logistik AG
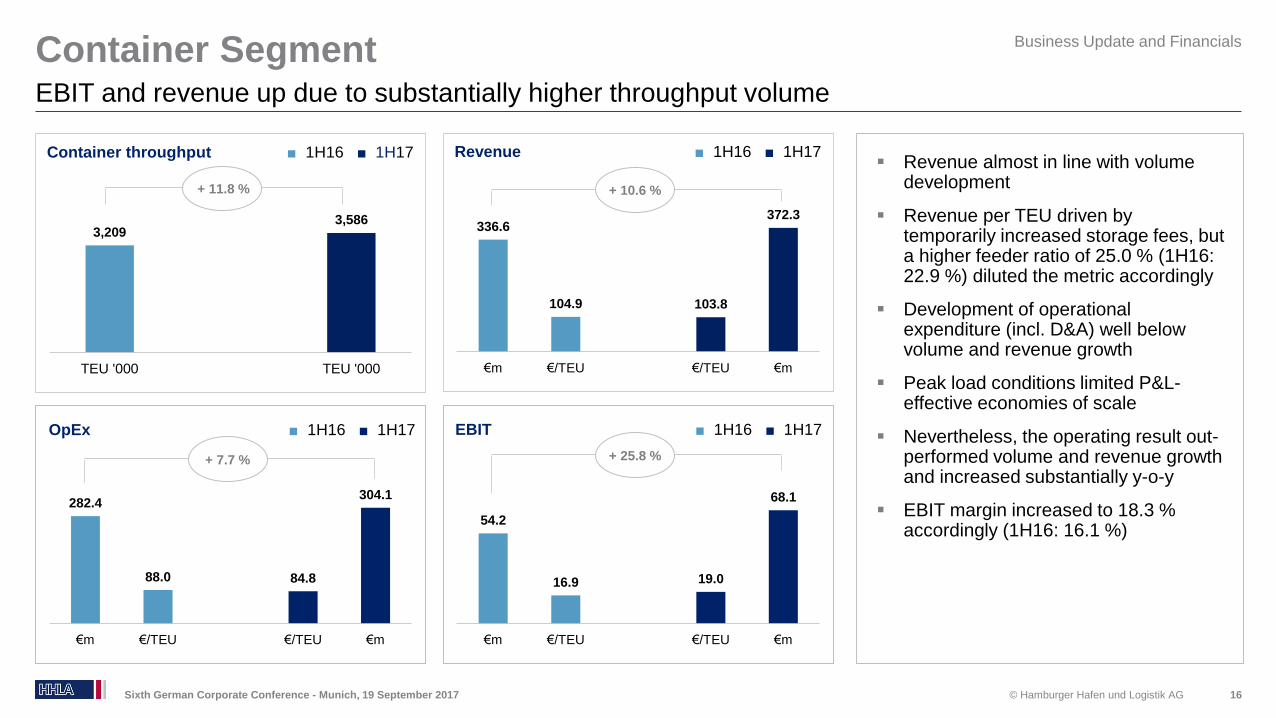
282.4
88.0 84.8
304.1
€m €/TEU €/TEU €m
54.2
16.9 19.0
68.1
€m €/TEU €/TEU €m
3,2093,586
TEU '000 TEU '000
Revenue almost in line with volume development
Revenue per TEU driven by temporarily increased storage fees, but a higher feeder ratio of 25.0 % (1H16: 22.9 %) diluted the metric accordingly
Development of operational expenditure (incl. D&A) well below volume and revenue growth
Peak load conditions limited P&L-effective economies of scale
Nevertheless, the operating result out-performed volume and revenue growth and increased substantially y-o-y
EBIT margin increased to 18.3 % accordingly (1H16: 16.1 %)
Container Segment
Sixth German Corporate Conference - Munich, 19 September 2017 16
EBIT and revenue up due to substantially higher throughput volume
EBIT ■ 1H16 ■ 1H17
Container throughput ■ 1H16 ■ 1H17
+ 11.8 %
+ 7.7 % + 25.8 %
OpEx ■ 1H16 ■ 1H17
336.6
104.9 103.8
372.3
€m €/TEU €/TEU €m
Revenue ■ 1H16 ■ 1H17
+ 10.6 %
Business Update and Financials
© Hamburger Hafen und Logistik AG
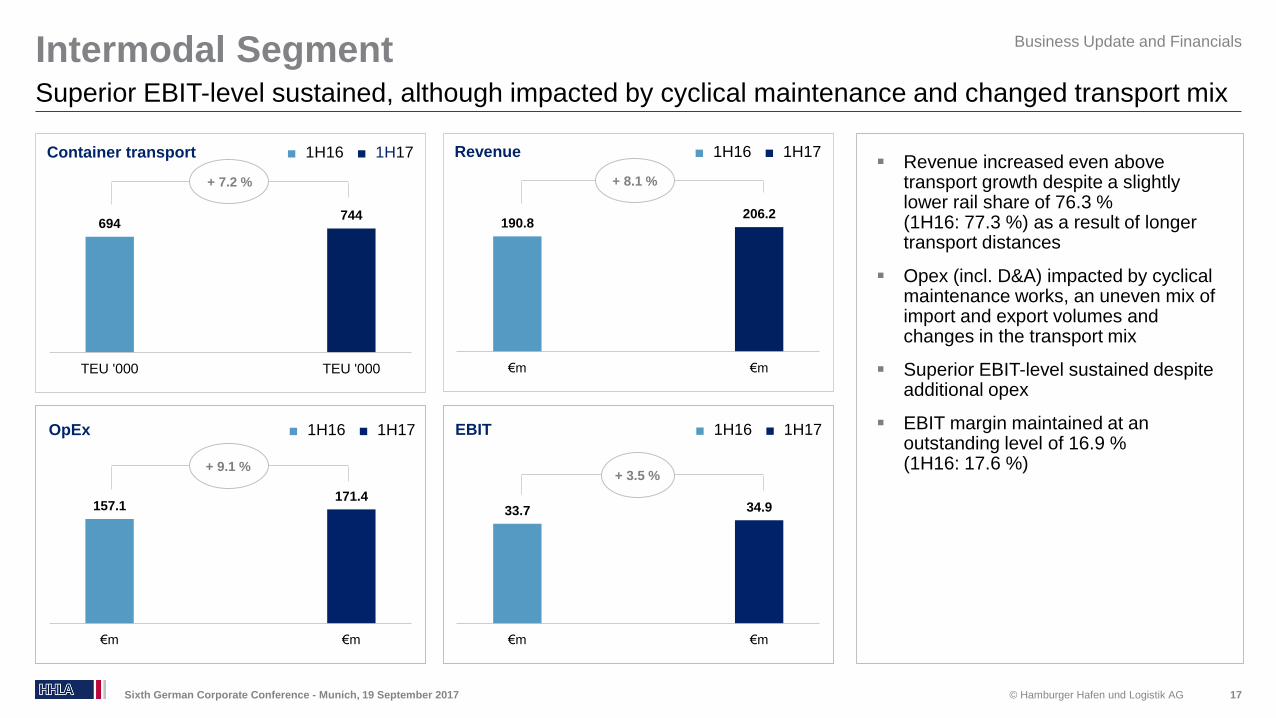
157.1171.4
€m €m
33.7 34.9
€m €m
694744
TEU '000 TEU '000
Revenue increased even above transport growth despite a slightly lower rail share of 76.3 % (1H16: 77.3 %) as a result of longer transport distances
Opex (incl. D&A) impacted by cyclical maintenance works, an uneven mix of import and export volumes and changes in the transport mix
Superior EBIT-level sustained despite additional opex
EBIT margin maintained at an outstanding level of 16.9 % (1H16: 17.6 %)
Intermodal Segment
Sixth German Corporate Conference - Munich, 19 September 2017 17
Superior EBIT-level sustained, although impacted by cyclical maintenance and changed transport mix
EBIT ■ 1H16 ■ 1H17
Business Update and Financials
Container transport ■ 1H16 ■ 1H17
+ 7.2 %
+ 9.1 %+ 3.5 %
OpEx ■ 1H16 ■ 1H17
190.8206.2
€m €m
Revenue ■ 1H16 ■ 1H17
+ 8.1 %
© Hamburger Hafen und Logistik AG
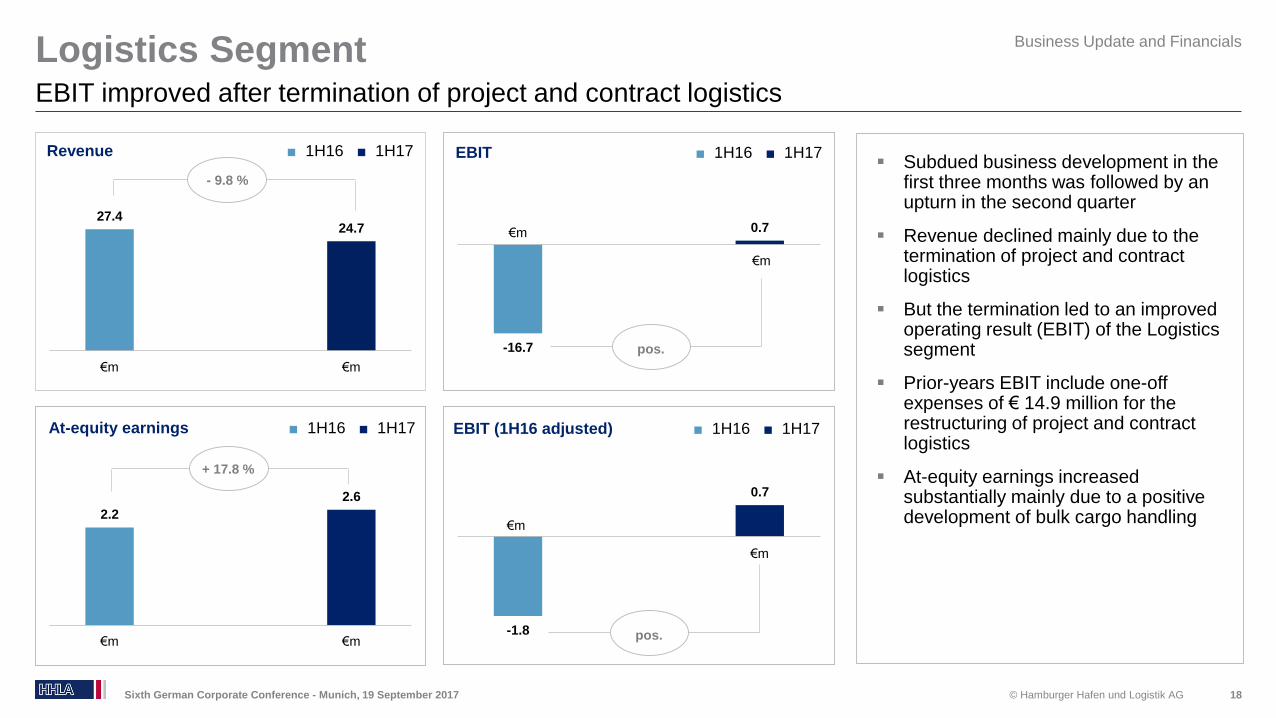
2.2
2.6
€m €m
-16.7
0.7
Subdued business development in the first three months was followed by an upturn in the second quarter
Revenue declined mainly due to the termination of project and contract logistics
But the termination led to an improved operating result (EBIT) of the Logistics segment
Prior-years EBIT include one-off expenses of € 14.9 million for the restructuring of project and contract logistics
At-equity earnings increased substantially mainly due to a positive development of bulk cargo handling
Logistics Segment
Sixth German Corporate Conference - Munich, 19 September 2017 18
EBIT improved after termination of project and contract logistics
EBIT ■ 1H16 ■ 1H17
Business Update and Financials
+ 17.8 %
pos.
At-equity earnings ■ 1H16 ■ 1H17
27.424.7
€m €m
Revenue ■ 1H16 ■ 1H17
- 9.8 %
€m
€m
-1.8
0.7
EBIT (1H16 adjusted) ■ 1H16 ■ 1H17
pos.
€m
€m
© Hamburger Hafen und Logistik AG
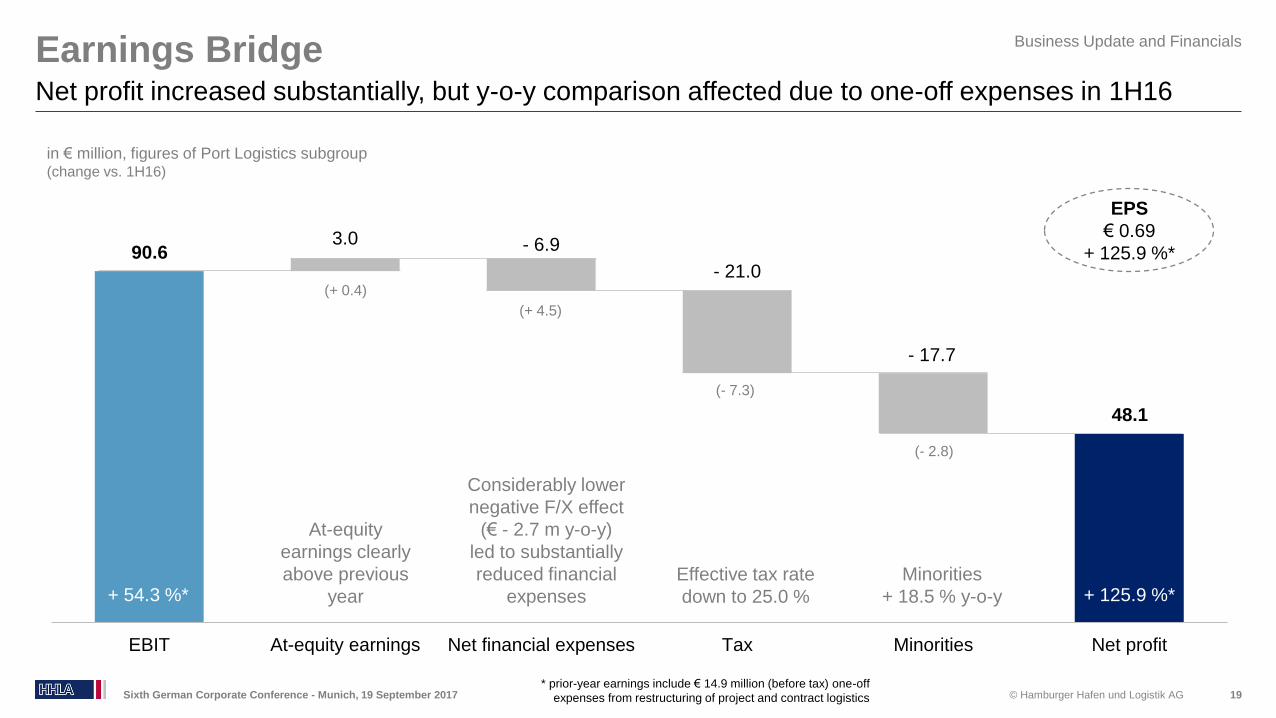
Earnings Bridge
19
Net profit increased substantially, but y-o-y comparison affected due to one-off expenses in 1H16
Business Update and Financials
Sixth German Corporate Conference - Munich, 19 September 2017
90.63.0 - 6.9
- 21.0
- 17.7
48.1
EBIT At-equity earnings Net financial expenses Tax Minorities Net profit
EPS
€ 0.69
+ 125.9 %*
in € million, figures of Port Logistics subgroup(change vs. 1H16)
(+ 0.4)
(+ 4.5)
(- 7.3)
(- 2.8)
At-equity
earnings clearly
above previous
year
Considerably lower
negative F/X effect
(€ - 2.7 m y-o-y)
led to substantially
reduced financial
expenses
Effective tax rate
down to 25.0 %
Minorities
+ 18.5 % y-o-y+ 54.3 %* + 125.9 %*
* prior-year earnings include € 14.9 million (before tax) one-off
expenses from restructuring of project and contract logistics
© Hamburger Hafen und Logistik AG
Agenda
Company Profile and Strategy
Business Update and Financial Performance 1H2017
Outlook 2017
Appendix
20Sixth German Corporate Conference - Munich, 19 September 2017
© Hamburger Hafen und Logistik AG
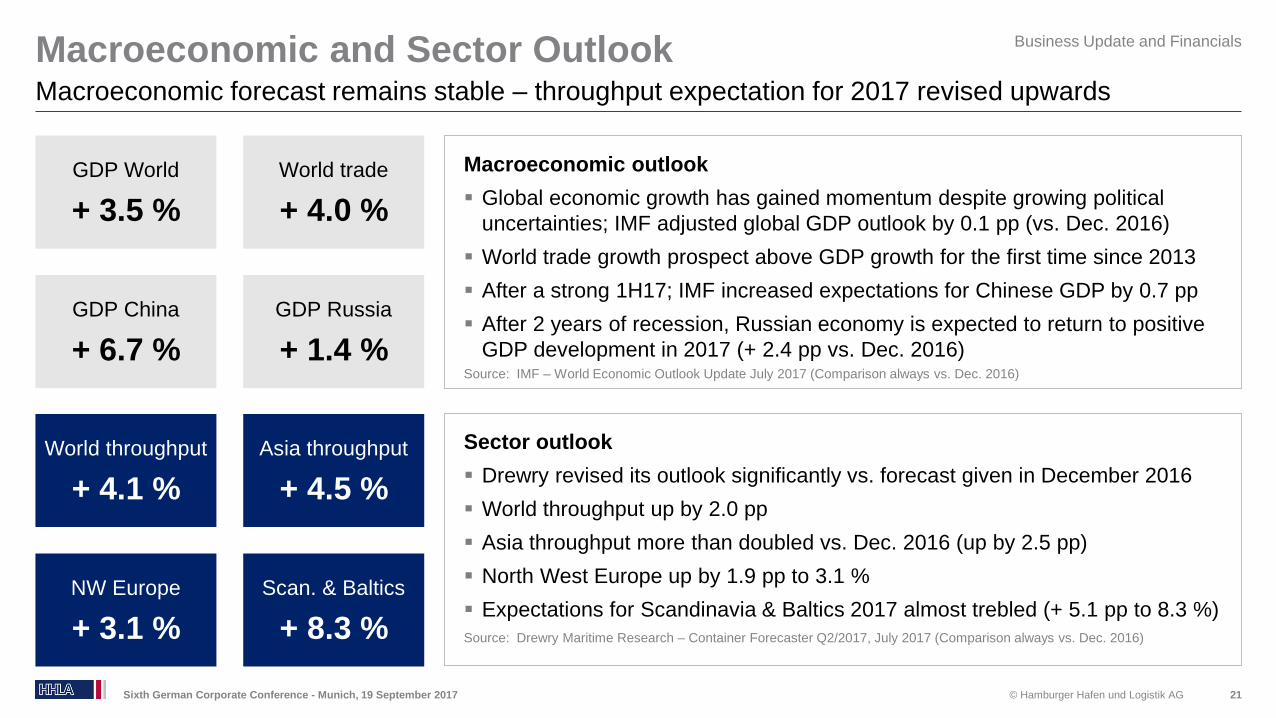
Macroeconomic outlook
Global economic growth has gained momentum despite growing political
uncertainties; IMF adjusted global GDP outlook by 0.1 pp (vs. Dec. 2016)
World trade growth prospect above GDP growth for the first time since 2013
After a strong 1H17; IMF increased expectations for Chinese GDP by 0.7 pp
After 2 years of recession, Russian economy is expected to return to positive
GDP development in 2017 (+ 2.4 pp vs. Dec. 2016)Source: IMF – World Economic Outlook Update July 2017 (Comparison always vs. Dec. 2016)
Macroeconomic and Sector Outlook
21
Macroeconomic forecast remains stable – throughput expectation for 2017 revised upwards
Business Update and Financials
Sixth German Corporate Conference - Munich, 19 September 2017
Sector outlook
Drewry revised its outlook significantly vs. forecast given in December 2016
World throughput up by 2.0 pp
Asia throughput more than doubled vs. Dec. 2016 (up by 2.5 pp)
North West Europe up by 1.9 pp to 3.1 %
Expectations for Scandinavia & Baltics 2017 almost trebled (+ 5.1 pp to 8.3 %)
Source: Drewry Maritime Research – Container Forecaster Q2/2017, July 2017 (Comparison always vs. Dec. 2016)
GDP China
+ 6.7 %
GDP Russia
+ 1.4 %
GDP World
+ 3.5 %
World trade
+ 4.0 %
NW Europe
+ 3.1 %
Scan. & Baltics
+ 8.3 %
World throughput
+ 4.1 %
Asia throughput
+ 4.5 %
© Hamburger Hafen und Logistik AG
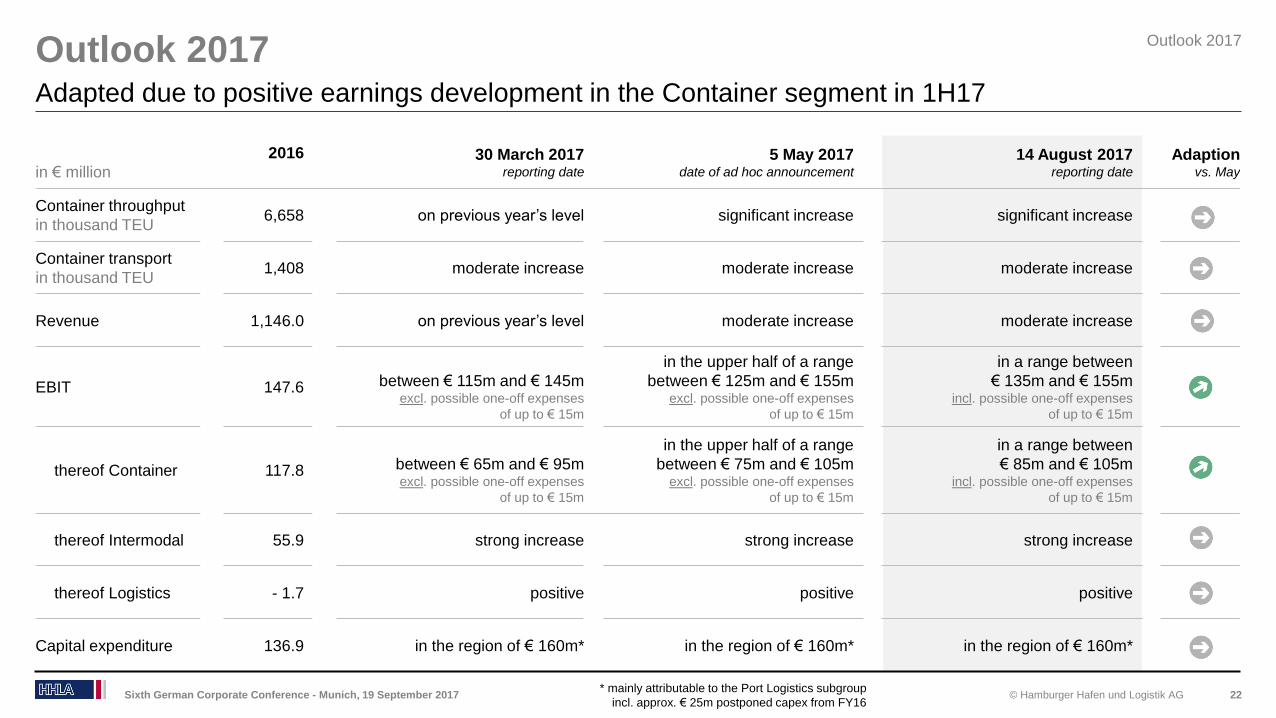
Outlook 2017
Sixth German Corporate Conference - Munich, 19 September 2017 22
Adapted due to positive earnings development in the Container segment in 1H17
Outlook 2017
in € million
2016 30 March 2017reporting date
5 May 2017date of ad hoc announcement
14 August 2017reporting date
Adaption vs. May
Container throughput
in thousand TEU6,658 on previous year’s level significant increase significant increase
Container transport
in thousand TEU1,408 moderate increase moderate increase moderate increase
Revenue 1,146.0 on previous year’s level moderate increase moderate increase
EBIT 147.6 between € 115m and € 145mexcl. possible one-off expenses
of up to € 15m
in the upper half of a range
between € 125m and € 155mexcl. possible one-off expenses
of up to € 15m
in a range between
€ 135m and € 155mincl. possible one-off expenses
of up to € 15m
thereof Container 117.8 between € 65m and € 95mexcl. possible one-off expenses
of up to € 15m
in the upper half of a range
between € 75m and € 105mexcl. possible one-off expenses
of up to € 15m
in a range between
€ 85m and € 105mincl. possible one-off expenses
of up to € 15m
thereof Intermodal 55.9 strong increase strong increase strong increase
thereof Logistics - 1.7 positive positive positive
Capital expenditure 136.9 in the region of € 160m* in the region of € 160m* in the region of € 160m*
* mainly attributable to the Port Logistics subgroup
incl. approx. € 25m postponed capex from FY16
© Hamburger Hafen und Logistik AG
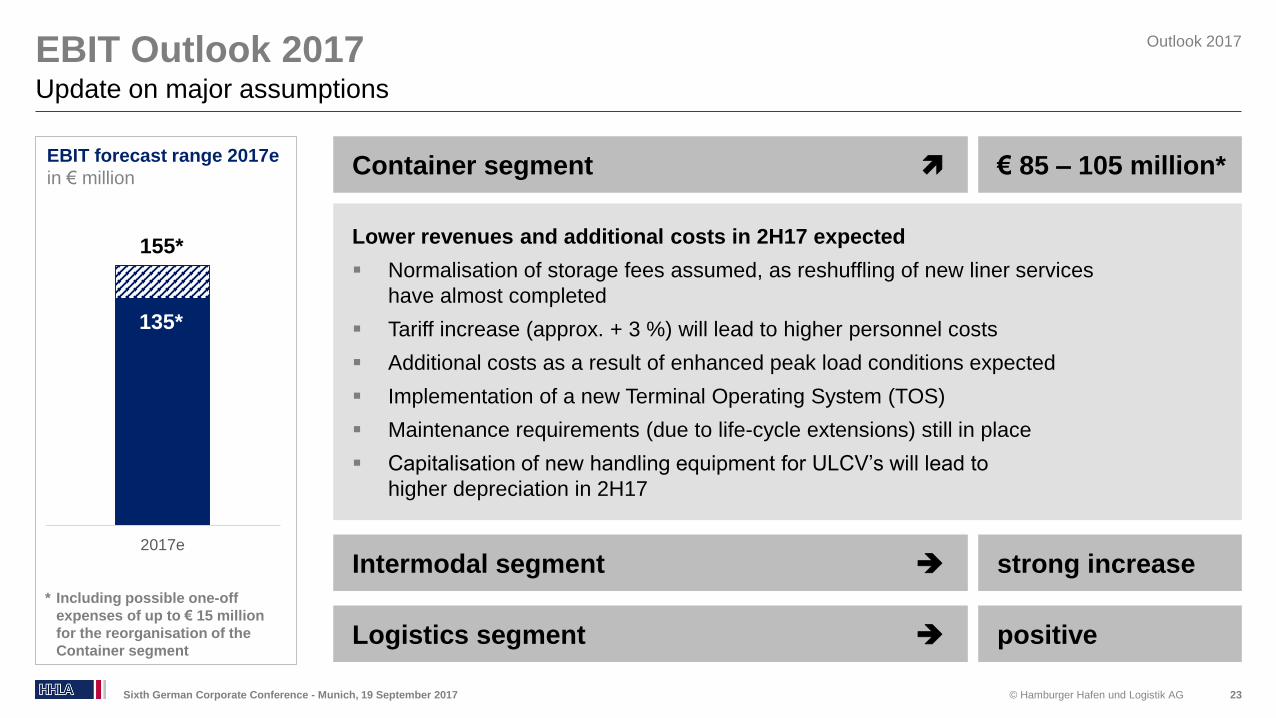
EBIT Outlook 2017
23
Update on major assumptions
Outlook 2017
Sixth German Corporate Conference - Munich, 19 September 2017
115*
2017e
* Including possible one-off
expenses of up to € 15 million
for the reorganisation of the
Container segment
EBIT forecast range 2017e
in € million
155*
135*
Lower revenues and additional costs in 2H17 expected
Normalisation of storage fees assumed, as reshuffling of new liner services
have almost completed
Tariff increase (approx. + 3 %) will lead to higher personnel costs
Additional costs as a result of enhanced peak load conditions expected
Implementation of a new Terminal Operating System (TOS)
Maintenance requirements (due to life-cycle extensions) still in place
Capitalisation of new handling equipment for ULCV’s will lead to
higher depreciation in 2H17
Container segment
Intermodal segment
Logistics segment
€ 85 – 105 million*
strong increase
positive
© Hamburger Hafen und Logistik AG
Agenda
Company Profile and Strategy
Business Update and Financial Performance 1H2017
Outlook 2017
Appendix
24Sixth German Corporate Conference - Munich, 19 September 2017
© Hamburger Hafen und Logistik AG
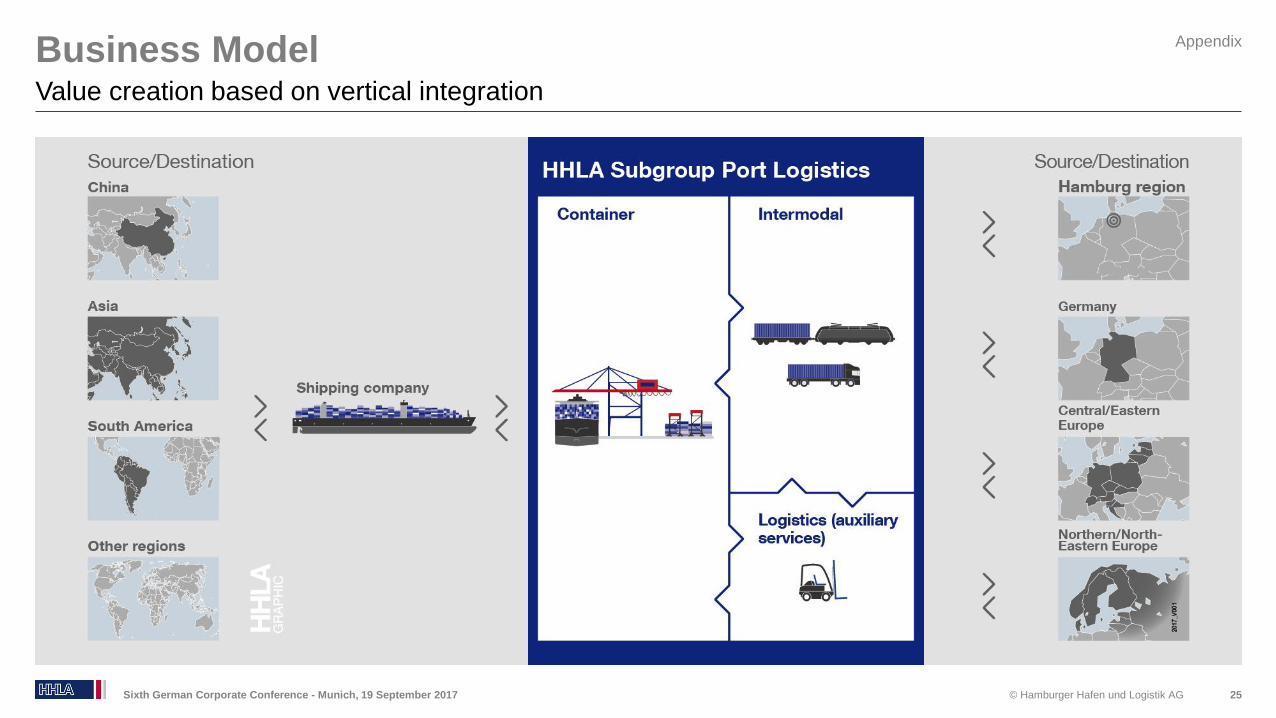
Business Model
25
Value creation based on vertical integration
Appendix
Sixth German Corporate Conference - Munich, 19 September 2017
© Hamburger Hafen und Logistik AG
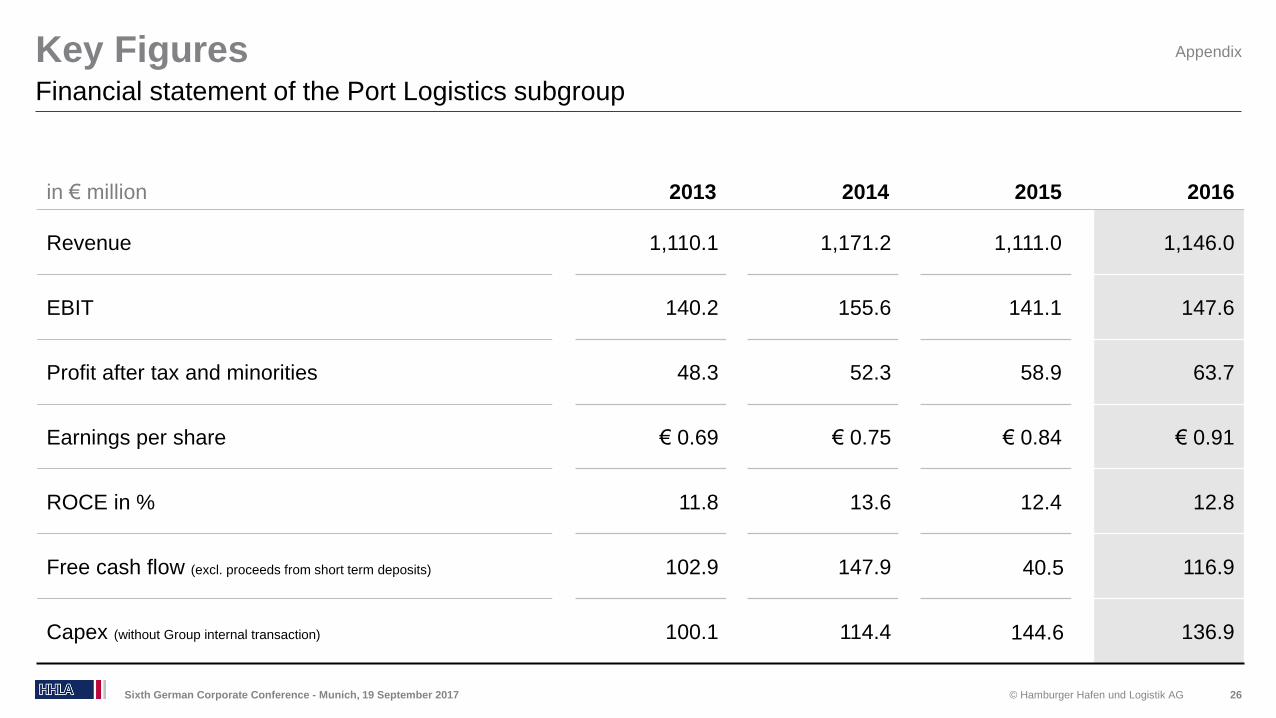
in € million 2013 2014 2015 2016
Revenue 1,110.1 1,171.2 1,111.0 1,146.0
EBIT 140.2 155.6 141.1 147.6
Profit after tax and minorities 48.3 52.3 58.9 63.7
Earnings per share € 0.69 € 0.75 € 0.84 € 0.91
ROCE in % 11.8 13.6 12.4 12.8
Free cash flow (excl. proceeds from short term deposits) 102.9 147.9 40.5 116.9
Capex (without Group internal transaction) 100.1 114.4 144.6 136.9
Key Figures
Sixth German Corporate Conference - Munich, 19 September 2017 26
Financial statement of the Port Logistics subgroup
Appendix
© Hamburger Hafen und Logistik AG
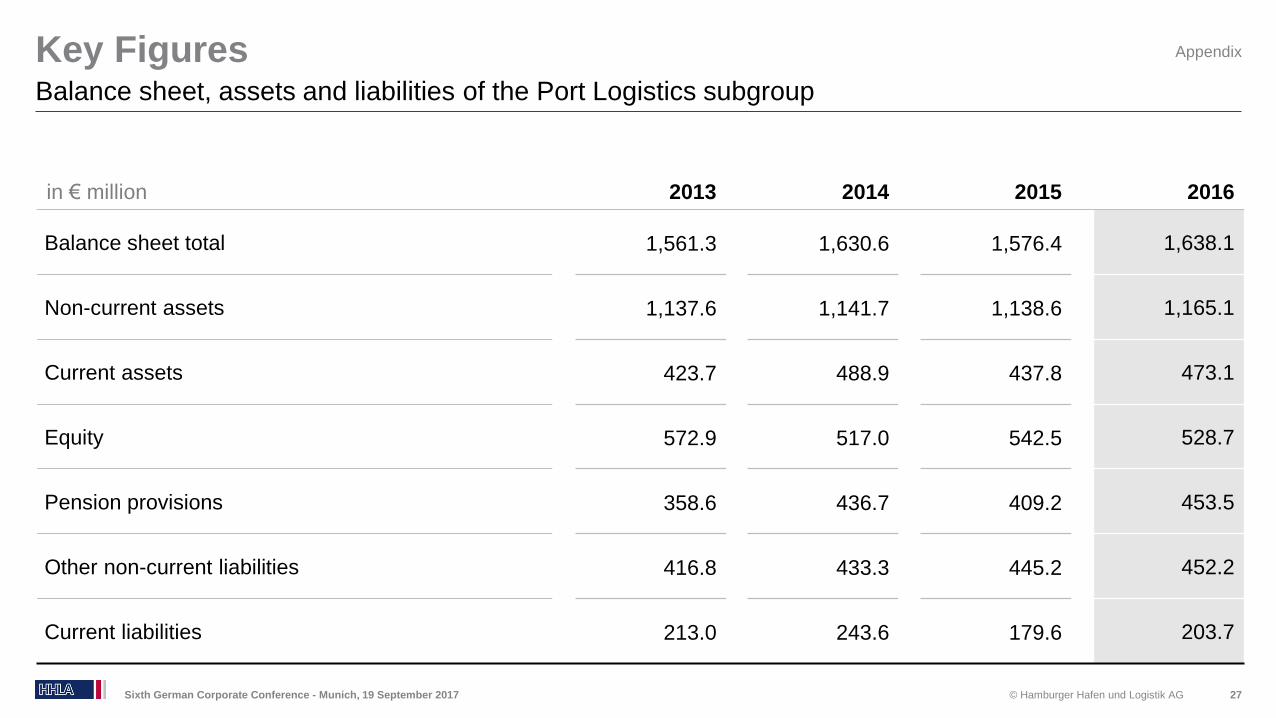
in € million 2013 2014 2015 2016
Balance sheet total 1,561.3 1,630.6 1,576.4 1,638.1
Non-current assets 1,137.6 1,141.7 1,138.6 1,165.1
Current assets 423.7 488.9 437.8 473.1
Equity 572.9 517.0 542.5 528.7
Pension provisions 358.6 436.7 409.2 453.5
Other non-current liabilities 416.8 433.3 445.2 452.2
Current liabilities 213.0 243.6 179.6 203.7
Key Figures
Sixth German Corporate Conference - Munich, 19 September 2017 27
Balance sheet, assets and liabilities of the Port Logistics subgroup
Appendix
© Hamburger Hafen und Logistik AG
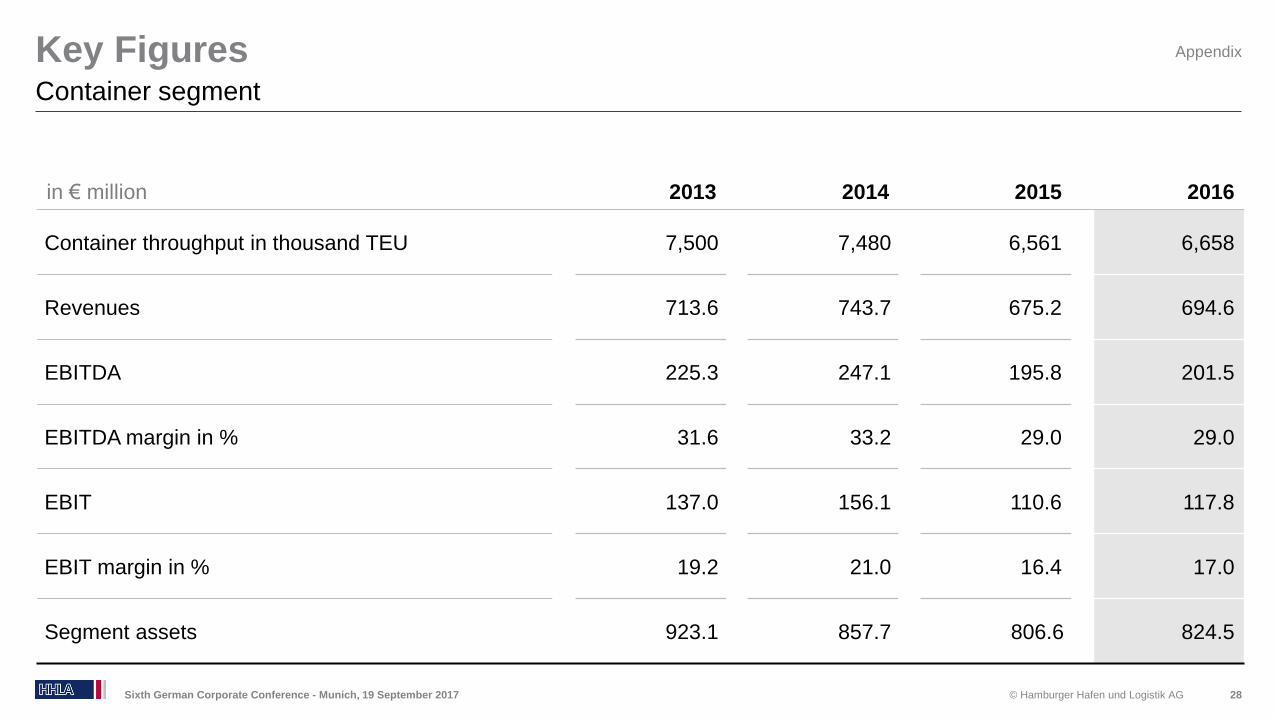
in € million 2013 2014 2015 2016
Container throughput in thousand TEU 7,500 7,480 6,561 6,658
Revenues 713.6 743.7 675.2 694.6
EBITDA 225.3 247.1 195.8 201.5
EBITDA margin in % 31.6 33.2 29.0 29.0
EBIT 137.0 156.1 110.6 117.8
EBIT margin in % 19.2 21.0 16.4 17.0
Segment assets 923.1 857.7 806.6 824.5
Key Figures
Sixth German Corporate Conference - Munich, 19 September 2017 28
Container segment
Appendix
© Hamburger Hafen und Logistik AG
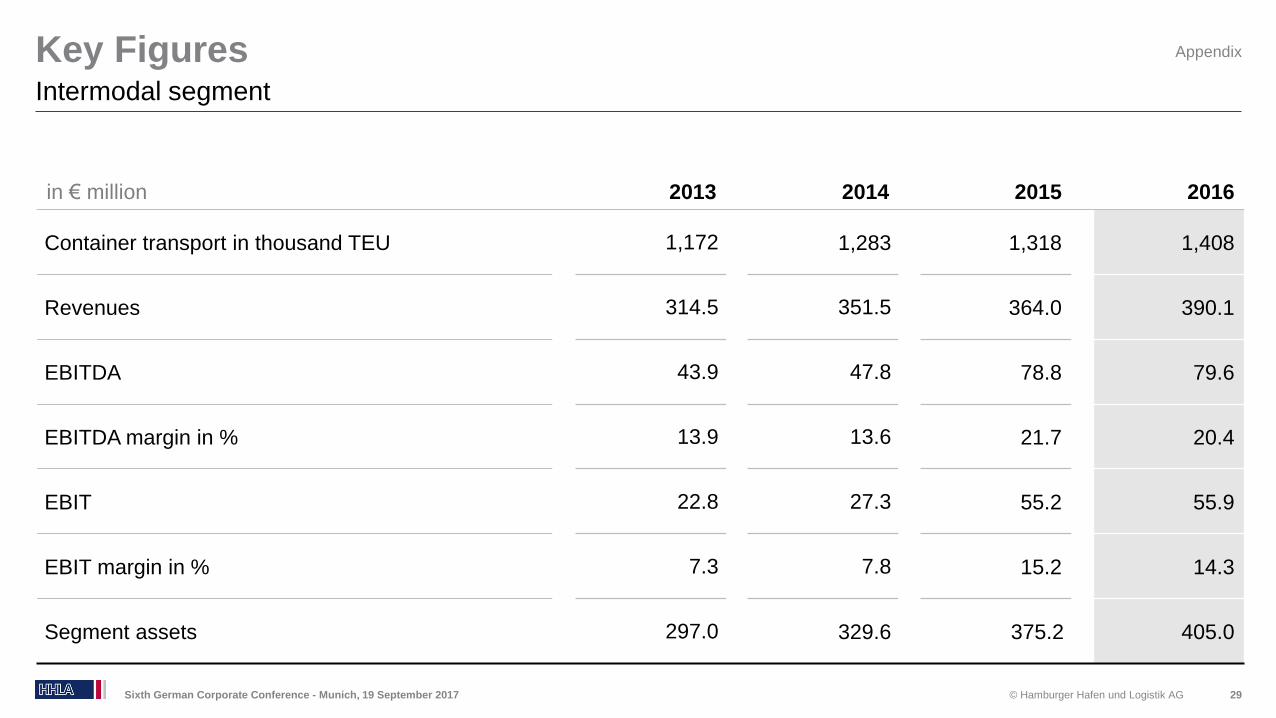
in € million 2013 2014 2015 2016
Container transport in thousand TEU 1,172 1,283 1,318 1,408
Revenues 314.5 351.5 364.0 390.1
EBITDA 43.9 47.8 78.8 79.6
EBITDA margin in % 13.9 13.6 21.7 20.4
EBIT 22.8 27.3 55.2 55.9
EBIT margin in % 7.3 7.8 15.2 14.3
Segment assets 297.0 329.6 375.2 405.0
Key Figures
Sixth German Corporate Conference - Munich, 19 September 2017 29
Intermodal segment
Appendix
© Hamburger Hafen und Logistik AG
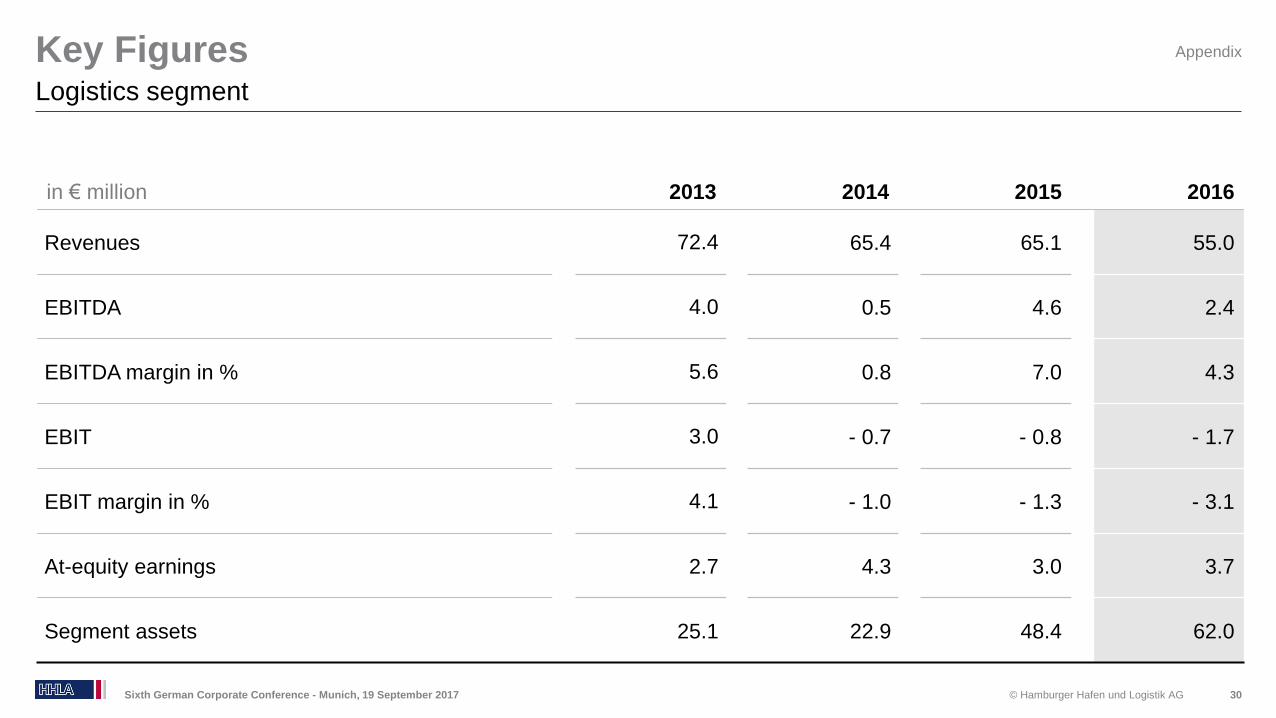
in € million 2013 2014 2015 2016
Revenues 72.4 65.4 65.1 55.0
EBITDA 4.0 0.5 4.6 2.4
EBITDA margin in % 5.6 0.8 7.0 4.3
EBIT 3.0 - 0.7 - 0.8 - 1.7
EBIT margin in % 4.1 - 1.0 - 1.3 - 3.1
At-equity earnings 2.7 4.3 3.0 3.7
Segment assets 25.1 22.9 48.4 62.0
Key Figures
Sixth German Corporate Conference - Munich, 19 September 2017 30
Logistics segment
Appendix
© Hamburger Hafen und Logistik AG
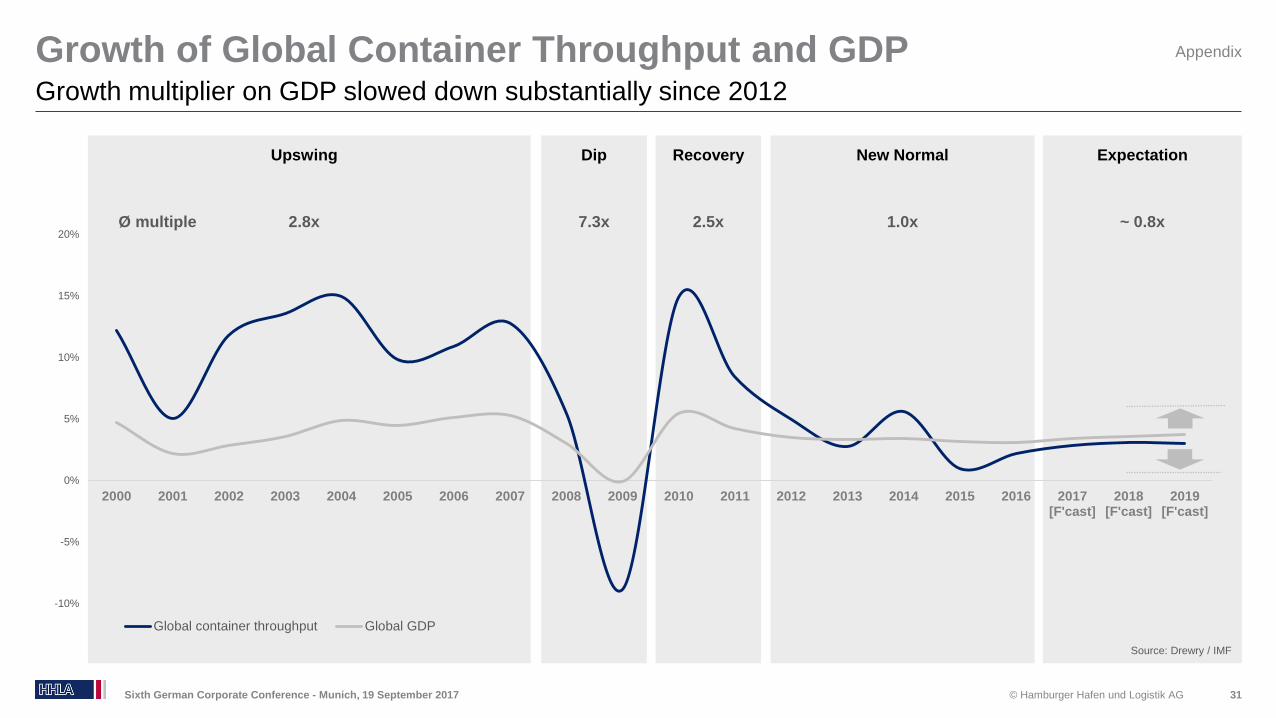
Growth of Global Container Throughput and GDP
Sixth German Corporate Conference - Munich, 19 September 2017 31
Growth multiplier on GDP slowed down substantially since 2012
Upswing Dip Recovery New Normal
-10%
-5%
0%
5%
10%
15%
20%
2000 2001 2002 2003 2004 2005 2006 2007 2008 2009 2010 2011 2012 2013 2014 2015 2016 2017[F'cast]
2018[F'cast]
2019[F'cast]
Global container throughput Global GDP
2.5x2.8x 7.3x
Expectation
1.0x ~ 0.8xØ multiple
Source: Drewry / IMF
Appendix
© Hamburger Hafen und Logistik AG
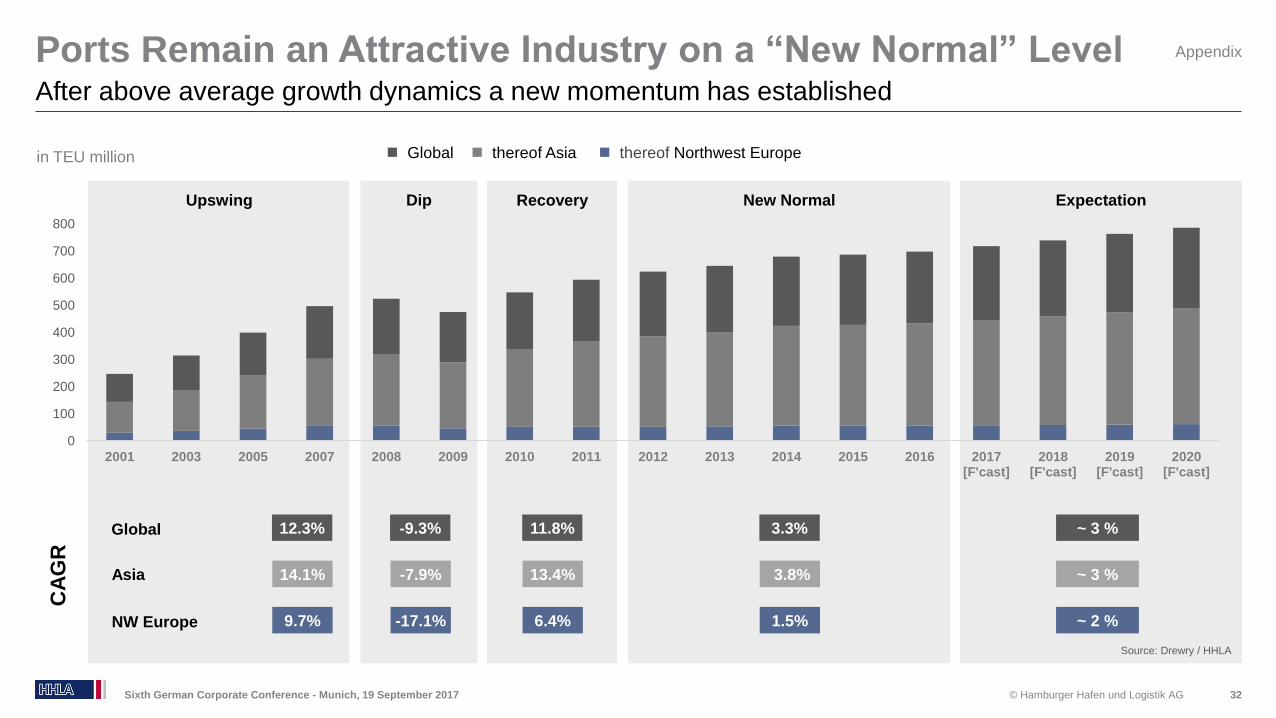
in TEU million
Ports Remain an Attractive Industry on a “New Normal” Level
Sixth German Corporate Conference - Munich, 19 September 2017 32
After above average growth dynamics a new momentum has established
Global thereof Asia thereof Northwest Europe
Source: Drewry / HHLA
Upswing Dip Recovery New Normal Expectation
14.1% -7.9% 13.4% 3.8% ~ 3 %
9.7% -17.1% 6.4% 1.5% ~ 2 %
CA
GR
12.3% -9.3% 11.8% 3.3% ~ 3 %
Asia
NW Europe
Global
0
100
200
300
400
500
600
700
800
2001 2003 2005 2007 2008 2009 2010 2011 2012 2013 2014 2015 2016 2017[F'cast]
2018[F'cast]
2019[F'cast]
2020[F'cast]
Appendix
© Hamburger Hafen und Logistik AG
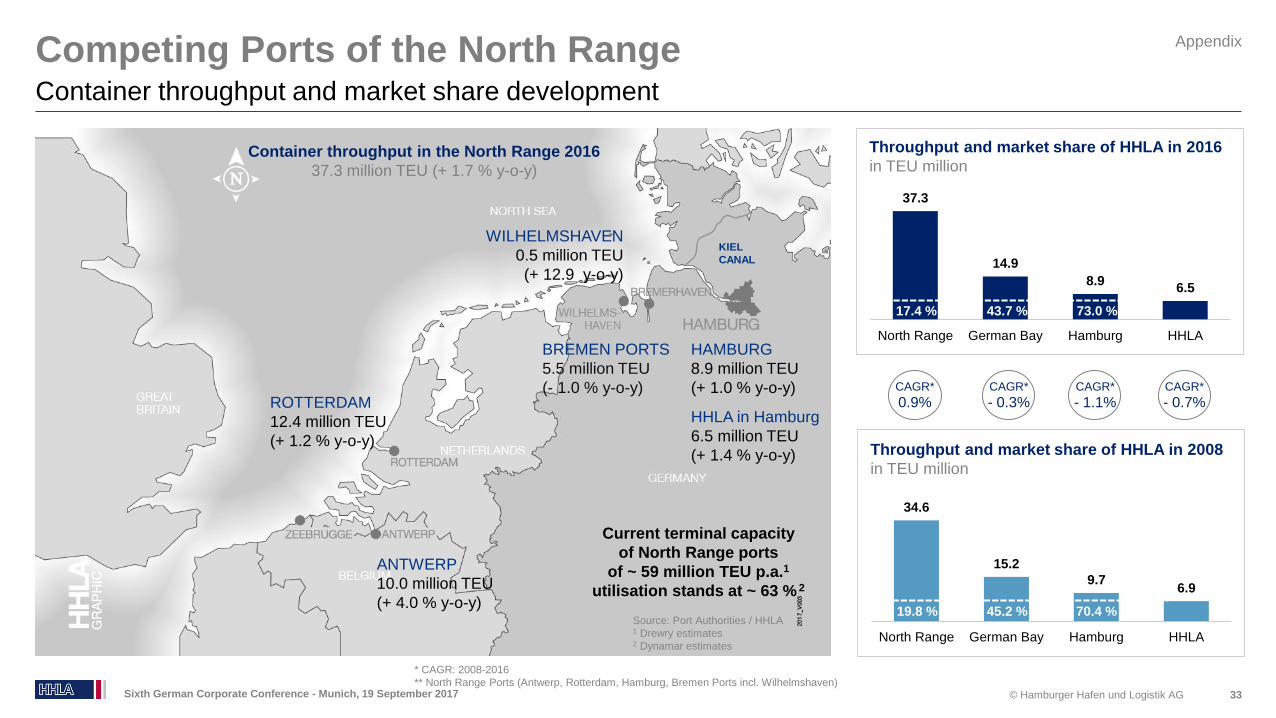
Competing Ports of the North Range
33
Container throughput and market share development
Sixth German Corporate Conference - Munich, 19 September 2017
WILHELMSHAVEN
0.5 million TEU
(+ 12.9 y-o-y)
ROTTERDAM
12.4 million TEU
(+ 1.2 % y-o-y)
ANTWERP
10.0 million TEU
(+ 4.0 % y-o-y)
BREMEN PORTS
5.5 million TEU
(- 1.0 % y-o-y)
HAMBURG
8.9 million TEU
(+ 1.0 % y-o-y)
KIEL
CANAL
HHLA in Hamburg
6.5 million TEU
(+ 1.4 % y-o-y)
Current terminal capacity
of North Range ports
of ~ 59 million TEU p.a.1
utilisation stands at ~ 63 % 2
Container throughput in the North Range 2016
37.3 million TEU (+ 1.7 % y-o-y)
37.3
14.9
8.96.5
North Range German Bay Hamburg HHLA
Throughput and market share of HHLA in 2016
in TEU million
34.6
15.2
9.76.9
North Range German Bay Hamburg HHLA
Throughput and market share of HHLA in 2008
in TEU million
70.4 %45.2 %19.8 %
CAGR*
0.9%CAGR*
- 0.3%CAGR*
- 1.1%CAGR*
- 0.7%
73.0 %43.7 %17.4 %
Source: Port Authorities / HHLA1 Drewry estimates2 Dynamar estimates
Appendix
* CAGR: 2008-2016
** North Range Ports (Antwerp, Rotterdam, Hamburg, Bremen Ports incl. Wilhelmshaven)
© Hamburger Hafen und Logistik AG
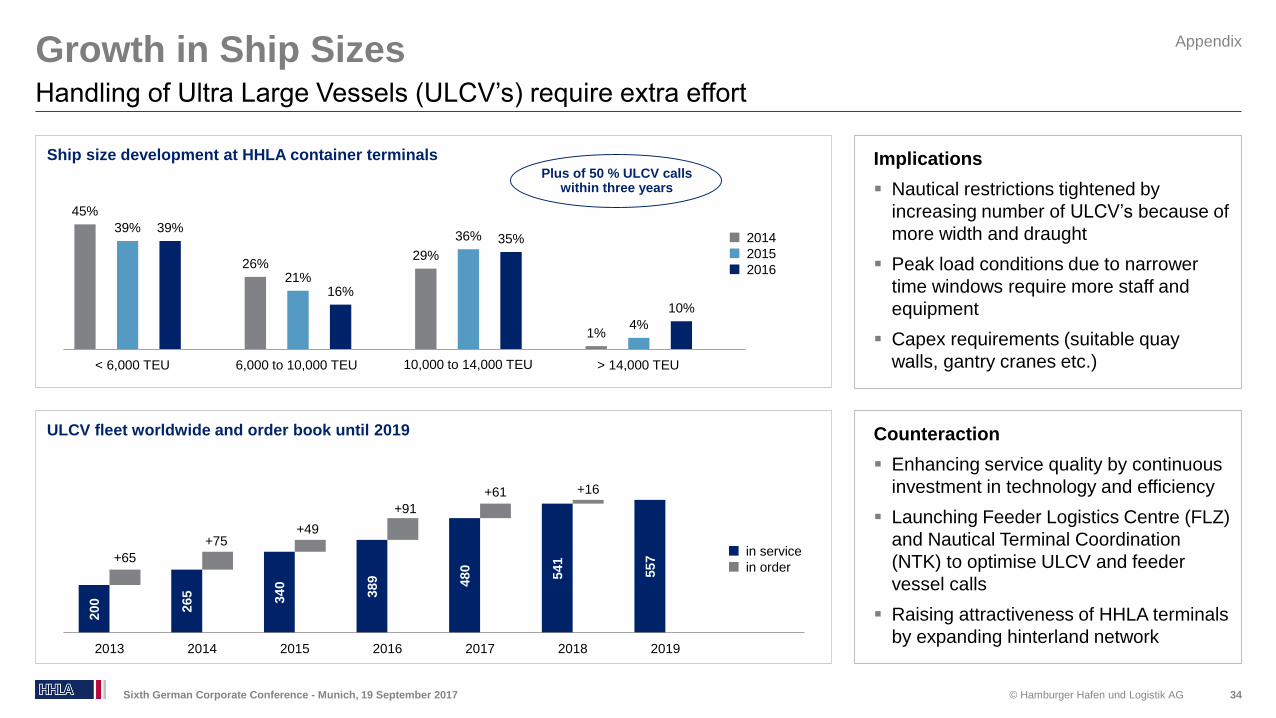
Growth in Ship Sizes
34
Handling of Ultra Large Vessels (ULCV’s) require extra effort
Sixth German Corporate Conference - Munich, 19 September 2017
Counteraction
Enhancing service quality by continuous
investment in technology and efficiency
Launching Feeder Logistics Centre (FLZ)
and Nautical Terminal Coordination
(NTK) to optimise ULCV and feeder
vessel calls
Raising attractiveness of HHLA terminals
by expanding hinterland network
Implications
Nautical restrictions tightened by
increasing number of ULCV’s because of
more width and draught
Peak load conditions due to narrower
time windows require more staff and
equipment
Capex requirements (suitable quay
walls, gantry cranes etc.)
45%
39% 39%
26%21%
16%
29%
36% 35%
1%4%
10%
Ship size development at HHLA container terminals
200
265 340
389 480
541
557+65
+75+49
+91
+61 +16
2013 2014 2015 2016 2017 2018 2019
> 14,000 TEU< 6,000 TEU 6,000 to 10,000 TEU
ULCV fleet worldwide and order book until 2019
in service
in order
2014
2015
2016
10,000 to 14,000 TEU
Plus of 50 % ULCV calls within three years
Appendix
© Hamburger Hafen und Logistik AG
High
Low
Low
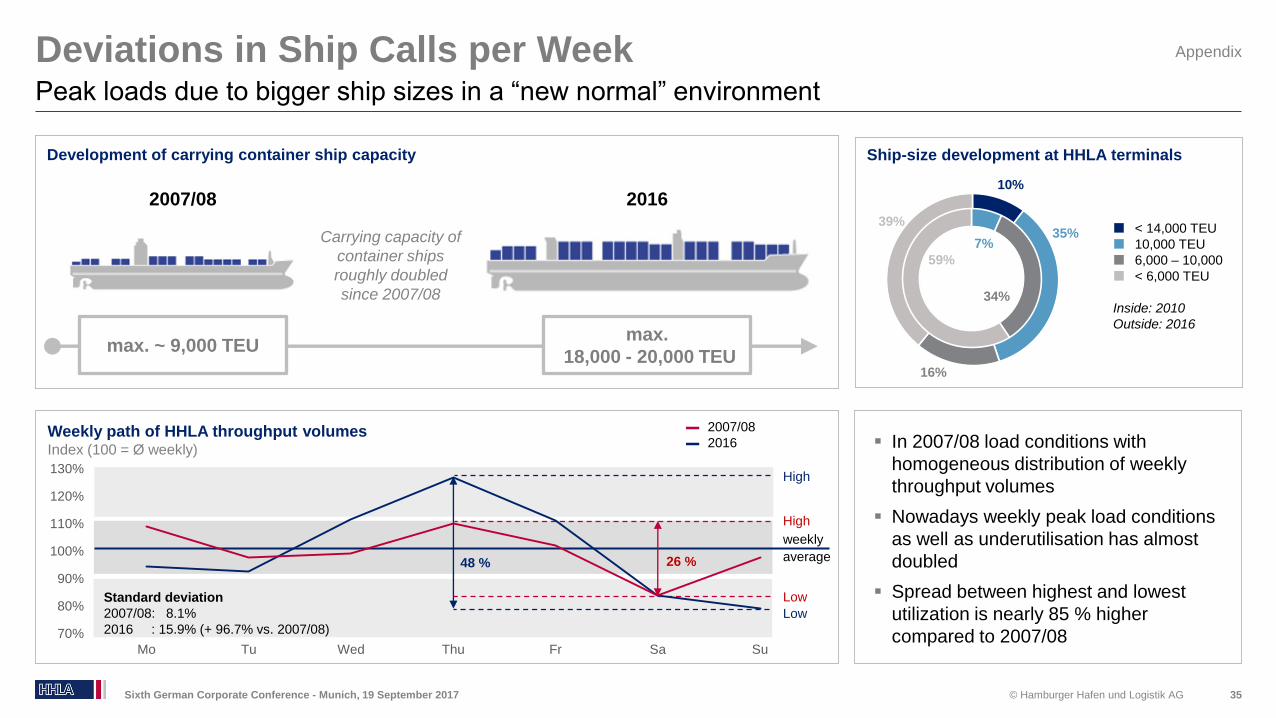
48 % 26 %
weekly
average
High
Standard deviation
2007/08: 8.1%
2016 : 15.9% (+ 96.7% vs. 2007/08)
10%
35%
16%
39%
Deviations in Ship Calls per Week
Sixth German Corporate Conference - Munich, 19 September 2017 35
Peak loads due to bigger ship sizes in a “new normal” environment
Carrying capacity of
container ships
roughly doubled
since 2007/08
2007/08 2016
In 2007/08 load conditions with
homogeneous distribution of weekly
throughput volumes
Nowadays weekly peak load conditions
as well as underutilisation has almost
doubled
Spread between highest and lowest
utilization is nearly 85 % higher
compared to 2007/08
max. ~ 9,000 TEUmax.
18,000 - 20,000 TEU
Development of carrying container ship capacity
Weekly path of HHLA throughput volumesIndex (100 = Ø weekly)
▬ 2007/08
▬ 2016
Ship-size development at HHLA terminals
< 14,000 TEU
10,000 TEU
6,000 – 10,000
< 6,000 TEU
Inside: 2010
Outside: 2016
7%
34%
59%
Appendix
70%
80%
90%
100%
110%
120%
130%
Mo Tu Wed Thu Fr Sa Su
© Hamburger Hafen und Logistik AG
Shipping Lines
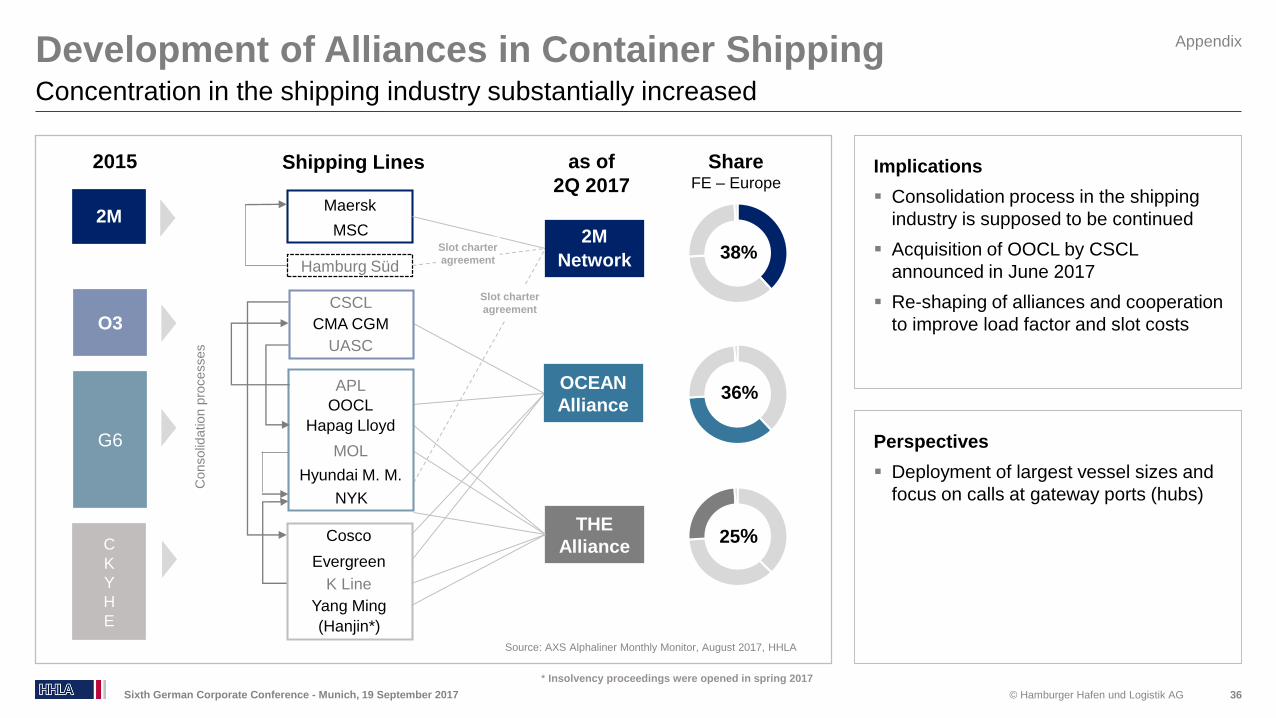
Development of Alliances in Container Shipping
36
Concentration in the shipping industry substantially increased
Sixth German Corporate Conference - Munich, 19 September 2017
70.4 %45.2 %
Perspectives
Deployment of largest vessel sizes and
focus on calls at gateway ports (hubs)
Implications
Consolidation process in the shipping
industry is supposed to be continued
Acquisition of OOCL by CSCL
announced in June 2017
Re-shaping of alliances and cooperation
to improve load factor and slot costs
THE
Alliance
2015 as of
2Q 2017
38%
36%
25%
ShareFE – Europe
Source: AXS Alphaliner Monthly Monitor, August 2017, HHLA
Hapag Lloyd
OOCL
MOL
APL
Hyundai M. M.
Cosco
K Line
Yang Ming
Evergreen
CMA CGM
CSCL
UASC
2M
O3
G6
C
K
Y
H
E
Consolid
ation p
rocesses
Slot charter
agreement
(Hanjin*)
Hamburg Süd
NYK
Slot charter
agreement
Maersk
MSC
Appendix
* Insolvency proceedings were opened in spring 2017
OCEAN
Alliance
2M
Network
© Hamburger Hafen und Logistik AG
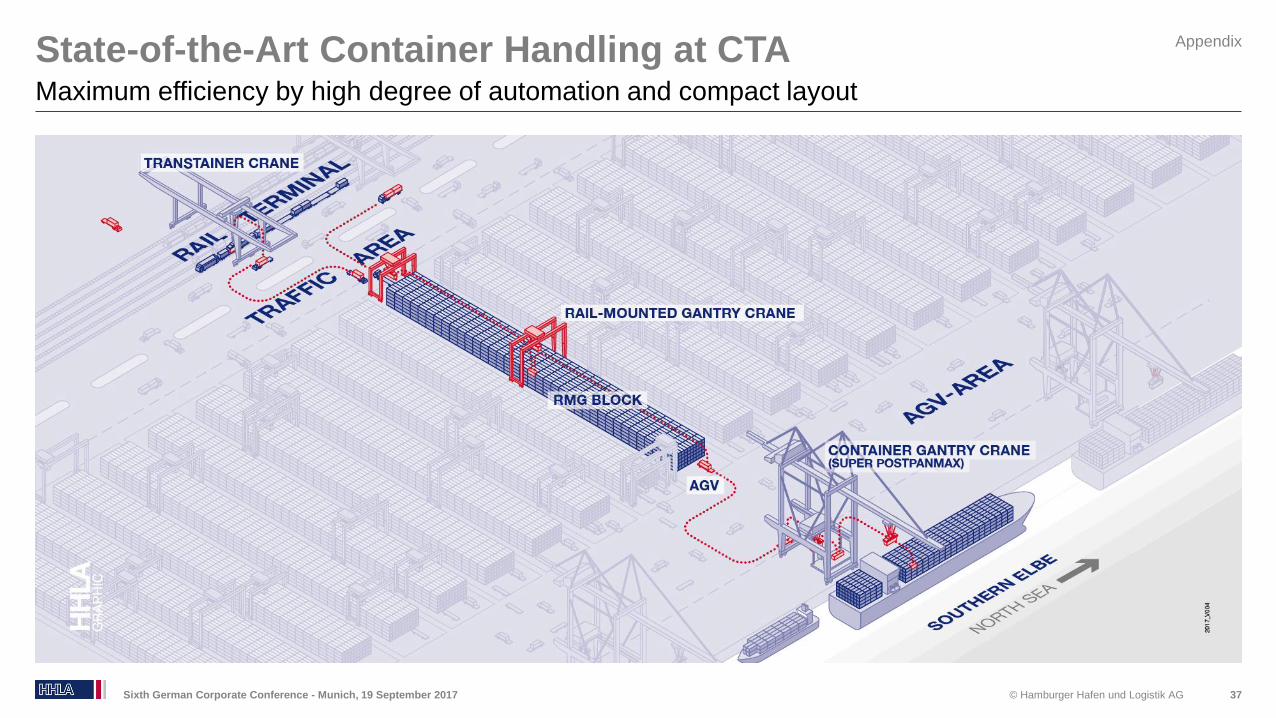
State-of-the-Art Container Handling at CTA
37
Maximum efficiency by high degree of automation and compact layout
Sixth German Corporate Conference - Munich, 19 September 2017
Appendix
© Hamburger Hafen und Logistik AG
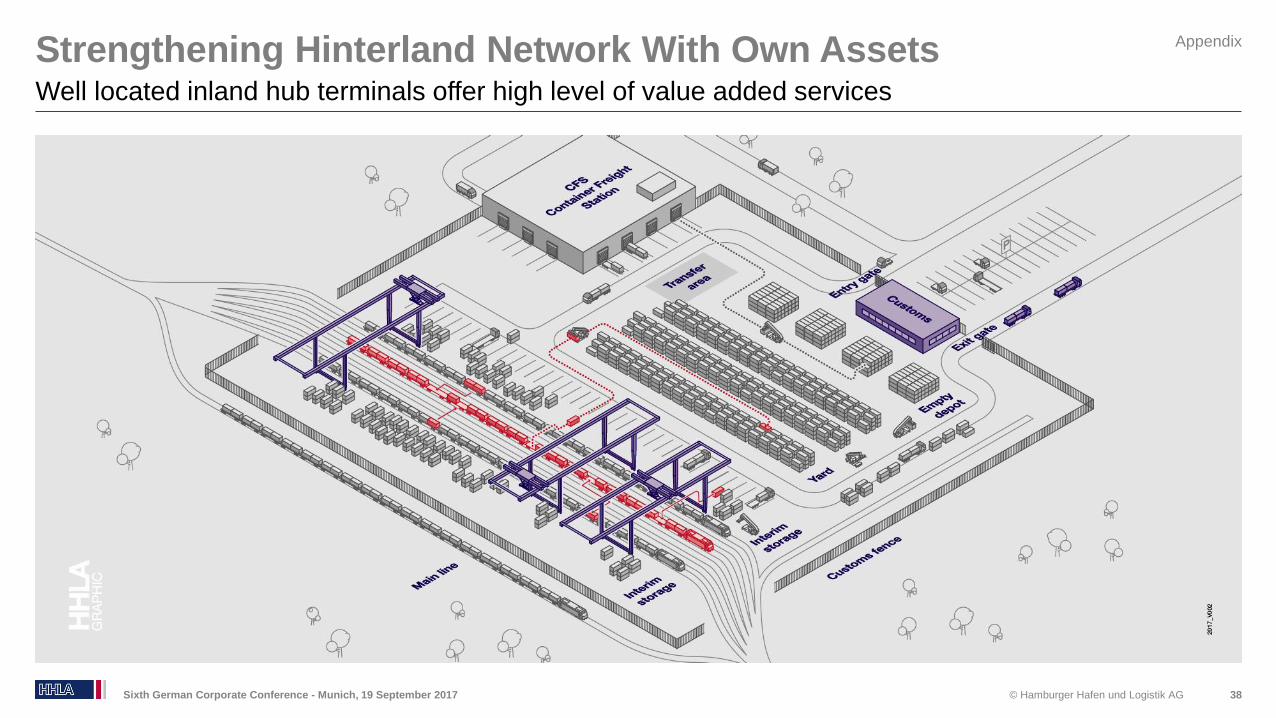
Strengthening Hinterland Network With Own Assets
38
Well located inland hub terminals offer high level of value added services
Sixth German Corporate Conference - Munich, 19 September 2017
Appendix
© Hamburger Hafen und Logistik AG
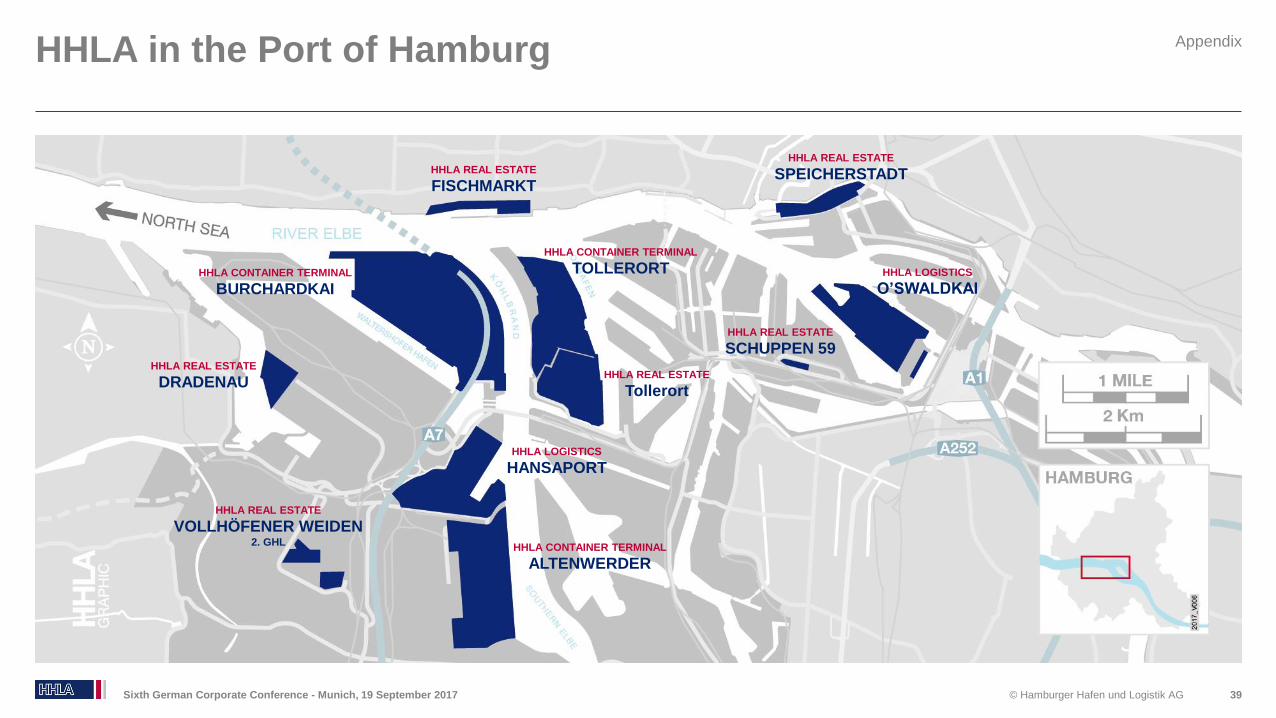
HHLA in the Port of Hamburg
39Sixth German Corporate Conference - Munich, 19 September 2017
Appendix
HHLA CONTAINER TERMINAL
BURCHARDKAI
HHLA CONTAINER TERMINAL
ALTENWERDER
HHLA LOGISTICS
HANSAPORT
HHLA CONTAINER TERMINAL
TOLLERORT
HHLA REAL ESTATE
FISCHMARKT
HHLA REAL ESTATE
SPEICHERSTADT
HHLA LOGISTICS
O’SWALDKAI
HHLA REAL ESTATE
SCHUPPEN 59
HHLA REAL ESTATE
VOLLHÖFENER WEIDEN2. GHL
HHLA REAL ESTATE
DRADENAUHHLA REAL ESTATE
Tollerort
© Hamburger Hafen und Logistik AG
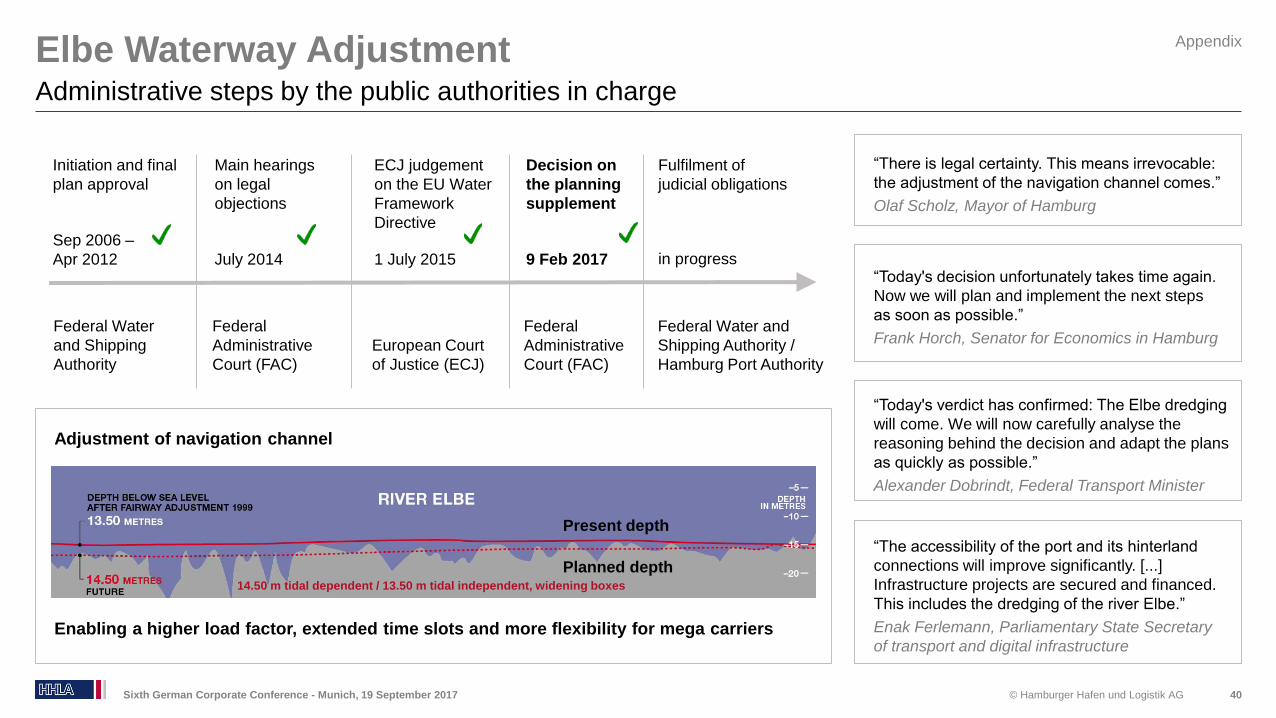
Elbe Waterway Adjustment
40
Administrative steps by the public authorities in charge
Sixth German Corporate Conference - Munich, 19 September 2017
Adjustment of navigation channel
Enabling a higher load factor, extended time slots and more flexibility for mega carriers
14.50 m tidal dependent / 13.50 m tidal independent, widening boxes
Main hearings
on legal
objections
Federal
Administrative
Court (FAC)
Initiation and final
plan approval
Sep 2006 –
Apr 2012 July 2014
ECJ judgement
on the EU Water
Framework
Directive
European Court
of Justice (ECJ)
1 July 2015
Decision on
the planning
supplement
9 Feb 2017
Federal Water and
Shipping Authority /
Hamburg Port Authority
Fulfilment of
judicial obligations
Appendix
in progress
Present depth
Planned depth14.50 m tidal dependent / 13.50 m tidal independent, widening boxes
Federal
Administrative
Court (FAC)
Federal Water
and Shipping
Authority
“There is legal certainty. This means irrevocable:
the adjustment of the navigation channel comes.”
Olaf Scholz, Mayor of Hamburg
“The accessibility of the port and its hinterland
connections will improve significantly. [...]
Infrastructure projects are secured and financed.
This includes the dredging of the river Elbe.”
Enak Ferlemann, Parliamentary State Secretary
of transport and digital infrastructure
“Today's verdict has confirmed: The Elbe dredging
will come. We will now carefully analyse the
reasoning behind the decision and adapt the plans
as quickly as possible.”
Alexander Dobrindt, Federal Transport Minister
“Today's decision unfortunately takes time again.
Now we will plan and implement the next steps
as soon as possible.”
Frank Horch, Senator for Economics in Hamburg
© Hamburger Hafen und Logistik AG
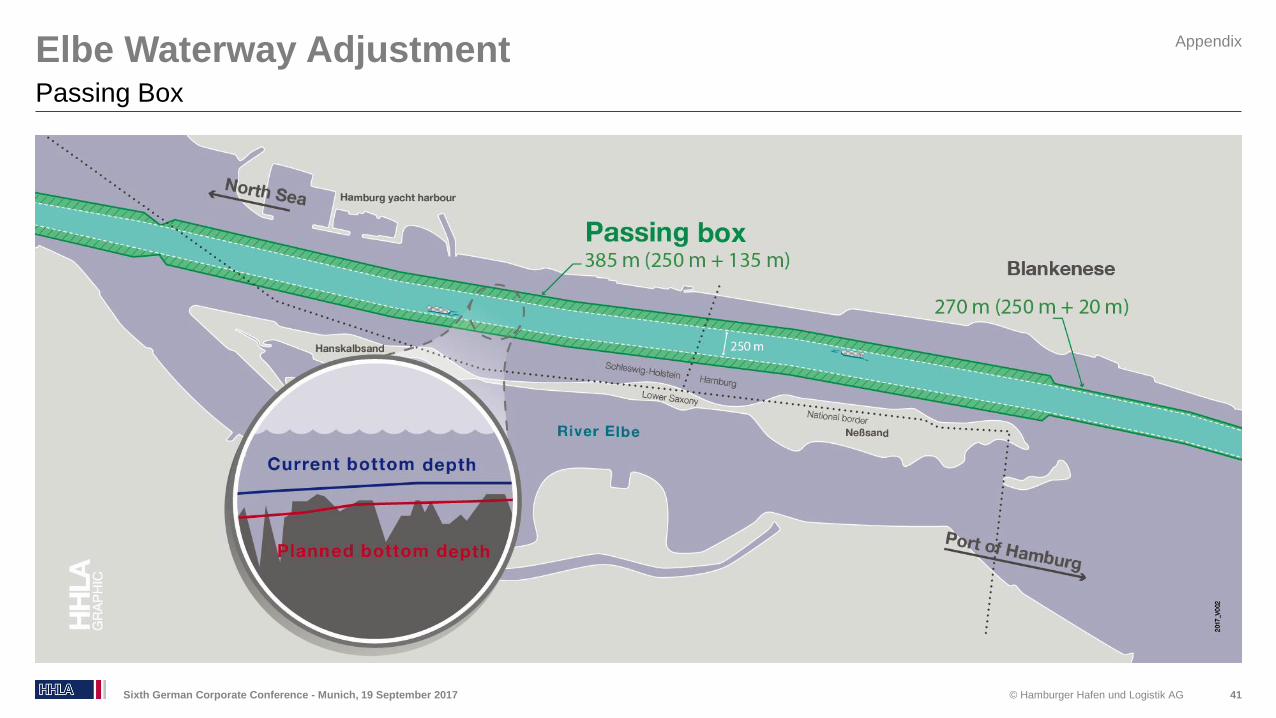
Elbe Waterway Adjustment
41
Passing Box
Sixth German Corporate Conference - Munich, 19 September 2017
Appendix
© Hamburger Hafen und Logistik AG
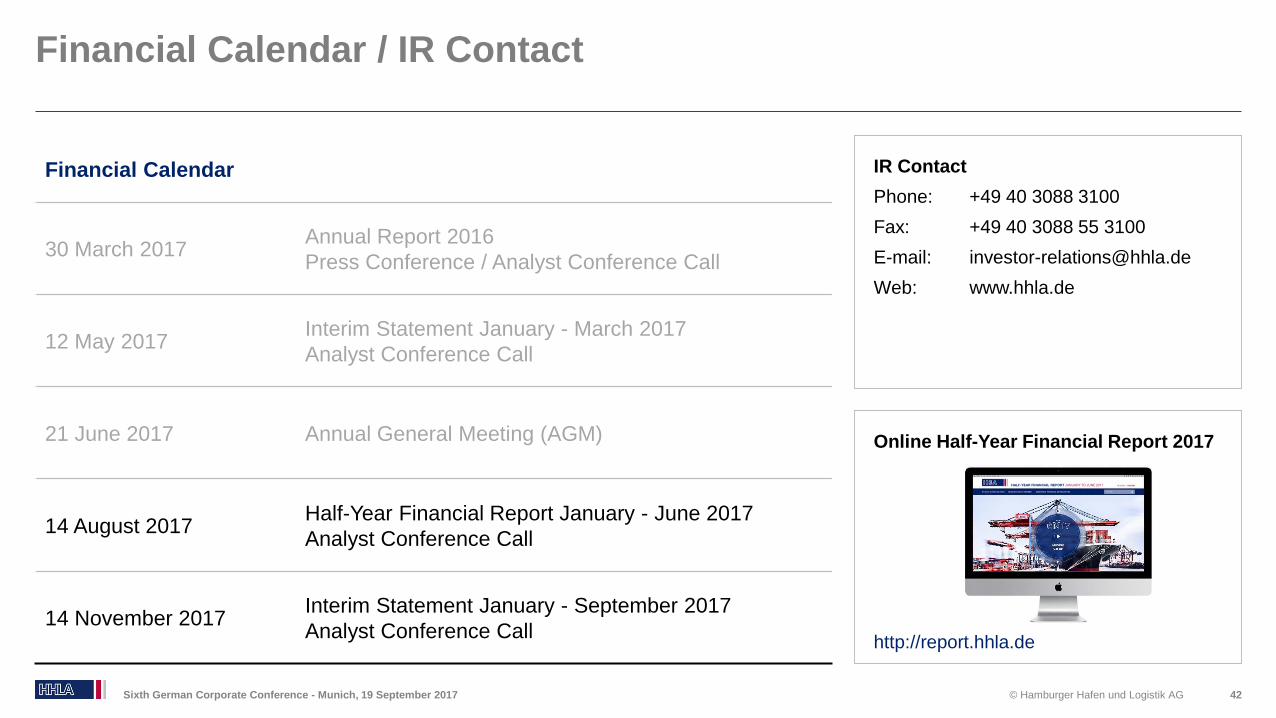
Financial Calendar / IR Contact
42Sixth German Corporate Conference - Munich, 19 September 2017
Online Half-Year Financial Report 2017
IR Contact
Phone: +49 40 3088 3100
Fax: +49 40 3088 55 3100
E-mail: [email protected]
Web: www.hhla.de
Financial Calendar
30 March 2017Annual Report 2016
Press Conference / Analyst Conference Call
12 May 2017Interim Statement January - March 2017
Analyst Conference Call
21 June 2017 Annual General Meeting (AGM)
14 August 2017Half-Year Financial Report January - June 2017
Analyst Conference Call
14 November 2017Interim Statement January - September 2017
Analyst Conference Callhttp://report.hhla.de
HALF-YEAR FINANCIAL REPORT JANUARY TO JUNE 2017
© Hamburger Hafen und Logistik AG
Interim Statement January to June 2017 http://report.hhla.de/half-year-financial-report-2017/
Related Documents