Impacts of Climate change and seed dispersal on airborne ragweed pollen concentrations in Europe L. Hamaoui-Laguel, R. Vautard, L. Liu, F. Solmon, N. Viovy et al. Our Common Future Under Climate Change : July 7, 2015

Welcome message from author
This document is posted to help you gain knowledge. Please leave a comment to let me know what you think about it! Share it to your friends and learn new things together.
Transcript
Impacts of Climate change and seed dispersal on airborne ragweed pollen concentrations in
Europe
L. Hamaoui-Laguel, R. Vautard, L. Liu, F. Solmon, N. Viovy et al.
Our Common Future Under Climate Change : July 7, 2015
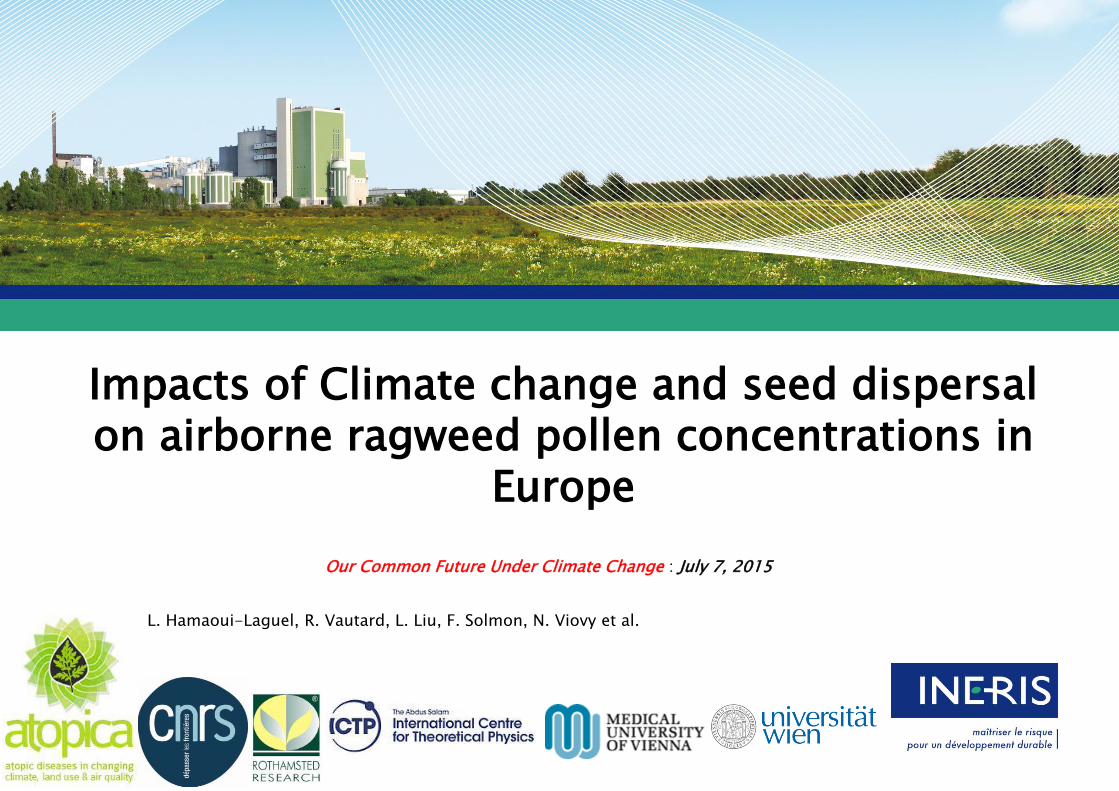
This study is realized within the framework of the ATOPICA project (FP7) : the fate of pollen allergies in Europe due to changes in climate, land use and air quality.
Common Ragweed (Ambrosia artemisiifolia L. ) is an invasive annual weed native to North America, introduced into Europe in the 19th century. Its pollen is abundant and very allergenic causing serious health effects on sensitive people.
Develop modeling tools to be able to project the evolution of airborne pollen in the future.
INTRODUCTION
Inra-Dijon
Anke Bellaire University of Vienna
General methodology : modeling chain ;
Hindcast simulations : calibration and evaluation ;
Ragweed projected changes ;
Attribution of changes;
Uncertainty due to seed dispersal ;
Conclusions and key messages ;
OUTLINE
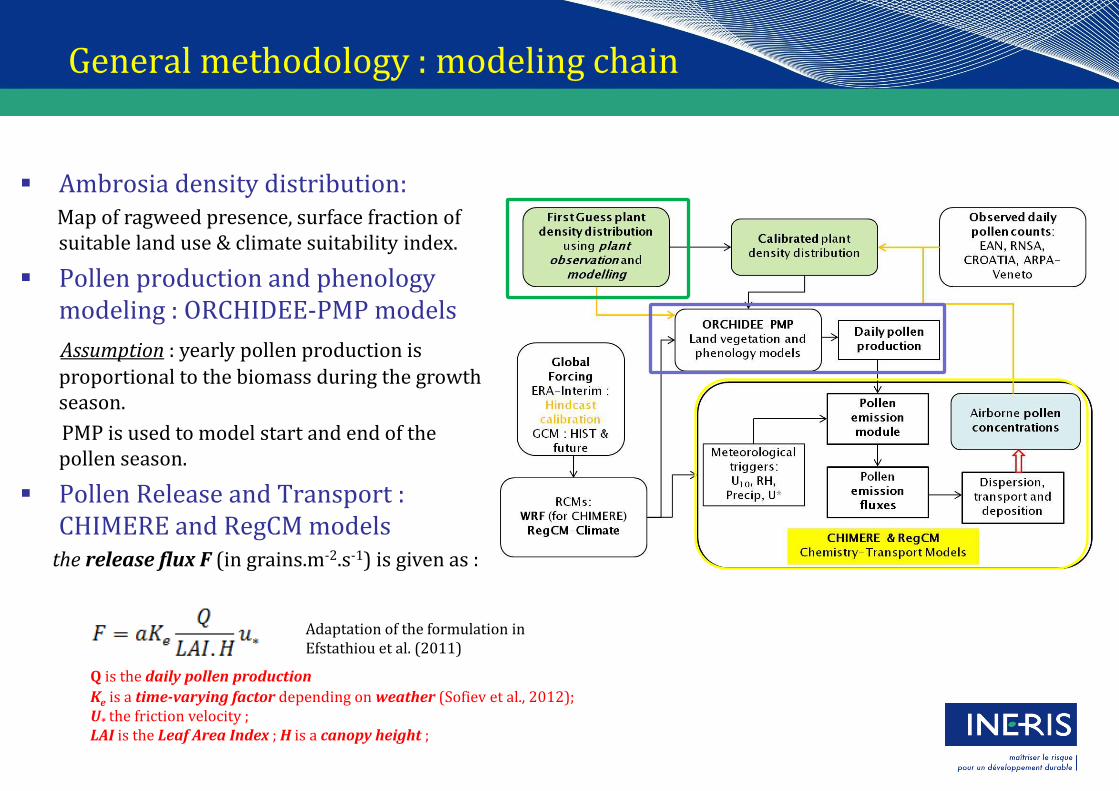
General methodology : modeling chain
Ambrosia density distribution: Map of ragweed presence, surface fraction of suitable land use & climate suitability index.
Pollen production and phenology modeling : ORCHIDEE-PMP models
Assumption : yearly pollen production is
proportional to the biomass during the growth season.
PMP is used to model start and end of the pollen season.
Pollen Release and Transport : CHIMERE and RegCM models
the release flux F (in grains.m-2.s-1) is given as :
Q is the daily pollen production
Ke is a time-varying factor depending on weather (Sofiev et al., 2012); U* the friction velocity ; LAI is the Leaf Area Index ; H is a canopy height ;
Adaptation of the formulation in Efstathiou et al. (2011)
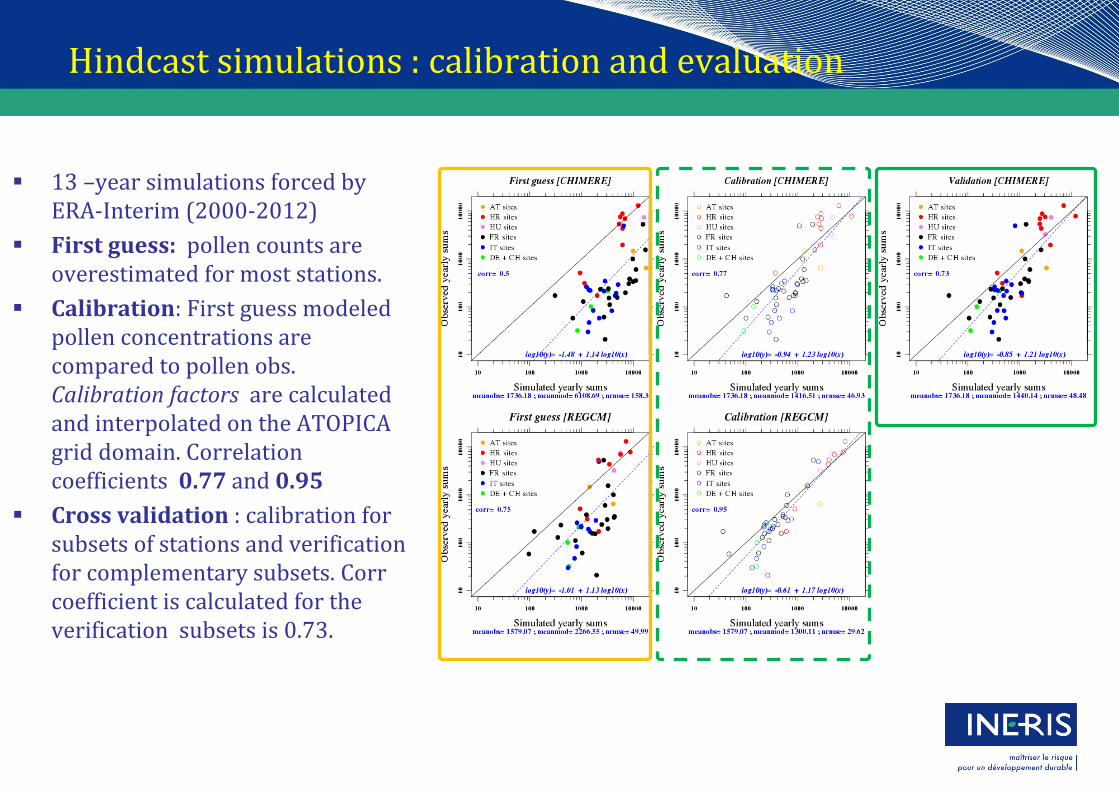
13 –year simulations forced by ERA-Interim (2000-2012)
First guess: pollen counts are overestimated for most stations.
Calibration: First guess modeled pollen concentrations are compared to pollen obs. Calibration factors are calculated and interpolated on the ATOPICA grid domain. Correlation coefficients 0.77 and 0.95
Cross validation : calibration for subsets of stations and verification for complementary subsets. Corr coefficient is calculated for the verification subsets is 0.73.
Hindcast simulations : calibration and evaluation
CHIMERE
RegCM
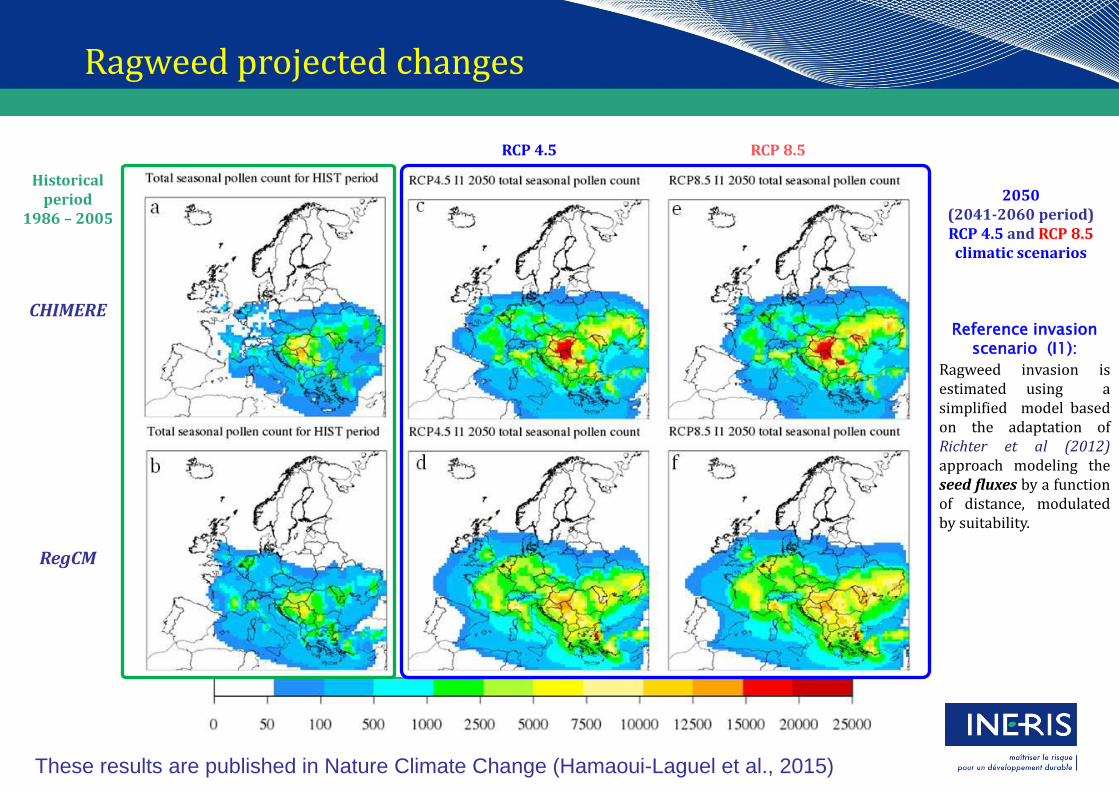
Reference invasion scenario (I1):
Ragweed invasion is estimated using a simplified model based on the adaptation of Richter et al (2012) approach modeling the seed fluxes by a function of distance, modulated by suitability.
2050 (2041-2060 period) RCP 4.5 and RCP 8.5 climatic scenarios
Historical period
1986 – 2005
RCP 4.5 RCP 8.5
Ragweed projected changes
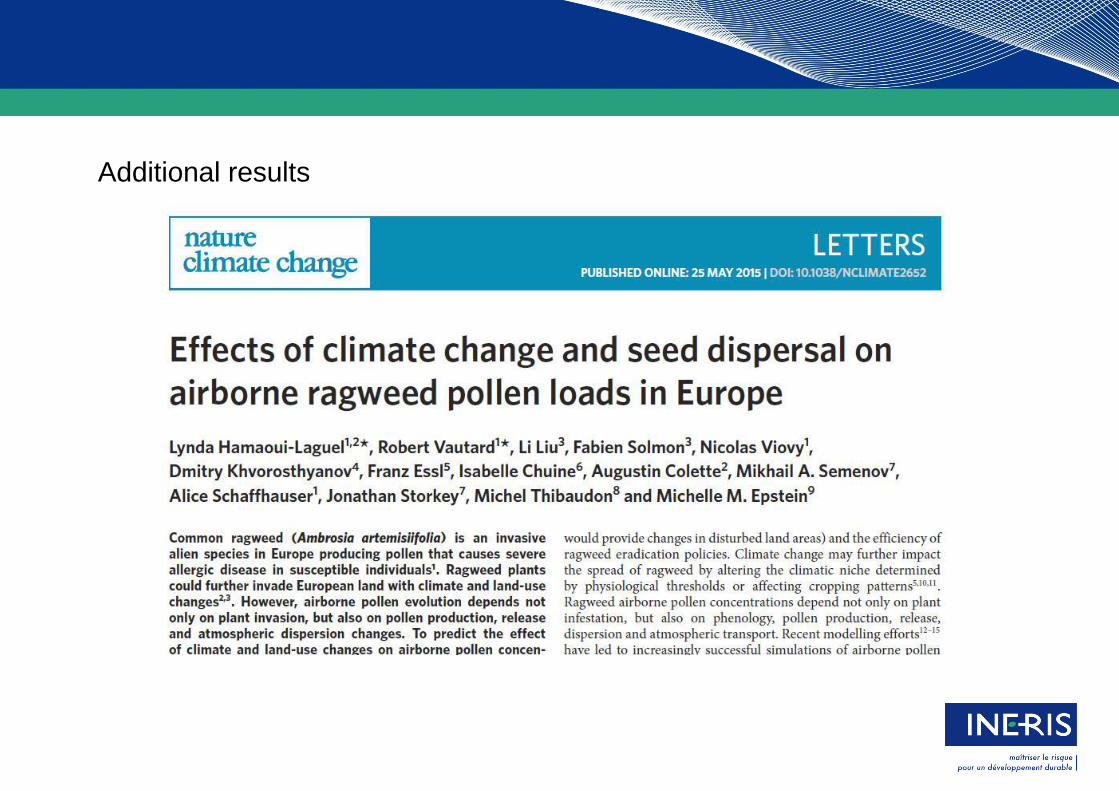
These results are published in Nature Climate Change (Hamaoui-Laguel et al., 2015)
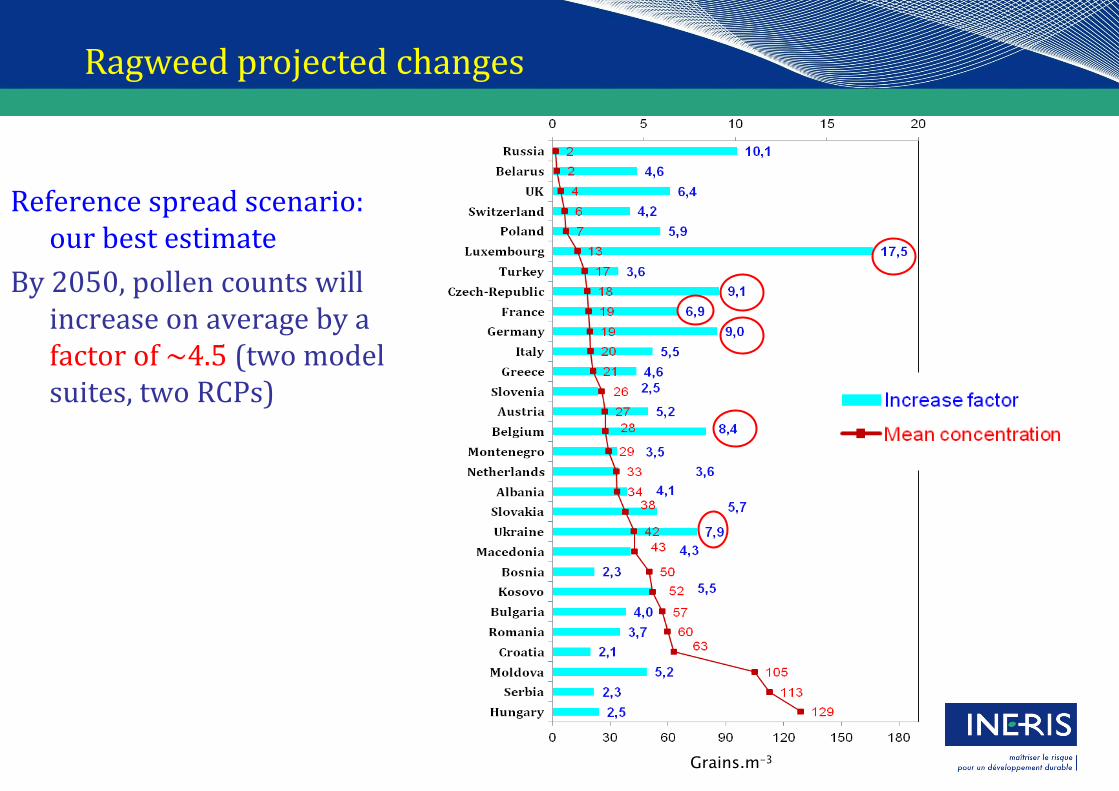
Ragweed projected changes
Reference spread scenario: our best estimate
By 2050, pollen counts will increase on average by a factor of ~4.5 (two model suites, two RCPs)
Grains.m-3

Attribution of changes
Sensitivity simulations:
S1 : No seed diffusion (same ragweed distribution as current) to evaluate the contribution of direct climate change effects (~15%)
S2 : Seed diffusion under median rate but without climate change effects to evaluate the contribution of seed diffusion without any climate change (~36%).
S3 : Seed diffusion under median rate with RCP8.5 climate/LU suitability changes but no direct climate change effects to evaluate the contribution of plant invasion under climate change only (~57%).
On average, about
- 1/3 of pollen increase is due to seed dispersal
- 2/3 are attributed to climate change:
increase of pollen production due to increasing CO2 and extension of suitable areas to Northern and Eastern Europe especially.
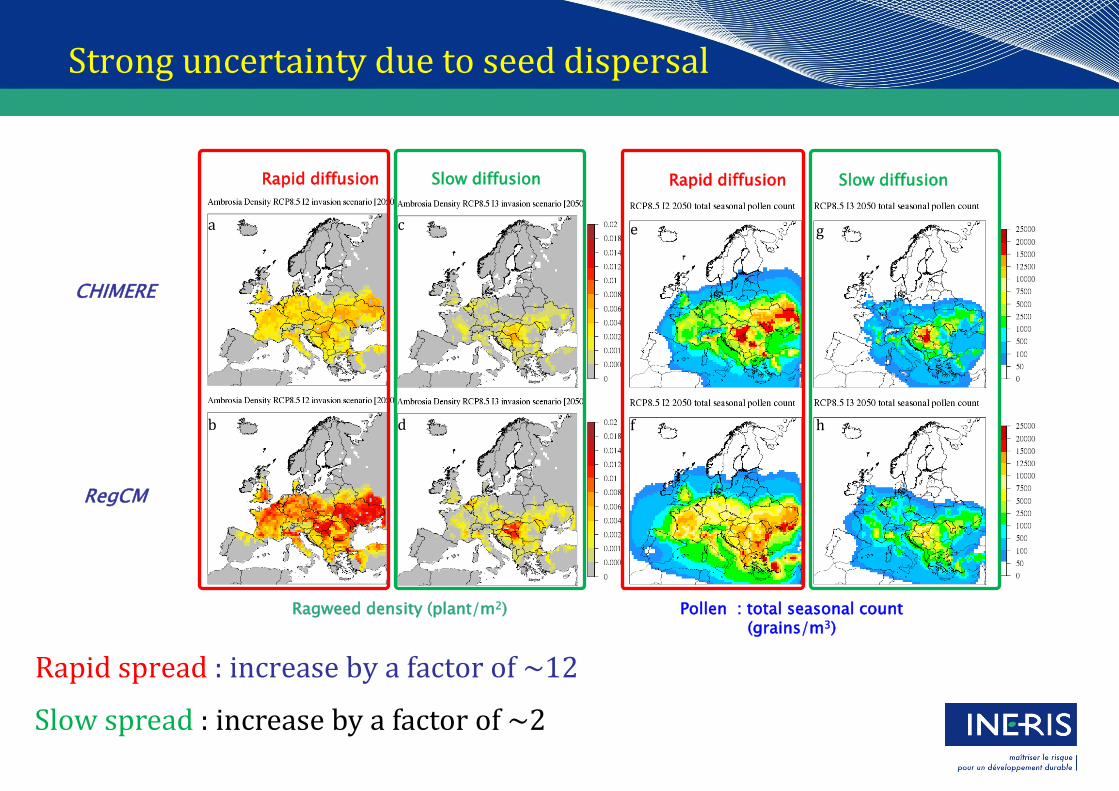
Rapid spread : increase by a factor of ~12
a c
b
e
d f
g
h
Rapid diffusion Slow diffusion
Ragweed density (plant/m2) Pollen : total seasonal count (grains/m3)
Rapid diffusion Slow diffusion
CHIMERE
RegCM
Strong uncertainty due to seed dispersal
Slow spread : increase by a factor of ~2
We have determined that pollen concentrations in Europe would increase on average by a factor of 4.5 by 2050.
Seed dispersal (mainly due to human activity) is responsible for a third of the increase in the pollen concentration.
Climate change is responsible for two thirds:
it promotes the expansion of ragweed in North and North-East Europe in particular
the increase in pollen production induced by the increase of CO2 and its favorable effect in the development of vegetation.
It is now necessary to establish coordinated management of this invasive plant in Europe.
Strong uncertainty: it is necessary to establish long term monitoring of this pollen and map the evolution of the presence of plants in Europe
Conclusions & Key messages

Thank you for your attention
Additional results

Attribution of changes
a
b d f
e c CHIMERE CHIMERE CHIMERE
RegCM RegCM RegCM
Ratios of pollen changes = (S(i) – HIST) / (reference – HIST)
S1 : Sensitivity simulation to evaluate the contribution of direct climate change effects
S2 : Sensitivity simulation to evaluate the contribution of seed diffusion without any climate change
S3 : Sensitivity simulation to evaluate the contribution of plant invasion under climate change only
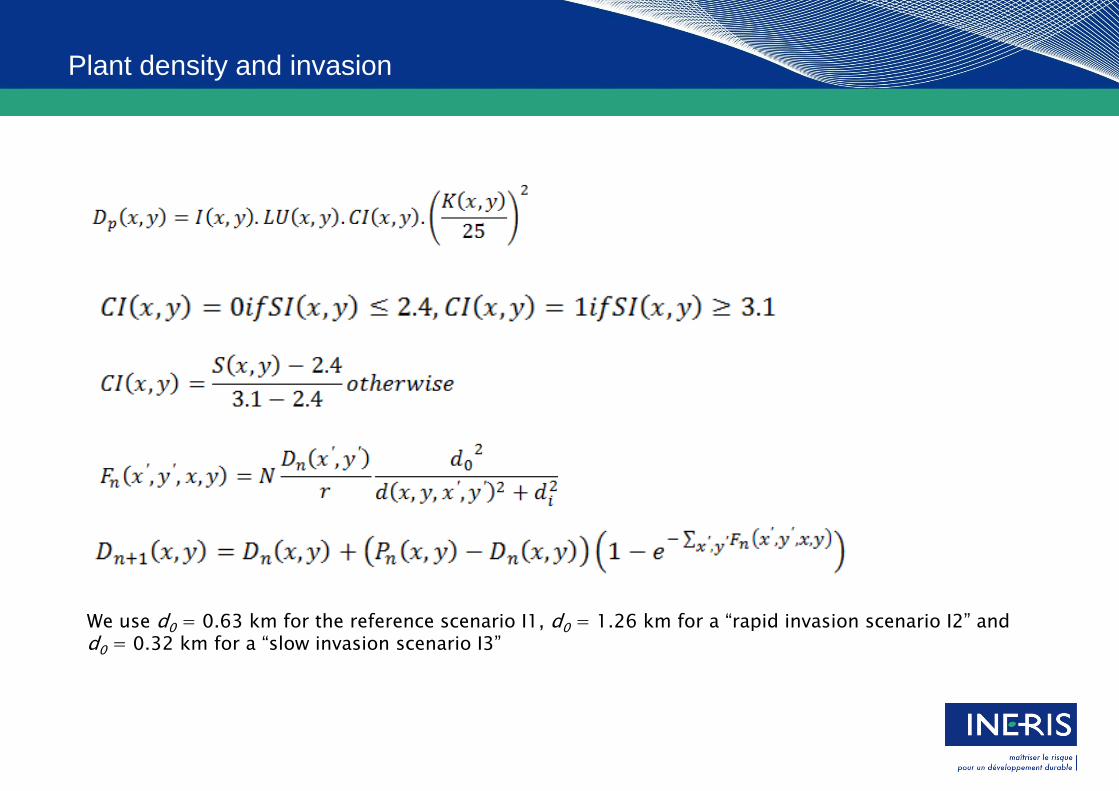
Plant density and invasion
We use d0 = 0.63 km for the reference scenario I1, d0 = 1.26 km for a “rapid invasion scenario I2” and d0 = 0.32 km for a “slow invasion scenario I3”
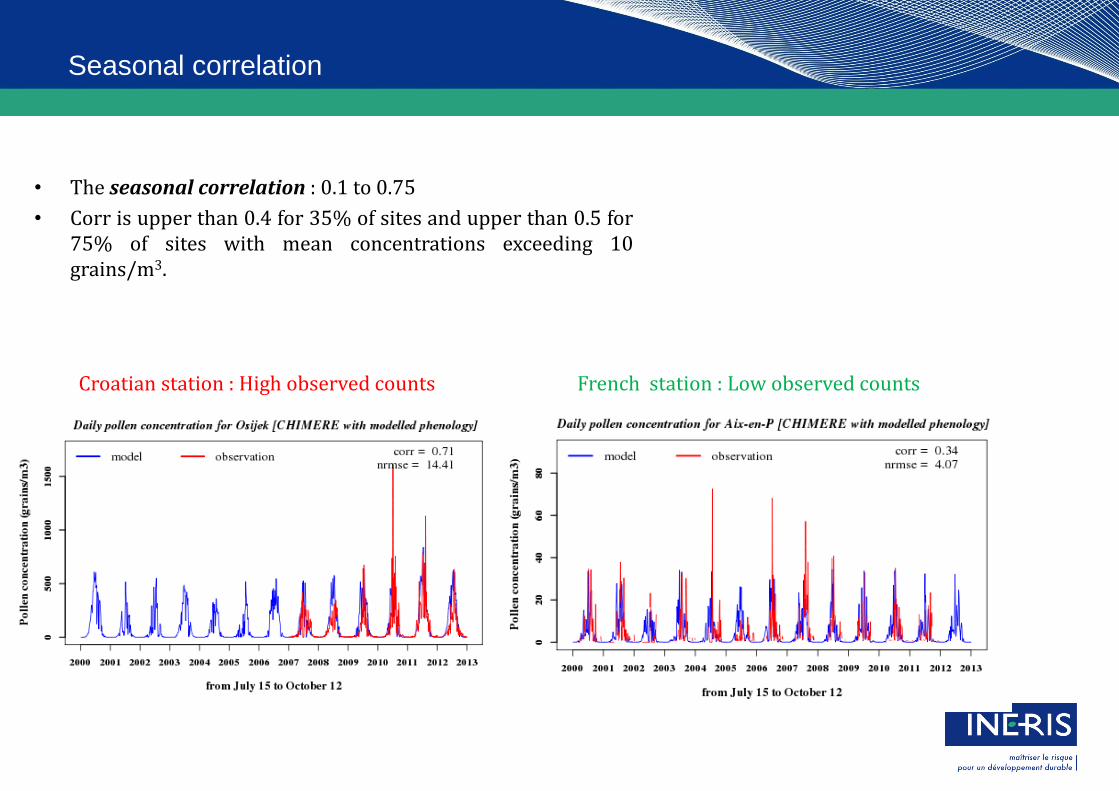
Seasonal correlation
Croatian station : High observed counts French station : Low observed counts
• The seasonal correlation : 0.1 to 0.75
• Corr is upper than 0.4 for 35% of sites and upper than 0.5 for 75% of sites with mean concentrations exceeding 10 grains/m3.
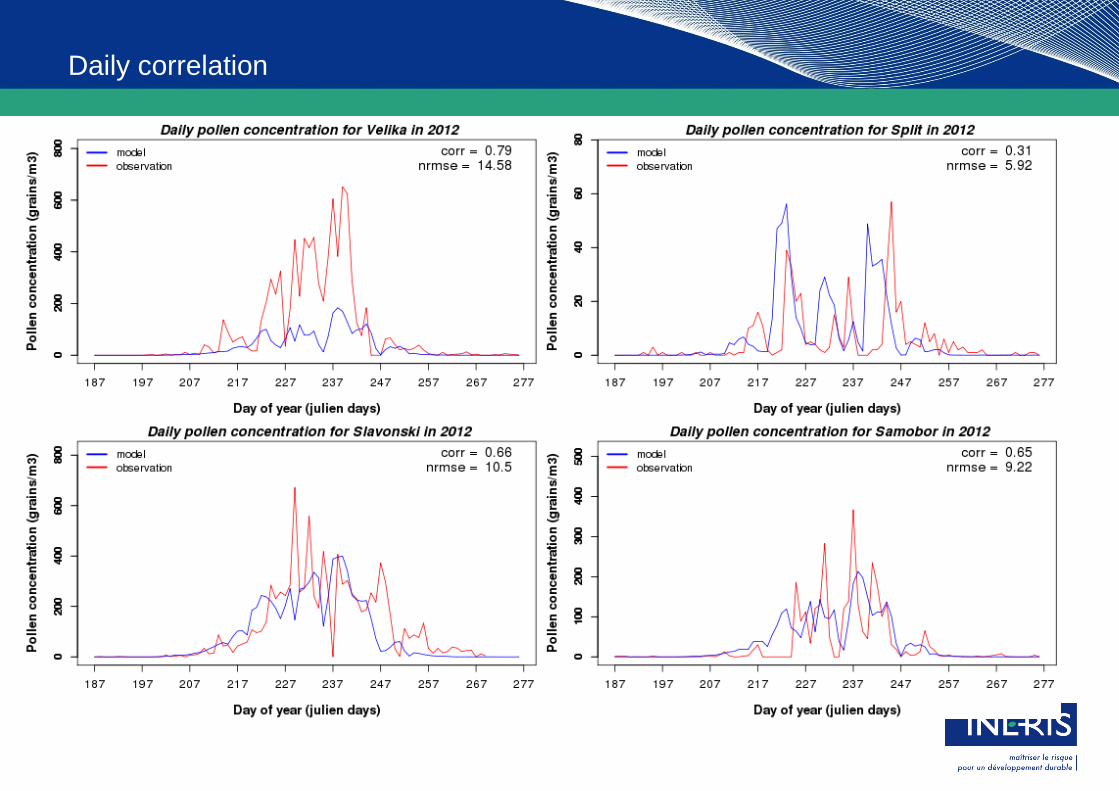
Daily correlation
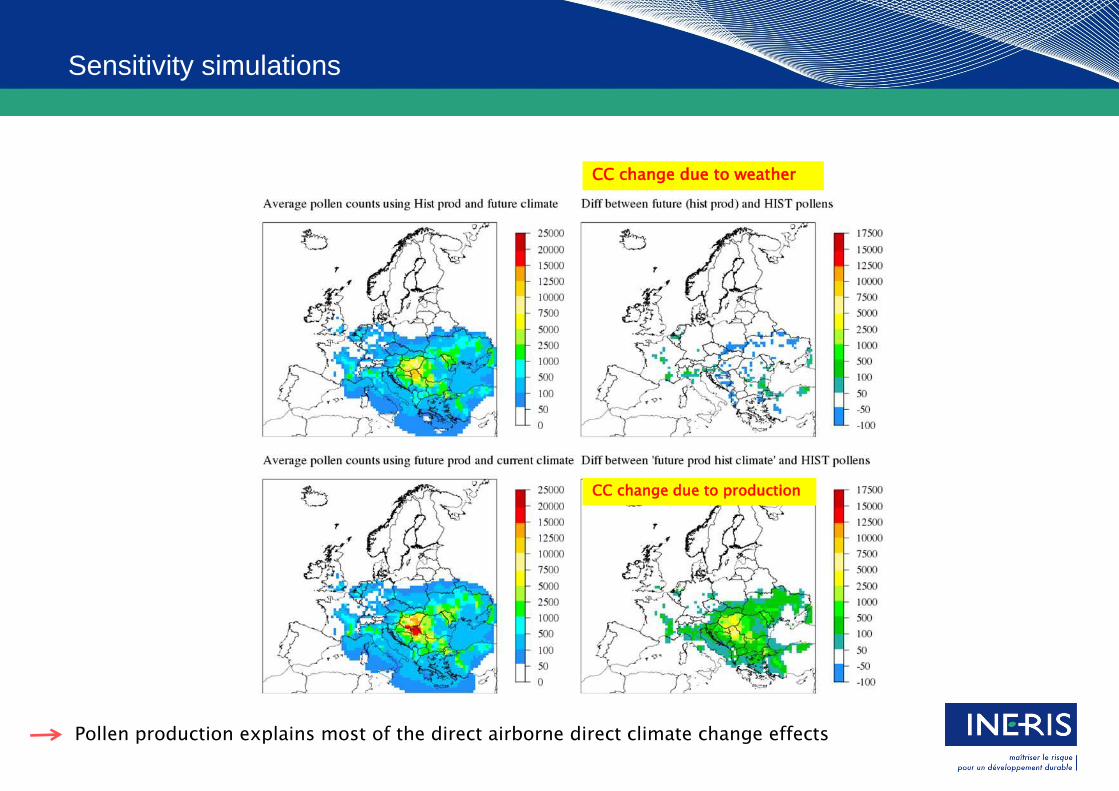
Sensitivity simulations
Pollen production explains most of the direct airborne direct climate change effects
CC change due to weather
CC change due to production
Related Documents