Don’t always trust the native speaker! Marjoleine Sloos University of Groningen Abstract Sociolinguistic research often relies on transcription or coding by one, two, or maximally three native coders. Recently, it has been shown that this method may have some drawbacks, since listeners may be biased by an overall impression of the accent of the speakers. Whereas coders are expected to judge only on the basis of the acoustic signal, other factors might also play a role. This paper investigates the degree to which the transcriptions of two coders match the acoustic measurements of the long vowel <ä> in Swiss Standard German. For this purpose, a standard statistical analysis of the coders’ judgements was compared to an analysis of the acoustic measurements of the same vowels. It turned out that the coders only partly rely on the acoustic signal; moreover, the coders seem to be biased towards an overall accent of the speakers, and transcribe the vowels concerned accordingly. This points towards a linguistic halo effect. This bias leads to statistical results that differ considerably from the acoustic analysis. The comparison of the two types of analyses, based on categorical judgements of native speakers and on acoustic measurements, shows that this type of sociolinguistic research should be treated with great care. Keywords: Coder bias, Halo effect, Swiss accent, Vowel perception. 325

Welcome message from author
This document is posted to help you gain knowledge. Please leave a comment to let me know what you think about it! Share it to your friends and learn new things together.
Transcript
Don’t always trust the native speaker!
Marjoleine Sloos
University of Groningen
Abstract
Sociolinguistic research often relies on transcription or coding by one, two, or maximally three native coders. Recently, it has been shown that this method may have some drawbacks, since listeners may be biased by an overall impression of the accent of the speakers. Whereas coders are expected to judge only on the basis of the acoustic signal, other factors might also play a role. This paper investigates the degree to which the transcriptions of two coders match the acoustic measurements of the long vowel <ä> in Swiss Standard German. For this purpose, a standard statistical analysis of the coders’ judgements was compared to an analysis of the acoustic measurements of the same vowels. It turned out that the coders only partly rely on the acoustic signal; moreover, the coders seem to be biased towards an overall accent of the speakers, and transcribe the vowels concerned accordingly. This points towards a linguistic halo effect. This bias leads to statistical results that differ considerably from the acoustic analysis. The comparison of the two types of analyses, based on categorical judgements of native speakers and on acoustic measurements, shows that this type of sociolinguistic research should be treated with great care. Keywords: Coder bias, Halo effect, Swiss accent, Vowel perception.
325
Halo-effects in linguistics
It is very common to ask two or at most three native speakers to code or
transcribe data in several subdisciplines of linguistics (Hall-Lew & Fix, 2012;
Milroy & Gordon, 2003), not only in many sociolinguistic and dialectological
studies, but also in linguistic fieldwork, second language acquisition, and
clinical linguistics. Although common practice, many dialectologists and
sociolinguists are aware of a serious drawback of this method, viz. the danger
of ‘coder bias’: coders perceive the data according to their expectations or
their general impression of the speech data they are transcribing. Such biases
have been investigated in perception studies (Niedzielski, 1999; Hay, Warren
& Drager, 2006; Hay & Drager, 2010), which show that a general impression
of a speaker who uses a particular dialect or accent may lead to the
assumption that certain features that are characteristic for this variety occur in
her speech, also when this is not actually the case.
We may expect that trained linguists are less biased. But is this really the
case? Since coders are often, and must be, linguistically trained, they are
likely to be able to guess what topic is being investigated. If coders are biased
regarding the variety they have to code, many analyses based on coders’
judgements may be unreliable. Very recently, in a post-hoc experiment, Hall-
Lew & Fix (2012) investigated coder bias among linguists with regard to l-
vocalization in English. Their conclusions are twofold: although inter-coder
reliability scores are high, considerable deviations from the mean were
attested despite the coders’ different linguistic backgrounds. The main factor
that caused this inconsistency turned out to be the coders’ ethnolinguistic
awareness: the coders perceived particular features and drew conclusions
326
about the ethnolinguistic background of the speakers, which apparently
influenced their transcriptions.
The phenomenon that judgements of individual characteristics are
influenced by an overall impression is well-known in psychology as the halo
effect (e.g. Nisbett & Wilson, 1977; Sahoo, Krishnan, Duncan & Callan,
2010;Thorndike, 1920, among many others). Typically, a halo effect shows
that subjects are not able to keep different factors apart. For instance, the
physical appearance of a person often influences judgements of his/her
personality. Physically attractive people tend to be assigned positive qualities
like intelligence and happiness more often than physically unattractive
people.
This mechanism is sub-conscious: people think they are unbiased,
whereas they clearly show such halo effects. For example, in an experiment,
Nisbett & Wilson (1977) showed that subjects who were asked to evaluate
the appearance, mannerism, and accent of a college instructor, were biased
by the fact that he acted as either cold or warm. However, the subjects
reported that their dislike of the instructor did not influence their ratings.
So the question arises to what extent any preconceptions may influence a
particular analysis that is done in the traditional way on the basis of two
coders who rate data categorically. This paper focuses on the risks of these
impressionistic analyses on the basis of two coders who made a categorical
analysis of the long vowel <ä> in Swiss Standard German (SSG). In order to
test the validity of this method, I measured the main acoustic values, F1
andF2, of the vowel. Subsequently, the two analyses were compared, and
turned out to yield surprisingly different results. This raised at least two other
327
questions; to what extent coders relied on the acoustic signal proper and,
also, to what extent they were biased towards an overall accent of the
speakers that they had to code. In order to answer these questions, I carried
out a second experiment to quantify the degree of accentedness of the
speakers in the original speech data. Subsequent analyses of the coders’
ratings and the acoustic measurements, with accentedness of the speakers
as one of the variables, showed that, although the coders relied to a
substantial extent on F1 and F2, they also seemed to be biased towards the
overall accentedness or to the dialect of the speakers they coded.
This paper is structured as follows. In the next section, more background
information on the variable pronunciation of the long vowel <ä> in SSG is
provided. Subsequently, the analysis on the basis of the coders’ ratings is
given in the section. This is followed by “The acoustic analysis”, which reports
on the results of the acoustic analysis and the comparison with the categorical
analyses. Since considerable differences were found, the categorical analysis
was conducted again, taking into regard the degree of accentedness of the
speakers, which is reported on in the section “The categorical analyses II”.
The final section discusses the findings and concludes.
Swiss Standard German long vowel <ä>
The pronunciation of SSG long vowel <ä> is comparable to that of other
varieties of Standard German: it can be realized as a long lower-mid
unrounded front vowel [ɛː] or a long higher-mid unrounded front vowel [eː],
any vowel in between these two, or even as a very open [æː] (Stearns &
Voge 1979, Sloos 2013). This variation serves as a test case for our
328
investigation into coder bias: how the vowel is phonetically realized does
not always correspond to the way it is transcribed. In this section, I
investigate the factors that are likely to play a role in this variation. First,
some relevant background on SSG is provided. Subsequently, the place of
the long vowel <ä> in the phonology of SSG will be considered.
Swiss Standard German
SSG is the variety of Standard German as spoken in Switzerland and
exists as the official language next to a considerable number of Swiss
German dialects. SSG is used as the literary language and in more
formal daily situations, such as in education, religion, and law. Since
SSG is primarily a written language and, moreover, it is learned
alongside reading and writing, it serves as a reference point for
pronunciation. Many Swiss speakers adhere to the prescriptive tradition
of spelling pronunciation, but Hove (2002) shows that some Swiss
speakers conform to the Northern Standard German (NSG) accent in
their speech, probably under the influence of the media. This is the
variety that is spoken in the Low German area in the north of Germany.
Hove (2002) describes some typical features of SSG pronunciation,
which includes the long vowel <ä>.
The long vowel <ä> in SSG
The long vowel <ä> is one of the most prototypical features of Swiss
pronunciation, especially as compared to NSG: whereas in NSG the preferred
colloquial variant is [eː] and usually neutralizes with /eː/, except in formal
329
registers (Stearns & Voge, 1979), in SSG, the standard pronunciation is [ɛː]
and is clearly distinct from /eː/.
Spelling SSG NSG gloss
denen d[eː]nen d[eː]nen them
Dänen d[ɛː]nen d[eː]nen ‘Danish people’
The pronunciation of this vowel in SSG is related to its spelling: since
the orthographical representations of the two vowels differ (<ä> vs <e>),
the pronunciation also differs.
As was pointed out above, the pronunciation of SSG <ä> shows a lot of
variation in the present day. It seems that sound change is ongoing,
changing the SSG pronunciation [ɛː] to the NSG pronunciation [eː]. In
variation studies, usually it is investigated which factors play a role. In this
kind of change, it is expected that age and gender of the speakers are
significant factors that influence pronunciation. Younger speakers, especially
younger female speakers, are usually ahead in innovative sound change
(e.g. Labov, 2001 p261ff.; Milroy & Milroy, 1985, among many others). If the
variation reflects sound change, we expect frequency effects to occur as well:
we would expect that low-frequency words are the first to change, since no
obvious reduction effects are involved (see Bybee, 2001; Phillips, 2006,
among others, on frequency effects in language change). So, more highly
frequent words are expected to be pronounced with SSG [ɛː] and words with
lower frequency are expected to be pronounced with [eː]. Separate from the
question of whether the variation reflects ongoing change or not, three other
types of factors may be involved in the patterns of variation: geographical
factors, pre-r context, and tautosyllabicity of the following consonant. Some
330
varieties that have more contact with other varieties of German may be
expected to have a pronunciation with a higher vowel quality on average, like
Basel, Bludenz, and Vaduz (see Figure 1). A following /r/ may have a
lowering effect on the vowel (cf. König, 1989; see also Sloos, 2013 and
references cited there). Finally, the following consonant often causes a lower
realization of a mid vowel when it is tautosyllabic, that is, when it belongs to
the same syllable (see e.g. De Decker & Mackenzie, 2000 and Latta, 1972).
Summarizing, the realization of the long vowel <ä> as [ɛː] is a prototypical
SSG feature, but variation with NSG pronunciation [eː] occurs. In the following
two sections, we will compare the categorical transcriptions by the coders with
instrumental measurements of F1 and F2. More specifically, we will test for
the factors age, gender, frequency, location, pre-r context, and tautosyllabicity
of the consonant following the long vowel <ä>.
The categorical analysis I
In this section, we adopt the traditional methodology in which corpus data are
categorically coded by two native speakers and subsequently statistically
analysed. Although the variation is gradient, we may expect that – on the
basis of the categorical distinction between the vowels in SSG and categorical
perception – the coders are able to make categorical judgements for almost
all vowels. The first subsection describes the material which has been used.
The second subsection provides some information about the coders and
reports on their inter-rater reliability. The final subsection provides the results
of the categorical analysis.
331
The data
The data that were used are spontaneous speech data (biographic
interviews) selected from the corpus ‘German Today’ of the Institut für
Deutsche Sprache ‘Institute for German Language’ in Mannheim
(Project Variation des gesprochenen Deutsch ‘Variation in spoken
German’, Brinckmann, Kleiner, Knöbl & Berend, 2008). All Swiss
locations for which data of both younger and older speakers were
available were selected. These contain data from Basel, Biel/Bern, Brig,
Luzern/Willisau, and Zurich. Furthermore, two locations outside
Switzerland are included in this study: Vaduz (Liechtenstein) and
Bludenz (Austria, on the Swiss border). These were included because
these locations belong to the same dialect group as the Swiss dialects,
viz. High-Alemannic. For each location, four students at a local
secondary school were interviewed: two female and two male
speakers, aged between sixteen and twenty. In addition, one female
and one male speaker aged between fifty and sixty were recorded.
Other factors that could influence sociolinguistic variation, such as
educational level, were kept constant as much as possible. Figure 1
shows the places investigated.
332
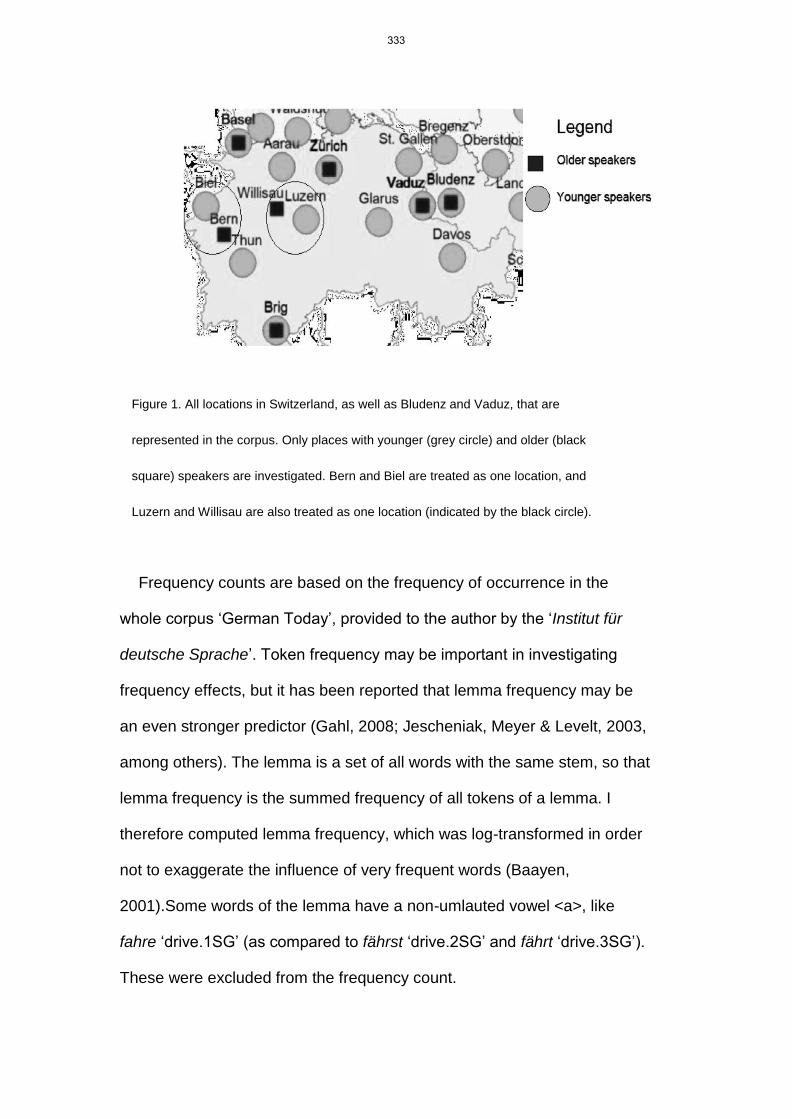
Figure 1. All locations in Switzerland, as well as Bludenz and Vaduz, that are
represented in the corpus. Only places with younger (grey circle) and older (black
square) speakers are investigated. Bern and Biel are treated as one location, and
Luzern and Willisau are also treated as one location (indicated by the black circle).
Frequency counts are based on the frequency of occurrence in the
whole corpus ‘German Today’, provided to the author by the ‘Institut für
deutsche Sprache’. Token frequency may be important in investigating
frequency effects, but it has been reported that lemma frequency may be
an even stronger predictor (Gahl, 2008; Jescheniak, Meyer & Levelt, 2003,
among others). The lemma is a set of all words with the same stem, so that
lemma frequency is the summed frequency of all tokens of a lemma. I
therefore computed lemma frequency, which was log-transformed in order
not to exaggerate the influence of very frequent words (Baayen,
2001).Some words of the lemma have a non-umlauted vowel <a>, like
fahre ‘drive.1SG’ (as compared to fährst ‘drive.2SG’ and fährt ‘drive.3SG’).
These were excluded from the frequency count.
333
To examine the pronunciation of the long vowel <ä>, a selection of all
items spelled with <ä> representing the long lower mid front vowel was made.
In German, <ä> may also represent the short vowel [ɛ]. Two words showed
variation in vowel length across the whole German-speaking area and were
therefore excluded from further analysis, namely Städte ‘town.PLUR’ and
nächste ‘next’.
The coders and inter-coder agreement
The long vowel <ä> was categorically transcribed (either [ɛː] or [eː]) by two
Swiss coders (C1 and C2) from Basel and Fribourg, who were female native
speakers of Swiss German and who spoke SSG fluently. The coders were not
informed of the purposes of the study. Both were linguistically trained at the
University of Freiburg (Germany), but did not have much experience in
coding. At the time of the analysis, they were 24 and 27 years old,
respectively. In sum, 579 codings were obtained. The codings were first
tested for inter-coder agreement with a Cohen’s Kappa test (Cohen,1968) and
showed a low agreement K=0.446. This indicates that the categorical
judgements were quite different amongst C1 and C2.
Results
Why do the coders differ? Are they biased by certain factors? In order to
investigate whether the coders are biased (or show a halo effect), we first
conducted a standard statistical analysis, to compare the results to the
acoustical analysis at a later stage. Mixed-effects modelling and model
comparison were used with coding as the dependent variable. The
334
independent variables are the speakers’ age, speakers’ gender, speakers’
location, tautosyllabicity of the consonant following long vowel <ä>, and
further pre-r context and frequency. The variables of speaker, lemma, and the
order of tokens per interview were treated as random effects.
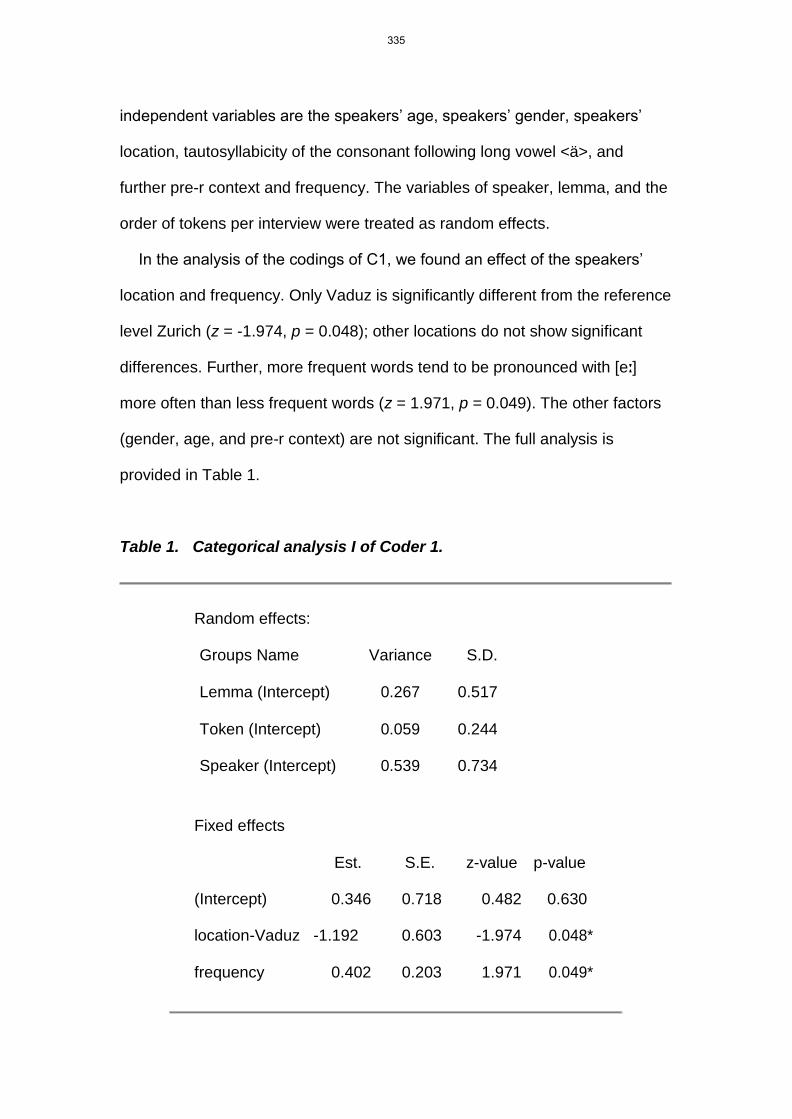
In the analysis of the codings of C1, we found an effect of the speakers’
location and frequency. Only Vaduz is significantly different from the reference
level Zurich (z = -1.974, p = 0.048); other locations do not show significant
differences. Further, more frequent words tend to be pronounced with [eː]
more often than less frequent words (z = 1.971, p = 0.049). The other factors
(gender, age, and pre-r context) are not significant. The full analysis is
provided in Table 1.
Table 1. Categorical analysis I of Coder 1.
Random effects:
Groups Name Variance S.D.
Lemma (Intercept) 0.267 0.517
Token (Intercept) 0.059 0.244
Speaker (Intercept) 0.539 0.734
Fixed effects
Est. S.E. z-value p-value
(Intercept) 0.346 0.718 0.482 0.630*
location-Vaduz -1.192 0.603 -1.974 0.048*
frequency 0.402 0.203 1.971 0.049*
335

On the other hand, the analysis of the codings of C2 shows almost a
complementary picture: the significant predictors are pre-r context, age, and
gender. In pre-r context, [ɛː] is more likely to occur than in other contexts (z
=2.262, p = 0.024). Also, younger speakers are coded as having more low [ɛː]
realizations and older speakers are coded as having more [eː] realizations (z
= -2.087, p = 0.037). Finally, males are rated as having more [ɛː] realizations
(z =-2.671, p = 0.008). The results of the analysis of C2 are provided in Table
2.
Table 2. Categorical analysis I of Coder 2.
Random effects:
Groups Name Variance S.D.
Lemma (Intercept) <0.001 <0.001
Token (Intercept) <0.001 <0.001
Speaker (Intercept) <0.001 <0.001
Fixed effects:
Est. S.E. z-value p-value
(Intercept) 2.790 1.300 2.147 0.032*
pre-r context 1.082 0.478 2.262 0.024*
gender male -3.024 1.132 -2.671 0.008*
age young -2.065 0.989 -2.087 0.037*
gender: age 2.904 1.333 2.178 0.030*
336
The different outcomes of the two analyses are remarkable. Is one coder
simply better than the other? How can we decide which analysis is the best
one? And, moreover, what is the reason for these different results? As a first
step, let us investigate the data by way of acoustic measurements, and
compare the acoustic analysis with the categorical analyses.
The acoustic analysis
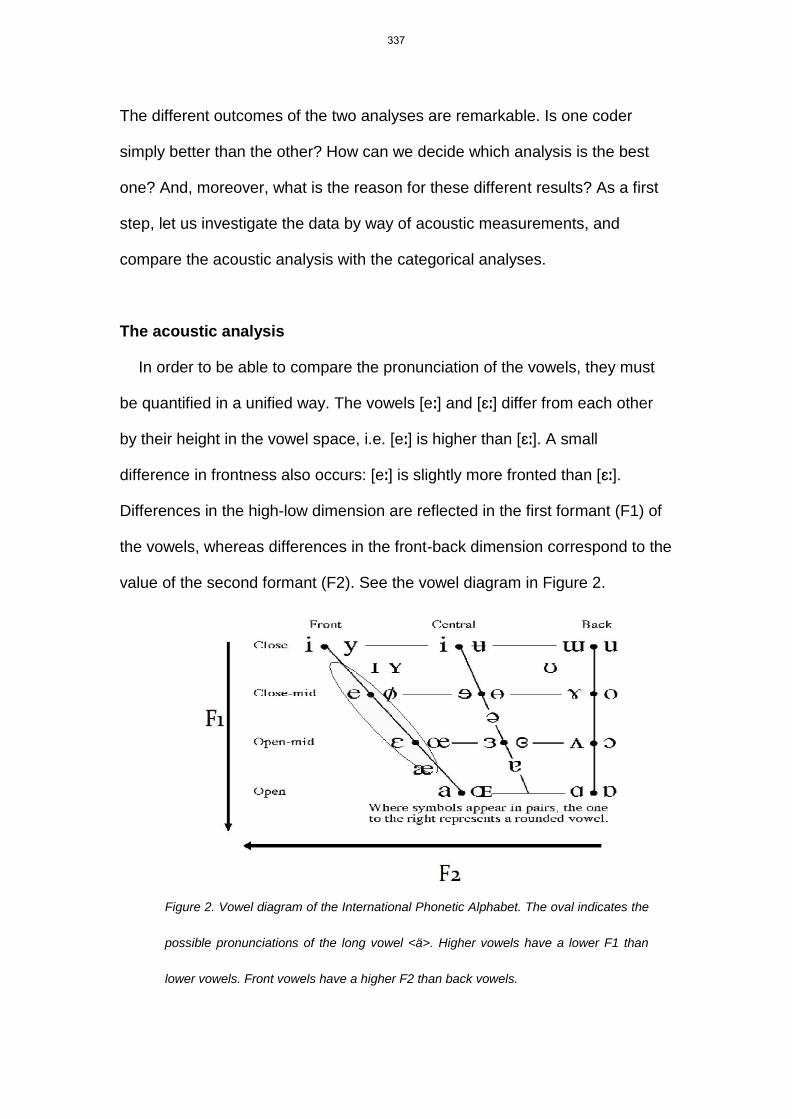
In order to be able to compare the pronunciation of the vowels, they must
be quantified in a unified way. The vowels [eː] and [ɛː] differ from each other
by their height in the vowel space, i.e. [eː] is higher than [ɛː]. A small
difference in frontness also occurs: [eː] is slightly more fronted than [ɛː].
Differences in the high-low dimension are reflected in the first formant (F1) of
the vowels, whereas differences in the front-back dimension correspond to the
value of the second formant (F2). See the vowel diagram in Figure 2.
Figure 2. Vowel diagram of the International Phonetic Alphabet. The oval indicates the
possible pronunciations of the long vowel <ä>. Higher vowels have a lower F1 than
lower vowels. Front vowels have a higher F2 than back vowels.
337
The Praat speech processing software (Boersma & Weenink, 2010) was
used to create spectrograms and the target vowel onsets and end points were
manually segmented. Since the vowels that are measured almost always
have a clear steady state, i.e. the F1 and F2 are stable during the vowel, so
they are truly monophthongs, it suffices to measure the temporal midpoint of
the vowels. This temporal midpoint was measured by using a Praat script. It is
standard practice in this kind of phonetic research to use Bark-transformed F1
and F2 values because Bark values match the perceptual differences more
closely than Hertz values. The Bark transformation as formulated by
Traunmüller (1990) is as follows.
Bark = [(26.81 x F)/(1960 + F)] - 0.53
F here represents the formant (either F1 or F2) values in Hertz.
Further, since different individuals have different vocal tract shapes and
sizes, the vowel formants differ per subject, such that absolute F values are
of limited use. Because the vowel change under discussion is a rather
straightforward one (involving just variation between [ɛː] and [eː]), I followed a
procedure that interpolates the vowel position under discussion between the
lowest and the highest vowel possible (see van Heuven, van Bezooijen &
Edelman, 2005 and van Bezooijen & van Heuven, 2010 for details on this
procedure). Therefore, for each speaker in the corpus, 3-5 realizations of
these reference vowels, i.e. the highest vowel /i / and the lowest vowel /a /,
were also measured. Subsequently, the most extreme realizations of these
reference vowels were taken as the beginning and end points of the subjects’
338

maximal vowel height dimension. The realization of / / and /e / is expressed
as the location on a relative scale between 0 (corresponding to [aː]) and 100
(corresponding to [iː]). By the interpolation of the vowels between [i] and [a]
for each speaker, we obtained an individually optimized relative value for
each realization of the target vowel. This value expresses its place of
articulation which, in the statistical test, is treated as the dependent variable.
In the acoustic analysis, the same factors were investigated as in the
categorical analysis. For numeric variables, the mixed-effects model does
not provide significance, but as a general threshold t-values < -2.000 or >
2.000 are expected to be significant. The results show an effect of speakers’
age and of pre-r context. Younger speakers tend to have a lower, more [ɛː]-
like pronunciation (t = -2.058). Further, pre-r context has a lowering effect (t =
-3.697). The other factors (speakers’ location, gender, age, and frequency)
are not significant. The significant results are provided in Table 3.
Table 3. The acoustic analysis.
Random effects:
Name Variance S.D.
Lemma (Intercept) 23 <0.001
Token (Intercept) <1 <0.001
Speaker (Intercept) 69 <0.001
Residual 147 <0.001
339

Est. S.E. t-value
(Intercept) 66.267 6.122 10.825
age -young -10.036 4.877 -2.058*
pre-r context -7.669 2.075 -3.697*
This acoustic analysis is comparable to that of C2, but unlike the analysis of
C2, no effect of the speakers’ gender is found. In Table 4, the results of the
categorical analyses and the acoustic analysis are summarized.
Table 4. Significant factors and non-significant factors in the categori-
cal and acoustic analyses (to be revised).
Factor Acoustic C1 C2
speakers’ age
pre r-context
speakers’ gender
speakers’ location
frequency
These analyses are all different and we may wonder how much the
coders actually rely on the acoustic signal. We will therefore investigate
whether a bias towards the level of SSG or NSG accent causes the
deviations from the acoustic measurements.
340
The coders’ analyses II
In order to be able to investigate whether the coders are biased by SSG or
NSG accent, the degree of accent of all speakers in the corpus must be
quantified. Therefore, the recordings were used in an internet survey to
establish type and degree of accent. For each speaker in the corpus, small
sound samples were contained in the internet survey. Twenty Swiss and
twenty German respondents estimated the degree of SSG/NSG
accentedness of each speaker on a four-point scale. The values were
averaged for each speaker (see Sloos (2012) for details on this procedure). If
the speakers relied only on F1 and F2, i.e. if they were perfectly unbiased, we
would find only a significant effect of F1 and F2 and not of any other factors.
In order to examine the effect of the speakers’ accentedness as well as the
effect of the F1 and F2, I used mixed-effects modelling with model
comparison, in which the codings were treated as the dependent variable and
the interpolated vowel height (F1-F2) and the degree of accentedness as
independent variables. The same factors as in the categorical analysis I were
included as well.
As shown in Table 5, the codings of C1 strongly correlate with F1 and F2 (z
= -6.208, p < 0.001). This means that, C1 relies on F1 and F2 to a large
extent, despite the complimentary results in Table 4. However, C1 appears to
also rely on the degree of accentedness (z = -3.165, p = 0.002). Other factors
were not significant.
341

Table 5. Categorical analysis II of Coder 1.
Random effects:
Name Variance S.D.
Lemma (Intercept) 0.135 0.368
Token (Intercept) 0.026 0.161
Speaker (Intercept) 0.999 0.999
Fixed effects:
Est. S.E. z-value p-value
(Intercept) 4.294 0.861 4.985 <0.001*
F1-F2 -0.050 0.008 -6.208 <0.001*
accentedness -0.383 0.121 -3.165 0.002*
The ratings of C2 are also strongly correlated with the F1 and F2 values (z
= -7.841, p < 0.001), so C2 also relies on F1 and F2 to a large degree. The
degree of accentedness does not play a role here, so it seems that C2 is not
biased towards the degree of SSG/NSG accentedness. However, the
speakers’ location is significantly different for Biel/Bern (z = -2.985, p = 0.003),
which shows a bias on the basis of the location of the speaker. So it seems
that the coder guesses the location, most probably by dialectal influence on
SSG, which leads to a higher number of [ɛː]-ratings. Further, speakers’ gender
is significant, such that the speech of males is transcribed as having more [ɛː]
pronunciations than females with the same F1-F2 values (z = - 2.364, p =
0.018). Speakers’ age correlates with the number of [ɛː] ratings as well:
342
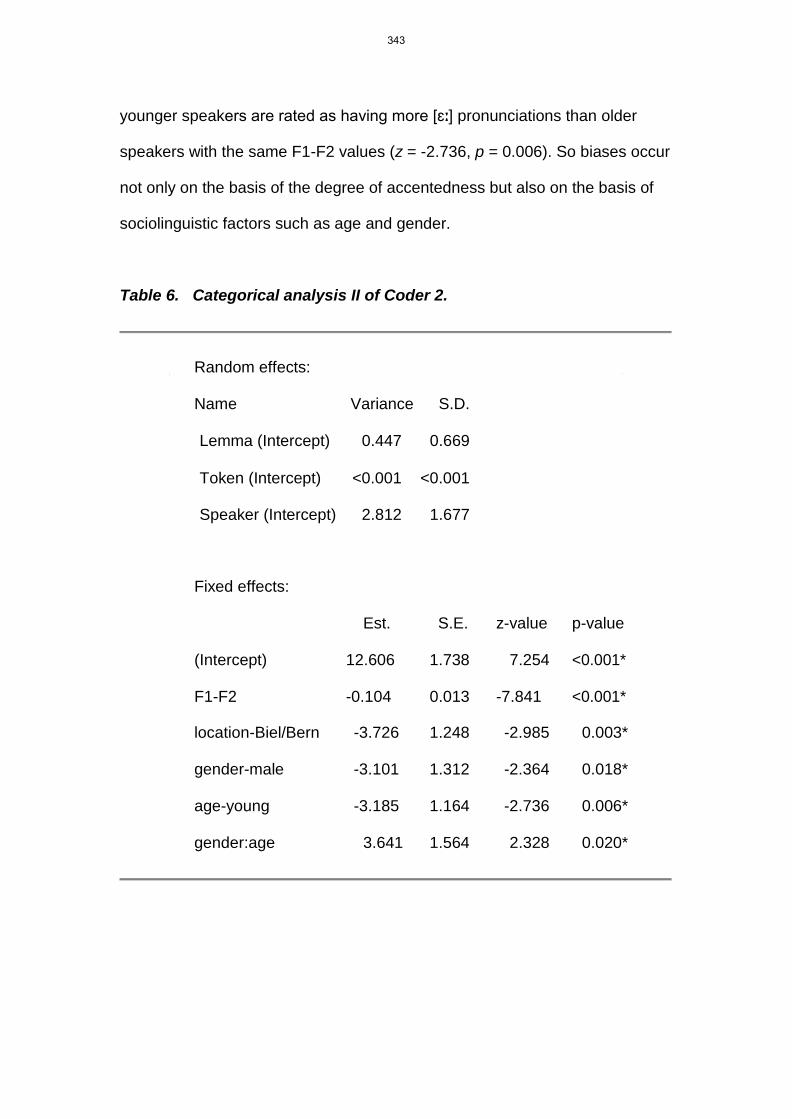
younger speakers are rated as having more [ɛː] pronunciations than older
speakers with the same F1-F2 values (z = -2.736, p = 0.006). So biases occur
not only on the basis of the degree of accentedness but also on the basis of
sociolinguistic factors such as age and gender.
Table 6. Categorical analysis II of Coder 2.
Random effects:
Name Variance S.D.
Lemma (Intercept) 0.447 0.669
Token (Intercept) <0.001 <0.001
Speaker (Intercept) 2.812 1.677
Fixed effects:
Est. S.E. z-value p-value
(Intercept) 12.606 1.738 7.254 <0.001*
F1-F2 -0.104 0.013 -7.841 <0.001*
location-Biel/Bern -3.726 1.248 -2.985 0.003*
gender-male -3.101 1.312 -2.364 0.018*
age-young -3.185 1.164 -2.736 0.006*
gender:age 3.641 1.564 2.328 0.020*
343

We thus find that the two coders both rely on the F1 and F2, but are
also biased towards accentedness, location, and other factors. Table 7
summarizes the results. Note that, ideally, the acoustic analysis and the
coders’ analyses without accentedness should be exactly the same, and the
coders’ analyses with accentedness should have only F1-F2 as significant
factor. Deviations from this ideal pattern are indicated by an exclamation
mark.
Table 7. Significant factors and non-significant in the categorical and
acoustic analyses, divided by accentedness and the different factors.
Further see text.
Factor Acoustic C1 C2
with
ou
t
acce
nte
dne
ss
with
acce
nte
dne
ss
with
ou
t
acce
nte
dne
ss
with
acce
nte
dne
ss
F1-F2 NA NA NA
speakers’ NA NA ! NA
speakers’ age ! !
speakers’ gender ! !
speakers’ location ! !
frequency !
pre r-context !
344
Discussion and conclusion
The results suggest that the coders do rely on the acoustic signal to a
certain extent, but that in particular cases they don’t. Since the variation is
continuous and the coders were given the task to categorically code the data,
probably in cases in which the vowel quality is unclear, i.e. neither prototypical
[eː] nor prototypical [ɛː], coders are led to rely on other factors. The coders
were sensitive to the accentedness of the speakers, both on the small-scale
local level (different locations of the speakers) as well as the large-scale
contrast between NSG and SSG. This suggests that one coder showed a halo
effect towards the dialectal accent, whereas the other coder showed a halo
effect towards the overall NSG and SSG accentedness. The results point
towards a coder bias, which is in line with recent findings in perception studies
among ratings of non-linguists. Studies like Drager (2011), Hay, Nolan, &
Drager (2006), Hay, Warren et al. (2006), Hay & Drager (2010), and
Niedzielski, (1999) also show a bias towards the accent which the subjects
are led to believe they hear. The crucial difference with the present study is
that our subjects were not lay people but linguistically trained coders.
This paper has shown that linguistically trained coders may be susceptible
to biases related to accentedness. Despite the fact that an investigation into
the halo effect in linguistics requires more large-scale experiments with more
coders, we can conclude from the present study that the method of having
two or maximally three coders may present drawbacks of which linguists
should be aware.
345
Acknowledgements
I am grateful to Stefan Kleiner of the Institut für Deutsche Sprache
forproviding the initial data and relevant information. Further, I thank Jos
Pacilly (Leiden University) for providing the Praat script. This paper benefitted
much from many useful comments on earlier versions by John Nerbonne,
Jeroen van de Weijer, and two anonymous reviewers. Of course, all errors are
mine.
4,960 words
346
References
Baayen, H. (2001). Word Frequency Distributions. Dordrecht: Kluwer
Academic Publications.
Bezooijen, R. van., & Heuven, V. J. van. (2010). Avant-garde Dutch: A
perceptual, acoustic and evaluational study. In D. R. Preston, & N.
A. Niedzielski (Eds.), A Reader in Sociophonetics (pp. 357-378).
NewYork: Walter de Gruyter.
Boersma, P., & Weenink, D. (2010). Praat: Doing Phonetics by
computer. [computer program].
Brinckmann, C., Kleiner, S., Knöbl, R., & Berend, N. (2008). German Today:
An areally extensive corpus of spoken Standard German. Proceedings
of the Sixth International Conference on Language Resources and
Evaluation, Marrakech, Morocco. 3185-3191.
Bybee, J. L. (2001). Phonology and Language Use. Cambridge and
New York: Cambridge University Press.
Cohen, J. (1968). Weighed kappa: Nominal scale agreement with provision
for scaled disagreement or partial credit. Psychological Bulletin 70
(4): 213–220.
De Decker, P., & Mackenzie, S. (2000). Slept through the ice: A further look
at lax vowel lowering in Canadian English. In G. J. Easson (Ed.),
Toronto Working Papers in Linguistics (Special issue ed., pp. 1-11).
Toronto: University of Toronto.
Drager, K. (2011). Speaker age and vowel perception. Language and
Speech, 54(1), 99-121.
347
Gahl, S. (2008). "Time" and "Thyme" are not homophones: The effect of
lemma frequency on word durations in spontaneous speech.
Language, 84(3), 474-496.
Hall-Lew, L., & Fix, S. (2012). Perceptual coding reliability of (L)-vocalization
in casual speech data. Lingua, 122(7), 794-809.
Hay, J., & Drager, K. (2010). Stuffed toys and speech perception. Linguistics,
48(4), 865-892.
Hay, J., Nolan, A., & Drager, K. (2006). From fush to feesh: Exemplar priming
in speech perception. The Linguistic Review, 23(3), 351-379.
Hay, J., Warren, P., & Drager, K. (2006). Factors influencing speech
perception in the context of a merger-in-progress. Journal of
Phonetics,34(4), 458-484.
Heuven, V. J. van., Bezooijen, R. van., & Edelman, L. (2005). Pronunciation
of /ɛi/ in avant-garde Dutch: A cross–sex acoustic study. In M. Filppula,
J. Klemola, M. Palander & E. Penttila (Eds.), Dialects across Borders
(pp.185-210). Amsterdam: John Benjamins.
Hove, I. (2002). Die Aussprache der Standardsprache in der deutschen
Schweiz. Tübingen: Niemeyer.
Jescheniak, J., Meyer, A. S., & Levelt, W. J. M. (2003). Specific-word
frequency is not all that counts in speech production: Comments on
Caramazza, Costa, et al. (2001) and new experimental data. Journal of
Experimental Psychology, Learning, Memory & Cognition, 29(3), 432-
438.Johnstone, B., Bhasin, N., & Wittkofski, D. (2002). "Dahntahn"
Pittsburgh: Monophthongal /aw/ and representations of localness in
Southwestern Pennsylvania. American Speech, 77(2), 148-176.
348
König, W. (1989). Atlas zur Aussprache des Schriftdeutschen in der
Bundesrepublik Deutschland. Ismaening: Max Hueber Verlag.
Labov, W. (2001). Principles of Linguistic Change: Social Factors. Malden and
Oxford: Blackwell.
Latta, F. C. (1972). On stress and vowel harmony in Chamorro. Oceanic
Linguistics, 11(2), 140-151.
Milroy, L., & Gordon, M. (2003). Sociolinguistics: Method and Interpretation.
Oxford: Wiley-Blackwell.
Milroy, J., & Milroy, L. (1985). Linguistic change, social network and speaker
innovation. Journal of Linguistics, 21(2), 339-384.
Niedzielski, N. (1999). The effect of social information on the perception of
sociolinguistic variables. Journal of Language and Social Psychology,
18(1), 62-85.
Nisbett, R. E., & Wilson, T. D. (1977). The halo effect: Evidence for
unconscious alteration of judgments. Journal of Personality and Social
Psychology, 35(4), 250-256.
Phillips, B. S. (2006). Word Frequency and Lexical Diffusion. Hampshire and
New York: Palgrave Macmillan.
Sahoo, N., Krishnan, R., Duncan, G., & Callan, J. (2010). The halo effect in
multi-component ratings and its implications for recommender systems:
The case of Yahoo! movies. Information Systems Research, 23(1),
231-246.
Sloos, M. (2012). Standard or Dialect? A new online elicitation method.
Dialectologia, 9, 98-113.
349
Sloos, M. (2013). Frequency and phonological grammar: An integrated
approach. Evidence from German, Indonesian, and Japanese. (PhD
thesis, University of Groningen).
Stearns, M. J., & Voge, W. (1979). The contemporary pronunciation of long
<ä> in Modern Standard German: A data-based, computer-
assisted analysis. In J. Köster (Ed.), Hamburger Phonetische
Beiträge. Untersuchungen zur Phonetik und Linguistik. Miszellen VI
(pp. 127-181). Hamburg: Helmut Buske Verlag.
Thorndike, E. (1920). A constant error in psychological ratings. Journal
of Applied Psychology, 4, 25-29.
Traunmüller, H. (1990). Analytical expressions for the tonotopic sensory
scale. The Journal of the Acoustical Society of America, 88(1), 97-100.
350
Related Documents