HALF-YEARLY MONETARY AND FINANCIAL STABILITY REPORT March 2013 This Report reviews statistical information between the end of August 2012 and the end of February 2013.

Welcome message from author
This document is posted to help you gain knowledge. Please leave a comment to let me know what you think about it! Share it to your friends and learn new things together.
Transcript
HALF-YEARLY MONETARY ANDFINANCIAL STABILITY REPORT
March 2013
This Report reviews statistical information between the end of August 2012 and the end of February 2013.

Half-Yearly Monetary and Financial Stability ReportMarch 2013
Table of Contents
1. Summary and overview 4
2. Global setting and outlook 9
External environment 9
2.1 Real activities 9
2.2 Global financial conditions 12
Mainland China 14
2.3 Output growth and inflation 14
2.4 Monetary conditions, asset markets and banking risks 15
3. Domestic economy 23
3.1 Aggregate demand 23
3.2 Domestic demand 24
3.3 External trade 26
3.4 Labour market conditions 27
3.5 Consumer prices 28
4. Monetary and financial conditions 36
Exchange rate, interest rates and monetary developments 36
4.1 Exchange rate and interest rates 36
4.2 Money and credit 39
4.3 Capital flows 43
Asset markets 48
4.4 Equity market 48
4.5 Debt market 50
4.6 Property markets 53
5. Banking sector performance 64
5.1 Profitability and capitalisation 64
5.2 Liquidity and funding 66
5.3 Interest rate risk 67
5.4 Credit risk 68
5.5 Systemic risk to the banking system 74
Box 1. How did labour market development affect labour costs in Mainland China? 19
Box 2. Recent movements of the current account balance in Hong Kong 31
Box 3. Recent performance of the Hong Kong dollar exchange market 57
Box 4. Determinants of the growth of renminbi deposits in Hong Kong 62
Box 5. The demand for and supply of mortgage loans: The role of loan-to-value policy 77
Box 6. Changing business models of Hong Kong branches of US and European global banks 81
Glossary of terms
Abbreviations
Page 3
1. Summary and overview
Higher demand for Hong Kong dollar assets led to repeated triggering of the strong-side
Convertibility Undertaking (CU) in the fourth quarter of 2012. In the face of such inflow
pressures, the Hong Kong dollar exchange market functioned normally and the Linked
Exchange Rate system continued to enjoy a high degree of market credibility.
Risks to financial stability posed by property market volatility have continued to mount.
Macroprudential policies have leaned against the build-up of leverage, but expectations of
property price movements could be reversed abruptly by unforeseen events. Participants in
the Hong Kong financial system should brace themselves for the potential volatilities of the
current financial cycle.
The external environment
Global financial conditions have improved
significantly over the past six months, driven
by reduced tail risks in the US and Europe,
more aggressive monetary policy easing in the
advanced economies, as well as a revival of
the growth momentum in Mainland China.
In Europe, the announcement of a new bond
purchase programme known as the Outright
Monetary Transactions (OMTs) by the European
Central Bank (ECB) in September 2012 has
helped reduce the tail risk of the European
sovereign debt crisis. In the US, the US Federal
Reserve has pursued unlimited quantitative
easing and has explicitly linked its forward
interest rate guidance to the inflation and
unemployment rates. In Japan, the new Abe
government also announced more aggressive
monetary easing and fiscal stimulus package.
That said, downside risks to growth in the
advanced economies and global financial
stability remain. While the temporary extension
of the debt ceiling deadline in the US helps
avoid an imminent political stand-off, fiscal
uncertainty will continue to cloud the US
economic prospects. In Europe, household,
bank and sovereign balance sheet stresses would
continue to drag on growth. Meanwhile, the
sharp depreciation of the Japanese yen and
the pound sterling on expectations of more
aggressive monetary policy moves reignites
concerns about currency volatilities.
Amid the stabilisation of the external
environment, growth momentum in East Asian
emerging economies, including Mainland
China, recovered in the last quarter of 2012,
after registering a general downward cycle in
the previous quarters. Inflationary pressures
remained contained. In Mainland China, there
have been concerns that the decline in working
age population would push up wages and
inflation. Box 1 discusses the extent to which
changing demographics and labour market
tightness have affected labour costs in Mainland
China. Meanwhile, the latest round of monetary
easing in major advanced economies has
generated some capital inflow pressures for most
East Asian economies. Regional currencies have
generally appreciated against the US dollar since
late August 2012, but the appreciation pressures
appeared to have eased recently.
Page 4
Summary and overview
The domestic economy
In Hong Kong, growth momentum picked up
gradually during the second half of 2012 along
with some stabilisation in the merchandise trade
performance. Domestic demand strengthened
on a broad base, led by robust growth in private
consumption and fixed investment. This lifted
real GDP growth to a sequential 0.8% in the
third quarter and 1.2% in the fourth quarter.
For 2012 as a whole, however, growth slowed to
a below-trend rate of 1.4% from 4.9% in 2011.
Box 2 analyses the deterioration in Hong Kong’s
current account balance and argues that such
developments warrant close monitoring as they
may be symptoms of financial imbalances.
The labour market remained tight on the back of
an improving economy. The seasonally adjusted
three-month moving-average unemployment
rate continued to stay at a low level of about
3.3% over the past six months, while total
employment increased to a historical high
of 3.71 million in January. With growth
momentum picking up, the output gap was also
estimated to have largely closed in the fourth
quarter of 2012.
Local inflation also rose along with the
improvement in the local economic
environment. On an annualised three-month-
on-three-month basis, the underlying inflation
rate increased steadily to 4.7% in December
2012 from 1.6% in August, with all major
CCPI components, including rental, tradables
and services, registering some increases in
momentum during the period. Looking
ahead, the inflation momentum is expected to
remain steady as the fragile global economic
environment is expected to help contain
commodity price pressures. However, there is the
chance that inflationary pressures may pick up
to higher-than-expected levels, particularly if the
local property market were more buoyant than
expected.
The Hong Kong economy is expected to grow
faster at a close-to-trend rate in 2013. The drags
from external demand should subside gradually,
but a full recovery in exports will still take
some time as the global economy is struggling
to achieve sustained growth. Domestically,
consumer spending should continue to lend
support to growth in real activity, and large-scale
infrastructure works and private building activity
are expected to hold up quite well. Overall for
2013, private sector analysts project the economy
to grow by 2.5-4.7%, averaging at around 3.5%.
The Government also sees growth strengthening
to the range of 1.5-3.5%.
Monetary conditions and capital flows
The Hong Kong dollar exchange rate
strengthened and stayed close to 7.75 during the
second half of 2012, and then softened slightly
in early 2013. The strong-side CU was triggered
repeatedly in the fourth quarter of 2012, which
led to the purchase of US dollars of $13.8 billion
and the sale of Hong Kong dollars of $107.2
billion by the HKMA. This inflow of funds partly
reflected increased allocation to Hong Kong
dollar assets by overseas investors, as well as
the proceeds from issuance of foreign currency
bonds by Hong Kong firms in exchange for Hong
Kong dollars. The stronger equity initial public
offerings (IPO) activities in late November and
December also to some extent supported the
inflows. In the face of inflow pressures, the Hong
Kong dollar exchange market has functioned
normally. Box 3 assesses the recent performance
of the Hong Kong dollar exchange market and
argues that the Linked Exchange Rate system
has continued to enjoy a high degree of market
credibility.
The low interest rate environment has
continued. In the money market, the interbank
rates stayed low, with the overnight and three-
month HIBOR fixings hovering around 0.10%
and 0.40% respectively. For maturities beyond
Page 5
three months, the interbank rates edged down
slightly along with the LIBOR counterparts. The
yield curve of Exchange Fund papers shifted
down in the second half of 2012, partly reflecting
increases in banks’ demand for high-quality
Hong Kong dollar assets. But it has steepened
slightly in early 2013 amid larger increases in
long-dated yields. The average cost of funds
for retail banks, as reflected by the composite
interest rate, has declined slightly as a result of
easing deposit interest rates. Mortgage interest
rates also edged down. In mid-March, however,
a few leading banks raised the mortgage interest
rates by 25 basis points, reportedly in response to
higher funding costs.
As a result of repeated triggering of the strong-
side CU in the fourth quarter of 2012, the
Aggregate Balance and hence the Monetary
Base increased appreciably. In early 2013,
additional Exchange Fund papers were issued to
meet the strong demand by banks for liquidity
management. Against this background, the Hong
Kong dollar monetary aggregates showed much
faster increase in the second half of 2012. For
the whole year, the Hong Kong dollar narrow
money supply rose by 15.8% and the broad
money supply by 12.1%. Meanwhile, Hong Kong
dollar deposits increased by 11.7% in 2012 as a
whole, compared with a modest annualised 3.8%
increase in the first half.
On the credit side, total loan growth slowed
visibly to 9.6% in 2012 from 20.2% in the
previous year, along with the slowdown in the
domestic economy and in part reflecting the
impact of prudential measures by the HKMA. But
compared with the first half, there was a slight
acceleration in loan growth towards the year
end led by Hong Kong dollar loans and loans
for domestic use, although growth remained
modest at 5.5% and 7.3% respectively for the
whole year. Foreign currency loans and loans
for non-domestic use saw growth decelerating
throughout the year to around 16%. Going
forward, credit demand is expected to increase in
the near term amid signs of improvement in the
domestic economy. The latest HKMA Opinion
Survey on Credit Condition Outlook also points
to stronger credit demand in the period ahead.
Renminbi loans extended by banks in Hong
Kong surged by 156.6% from a year ago to
RMB79.0 billion at the end of 2012. As a result,
banks’ renminbi assets have become more
diversified. On the liability side, the funding
structure of banks’ renminbi business has
continued to evolve. Banks were increasingly
issuing renminbi certificates of deposits (CDs) as
a means to tap renminbi funds in the first half
of 2012, although such tendency moderated
somewhat in the second half of the year. For
2012 as a whole, outstanding CDs surged by
60.5% to RMB117.3 billion while customer
deposits increased by 2.5% to RMB603.0 billion.
The latter represented 9.1% of total deposits in
Hong Kong’s banking system. Box 4 provides
a preliminary analysis of the determinants to
the growth in outstanding renminbi deposits.
This helps provide further insights on the
development of offshore renminbi liquidity.
Asset markets
The local stock market rebounded following
last summer in view of a brighter outlook for
global financial markets. Financial conditions
stabilised as the Fed and ECB introduced another
round of monetary easing measures, while more
signs emerged that the Mainland economy was
about to bottom out. Except for a brief period
towards the end of last year in which concerns
over the US economy heading for a “fiscal
cliff” pulled investors back to the sideline, the
overall sentiment has been bullish in the past
six months. Looking ahead, however, the most
fundamental fiscal issues remain unresolved in
the US and Europe, and noise from political
Page 6
wrestling could now and then hit a nerve.
Geopolitical tensions arising from the nuclear
testing in North Korea and the sovereign border
disputes in East Asia could also potentially
unsettle equities.
The debt market has registered fast growth,
with private sector debt issuance increasing
particularly strongly. Last year saw the
corporate sector tap the bond market much
more aggressively than before. While Hong
Kong dollar debt issued by local corporates
declined slightly, debt issued in other currencies
experienced phenomenal growth with US dollar
debt issuance more than doubling. The strong
growth in the corporate bond market was
attributed to a host of cyclical and structural
factors, which are likely to continue to underpin
the outlook in the period ahead. The renminbi
debt market in Hong Kong also expanded
steadily last year with a number of positive
developments including an increasingly more
diversified mix of issuers, longer maturity of debt
issued and better credit quality of bonds.
Risks in the residential property market continue
to be a major concern for macroeconomic
and financial stability in Hong Kong. While
the volume of property transactions has been
volatile, flat prices increased notably by 25.2%
in 2012 and more than doubled from the end
of 2008. But with household income growing
at a more gradual pace, flat prices could have
run well ahead of the fundamentals, with many
of the affordability indicators already flagging
warning signals of overvaluation risks.
Going forward, improved market sentiment
amid better growth outlook and more aggressive
monetary easing in the advanced economies
could further aggravate the misalignments
between flat prices and the fundamentals. In
view of this, the Government introduced further
measures in February 2013 by doubling the ad
valorem stamp duty rates for all properties.
The HKMA also announced a new round of
prudential measures by imposing stricter stress
testing requirements for mortgage lending,
lowering the maximum loan-to-value (LTV) ratio
for non-residential properties and introducing
a risk weight floor of 15% for new residential
mortgage lending by banks using the internal
ratings-based approach.
Banking sector performance
Along with the general stabilisation of global
financial market conditions and a more sanguine
economic outlook, the local banking sector
continued to record healthy growth. The sector’s
performance was characterised by steady credit
expansion and favourable liquidity conditions.
These positive developments took place despite
continued deleveraging by euro area banks,
as local and other foreign banks moved in to
fill the void. With strong capital positions by
international standards and sound asset quality,
banks are well placed to meet the new capital
requirements under the Basel III framework.
During the second half of 2012, the sector’s
profitability moderated from the very buoyant
results of the first half, due to lower non-interest
income, a rise in operating cost and higher net
charges for provisions, which more than offset
the increase in interest income. Nevertheless, the
performance remained more favourable than the
same period of 2011, with retail banks registering
a pre-tax return on assets of 1.1%, compared
with 1.24% in the first half, and just 1% in the
second half of 2011. For 2012 as a whole, the
aggregate pre-tax profits recorded an increase of
12.7%, with the average pre-tax return on assets
rising to 1.16% from 1.1% in the previous year.
Liquidity conditions continued to be sound.
As the growth of deposits outpaced credit
expansion, the overall loan-to-deposit (LTD)
ratio for all authorized institutions (AIs) went
down notably to 67.1% in December 2012, from
69% in June 2012. Reflecting improved funding
Page 7
Summary and overview
conditions, average interest costs for the Hong
Kong dollar and US dollar funding of licensed
banks both declined across the board – for both
deposits and market-based funding.
Looking ahead, while external headwinds have
seemingly diminished, uncertainties regarding
fiscal issues in the US and Europe would
continue to cloud economic prospects. Another
challenge regards the continued expansion of
the sector’s credit exposure to Mainland-related
business, and banks should continue to be
vigilant about the credit risk management on
their Mainland-related exposure.
Domestically, the risk of a property-price
bubble would continue to overshadow the
banking system. Box 5 examines empirically
the transmission mechanism of LTV policy and
reveals that the sharp rise in property prices after
the global financial crisis has led to significant
increases in collateral values and thus credit
supply, and the LTV cap tightening has partly
offset such effect and reduced the risk of credit-
asset price spirals.
The recent financial crisis has highlighted
the important role of global banks in the
transmission of shocks across banking sectors
in different economies. Box 6 assesses how US
and European banks have adjusted the business
models of their Hong Kong branches after the
2008-09 global financial crisis, and implications
for the shock transmissions.
The Half-yearly Report on Monetary and Financial
Stability is prepared by the staff of the Research
Department of the Hong Kong Monetary
Authority.
Page 8
2. Global setting and outlook
External environment
Tail risks in major advanced economies have diminished over the past six months but growth
remained sluggish. Fiscal drag is set to play a more prominent role from 2013 onwards and
the economic outlook is still subject to substantial policy uncertainties. Growth momentum
in East Asian economies generally improved, and domestic demand will continue to support
economic growth going forward.
2.1 Real activities
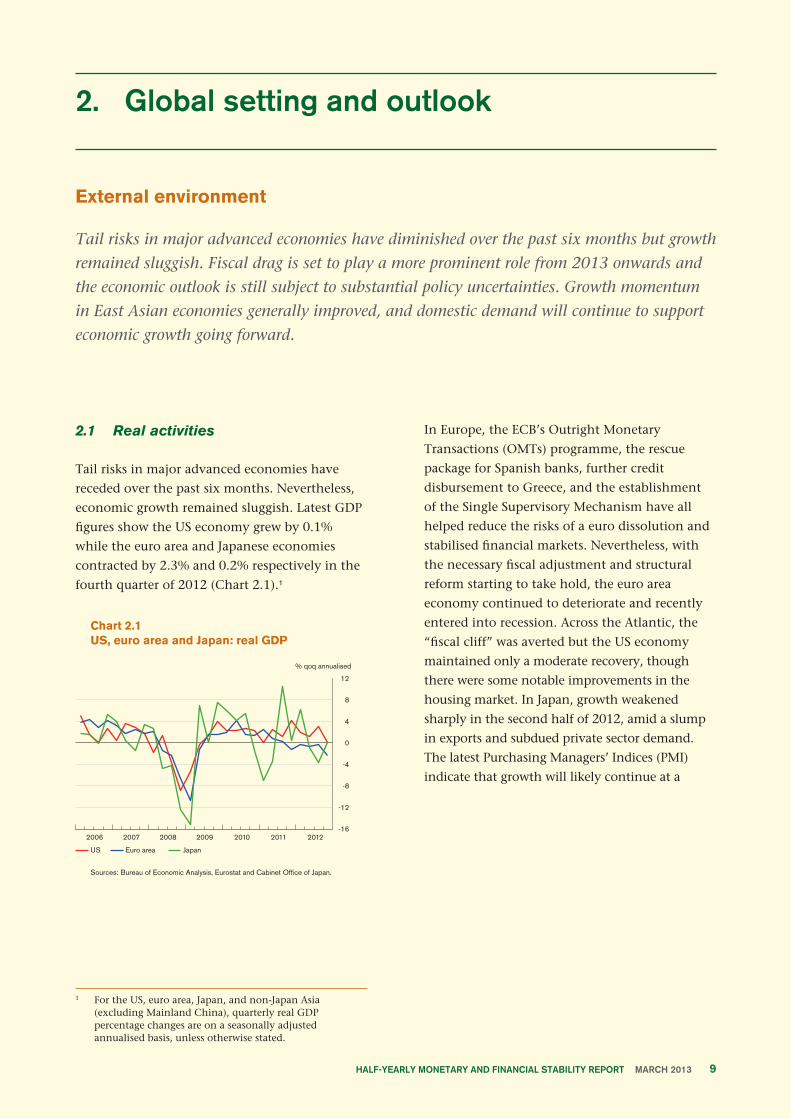
Tail risks in major advanced economies have
receded over the past six months. Nevertheless,
economic growth remained sluggish. Latest GDP
figures show the US economy grew by 0.1%
while the euro area and Japanese economies
contracted by 2.3% and 0.2% respectively in the
fourth quarter of 2012 (Chart 2.1).1
Chart 2.1US, euro area and Japan: real GDP
Sources: Bureau of Economic Analysis, Eurostat and Cabinet Office of Japan.
In Europe, the ECB’s Outright Monetary
Transactions (OMTs) programme, the rescue
package for Spanish banks, further credit
disbursement to Greece, and the establishment
of the Single Supervisory Mechanism have all
helped reduce the risks of a euro dissolution and
stabilised financial markets. Nevertheless, with
the necessary fiscal adjustment and structural
reform starting to take hold, the euro area
economy continued to deteriorate and recently
entered into recession. Across the Atlantic, the
“fiscal cliff” was averted but the US economy
maintained only a moderate recovery, though
there were some notable improvements in the
housing market. In Japan, growth weakened
sharply in the second half of 2012, amid a slump
in exports and subdued private sector demand.
The latest Purchasing Managers’ Indices (PMI)
indicate that growth will likely continue at a
Page 9
1 For the US, euro area, Japan, and non-Japan Asia (excluding Mainland China), quarterly real GDP percentage changes are on a seasonally adjusted annualised basis, unless otherwise stated.
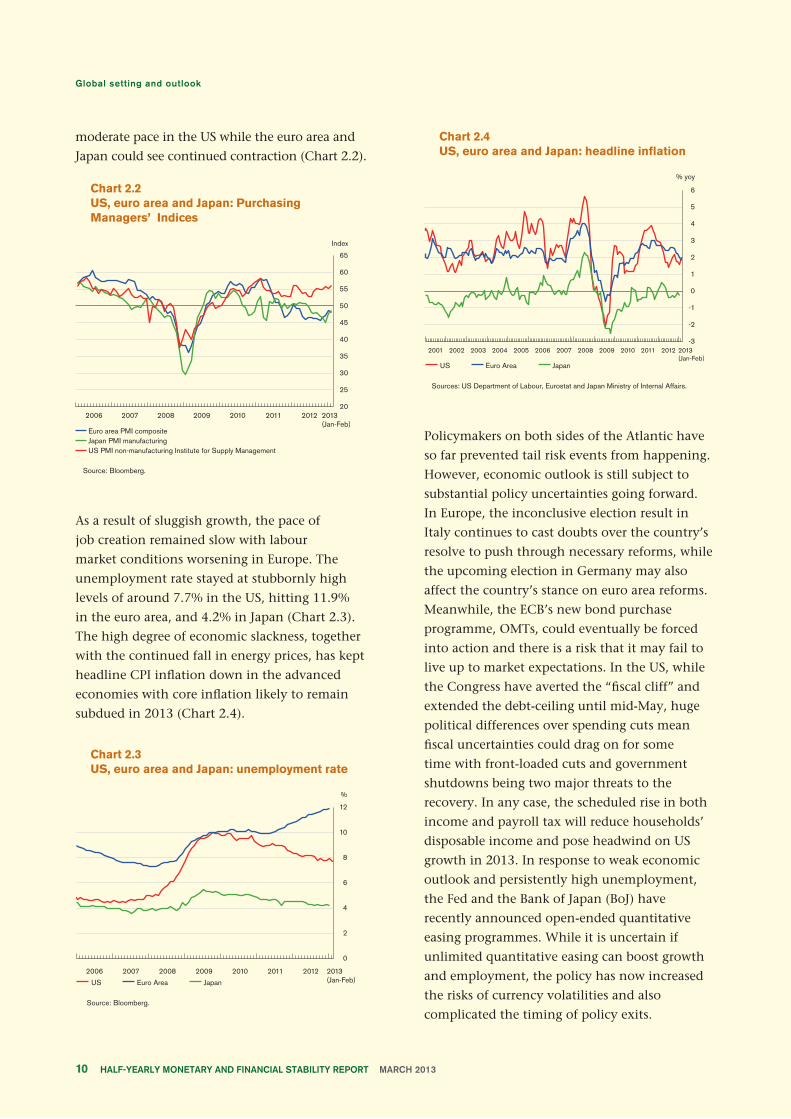
moderate pace in the US while the euro area and
Japan could see continued contraction (Chart 2.2).
Chart 2.2US, euro area and Japan: Purchasing Managers’ Indices
Source: Bloomberg.
As a result of sluggish growth, the pace of
job creation remained slow with labour
market conditions worsening in Europe. The
unemployment rate stayed at stubbornly high
levels of around 7.7% in the US, hitting 11.9%
in the euro area, and 4.2% in Japan (Chart 2.3).
The high degree of economic slackness, together
with the continued fall in energy prices, has kept
headline CPI inflation down in the advanced
economies with core inflation likely to remain
subdued in 2013 (Chart 2.4).
Chart 2.3US, euro area and Japan: unemployment rate
Source: Bloomberg.
Chart 2.4US, euro area and Japan: headline inflation
Sources: US Department of Labour, Eurostat and Japan Ministry of Internal Affairs.
Policymakers on both sides of the Atlantic have
so far prevented tail risk events from happening.
However, economic outlook is still subject to
substantial policy uncertainties going forward.
In Europe, the inconclusive election result in
Italy continues to cast doubts over the country’s
resolve to push through necessary reforms, while
the upcoming election in Germany may also
affect the country’s stance on euro area reforms.
Meanwhile, the ECB’s new bond purchase
programme, OMTs, could eventually be forced
into action and there is a risk that it may fail to
live up to market expectations. In the US, while
the Congress have averted the “fiscal cliff” and
extended the debt-ceiling until mid-May, huge
political differences over spending cuts mean
fiscal uncertainties could drag on for some
time with front-loaded cuts and government
shutdowns being two major threats to the
recovery. In any case, the scheduled rise in both
income and payroll tax will reduce households’
disposable income and pose headwind on US
growth in 2013. In response to weak economic
outlook and persistently high unemployment,
the Fed and the Bank of Japan (BoJ) have
recently announced open-ended quantitative
easing programmes. While it is uncertain if
unlimited quantitative easing can boost growth
and employment, the policy has now increased
the risks of currency volatilities and also
complicated the timing of policy exits.
Page 10
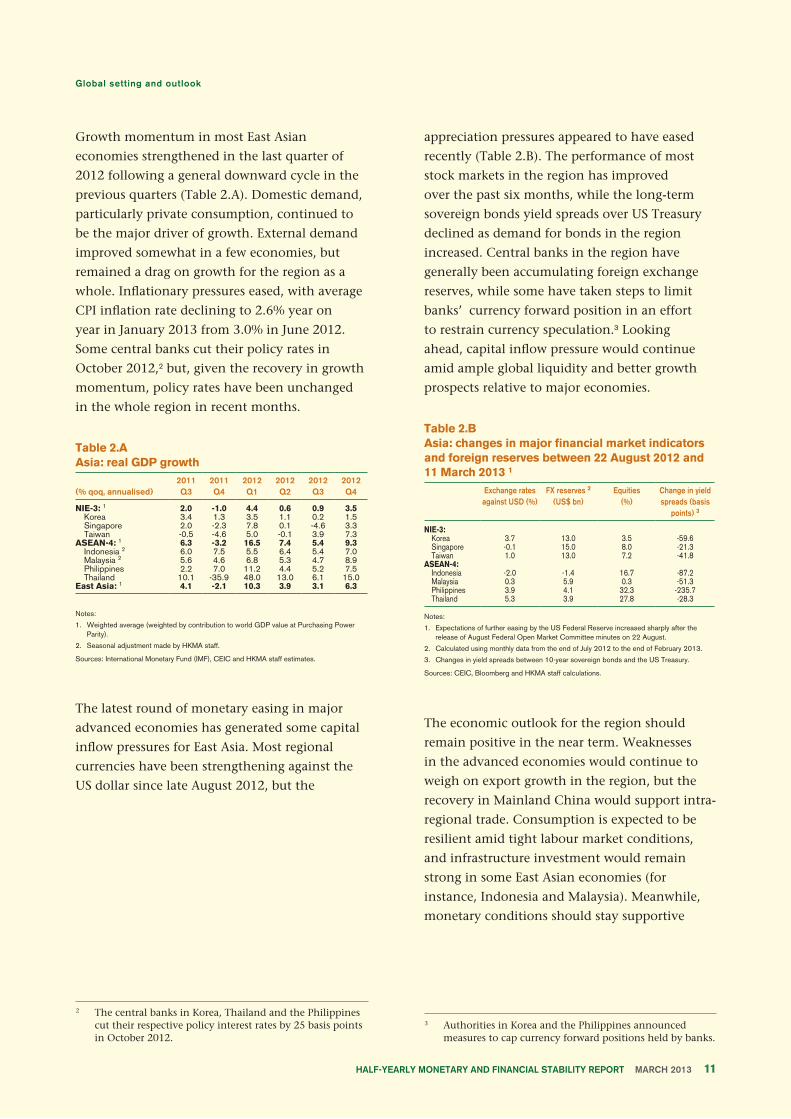
Growth momentum in most East Asian
economies strengthened in the last quarter of
2012 following a general downward cycle in the
previous quarters (Table 2.A). Domestic demand,
particularly private consumption, continued to
be the major driver of growth. External demand
improved somewhat in a few economies, but
remained a drag on growth for the region as a
whole. Inflationary pressures eased, with average
CPI inflation rate declining to 2.6% year on
year in January 2013 from 3.0% in June 2012.
Some central banks cut their policy rates in
October 2012,2 but, given the recovery in growth
momentum, policy rates have been unchanged
in the whole region in recent months.
Table 2.AAsia: real GDP growth
(% qoq, annualised)2011Q3
2011Q4
2012Q1
2012Q2
2012Q3
2012Q4
NIE-3: 1 2.0 -1.0 4.4 0.6 0.9 3.5 Korea 3.4 1.3 3.5 1.1 0.2 1.5 Singapore 2.0 -2.3 7.8 0.1 -4.6 3.3 Taiwan -0.5 -4.6 5.0 -0.1 3.9 7.3ASEAN-4: 1 6.3 -3.2 16.5 7.4 5.4 9.3 Indonesia 2 6.0 7.5 5.5 6.4 5.4 7.0 Malaysia 2 5.6 4.6 6.8 5.3 4.7 8.9 Philippines 2.2 7.0 11.2 4.4 5.2 7.5 Thailand 10.1 -35.9 48.0 13.0 6.1 15.0East Asia: 1 4.1 -2.1 10.3 3.9 3.1 6.3
appreciation pressures appeared to have eased
recently (Table 2.B). The performance of most
stock markets in the region has improved
over the past six months, while the long-term
sovereign bonds yield spreads over US Treasury
declined as demand for bonds in the region
increased. Central banks in the region have
generally been accumulating foreign exchange
reserves, while some have taken steps to limit
banks’ currency forward position in an effort
to restrain currency speculation.3 Looking
ahead, capital inflow pressure would continue
amid ample global liquidity and better growth
prospects relative to major economies.
Table 2.BAsia: changes in major financial market indicators and foreign reserves between 22 August 2012 and 11 March 2013 1
region Exchange ratesagainst USD (%)
FX reserves 2
(US$ bn)Equities
(%)Change in yieldspreads (basis
points) 3
NIE-3: Korea 3.7 13.0 3.5 -59.6 Singapore -0.1 15.0 8.0 -21.3 Taiwan 1.0 13.0 7.2 -41.8ASEAN-4: Indonesia -2.0 -1.4 16.7 -87.2 Malaysia 0.3 5.9 0.3 -51.3 Philippines 3.9 4.1 32.3 -235.7 Thailand 5.3 3.9 27.8 -28.3
Notes:
1. Expectations of further easing by the US Federal Reserve increased sharply after the release of August Federal Open Market Committee minutes on 22 August.
2. Calculated using monthly data from the end of July 2012 to the end of February 2013.
3. Changes in yield spreads between 10-year sovereign bonds and the US Treasury.
Sources: CEIC, Bloomberg and HKMA staff calculations.
The economic outlook for the region should
remain positive in the near term. Weaknesses
in the advanced economies would continue to
weigh on export growth in the region, but the
recovery in Mainland China would support intra-
regional trade. Consumption is expected to be
resilient amid tight labour market conditions,
and infrastructure investment would remain
strong in some East Asian economies (for
instance, Indonesia and Malaysia). Meanwhile,
monetary conditions should stay supportive
Page 11
Notes:
1. Weighted average (weighted by contribution to world GDP value at Purchasing Power Parity).
2. Seasonal adjustment made by HKMA staff.
Sources: International Monetary Fund (IMF), CEIC and HKMA staff estimates.
The latest round of monetary easing in major
advanced economies has generated some capital
inflow pressures for East Asia. Most regional
currencies have been strengthening against the
US dollar since late August 2012, but the
3 Authorities in Korea and the Philippines announced measures to cap currency forward positions held by banks.
2 The central banks in Korea, Thailand and the Philippines cut their respective policy interest rates by 25 basis points in October 2012.
of growth amid continued monetary easing in
major advanced economies and the stabilisation
of deleveraging by European banks. Accordingly,
risks to inflation appear to be tilted towards
upside, particularly if global commodity prices
strengthen along with a stabilisation of global
conditions. The latest consensus forecasts project
the region’s GDP to grow by 4.4% as a whole
in 2013, compared with 3.9% in 2012, while
inflation rate would increase to 3.2% from 3.0%.
2.2 Global financial conditions
Global financial conditions have improved
significantly in the past six months, driven by
extraordinary accommodative monetary policy
from central banks in the developed countries
and reduced tail risks in the US and Europe.
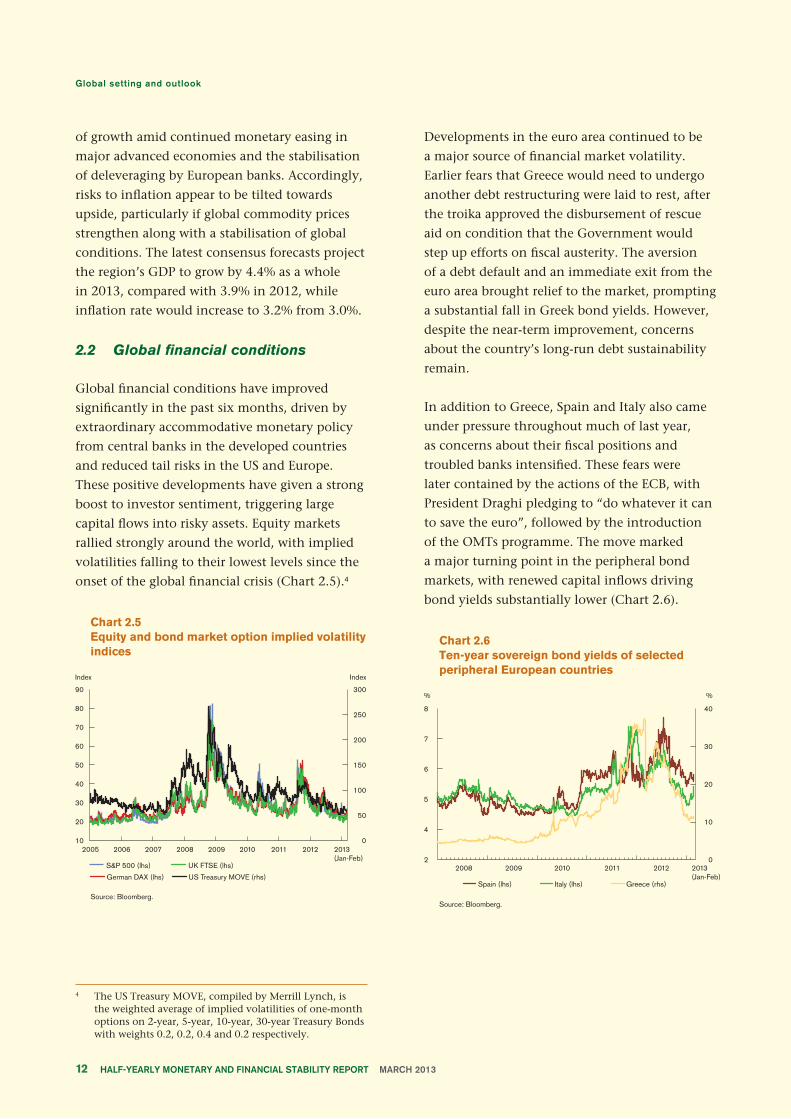
These positive developments have given a strong
boost to investor sentiment, triggering large
capital flows into risky assets. Equity markets
rallied strongly around the world, with implied
volatilities falling to their lowest levels since the
onset of the global financial crisis (Chart 2.5).4
Chart 2.5Equity and bond market option implied volatility indices
Source: Bloomberg.
Developments in the euro area continued to be
a major source of financial market volatility.
Earlier fears that Greece would need to undergo
another debt restructuring were laid to rest, after
the troika approved the disbursement of rescue
aid on condition that the Government would
step up efforts on fiscal austerity. The aversion
of a debt default and an immediate exit from the
euro area brought relief to the market, prompting
a substantial fall in Greek bond yields. However,
despite the near-term improvement, concerns
about the country’s long-run debt sustainability
remain.
In addition to Greece, Spain and Italy also came
under pressure throughout much of last year,
as concerns about their fiscal positions and
troubled banks intensified. These fears were
later contained by the actions of the ECB, with
President Draghi pledging to “do whatever it can
to save the euro”, followed by the introduction
of the OMTs programme. The move marked
a major turning point in the peripheral bond
markets, with renewed capital inflows driving
bond yields substantially lower (Chart 2.6).
Chart 2.6Ten-year sovereign bond yields of selected peripheral European countries
Source: Bloomberg.
Page 12
4 The US Treasury MOVE, compiled by Merrill Lynch, is the weighted average of implied volatilities of one-month options on 2-year, 5-year, 10-year, 30-year Treasury Bonds with weights 0.2, 0.2, 0.4 and 0.2 respectively.
However, the banking system in Europe
continues to be a stumbling block, as banks
are still highly leveraged and inadequately
capitalised. Constrained by poor balance sheets,
banks have been reluctant to lend to the real
economy, taking a toll on any potential recovery.
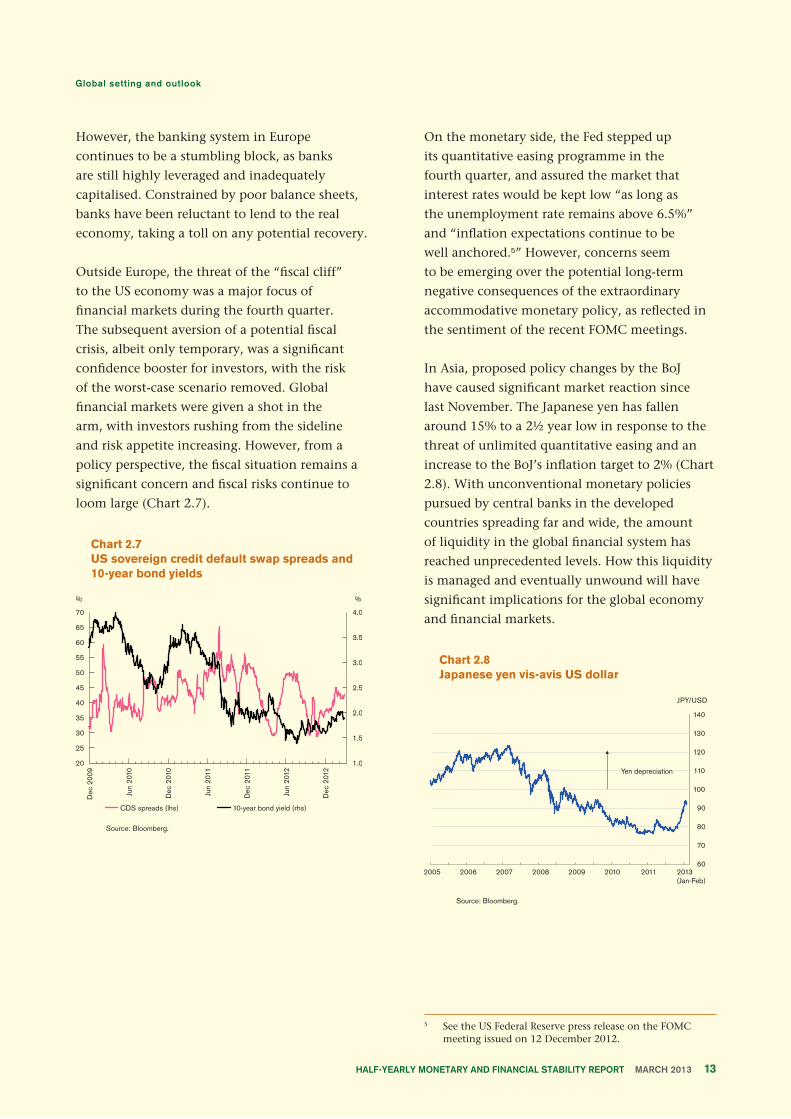
Outside Europe, the threat of the “fiscal cliff”
to the US economy was a major focus of
financial markets during the fourth quarter.
The subsequent aversion of a potential fiscal
crisis, albeit only temporary, was a significant
confidence booster for investors, with the risk
of the worst-case scenario removed. Global
financial markets were given a shot in the
arm, with investors rushing from the sideline
and risk appetite increasing. However, from a
policy perspective, the fiscal situation remains a
significant concern and fiscal risks continue to
loom large (Chart 2.7).
Chart 2.7US sovereign credit default swap spreads and 10-year bond yields
Source: Bloomberg.
On the monetary side, the Fed stepped up
its quantitative easing programme in the
fourth quarter, and assured the market that
interest rates would be kept low “as long as
the unemployment rate remains above 6.5%”
and “inflation expectations continue to be
well anchored.5” However, concerns seem
to be emerging over the potential long-term
negative consequences of the extraordinary
accommodative monetary policy, as reflected in
the sentiment of the recent FOMC meetings.
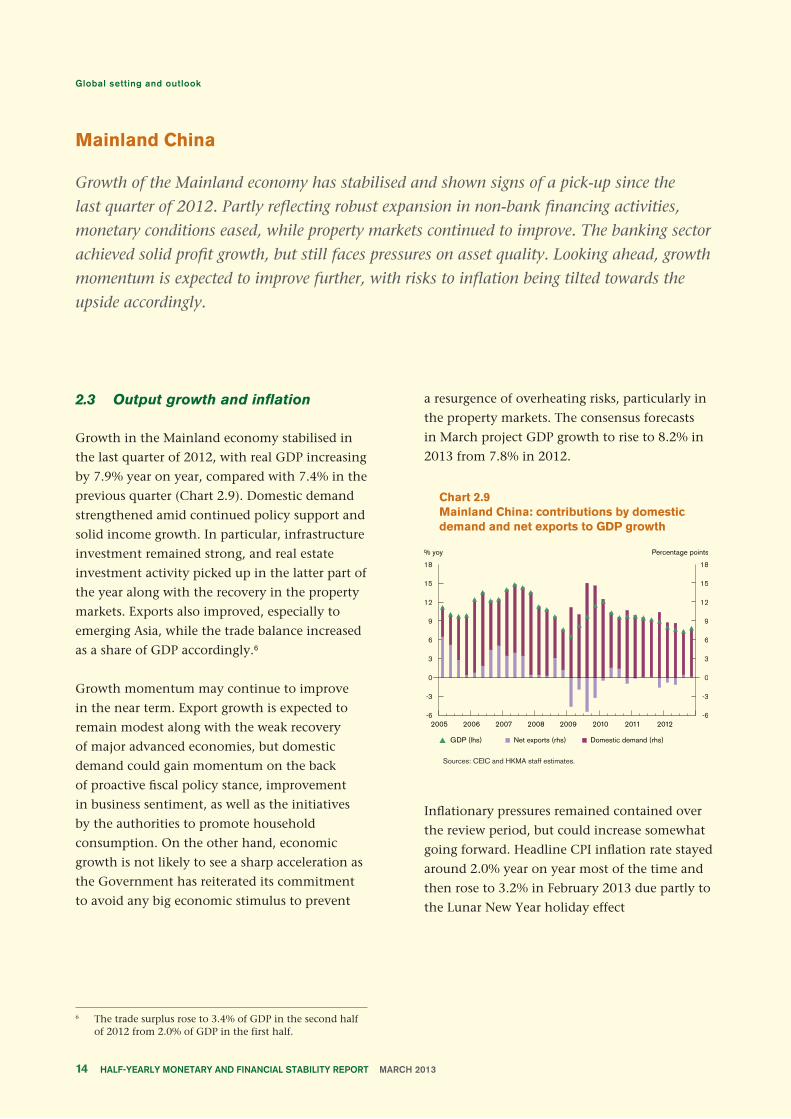
In Asia, proposed policy changes by the BoJ
have caused significant market reaction since
last November. The Japanese yen has fallen
around 15% to a 2½ year low in response to the
threat of unlimited quantitative easing and an
increase to the BoJ’s inflation target to 2% (Chart
2.8). With unconventional monetary policies
pursued by central banks in the developed
countries spreading far and wide, the amount
of liquidity in the global financial system has
reached unprecedented levels. How this liquidity
is managed and eventually unwound will have
significant implications for the global economy
and financial markets.
Chart 2.8Japanese yen vis-avis US dollar
Source: Bloomberg.
5 See the US Federal Reserve press release on the FOMC meeting issued on 12 December 2012.
Page 13
Mainland China
Growth of the Mainland economy has stabilised and shown signs of a pick-up since the
last quarter of 2012. Partly reflecting robust expansion in non-bank financing activities,
monetary conditions eased, while property markets continued to improve. The banking sector
achieved solid profit growth, but still faces pressures on asset quality. Looking ahead, growth
momentum is expected to improve further, with risks to inflation being tilted towards the
upside accordingly.
2.3 Output growth and inflation
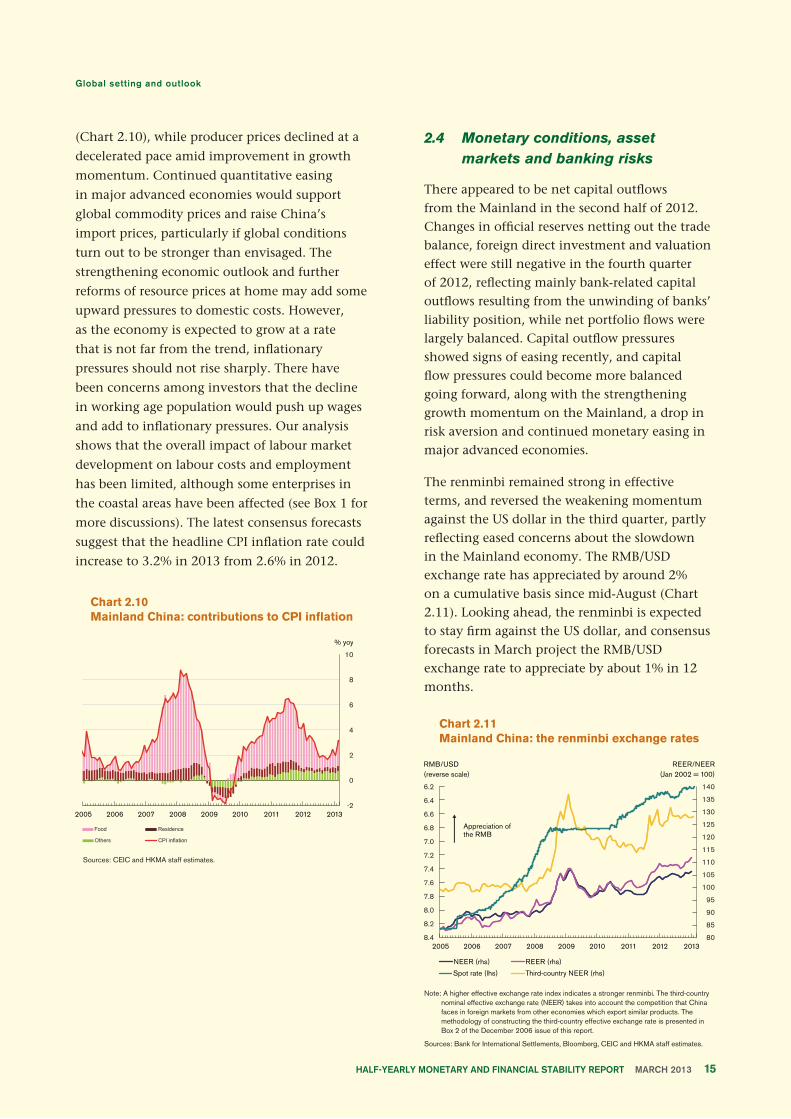
Growth in the Mainland economy stabilised in
the last quarter of 2012, with real GDP increasing
by 7.9% year on year, compared with 7.4% in the
previous quarter (Chart 2.9). Domestic demand
strengthened amid continued policy support and
solid income growth. In particular, infrastructure
investment remained strong, and real estate
investment activity picked up in the latter part of
the year along with the recovery in the property
markets. Exports also improved, especially to
emerging Asia, while the trade balance increased
as a share of GDP accordingly.6
Growth momentum may continue to improve
in the near term. Export growth is expected to
remain modest along with the weak recovery
of major advanced economies, but domestic
demand could gain momentum on the back
of proactive fiscal policy stance, improvement
in business sentiment, as well as the initiatives
by the authorities to promote household
consumption. On the other hand, economic
growth is not likely to see a sharp acceleration as
the Government has reiterated its commitment
to avoid any big economic stimulus to prevent
a resurgence of overheating risks, particularly in
the property markets. The consensus forecasts
in March project GDP growth to rise to 8.2% in
2013 from 7.8% in 2012.
Chart 2.9Mainland China: contributions by domestic demand and net exports to GDP growth
Sources: CEIC and HKMA staff estimates.
Inflationary pressures remained contained over
the review period, but could increase somewhat
going forward. Headline CPI inflation rate stayed
around 2.0% year on year most of the time and
then rose to 3.2% in February 2013 due partly to
the Lunar New Year holiday effect
Page 14
6 The trade surplus rose to 3.4% of GDP in the second half of 2012 from 2.0% of GDP in the first half.
(Chart 2.10), while producer prices declined at a
decelerated pace amid improvement in growth
momentum. Continued quantitative easing
in major advanced economies would support
global commodity prices and raise China’s
import prices, particularly if global conditions
turn out to be stronger than envisaged. The
strengthening economic outlook and further
reforms of resource prices at home may add some
upward pressures to domestic costs. However,
as the economy is expected to grow at a rate
that is not far from the trend, inflationary
pressures should not rise sharply. There have
been concerns among investors that the decline
in working age population would push up wages
and add to inflationary pressures. Our analysis
shows that the overall impact of labour market
development on labour costs and employment
has been limited, although some enterprises in
the coastal areas have been affected (see Box 1 for
more discussions). The latest consensus forecasts
suggest that the headline CPI inflation rate could
increase to 3.2% in 2013 from 2.6% in 2012.
Chart 2.10Mainland China: contributions to CPI inflation
Sources: CEIC and HKMA staff estimates.
2.4 Monetary conditions, asset markets and banking risks
There appeared to be net capital outflows from the Mainland in the second half of 2012. Changes in official reserves netting out the trade balance, foreign direct investment and valuation effect were still negative in the fourth quarter of 2012, reflecting mainly bank-related capital outflows resulting from the unwinding of banks’ liability position, while net portfolio flows were largely balanced. Capital outflow pressures showed signs of easing recently, and capital flow pressures could become more balanced going forward, along with the strengthening growth momentum on the Mainland, a drop in risk aversion and continued monetary easing in major advanced economies.
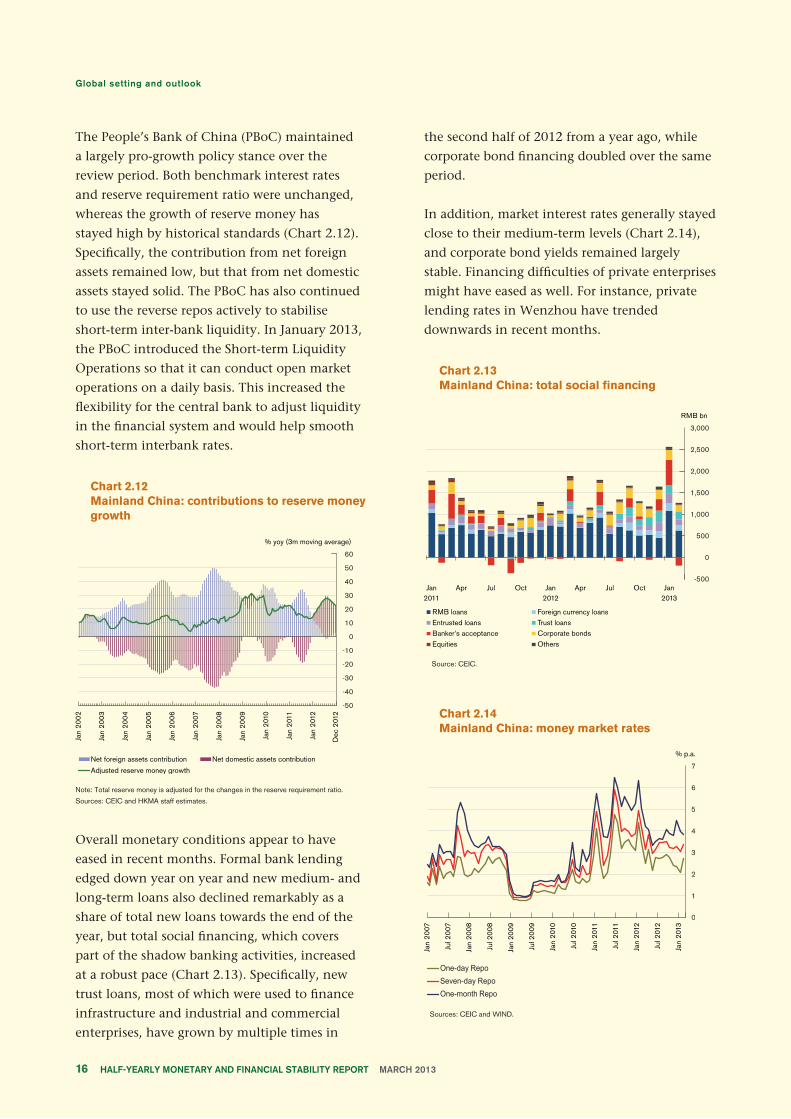
The renminbi remained strong in effective terms, and reversed the weakening momentum against the US dollar in the third quarter, partly reflecting eased concerns about the slowdown in the Mainland economy. The RMB/USD exchange rate has appreciated by around 2% on a cumulative basis since mid-August (Chart 2.11). Looking ahead, the renminbi is expected to stay firm against the US dollar, and consensus forecasts in March project the RMB/USD exchange rate to appreciate by about 1% in 12 months.
Chart 2.11Mainland China: the renminbi exchange rates
Note: A higher effective exchange rate index indicates a stronger renminbi. The third-country nominal effective exchange rate (NEER) takes into account the competition that China faces in foreign markets from other economies which export similar products. The methodology of constructing the third-country effective exchange rate is presented in Box 2 of the December 2006 issue of this report.
Sources: Bank for International Settlements, Bloomberg, CEIC and HKMA staff estimates.
Page 15
The People’s Bank of China (PBoC) maintained
a largely pro-growth policy stance over the
review period. Both benchmark interest rates
and reserve requirement ratio were unchanged,
whereas the growth of reserve money has
stayed high by historical standards (Chart 2.12).
Specifically, the contribution from net foreign
assets remained low, but that from net domestic
assets stayed solid. The PBoC has also continued
to use the reverse repos actively to stabilise
short-term inter-bank liquidity. In January 2013,
the PBoC introduced the Short-term Liquidity
Operations so that it can conduct open market
operations on a daily basis. This increased the
flexibility for the central bank to adjust liquidity
in the financial system and would help smooth
short-term interbank rates.
Chart 2.12Mainland China: contributions to reserve money growth
Note: Total reserve money is adjusted for the changes in the reserve requirement ratio.
Sources: CEIC and HKMA staff estimates.
Overall monetary conditions appear to have
eased in recent months. Formal bank lending
edged down year on year and new medium- and
long-term loans also declined remarkably as a
share of total new loans towards the end of the
year, but total social financing, which covers
part of the shadow banking activities, increased
at a robust pace (Chart 2.13). Specifically, new
trust loans, most of which were used to finance
infrastructure and industrial and commercial
enterprises, have grown by multiple times in
the second half of 2012 from a year ago, while
corporate bond financing doubled over the same
period.
In addition, market interest rates generally stayed
close to their medium-term levels (Chart 2.14),
and corporate bond yields remained largely
stable. Financing difficulties of private enterprises
might have eased as well. For instance, private
lending rates in Wenzhou have trended
downwards in recent months.
Chart 2.13Mainland China: total social financing
Source: CEIC.
Chart 2.14Mainland China: money market rates
Sources: CEIC and WIND.
Page 16
Equity markets reversed the downward trend
towards the end of the year, partly reflecting
a rise in investor confidence in the Mainland
economic outlook. The price-to-earnings ratio
of Shanghai A shares rose from an historical
low of 10.6 in early December 2012 to 12.6 in
mid-March 2013.7 Going forward, the generally
improving prospect of corporate profitability
could continue to support market sentiment.
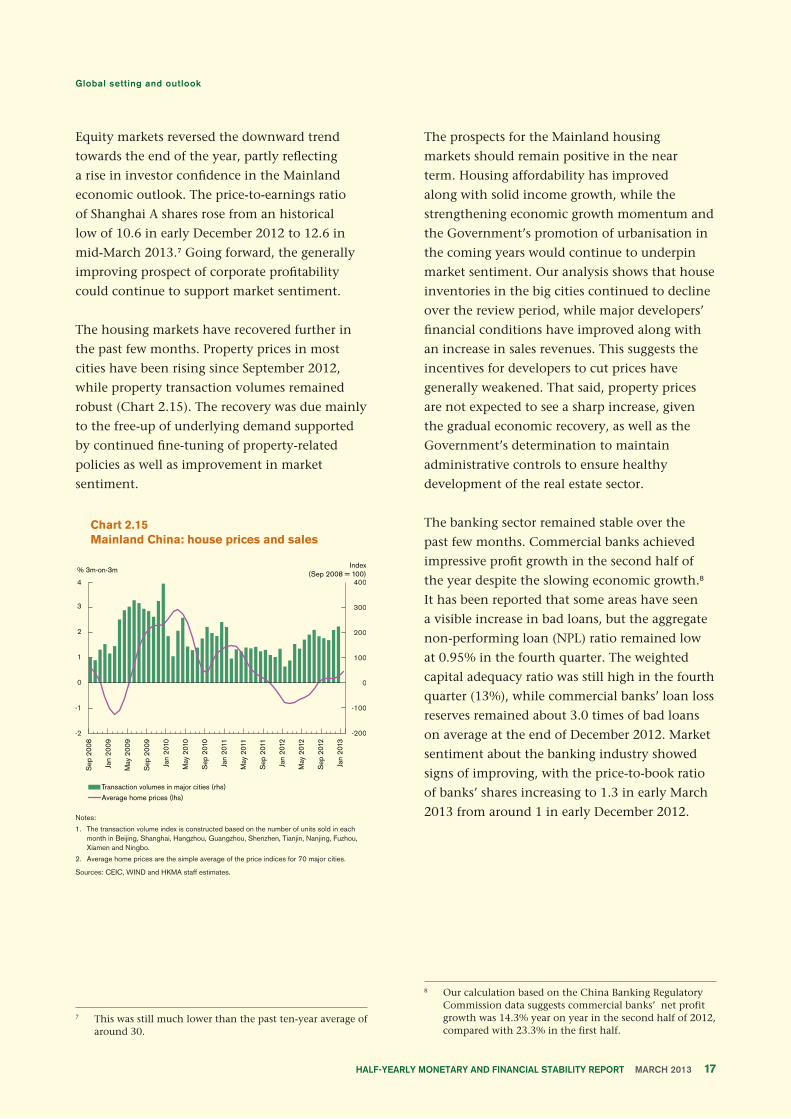
The housing markets have recovered further in
the past few months. Property prices in most
cities have been rising since September 2012,
while property transaction volumes remained
robust (Chart 2.15). The recovery was due mainly
to the free-up of underlying demand supported
by continued fine-tuning of property-related
policies as well as improvement in market
sentiment.
Chart 2.15Mainland China: house prices and sales
Notes:
1. The transaction volume index is constructed based on the number of units sold in each month in Beijing, Shanghai, Hangzhou, Guangzhou, Shenzhen, Tianjin, Nanjing, Fuzhou, Xiamen and Ningbo.
2. Average home prices are the simple average of the price indices for 70 major cities.
Sources: CEIC, WIND and HKMA staff estimates.
The prospects for the Mainland housing
markets should remain positive in the near
term. Housing affordability has improved
along with solid income growth, while the
strengthening economic growth momentum and
the Government’s promotion of urbanisation in
the coming years would continue to underpin
market sentiment. Our analysis shows that house
inventories in the big cities continued to decline
over the review period, while major developers’
financial conditions have improved along with
an increase in sales revenues. This suggests the
incentives for developers to cut prices have
generally weakened. That said, property prices
are not expected to see a sharp increase, given
the gradual economic recovery, as well as the
Government’s determination to maintain
administrative controls to ensure healthy
development of the real estate sector.
The banking sector remained stable over the
past few months. Commercial banks achieved
impressive profit growth in the second half of
the year despite the slowing economic growth.8
It has been reported that some areas have seen
a visible increase in bad loans, but the aggregate
non-performing loan (NPL) ratio remained low
at 0.95% in the fourth quarter. The weighted
capital adequacy ratio was still high in the fourth
quarter (13%), while commercial banks’ loan loss
reserves remained about 3.0 times of bad loans
on average at the end of December 2012. Market
sentiment about the banking industry showed
signs of improving, with the price-to-book ratio
of banks’ shares increasing to 1.3 in early March
2013 from around 1 in early December 2012.
Page 17
7 This was still much lower than the past ten-year average of around 30.
8 Our calculation based on the China Banking Regulatory Commission data suggests commercial banks’ net profit growth was 14.3% year on year in the second half of 2012, compared with 23.3% in the first half.
However, concerns over the banking sector’s
profitability and asset quality may not ease
significantly in the near term. The recovering
property markets and the authorities’ active
management of lending to local government
financing vehicles have reduced pressures
on banks’ asset quality. On the other hand,
some small- and medium-sized enterprises and
those sectors with substantial overcapacity
(for instance, steel industry) may still have
difficulty in repaying loans. Indeed, the NPL
ratio in Wenzhou, where a large number of small
enterprises are located, rose to 3.4% in November
2012 from 2.7% in June.
The rapidly expanding shadow banking system
also posed uncertainty to the banking sector’s
asset quality and profitability. There is not
yet a consensus on the definition of shadow
banking, but according to most commentators
of the Mainland economy, it mainly consists
of banks’ off-balance sheet financing activities,
non-bank financial institutions’ (for instance,
trust companies) financing activities, and
informal lending activities. There is much
uncertainty over the size of shadow banking
in Mainland China, but most estimates suggest
it should be relatively much smaller than in
major economies.9 Moreover, part of the shadow
banking activity is incentivised by the remaining
interest rate controls in the banking system and
is therefore not entirely negative or risky. In
general, products that offer very high interest
rates are likely to be more problematic than
those whose yields are only a few percentage
points higher than benechmark deposit rates,
and the former does not appear to be a large part
of bank-related activities. That said, the close yet
opaque relationship between shadow banking
and regular banking activities has raised concerns
over its potential impact on financial stability,
particularly given that some sectors financed
through shadow banking still face headwinds
9 See Global Shadow Banking Monitoring Report 2012, Financial Stability Board.
in profit growth, and there may be a significant
amount of maturity transformation and
therefore liquidity risks built in such activities.
Reflecting these concerns, the regulatory
authorities on the Mainland have stepped up
their supervision of shadow banking activities.
Page 18
Box 1How did labour market development affect labour costs in
Mainland China?10
Labour markets in Mainland China have
experienced some remarkable changes in recent
years. First, working-age population (15-59 years
old) started to decline in 2012 according to the
National Bureau of Statistics. Secondly, it has been
reported that there has emerged a shortage of
“migrant workers” in coastal areas in recent years,
while minimum wages have risen at a fast pace.
As labour market development matters for an
economy’s growth and inflation, this article
first studies the extent to which labour market
tightness has affected labour costs on the
Mainland. It then explores the impact of changes
in migrant labour forces on labour costs and
employment in East China (Bohai gulf, Jiangsu-
Zhejiang-Shanghai and Fujian-Guangdong-
Hainan). Policy implications are also discussed
accordingly.
Our research shows that the overall impact of
labour market development on labour costs and
employment has been limited, although Hong
Kong-Macau-Taiwan (HMT) firms and private
enterprises have been affected, particularly in
the coastal areas. This suggests China has not
yet seen an absolute shortage of labour, but
structural problems, such as skill-mismatch, do
exist in the labour markets.
How did labour market tightness affect labour costs in China?According to economic theory, labour costs are
mainly determined by minimum wages, labour
demand-to-supply ratio and other control
variables such as output. While an increase in
minimum wages could partly capture the growth
in living costs and hence reflect workers’ wage
requirement, a rise in labour demand-to-supply
ratio implies intensification in labour market
tightness and would push up labour costs. We
study the impact of these factors on labour
costs using annual firm-level data of above-scale
industrial firms from 2001-2008 across regions
(East China, Central China, West China and
Northeast China), technology levels and firm
ownerships. Specifically, firms in each region are
grouped as state-owned enterprise (SOEs), foreign
firms, HMT firms and private firms.
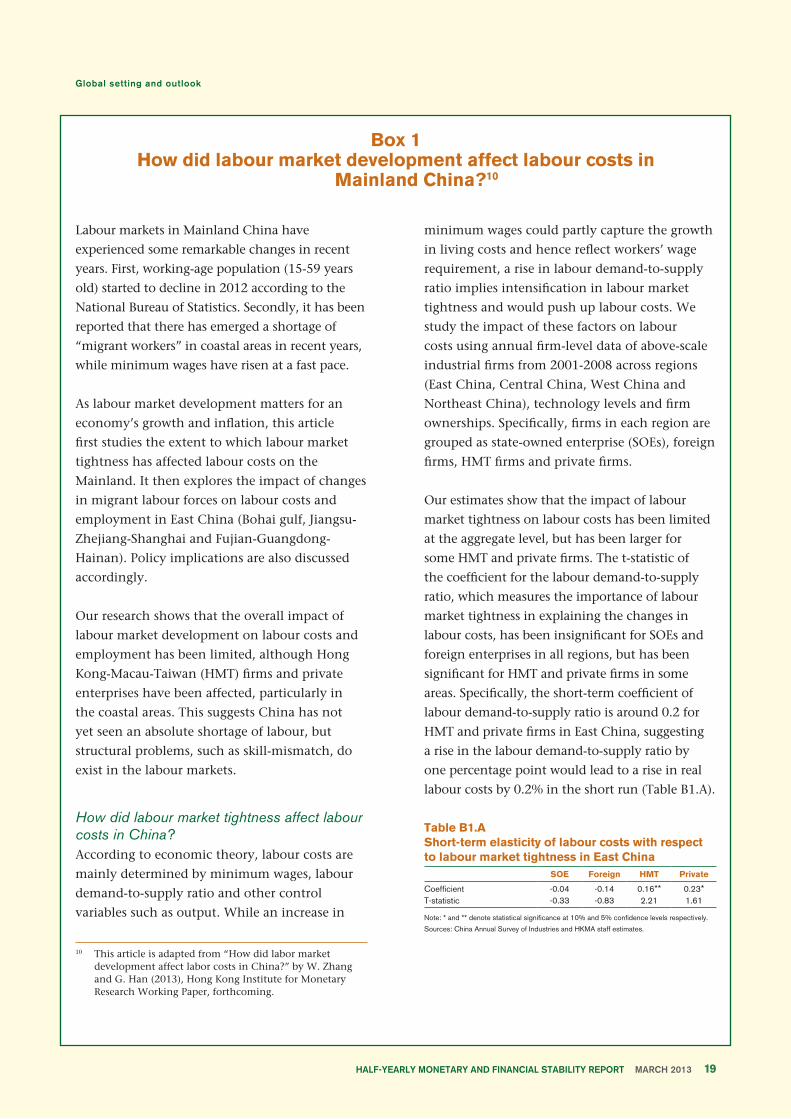
Our estimates show that the impact of labour
market tightness on labour costs has been limited
at the aggregate level, but has been larger for
some HMT and private firms. The t-statistic of
the coefficient for the labour demand-to-supply
ratio, which measures the importance of labour
market tightness in explaining the changes in
labour costs, has been insignificant for SOEs and
foreign enterprises in all regions, but has been
significant for HMT and private firms in some
areas. Specifically, the short-term coefficient of
labour demand-to-supply ratio is around 0.2 for
HMT and private firms in East China, suggesting
a rise in the labour demand-to-supply ratio by
one percentage point would lead to a rise in real
labour costs by 0.2% in the short run (Table B1.A).
Table B1.AShort-term elasticity of labour costs with respect to labour market tightness in East Chinaitem SOE Foreign HMT Private
Coefficient -0.04 -0.14 0.16** 0.23*T-statistic -0.33 -0.83 2.21 1.61
Note: * and ** denote statistical significance at 10% and 5% confidence levels respectively.
Sources: China Annual Survey of Industries and HKMA staff estimates.
10 This article is adapted from “How did labor market development affect labor costs in China?” by W. Zhang and G. Han (2013), Hong Kong Institute for Monetary Research Working Paper, forthcoming.
Page 19
As to other regions, the coefficient is only
significant for private firms in West China and
HMT firms in Northeast China. Our research
further shows the picture remains essentially
unchanged from a longer-term perspective, with
labour market tightness only affecting the labour
costs of some HMT and private firms.
The estimates suggest that there has not yet
emerged an absolute shortage of labour on
the Mainland, but there are some sectoral
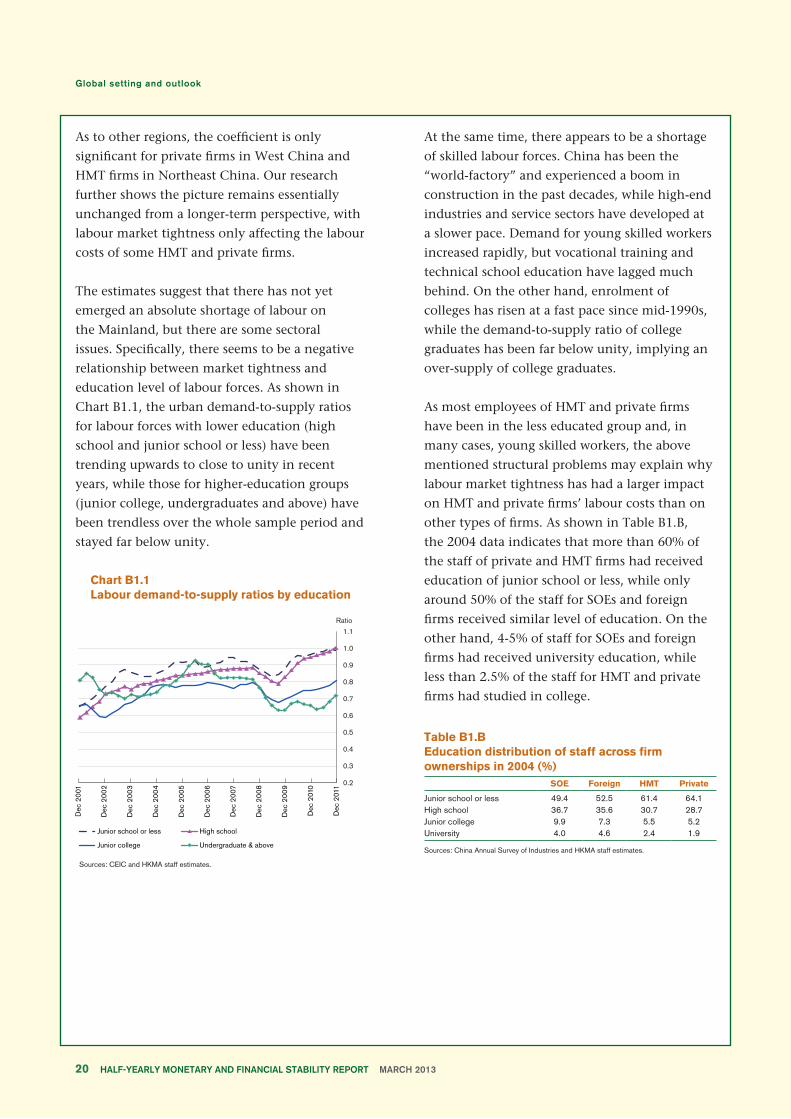
issues. Specifically, there seems to be a negative
relationship between market tightness and
education level of labour forces. As shown in
Chart B1.1, the urban demand-to-supply ratios
for labour forces with lower education (high
school and junior school or less) have been
trending upwards to close to unity in recent
years, while those for higher-education groups
(junior college, undergraduates and above) have
been trendless over the whole sample period and
stayed far below unity.
Chart B1.1Labour demand-to-supply ratios by education
Sources: CEIC and HKMA staff estimates.
At the same time, there appears to be a shortage
of skilled labour forces. China has been the
“world-factory” and experienced a boom in
construction in the past decades, while high-end
industries and service sectors have developed at
a slower pace. Demand for young skilled workers
increased rapidly, but vocational training and
technical school education have lagged much
behind. On the other hand, enrolment of
colleges has risen at a fast pace since mid-1990s,
while the demand-to-supply ratio of college
graduates has been far below unity, implying an
over-supply of college graduates.
As most employees of HMT and private firms
have been in the less educated group and, in
many cases, young skilled workers, the above
mentioned structural problems may explain why
labour market tightness has had a larger impact
on HMT and private firms’ labour costs than on
other types of firms. As shown in Table B1.B,
the 2004 data indicates that more than 60% of
the staff of private and HMT firms had received
education of junior school or less, while only
around 50% of the staff for SOEs and foreign
firms received similar level of education. On the
other hand, 4-5% of staff for SOEs and foreign
firms had received university education, while
less than 2.5% of the staff for HMT and private
firms had studied in college.
Table B1.BEducation distribution of staff across firm ownerships in 2004 (%)Item SOE Foreign HMT Private
Junior school or less 49.4 52.5 61.4 64.1High school 36.7 35.6 30.7 28.7Junior college 9.9 7.3 5.5 5.2University 4.0 4.6 2.4 1.9
Sources: China Annual Survey of Industries and HKMA staff estimates.
Page 20
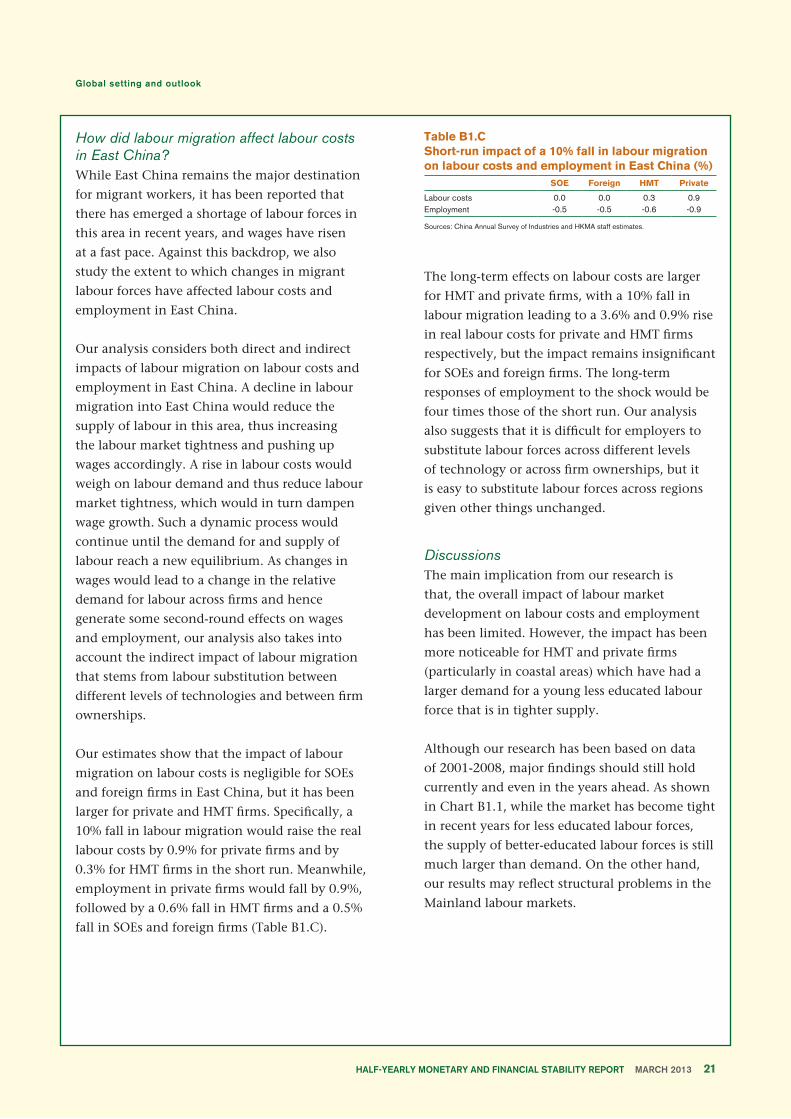
How did labour migration affect labour costs in East China?While East China remains the major destination
for migrant workers, it has been reported that
there has emerged a shortage of labour forces in
this area in recent years, and wages have risen
at a fast pace. Against this backdrop, we also
study the extent to which changes in migrant
labour forces have affected labour costs and
employment in East China.
Our analysis considers both direct and indirect
impacts of labour migration on labour costs and
employment in East China. A decline in labour
migration into East China would reduce the
supply of labour in this area, thus increasing
the labour market tightness and pushing up
wages accordingly. A rise in labour costs would
weigh on labour demand and thus reduce labour
market tightness, which would in turn dampen
wage growth. Such a dynamic process would
continue until the demand for and supply of
labour reach a new equilibrium. As changes in
wages would lead to a change in the relative
demand for labour across firms and hence
generate some second-round effects on wages
and employment, our analysis also takes into
account the indirect impact of labour migration
that stems from labour substitution between
different levels of technologies and between firm
ownerships.
Our estimates show that the impact of labour
migration on labour costs is negligible for SOEs
and foreign firms in East China, but it has been
larger for private and HMT firms. Specifically, a
10% fall in labour migration would raise the real
labour costs by 0.9% for private firms and by
0.3% for HMT firms in the short run. Meanwhile,
employment in private firms would fall by 0.9%,
followed by a 0.6% fall in HMT firms and a 0.5%
fall in SOEs and foreign firms (Table B1.C).
Table B1.CShort-run impact of a 10% fall in labour migration on labour costs and employment in East China (%)Item SOE Foreign HMT Private
Labour costs 0.0 0.0 0.3 0.9Employment -0.5 -0.5 -0.6 -0.9
Sources: China Annual Survey of Industries and HKMA staff estimates.
The long-term effects on labour costs are larger
for HMT and private firms, with a 10% fall in
labour migration leading to a 3.6% and 0.9% rise
in real labour costs for private and HMT firms
respectively, but the impact remains insignificant
for SOEs and foreign firms. The long-term
responses of employment to the shock would be
four times those of the short run. Our analysis
also suggests that it is difficult for employers to
substitute labour forces across different levels
of technology or across firm ownerships, but it
is easy to substitute labour forces across regions
given other things unchanged.
DiscussionsThe main implication from our research is
that, the overall impact of labour market
development on labour costs and employment
has been limited. However, the impact has been
more noticeable for HMT and private firms
(particularly in coastal areas) which have had a
larger demand for a young less educated labour
force that is in tighter supply.
Although our research has been based on data
of 2001-2008, major findings should still hold
currently and even in the years ahead. As shown
in Chart B1.1, while the market has become tight
in recent years for less educated labour forces,
the supply of better-educated labour forces is still
much larger than demand. On the other hand,
our results may reflect structural problems in the
Mainland labour markets.
Page 21

First of all, segmentation of rural and urban
labour markets makes it difficult for rural labour
forces to work in urban areas for long enough,
thus increasing the tightness for labour markets
of less educated groups and skilled workers.
Despite the progress made in the past decade
in deregulating labour markets, there still exist
many institutional factors (for instance, limited
access to social security networks and schooling
facilities for children) that prevent rural labour
forces from working in cities on a permanent
basis. In fact, some research shows that migrant
workers started to return home at the age of 25-
35 to set up family and would not come back to
urban areas afterwards.
Secondly, as mentioned earlier, mismatch
between labour demand and supply appears to
be serious. Specifically, while higher education
is conducive to an economy’s growth from a
long-term perspective, there could be structural
problems in the labour markets in the short run
if the level of education attainment does not
match the demand for labour.
As such, it is useful to remove the barriers
to labour mobility and develop vocational
education to reduce sectoral tightness in the
Mainland labour markets. It is also important
to upgrade industrial chain and develop service
sectors to reduce demand and supply mismatch
in the labour market.
Page 22
3. Domestic economy
The Hong Kong economy grew faster in the second half of 2012 along with some stabilisation
in the merchandise trade performance. The short-term outlook has improved, supported by solid
domestic demand and improving exports. Inflationary pressures have only abated slowly and
are likely to remain elevated as property rentals continue to rise apace.
The labour market remained tight, with the unemployment rate hovering at a low level.
Hiring sentiment stayed strong, and its outlook is likely to be stable barring any major
deterioration in the external environment.
3.1 Aggregate demand
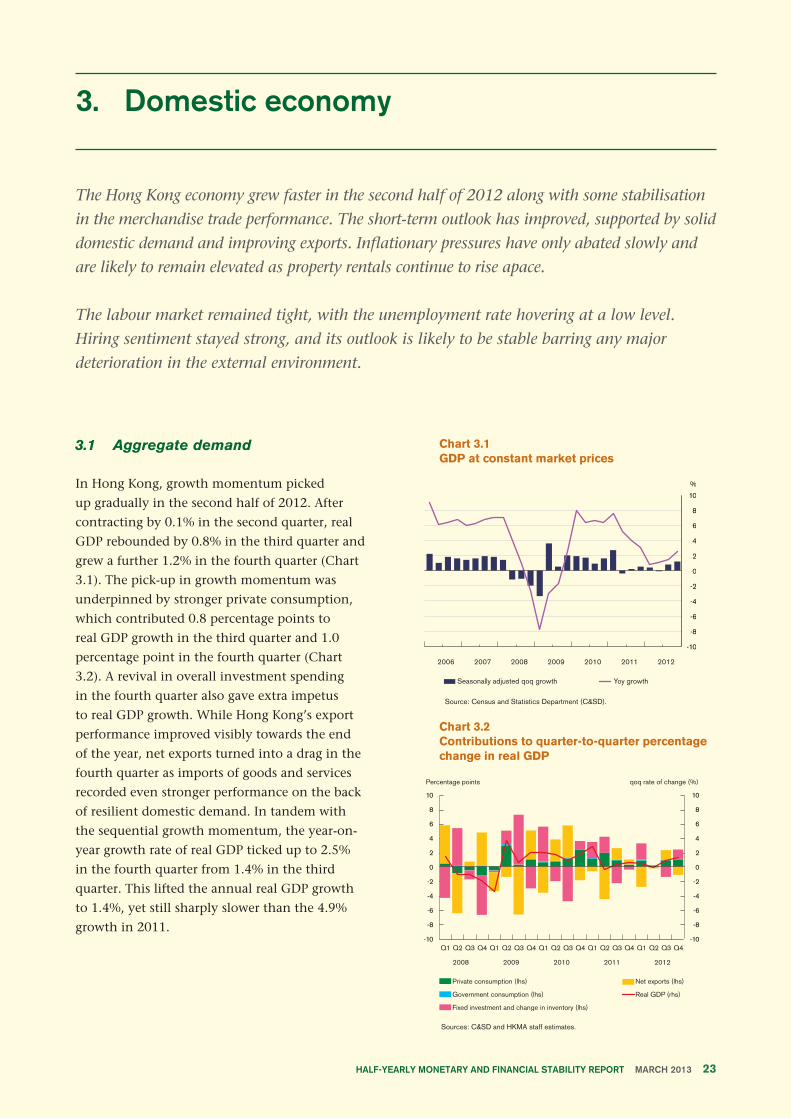
In Hong Kong, growth momentum picked
up gradually in the second half of 2012. After
contracting by 0.1% in the second quarter, real
GDP rebounded by 0.8% in the third quarter and
grew a further 1.2% in the fourth quarter (Chart
3.1). The pick-up in growth momentum was
underpinned by stronger private consumption,
which contributed 0.8 percentage points to
real GDP growth in the third quarter and 1.0
percentage point in the fourth quarter (Chart
3.2). A revival in overall investment spending
in the fourth quarter also gave extra impetus
to real GDP growth. While Hong Kong’s export
performance improved visibly towards the end
of the year, net exports turned into a drag in the
fourth quarter as imports of goods and services
recorded even stronger performance on the back
of resilient domestic demand. In tandem with
the sequential growth momentum, the year-on-
year growth rate of real GDP ticked up to 2.5%
in the fourth quarter from 1.4% in the third
quarter. This lifted the annual real GDP growth
to 1.4%, yet still sharply slower than the 4.9%
growth in 2011.
Chart 3.1GDP at constant market prices
Source: Census and Statistics Department (C&SD).
Chart 3.2Contributions to quarter-to-quarter percentage change in real GDP
Sources: C&SD and HKMA staff estimates.
Page 23
Looking ahead, the Hong Kong economy is
expected to grow faster at a close-to-trend
rate in 2013. The drags from external demand
should subside gradually, but a full recovery in
exports will still take some time as the global
economy is struggling to achieve sustained
growth. Domestically, consumer spending
will continue to be bolstered by the sustained
strength in the labour market, higher incomes
and increased wealth afforded by the booming
asset markets. Large-scale infrastructure works
and private building activity are also expected
to hold up quite well, although the outlook for
capital investment and inventory stocking is less
certain as business sentiment remains somewhat
cautious. The moderately expansionary fiscal
stance in the 2013/14 Budget should provide
support to the economy with committed
infrastructure projects and a package of relief
measures.
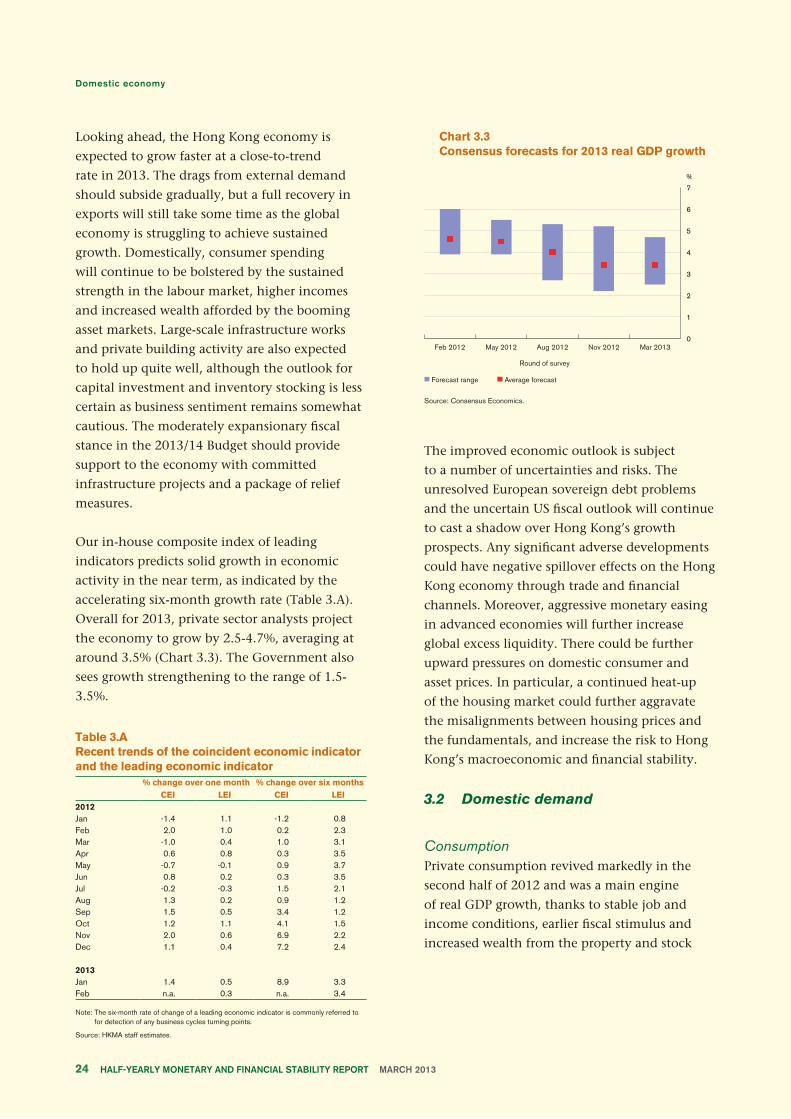
Our in-house composite index of leading
indicators predicts solid growth in economic
activity in the near term, as indicated by the
accelerating six-month growth rate (Table 3.A).
Overall for 2013, private sector analysts project
the economy to grow by 2.5-4.7%, averaging at
around 3.5% (Chart 3.3). The Government also
sees growth strengthening to the range of 1.5-
3.5%.
Table 3.ARecent trends of the coincident economic indicator and the leading economic indicatorperiod % change over one month % change over six months
CEI LEI CEI LEI2012Jan -1.4 1.1 -1.2 0.8Feb 2.0 1.0 0.2 2.3Mar -1.0 0.4 1.0 3.1Apr 0.6 0.8 0.3 3.5May -0.7 -0.1 0.9 3.7Jun 0.8 0.2 0.3 3.5Jul -0.2 -0.3 1.5 2.1Aug 1.3 0.2 0.9 1.2Sep 1.5 0.5 3.4 1.2Oct 1.2 1.1 4.1 1.5Nov 2.0 0.6 6.9 2.2Dec 1.1 0.4 7.2 2.4
2013Jan 1.4 0.5 8.9 3.3Feb n.a. 0.3 n.a. 3.4
Note: The six-month rate of change of a leading economic indicator is commonly referred to for detection of any business cycles turning points.
Source: HKMA staff estimates.
Chart 3.3Consensus forecasts for 2013 real GDP growth
Source: Consensus Economics.
The improved economic outlook is subject
to a number of uncertainties and risks. The
unresolved European sovereign debt problems
and the uncertain US fiscal outlook will continue
to cast a shadow over Hong Kong’s growth
prospects. Any significant adverse developments
could have negative spillover effects on the Hong
Kong economy through trade and financial
channels. Moreover, aggressive monetary easing
in advanced economies will further increase
global excess liquidity. There could be further
upward pressures on domestic consumer and
asset prices. In particular, a continued heat-up
of the housing market could further aggravate
the misalignments between housing prices and
the fundamentals, and increase the risk to Hong
Kong’s macroeconomic and financial stability.
3.2 Domestic demand
ConsumptionPrivate consumption revived markedly in the
second half of 2012 and was a main engine
of real GDP growth, thanks to stable job and
income conditions, earlier fiscal stimulus and
increased wealth from the property and stock
Page 24
markets (Chart 3.4). Its sequential growth
picked up to 1.3% in the third quarter and
1.5% in the fourth quarter. Consumption of
goods, particularly durable goods, rose at a faster
pace. Service consumption also displayed a
growth pick-up amid increased financial market
activities. Box 2 explains the strength of private
consumption in recent years, which was found
to have accounted for the deterioration in the
current account balance in Hong Kong during
the period.
In 2013, private consumption growth is likely to
remain strong on the back of sanguine consumer
sentiment, labour market resilience and
sustained rises in incomes. The relief measures
recently introduced in the 2013/14 Budget
will also provide additional support. The mean
consensus forecast for private consumption
growth is now 3.9% for 2013, slightly slower
than the 4.0% growth in 2012.
Government consumption continued to hold
up reasonably well, expanding by 0.8% in the
third quarter and 0.7% in the fourth quarter
(Chart 3.4). Its growth rate is expected to pick
up somewhat in the future as suggested in the
2013/14 Budget, where the recurrent part of
public expenditure is projected to rise by 8.4% in
real terms in the coming fiscal year, higher than
the 6.8% increase in 2012/13. 11
Chart 3.4Private and government consumption
Source: C&SD.
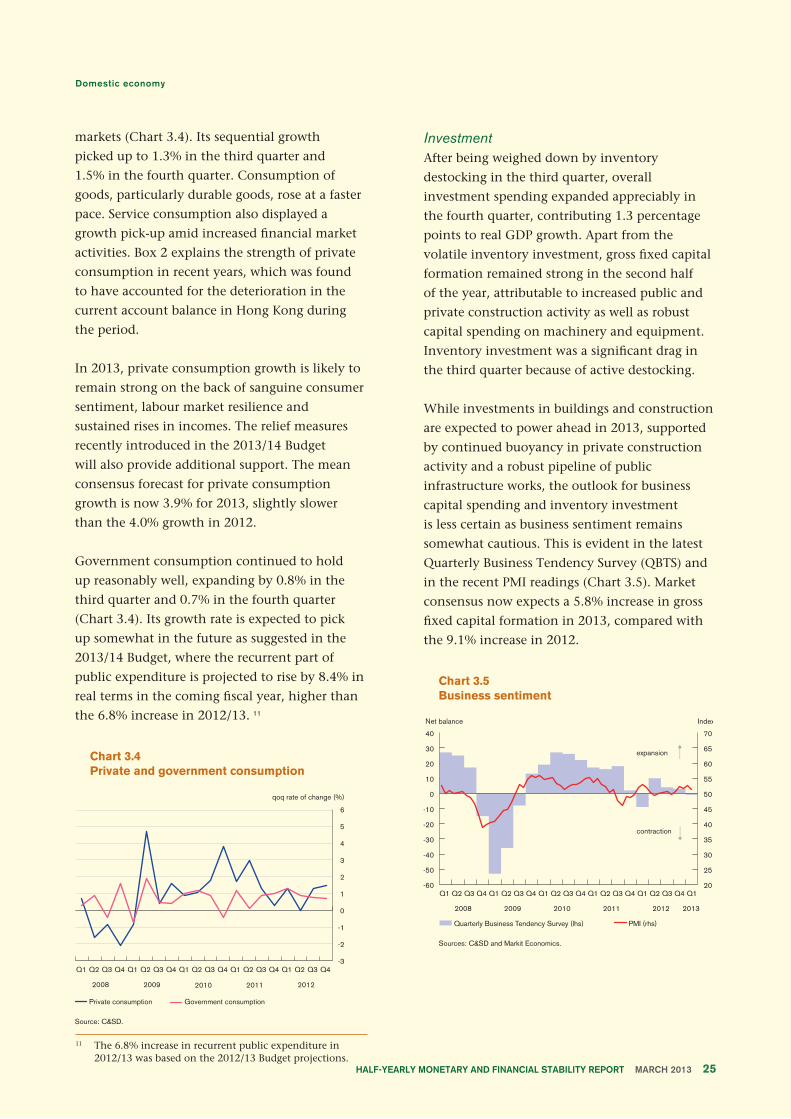
InvestmentAfter being weighed down by inventory
destocking in the third quarter, overall
investment spending expanded appreciably in
the fourth quarter, contributing 1.3 percentage
points to real GDP growth. Apart from the
volatile inventory investment, gross fixed capital
formation remained strong in the second half
of the year, attributable to increased public and
private construction activity as well as robust
capital spending on machinery and equipment.
Inventory investment was a significant drag in
the third quarter because of active destocking.
While investments in buildings and construction
are expected to power ahead in 2013, supported
by continued buoyancy in private construction
activity and a robust pipeline of public
infrastructure works, the outlook for business
capital spending and inventory investment
is less certain as business sentiment remains
somewhat cautious. This is evident in the latest
Quarterly Business Tendency Survey (QBTS) and
in the recent PMI readings (Chart 3.5). Market
consensus now expects a 5.8% increase in gross
fixed capital formation in 2013, compared with
the 9.1% increase in 2012.
Chart 3.5Business sentiment
Sources: C&SD and Markit Economics.
11 The 6.8% increase in recurrent public expenditure in 2012/13 was based on the 2012/13 Budget projections.
Page 25
3.3 External trade
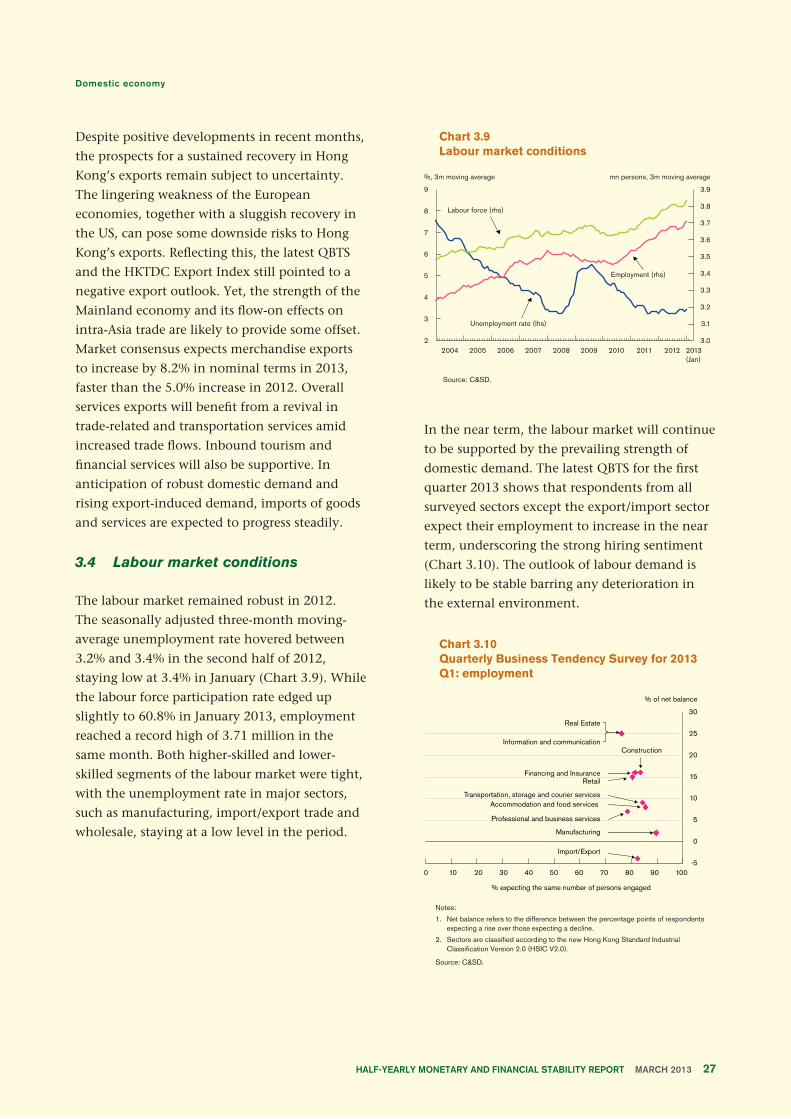
Hong Kong’s overall export performance
improved in the second half of 2012 along with
the stabilising external conditions. Exports of
goods increased briskly by a sequential 3.0%
in the third quarter and 4.8% in the fourth
quarter (Chart 3.6). This reflected a number of
factors including increased external demand
from the US, stronger global demand for new
electronic products and a growth pick-up of the
Mainland economy which helped revive the
intra-Asia trade. As for exports of services, a 2.1%
contraction was reported in the third quarter,
followed by a 2.1% growth in the fourth quarter.
The merchanting and other trade-related services
components improved alongside increased trade
flows, while inbound tourism grew faster.
Chart 3.6Exports of goods and services
Source: C&SD.
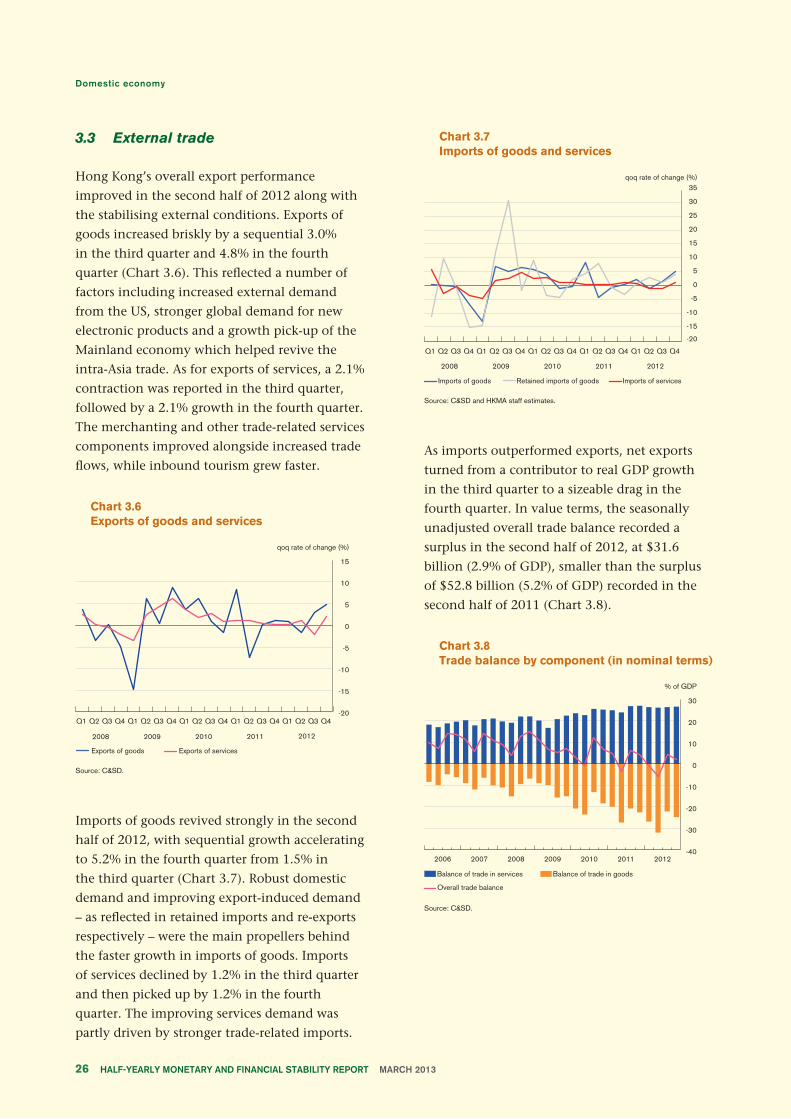
Imports of goods revived strongly in the second
half of 2012, with sequential growth accelerating
to 5.2% in the fourth quarter from 1.5% in
the third quarter (Chart 3.7). Robust domestic
demand and improving export-induced demand
– as reflected in retained imports and re-exports
respectively – were the main propellers behind
the faster growth in imports of goods. Imports
of services declined by 1.2% in the third quarter
and then picked up by 1.2% in the fourth
quarter. The improving services demand was
partly driven by stronger trade-related imports.
Chart 3.7Imports of goods and services
Source: C&SD and HKMA staff estimates.
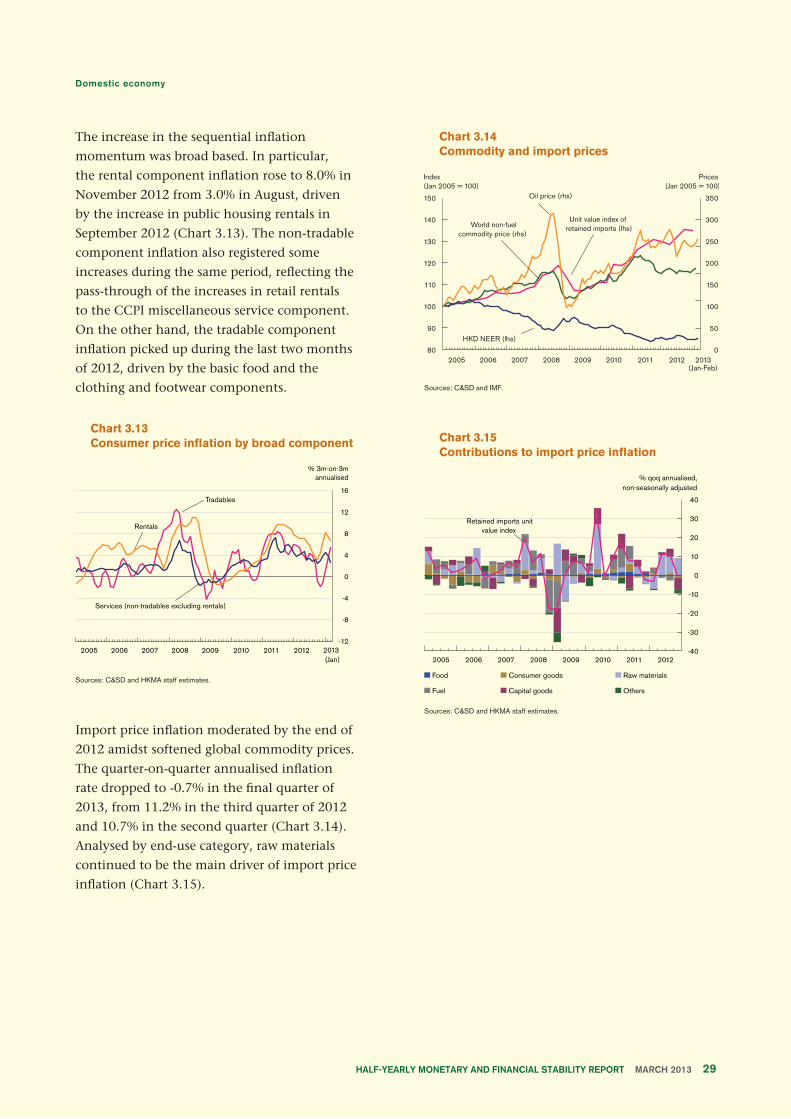
As imports outperformed exports, net exports
turned from a contributor to real GDP growth
in the third quarter to a sizeable drag in the
fourth quarter. In value terms, the seasonally
unadjusted overall trade balance recorded a
surplus in the second half of 2012, at $31.6
billion (2.9% of GDP), smaller than the surplus
of $52.8 billion (5.2% of GDP) recorded in the
second half of 2011 (Chart 3.8).
Chart 3.8Trade balance by component (in nominal terms)
Source: C&SD.
Page 26
Despite positive developments in recent months,
the prospects for a sustained recovery in Hong
Kong’s exports remain subject to uncertainty.
The lingering weakness of the European
economies, together with a sluggish recovery in
the US, can pose some downside risks to Hong
Kong’s exports. Reflecting this, the latest QBTS
and the HKTDC Export Index still pointed to a
negative export outlook. Yet, the strength of the
Mainland economy and its flow-on effects on
intra-Asia trade are likely to provide some offset.
Market consensus expects merchandise exports
to increase by 8.2% in nominal terms in 2013,
faster than the 5.0% increase in 2012. Overall
services exports will benefit from a revival in
trade-related and transportation services amid
increased trade flows. Inbound tourism and
financial services will also be supportive. In
anticipation of robust domestic demand and
rising export-induced demand, imports of goods
and services are expected to progress steadily.
3.4 Labour market conditions
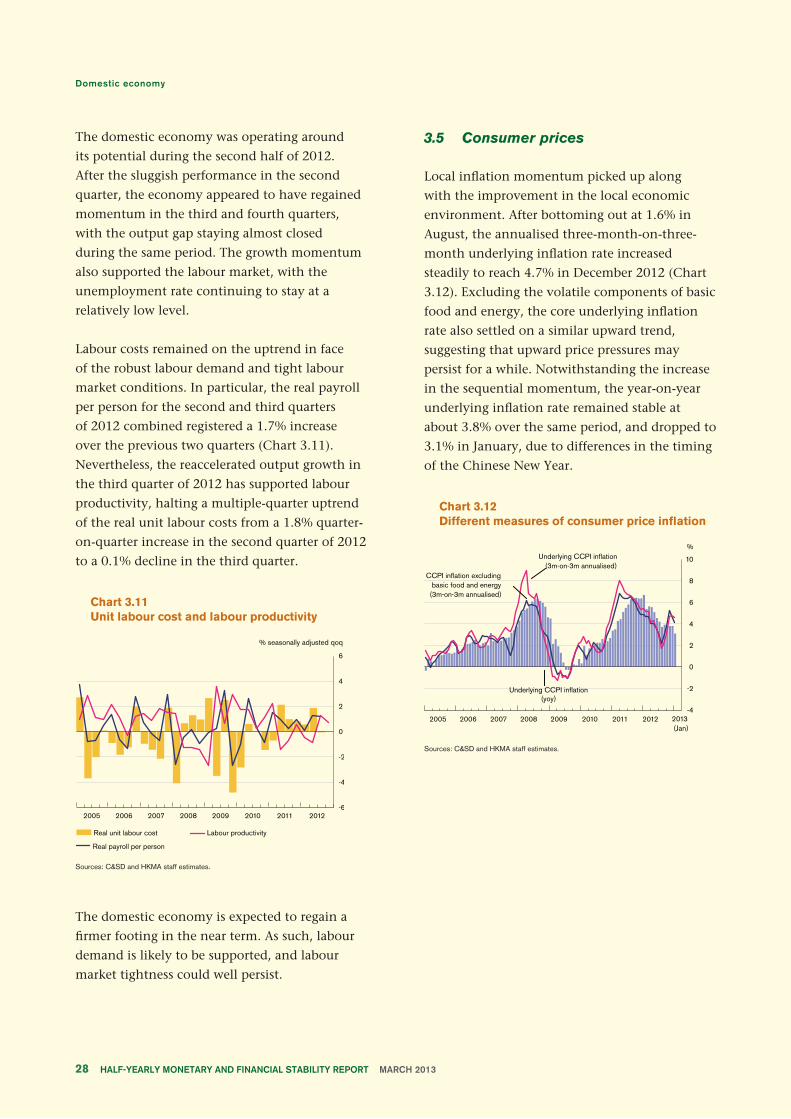
The labour market remained robust in 2012.
The seasonally adjusted three-month moving-
average unemployment rate hovered between
3.2% and 3.4% in the second half of 2012,
staying low at 3.4% in January (Chart 3.9). While
the labour force participation rate edged up
slightly to 60.8% in January 2013, employment
reached a record high of 3.71 million in the
same month. Both higher-skilled and lower-
skilled segments of the labour market were tight,
with the unemployment rate in major sectors,
such as manufacturing, import/export trade and
wholesale, staying at a low level in the period.
Chart 3.9Labour market conditions
Source: C&SD.
In the near term, the labour market will continue
to be supported by the prevailing strength of
domestic demand. The latest QBTS for the first
quarter 2013 shows that respondents from all
surveyed sectors except the export/import sector
expect their employment to increase in the near
term, underscoring the strong hiring sentiment
(Chart 3.10). The outlook of labour demand is
likely to be stable barring any deterioration in
the external environment.
Chart 3.10Quarterly Business Tendency Survey for 2013 Q1: employment
Notes:
1. Net balance refers to the difference between the percentage points of respondents expecting a rise over those expecting a decline.
2. Sectors are classified according to the new Hong Kong Standard Industrial Classification Version 2.0 (HSIC V2.0).
Source: C&SD.
Page 27
The domestic economy was operating around
its potential during the second half of 2012.
After the sluggish performance in the second
quarter, the economy appeared to have regained
momentum in the third and fourth quarters,
with the output gap staying almost closed
during the same period. The growth momentum
also supported the labour market, with the
unemployment rate continuing to stay at a
relatively low level.
Labour costs remained on the uptrend in face
of the robust labour demand and tight labour
market conditions. In particular, the real payroll
per person for the second and third quarters
of 2012 combined registered a 1.7% increase
over the previous two quarters (Chart 3.11).
Nevertheless, the reaccelerated output growth in
the third quarter of 2012 has supported labour
productivity, halting a multiple-quarter uptrend
of the real unit labour costs from a 1.8% quarter-
on-quarter increase in the second quarter of 2012
to a 0.1% decline in the third quarter.
Chart 3.11Unit labour cost and labour productivity
Sources: C&SD and HKMA staff estimates.
The domestic economy is expected to regain a
firmer footing in the near term. As such, labour
demand is likely to be supported, and labour
market tightness could well persist.
3.5 Consumer prices
Local inflation momentum picked up along
with the improvement in the local economic
environment. After bottoming out at 1.6% in
August, the annualised three-month-on-three-
month underlying inflation rate increased
steadily to reach 4.7% in December 2012 (Chart
3.12). Excluding the volatile components of basic
food and energy, the core underlying inflation
rate also settled on a similar upward trend,
suggesting that upward price pressures may
persist for a while. Notwithstanding the increase
in the sequential momentum, the year-on-year
underlying inflation rate remained stable at
about 3.8% over the same period, and dropped to
3.1% in January, due to differences in the timing
of the Chinese New Year.
Chart 3.12Different measures of consumer price inflation
Sources: C&SD and HKMA staff estimates.
Page 28
The increase in the sequential inflation
momentum was broad based. In particular,
the rental component inflation rose to 8.0% in
November 2012 from 3.0% in August, driven
by the increase in public housing rentals in
September 2012 (Chart 3.13). The non-tradable
component inflation also registered some
increases during the same period, reflecting the
pass-through of the increases in retail rentals
to the CCPI miscellaneous service component.
On the other hand, the tradable component
inflation picked up during the last two months
of 2012, driven by the basic food and the
clothing and footwear components.
Chart 3.13Consumer price inflation by broad component
Sources: C&SD and HKMA staff estimates.
Import price inflation moderated by the end of
2012 amidst softened global commodity prices.
The quarter-on-quarter annualised inflation
rate dropped to -0.7% in the final quarter of
2013, from 11.2% in the third quarter of 2012
and 10.7% in the second quarter (Chart 3.14).
Analysed by end-use category, raw materials
continued to be the main driver of import price
inflation (Chart 3.15).
Chart 3.14Commodity and import prices
Sources: C&SD and IMF.
Chart 3.15Contributions to import price inflation
Sources: C&SD and HKMA staff estimates.
Page 29
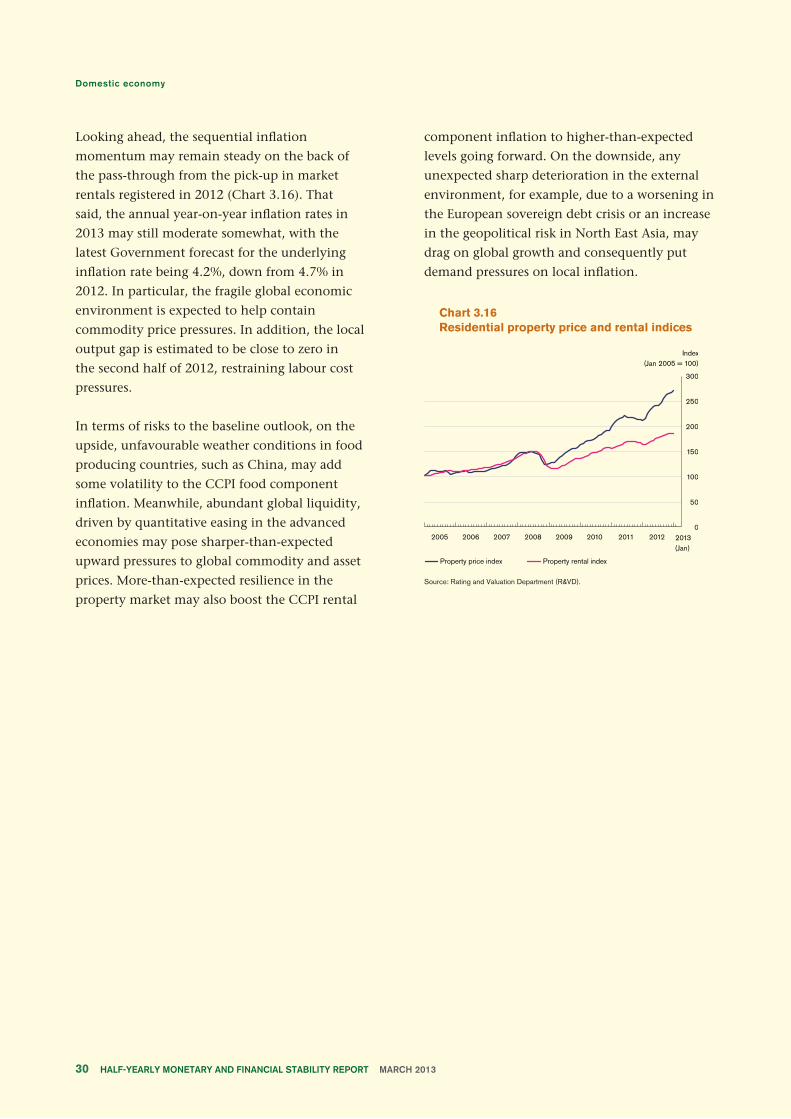
Looking ahead, the sequential inflation
momentum may remain steady on the back of
the pass-through from the pick-up in market
rentals registered in 2012 (Chart 3.16). That
said, the annual year-on-year inflation rates in
2013 may still moderate somewhat, with the
latest Government forecast for the underlying
inflation rate being 4.2%, down from 4.7% in
2012. In particular, the fragile global economic
environment is expected to help contain
commodity price pressures. In addition, the local
output gap is estimated to be close to zero in
the second half of 2012, restraining labour cost
pressures.
In terms of risks to the baseline outlook, on the
upside, unfavourable weather conditions in food
producing countries, such as China, may add
some volatility to the CCPI food component
inflation. Meanwhile, abundant global liquidity,
driven by quantitative easing in the advanced
economies may pose sharper-than-expected
upward pressures to global commodity and asset
prices. More-than-expected resilience in the
property market may also boost the CCPI rental
component inflation to higher-than-expected
levels going forward. On the downside, any
unexpected sharp deterioration in the external
environment, for example, due to a worsening in
the European sovereign debt crisis or an increase
in the geopolitical risk in North East Asia, may
drag on global growth and consequently put
demand pressures on local inflation.
Chart 3.16Residential property price and rental indices
Source: Rating and Valuation Department (R&VD).
Page 30
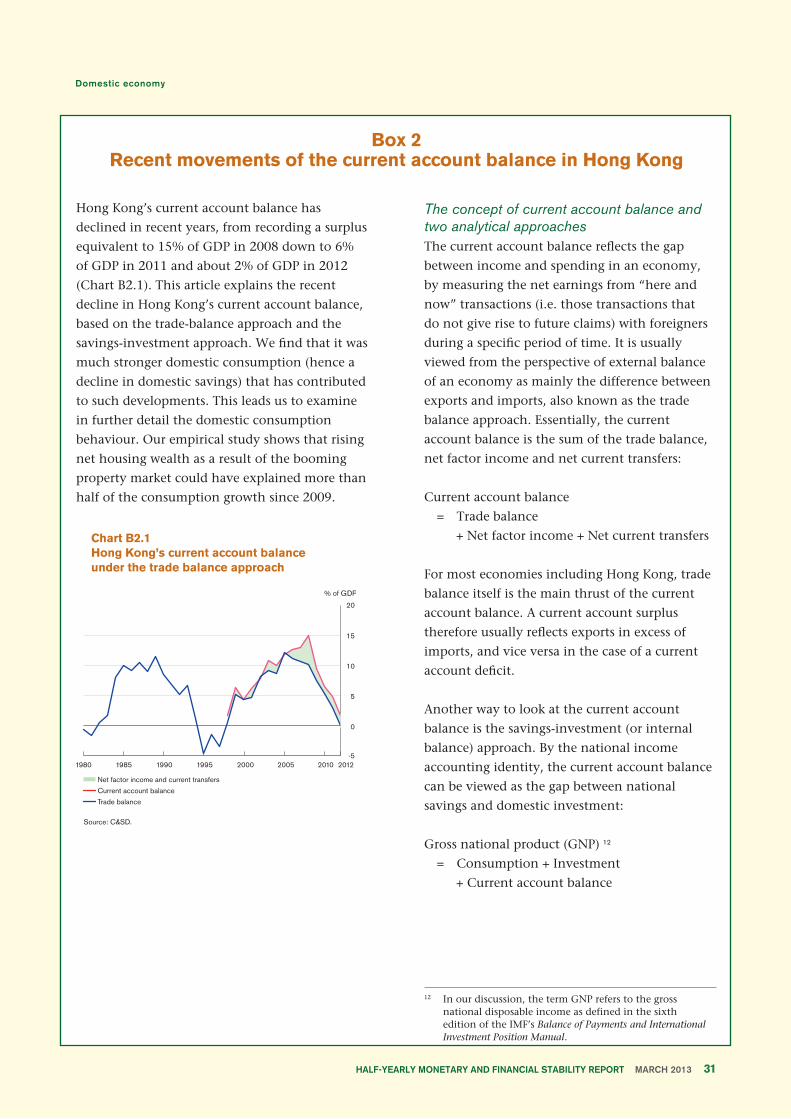
Box 2Recent movements of the current account balance in Hong Kong
Hong Kong’s current account balance has
declined in recent years, from recording a surplus
equivalent to 15% of GDP in 2008 down to 6%
of GDP in 2011 and about 2% of GDP in 2012
(Chart B2.1). This article explains the recent
decline in Hong Kong’s current account balance,
based on the trade-balance approach and the
savings-investment approach. We find that it was
much stronger domestic consumption (hence a
decline in domestic savings) that has contributed
to such developments. This leads us to examine
in further detail the domestic consumption
behaviour. Our empirical study shows that rising
net housing wealth as a result of the booming
property market could have explained more than
half of the consumption growth since 2009.
Chart B2.1Hong Kong’s current account balanceunder the trade balance approach
Source: C&SD.
The concept of current account balance and two analytical approachesThe current account balance reflects the gap
between income and spending in an economy,
by measuring the net earnings from “here and
now” transactions (i.e. those transactions that
do not give rise to future claims) with foreigners
during a specific period of time. It is usually
viewed from the perspective of external balance
of an economy as mainly the difference between
exports and imports, also known as the trade
balance approach. Essentially, the current
account balance is the sum of the trade balance,
net factor income and net current transfers:
Current account balance
= Trade balance
+ Net factor income + Net current transfers
For most economies including Hong Kong, trade
balance itself is the main thrust of the current
account balance. A current account surplus
therefore usually reflects exports in excess of
imports, and vice versa in the case of a current
account deficit.
Another way to look at the current account
balance is the savings-investment (or internal
balance) approach. By the national income
accounting identity, the current account balance
can be viewed as the gap between national
savings and domestic investment:
Gross national product (GNP) 12
= Consumption + Investment
+ Current account balance
Page 31
12 In our discussion, the term GNP refers to the gross national disposable income as defined in the sixth edition of the IMF’s Balance of Payments and International Investment Position Manual.
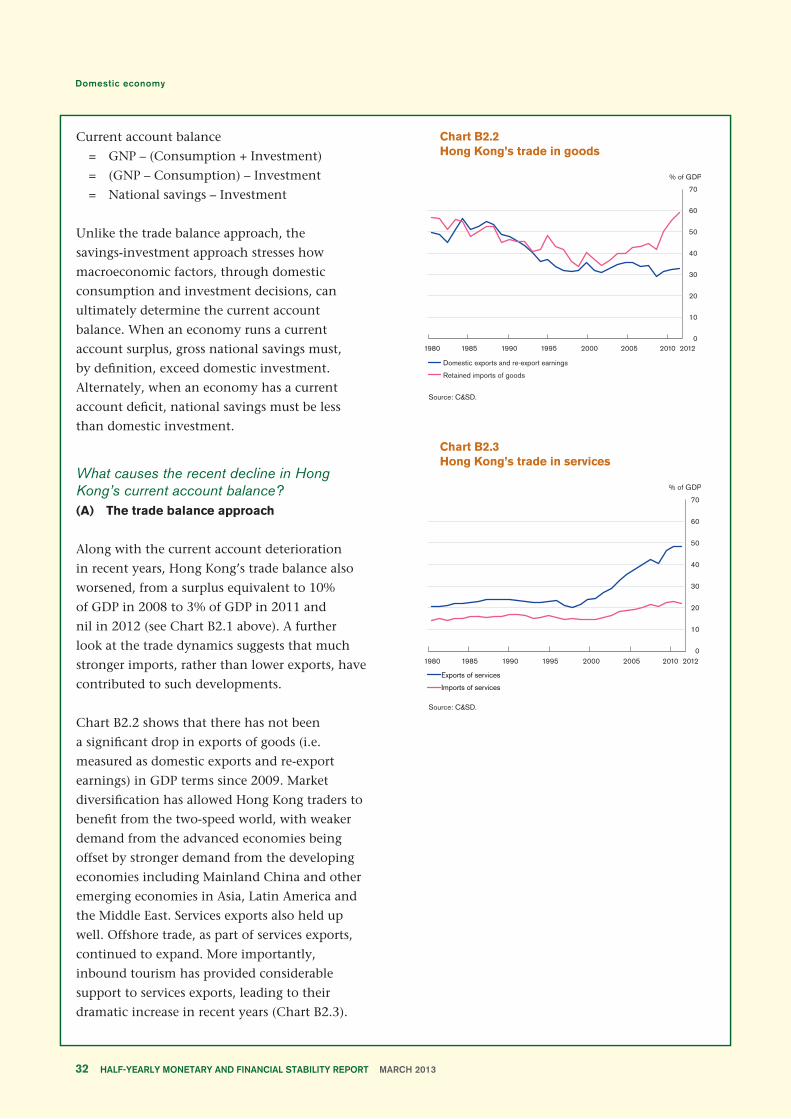
Current account balance
= GNP – (Consumption + Investment)
= (GNP – Consumption) – Investment
= National savings – Investment
Unlike the trade balance approach, the
savings-investment approach stresses how
macroeconomic factors, through domestic
consumption and investment decisions, can
ultimately determine the current account
balance. When an economy runs a current
account surplus, gross national savings must,
by definition, exceed domestic investment.
Alternately, when an economy has a current
account deficit, national savings must be less
than domestic investment.
What causes the recent decline in Hong Kong’s current account balance?(A) The trade balance approach
Along with the current account deterioration
in recent years, Hong Kong’s trade balance also
worsened, from a surplus equivalent to 10%
of GDP in 2008 to 3% of GDP in 2011 and
nil in 2012 (see Chart B2.1 above). A further
look at the trade dynamics suggests that much
stronger imports, rather than lower exports, have
contributed to such developments.
Chart B2.2 shows that there has not been
a significant drop in exports of goods (i.e.
measured as domestic exports and re-export
earnings) in GDP terms since 2009. Market
diversification has allowed Hong Kong traders to
benefit from the two-speed world, with weaker
demand from the advanced economies being
offset by stronger demand from the developing
economies including Mainland China and other
emerging economies in Asia, Latin America and
the Middle East. Services exports also held up
well. Offshore trade, as part of services exports,
continued to expand. More importantly,
inbound tourism has provided considerable
support to services exports, leading to their
dramatic increase in recent years (Chart B2.3).
Chart B2.2Hong Kong’s trade in goods
Source: C&SD.
Chart B2.3Hong Kong’s trade in services
Source: C&SD.
Page 32
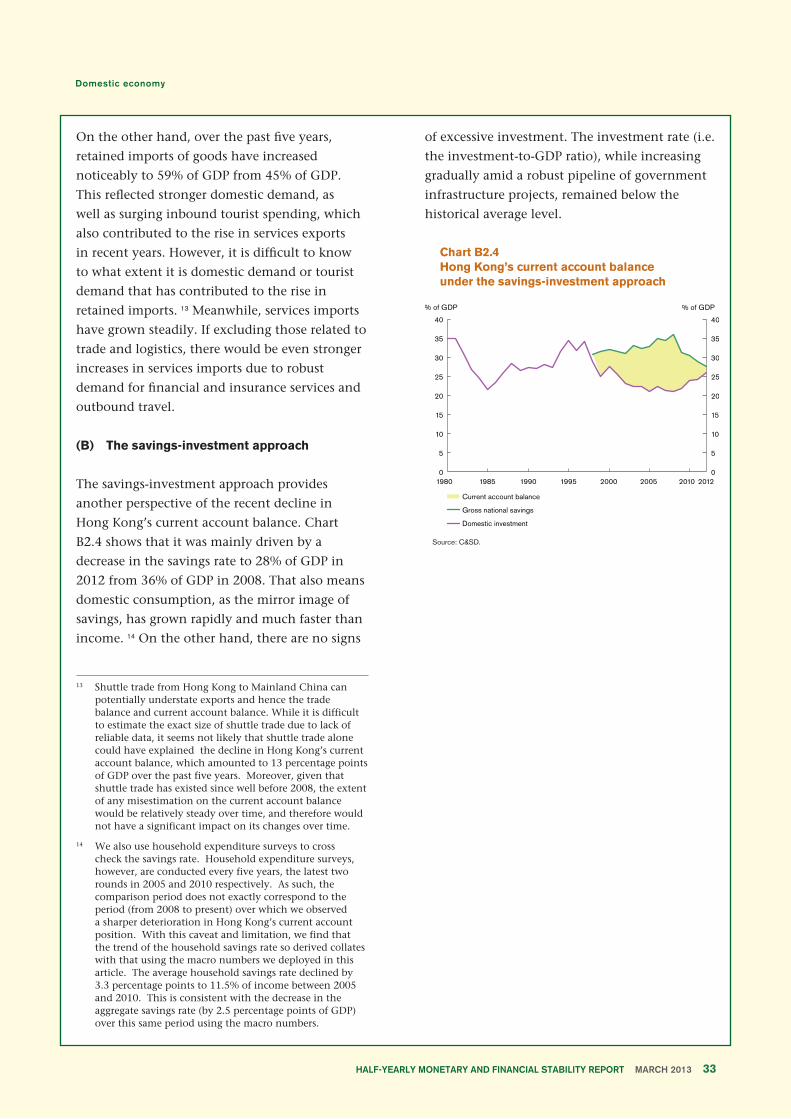
On the other hand, over the past five years,
retained imports of goods have increased
noticeably to 59% of GDP from 45% of GDP.
This reflected stronger domestic demand, as
well as surging inbound tourist spending, which
also contributed to the rise in services exports
in recent years. However, it is difficult to know
to what extent it is domestic demand or tourist
demand that has contributed to the rise in
retained imports. 13 Meanwhile, services imports
have grown steadily. If excluding those related to
trade and logistics, there would be even stronger
increases in services imports due to robust
demand for financial and insurance services and
outbound travel.
(B) The savings-investment approach
The savings-investment approach provides
another perspective of the recent decline in
Hong Kong’s current account balance. Chart
B2.4 shows that it was mainly driven by a
decrease in the savings rate to 28% of GDP in
2012 from 36% of GDP in 2008. That also means
domestic consumption, as the mirror image of
savings, has grown rapidly and much faster than
income. 14 On the other hand, there are no signs
of excessive investment. The investment rate (i.e.
the investment-to-GDP ratio), while increasing
gradually amid a robust pipeline of government
infrastructure projects, remained below the
historical average level.
Chart B2.4Hong Kong’s current account balanceunder the savings-investment approach
Source: C&SD.
Page 33
13 Shuttle trade from Hong Kong to Mainland China can potentially understate exports and hence the trade balance and current account balance. While it is difficult to estimate the exact size of shuttle trade due to lack of reliable data, it seems not likely that shuttle trade alone could have explained the decline in Hong Kong’s current account balance, which amounted to 13 percentage points of GDP over the past five years. Moreover, given that shuttle trade has existed since well before 2008, the extent of any misestimation on the current account balance would be relatively steady over time, and therefore would not have a significant impact on its changes over time.
14 We also use household expenditure surveys to cross check the savings rate. Household expenditure surveys, however, are conducted every five years, the latest two rounds in 2005 and 2010 respectively. As such, the comparison period does not exactly correspond to the period (from 2008 to present) over which we observed a sharper deterioration in Hong Kong’s current account position. With this caveat and limitation, we find that the trend of the household savings rate so derived collates with that using the macro numbers we deployed in this article. The average household savings rate declined by 3.3 percentage points to 11.5% of income between 2005 and 2010. This is consistent with the decrease in the aggregate savings rate (by 2.5 percentage points of GDP) over this same period using the macro numbers.
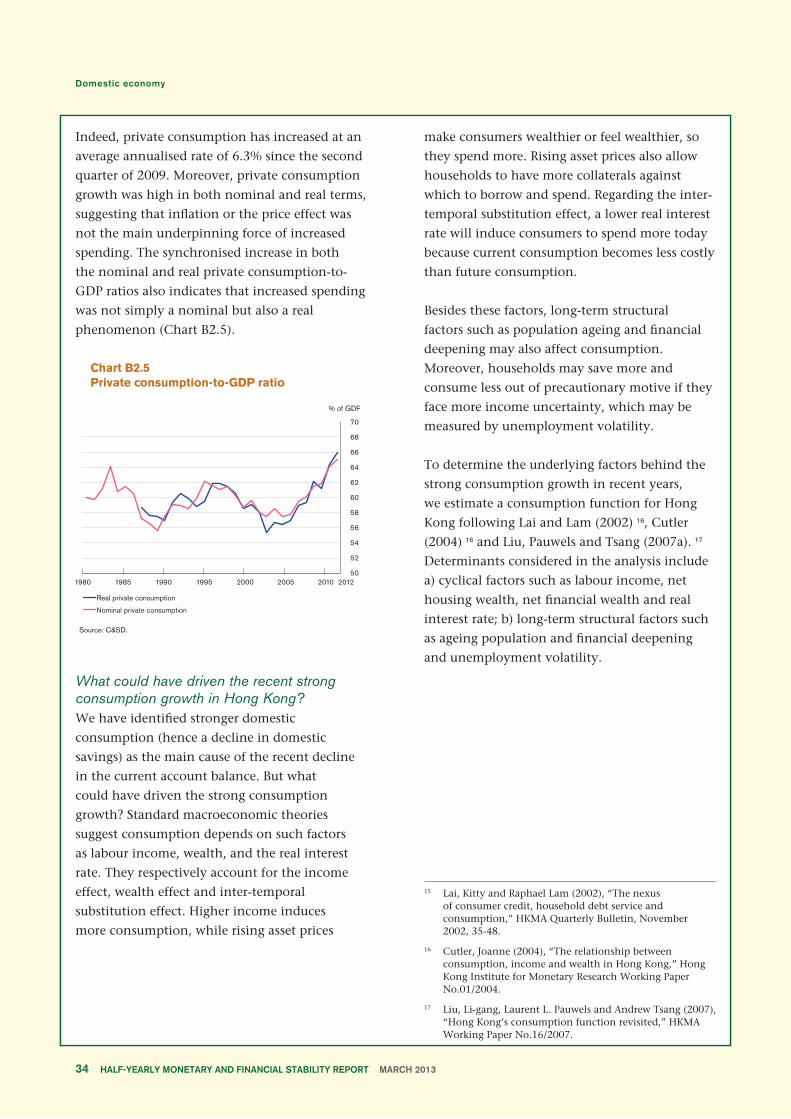
Indeed, private consumption has increased at an
average annualised rate of 6.3% since the second
quarter of 2009. Moreover, private consumption
growth was high in both nominal and real terms,
suggesting that inflation or the price effect was
not the main underpinning force of increased
spending. The synchronised increase in both
the nominal and real private consumption-to-
GDP ratios also indicates that increased spending
was not simply a nominal but also a real
phenomenon (Chart B2.5).
Chart B2.5Private consumption-to-GDP ratio
Source: C&SD.
What could have driven the recent strong consumption growth in Hong Kong?We have identified stronger domestic
consumption (hence a decline in domestic
savings) as the main cause of the recent decline
in the current account balance. But what
could have driven the strong consumption
growth? Standard macroeconomic theories
suggest consumption depends on such factors
as labour income, wealth, and the real interest
rate. They respectively account for the income
effect, wealth effect and inter-temporal
substitution effect. Higher income induces
more consumption, while rising asset prices
make consumers wealthier or feel wealthier, so
they spend more. Rising asset prices also allow
households to have more collaterals against
which to borrow and spend. Regarding the inter-
temporal substitution effect, a lower real interest
rate will induce consumers to spend more today
because current consumption becomes less costly
than future consumption.
Besides these factors, long-term structural
factors such as population ageing and financial
deepening may also affect consumption.
Moreover, households may save more and
consume less out of precautionary motive if they
face more income uncertainty, which may be
measured by unemployment volatility.
To determine the underlying factors behind the
strong consumption growth in recent years,
we estimate a consumption function for Hong
Kong following Lai and Lam (2002) 16, Cutler
(2004) 16 and Liu, Pauwels and Tsang (2007a). 17
Determinants considered in the analysis include
a) cyclical factors such as labour income, net
housing wealth, net financial wealth and real
interest rate; b) long-term structural factors such
as ageing population and financial deepening
and unemployment volatility.
Page 34
15 Lai, Kitty and Raphael Lam (2002), “The nexus of consumer credit, household debt service and consumption,” HKMA Quarterly Bulletin, November 2002, 35-48.
16 Cutler, Joanne (2004), “The relationship between consumption, income and wealth in Hong Kong,” Hong Kong Institute for Monetary Research Working Paper No.01/2004.
17 Liu, Li-gang, Laurent L. Pauwels and Andrew Tsang (2007), “Hong Kong’s consumption function revisited,” HKMA Working Paper No.16/2007.
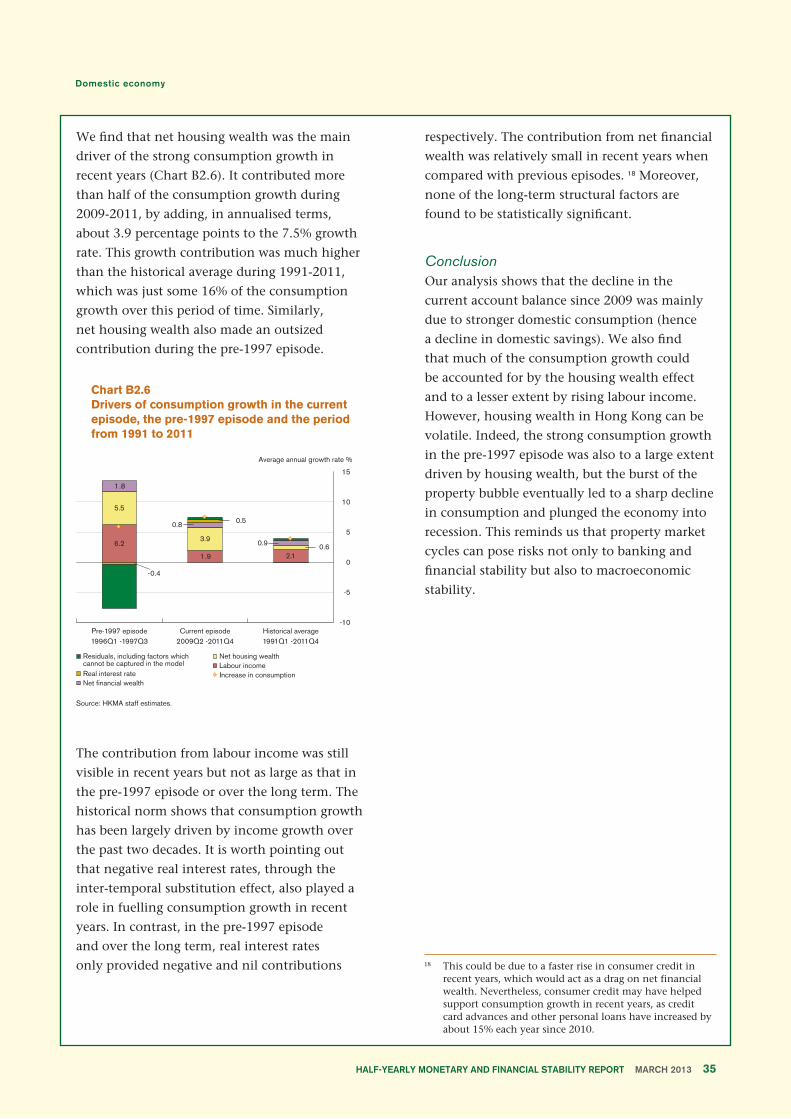
We find that net housing wealth was the main
driver of the strong consumption growth in
recent years (Chart B2.6). It contributed more
than half of the consumption growth during
2009-2011, by adding, in annualised terms,
about 3.9 percentage points to the 7.5% growth
rate. This growth contribution was much higher
than the historical average during 1991-2011,
which was just some 16% of the consumption
growth over this period of time. Similarly,
net housing wealth also made an outsized
contribution during the pre-1997 episode.
Chart B2.6Drivers of consumption growth in the current episode, the pre-1997 episode and the period from 1991 to 2011
Source: HKMA staff estimates.
The contribution from labour income was still
visible in recent years but not as large as that in
the pre-1997 episode or over the long term. The
historical norm shows that consumption growth
has been largely driven by income growth over
the past two decades. It is worth pointing out
that negative real interest rates, through the
inter-temporal substitution effect, also played a
role in fuelling consumption growth in recent
years. In contrast, in the pre-1997 episode
and over the long term, real interest rates
only provided negative and nil contributions
respectively. The contribution from net financial
wealth was relatively small in recent years when
compared with previous episodes. 18 Moreover,
none of the long-term structural factors are
found to be statistically significant.
ConclusionOur analysis shows that the decline in the
current account balance since 2009 was mainly
due to stronger domestic consumption (hence
a decline in domestic savings). We also find
that much of the consumption growth could
be accounted for by the housing wealth effect
and to a lesser extent by rising labour income.
However, housing wealth in Hong Kong can be
volatile. Indeed, the strong consumption growth
in the pre-1997 episode was also to a large extent
driven by housing wealth, but the burst of the
property bubble eventually led to a sharp decline
in consumption and plunged the economy into
recession. This reminds us that property market
cycles can pose risks not only to banking and
financial stability but also to macroeconomic
stability.
Page 35
18 This could be due to a faster rise in consumer credit in recent years, which would act as a drag on net financial wealth. Nevertheless, consumer credit may have helped support consumption growth in recent years, as credit card advances and other personal loans have increased by about 15% each year since 2010.
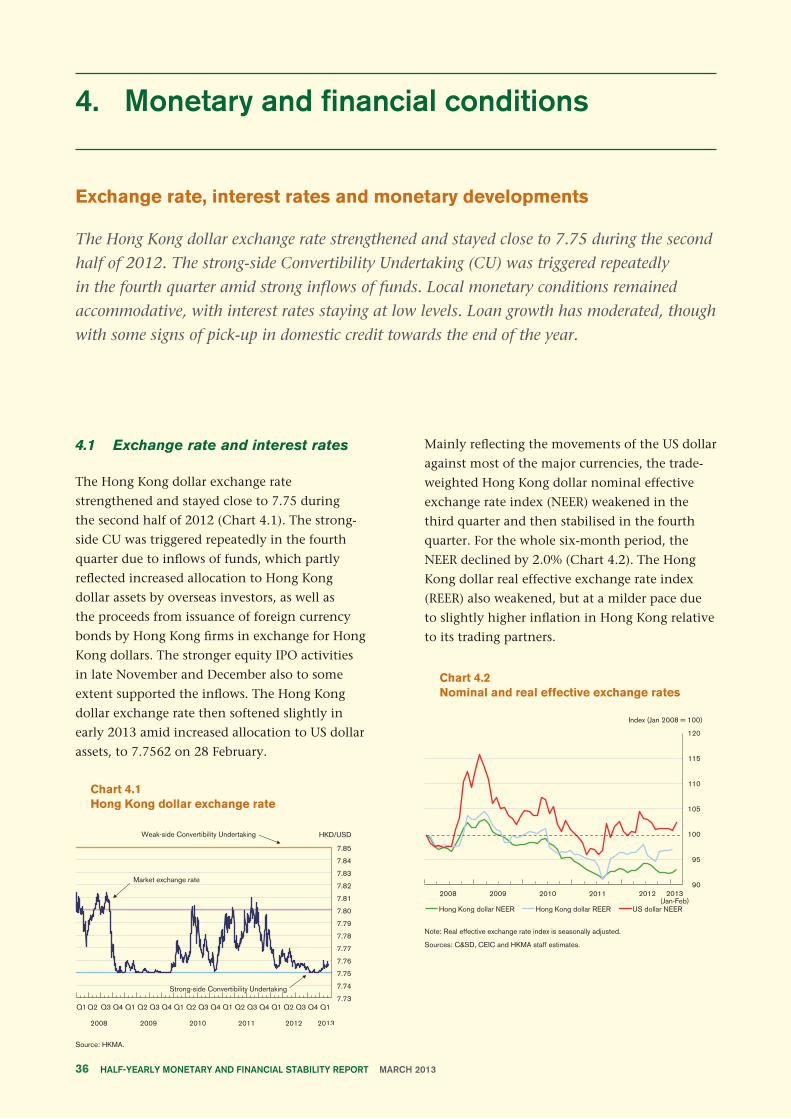
4. Monetary and financial conditions
Exchange rate, interest rates and monetary developments
The Hong Kong dollar exchange rate strengthened and stayed close to 7.75 during the second
half of 2012. The strong-side Convertibility Undertaking (CU) was triggered repeatedly
in the fourth quarter amid strong inflows of funds. Local monetary conditions remained
accommodative, with interest rates staying at low levels. Loan growth has moderated, though
with some signs of pick-up in domestic credit towards the end of the year.
4.1 Exchange rate and interest rates
The Hong Kong dollar exchange rate
strengthened and stayed close to 7.75 during
the second half of 2012 (Chart 4.1). The strong-
side CU was triggered repeatedly in the fourth
quarter due to inflows of funds, which partly
reflected increased allocation to Hong Kong
dollar assets by overseas investors, as well as
the proceeds from issuance of foreign currency
bonds by Hong Kong firms in exchange for Hong
Kong dollars. The stronger equity IPO activities
in late November and December also to some
extent supported the inflows. The Hong Kong
dollar exchange rate then softened slightly in
early 2013 amid increased allocation to US dollar
assets, to 7.7562 on 28 February.
Chart 4.1Hong Kong dollar exchange rate
Source: HKMA.
Mainly reflecting the movements of the US dollar
against most of the major currencies, the trade-
weighted Hong Kong dollar nominal effective
exchange rate index (NEER) weakened in the
third quarter and then stabilised in the fourth
quarter. For the whole six-month period, the
NEER declined by 2.0% (Chart 4.2). The Hong
Kong dollar real effective exchange rate index
(REER) also weakened, but at a milder pace due
to slightly higher inflation in Hong Kong relative
to its trading partners.
Chart 4.2Nominal and real effective exchange rates
Note: Real effective exchange rate index is seasonally adjusted.
Sources: C&SD, CEIC and HKMA staff estimates.
Page 36
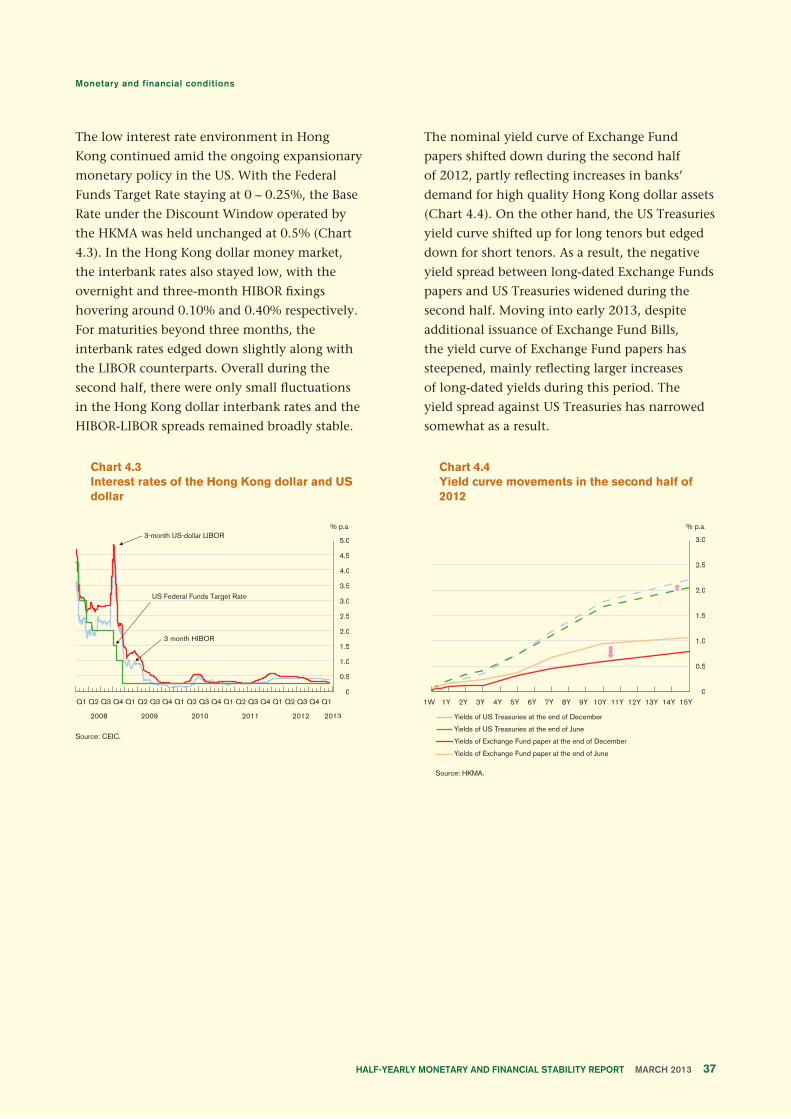
The low interest rate environment in Hong
Kong continued amid the ongoing expansionary
monetary policy in the US. With the Federal
Funds Target Rate staying at 0 – 0.25%, the Base
Rate under the Discount Window operated by
the HKMA was held unchanged at 0.5% (Chart
4.3). In the Hong Kong dollar money market,
the interbank rates also stayed low, with the
overnight and three-month HIBOR fixings
hovering around 0.10% and 0.40% respectively.
For maturities beyond three months, the
interbank rates edged down slightly along with
the LIBOR counterparts. Overall during the
second half, there were only small fluctuations
in the Hong Kong dollar interbank rates and the
HIBOR-LIBOR spreads remained broadly stable.
Chart 4.3Interest rates of the Hong Kong dollar and US dollar
Source: CEIC.
The nominal yield curve of Exchange Fund
papers shifted down during the second half
of 2012, partly reflecting increases in banks’
demand for high quality Hong Kong dollar assets
(Chart 4.4). On the other hand, the US Treasuries
yield curve shifted up for long tenors but edged
down for short tenors. As a result, the negative
yield spread between long-dated Exchange Funds
papers and US Treasuries widened during the
second half. Moving into early 2013, despite
additional issuance of Exchange Fund Bills,
the yield curve of Exchange Fund papers has
steepened, mainly reflecting larger increases
of long-dated yields during this period. The
yield spread against US Treasuries has narrowed
somewhat as a result.
Chart 4.4Yield curve movements in the second half of 2012
Source: HKMA.
Page 37
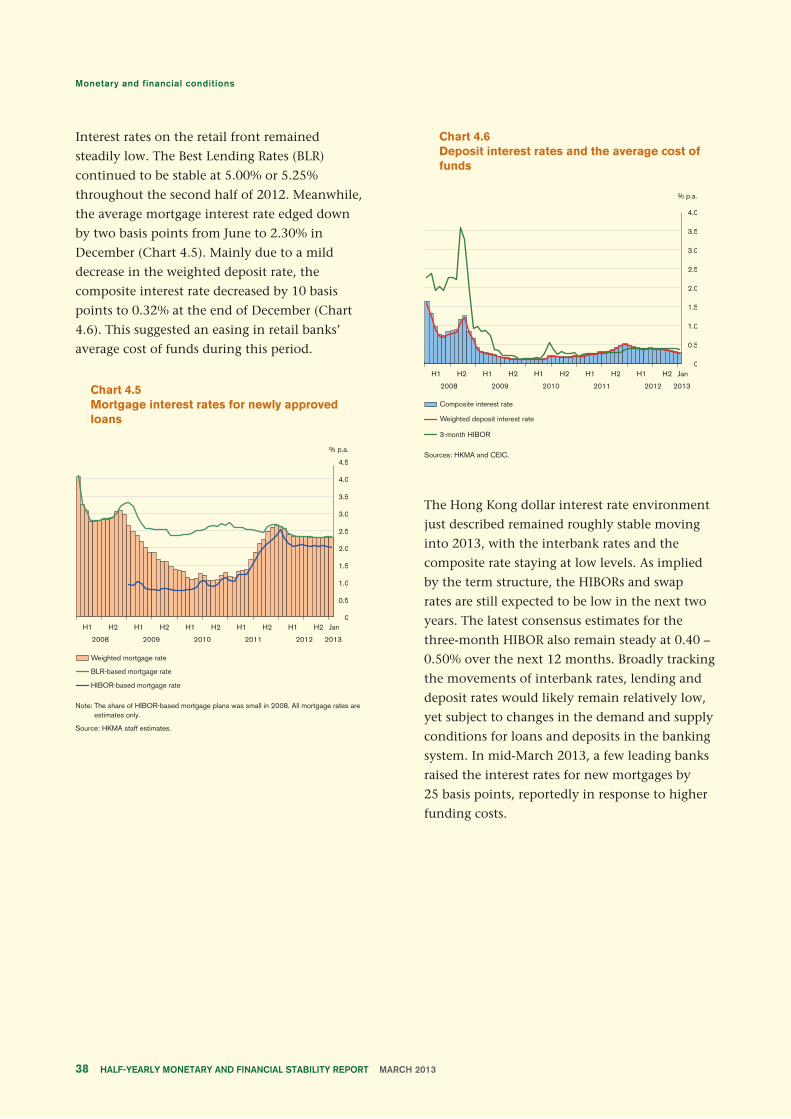
Interest rates on the retail front remained
steadily low. The Best Lending Rates (BLR)
continued to be stable at 5.00% or 5.25%
throughout the second half of 2012. Meanwhile,
the average mortgage interest rate edged down
by two basis points from June to 2.30% in
December (Chart 4.5). Mainly due to a mild
decrease in the weighted deposit rate, the
composite interest rate decreased by 10 basis
points to 0.32% at the end of December (Chart
4.6). This suggested an easing in retail banks’
average cost of funds during this period.
Chart 4.5Mortgage interest rates for newly approved loans
Note: The share of HIBOR-based mortgage plans was small in 2008. All mortgage rates are estimates only.
Source: HKMA staff estimates.
Chart 4.6Deposit interest rates and the average cost of funds
Sources: HKMA and CEIC.
The Hong Kong dollar interest rate environment
just described remained roughly stable moving
into 2013, with the interbank rates and the
composite rate staying at low levels. As implied
by the term structure, the HIBORs and swap
rates are still expected to be low in the next two
years. The latest consensus estimates for the
three-month HIBOR also remain steady at 0.40 –
0.50% over the next 12 months. Broadly tracking
the movements of interbank rates, lending and
deposit rates would likely remain relatively low,
yet subject to changes in the demand and supply
conditions for loans and deposits in the banking
system. In mid-March 2013, a few leading banks
raised the interest rates for new mortgages by
25 basis points, reportedly in response to higher
funding costs.
Page 38
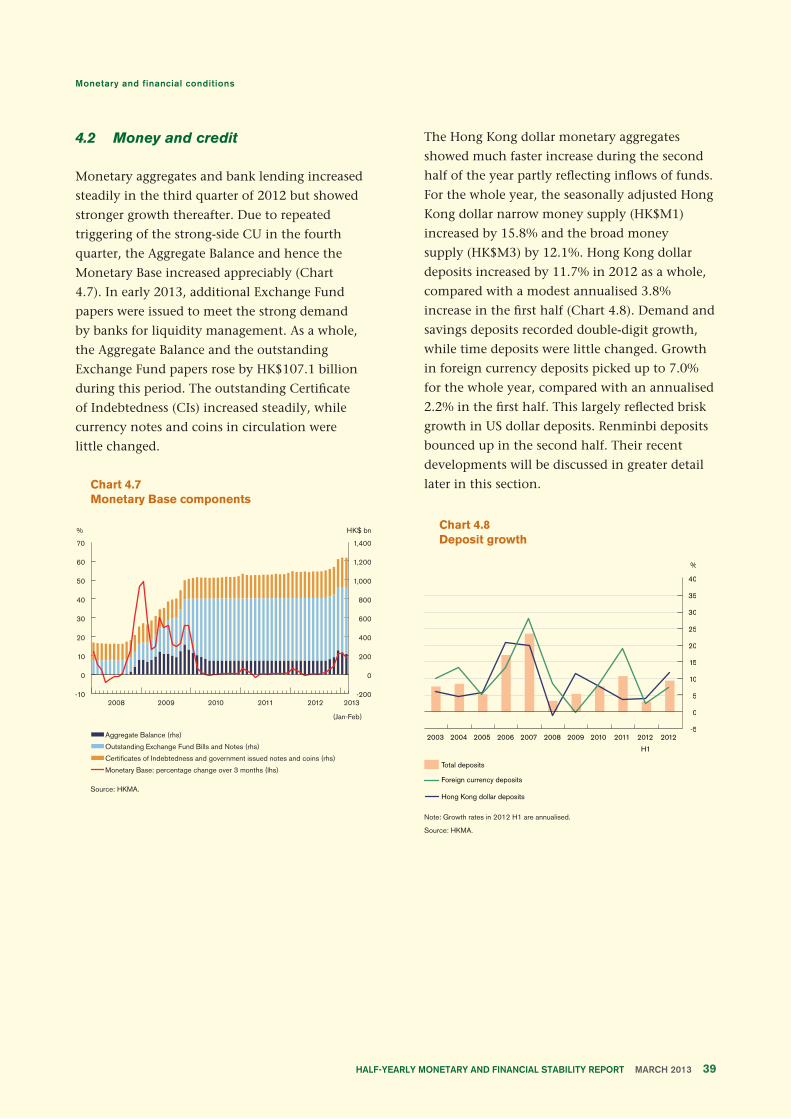
4.2 Money and credit
Monetary aggregates and bank lending increased
steadily in the third quarter of 2012 but showed
stronger growth thereafter. Due to repeated
triggering of the strong-side CU in the fourth
quarter, the Aggregate Balance and hence the
Monetary Base increased appreciably (Chart
4.7). In early 2013, additional Exchange Fund
papers were issued to meet the strong demand
by banks for liquidity management. As a whole,
the Aggregate Balance and the outstanding
Exchange Fund papers rose by HK$107.1 billion
during this period. The outstanding Certificate
of Indebtedness (CIs) increased steadily, while
currency notes and coins in circulation were
little changed.
Chart 4.7Monetary Base components
Source: HKMA.
The Hong Kong dollar monetary aggregates
showed much faster increase during the second
half of the year partly reflecting inflows of funds.
For the whole year, the seasonally adjusted Hong
Kong dollar narrow money supply (HK$M1)
increased by 15.8% and the broad money
supply (HK$M3) by 12.1%. Hong Kong dollar
deposits increased by 11.7% in 2012 as a whole,
compared with a modest annualised 3.8%
increase in the first half (Chart 4.8). Demand and
savings deposits recorded double-digit growth,
while time deposits were little changed. Growth
in foreign currency deposits picked up to 7.0%
for the whole year, compared with an annualised
2.2% in the first half. This largely reflected brisk
growth in US dollar deposits. Renminbi deposits
bounced up in the second half. Their recent
developments will be discussed in greater detail
later in this section.
Chart 4.8Deposit growth
Note: Growth rates in 2012 H1 are annualised.
Source: HKMA.
Page 39
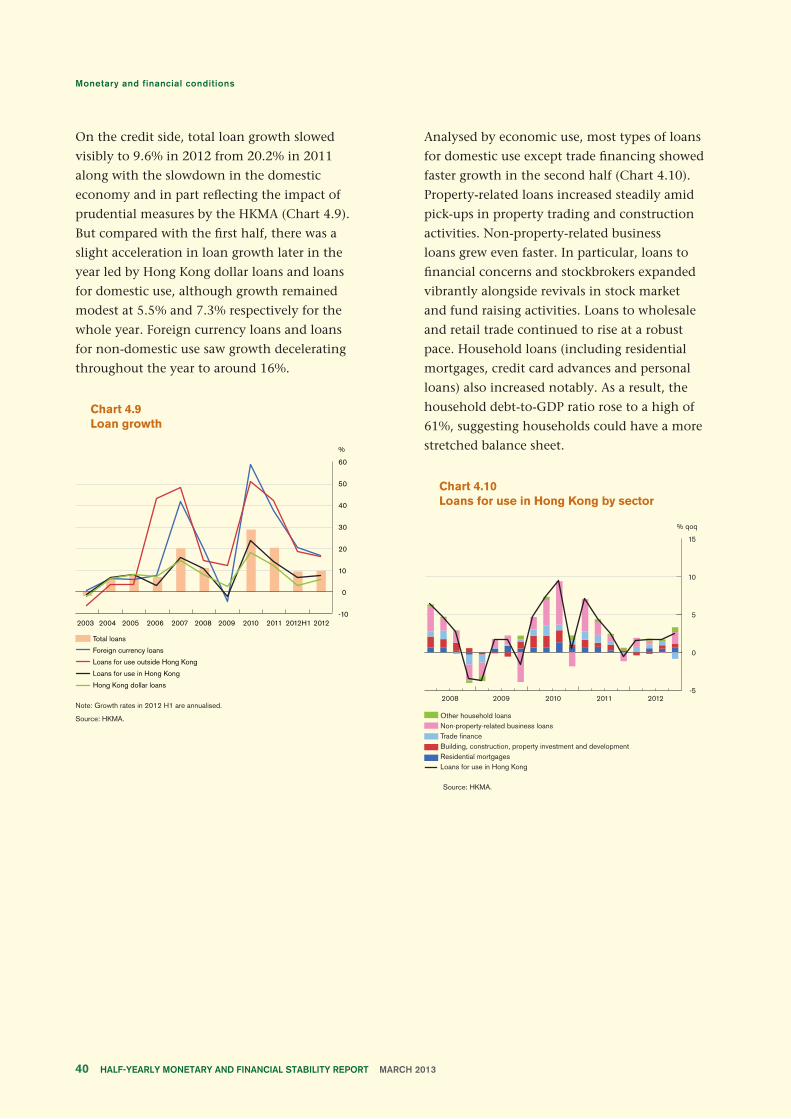
On the credit side, total loan growth slowed
visibly to 9.6% in 2012 from 20.2% in 2011
along with the slowdown in the domestic
economy and in part reflecting the impact of
prudential measures by the HKMA (Chart 4.9).
But compared with the first half, there was a
slight acceleration in loan growth later in the
year led by Hong Kong dollar loans and loans
for domestic use, although growth remained
modest at 5.5% and 7.3% respectively for the
whole year. Foreign currency loans and loans
for non-domestic use saw growth decelerating
throughout the year to around 16%.
Chart 4.9Loan growth
Note: Growth rates in 2012 H1 are annualised.
Source: HKMA.
Analysed by economic use, most types of loans
for domestic use except trade financing showed
faster growth in the second half (Chart 4.10).
Property-related loans increased steadily amid
pick-ups in property trading and construction
activities. Non-property-related business
loans grew even faster. In particular, loans to
financial concerns and stockbrokers expanded
vibrantly alongside revivals in stock market
and fund raising activities. Loans to wholesale
and retail trade continued to rise at a robust
pace. Household loans (including residential
mortgages, credit card advances and personal
loans) also increased notably. As a result, the
household debt-to-GDP ratio rose to a high of
61%, suggesting households could have a more
stretched balance sheet.
Chart 4.10Loans for use in Hong Kong by sector
Source: HKMA.
Page 40
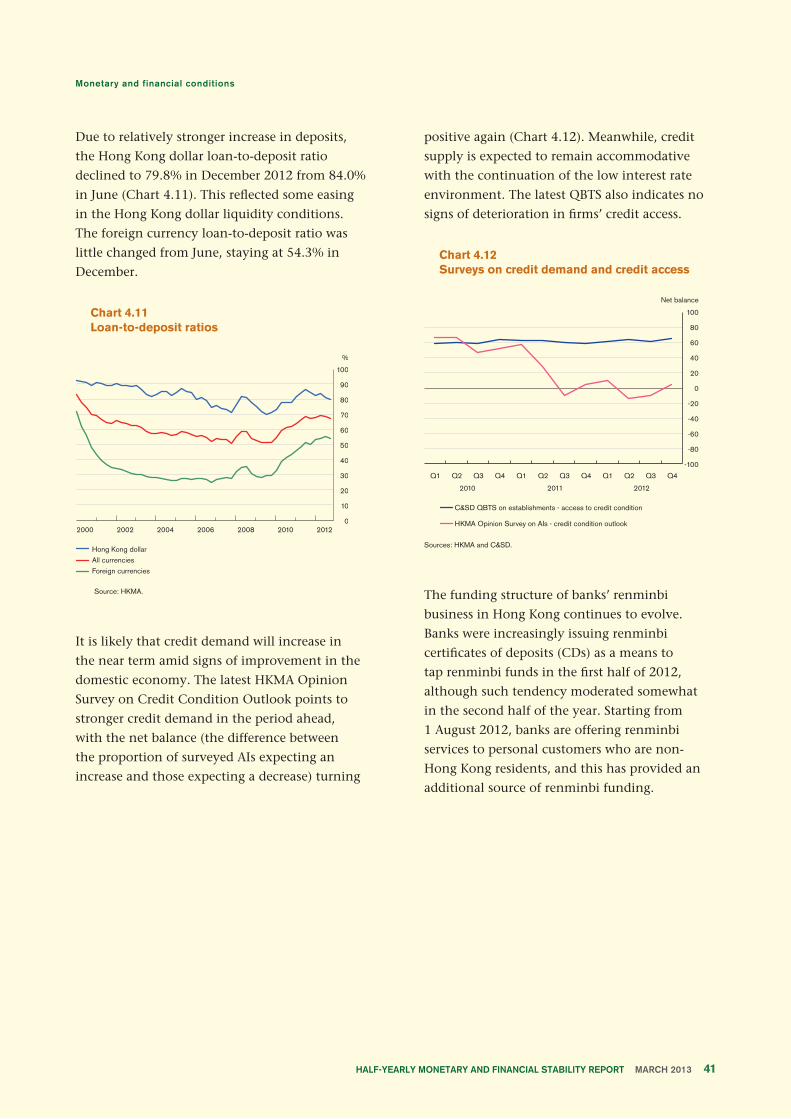
Due to relatively stronger increase in deposits,
the Hong Kong dollar loan-to-deposit ratio
declined to 79.8% in December 2012 from 84.0%
in June (Chart 4.11). This reflected some easing
in the Hong Kong dollar liquidity conditions.
The foreign currency loan-to-deposit ratio was
little changed from June, staying at 54.3% in
December.
Chart 4.11Loan-to-deposit ratios
Source: HKMA.
It is likely that credit demand will increase in
the near term amid signs of improvement in the
domestic economy. The latest HKMA Opinion
Survey on Credit Condition Outlook points to
stronger credit demand in the period ahead,
with the net balance (the difference between
the proportion of surveyed AIs expecting an
increase and those expecting a decrease) turning
positive again (Chart 4.12). Meanwhile, credit
supply is expected to remain accommodative
with the continuation of the low interest rate
environment. The latest QBTS also indicates no
signs of deterioration in firms’ credit access.
Chart 4.12Surveys on credit demand and credit access
Sources: HKMA and C&SD.
The funding structure of banks’ renminbi
business in Hong Kong continues to evolve.
Banks were increasingly issuing renminbi
certificates of deposits (CDs) as a means to
tap renminbi funds in the first half of 2012,
although such tendency moderated somewhat
in the second half of the year. Starting from
1 August 2012, banks are offering renminbi
services to personal customers who are non-
Hong Kong residents, and this has provided an
additional source of renminbi funding.
Page 41
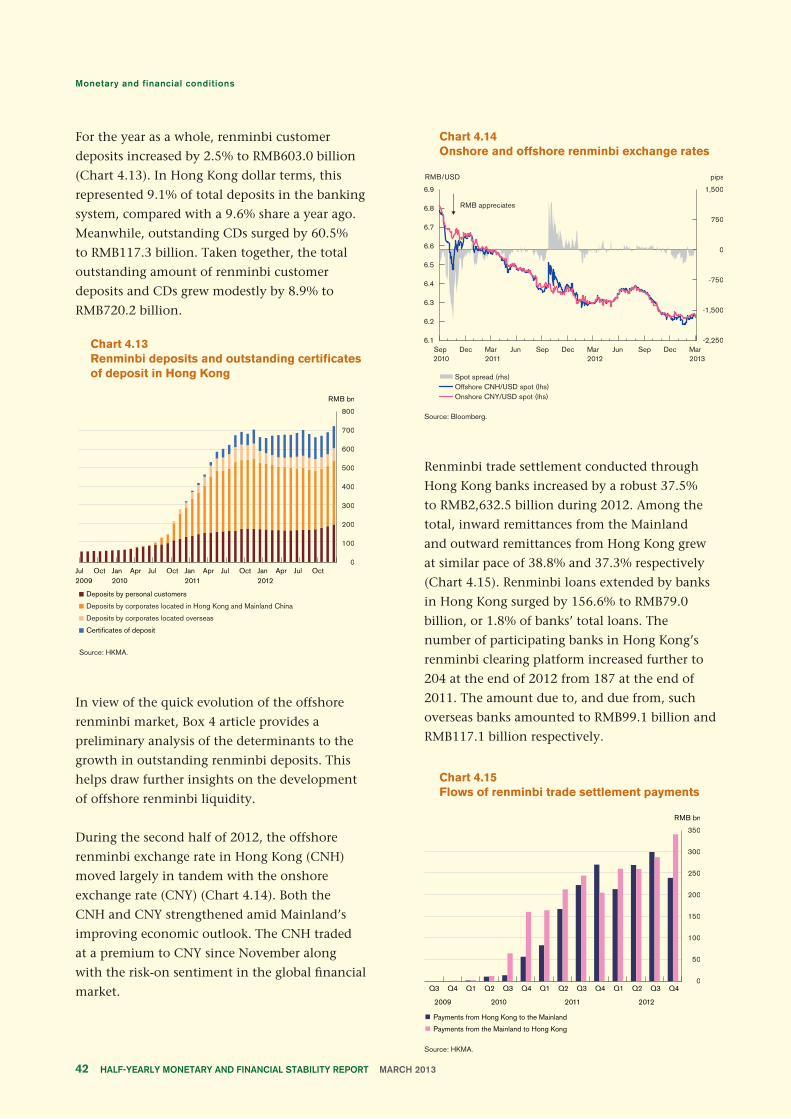
For the year as a whole, renminbi customer
deposits increased by 2.5% to RMB603.0 billion
(Chart 4.13). In Hong Kong dollar terms, this
represented 9.1% of total deposits in the banking
system, compared with a 9.6% share a year ago.
Meanwhile, outstanding CDs surged by 60.5%
to RMB117.3 billion. Taken together, the total
outstanding amount of renminbi customer
deposits and CDs grew modestly by 8.9% to
RMB720.2 billion.
Chart 4.13Renminbi deposits and outstanding certificates of deposit in Hong Kong
Source: HKMA.
In view of the quick evolution of the offshore
renminbi market, Box 4 article provides a
preliminary analysis of the determinants to the
growth in outstanding renminbi deposits. This
helps draw further insights on the development
of offshore renminbi liquidity.
During the second half of 2012, the offshore
renminbi exchange rate in Hong Kong (CNH)
moved largely in tandem with the onshore
exchange rate (CNY) (Chart 4.14). Both the
CNH and CNY strengthened amid Mainland’s
improving economic outlook. The CNH traded
at a premium to CNY since November along
with the risk-on sentiment in the global financial
market.
Chart 4.14Onshore and offshore renminbi exchange rates
Source: Bloomberg.
Renminbi trade settlement conducted through
Hong Kong banks increased by a robust 37.5%
to RMB2,632.5 billion during 2012. Among the
total, inward remittances from the Mainland
and outward remittances from Hong Kong grew
at similar pace of 38.8% and 37.3% respectively
(Chart 4.15). Renminbi loans extended by banks
in Hong Kong surged by 156.6% to RMB79.0
billion, or 1.8% of banks’ total loans. The
number of participating banks in Hong Kong’s
renminbi clearing platform increased further to
204 at the end of 2012 from 187 at the end of
2011. The amount due to, and due from, such
overseas banks amounted to RMB99.1 billion and
RMB117.1 billion respectively.
Chart 4.15Flows of renminbi trade settlement payments
Source: HKMA.
Page 42
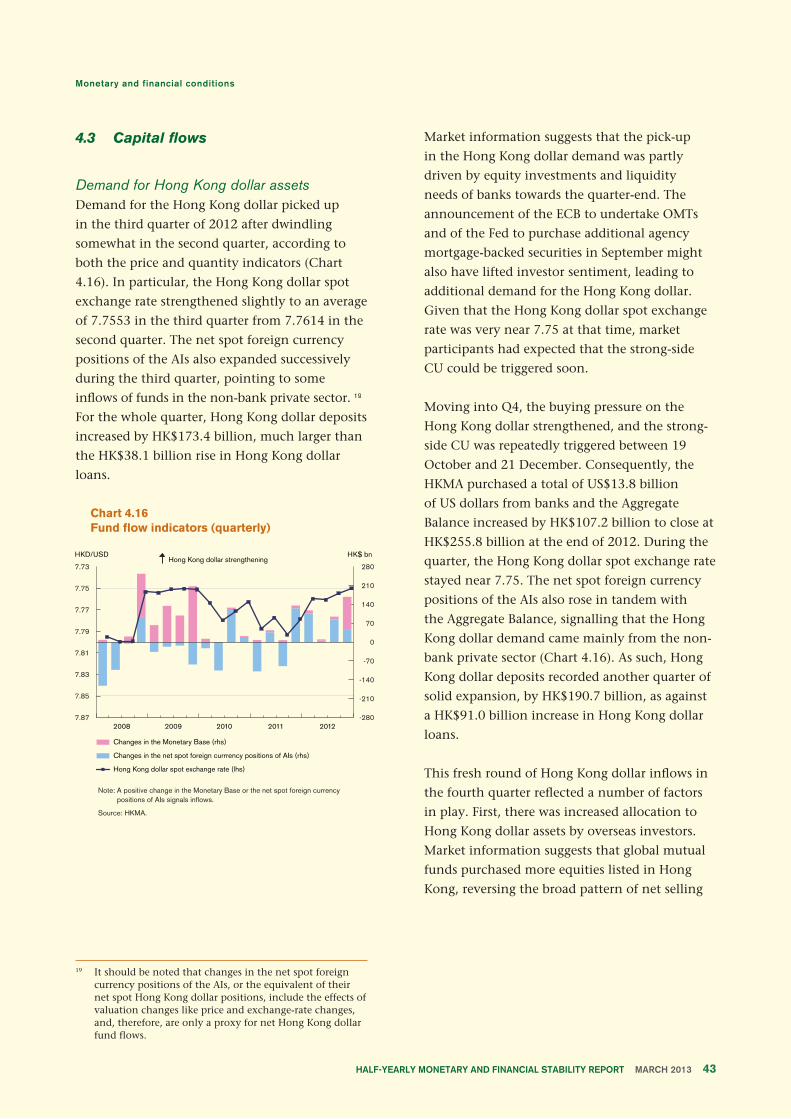
4.3 Capital flows
Demand for Hong Kong dollar assetsDemand for the Hong Kong dollar picked up
in the third quarter of 2012 after dwindling
somewhat in the second quarter, according to
both the price and quantity indicators (Chart
4.16). In particular, the Hong Kong dollar spot
exchange rate strengthened slightly to an average
of 7.7553 in the third quarter from 7.7614 in the
second quarter. The net spot foreign currency
positions of the AIs also expanded successively
during the third quarter, pointing to some
inflows of funds in the non-bank private sector. 19
For the whole quarter, Hong Kong dollar deposits
increased by HK$173.4 billion, much larger than
the HK$38.1 billion rise in Hong Kong dollar
loans.
Chart 4.16Fund flow indicators (quarterly)
Note: A positive change in the Monetary Base or the net spot foreign currency positions of AIs signals inflows.
Source: HKMA.
Market information suggests that the pick-up
in the Hong Kong dollar demand was partly
driven by equity investments and liquidity
needs of banks towards the quarter-end. The
announcement of the ECB to undertake OMTs
and of the Fed to purchase additional agency
mortgage-backed securities in September might
also have lifted investor sentiment, leading to
additional demand for the Hong Kong dollar.
Given that the Hong Kong dollar spot exchange
rate was very near 7.75 at that time, market
participants had expected that the strong-side
CU could be triggered soon.
Moving into Q4, the buying pressure on the
Hong Kong dollar strengthened, and the strong-
side CU was repeatedly triggered between 19
October and 21 December. Consequently, the
HKMA purchased a total of US$13.8 billion
of US dollars from banks and the Aggregate
Balance increased by HK$107.2 billion to close at
HK$255.8 billion at the end of 2012. During the
quarter, the Hong Kong dollar spot exchange rate
stayed near 7.75. The net spot foreign currency
positions of the AIs also rose in tandem with
the Aggregate Balance, signalling that the Hong
Kong dollar demand came mainly from the non-
bank private sector (Chart 4.16). As such, Hong
Kong dollar deposits recorded another quarter of
solid expansion, by HK$190.7 billion, as against
a HK$91.0 billion increase in Hong Kong dollar
loans.
This fresh round of Hong Kong dollar inflows in
the fourth quarter reflected a number of factors
in play. First, there was increased allocation to
Hong Kong dollar assets by overseas investors.
Market information suggests that global mutual
funds purchased more equities listed in Hong
Kong, reversing the broad pattern of net selling
19 It should be noted that changes in the net spot foreign currency positions of the AIs, or the equivalent of their net spot Hong Kong dollar positions, include the effects of valuation changes like price and exchange-rate changes, and, therefore, are only a proxy for net Hong Kong dollar fund flows.
Page 43
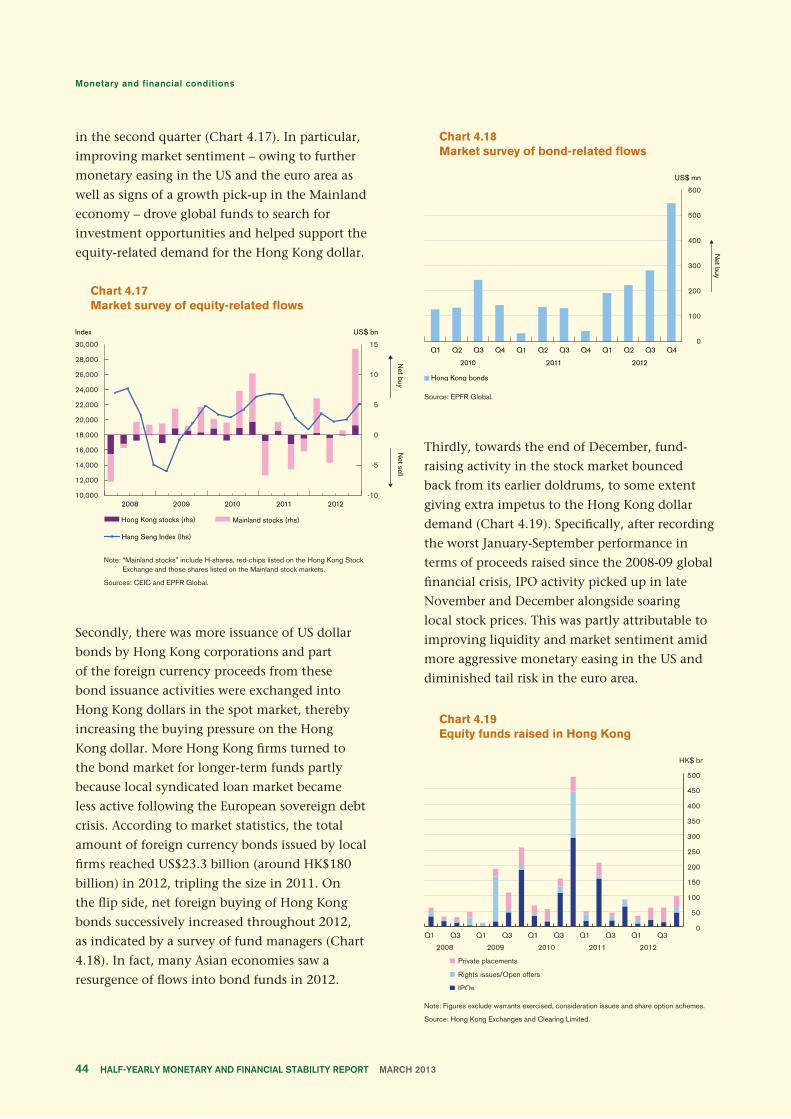
in the second quarter (Chart 4.17). In particular,
improving market sentiment – owing to further
monetary easing in the US and the euro area as
well as signs of a growth pick-up in the Mainland
economy – drove global funds to search for
investment opportunities and helped support the
equity-related demand for the Hong Kong dollar.
Chart 4.17Market survey of equity-related flows
Note: “Mainland stocks” include H-shares, red-chips listed on the Hong Kong Stock Exchange and those shares listed on the Mainland stock markets.
Sources: CEIC and EPFR Global.
Secondly, there was more issuance of US dollar
bonds by Hong Kong corporations and part
of the foreign currency proceeds from these
bond issuance activities were exchanged into
Hong Kong dollars in the spot market, thereby
increasing the buying pressure on the Hong
Kong dollar. More Hong Kong firms turned to
the bond market for longer-term funds partly
because local syndicated loan market became
less active following the European sovereign debt
crisis. According to market statistics, the total
amount of foreign currency bonds issued by local
firms reached US$23.3 billion (around HK$180
billion) in 2012, tripling the size in 2011. On
the flip side, net foreign buying of Hong Kong
bonds successively increased throughout 2012,
as indicated by a survey of fund managers (Chart
4.18). In fact, many Asian economies saw a
resurgence of flows into bond funds in 2012.
Chart 4.18Market survey of bond-related flows
Source: EPFR Global.
Thirdly, towards the end of December, fund-
raising activity in the stock market bounced
back from its earlier doldrums, to some extent
giving extra impetus to the Hong Kong dollar
demand (Chart 4.19). Specifically, after recording
the worst January-September performance in
terms of proceeds raised since the 2008-09 global
financial crisis, IPO activity picked up in late
November and December alongside soaring
local stock prices. This was partly attributable to
improving liquidity and market sentiment amid
more aggressive monetary easing in the US and
diminished tail risk in the euro area.
Chart 4.19Equity funds raised in Hong Kong
Note: Figures exclude warrants exercised, consideration issues and share option schemes.
Source: Hong Kong Exchanges and Clearing Limited.
Page 44
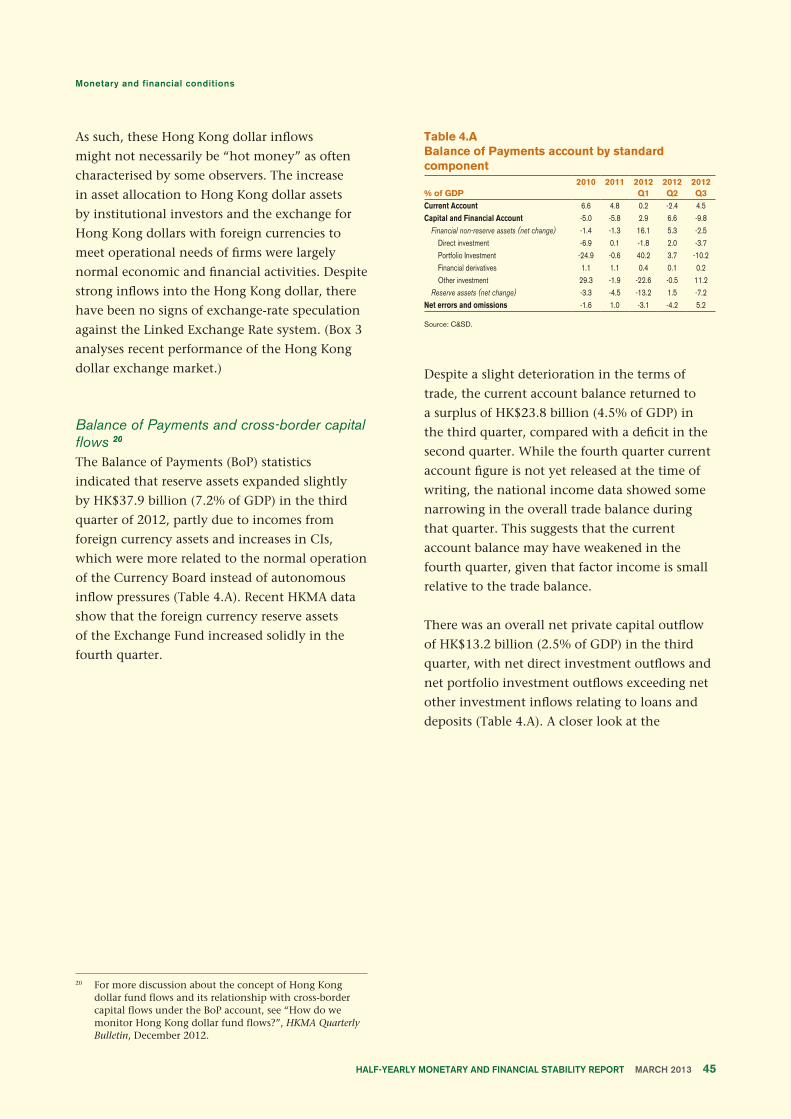
As such, these Hong Kong dollar inflows
might not necessarily be “hot money” as often
characterised by some observers. The increase
in asset allocation to Hong Kong dollar assets
by institutional investors and the exchange for
Hong Kong dollars with foreign currencies to
meet operational needs of firms were largely
normal economic and financial activities. Despite
strong inflows into the Hong Kong dollar, there
have been no signs of exchange-rate speculation
against the Linked Exchange Rate system. (Box 3
analyses recent performance of the Hong Kong
dollar exchange market.)
Balance of Payments and cross-border capital flows 20
The Balance of Payments (BoP) statistics
indicated that reserve assets expanded slightly
by HK$37.9 billion (7.2% of GDP) in the third
quarter of 2012, partly due to incomes from
foreign currency assets and increases in CIs,
which were more related to the normal operation
of the Currency Board instead of autonomous
inflow pressures (Table 4.A). Recent HKMA data
show that the foreign currency reserve assets
of the Exchange Fund increased solidly in the
fourth quarter.
Table 4.ABalance of Payments account by standard component
% of GDP2010 2011 2012
Q12012Q2
2012Q3
Current Account 6.6 4.8 0.2 -2.4 4.5Capital and Financial Account -5.0 -5.8 2.9 6.6 -9.8 Financial non-reserve assets (net change) -1.4 -1.3 16.1 5.3 -2.5 Direct investment -6.9 0.1 -1.8 2.0 -3.7 Portfolio Investment -24.9 -0.6 40.2 3.7 -10.2 Financial derivatives 1.1 1.1 0.4 0.1 0.2 Other investment 29.3 -1.9 -22.6 -0.5 11.2 Reserve assets (net change) -3.3 -4.5 -13.2 1.5 -7.2Net errors and omissions -1.6 1.0 -3.1 -4.2 5.2
Source: C&SD.
Despite a slight deterioration in the terms of
trade, the current account balance returned to
a surplus of HK$23.8 billion (4.5% of GDP) in
the third quarter, compared with a deficit in the
second quarter. While the fourth quarter current
account figure is not yet released at the time of
writing, the national income data showed some
narrowing in the overall trade balance during
that quarter. This suggests that the current
account balance may have weakened in the
fourth quarter, given that factor income is small
relative to the trade balance.
There was an overall net private capital outflow
of HK$13.2 billion (2.5% of GDP) in the third
quarter, with net direct investment outflows and
net portfolio investment outflows exceeding net
other investment inflows relating to loans and
deposits (Table 4.A). A closer look at the
Page 45
20 For more discussion about the concept of Hong Kong dollar fund flows and its relationship with cross-border capital flows under the BoP account, see “How do we monitor Hong Kong dollar fund flows?”, HKMA Quarterly Bulletin, December 2012.
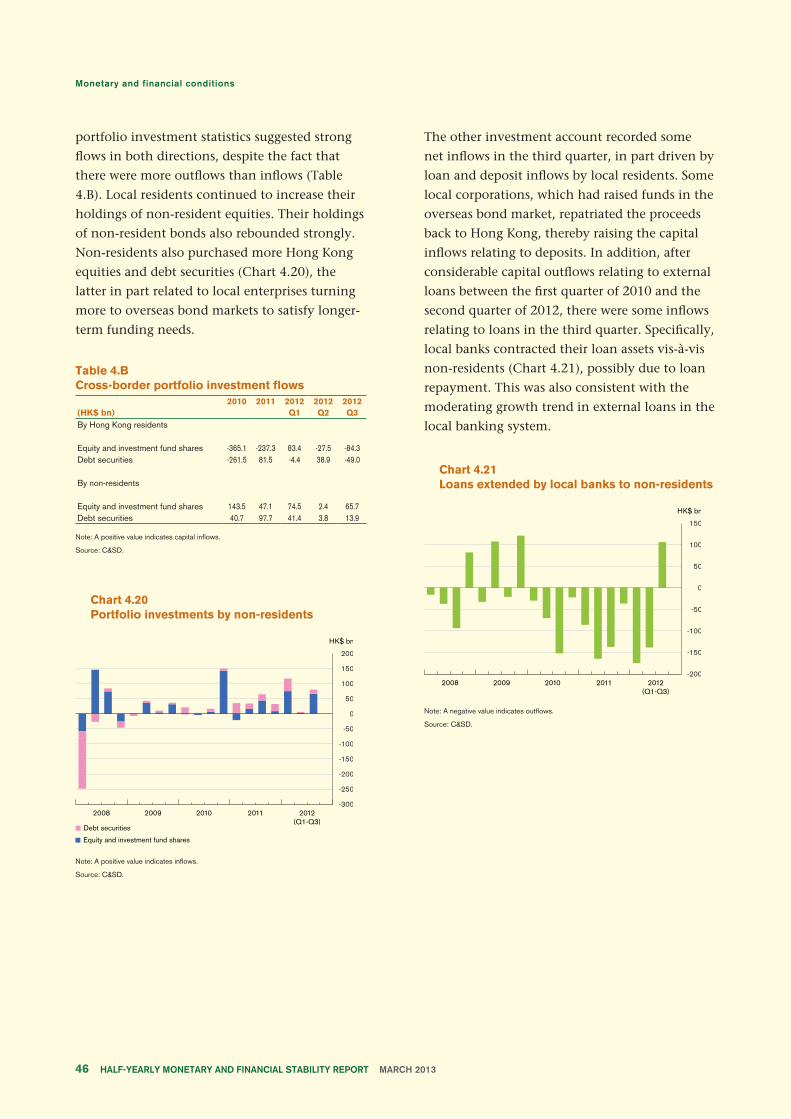
portfolio investment statistics suggested strong
flows in both directions, despite the fact that
there were more outflows than inflows (Table
4.B). Local residents continued to increase their
holdings of non-resident equities. Their holdings
of non-resident bonds also rebounded strongly.
Non-residents also purchased more Hong Kong
equities and debt securities (Chart 4.20), the
latter in part related to local enterprises turning
more to overseas bond markets to satisfy longer-
term funding needs.
Table 4.BCross-border portfolio investment flows
(HK$ bn)2010 2011 2012
Q12012Q2
2012Q3
By Hong Kong residents
Equity and investment fund shares -365.1 -237.3 83.4 -27.5 -84.3Debt securities -261.5 81.5 -4.4 38.9 -49.0
By non-residents
Equity and investment fund shares 143.5 47.1 74.5 2.4 65.7Debt securities 40.7 97.7 41.4 3.8 13.9
Note: A positive value indicates capital inflows.
Source: C&SD.
Chart 4.20Portfolio investments by non-residents
Note: A positive value indicates inflows.
Source: C&SD.
The other investment account recorded some
net inflows in the third quarter, in part driven by
loan and deposit inflows by local residents. Some
local corporations, which had raised funds in the
overseas bond market, repatriated the proceeds
back to Hong Kong, thereby raising the capital
inflows relating to deposits. In addition, after
considerable capital outflows relating to external
loans between the first quarter of 2010 and the
second quarter of 2012, there were some inflows
relating to loans in the third quarter. Specifically,
local banks contracted their loan assets vis-à-vis
non-residents (Chart 4.21), possibly due to loan
repayment. This was also consistent with the
moderating growth trend in external loans in the
local banking system.
Chart 4.21Loans extended by local banks to non-residents
Note: A negative value indicates outflows.
Source: C&SD.
Page 46

Outlook for capital flowsThe direction and size of fund flows are relatively
uncertain in 2013, reflecting the interplay
of various pull and push factors. On the one
hand, against the backdrop of more aggressive
monetary easing in advanced economies, the
consequential abundant global liquidity appears
to have increased market’s risk appetite and
incentive for a search for yield around the world
and particularly in Asia and other emerging
markets. With the economic outlook for Hong
Kong and the Mainland China gradually
improving, there could be more equity-related
demand for Hong Kong dollars. A possible revival
in stock market fund-raising activities and the
furthering of overseas bond issuance by local
corporations (followed by proceeds repatriation)
will also likely bolster Hong Kong dollar
demands and capital inflows. On the other hand,
a faster-than-expected recovery in the advanced
economies could induce capital outflows from
Hong Kong and the region. Moreover, given that
tail risks in the global economy and the financial
markets have not vanished, it is possible that
the sanguine market sentiment and risk appetite
could make a sharp turn and capital flows would
be subject to much volatility.
Page 47
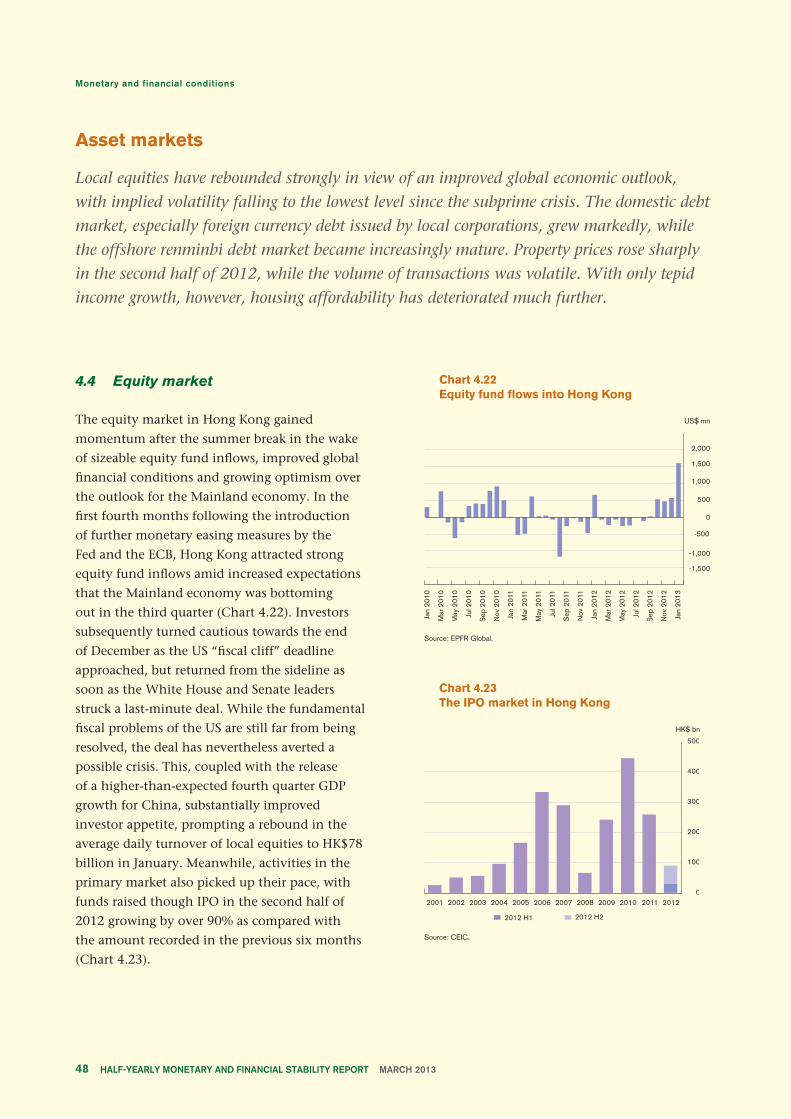
Asset markets
Local equities have rebounded strongly in view of an improved global economic outlook,
with implied volatility falling to the lowest level since the subprime crisis. The domestic debt
market, especially foreign currency debt issued by local corporations, grew markedly, while
the offshore renminbi debt market became increasingly mature. Property prices rose sharply
in the second half of 2012, while the volume of transactions was volatile. With only tepid
income growth, however, housing affordability has deteriorated much further.
4.4 Equity market
The equity market in Hong Kong gained
momentum after the summer break in the wake
of sizeable equity fund inflows, improved global
financial conditions and growing optimism over
the outlook for the Mainland economy. In the
first fourth months following the introduction
of further monetary easing measures by the
Fed and the ECB, Hong Kong attracted strong
equity fund inflows amid increased expectations
that the Mainland economy was bottoming
out in the third quarter (Chart 4.22). Investors
subsequently turned cautious towards the end
of December as the US “fiscal cliff” deadline
approached, but returned from the sideline as
soon as the White House and Senate leaders
struck a last-minute deal. While the fundamental
fiscal problems of the US are still far from being
resolved, the deal has nevertheless averted a
possible crisis. This, coupled with the release
of a higher-than-expected fourth quarter GDP
growth for China, substantially improved
investor appetite, prompting a rebound in the
average daily turnover of local equities to HK$78
billion in January. Meanwhile, activities in the
primary market also picked up their pace, with
funds raised though IPO in the second half of
2012 growing by over 90% as compared with
the amount recorded in the previous six months
(Chart 4.23).
Chart 4.22Equity fund flows into Hong Kong
Source: EPFR Global.
Chart 4.23The IPO market in Hong Kong
Source: CEIC.
Page 48
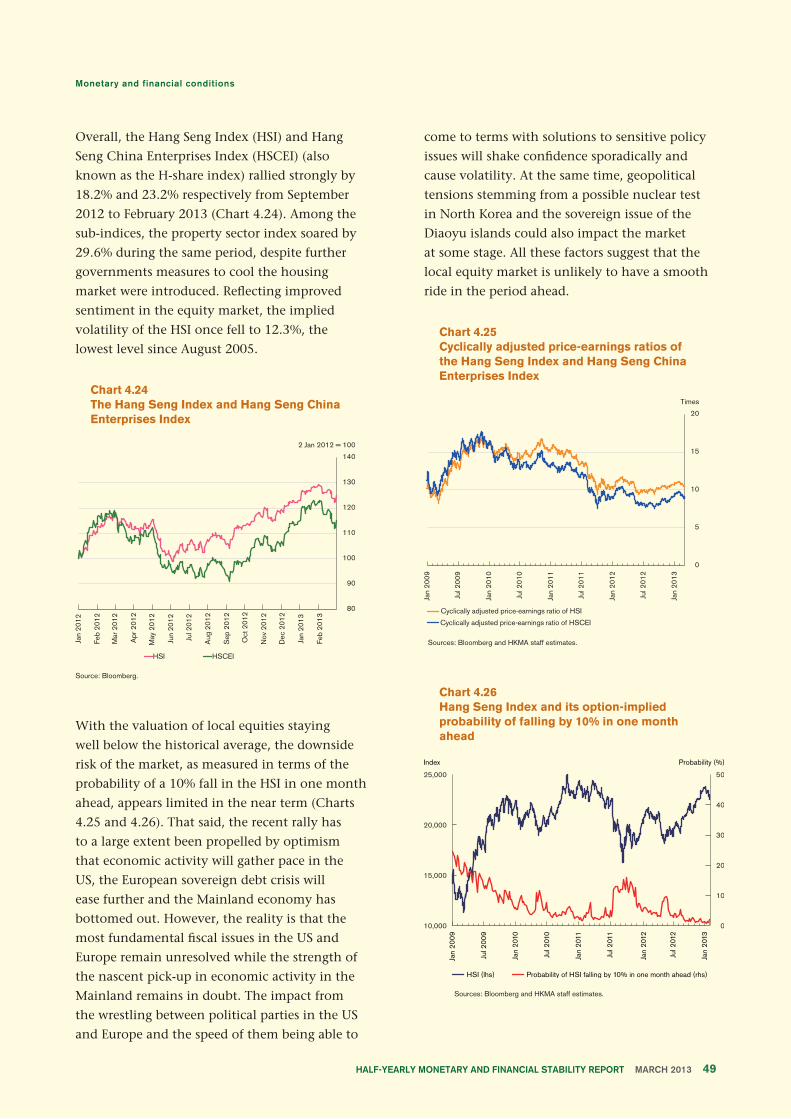
Overall, the Hang Seng Index (HSI) and Hang
Seng China Enterprises Index (HSCEI) (also
known as the H-share index) rallied strongly by
18.2% and 23.2% respectively from September
2012 to February 2013 (Chart 4.24). Among the
sub-indices, the property sector index soared by
29.6% during the same period, despite further
governments measures to cool the housing
market were introduced. Reflecting improved
sentiment in the equity market, the implied
volatility of the HSI once fell to 12.3%, the
lowest level since August 2005.
Chart 4.24The Hang Seng Index and Hang Seng China Enterprises Index
Source: Bloomberg.
With the valuation of local equities staying
well below the historical average, the downside
risk of the market, as measured in terms of the
probability of a 10% fall in the HSI in one month
ahead, appears limited in the near term (Charts
4.25 and 4.26). That said, the recent rally has
to a large extent been propelled by optimism
that economic activity will gather pace in the
US, the European sovereign debt crisis will
ease further and the Mainland economy has
bottomed out. However, the reality is that the
most fundamental fiscal issues in the US and
Europe remain unresolved while the strength of
the nascent pick-up in economic activity in the
Mainland remains in doubt. The impact from
the wrestling between political parties in the US
and Europe and the speed of them being able to
come to terms with solutions to sensitive policy
issues will shake confidence sporadically and
cause volatility. At the same time, geopolitical
tensions stemming from a possible nuclear test
in North Korea and the sovereign issue of the
Diaoyu islands could also impact the market
at some stage. All these factors suggest that the
local equity market is unlikely to have a smooth
ride in the period ahead.
Chart 4.25Cyclically adjusted price-earnings ratios of the Hang Seng Index and Hang Seng China Enterprises Index
Sources: Bloomberg and HKMA staff estimates.
Chart 4.26Hang Seng Index and its option-implied probability of falling by 10% in one month ahead
Sources: Bloomberg and HKMA staff estimates.
Page 49
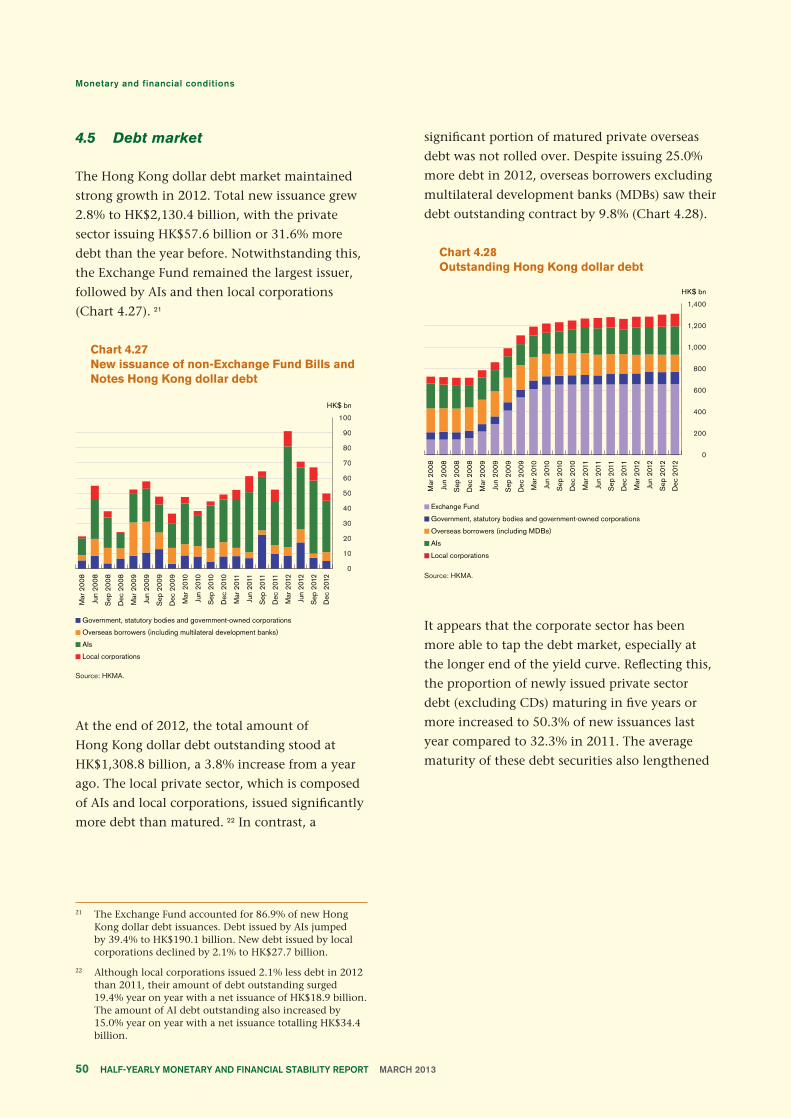
4.5 Debt market
The Hong Kong dollar debt market maintained
strong growth in 2012. Total new issuance grew
2.8% to HK$2,130.4 billion, with the private
sector issuing HK$57.6 billion or 31.6% more
debt than the year before. Notwithstanding this,
the Exchange Fund remained the largest issuer,
followed by AIs and then local corporations
(Chart 4.27). 21
Chart 4.27New issuance of non-Exchange Fund Bills and Notes Hong Kong dollar debt
Source: HKMA.
At the end of 2012, the total amount of
Hong Kong dollar debt outstanding stood at
HK$1,308.8 billion, a 3.8% increase from a year
ago. The local private sector, which is composed
of AIs and local corporations, issued significantly
more debt than matured. 22 In contrast, a
significant portion of matured private overseas
debt was not rolled over. Despite issuing 25.0%
more debt in 2012, overseas borrowers excluding
multilateral development banks (MDBs) saw their
debt outstanding contract by 9.8% (Chart 4.28).
Chart 4.28Outstanding Hong Kong dollar debt
Source: HKMA.
It appears that the corporate sector has been
more able to tap the debt market, especially at
the longer end of the yield curve. Reflecting this,
the proportion of newly issued private sector
debt (excluding CDs) maturing in five years or
more increased to 50.3% of new issuances last
year compared to 32.3% in 2011. The average
maturity of these debt securities also lengthened
21 The Exchange Fund accounted for 86.9% of new Hong Kong dollar debt issuances. Debt issued by AIs jumped by 39.4% to HK$190.1 billion. New debt issued by local corporations declined by 2.1% to HK$27.7 billion.
22 Although local corporations issued 2.1% less debt in 2012 than 2011, their amount of debt outstanding surged 19.4% year on year with a net issuance of HK$18.9 billion. The amount of AI debt outstanding also increased by 15.0% year on year with a net issuance totalling HK$34.4 billion.
Page 50
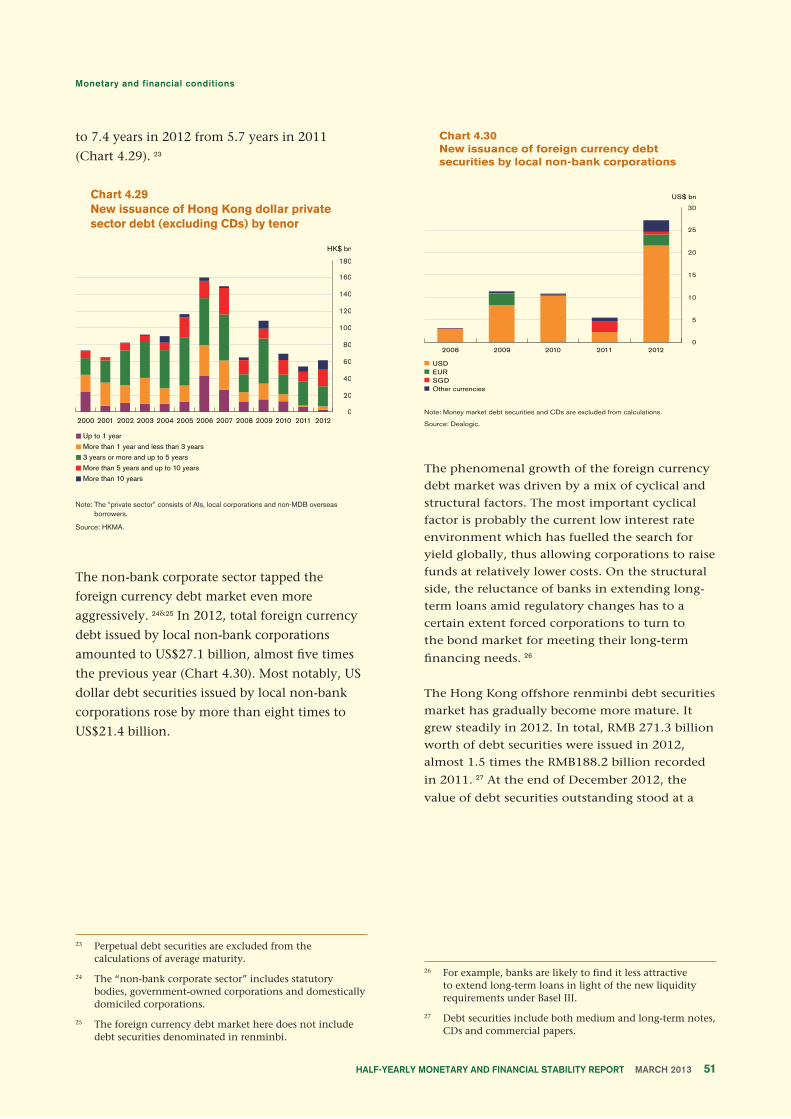
to 7.4 years in 2012 from 5.7 years in 2011
(Chart 4.29). 23
Chart 4.29New issuance of Hong Kong dollar private sector debt (excluding CDs) by tenor
Note: The “private sector” consists of AIs, local corporations and non-MDB overseas borrowers.
Source: HKMA.
The non-bank corporate sector tapped the
foreign currency debt market even more
aggressively. 24&25 In 2012, total foreign currency
debt issued by local non-bank corporations
amounted to US$27.1 billion, almost five times
the previous year (Chart 4.30). Most notably, US
dollar debt securities issued by local non-bank
corporations rose by more than eight times to
US$21.4 billion.
Chart 4.30New issuance of foreign currency debt securities by local non-bank corporations
Note: Money market debt securities and CDs are excluded from calculations.
Source: Dealogic.
The phenomenal growth of the foreign currency
debt market was driven by a mix of cyclical and
structural factors. The most important cyclical
factor is probably the current low interest rate
environment which has fuelled the search for
yield globally, thus allowing corporations to raise
funds at relatively lower costs. On the structural
side, the reluctance of banks in extending long-
term loans amid regulatory changes has to a
certain extent forced corporations to turn to
the bond market for meeting their long-term
financing needs. 26
The Hong Kong offshore renminbi debt securities
market has gradually become more mature. It
grew steadily in 2012. In total, RMB 271.3 billion
worth of debt securities were issued in 2012,
almost 1.5 times the RMB188.2 billion recorded
in 2011. 27 At the end of December 2012, the
value of debt securities outstanding stood at a
23 Perpetual debt securities are excluded from the calculations of average maturity.
24 The “non-bank corporate sector” includes statutory bodies, government-owned corporations and domestically domiciled corporations.
25 The foreign currency debt market here does not include debt securities denominated in renminbi.
26 For example, banks are likely to find it less attractive to extend long-term loans in light of the new liquidity requirements under Basel III.
27 Debt securities include both medium and long-term notes, CDs and commercial papers.
Page 51
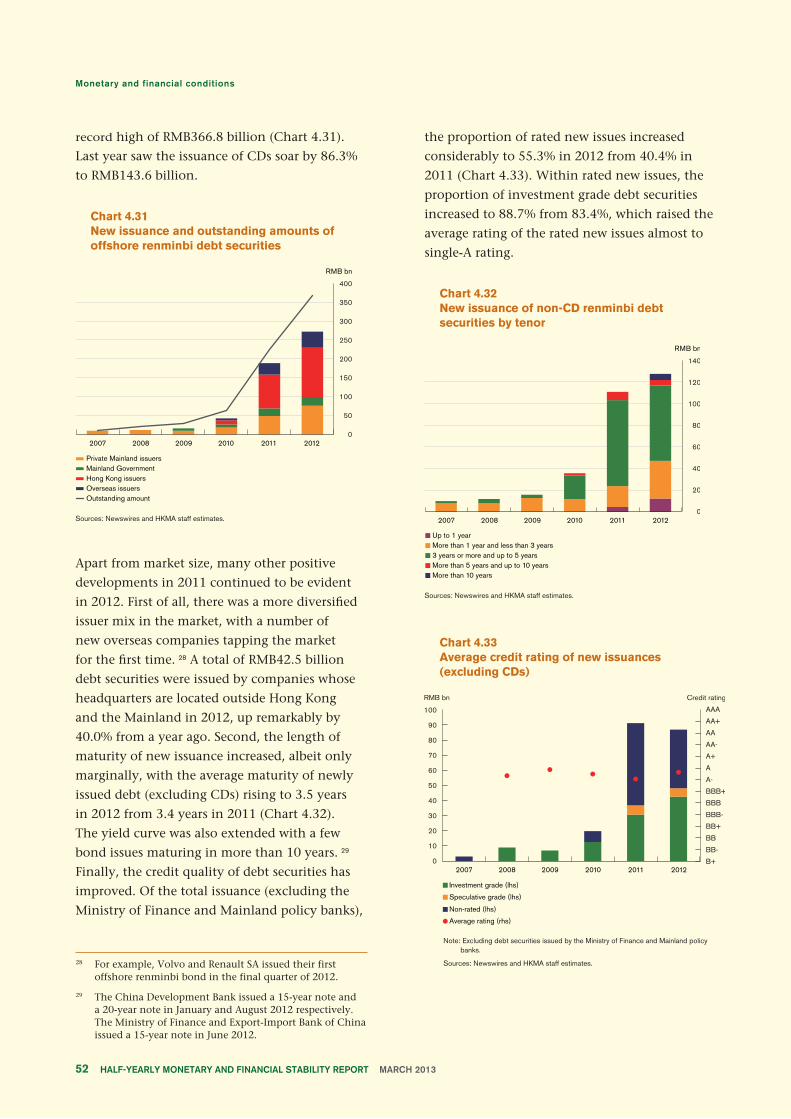
record high of RMB366.8 billion (Chart 4.31).
Last year saw the issuance of CDs soar by 86.3%
to RMB143.6 billion.
Chart 4.31New issuance and outstanding amounts of offshore renminbi debt securities
Sources: Newswires and HKMA staff estimates.
Apart from market size, many other positive
developments in 2011 continued to be evident
in 2012. First of all, there was a more diversified
issuer mix in the market, with a number of
new overseas companies tapping the market
for the first time. 28 A total of RMB42.5 billion
debt securities were issued by companies whose
headquarters are located outside Hong Kong
and the Mainland in 2012, up remarkably by
40.0% from a year ago. Second, the length of
maturity of new issuance increased, albeit only
marginally, with the average maturity of newly
issued debt (excluding CDs) rising to 3.5 years
in 2012 from 3.4 years in 2011 (Chart 4.32).
The yield curve was also extended with a few
bond issues maturing in more than 10 years. 29
Finally, the credit quality of debt securities has
improved. Of the total issuance (excluding the
Ministry of Finance and Mainland policy banks),
the proportion of rated new issues increased
considerably to 55.3% in 2012 from 40.4% in
2011 (Chart 4.33). Within rated new issues, the
proportion of investment grade debt securities
increased to 88.7% from 83.4%, which raised the
average rating of the rated new issues almost to
single-A rating.
Chart 4.32New issuance of non-CD renminbi debt securities by tenor
Sources: Newswires and HKMA staff estimates.
Chart 4.33Average credit rating of new issuances (excluding CDs)
Note: Excluding debt securities issued by the Ministry of Finance and Mainland policy banks.
Sources: Newswires and HKMA staff estimates.28 For example, Volvo and Renault SA issued their first offshore renminbi bond in the final quarter of 2012.
29 The China Development Bank issued a 15-year note and a 20-year note in January and August 2012 respectively. The Ministry of Finance and Export-Import Bank of China issued a 15-year note in June 2012.
Page 52
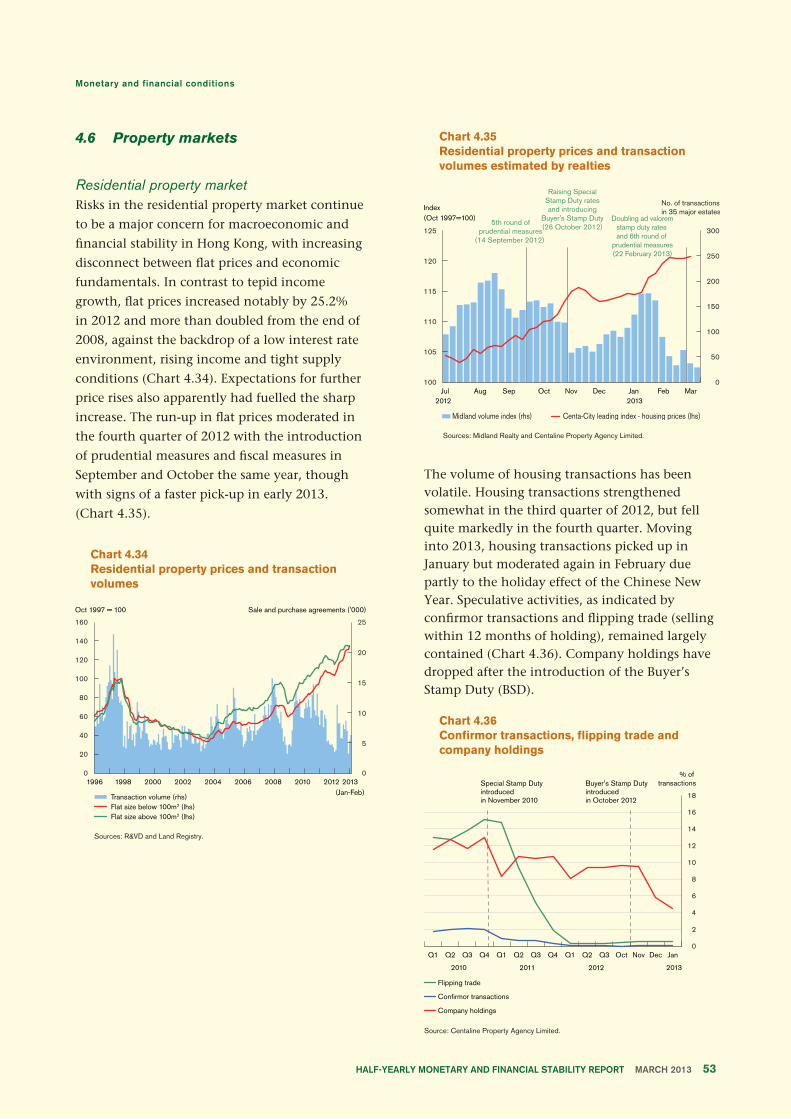
4.6 Property markets
Residential property marketRisks in the residential property market continue
to be a major concern for macroeconomic and
financial stability in Hong Kong, with increasing
disconnect between flat prices and economic
fundamentals. In contrast to tepid income
growth, flat prices increased notably by 25.2%
in 2012 and more than doubled from the end of
2008, against the backdrop of a low interest rate
environment, rising income and tight supply
conditions (Chart 4.34). Expectations for further
price rises also apparently had fuelled the sharp
increase. The run-up in flat prices moderated in
the fourth quarter of 2012 with the introduction
of prudential measures and fiscal measures in
September and October the same year, though
with signs of a faster pick-up in early 2013.
(Chart 4.35).
Chart 4.34Residential property prices and transaction volumes
Sources: R&VD and Land Registry.
Chart 4.35Residential property prices and transaction volumes estimated by realties
Sources: Midland Realty and Centaline Property Agency Limited.
The volume of housing transactions has been volatile. Housing transactions strengthened somewhat in the third quarter of 2012, but fell quite markedly in the fourth quarter. Moving into 2013, housing transactions picked up in January but moderated again in February due partly to the holiday effect of the Chinese New Year. Speculative activities, as indicated by confirmor transactions and flipping trade (selling within 12 months of holding), remained largely contained (Chart 4.36). Company holdings have dropped after the introduction of the Buyer’s Stamp Duty (BSD).
Chart 4.36Confirmor transactions, flipping trade and company holdings
Source: Centaline Property Agency Limited.
Page 53
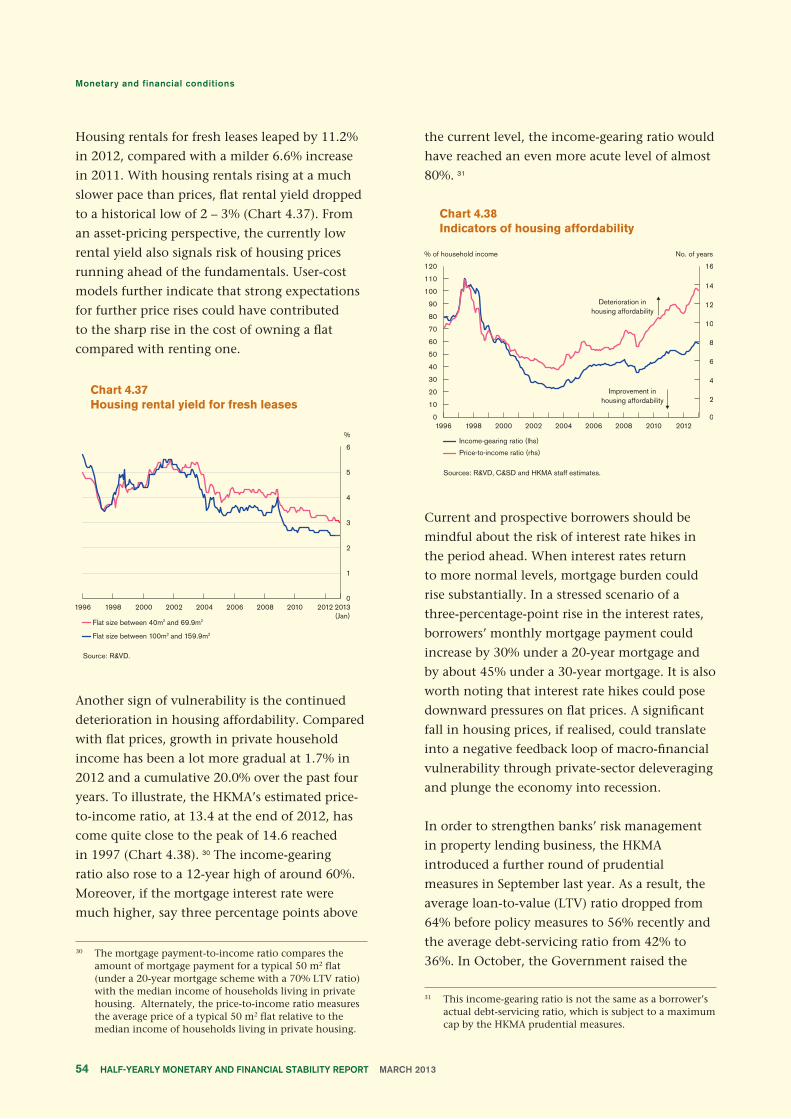
Housing rentals for fresh leases leaped by 11.2%
in 2012, compared with a milder 6.6% increase
in 2011. With housing rentals rising at a much
slower pace than prices, flat rental yield dropped
to a historical low of 2 – 3% (Chart 4.37). From
an asset-pricing perspective, the currently low
rental yield also signals risk of housing prices
running ahead of the fundamentals. User-cost
models further indicate that strong expectations
for further price rises could have contributed
to the sharp rise in the cost of owning a flat
compared with renting one.
Chart 4.37Housing rental yield for fresh leases
Source: R&VD.
Another sign of vulnerability is the continued
deterioration in housing affordability. Compared
with flat prices, growth in private household
income has been a lot more gradual at 1.7% in
2012 and a cumulative 20.0% over the past four
years. To illustrate, the HKMA’s estimated price-
to-income ratio, at 13.4 at the end of 2012, has
come quite close to the peak of 14.6 reached
in 1997 (Chart 4.38). 30 The income-gearing
ratio also rose to a 12-year high of around 60%.
Moreover, if the mortgage interest rate were
much higher, say three percentage points above
the current level, the income-gearing ratio would
have reached an even more acute level of almost
80%. 31
Chart 4.38Indicators of housing affordability
Sources: R&VD, C&SD and HKMA staff estimates.
Current and prospective borrowers should be
mindful about the risk of interest rate hikes in
the period ahead. When interest rates return
to more normal levels, mortgage burden could
rise substantially. In a stressed scenario of a
three-percentage-point rise in the interest rates,
borrowers’ monthly mortgage payment could
increase by 30% under a 20-year mortgage and
by about 45% under a 30-year mortgage. It is also
worth noting that interest rate hikes could pose
downward pressures on flat prices. A significant
fall in housing prices, if realised, could translate
into a negative feedback loop of macro-financial
vulnerability through private-sector deleveraging
and plunge the economy into recession.
In order to strengthen banks’ risk management
in property lending business, the HKMA
introduced a further round of prudential
measures in September last year. As a result, the
average loan-to-value (LTV) ratio dropped from
64% before policy measures to 56% recently and
the average debt-servicing ratio from 42% to
36%. In October, the Government raised the 30 The mortgage payment-to-income ratio compares the
amount of mortgage payment for a typical 50 m2 flat (under a 20-year mortgage scheme with a 70% LTV ratio) with the median income of households living in private housing. Alternately, the price-to-income ratio measures the average price of a typical 50 m2 flat relative to the median income of households living in private housing.
31 This income-gearing ratio is not the same as a borrower’s actual debt-servicing ratio, which is subject to a maximum cap by the HKMA prudential measures.
Page 54
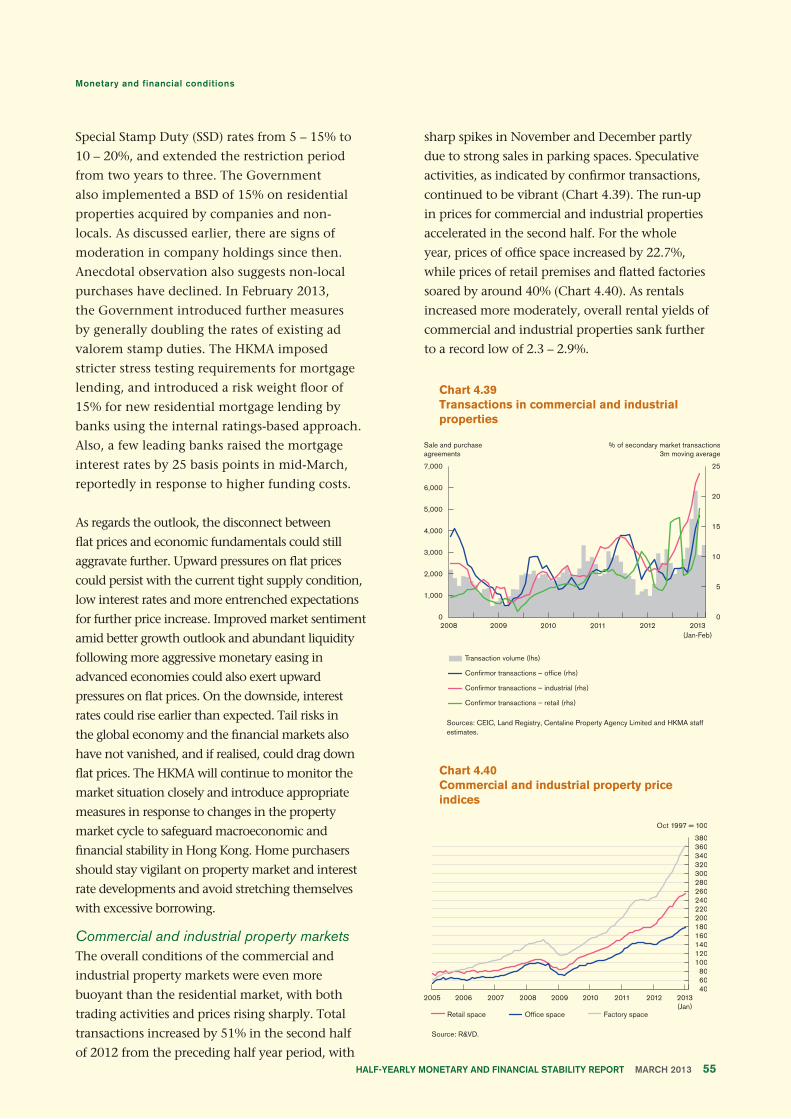
Special Stamp Duty (SSD) rates from 5 – 15% to
10 – 20%, and extended the restriction period
from two years to three. The Government
also implemented a BSD of 15% on residential
properties acquired by companies and non-
locals. As discussed earlier, there are signs of
moderation in company holdings since then.
Anecdotal observation also suggests non-local
purchases have declined. In February 2013,
the Government introduced further measures
by generally doubling the rates of existing ad
valorem stamp duties. The HKMA imposed
stricter stress testing requirements for mortgage
lending, and introduced a risk weight floor of
15% for new residential mortgage lending by
banks using the internal ratings-based approach.
Also, a few leading banks raised the mortgage
interest rates by 25 basis points in mid-March,
reportedly in response to higher funding costs.
As regards the outlook, the disconnect between
flat prices and economic fundamentals could still
aggravate further. Upward pressures on flat prices
could persist with the current tight supply condition,
low interest rates and more entrenched expectations
for further price increase. Improved market sentiment
amid better growth outlook and abundant liquidity
following more aggressive monetary easing in
advanced economies could also exert upward
pressures on flat prices. On the downside, interest
rates could rise earlier than expected. Tail risks in
the global economy and the financial markets also
have not vanished, and if realised, could drag down
flat prices. The HKMA will continue to monitor the
market situation closely and introduce appropriate
measures in response to changes in the property
market cycle to safeguard macroeconomic and
financial stability in Hong Kong. Home purchasers
should stay vigilant on property market and interest
rate developments and avoid stretching themselves
with excessive borrowing.
Commercial and industrial property marketsThe overall conditions of the commercial and
industrial property markets were even more
buoyant than the residential market, with both
trading activities and prices rising sharply. Total
transactions increased by 51% in the second half
of 2012 from the preceding half year period, with
sharp spikes in November and December partly
due to strong sales in parking spaces. Speculative
activities, as indicated by confirmor transactions,
continued to be vibrant (Chart 4.39). The run-up
in prices for commercial and industrial properties
accelerated in the second half. For the whole
year, prices of office space increased by 22.7%,
while prices of retail premises and flatted factories
soared by around 40% (Chart 4.40). As rentals
increased more moderately, overall rental yields of
commercial and industrial properties sank further
to a record low of 2.3 – 2.9%.
Chart 4.39Transactions in commercial and industrial properties
Sources: CEIC, Land Registry, Centaline Property Agency Limited and HKMA staff estimates.
Chart 4.40Commercial and industrial property price indices
Source: R&VD.
Page 55
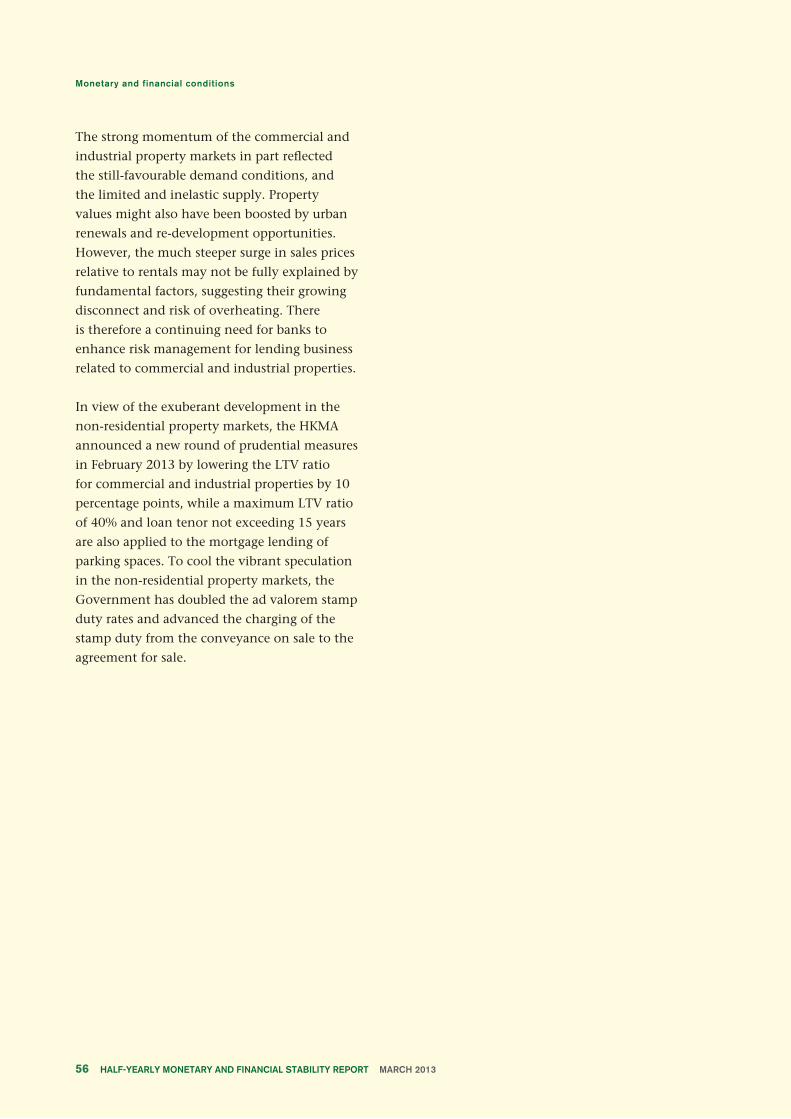
The strong momentum of the commercial and
industrial property markets in part reflected
the still-favourable demand conditions, and
the limited and inelastic supply. Property
values might also have been boosted by urban
renewals and re-development opportunities.
However, the much steeper surge in sales prices
relative to rentals may not be fully explained by
fundamental factors, suggesting their growing
disconnect and risk of overheating. There
is therefore a continuing need for banks to
enhance risk management for lending business
related to commercial and industrial properties.
In view of the exuberant development in the
non-residential property markets, the HKMA
announced a new round of prudential measures
in February 2013 by lowering the LTV ratio
for commercial and industrial properties by 10
percentage points, while a maximum LTV ratio
of 40% and loan tenor not exceeding 15 years
are also applied to the mortgage lending of
parking spaces. To cool the vibrant speculation
in the non-residential property markets, the
Government has doubled the ad valorem stamp
duty rates and advanced the charging of the
stamp duty from the conveyance on sale to the
agreement for sale.
Page 56
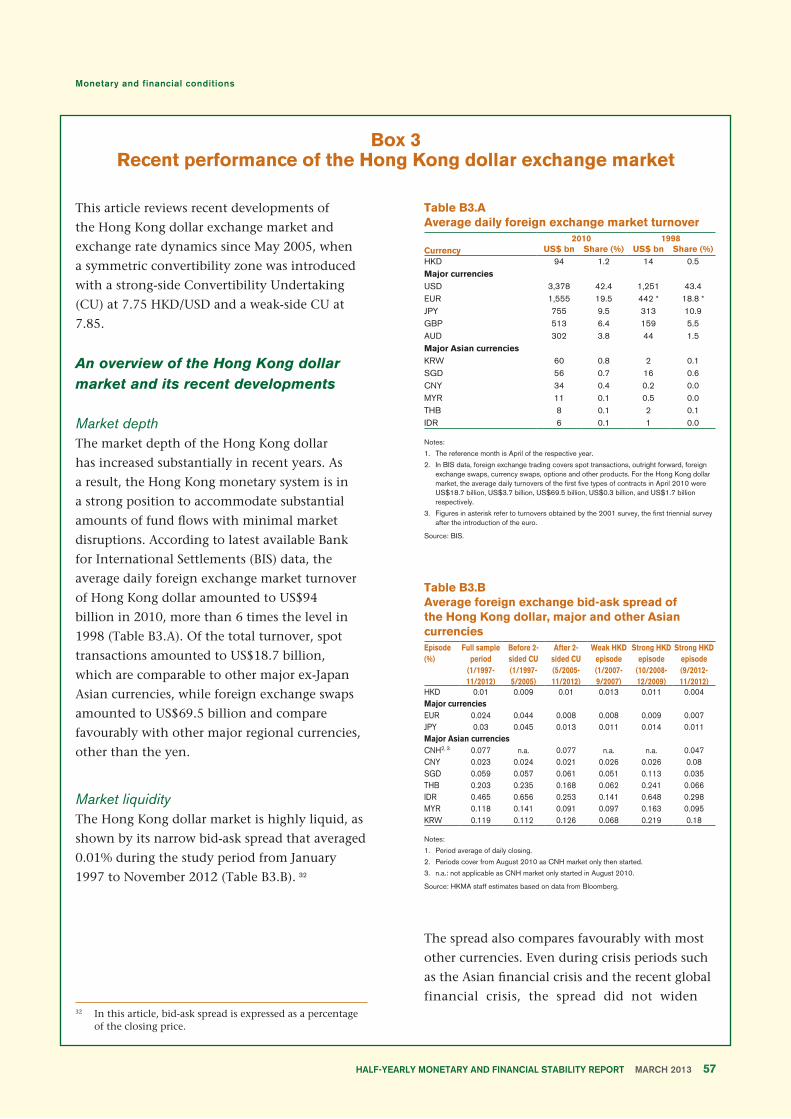
Box 3Recent performance of the Hong Kong dollar exchange market
This article reviews recent developments of
the Hong Kong dollar exchange market and
exchange rate dynamics since May 2005, when
a symmetric convertibility zone was introduced
with a strong-side Convertibility Undertaking
(CU) at 7.75 HKD/USD and a weak-side CU at
7.85.
An overview of the Hong Kong dollar market and its recent developments
Market depthThe market depth of the Hong Kong dollar
has increased substantially in recent years. As
a result, the Hong Kong monetary system is in
a strong position to accommodate substantial
amounts of fund flows with minimal market
disruptions. According to latest available Bank
for International Settlements (BIS) data, the
average daily foreign exchange market turnover
of Hong Kong dollar amounted to US$94
billion in 2010, more than 6 times the level in
1998 (Table B3.A). Of the total turnover, spot
transactions amounted to US$18.7 billion,
which are comparable to other major ex-Japan
Asian currencies, while foreign exchange swaps
amounted to US$69.5 billion and compare
favourably with other major regional currencies,
other than the yen.
Market liquidityThe Hong Kong dollar market is highly liquid, as
shown by its narrow bid-ask spread that averaged
0.01% during the study period from January
1997 to November 2012 (Table B3.B). 32
Table B3.AAverage daily foreign exchange market turnover
Currency2010 1998
US$ bn Share (%) US$ bn Share (%)HKD 94 1.2 14 0.5Major currenciesUSD 3,378 42.4 1,251 43.4EUR 1,555 19.5 442 * 18.8 *
JPY 755 9.5 313 10.9GBP 513 6.4 159 5.5AUD 302 3.8 44 1.5Major Asian currenciesKRW 60 0.8 2 0.1SGD 56 0.7 16 0.6CNY 34 0.4 0.2 0.0MYR 11 0.1 0.5 0.0THB 8 0.1 2 0.1IDR 6 0.1 1 0.0
Notes:
1. The reference month is April of the respective year.
2. In BIS data, foreign exchange trading covers spot transactions, outright forward, foreign exchange swaps, currency swaps, options and other products. For the Hong Kong dollar market, the average daily turnovers of the first five types of contracts in April 2010 were US$18.7 billion, US$3.7 billion, US$69.5 billion, US$0.3 billion, and US$1.7 billion respectively.
3. Figures in asterisk refer to turnovers obtained by the 2001 survey, the first triennial survey after the introduction of the euro.
Source: BIS.
Table B3.BAverage foreign exchange bid-ask spread of the Hong Kong dollar, major and other Asian currenciesEpisode(%)
Full sampleperiod
(1/1997-11/2012)
Before 2-sided CU(1/1997-5/2005)
After 2-sided CU(5/2005-11/2012)
Weak HKDepisode(1/2007-9/2007)
Strong HKDepisode
(10/2008-12/2009)
Strong HKDepisode(9/2012-11/2012)
HKD 0.01 0.009 0.01 0.013 0.011 0.004Major currenciesEUR 0.024 0.044 0.008 0.008 0.009 0.007JPY 0.03 0.045 0.013 0.011 0.014 0.011Major Asian currenciesCNH2, 3 0.077 n.a. 0.077 n.a. n.a. 0.047CNY 0.023 0.024 0.021 0.026 0.026 0.08SGD 0.059 0.057 0.061 0.051 0.113 0.035THB 0.203 0.235 0.168 0.062 0.241 0.066IDR 0.465 0.656 0.253 0.141 0.648 0.298MYR 0.118 0.141 0.091 0.097 0.163 0.095KRW 0.119 0.112 0.126 0.068 0.219 0.18
Notes:
1. Period average of daily closing.
2. Periods cover from August 2010 as CNH market only then started.
3. n.a.: not applicable as CNH market only started in August 2010.
Source: HKMA staff estimates based on data from Bloomberg.
The spread also compares favourably with most
other currencies. Even during crisis periods such
as the Asian financial crisis and the recent global
financial crisis, the spread did not widen
Page 57
32 In this article, bid-ask spread is expressed as a percentage of the closing price.
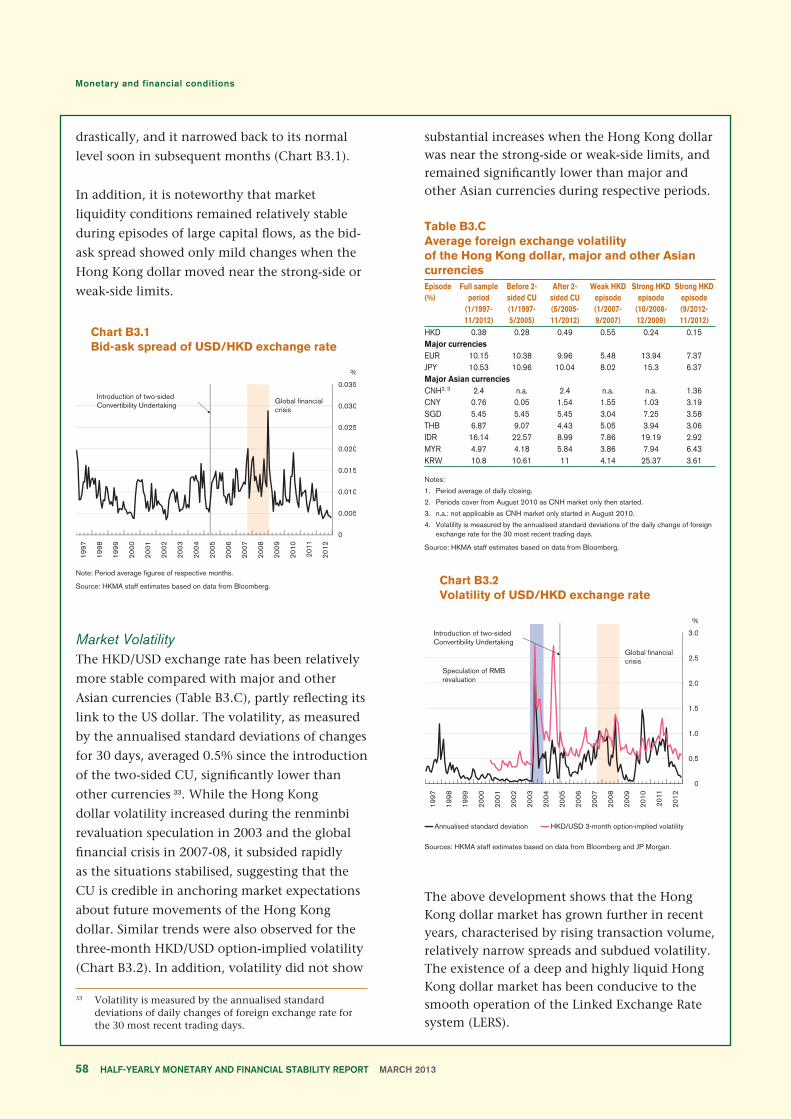
drastically, and it narrowed back to its normal
level soon in subsequent months (Chart B3.1).
In addition, it is noteworthy that market
liquidity conditions remained relatively stable
during episodes of large capital flows, as the bid-
ask spread showed only mild changes when the
Hong Kong dollar moved near the strong-side or
weak-side limits.
Chart B3.1Bid-ask spread of USD/HKD exchange rate
Note: Period average figures of respective months.
Source: HKMA staff estimates based on data from Bloomberg.
Market VolatilityThe HKD/USD exchange rate has been relatively
more stable compared with major and other
Asian currencies (Table B3.C), partly reflecting its
link to the US dollar. The volatility, as measured
by the annualised standard deviations of changes
for 30 days, averaged 0.5% since the introduction
of the two-sided CU, significantly lower than
other currencies 33. While the Hong Kong
dollar volatility increased during the renminbi
revaluation speculation in 2003 and the global
financial crisis in 2007-08, it subsided rapidly
as the situations stabilised, suggesting that the
CU is credible in anchoring market expectations
about future movements of the Hong Kong
dollar. Similar trends were also observed for the
three-month HKD/USD option-implied volatility
(Chart B3.2). In addition, volatility did not show
substantial increases when the Hong Kong dollar was near the strong-side or weak-side limits, and remained significantly lower than major and other Asian currencies during respective periods.
Table B3.CAverage foreign exchange volatilityof the Hong Kong dollar, major and other Asian currenciesEpisode(%)
Full sampleperiod
(1/1997-11/2012)
Before 2-sided CU(1/1997-5/2005)
After 2-sided CU(5/2005-11/2012)
Weak HKDepisode(1/2007-9/2007)
Strong HKDepisode
(10/2008-12/2009)
Strong HKDepisode(9/2012-11/2012)
HKD 0.38 0.28 0.49 0.55 0.24 0.15Major currenciesEUR 10.15 10.38 9.96 5.48 13.94 7.37JPY 10.53 10.96 10.04 8.02 15.3 6.37Major Asian currenciesCNH2, 3 2.4 n.a. 2.4 n.a. n.a. 1.36CNY 0.76 0.05 1.54 1.55 1.03 3.19SGD 5.45 5.45 5.45 3.04 7.25 3.58THB 6.87 9.07 4.43 5.05 3.94 3.06IDR 16.14 22.57 8.99 7.86 19.19 2.92MYR 4.97 4.18 5.84 3.86 7.94 6.43KRW 10.8 10.61 11 4.14 25.37 3.61
Notes:
1. Period average of daily closing.
2. Periods cover from August 2010 as CNH market only then started.
3. n.a.: not applicable as CNH market only started in August 2010.
4. Volatility is measured by the annualised standard deviations of the daily change of foreign exchange rate for the 30 most recent trading days.
Source: HKMA staff estimates based on data from Bloomberg.
Chart B3.2Volatility of USD/HKD exchange rate
Sources: HKMA staff estimates based on data from Bloomberg and JP Morgan.
The above development shows that the Hong Kong dollar market has grown further in recent years, characterised by rising transaction volume, relatively narrow spreads and subdued volatility. The existence of a deep and highly liquid Hong Kong dollar market has been conducive to the smooth operation of the Linked Exchange Rate system (LERS).
Page 58
33 Volatility is measured by the annualised standard deviations of daily changes of foreign exchange rate for the 30 most recent trading days.
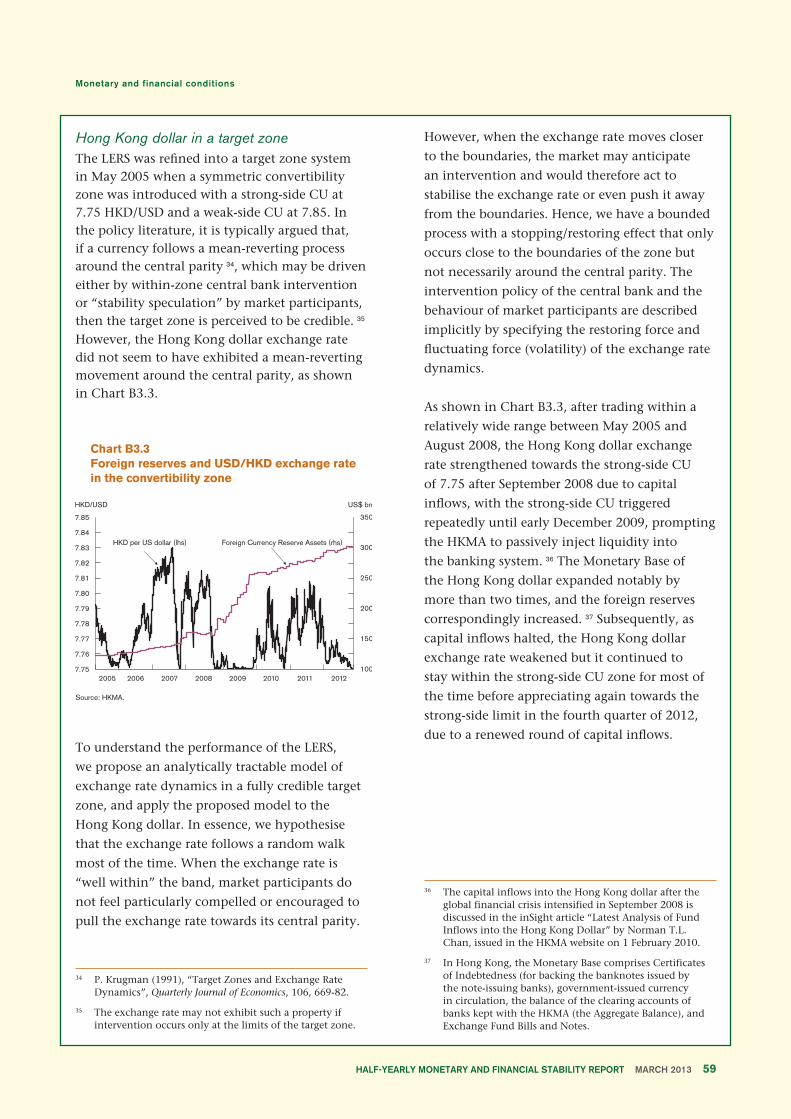
Hong Kong dollar in a target zoneThe LERS was refined into a target zone system in May 2005 when a symmetric convertibility zone was introduced with a strong-side CU at 7.75 HKD/USD and a weak-side CU at 7.85. In the policy literature, it is typically argued that, if a currency follows a mean-reverting process around the central parity 34, which may be driven either by within-zone central bank intervention or “stability speculation” by market participants, then the target zone is perceived to be credible. 35
However, the Hong Kong dollar exchange rate did not seem to have exhibited a mean-reverting movement around the central parity, as shown in Chart B3.3.
Chart B3.3Foreign reserves and USD/HKD exchange rate in the convertibility zone
Source: HKMA.
To understand the performance of the LERS,
we propose an analytically tractable model of
exchange rate dynamics in a fully credible target
zone, and apply the proposed model to the
Hong Kong dollar. In essence, we hypothesise
that the exchange rate follows a random walk
most of the time. When the exchange rate is
“well within” the band, market participants do
not feel particularly compelled or encouraged to
pull the exchange rate towards its central parity.
However, when the exchange rate moves closer
to the boundaries, the market may anticipate
an intervention and would therefore act to
stabilise the exchange rate or even push it away
from the boundaries. Hence, we have a bounded
process with a stopping/restoring effect that only
occurs close to the boundaries of the zone but
not necessarily around the central parity. The
intervention policy of the central bank and the
behaviour of market participants are described
implicitly by specifying the restoring force and
fluctuating force (volatility) of the exchange rate
dynamics.
As shown in Chart B3.3, after trading within a
relatively wide range between May 2005 and
August 2008, the Hong Kong dollar exchange
rate strengthened towards the strong-side CU
of 7.75 after September 2008 due to capital
inflows, with the strong-side CU triggered
repeatedly until early December 2009, prompting
the HKMA to passively inject liquidity into
the banking system. 36 The Monetary Base of
the Hong Kong dollar expanded notably by
more than two times, and the foreign reserves
correspondingly increased. 37 Subsequently, as
capital inflows halted, the Hong Kong dollar
exchange rate weakened but it continued to
stay within the strong-side CU zone for most of
the time before appreciating again towards the
strong-side limit in the fourth quarter of 2012,
due to a renewed round of capital inflows.
Page 59
34 P. Krugman (1991), “Target Zones and Exchange Rate Dynamics”, Quarterly Journal of Economics, 106, 669-82.
35 The exchange rate may not exhibit such a property if intervention occurs only at the limits of the target zone.
36 The capital inflows into the Hong Kong dollar after the global financial crisis intensified in September 2008 is discussed in the inSight article “Latest Analysis of Fund Inflows into the Hong Kong Dollar” by Norman T.L. Chan, issued in the HKMA website on 1 February 2010.
37 In Hong Kong, the Monetary Base comprises Certificates of Indebtedness (for backing the banknotes issued by the note-issuing banks), government-issued currency in circulation, the balance of the clearing accounts of banks kept with the HKMA (the Aggregate Balance), and Exchange Fund Bills and Notes.
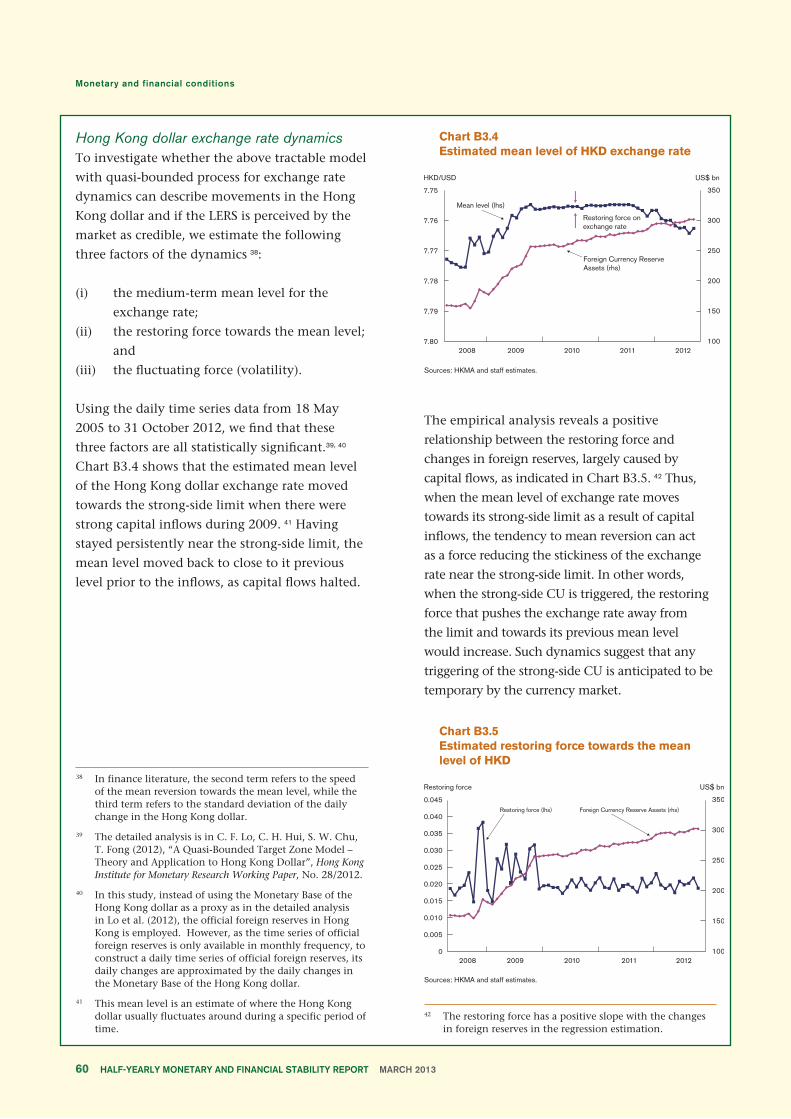
Hong Kong dollar exchange rate dynamicsTo investigate whether the above tractable model
with quasi-bounded process for exchange rate
dynamics can describe movements in the Hong
Kong dollar and if the LERS is perceived by the
market as credible, we estimate the following
three factors of the dynamics 38:
(i) the medium-term mean level for the
exchange rate;
(ii) the restoring force towards the mean level;
and
(iii) the fluctuating force (volatility).
Using the daily time series data from 18 May
2005 to 31 October 2012, we find that these
three factors are all statistically significant.39, 40
Chart B3.4 shows that the estimated mean level
of the Hong Kong dollar exchange rate moved
towards the strong-side limit when there were
strong capital inflows during 2009. 41 Having
stayed persistently near the strong-side limit, the
mean level moved back to close to it previous
level prior to the inflows, as capital flows halted.
Chart B3.4Estimated mean level of HKD exchange rate
Sources: HKMA and staff estimates.
The empirical analysis reveals a positive
relationship between the restoring force and
changes in foreign reserves, largely caused by
capital flows, as indicated in Chart B3.5. 42 Thus,
when the mean level of exchange rate moves
towards its strong-side limit as a result of capital
inflows, the tendency to mean reversion can act
as a force reducing the stickiness of the exchange
rate near the strong-side limit. In other words,
when the strong-side CU is triggered, the restoring
force that pushes the exchange rate away from
the limit and towards its previous mean level
would increase. Such dynamics suggest that any
triggering of the strong-side CU is anticipated to be
temporary by the currency market.
Chart B3.5Estimated restoring force towards the mean level of HKD
Sources: HKMA and staff estimates.
Page 60
38 In finance literature, the second term refers to the speed of the mean reversion towards the mean level, while the third term refers to the standard deviation of the daily change in the Hong Kong dollar.
39 The detailed analysis is in C. F. Lo, C. H. Hui, S. W. Chu, T. Fong (2012), “A Quasi-Bounded Target Zone Model – Theory and Application to Hong Kong Dollar”, Hong Kong Institute for Monetary Research Working Paper, No. 28/2012.
40 In this study, instead of using the Monetary Base of the Hong Kong dollar as a proxy as in the detailed analysis in Lo et al. (2012), the official foreign reserves in Hong Kong is employed. However, as the time series of official foreign reserves is only available in monthly frequency, to construct a daily time series of official foreign reserves, its daily changes are approximated by the daily changes in the Monetary Base of the Hong Kong dollar.
41 This mean level is an estimate of where the Hong Kong dollar usually fluctuates around during a specific period of time.
42 The restoring force has a positive slope with the changes in foreign reserves in the regression estimation.
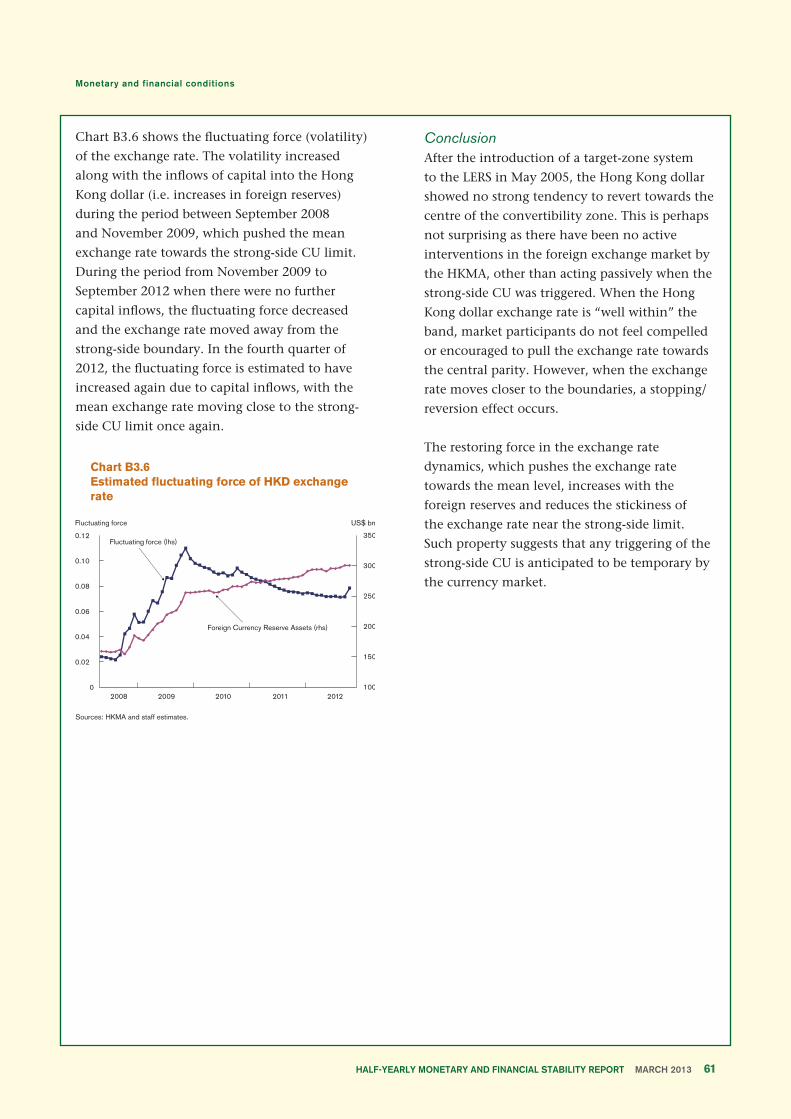
Chart B3.6 shows the fluctuating force (volatility)
of the exchange rate. The volatility increased
along with the inflows of capital into the Hong
Kong dollar (i.e. increases in foreign reserves)
during the period between September 2008
and November 2009, which pushed the mean
exchange rate towards the strong-side CU limit.
During the period from November 2009 to
September 2012 when there were no further
capital inflows, the fluctuating force decreased
and the exchange rate moved away from the
strong-side boundary. In the fourth quarter of
2012, the fluctuating force is estimated to have
increased again due to capital inflows, with the
mean exchange rate moving close to the strong-
side CU limit once again.
Chart B3.6Estimated fluctuating force of HKD exchange rate
Sources: HKMA and staff estimates.
ConclusionAfter the introduction of a target-zone system
to the LERS in May 2005, the Hong Kong dollar
showed no strong tendency to revert towards the
centre of the convertibility zone. This is perhaps
not surprising as there have been no active
interventions in the foreign exchange market by
the HKMA, other than acting passively when the
strong-side CU was triggered. When the Hong
Kong dollar exchange rate is “well within” the
band, market participants do not feel compelled
or encouraged to pull the exchange rate towards
the central parity. However, when the exchange
rate moves closer to the boundaries, a stopping/
reversion effect occurs.
The restoring force in the exchange rate
dynamics, which pushes the exchange rate
towards the mean level, increases with the
foreign reserves and reduces the stickiness of
the exchange rate near the strong-side limit.
Such property suggests that any triggering of the
strong-side CU is anticipated to be temporary by
the currency market.
Page 61
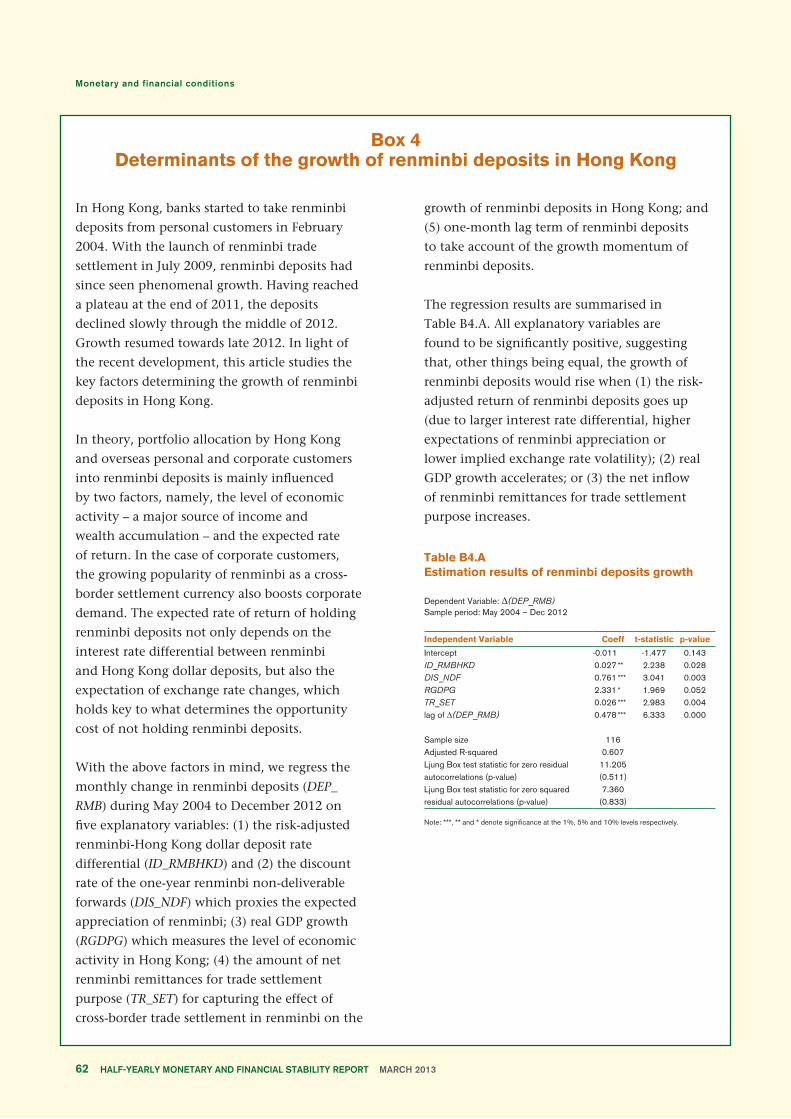
Box 4Determinants of the growth of renminbi deposits in Hong Kong
In Hong Kong, banks started to take renminbi
deposits from personal customers in February
2004. With the launch of renminbi trade
settlement in July 2009, renminbi deposits had
since seen phenomenal growth. Having reached
a plateau at the end of 2011, the deposits
declined slowly through the middle of 2012.
Growth resumed towards late 2012. In light of
the recent development, this article studies the
key factors determining the growth of renminbi
deposits in Hong Kong.
In theory, portfolio allocation by Hong Kong
and overseas personal and corporate customers
into renminbi deposits is mainly influenced
by two factors, namely, the level of economic
activity – a major source of income and
wealth accumulation – and the expected rate
of return. In the case of corporate customers,
the growing popularity of renminbi as a cross-
border settlement currency also boosts corporate
demand. The expected rate of return of holding
renminbi deposits not only depends on the
interest rate differential between renminbi
and Hong Kong dollar deposits, but also the
expectation of exchange rate changes, which
holds key to what determines the opportunity
cost of not holding renminbi deposits.
With the above factors in mind, we regress the
monthly change in renminbi deposits (DEP_
RMB) during May 2004 to December 2012 on
five explanatory variables: (1) the risk-adjusted
renminbi-Hong Kong dollar deposit rate
differential (ID_RMBHKD) and (2) the discount
rate of the one-year renminbi non-deliverable
forwards (DIS_NDF) which proxies the expected
appreciation of renminbi; (3) real GDP growth
(RGDPG) which measures the level of economic
activity in Hong Kong; (4) the amount of net
renminbi remittances for trade settlement
purpose (TR_SET) for capturing the effect of
cross-border trade settlement in renminbi on the
growth of renminbi deposits in Hong Kong; and
(5) one-month lag term of renminbi deposits
to take account of the growth momentum of
renminbi deposits.
The regression results are summarised in
Table B4.A. All explanatory variables are
found to be significantly positive, suggesting
that, other things being equal, the growth of
renminbi deposits would rise when (1) the risk-
adjusted return of renminbi deposits goes up
(due to larger interest rate differential, higher
expectations of renminbi appreciation or
lower implied exchange rate volatility); (2) real
GDP growth accelerates; or (3) the net inflow
of renminbi remittances for trade settlement
purpose increases.
Table B4.AEstimation results of renminbi deposits growth
Dependent Variable: Δ(DEP_RMB)Sample period: May 2004 – Dec 2012
Independent Variable Coeff t-statistic p-value
Intercept -0.011 -1.477 0.143ID_RMBHKD 0.027 ** 2.238 0.028DIS_NDF 0.761 *** 3.041 0.003RGDPG 2.331 * 1.969 0.052TR_SET 0.026 *** 2.983 0.004lag of Δ(DEP_RMB) 0.478 *** 6.333 0.000
Sample size 116Adjusted R-squared 0.607Ljung Box test statistic for zero residual 11.205autocorrelations (p-value) (0.511)Ljung Box test statistic for zero squared 7.360residual autocorrelations (p-value) (0.833)
Note: ***, ** and * denote significance at the 1%, 5% and 10% levels respectively.
Page 62
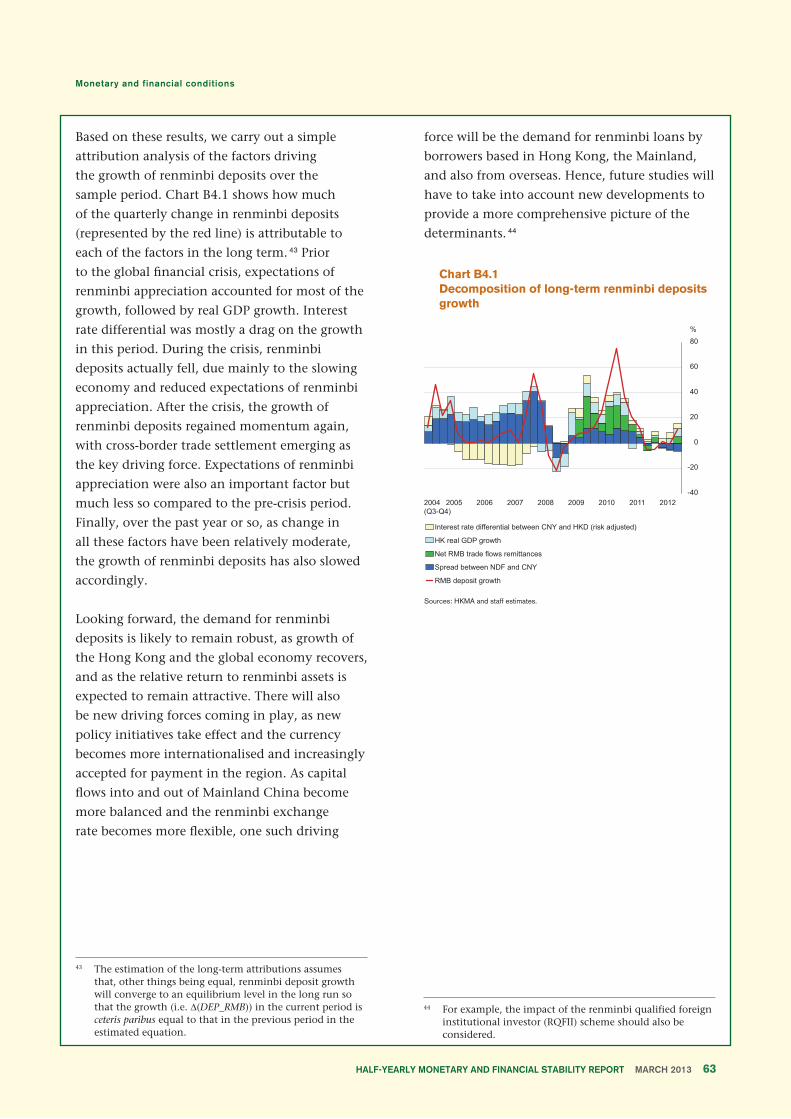
Based on these results, we carry out a simple
attribution analysis of the factors driving
the growth of renminbi deposits over the
sample period. Chart B4.1 shows how much
of the quarterly change in renminbi deposits
(represented by the red line) is attributable to
each of the factors in the long term. 43 Prior
to the global financial crisis, expectations of
renminbi appreciation accounted for most of the
growth, followed by real GDP growth. Interest
rate differential was mostly a drag on the growth
in this period. During the crisis, renminbi
deposits actually fell, due mainly to the slowing
economy and reduced expectations of renminbi
appreciation. After the crisis, the growth of
renminbi deposits regained momentum again,
with cross-border trade settlement emerging as
the key driving force. Expectations of renminbi
appreciation were also an important factor but
much less so compared to the pre-crisis period.
Finally, over the past year or so, as change in
all these factors have been relatively moderate,
the growth of renminbi deposits has also slowed
accordingly.
Looking forward, the demand for renminbi
deposits is likely to remain robust, as growth of
the Hong Kong and the global economy recovers,
and as the relative return to renminbi assets is
expected to remain attractive. There will also
be new driving forces coming in play, as new
policy initiatives take effect and the currency
becomes more internationalised and increasingly
accepted for payment in the region. As capital
flows into and out of Mainland China become
more balanced and the renminbi exchange
rate becomes more flexible, one such driving
force will be the demand for renminbi loans by
borrowers based in Hong Kong, the Mainland,
and also from overseas. Hence, future studies will
have to take into account new developments to
provide a more comprehensive picture of the
determinants. 44
Chart B4.1Decomposition of long-term renminbi deposits growth
Sources: HKMA and staff estimates.
Page 63
44 For example, the impact of the renminbi qualified foreign institutional investor (RQFII) scheme should also be considered.
43 The estimation of the long-term attributions assumes that, other things being equal, renminbi deposit growth will converge to an equilibrium level in the long run so that the growth (i.e. Δ(DEP_RMB)) in the current period is ceteris paribus equal to that in the previous period in the estimated equation.
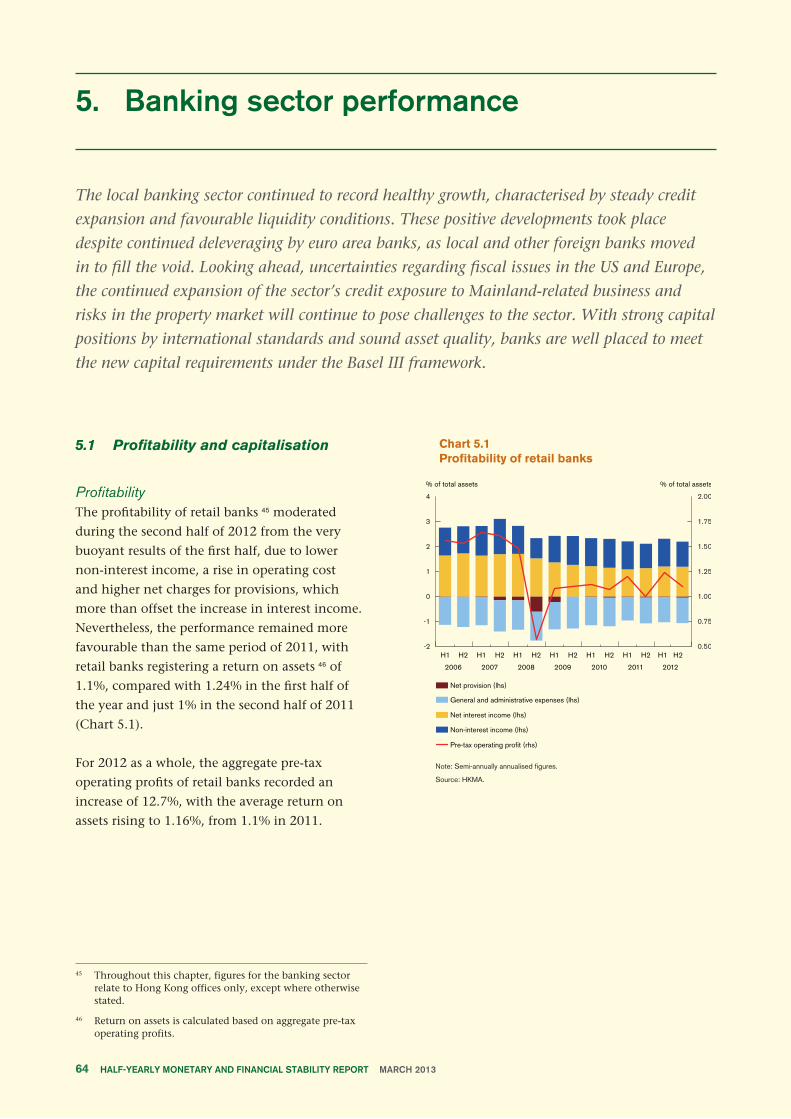
5. Banking sector performance
The local banking sector continued to record healthy growth, characterised by steady credit
expansion and favourable liquidity conditions. These positive developments took place
despite continued deleveraging by euro area banks, as local and other foreign banks moved
in to fill the void. Looking ahead, uncertainties regarding fiscal issues in the US and Europe,
the continued expansion of the sector’s credit exposure to Mainland-related business and
risks in the property market will continue to pose challenges to the sector. With strong capital
positions by international standards and sound asset quality, banks are well placed to meet
the new capital requirements under the Basel III framework.
5.1 Profitability and capitalisation
ProfitabilityThe profitability of retail banks 45 moderated
during the second half of 2012 from the very
buoyant results of the first half, due to lower
non-interest income, a rise in operating cost
and higher net charges for provisions, which
more than offset the increase in interest income.
Nevertheless, the performance remained more
favourable than the same period of 2011, with
retail banks registering a return on assets 46 of
1.1%, compared with 1.24% in the first half of
the year and just 1% in the second half of 2011
(Chart 5.1).
For 2012 as a whole, the aggregate pre-tax
operating profits of retail banks recorded an
increase of 12.7%, with the average return on
assets rising to 1.16%, from 1.1% in 2011.
Chart 5.1Profitability of retail banks
Note: Semi-annually annualised figures.
Source: HKMA.
Page 64
45 Throughout this chapter, figures for the banking sector relate to Hong Kong offices only, except where otherwise stated.
46 Return on assets is calculated based on aggregate pre-tax operating profits.
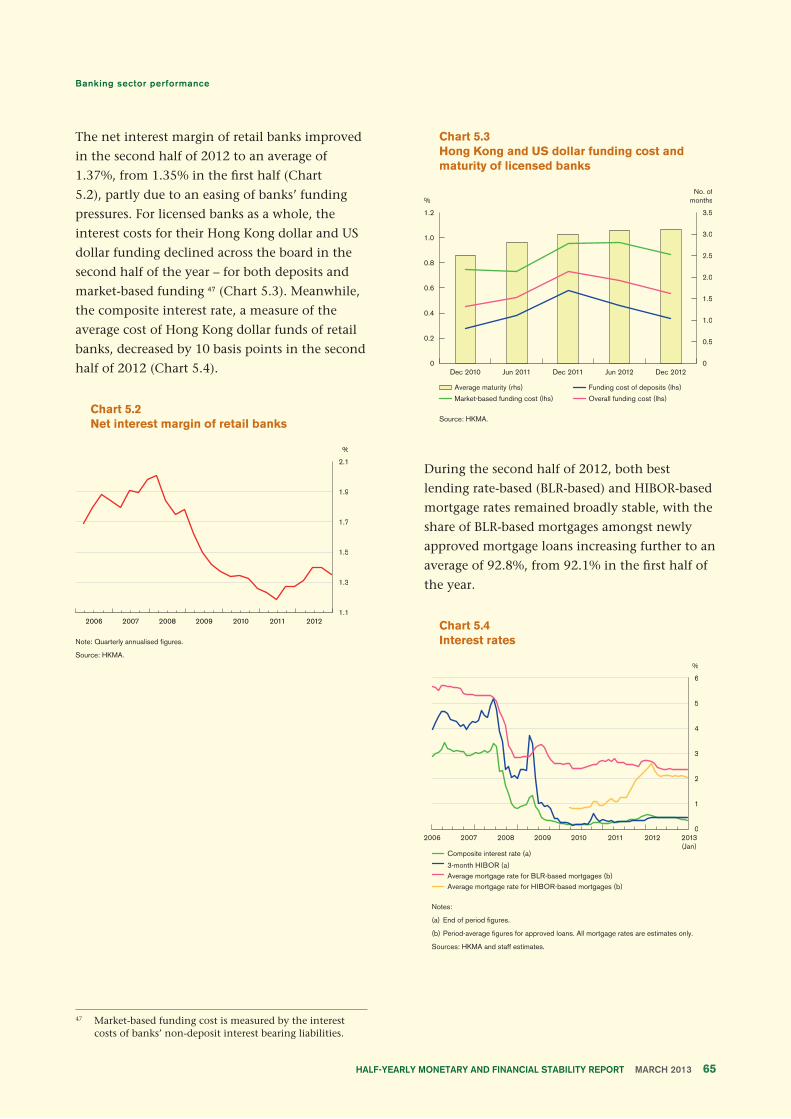
The net interest margin of retail banks improved
in the second half of 2012 to an average of
1.37%, from 1.35% in the first half (Chart
5.2), partly due to an easing of banks’ funding
pressures. For licensed banks as a whole, the
interest costs for their Hong Kong dollar and US
dollar funding declined across the board in the
second half of the year – for both deposits and
market-based funding 47 (Chart 5.3). Meanwhile,
the composite interest rate, a measure of the
average cost of Hong Kong dollar funds of retail
banks, decreased by 10 basis points in the second
half of 2012 (Chart 5.4).
Chart 5.2Net interest margin of retail banks
Note: Quarterly annualised figures.
Source: HKMA.
Chart 5.3Hong Kong and US dollar funding cost and maturity of licensed banks
Source: HKMA.
During the second half of 2012, both best
lending rate-based (BLR-based) and HIBOR-based
mortgage rates remained broadly stable, with the
share of BLR-based mortgages amongst newly
approved mortgage loans increasing further to an
average of 92.8%, from 92.1% in the first half of
the year.
Chart 5.4Interest rates
Notes:
(a) End of period figures.
(b) Period-average figures for approved loans. All mortgage rates are estimates only.
Sources: HKMA and staff estimates.
47 Market-based funding cost is measured by the interest costs of banks’ non-deposit interest bearing liabilities.
Page 65
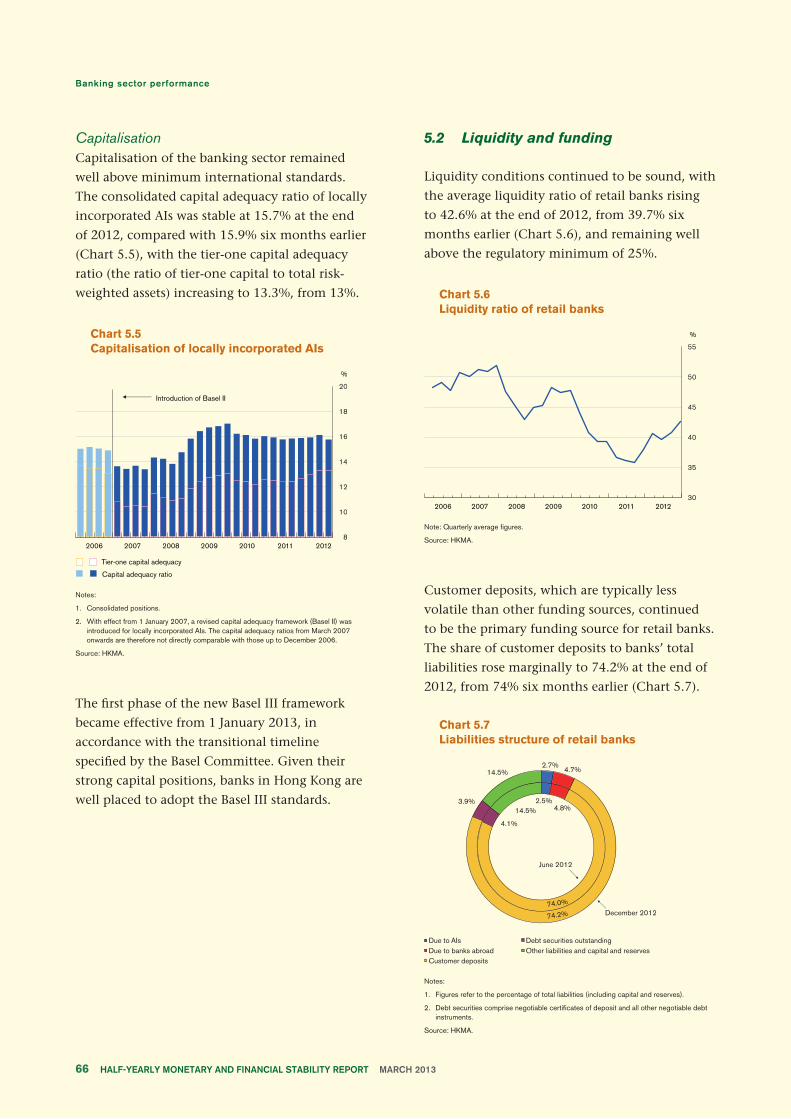
CapitalisationCapitalisation of the banking sector remained
well above minimum international standards.
The consolidated capital adequacy ratio of locally
incorporated AIs was stable at 15.7% at the end
of 2012, compared with 15.9% six months earlier
(Chart 5.5), with the tier-one capital adequacy
ratio (the ratio of tier-one capital to total risk-
weighted assets) increasing to 13.3%, from 13%.
Chart 5.5Capitalisation of locally incorporated AIs
Notes:
1. Consolidated positions.
2. With effect from 1 January 2007, a revised capital adequacy framework (Basel II) was introduced for locally incorporated AIs. The capital adequacy ratios from March 2007 onwards are therefore not directly comparable with those up to December 2006.
Source: HKMA.
The first phase of the new Basel III framework
became effective from 1 January 2013, in
accordance with the transitional timeline
specified by the Basel Committee. Given their
strong capital positions, banks in Hong Kong are
well placed to adopt the Basel III standards.
5.2 Liquidity and funding
Liquidity conditions continued to be sound, with
the average liquidity ratio of retail banks rising
to 42.6% at the end of 2012, from 39.7% six
months earlier (Chart 5.6), and remaining well
above the regulatory minimum of 25%.
Chart 5.6Liquidity ratio of retail banks
Note: Quarterly average figures.
Source: HKMA.
Customer deposits, which are typically less
volatile than other funding sources, continued
to be the primary funding source for retail banks.
The share of customer deposits to banks’ total
liabilities rose marginally to 74.2% at the end of
2012, from 74% six months earlier (Chart 5.7).
Chart 5.7Liabilities structure of retail banks
Notes:
1. Figures refer to the percentage of total liabilities (including capital and reserves).
2. Debt securities comprise negotiable certificates of deposit and all other negotiable debt instruments.
Source: HKMA.
Page 66
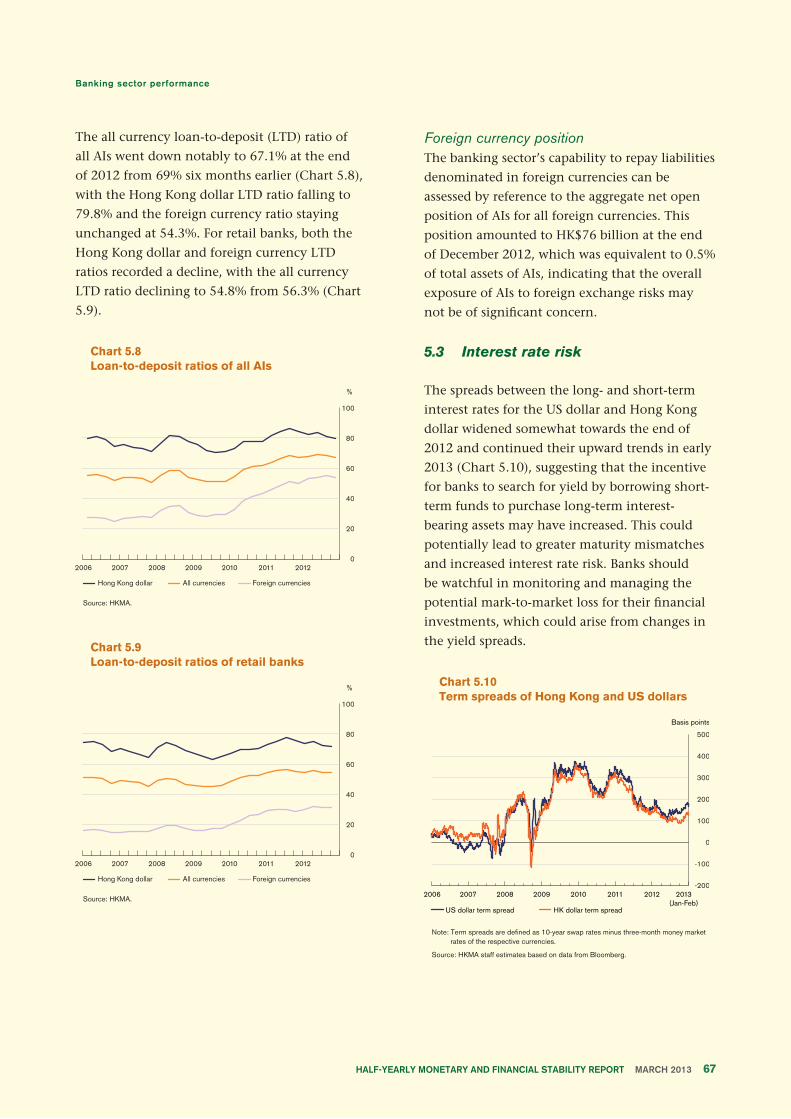
The all currency loan-to-deposit (LTD) ratio of
all AIs went down notably to 67.1% at the end
of 2012 from 69% six months earlier (Chart 5.8),
with the Hong Kong dollar LTD ratio falling to
79.8% and the foreign currency ratio staying
unchanged at 54.3%. For retail banks, both the
Hong Kong dollar and foreign currency LTD
ratios recorded a decline, with the all currency
LTD ratio declining to 54.8% from 56.3% (Chart
5.9).
Chart 5.8Loan-to-deposit ratios of all AIs
Source: HKMA.
Chart 5.9Loan-to-deposit ratios of retail banks
Source: HKMA.
Foreign currency positionThe banking sector’s capability to repay liabilities
denominated in foreign currencies can be
assessed by reference to the aggregate net open
position of AIs for all foreign currencies. This
position amounted to HK$76 billion at the end
of December 2012, which was equivalent to 0.5%
of total assets of AIs, indicating that the overall
exposure of AIs to foreign exchange risks may
not be of significant concern.
5.3 Interest rate risk
The spreads between the long- and short-term
interest rates for the US dollar and Hong Kong
dollar widened somewhat towards the end of
2012 and continued their upward trends in early
2013 (Chart 5.10), suggesting that the incentive
for banks to search for yield by borrowing short-
term funds to purchase long-term interest-
bearing assets may have increased. This could
potentially lead to greater maturity mismatches
and increased interest rate risk. Banks should
be watchful in monitoring and managing the
potential mark-to-market loss for their financial
investments, which could arise from changes in
the yield spreads.
Chart 5.10Term spreads of Hong Kong and US dollars
Note: Term spreads are defined as 10-year swap rates minus three-month money market rates of the respective currencies.
Source: HKMA staff estimates based on data from Bloomberg.
Page 67
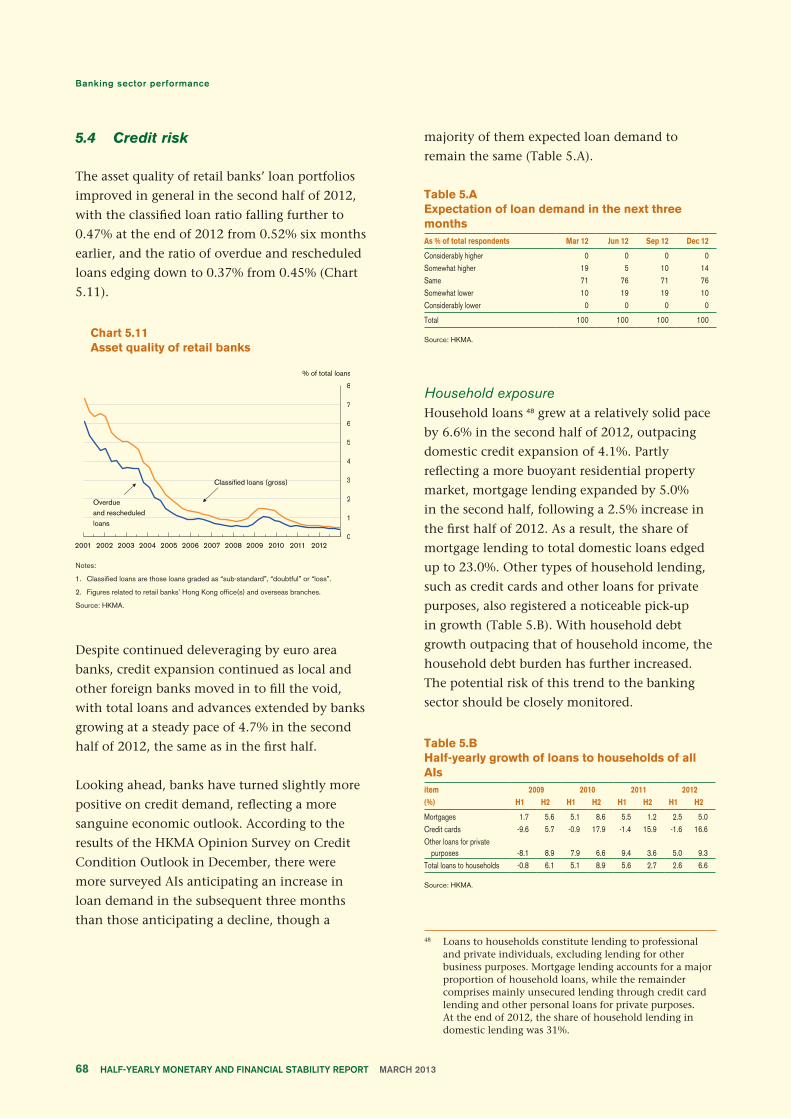
5.4 Credit risk
The asset quality of retail banks’ loan portfolios
improved in general in the second half of 2012,
with the classified loan ratio falling further to
0.47% at the end of 2012 from 0.52% six months
earlier, and the ratio of overdue and rescheduled
loans edging down to 0.37% from 0.45% (Chart
5.11).
Chart 5.11Asset quality of retail banks
Notes:
1. Classified loans are those loans graded as “sub-standard”, “doubtful” or “loss”.
2. Figures related to retail banks’ Hong Kong office(s) and overseas branches.
Source: HKMA.
Despite continued deleveraging by euro area
banks, credit expansion continued as local and
other foreign banks moved in to fill the void,
with total loans and advances extended by banks
growing at a steady pace of 4.7% in the second
half of 2012, the same as in the first half.
Looking ahead, banks have turned slightly more
positive on credit demand, reflecting a more
sanguine economic outlook. According to the
results of the HKMA Opinion Survey on Credit
Condition Outlook in December, there were
more surveyed AIs anticipating an increase in
loan demand in the subsequent three months
than those anticipating a decline, though a 48 Loans to households constitute lending to professional
and private individuals, excluding lending for other business purposes. Mortgage lending accounts for a major proportion of household loans, while the remainder comprises mainly unsecured lending through credit card lending and other personal loans for private purposes. At the end of 2012, the share of household lending in domestic lending was 31%.
Page 68
majority of them expected loan demand to
remain the same (Table 5.A).
Table 5.AExpectation of loan demand in the next three monthsAs % of total respondents Mar 12 Jun 12 Sep 12 Dec 12
Considerably higher 0 0 0 0Somewhat higher 19 5 10 14Same 71 76 71 76Somewhat lower 10 19 19 10Considerably lower 0 0 0 0
Total 100 100 100 100
Source: HKMA.
Household exposureHousehold loans 48 grew at a relatively solid pace
by 6.6% in the second half of 2012, outpacing
domestic credit expansion of 4.1%. Partly
reflecting a more buoyant residential property
market, mortgage lending expanded by 5.0%
in the second half, following a 2.5% increase in
the first half of 2012. As a result, the share of
mortgage lending to total domestic loans edged
up to 23.0%. Other types of household lending,
such as credit cards and other loans for private
purposes, also registered a noticeable pick-up
in growth (Table 5.B). With household debt
growth outpacing that of household income, the
household debt burden has further increased.
The potential risk of this trend to the banking
sector should be closely monitored.
Table 5.BHalf-yearly growth of loans to households of all AIsitem 2009 2010 2011 2012(%) H1 H2 H1 H2 H1 H2 H1 H2
Mortgages 1.7 5.6 5.1 8.6 5.5 1.2 2.5 5.0Credit cards -9.6 5.7 -0.9 17.9 -1.4 15.9 -1.6 16.6Other loans for private purposes -8.1 8.9 7.9 6.6 9.4 3.6 5.0 9.3Total loans to households -0.8 6.1 5.1 8.9 5.6 2.7 2.6 6.6
Source: HKMA.
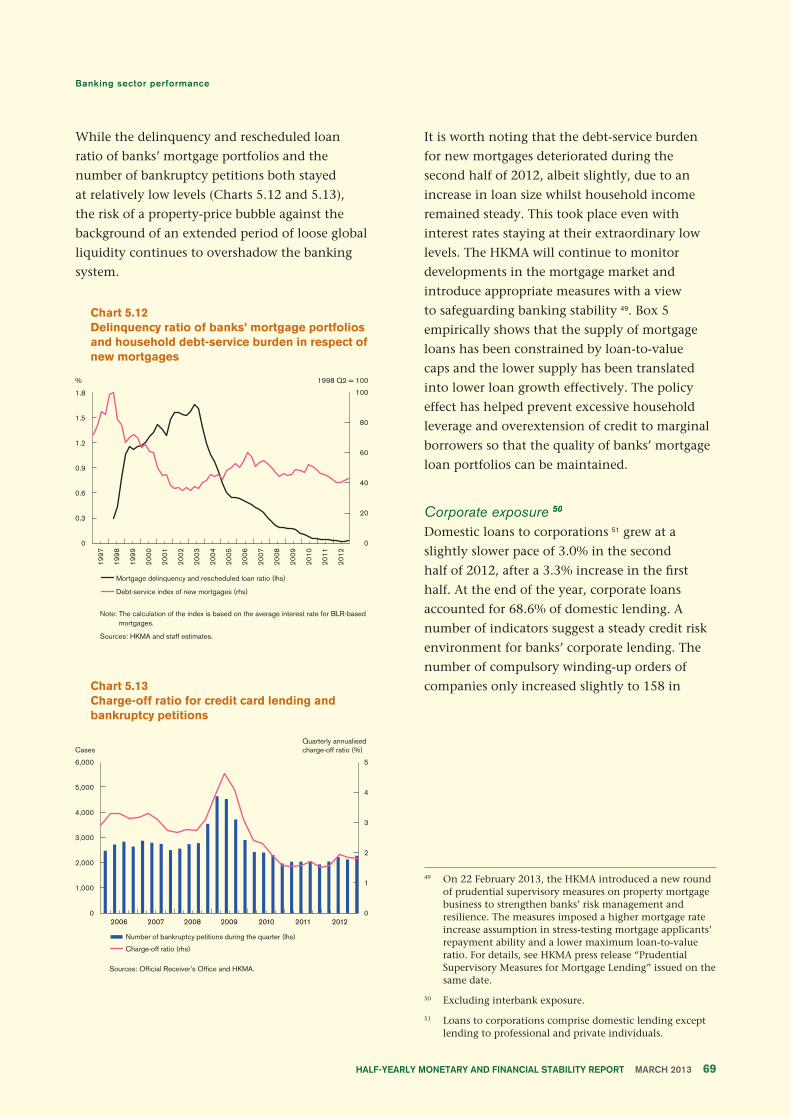
While the delinquency and rescheduled loan
ratio of banks’ mortgage portfolios and the
number of bankruptcy petitions both stayed
at relatively low levels (Charts 5.12 and 5.13),
the risk of a property-price bubble against the
background of an extended period of loose global
liquidity continues to overshadow the banking
system.
Chart 5.12Delinquency ratio of banks’ mortgage portfolios and household debt-service burden in respect of new mortgages
Note: The calculation of the index is based on the average interest rate for BLR-based mortgages.
Sources: HKMA and staff estimates.
Chart 5.13Charge-off ratio for credit card lending and bankruptcy petitions
Sources: Official Receiver’s Office and HKMA.
It is worth noting that the debt-service burden
for new mortgages deteriorated during the
second half of 2012, albeit slightly, due to an
increase in loan size whilst household income
remained steady. This took place even with
interest rates staying at their extraordinary low
levels. The HKMA will continue to monitor
developments in the mortgage market and
introduce appropriate measures with a view
to safeguarding banking stability 49. Box 5
empirically shows that the supply of mortgage
loans has been constrained by loan-to-value
caps and the lower supply has been translated
into lower loan growth effectively. The policy
effect has helped prevent excessive household
leverage and overextension of credit to marginal
borrowers so that the quality of banks’ mortgage
loan portfolios can be maintained.
Corporate exposure 50
Domestic loans to corporations 51 grew at a
slightly slower pace of 3.0% in the second
half of 2012, after a 3.3% increase in the first
half. At the end of the year, corporate loans
accounted for 68.6% of domestic lending. A
number of indicators suggest a steady credit risk
environment for banks’ corporate lending. The
number of compulsory winding-up orders of
companies only increased slightly to 158 in
49 On 22 February 2013, the HKMA introduced a new round of prudential supervisory measures on property mortgage business to strengthen banks’ risk management and resilience. The measures imposed a higher mortgage rate increase assumption in stress-testing mortgage applicants’ repayment ability and a lower maximum loan-to-value ratio. For details, see HKMA press release “Prudential Supervisory Measures for Mortgage Lending” issued on the same date.
50 Excluding interbank exposure.
51 Loans to corporations comprise domestic lending except lending to professional and private individuals.
Page 69
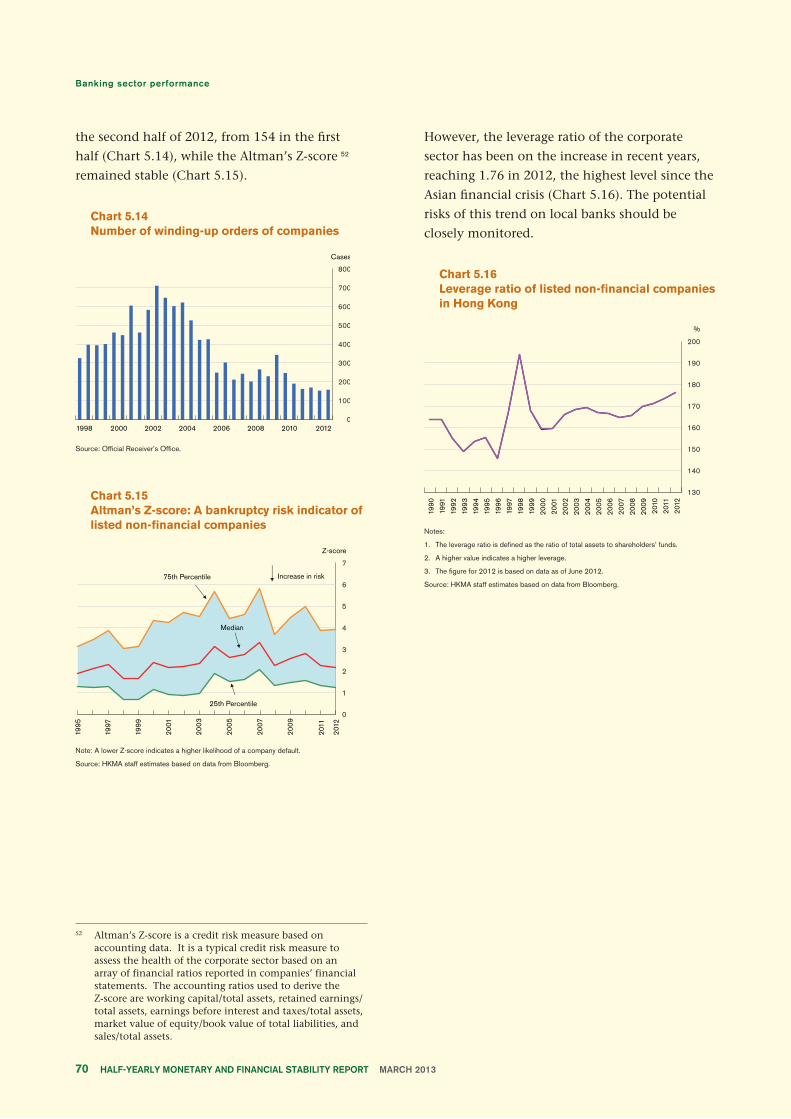
the second half of 2012, from 154 in the first
half (Chart 5.14), while the Altman’s Z-score 52
remained stable (Chart 5.15).
Chart 5.14Number of winding-up orders of companies
Source: Official Receiver’s Office.
Chart 5.15Altman’s Z-score: A bankruptcy risk indicator of listed non-financial companies
Note: A lower Z-score indicates a higher likelihood of a company default.
Source: HKMA staff estimates based on data from Bloomberg.
However, the leverage ratio of the corporate
sector has been on the increase in recent years,
reaching 1.76 in 2012, the highest level since the
Asian financial crisis (Chart 5.16). The potential
risks of this trend on local banks should be
closely monitored.
Chart 5.16Leverage ratio of listed non-financial companies in Hong Kong
Notes:
1. The leverage ratio is defined as the ratio of total assets to shareholders’ funds.
2. A higher value indicates a higher leverage.
3. The figure for 2012 is based on data as of June 2012.
Source: HKMA staff estimates based on data from Bloomberg.
52 Altman’s Z-score is a credit risk measure based on accounting data. It is a typical credit risk measure to assess the health of the corporate sector based on an array of financial ratios reported in companies’ financial statements. The accounting ratios used to derive the Z-score are working capital/total assets, retained earnings/total assets, earnings before interest and taxes/total assets, market value of equity/book value of total liabilities, and sales/total assets.
Page 70
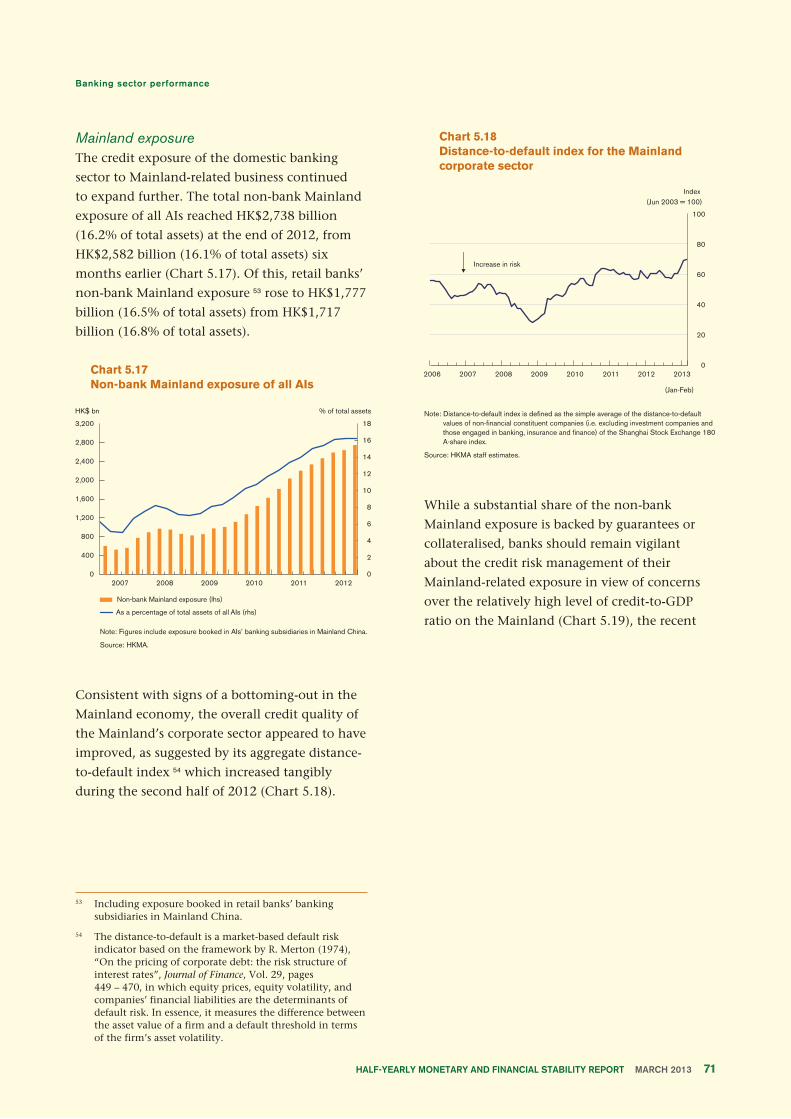
Mainland exposureThe credit exposure of the domestic banking
sector to Mainland-related business continued
to expand further. The total non-bank Mainland
exposure of all AIs reached HK$2,738 billion
(16.2% of total assets) at the end of 2012, from
HK$2,582 billion (16.1% of total assets) six
months earlier (Chart 5.17). Of this, retail banks’
non-bank Mainland exposure 53 rose to HK$1,777
billion (16.5% of total assets) from HK$1,717
billion (16.8% of total assets).
Chart 5.17Non-bank Mainland exposure of all AIs
Note: Figures include exposure booked in AIs’ banking subsidiaries in Mainland China.
Source: HKMA.
Consistent with signs of a bottoming-out in the
Mainland economy, the overall credit quality of
the Mainland’s corporate sector appeared to have
improved, as suggested by its aggregate distance-
to-default index 54 which increased tangibly
during the second half of 2012 (Chart 5.18).
Chart 5.18Distance-to-default index for the Mainland corporate sector
Note: Distance-to-default index is defined as the simple average of the distance-to-default values of non-financial constituent companies (i.e. excluding investment companies and those engaged in banking, insurance and finance) of the Shanghai Stock Exchange 180 A-share index.
Source: HKMA staff estimates.
While a substantial share of the non-bank
Mainland exposure is backed by guarantees or
collateralised, banks should remain vigilant
about the credit risk management of their
Mainland-related exposure in view of concerns
over the relatively high level of credit-to-GDP
ratio on the Mainland (Chart 5.19), the recent
53 Including exposure booked in retail banks’ banking subsidiaries in Mainland China.
54 The distance-to-default is a market-based default risk indicator based on the framework by R. Merton (1974), “On the pricing of corporate debt: the risk structure of interest rates”, Journal of Finance, Vol. 29, pages 449 – 470, in which equity prices, equity volatility, and companies’ financial liabilities are the determinants of default risk. In essence, it measures the difference between the asset value of a firm and a default threshold in terms of the firm’s asset volatility.
Page 71
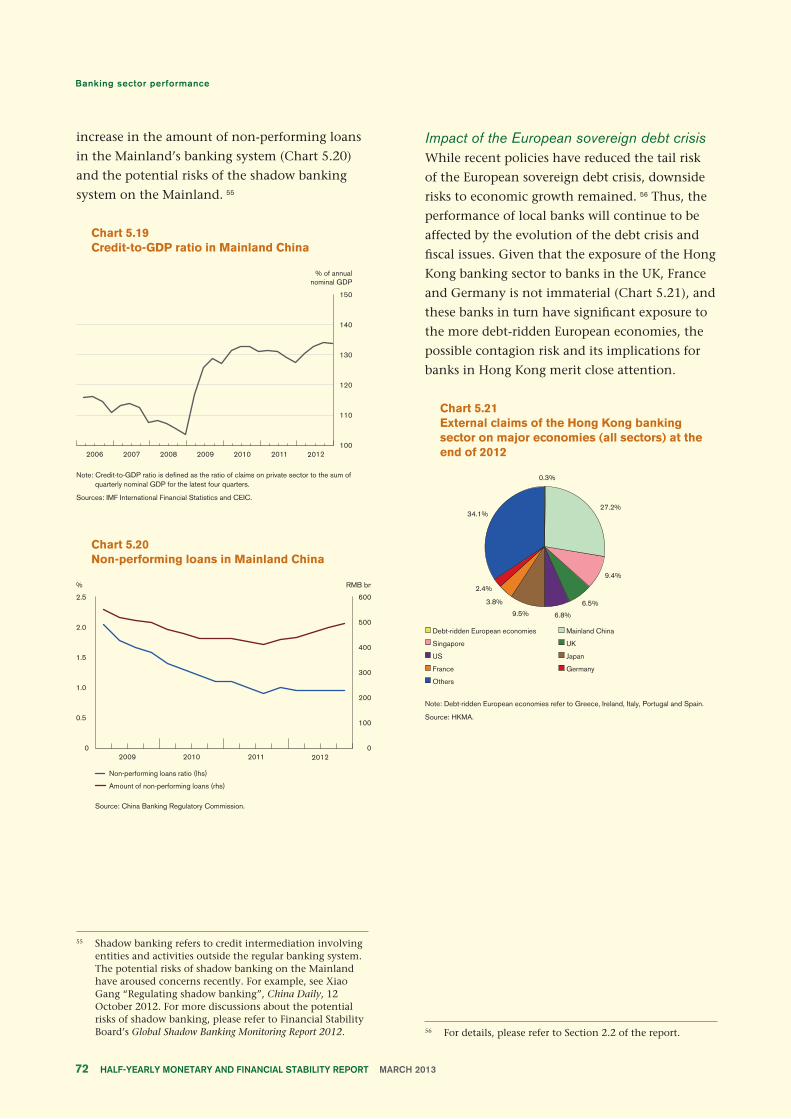
increase in the amount of non-performing loans
in the Mainland’s banking system (Chart 5.20)
and the potential risks of the shadow banking
system on the Mainland. 55
Chart 5.19Credit-to-GDP ratio in Mainland China
Note: Credit-to-GDP ratio is defined as the ratio of claims on private sector to the sum of quarterly nominal GDP for the latest four quarters.
Sources: IMF International Financial Statistics and CEIC.
Chart 5.20Non-performing loans in Mainland China
Source: China Banking Regulatory Commission.
Impact of the European sovereign debt crisisWhile recent policies have reduced the tail risk
of the European sovereign debt crisis, downside
risks to economic growth remained. 56 Thus, the
performance of local banks will continue to be
affected by the evolution of the debt crisis and
fiscal issues. Given that the exposure of the Hong
Kong banking sector to banks in the UK, France
and Germany is not immaterial (Chart 5.21), and
these banks in turn have significant exposure to
the more debt-ridden European economies, the
possible contagion risk and its implications for
banks in Hong Kong merit close attention.
Chart 5.21External claims of the Hong Kong banking sector on major economies (all sectors) at the end of 2012
Note: Debt-ridden European economies refer to Greece, Ireland, Italy, Portugal and Spain.
Source: HKMA.
55 Shadow banking refers to credit intermediation involving entities and activities outside the regular banking system. The potential risks of shadow banking on the Mainland have aroused concerns recently. For example, see Xiao Gang “Regulating shadow banking”, China Daily, 12 October 2012. For more discussions about the potential risks of shadow banking, please refer to Financial Stability Board’s Global Shadow Banking Monitoring Report 2012. 56 For details, please refer to Section 2.2 of the report.
Page 72
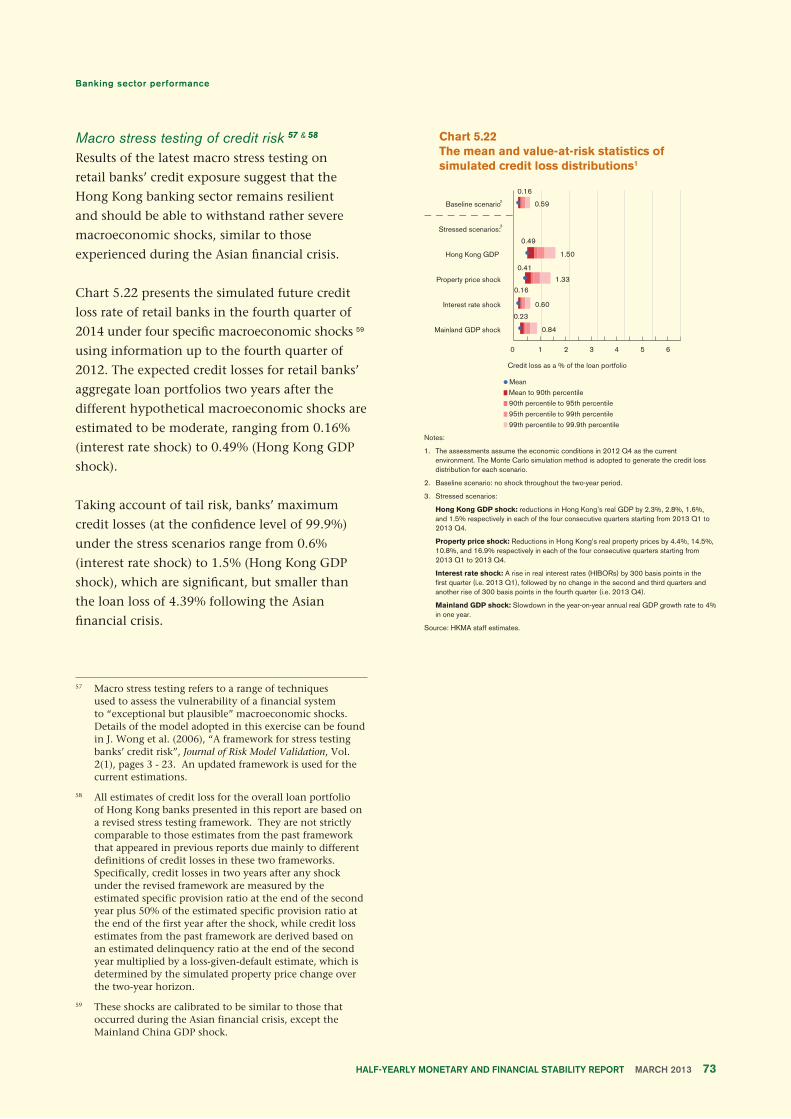
Macro stress testing of credit risk 57 & 58
Results of the latest macro stress testing on
retail banks’ credit exposure suggest that the
Hong Kong banking sector remains resilient
and should be able to withstand rather severe
macroeconomic shocks, similar to those
experienced during the Asian financial crisis.
Chart 5.22 presents the simulated future credit
loss rate of retail banks in the fourth quarter of
2014 under four specific macroeconomic shocks 59
using information up to the fourth quarter of
2012. The expected credit losses for retail banks’
aggregate loan portfolios two years after the
different hypothetical macroeconomic shocks are
estimated to be moderate, ranging from 0.16%
(interest rate shock) to 0.49% (Hong Kong GDP
shock).
Taking account of tail risk, banks’ maximum
credit losses (at the confidence level of 99.9%)
under the stress scenarios range from 0.6%
(interest rate shock) to 1.5% (Hong Kong GDP
shock), which are significant, but smaller than
the loan loss of 4.39% following the Asian
financial crisis.
Chart 5.22The mean and value-at-risk statistics of simulated credit loss distributions1
Notes:
1. The assessments assume the economic conditions in 2012 Q4 as the current environment. The Monte Carlo simulation method is adopted to generate the credit loss distribution for each scenario.
2. Baseline scenario: no shock throughout the two-year period.
3. Stressed scenarios:
Hong Kong GDP shock: reductions in Hong Kong’s real GDP by 2.3%, 2.8%, 1.6%, and 1.5% respectively in each of the four consecutive quarters starting from 2013 Q1 to 2013 Q4.
Property price shock: Reductions in Hong Kong’s real property prices by 4.4%, 14.5%, 10.8%, and 16.9% respectively in each of the four consecutive quarters starting from 2013 Q1 to 2013 Q4.
Interest rate shock: A rise in real interest rates (HIBORs) by 300 basis points in the first quarter (i.e. 2013 Q1), followed by no change in the second and third quarters and another rise of 300 basis points in the fourth quarter (i.e. 2013 Q4).
Mainland GDP shock: Slowdown in the year-on-year annual real GDP growth rate to 4% in one year.
Source: HKMA staff estimates.
57 Macro stress testing refers to a range of techniques used to assess the vulnerability of a financial system to “exceptional but plausible” macroeconomic shocks. Details of the model adopted in this exercise can be found in J. Wong et al. (2006), “A framework for stress testing banks’ credit risk”, Journal of Risk Model Validation, Vol. 2(1), pages 3 - 23. An updated framework is used for the current estimations.
58 All estimates of credit loss for the overall loan portfolio of Hong Kong banks presented in this report are based on a revised stress testing framework. They are not strictly comparable to those estimates from the past framework that appeared in previous reports due mainly to different definitions of credit losses in these two frameworks. Specifically, credit losses in two years after any shock under the revised framework are measured by the estimated specific provision ratio at the end of the second year plus 50% of the estimated specific provision ratio at the end of the first year after the shock, while credit loss estimates from the past framework are derived based on an estimated delinquency ratio at the end of the second year multiplied by a loss-given-default estimate, which is determined by the simulated property price change over the two-year horizon.
59 These shocks are calibrated to be similar to those that occurred during the Asian financial crisis, except the Mainland China GDP shock.
Page 73
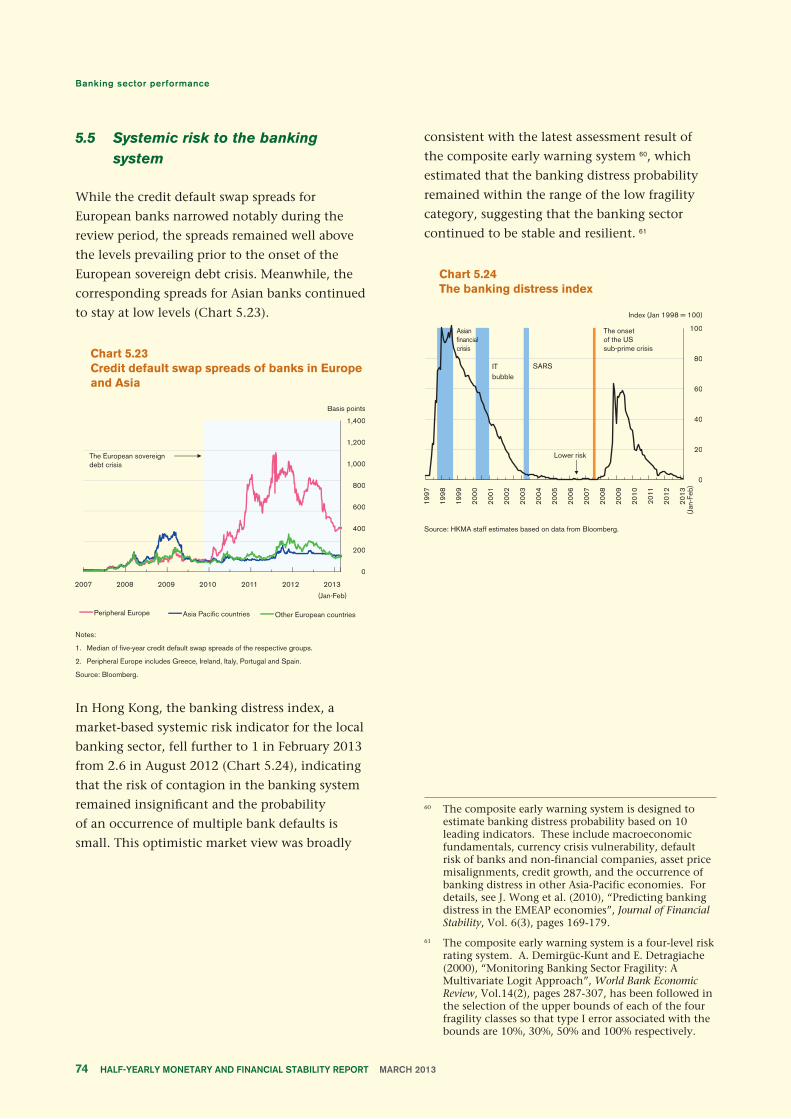
5.5 Systemic risk to the banking system
While the credit default swap spreads for
European banks narrowed notably during the
review period, the spreads remained well above
the levels prevailing prior to the onset of the
European sovereign debt crisis. Meanwhile, the
corresponding spreads for Asian banks continued
to stay at low levels (Chart 5.23).
Chart 5.23Credit default swap spreads of banks in Europe and Asia
Notes:
1. Median of five-year credit default swap spreads of the respective groups.
2. Peripheral Europe includes Greece, Ireland, Italy, Portugal and Spain.
Source: Bloomberg.
In Hong Kong, the banking distress index, a
market-based systemic risk indicator for the local
banking sector, fell further to 1 in February 2013
from 2.6 in August 2012 (Chart 5.24), indicating
that the risk of contagion in the banking system
remained insignificant and the probability
of an occurrence of multiple bank defaults is
small. This optimistic market view was broadly
consistent with the latest assessment result of
the composite early warning system 60, which
estimated that the banking distress probability
remained within the range of the low fragility
category, suggesting that the banking sector
continued to be stable and resilient. 61
Chart 5.24The banking distress index
Source: HKMA staff estimates based on data from Bloomberg.
60 The composite early warning system is designed to estimate banking distress probability based on 10 leading indicators. These include macroeconomic fundamentals, currency crisis vulnerability, default risk of banks and non-financial companies, asset price misalignments, credit growth, and the occurrence of banking distress in other Asia-Pacific economies. For details, see J. Wong et al. (2010), “Predicting banking distress in the EMEAP economies”, Journal of Financial Stability, Vol. 6(3), pages 169-179.
61 The composite early warning system is a four-level risk rating system. A. Demirgüc-Kunt and E. Detragiache (2000), “Monitoring Banking Sector Fragility: A Multivariate Logit Approach”, World Bank Economic Review, Vol.14(2), pages 287-307, has been followed in the selection of the upper bounds of each of the four fragility classes so that type I error associated with the bounds are 10%, 30%, 50% and 100% respectively.
Page 74

The recent financial crisis has highlighted
the important role of global banks in the
transmission of shocks across banking sectors
in different economies. Box 6 assesses how
US and European banks have adjusted the
business models of their Hong Kong branches
after the 2008-09 global financial crisis. The
result shows that these adjustments are likely to
produce two different opposing effects on shock
transmissions. The favourable impact sees them
becoming less prone to drastic withdrawal of
funds by their head offices during crises than
before, due to the shift of some of these branches
from operating traditionally as regional funding
centres of global banks to performing as their
regional lending units. Counteracting this are the
more adverse impacts of any given withdrawal of
funds due to the greater reliance of the branches
on intra-group funding to fund their lending
activities in the region.
Key performance indicators of the banking sector
are provided in Table 5.C.
Page 75
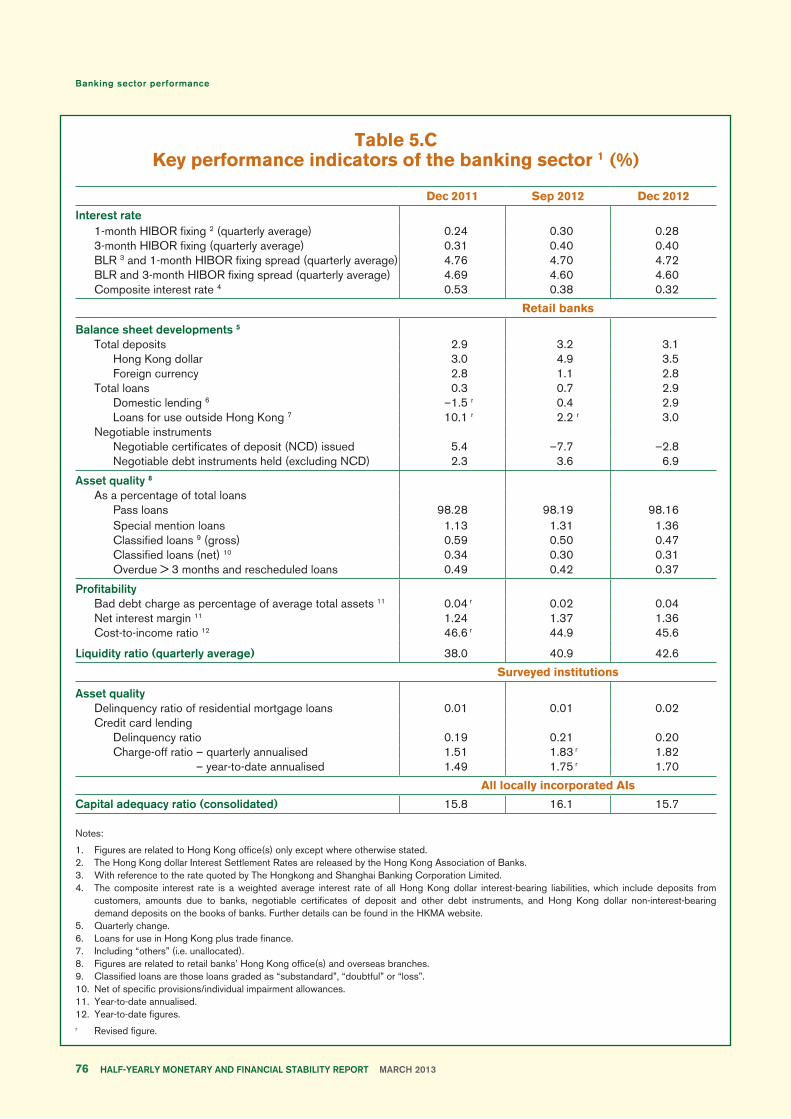
Table 5.CKey performance indicators of the banking sector 1 (%)
Item Dec 2011 Sep 2012 Dec 2012
Interest rate1-month HIBOR fixing 2 (quarterly average) 0.24 0.30 0.283-month HIBOR fixing (quarterly average) 0.31 0.40 0.40BLR 3 and 1-month HIBOR fixing spread (quarterly average) 4.76 4.70 4.72BLR and 3-month HIBOR fixing spread (quarterly average) 4.69 4.60 4.60Composite interest rate 4 0.53 0.38 0.32
Retail banks
Balance sheet developments 5
Total deposits 2.9 3.2 3.1Hong Kong dollar 3.0 4.9 3.5Foreign currency 2.8 1.1 2.8
Total loans 0.3 0.7 2.9Domestic lending 6 –1.5 r 0.4 2.9Loans for use outside Hong Kong 7 10.1 r 2.2 r 3.0
Negotiable instrumentsNegotiable certificates of deposit (NCD) issued 5.4 –7.7 –2.8Negotiable debt instruments held (excluding NCD) 2.3 3.6 6.9
Asset quality 8
As a percentage of total loansPass loans 98.28 98.19 98.16Special mention loans 1.13 1.31 1.36Classified loans 9 (gross) 0.59 0.50 0.47Classified loans (net) 10 0.34 0.30 0.31Overdue > 3 months and rescheduled loans 0.49 0.42 0.37
ProfitabilityBad debt charge as percentage of average total assets 11 0.04 r 0.02 0.04Net interest margin 11 1.24 1.37 1.36Cost-to-income ratio 12 46.6 r 44.9 45.6
Liquidity ratio (quarterly average) 38.0 40.9 42.6
Surveyed institutions
Asset qualityDelinquency ratio of residential mortgage loans 0.01 0.01 0.02Credit card lending
Delinquency ratio 0.19 0.21 0.20Charge-off ratio – quarterly annualised 1.51 1.83 r 1.82
– year-to-date annualised 1.49 1.75 r 1.70
All locally incorporated AIs
Capital adequacy ratio (consolidated) 15.8 16.1 15.7
Notes:
1. Figures are related to Hong Kong office(s) only except where otherwise stated.2. The Hong Kong dollar Interest Settlement Rates are released by the Hong Kong Association of Banks.3. With reference to the rate quoted by The Hongkong and Shanghai Banking Corporation Limited.4. The composite interest rate is a weighted average interest rate of all Hong Kong dollar interest-bearing liabilities, which include deposits from
customers, amounts due to banks, negotiable certificates of deposit and other debt instruments, and Hong Kong dollar non-interest-bearing demand deposits on the books of banks. Further details can be found in the HKMA website.
5. Quarterly change.6. Loans for use in Hong Kong plus trade finance.7. Including “others” (i.e. unallocated).8. Figures are related to retail banks’ Hong Kong office(s) and overseas branches.9. Classified loans are those loans graded as “substandard”, “doubtful” or “loss”.10. Net of specific provisions/individual impairment allowances.11. Year-to-date annualised.12. Year-to-date figures.r Revised figure.
Page 76
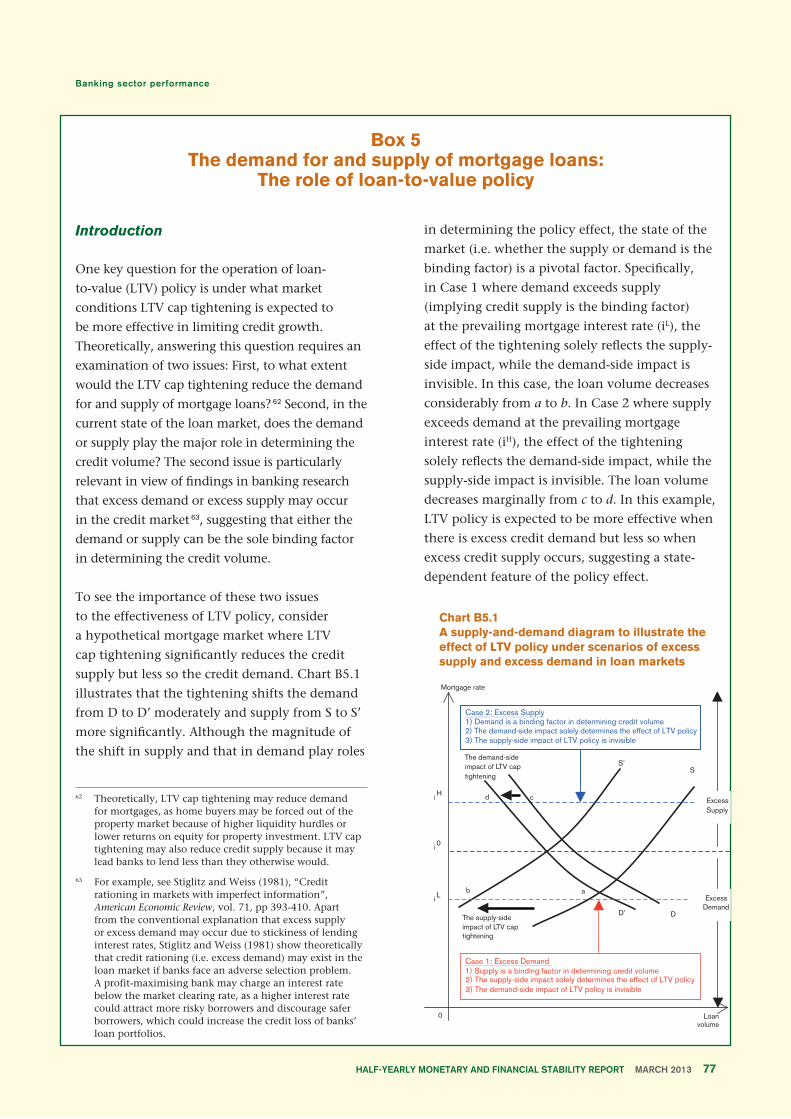
Introduction
One key question for the operation of loan-
to-value (LTV) policy is under what market
conditions LTV cap tightening is expected to
be more effective in limiting credit growth.
Theoretically, answering this question requires an
examination of two issues: First, to what extent
would the LTV cap tightening reduce the demand
for and supply of mortgage loans? 62 Second, in the
current state of the loan market, does the demand
or supply play the major role in determining the
credit volume? The second issue is particularly
relevant in view of findings in banking research
that excess demand or excess supply may occur
in the credit market 63, suggesting that either the
demand or supply can be the sole binding factor
in determining the credit volume.
To see the importance of these two issues
to the effectiveness of LTV policy, consider
a hypothetical mortgage market where LTV
cap tightening significantly reduces the credit
supply but less so the credit demand. Chart B5.1
illustrates that the tightening shifts the demand
from D to D’ moderately and supply from S to S’
more significantly. Although the magnitude of
the shift in supply and that in demand play roles
in determining the policy effect, the state of the
market (i.e. whether the supply or demand is the
binding factor) is a pivotal factor. Specifically,
in Case 1 where demand exceeds supply
(implying credit supply is the binding factor)
at the prevailing mortgage interest rate (iL), the
effect of the tightening solely reflects the supply-
side impact, while the demand-side impact is
invisible. In this case, the loan volume decreases
considerably from a to b. In Case 2 where supply
exceeds demand at the prevailing mortgage
interest rate (iH), the effect of the tightening
solely reflects the demand-side impact, while the
supply-side impact is invisible. The loan volume
decreases marginally from c to d. In this example,
LTV policy is expected to be more effective when
there is excess credit demand but less so when
excess credit supply occurs, suggesting a state-
dependent feature of the policy effect.
Chart B5.1A supply-and-demand diagram to illustrate the effect of LTV policy under scenarios of excess supply and excess demand in loan markets
Box 5The demand for and supply of mortgage loans:
The role of loan-to-value policy
Page 77
62 Theoretically, LTV cap tightening may reduce demand for mortgages, as home buyers may be forced out of the property market because of higher liquidity hurdles or lower returns on equity for property investment. LTV cap tightening may also reduce credit supply because it may lead banks to lend less than they otherwise would.
63 For example, see Stiglitz and Weiss (1981), “Credit rationing in markets with imperfect information”, American Economic Review, vol. 71, pp 393-410. Apart from the conventional explanation that excess supply or excess demand may occur due to stickiness of lending interest rates, Stiglitz and Weiss (1981) show theoretically that credit rationing (i.e. excess demand) may exist in the loan market if banks face an adverse selection problem. A profit-maximising bank may charge an interest rate below the market clearing rate, as a higher interest rate could attract more risky borrowers and discourage safer borrowers, which could increase the credit loss of banks’ loan portfolios.
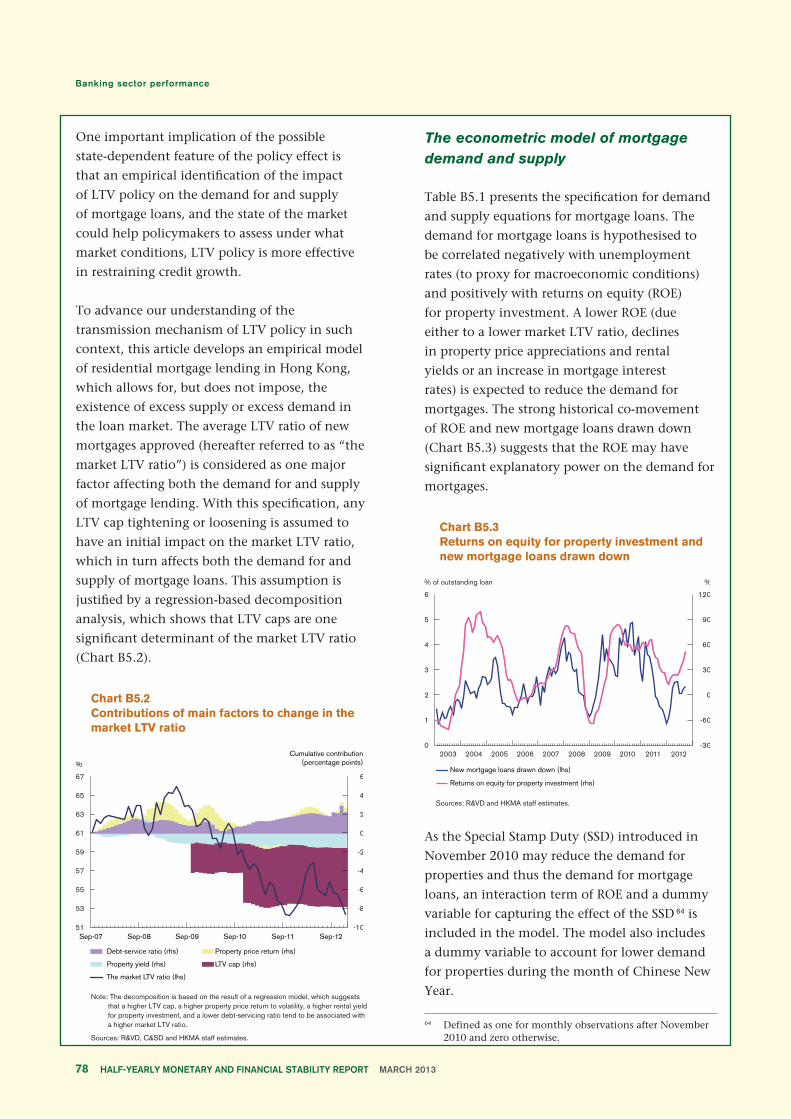
One important implication of the possible
state-dependent feature of the policy effect is
that an empirical identification of the impact
of LTV policy on the demand for and supply
of mortgage loans, and the state of the market
could help policymakers to assess under what
market conditions, LTV policy is more effective
in restraining credit growth.
To advance our understanding of the
transmission mechanism of LTV policy in such
context, this article develops an empirical model
of residential mortgage lending in Hong Kong,
which allows for, but does not impose, the
existence of excess supply or excess demand in
the loan market. The average LTV ratio of new
mortgages approved (hereafter referred to as “the
market LTV ratio”) is considered as one major
factor affecting both the demand for and supply
of mortgage lending. With this specification, any
LTV cap tightening or loosening is assumed to
have an initial impact on the market LTV ratio,
which in turn affects both the demand for and
supply of mortgage loans. This assumption is
justified by a regression-based decomposition
analysis, which shows that LTV caps are one
significant determinant of the market LTV ratio
(Chart B5.2).
Chart B5.2Contributions of main factors to change in the market LTV ratio
Note: The decomposition is based on the result of a regression model, which suggests that a higher LTV cap, a higher property price return to volatility, a higher rental yield for property investment, and a lower debt-servicing ratio tend to be associated with a higher market LTV ratio.
Sources: R&VD, C&SD and HKMA staff estimates.
The econometric model of mortgage demand and supply
Table B5.1 presents the specification for demand
and supply equations for mortgage loans. The
demand for mortgage loans is hypothesised to
be correlated negatively with unemployment
rates (to proxy for macroeconomic conditions)
and positively with returns on equity (ROE)
for property investment. A lower ROE (due
either to a lower market LTV ratio, declines
in property price appreciations and rental
yields or an increase in mortgage interest
rates) is expected to reduce the demand for
mortgages. The strong historical co-movement
of ROE and new mortgage loans drawn down
(Chart B5.3) suggests that the ROE may have
significant explanatory power on the demand for
mortgages.
Chart B5.3Returns on equity for property investment and new mortgage loans drawn down
Sources: R&VD and HKMA staff estimates.
As the Special Stamp Duty (SSD) introduced in
November 2010 may reduce the demand for
properties and thus the demand for mortgage
loans, an interaction term of ROE and a dummy
variable for capturing the effect of the SSD 64 is
included in the model. The model also includes
a dummy variable to account for lower demand
for properties during the month of Chinese New
Year.
Page 78
64 Defined as one for monthly observations after November 2010 and zero otherwise.
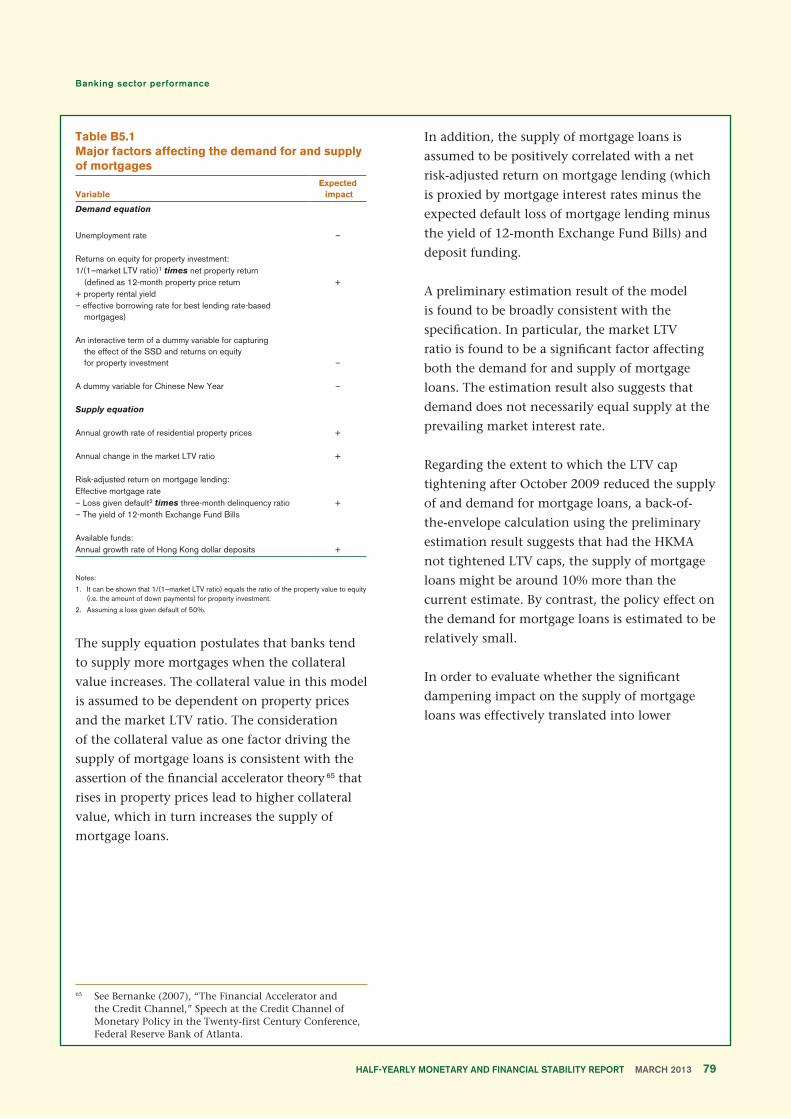
Table B5.1Major factors affecting the demand for and supply of mortgages
VariableExpected impact
Demand equation
Unemployment rate –
Returns on equity for property investment:1/(1–market LTV ratio)1 times net property return (defined as 12-month property price return ++ property rental yield– effective borrowing rate for best lending rate-based mortgages)
An interactive term of a dummy variable for capturing the effect of the SSD and returns on equity for property investment –
A dummy variable for Chinese New Year –
Supply equation
Annual growth rate of residential property prices +
Annual change in the market LTV ratio +
Risk-adjusted return on mortgage lending:Effective mortgage rate– Loss given default2 times three-month delinquency ratio +– The yield of 12-month Exchange Fund Bills
Available funds:Annual growth rate of Hong Kong dollar deposits +
Notes:
1. It can be shown that 1/(1–market LTV ratio) equals the ratio of the property value to equity (i.e. the amount of down payments) for property investment.
2. Assuming a loss given default of 50%.
The supply equation postulates that banks tend
to supply more mortgages when the collateral
value increases. The collateral value in this model
is assumed to be dependent on property prices
and the market LTV ratio. The consideration
of the collateral value as one factor driving the
supply of mortgage loans is consistent with the
assertion of the financial accelerator theory 65 that
rises in property prices lead to higher collateral
value, which in turn increases the supply of
mortgage loans.
In addition, the supply of mortgage loans is
assumed to be positively correlated with a net
risk-adjusted return on mortgage lending (which
is proxied by mortgage interest rates minus the
expected default loss of mortgage lending minus
the yield of 12-month Exchange Fund Bills) and
deposit funding.
A preliminary estimation result of the model
is found to be broadly consistent with the
specification. In particular, the market LTV
ratio is found to be a significant factor affecting
both the demand for and supply of mortgage
loans. The estimation result also suggests that
demand does not necessarily equal supply at the
prevailing market interest rate.
Regarding the extent to which the LTV cap
tightening after October 2009 reduced the supply
of and demand for mortgage loans, a back-of-
the-envelope calculation using the preliminary
estimation result suggests that had the HKMA
not tightened LTV caps, the supply of mortgage
loans might be around 10% more than the
current estimate. By contrast, the policy effect on
the demand for mortgage loans is estimated to be
relatively small.
In order to evaluate whether the significant
dampening impact on the supply of mortgage
loans was effectively translated into lower
65 See Bernanke (2007), “The Financial Accelerator and the Credit Channel,” Speech at the Credit Channel of Monetary Policy in the Twenty-first Century Conference, Federal Reserve Bank of Atlanta.
Page 79
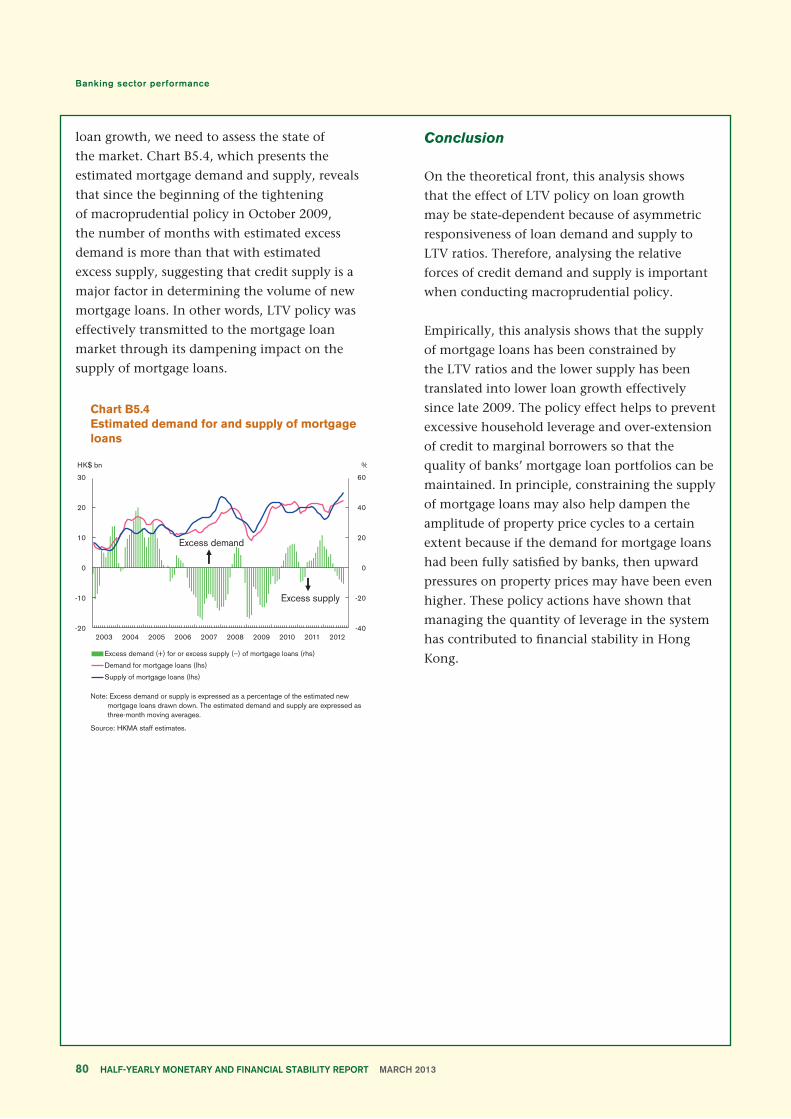
loan growth, we need to assess the state of
the market. Chart B5.4, which presents the
estimated mortgage demand and supply, reveals
that since the beginning of the tightening
of macroprudential policy in October 2009,
the number of months with estimated excess
demand is more than that with estimated
excess supply, suggesting that credit supply is a
major factor in determining the volume of new
mortgage loans. In other words, LTV policy was
effectively transmitted to the mortgage loan
market through its dampening impact on the
supply of mortgage loans.
Chart B5.4Estimated demand for and supply of mortgage loans
Note: Excess demand or supply is expressed as a percentage of the estimated new mortgage loans drawn down. The estimated demand and supply are expressed as three-month moving averages.
Source: HKMA staff estimates.
Conclusion
On the theoretical front, this analysis shows
that the effect of LTV policy on loan growth
may be state-dependent because of asymmetric
responsiveness of loan demand and supply to
LTV ratios. Therefore, analysing the relative
forces of credit demand and supply is important
when conducting macroprudential policy.
Empirically, this analysis shows that the supply
of mortgage loans has been constrained by
the LTV ratios and the lower supply has been
translated into lower loan growth effectively
since late 2009. The policy effect helps to prevent
excessive household leverage and over-extension
of credit to marginal borrowers so that the
quality of banks’ mortgage loan portfolios can be
maintained. In principle, constraining the supply
of mortgage loans may also help dampen the
amplitude of property price cycles to a certain
extent because if the demand for mortgage loans
had been fully satisfied by banks, then upward
pressures on property prices may have been even
higher. These policy actions have shown that
managing the quantity of leverage in the system
has contributed to financial stability in Hong
Kong.
Page 80
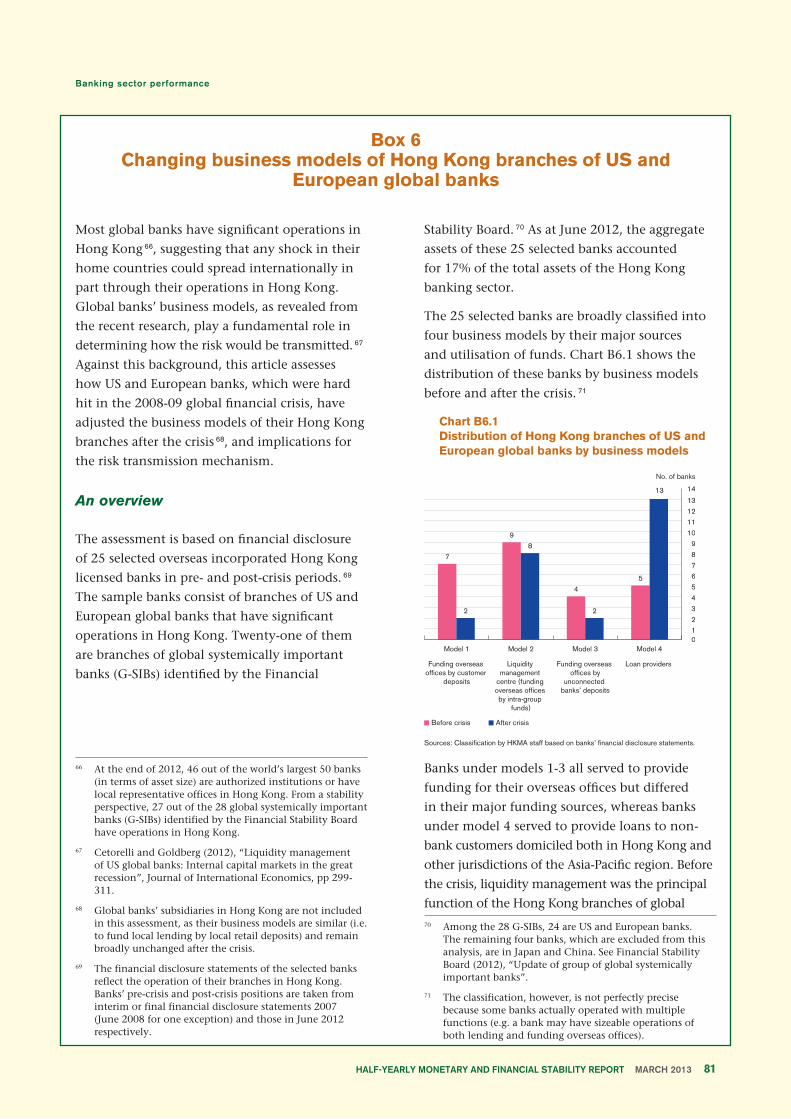
Most global banks have significant operations in
Hong Kong 66, suggesting that any shock in their
home countries could spread internationally in
part through their operations in Hong Kong.
Global banks’ business models, as revealed from
the recent research, play a fundamental role in
determining how the risk would be transmitted. 67
Against this background, this article assesses
how US and European banks, which were hard
hit in the 2008-09 global financial crisis, have
adjusted the business models of their Hong Kong
branches after the crisis 68, and implications for
the risk transmission mechanism.
An overview
The assessment is based on financial disclosure
of 25 selected overseas incorporated Hong Kong
licensed banks in pre- and post-crisis periods. 69
The sample banks consist of branches of US and
European global banks that have significant
operations in Hong Kong. Twenty-one of them
are branches of global systemically important
banks (G-SIBs) identified by the Financial
Stability Board. 70 As at June 2012, the aggregate
assets of these 25 selected banks accounted
for 17% of the total assets of the Hong Kong
banking sector.
The 25 selected banks are broadly classified into
four business models by their major sources
and utilisation of funds. Chart B6.1 shows the
distribution of these banks by business models
before and after the crisis. 71
Chart B6.1Distribution of Hong Kong branches of US and European global banks by business models
Sources: Classification by HKMA staff based on banks’ financial disclosure statements.
Banks under models 1-3 all served to provide
funding for their overseas offices but differed
in their major funding sources, whereas banks
under model 4 served to provide loans to non-
bank customers domiciled both in Hong Kong and
other jurisdictions of the Asia-Pacific region. Before
the crisis, liquidity management was the principal
function of the Hong Kong branches of global
Box 6Changing business models of Hong Kong branches of US and
European global banks
66 At the end of 2012, 46 out of the world’s largest 50 banks (in terms of asset size) are authorized institutions or have local representative offices in Hong Kong. From a stability perspective, 27 out of the 28 global systemically important banks (G-SIBs) identified by the Financial Stability Board have operations in Hong Kong.
67 Cetorelli and Goldberg (2012), “Liquidity management of US global banks: Internal capital markets in the great recession”, Journal of International Economics, pp 299-311.
68 Global banks’ subsidiaries in Hong Kong are not included in this assessment, as their business models are similar (i.e. to fund local lending by local retail deposits) and remain broadly unchanged after the crisis.
69 The financial disclosure statements of the selected banks reflect the operation of their branches in Hong Kong. Banks’ pre-crisis and post-crisis positions are taken from interim or final financial disclosure statements 2007 (June 2008 for one exception) and those in June 2012 respectively.
70 Among the 28 G-SIBs, 24 are US and European banks. The remaining four banks, which are excluded from this analysis, are in Japan and China. See Financial Stability Board (2012), “Update of group of global systemically important banks”.
71 The classification, however, is not perfectly precise because some banks actually operated with multiple functions (e.g. a bank may have sizeable operations of both lending and funding overseas offices).
Page 81
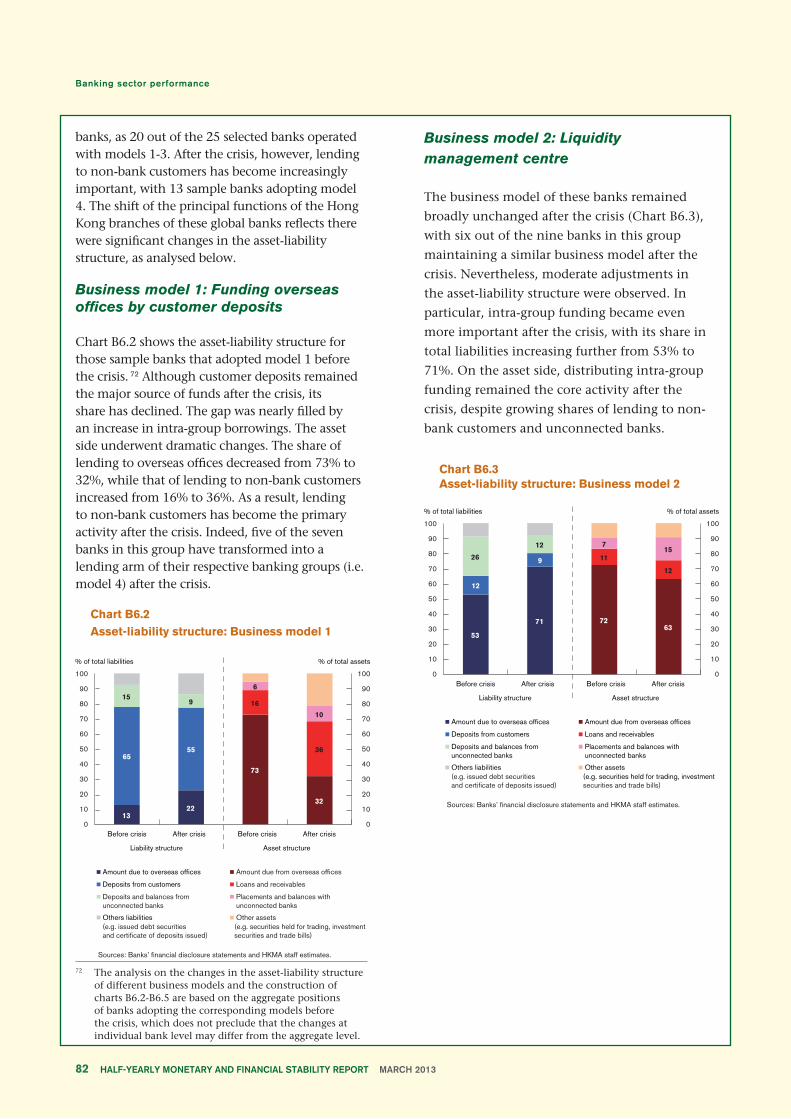
banks, as 20 out of the 25 selected banks operated with models 1-3. After the crisis, however, lending to non-bank customers has become increasingly important, with 13 sample banks adopting model 4. The shift of the principal functions of the Hong Kong branches of these global banks reflects there were significant changes in the asset-liability structure, as analysed below.
Business model 1: Funding overseas offices by customer deposits
Chart B6.2 shows the asset-liability structure for those sample banks that adopted model 1 before the crisis. 72 Although customer deposits remained the major source of funds after the crisis, its share has declined. The gap was nearly filled by an increase in intra-group borrowings. The asset side underwent dramatic changes. The share of lending to overseas offices decreased from 73% to 32%, while that of lending to non-bank customers increased from 16% to 36%. As a result, lending to non-bank customers has become the primary activity after the crisis. Indeed, five of the seven banks in this group have transformed into a lending arm of their respective banking groups (i.e. model 4) after the crisis.
Chart B6.2Asset-liability structure: Business model 1
Sources: Banks’ financial disclosure statements and HKMA staff estimates.
Business model 2: Liquidity management centre
The business model of these banks remained
broadly unchanged after the crisis (Chart B6.3),
with six out of the nine banks in this group
maintaining a similar business model after the
crisis. Nevertheless, moderate adjustments in
the asset-liability structure were observed. In
particular, intra-group funding became even
more important after the crisis, with its share in
total liabilities increasing further from 53% to
71%. On the asset side, distributing intra-group
funding remained the core activity after the
crisis, despite growing shares of lending to non-
bank customers and unconnected banks.
Chart B6.3Asset-liability structure: Business model 2
Sources: Banks’ financial disclosure statements and HKMA staff estimates.
Page 82
72 The analysis on the changes in the asset-liability structure of different business models and the construction of charts B6.2-B6.5 are based on the aggregate positions of banks adopting the corresponding models before the crisis, which does not preclude that the changes at individual bank level may differ from the aggregate level.
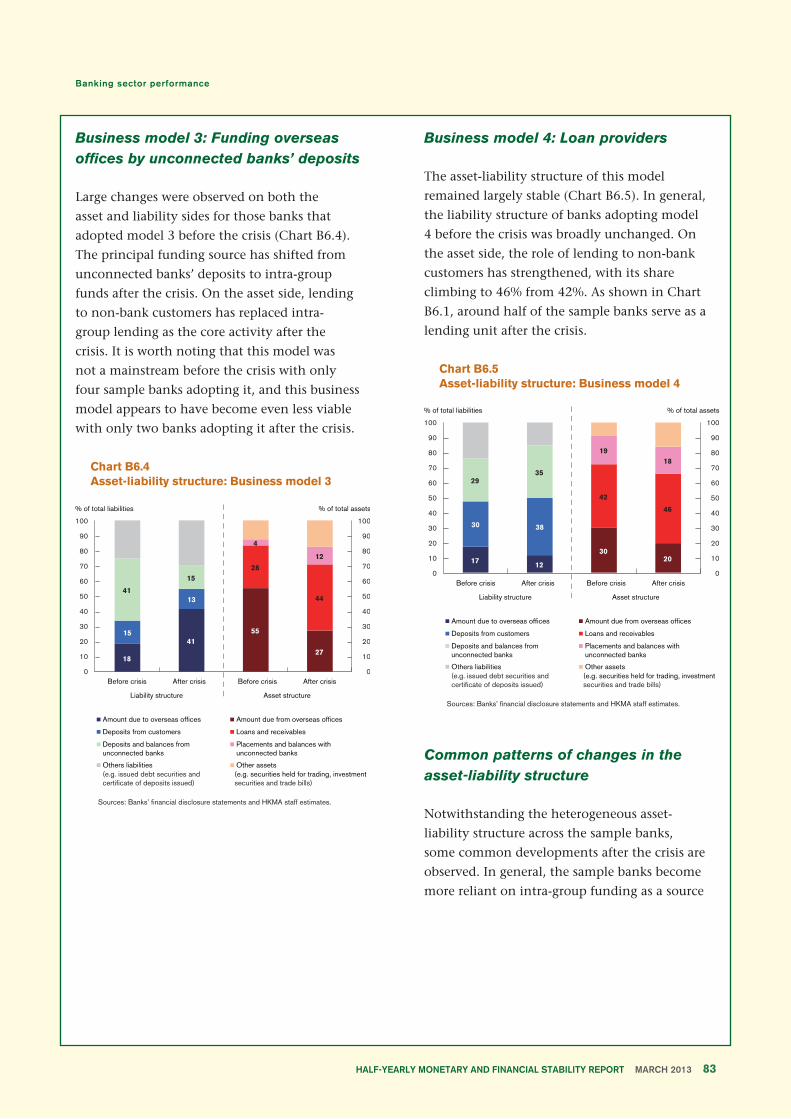
Business model 3: Funding overseas offices by unconnected banks’ deposits
Large changes were observed on both the
asset and liability sides for those banks that
adopted model 3 before the crisis (Chart B6.4).
The principal funding source has shifted from
unconnected banks’ deposits to intra-group
funds after the crisis. On the asset side, lending
to non-bank customers has replaced intra-
group lending as the core activity after the
crisis. It is worth noting that this model was
not a mainstream before the crisis with only
four sample banks adopting it, and this business
model appears to have become even less viable
with only two banks adopting it after the crisis.
Chart B6.4Asset-liability structure: Business model 3
Sources: Banks’ financial disclosure statements and HKMA staff estimates.
Business model 4: Loan providers
The asset-liability structure of this model
remained largely stable (Chart B6.5). In general,
the liability structure of banks adopting model
4 before the crisis was broadly unchanged. On
the asset side, the role of lending to non-bank
customers has strengthened, with its share
climbing to 46% from 42%. As shown in Chart
B6.1, around half of the sample banks serve as a
lending unit after the crisis.
Chart B6.5Asset-liability structure: Business model 4
Sources: Banks’ financial disclosure statements and HKMA staff estimates.
Common patterns of changes in the asset-liability structure
Notwithstanding the heterogeneous asset-
liability structure across the sample banks,
some common developments after the crisis are
observed. In general, the sample banks become
more reliant on intra-group funding as a source
Page 83
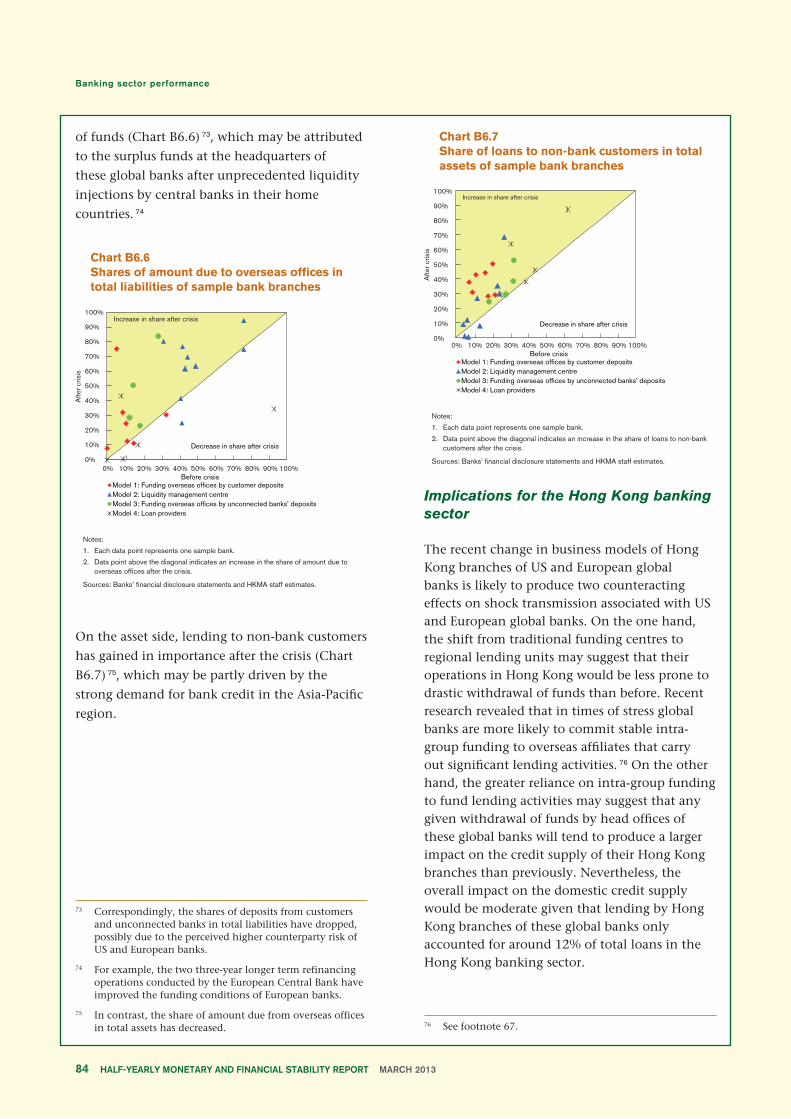
of funds (Chart B6.6) 73, which may be attributed
to the surplus funds at the headquarters of
these global banks after unprecedented liquidity
injections by central banks in their home
countries. 74
Chart B6.6Shares of amount due to overseas offices in total liabilities of sample bank branches
Notes:
1. Each data point represents one sample bank.
2. Data point above the diagonal indicates an increase in the share of amount due to overseas offices after the crisis.
Sources: Banks’ financial disclosure statements and HKMA staff estimates.
On the asset side, lending to non-bank customers
has gained in importance after the crisis (Chart
B6.7) 75, which may be partly driven by the
strong demand for bank credit in the Asia-Pacific
region.
Chart B6.7Share of loans to non-bank customers in total assets of sample bank branches
Notes:
1. Each data point represents one sample bank.
2. Data point above the diagonal indicates an increase in the share of loans to non-bank customers after the crisis.
Sources: Banks’ financial disclosure statements and HKMA staff estimates.
Implications for the Hong Kong banking sector
The recent change in business models of Hong Kong branches of US and European global banks is likely to produce two counteracting effects on shock transmission associated with US and European global banks. On the one hand, the shift from traditional funding centres to regional lending units may suggest that their operations in Hong Kong would be less prone to drastic withdrawal of funds than before. Recent research revealed that in times of stress global banks are more likely to commit stable intra-group funding to overseas affiliates that carry out significant lending activities. 76 On the other hand, the greater reliance on intra-group funding to fund lending activities may suggest that any given withdrawal of funds by head offices of these global banks will tend to produce a larger impact on the credit supply of their Hong Kong branches than previously. Nevertheless, the overall impact on the domestic credit supply would be moderate given that lending by Hong Kong branches of these global banks only accounted for around 12% of total loans in the Hong Kong banking sector.
Page 84
73 Correspondingly, the shares of deposits from customers and unconnected banks in total liabilities have dropped, possibly due to the perceived higher counterparty risk of US and European banks.
74 For example, the two three-year longer term refinancing operations conducted by the European Central Bank have improved the funding conditions of European banks.
75 In contrast, the share of amount due from overseas offices in total assets has decreased. 76 See footnote 67.
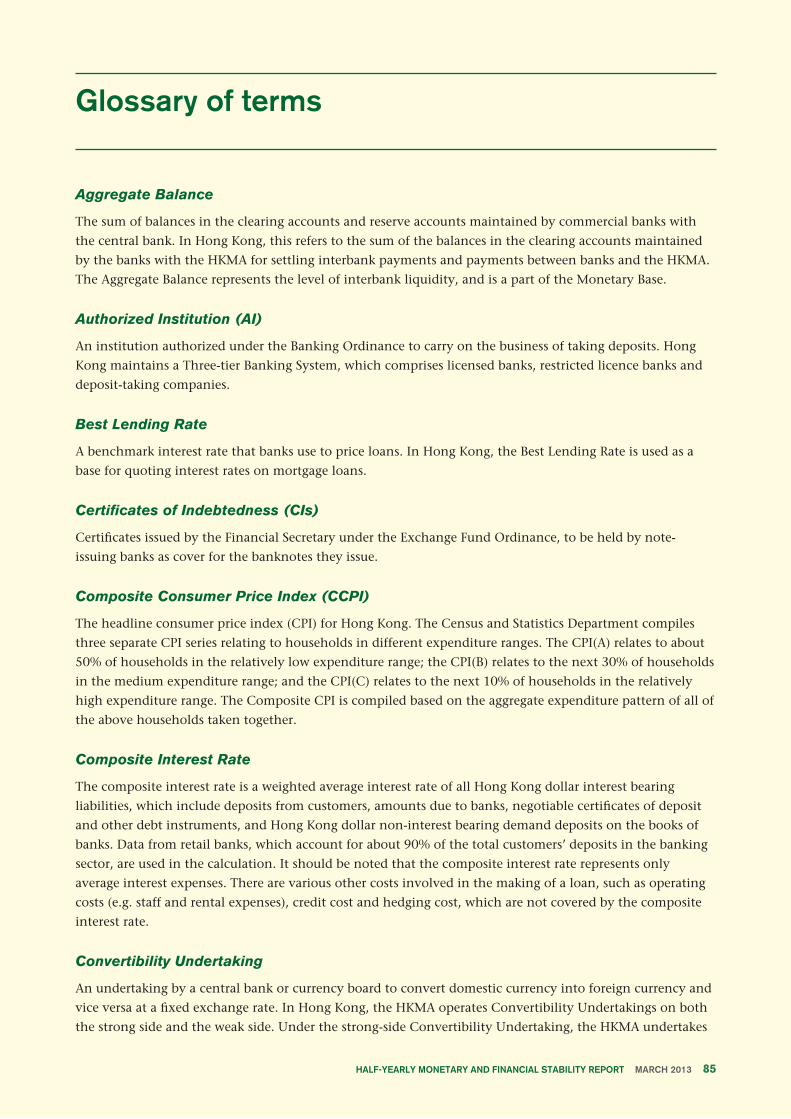
Glossary of terms
Aggregate Balance
The sum of balances in the clearing accounts and reserve accounts maintained by commercial banks with
the central bank. In Hong Kong, this refers to the sum of the balances in the clearing accounts maintained
by the banks with the HKMA for settling interbank payments and payments between banks and the HKMA.
The Aggregate Balance represents the level of interbank liquidity, and is a part of the Monetary Base.
Authorized Institution (AI)
An institution authorized under the Banking Ordinance to carry on the business of taking deposits. Hong
Kong maintains a Three-tier Banking System, which comprises licensed banks, restricted licence banks and
deposit-taking companies.
Best Lending Rate
A benchmark interest rate that banks use to price loans. In Hong Kong, the Best Lending Rate is used as a
base for quoting interest rates on mortgage loans.
Certificates of Indebtedness (CIs)
Certificates issued by the Financial Secretary under the Exchange Fund Ordinance, to be held by note-
issuing banks as cover for the banknotes they issue.
Composite Consumer Price Index (CCPI)
The headline consumer price index (CPI) for Hong Kong. The Census and Statistics Department compiles
three separate CPI series relating to households in different expenditure ranges. The CPI(A) relates to about
50% of households in the relatively low expenditure range; the CPI(B) relates to the next 30% of households
in the medium expenditure range; and the CPI(C) relates to the next 10% of households in the relatively
high expenditure range. The Composite CPI is compiled based on the aggregate expenditure pattern of all of
the above households taken together.
Composite Interest Rate
The composite interest rate is a weighted average interest rate of all Hong Kong dollar interest bearing
liabilities, which include deposits from customers, amounts due to banks, negotiable certificates of deposit
and other debt instruments, and Hong Kong dollar non-interest bearing demand deposits on the books of
banks. Data from retail banks, which account for about 90% of the total customers’ deposits in the banking
sector, are used in the calculation. It should be noted that the composite interest rate represents only
average interest expenses. There are various other costs involved in the making of a loan, such as operating
costs (e.g. staff and rental expenses), credit cost and hedging cost, which are not covered by the composite
interest rate.
Convertibility Undertaking
An undertaking by a central bank or currency board to convert domestic currency into foreign currency and
vice versa at a fixed exchange rate. In Hong Kong, the HKMA operates Convertibility Undertakings on both
the strong side and the weak side. Under the strong-side Convertibility Undertaking, the HKMA undertakes
Page 85
to buy US dollars from licensed banks at 7.75. Under the weak-side Convertibility Undertaking, the HKMA
undertakes to sell US dollars at 7.85. Within the Convertibility Zone between 7.75 and 7.85, the HKMA may
choose to conduct market operations consistent with Currency Board principles with the aim of promoting
the smooth functioning of the money and foreign exchange markets.
Convertibility Zone
The Hong Kong dollar-US dollar exchange rate band, defined by the levels of the strong- and weak-side
Convertibility Undertakings, within which the HKMA may choose to conduct market operations consistent
with Currency Board principles.
Exchange Fund Bills and Notes (EFBN)
Debt instruments issued by the HKMA for the account of the Exchange Fund. Introduced in March 1990,
the Exchange Fund Bills and Notes programme has expanded over the years, with a maturity profile
ranging from three months to 15 years. These instruments are fully backed by the foreign reserves. The
HKMA has undertaken that new Exchange Fund paper will only be issued when there is an inflow of funds,
thus enabling the additional paper to be fully backed by the foreign reserves. Since 1 April 1999, interest
payments on Exchange Fund paper have been allowed to expand the Monetary Base. Additional Exchange
Fund paper is issued to absorb such interest payments. This is consistent with the Currency Board discipline
since interest payments on Exchange Fund paper are backed by interest income on the US dollar assets
backing the Monetary Base.
Liquidity Ratio
All authorized institutions in Hong Kong are required to meet a minimum monthly average liquidity ratio
of 25%. This is calculated as the ratio of liquefiable assets (e.g. marketable debt securities and loans repayable
within one month subject to their respective liquidity conversion factors) to qualifying liabilities (basically
all liabilities due within one month). The method of calculation and its components are specified in the
Fourth Schedule to the Banking Ordinance.
Monetary Base
A part of the monetary liabilities of a central bank. The monetary base is defined, at the minimum, as the
sum of the currency in circulation (banknotes and coins) and the balance of the banking system held with
the central bank (the reserve balance or the clearing balance). In Hong Kong, the Monetary Base comprises
Certificates of Indebtedness (for backing the banknotes issued by the note-issuing banks), government-
issued currency in circulation, the balance of the clearing accounts of banks kept with the HKMA, and
Exchange Fund Bills and Notes.
Nominal and Real Effective Exchange Rate (NEER and REER)
An indicator of the overall exchange rate value of the Hong Kong dollar against a basket of currencies of
Hong Kong’s principal trading partners. The nominal effective exchange rate (NEER) is a weighted average
of the exchange rates between Hong Kong and its principal trading partners. The real effective exchange rate
(REER) is obtained by adjusting the NEER for relative movements in the seasonally adjusted consumer price
indices of those selected trading partners.
Page 86
Abbreviations
item abbreviations
3m moving average Three-month moving average3m-on-3m Three-month-on-three-monthASEAN Association of Southeast Asian NationsAIs Authorized InstitutionsBIS Bank for International Settlementsbn BillionBLR Best lending rateBoP Balance of PaymentsBSD Buyer’s Stamp DutyCCPI Composite Consumer Price IndexCDs Certificates of depositCEI Composite index of coincident economic indicatorsCIs Certificates of IndebtednessCNH Offshore renminbi exchange rate in Hong KongCNY Onshore renminbi exchange rateC&SD Census and Statistics DepartmentCPI Consumer Price IndexCU Convertibility Undertaking EFBN Exchange Fund Bills and NotesFed Federal ReserveGDP Gross Domestic ProductG-SIBs Global systemically important banks HIBOR Hong Kong Interbank Offered RateHKD Hong Kong dollarHKMA Hong Kong Monetary AuthorityHKTDC Hong Kong Trade Development CouncilHSCEI Hang Seng China Enterprises IndexHSI Hang Seng IndexIMF International Monetary FundIPO Initial Public OfferingLEI Composite index of leading economic indicatorsLIBOR London Interbank Offered Ratelhs Left-hand scaleLTD Loan-to-deposit
Page 87
item abbreviations
LTV Loan-to-valueMDBs Multilateral development banksmn MillionNCD Negotiable certificates of depositNEER Nominal effective exchange rateNIE Newly industrialised economiesNPL Non-performing loanOMTs Outright Monetary Transactionsp.a. Per annumPBoC People’s Bank of ChinaPMI Purchasing Managers’ IndexQBTS Quarterly Business Tendency Surveyqoq Quarter-on-quarterR&VD Rating and Valuation DepartmentREER Real effective exchange raterhs Right-hand scaleRMB RenminbiSSD Special Stamp DutyS&P 500 Standard & Poor’s 500 IndexUK United KingdomUS United StatesUSD US dollaryoy Year-on-year
Page 88

This Report is extracted from theHKMA Quarterly Bulletin
March 2013 issue.
©2013 Hong Kong Monetary Authority
Reproduction for non-commercial
purposes is permitted provided that the
source is properly stated.
Full text of this Report is available on the
HKMA website at www.hkma.gov.hk.
Hong Kong Monetary Authority55th Floor, Two International Finance Centre,
8 Finance Street, Central, Hong Kong
Telephone: (852) 2878 8196
Facsimile: (852) 2878 8197
E-mail: [email protected]
www.hkma.gov.hk
Printed in Hong Kong
ISSN 2221-5727 (Print version)
ISSN 2222-1514 (Online version)
HK$60
Related Documents