Guidelines for Using Local Materials for Roadway Base and Subbase Research Report 0-5562-1 TxDOT Project Number 0-5562 Conducted for: Texas Department of Transportation in cooperation with Federal Highway Administration January 2009 Center for Transportation Infrastructure Systems The University of Texas at El Paso El Paso, TX 79968 (915) 747-6925 http://ctis.utep.edu

Welcome message from author
This document is posted to help you gain knowledge. Please leave a comment to let me know what you think about it! Share it to your friends and learn new things together.
Transcript
Guidelines for Using Local Materials for Roadway Base
and Subbase
Research Report 0-5562-1
TxDOT Project Number 0-5562
Conducted for: Texas Department of Transportation
in cooperation with
Federal Highway Administration
January 2009
Center for Transportation Infrastructure Systems The University of Texas at El Paso
El Paso, TX 79968 (915) 747-6925
http://ctis.utep.edu

TECHNICAL REPORT STANDARD TITLE PAGE 1. Report No. FHWA/TX-08/0-5562-1
2. Government Accession No.
3. Recipient's Catalog No.
4. Title and Subtitle Guidelines for Using Local Materials for Roadway Base and Subbase
5. Report Date January 2009
6. Performing Organization Code
7. Author(s) B. Gautam, D. Yuan, I. Abdallah and S. Nazarian
8. Performing Organization Report No. TX 0-5562-1
9. Performing Organization Name and Address Center for Transportation Research Systems The University of Texas at El Paso El Paso, Texas 79968-0516
10. Work Unit No.
11. Contract or Grant No. Project No. 0-5562
12. Sponsoring Agency Name and Address Texas Department of Transportation Research and Technology Implementation Office P.O. Box 5080 Austin, Texas 78763-5080
13. Type of Report and Period Covered Technical Report Sept. 1, 2006 –August 31, 200814. Sponsoring Agency Code
15. Supplementary Notes
Research Performed in cooperation with TxDOT and the Federal Highway Administration Research Study Title: Guidelines for Using Local Materials for Roadway Base and Subbase 16. Abstract Flexible base materials that meet TxDOT specifications are getting more difficult to purchase in many TxDOT Districts. As a result, high quality materials have to be hauled in long distances, sometimes from other States. This act would significantly increase the costs associated with the construction of roads and subsequent maintenance and rehabilitation of them. Out-of-specification local materials are normally available. If through appropriate modifications of the materials (adjusting the gradation or/and chemical treatment) or structural design (specifying thicker layers of base and/or hot mix) the use of the local materials can be permitted, the construction can be accelerated and significant monetary benefits can be realized. Under the current TxDOT specification (Item 247), a material can be considered out-of-specification (low-quality) for a variety of reasons such as inadequate gradation, inadequate plasticity and inadequate strength. In many cases, the local flexible base supplies miss the standard specifications by a small margin. Since the criteria set in Item 247 are experienced-based, some of the parameters used to classify a base may be less significant than others. In this report, guidelines and test protocols for the use of out-of-specification base materials in low volume roads are recommended on the basis of test results of ten materials from five TxDOT districts. 17. Key Words Base material, Low volume Road, Strength, Modulus, Chemical treatment, Structural analysis
18. Distribution Statement No restrictions. This document is available to the public through the National Technical service, 5285 Port Royal Road, Springfield, Virginia 22161, www.ntis.gov
19. Security Classif. (of this report) Unclassified
20. Security Classif. (of this page) Unclassified
21. No. of Pages 105
22. Price
Form DOT F 1700.7 (8-69)

Guidelines for Using Local Material for Roadway Base and Subbase
by
Biraj Gautam, BSCE Deren Yuan, PhD
Imad Abdallah, MSCE And
Soheil Nazarian, PhD, PE
Research Project TX-0-5562
Conducted for Texas Department of Transportation
in cooperation with Federal Highway Administration
Research Report TX 0-5562-1
The Center for Transportation Infrastructure Systems
The University of Texas at El Paso El Paso, TX 79968-0516
DISCLAIMERS The contents of this report reflect the view of the authors who are responsible for the facts and the accuracy of the data presented herein. The contents do not necessarily reflect the official views or policies of the Texas Department of Transportation or the Federal Highway Administration. This report does not constitute a standard, a specification or a regulation. The material contained in this report is experimental in nature and is published for informational purposes only. Any discrepancies with official views or policies of the Texas Department of Transportation or the Federal Highway Administration should be discussed with the appropriate Austin Division prior to implementation of the procedures or results.
NOT INTENDED FOR CONSTRUCTION, BIDDING, OR PERMIT PURPOSES
Biraj Gautam, BSCE Deren Yuan, PhD Imad Abdallah, MSCE Soheil Nazarian, PhD, PE (66495)
iii
Acknowledgements
The authors would like to express their sincere appreciation to the Project Management Committee of this project, consisting of Jim Combes, Lynn Passmore, Ron Seal, Ronald Hatcher and Buster Sanders for their support. We are grateful to a number of TxDOT district personnel, especially Paul Hoelscher and Paul Norman in Abilene District, Gary Humes, Richard Walker and Elias Rmeili in Brownwood District, Stevan Perez and Dustin McNabb in Lubbock District and Richard Holder in San Angelo District for their assistance in material collection and field testing. We are also grateful to the owners of Cemex at El Paso Black Lease and Old Bobby Noble in Abilene area, Prater and Vulcan in Brownwood area, Caddell in Lubbock area and Turner and Lumpkin in San Angelo for their donations of materials used in this research project.

iv
v
Abstract
Flexible base materials that meet TxDOT specifications are getting more difficult to purchase in many TxDOT Districts. As a result, high quality materials have to be hauled in long distances, sometimes from other States. This act would significantly increase the costs associated with the construction of roads and subsequent maintenance and rehabilitation of them. Out-of-specification local materials are normally available. If through appropriate modifications of the materials (adjusting the gradation or/and chemical treatment) or structural design (specifying thicker layers of base and/or hot mix) the use of the local materials can be permitted, the construction can be accelerated and significant monetary benefits can be realized. Under the current TxDOT specification (Item 247), a material can be considered out-of-specification (low-quality) for a variety of reasons such as inadequate gradation, inadequate plasticity and inadequate strength. In many cases, the local flexible base supplies miss the standard specifications by a small margin. Since the criteria set in Item 247 are experienced-based, some of the parameters used to classify a base may be less significant than others. In this report, guidelines and test protocols for the use of out-of-specification base materials in low volume roads are recommended on the basis of test results of ten materials from five TxDOT districts.

vi
vii
Implementation Statement
In this report a number of recommendations have been made to improve the use of out-of-specification materials as base and subbase layers in low volume roads with guidelines and test protocols. The recommendations are based on the test results of ten materials from five TxDOT districts. At this time, the recommendations should be implemented on a number of new and ongoing projects to confirm their applicability and to adjust the limits and/or criteria recommended. As part of the implementation, a guide should be developed to decimate to the TxDOT staff.

viii
ix
Table of Contents
List of Figures .............................................................................................................................. xiii
List of Tables ................................................................................................................................ xv
Chapter 1 - Introduction .................................................................................................................. 1
Objective ..................................................................................................................................... 1 Organization of Report ............................................................................................................... 3
Chapter 2 - Background and Information Search ........................................................................... 5
Introduction ................................................................................................................................. 5 History and Current Status of Using Local Materials ................................................................. 5 Factors Affecting Strength, Stiffness and Permanent Deformation ............................................ 9
Aggregate Shape and Size ................................................................................................ 10 Compaction ....................................................................................................................... 10 Dry Density ....................................................................................................................... 11 Fines Content .................................................................................................................... 11 Gradation and Grain Size .................................................................................................. 11 Moisture Content .............................................................................................................. 12 Stress State ........................................................................................................................ 12
Material Characterization .......................................................................................................... 13 Stabilizer Selection ................................................................................................................... 15 Performance Evaluation with Small Scale Test ........................................................................ 18 Cost Benefit .............................................................................................................................. 20
Chapter 3 - Testing Procedures ..................................................................................................... 23
Introduction ............................................................................................................................... 23 Index Properties ........................................................................................................................ 23
Sieve Analysis and Gradation ........................................................................................... 23 Atterberg Limits ................................................................................................................ 23 Moisture Density ............................................................................................................... 23 Aggregate Quality Assessment ......................................................................................... 24 Triaxial Compression Test ................................................................................................ 25 Repeated Load Triaxial Test ............................................................................................. 26
Resilient Modulus ........................................................................................................ 26
x
Permanent Deformation.............................................................................................. 29 Free-Free Resonant Column (FFRC) Tests ...................................................................... 30 Moisture Susceptibility ..................................................................................................... 31 Small Scale Test ................................................................................................................ 32
Chapter 4 - Results from Laboratory and Field Tests ................................................................... 37
Introduction ............................................................................................................................... 37 Material Selection ..................................................................................................................... 37 Laboratory Test Results of Raw Materials (Materials As-Is) ................................................... 38
Index Properties ................................................................................................................ 38 Moisture Density and Related Tests ................................................................................. 38 Triaxial Strength Test ....................................................................................................... 40
Material Considered Out-of-Specification ................................................................................ 42 Remedial Measures ................................................................................................................... 42
Treatment with Chemical Additives ................................................................................. 44 Modification of Gradation ................................................................................................ 44
Laboratory Test Results of Treated or Gradation Modified Materials ..................................... 46 Index Properties ................................................................................................................ 46 Moisture Density and Related Test ................................................................................... 46 Triaxial Compression Test ................................................................................................ 47
Performance and Additional Tests ............................................................................................ 50 Aggregate Quality Assessment ......................................................................................... 50 Resilient Modulus ............................................................................................................. 50 Permanent Deformation .................................................................................................... 51 Moisture Susceptibility ..................................................................................................... 57 Small Scale Test ................................................................................................................ 57 Field Monitoring ............................................................................................................... 64
Chapter 5 - Structural Analysis and Cost Evaluation ................................................................... 67
Introduction ............................................................................................................................... 67 Structural Analysis .................................................................................................................... 67 Sensitivity Analysis .................................................................................................................. 69
ACP Layer ........................................................................................................................ 70 Base Layer ........................................................................................................................ 71 Utilization of Subbase ....................................................................................................... 73 Subgrade ........................................................................................................................... 73
Determination of Equivalent Layer Thickness ......................................................................... 78 Fatigue Cracking of HMA ................................................................................................ 78 Rutting of Subgrade .......................................................................................................... 78 Rutting of Base ................................................................................................................. 78
Result from Structural Analysis ................................................................................................ 82 Cost Analysis ............................................................................................................................ 84
Methodology of Cost Analysis ......................................................................................... 84
Chapter 6 - Guidelines and Protocols ........................................................................................... 87
Introduction ............................................................................................................................... 87 Guidelines and Test Protocols .................................................................................................. 87

xi
Chapter 7 - Summary and Conclusions ........................................................................................ 93
References ..................................................................................................................................... 95
Appendix A - Cost Evaluation Tool Manual ................................................................................ 99
Introduction ............................................................................................................................. 101 Program Description ............................................................................................................... 101 Section 1: Project Information ................................................................................................ 102 Section 2: Pavement Section ................................................................................................... 102 Section 3: Base Layer Information ......................................................................................... 102 Section 4: Cost Information .................................................................................................... 103 Section 5: Results .................................................................................................................... 103 Section 6: Sample Calculation ................................................................................................ 104

xii

xiii
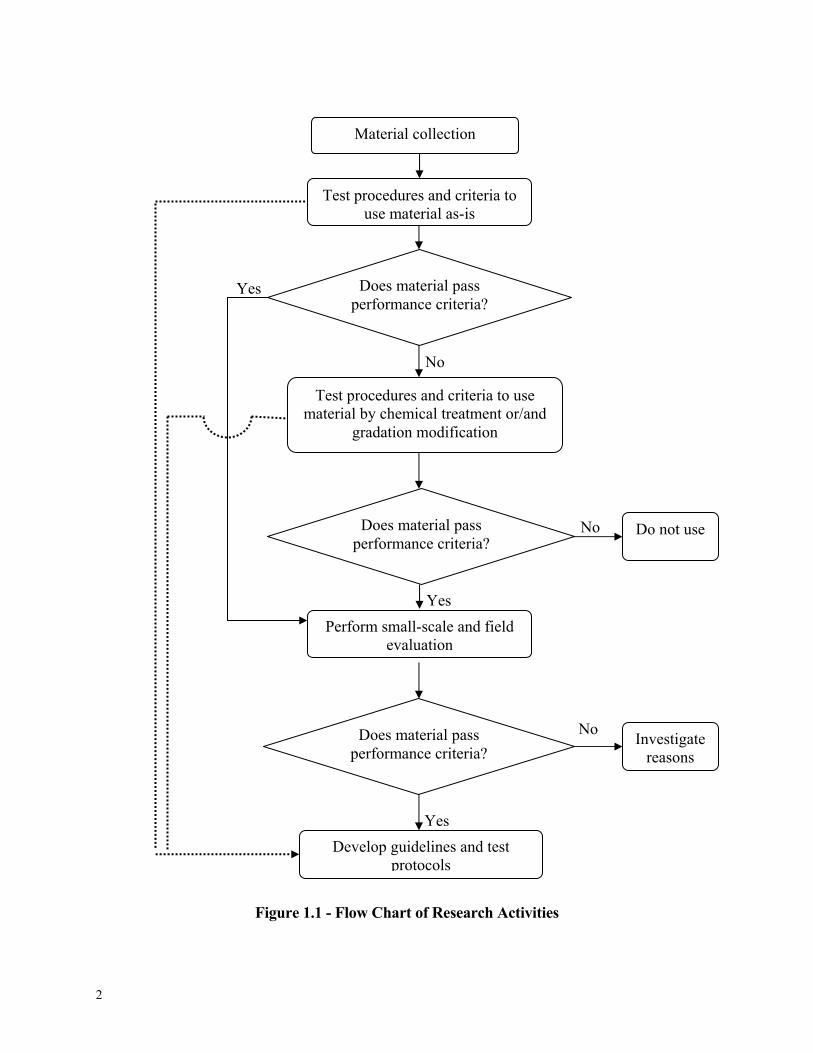
List of Figures Figure 1.1 - Flow Chart of Research Activities .............................................................................. 2 Figure 2.1 - Non-Standard Material Groups and Their Likely Problems
(Cook and Gourley, 2003) ....................................................................................... 15 Figure 2.2 - Test Protocol for Characterizing Base Materials (Geiger et al., 2006) ..................... 16 Figure 2.3 - Flowchart for Base Treatment (TxDOT, 2005) ........................................................ 18 Figure 2.4 - Variations of Rutting with Number of Load Cycles ................................................. 19 Figure 3.1 - Relationships between Moisture Content, Dry Density, Modulus and Strength ...... 24 Figure 3.2 - Aggregate Impact Value and Aggregate Crushing Value Test Setups ..................... 25 Figure 3.3 - Procedure for Repeated Load Triaxial Test .............................................................. 27 Figure 3.4 - Repeated Load Triaxial Load Schematic .................................................................. 28 Figure 3.5 – Stress and Strain of One Load Cycle ........................................................................ 28 Figure 3.6 - Typical Result Obtained from Resilient Modulus Test ............................................. 29 Figure 3.7 -Typical Result Obtained from Permanent Deformation Test .................................... 30 Figure 3.8 - Free-Free Resonant Column (FFRC) Test ................................................................ 31 Figure 3.9 - Tube Suction Test ..................................................................................................... 31 Figure 3.10 - Typical Variation in Modulus, Moisture and Dielectric Constant with Time ........ 32 Figure 3.11 - Schematic Picture of Tank (Amiri, 2004) ............................................................... 33 Figure 3.12 - Different Steps of Filling Tank ............................................................................... 34 Figure 3.13 - Modulus Test on a Small Scale Specimen .............................................................. 35 Figure 3.14 – Permanent Deformation Test on a Small Scale Specimen ..................................... 35 Figure 3.15 - Typical Pattern and Corresponding Deflections for
Cyclic Ramp Loading ............................................................................................. 35 Figure 3.16 – Typical Pattern and Corresponding Deflections for
Sinusoidal Loading ................................................................................................. 36 Figure 4.1 - Gradation Curves from Different Base Materials ..................................................... 40 Figure 4.2 - Decision Tree for Stabilization Selection ................................................................. 44 Figure 4.3 - Gradation Curves of Materials before and after Gradation Modification ................. 45 Figure 4.4 - Unconfined Compressive Strengths of Different Materials as per
Tex 120-E, Tex 121-E and Tex 127-E ...................................................................... 48
xiv
Figure 4.5 - ACV and AIV of Different Materials ....................................................................... 51 Figure 4.6 - Representative Resilient Modulus for Different Materials at
Optimum Moisture Content ....................................................................................... 54 Figure 4.7 - Representative Resilient Modulus for Different Materials at
Saturated Condition ................................................................................................... 54 Figure 4.8 - Dielectric Constants of Different Materials .............................................................. 58 Figure 4.9 - Retained Moduli of Different Materials .................................................................... 58 Figure 4.10 - Retained Strength of Different Materials ................................................................ 60 Figure 4.11 - Load Deflection Curves from Small Scale Test ...................................................... 63 Figure 4.12 - Comparison of Results from FWD Measurements and Laboratory Tests .............. 65 Figure 4.13 - Comparison of Results from PSPA Measurements and Laboratory Tests ............. 66 Figure 5.1 - Critical Stresses and Strains in a Three-Layer Flexible Pavement System .............. 68 Figure 5.2 - Typical Graph Obtained from VESYS (TxIntPave) Program .................................. 68 Figure 5.3 - Variations in Rutting in ACP Layer with ACP Thickness ........................................ 70 Figure 5.4 -Variations in Rutting with ACP Thickness ................................................................ 71 Figure 5.5 - Variations in Rutting with Parameter k1 of Base ...................................................... 72 Figure 5.6 - Variations in Rutting with Parameter k2 of Base ...................................................... 72 Figure 5.7 - Variations in Rutting with Parameter k3 of Base ...................................................... 74 Figure 5.8 - Variations in Rutting with Parameter μ of Base ....................................................... 74 Figure 5.9 - Variations in Rutting with Parameter Alpha of Base ................................................ 75 Figure 5.10 - Variations in Rutting with Thickness of Base ......................................................... 75 Figure 5.11 - Comparison of Variations in Rutting with Parameter Alpha for
Base Courses Consisting of One Layer and Two Layers ....................................... 76 Figure 5.12 - Comparison of Variations in Rutting with Parameter Mu for
Base Courses Consisting of One Layer and Two Layers ....................................... 76 Figure 5.13 - Variations in Rutting with Subgrade Modulus ........................................................ 77 Figure 5.14 - Variations of Rut Depth in Base Layer with Base Thickness ................................. 80 Figure 5.15 - Flow Chart for Determining Equivalent Base Thickness ....................................... 81 Figure 5.16 - Typical Trend of Rut Depth for Bases of High and Low Quality Materials ........... 84 Figure 5.17 - Worksheet of Cost Analysis for Roadway Base Construction with
Low and High Quality Materials ............................................................................ 85 Figure 6.1 - Flow Chart of Test and Evaluation Protocols ........................................................... 88 Figure 6.2 - Decision Tree for Selecting Type of Additive .......................................................... 91
xv
List of Tables Table 2.1 - Examples of the Use of Non-Standard Materials in Low-Volume Roads
(Cook and Gourley, 2003) ............................................................................................ 6 Table 2.2 – Material Requirements (TxDOT, 2004) .................................................................... 13 Table 2.3 - Contributing Factors to Base Related Distress ........................................................... 14 Table 2.4 - Summary of Conventional Stabilizers (Yoder and Witzcak, 1975) ........................... 17 Table 2.5 - Stabilization Methods for Different Soil Types (Terrel et al., 1979) ......................... 17 Table 2.6 - Load Carrying Capacity of Different Bases on Sandy Subgrade ............................... 20 Table 2.7 - Load Carrying Capacity of Different Bases on Clayey Subgrade .............................. 20 Table 4.1 - Sources and Rock Types of Materials Selected ......................................................... 38 Table 4.2 - Gradations, Classifications and Atterberg Limits ...................................................... 39 Table 4.3 - Results from Moisture-Density and Related Tests ..................................................... 39 Table 4.4 - Triaxial Compression for Different Base Materials ................................................... 41 Table 4.5 - Evaluation of the Results Based on Item 247 for a Grade 1 Base .............................. 43 Table 4.6 - Index Parameters for Materials before and after Treatment ....................................... 46 Table 4.7 - Characteristics of Base Materials before and after Treatment ................................... 47 Table 4.8 - Triaxial Compression for Base Materials
before and after Treatment or Modification ................................................................ 49 Table 4.9 - Resilient Moduli of Different Materials
before and after Treatment at Optimum Condition ..................................................... 52 Table 4.10 - Resilient Moduli of Different Materials
before and after Treatment at Saturated Condition .................................................. 53 Table 4.11 - Permanent Deformation Parameters
before and after Treatment at Optimum Condition .................................................. 55 Table 4.12 - Permanent Deformation Parameters
before and after Treatment at Saturated Condition .................................................. 56 Table 4.13 - Variations in Dielectric Constant,
Moisture Content and Seismic Modulus with Time ................................................ 59 Table 4.14 - Evaluation of the Results Based on Performance Tests ........................................... 60 Table 4.15 - Moisture-Density Test Results ................................................................................. 60 Table 4.16 - Triaxial Compression Test Results ........................................................................... 61 Table 4.17 - Permanent Deformation Test Results ....................................................................... 61 Table 4.18 - Resilient Modulus Test Results ................................................................................ 61 Table 4.19 - PSPA Test Results .................................................................................................... 62
xvi
Table 4.20 - DCP Test Results ...................................................................................................... 62 Table 4.21 - Loads Corresponding to 100 mils of Deflection from Small-Scale Tests ................ 64 Table 4.22 - Base Permanent Deformations (mils)
after 200 Loading Cycles from Small-Scale Tests .................................................. 64 Table 5.1 - TxIntPave Input Parameters for Base Layer .............................................................. 69 Table 5.2 - Typical Properties of Reference Pavement Layers .................................................... 69 Table 5.3 - Traffic Related Parameters ......................................................................................... 69 Table 5.4 - Parameters Sensitive to the Rutting of Base and the Total Rutting of Pavement ...... 77 Table 5.5 - Rutting Contribution for Different Base Thicknesses Required by FPS19 Design ... 83
1
Chapter 1 Introduction The use of high-quality base materials is generally required for pavement construction and rehabilitation to comply with conventional specifications. The source of these high-quality materials can be a long distance from the construction site, resulting in high transportation costs. The use of local sources of marginal materials or low-quality materials is not allowed if they do not comply with the existing specifications. Since the reserves of high-quality materials are diminishing in some regions, it is necessary to use local sources of unbound granular materials in pavements. If through appropriate chemical treatment and/or gradation modification of the low-quality materials or proper structural design (specifying thicker layers of base and/or hot mix), the use of the low-quality materials for the purpose of low-volume roads can be permitted, the construction can be accelerated and the significant monetary benefits can be realized. A thorough evaluation of out-of-specification base materials from different local sources is essential to provide guidelines and test protocols for using these materials for roadway base and subbase. Objective The main objective of this research project is to evaluate the out-of-specification/marginally low-quality base materials from local sources and develop comprehensive guidelines and test protocols for the use of such materials in the construction of low-volume roads. To achieve this objective, a number of tasks were proposed and completed. A flow chart of the progression of these tasks is shown in Figure 1.1. The first step of the process was to identify those TxDOT districts that benefit the most from using local materials and to investigate the methods criteria that the districts currently use to incorporate local materials in their construction. The local bases from the districts that might benefit the most from this study were selected for comprehensive testing and evaluation. The second step of the process consisted of extensive performance-based laboratory tests to determine whether the local materials can be used as-is. If a local material did not meet the
2
Yes
No
No
Yes No
Yes
Figure 1.1 - Flow Chart of Research Activities
Material collection
Test procedures and criteria to use material as-is
Does material pass performance criteria?
Test procedures and criteria to use material by chemical treatment or/and
gradation modification
Does material pass performance criteria?
Perform small-scale and field evaluation
Does material pass performance criteria?
Develop guidelines and test protocols
Do not use
Investigate reasons
3
performance-based criteria, the feasibility of treating the material with minimum amount of stabilizer was pursued. The next step consisted of the validation of the outcomes of the previous step. Small-scale simulation and field tests were used to validate the effectiveness of proposed remediation process under different environmental conditions. Finally, the results from all laboratory and field tests were analyzed and used to develop the guidelines and test protocols. Organization of Report This report consists of seven chapters. Chapter 2 contains the background and information searched from the previous work done on locally available base materials for the purpose of road construction. Chapter 3 outlines the research and test procedures for characterizing low-quality base materials. The topics discussed in that chapter are procedures for different laboratory testing programs, which include index property tests, compression tests, repeated load triaxial tests, free-free resonant column tests, tube suction tests and small scale tests. Chapter 4 presents information and results of common base materials from different parts of Texas. The topics discussed in that chapter are the description of the materials investigated, laboratory testing programs mentioned Chapter 3, the reasons for the materials being considered low-quality or marginal and the remedial measures with evaluation. Also, included in that chapter are the results from small scale tests and field monitoring tests. Chapter 5 presents the structural analysis and cost evaluation. For structural analysis, the topics include the sensitivity study in order to understand the parameters that influence the performance of the pavement in a low-volume road the most, and the determination of equivalent base thickness for low quality materials. For cost evaluation, several factors such as material cost, construction cost and transportation cost are discussed to comprehensively evaluate costs between the uses of the low-quality material from a local pit and the high-quality material from a distance source. Chapter 6 provides the guidelines and test protocols for using low quality materials on low-volume roads. Chapter 7 contains the summary and conclusions of the research as well as recommendations for changing TxDOT policies and future study.

4

5
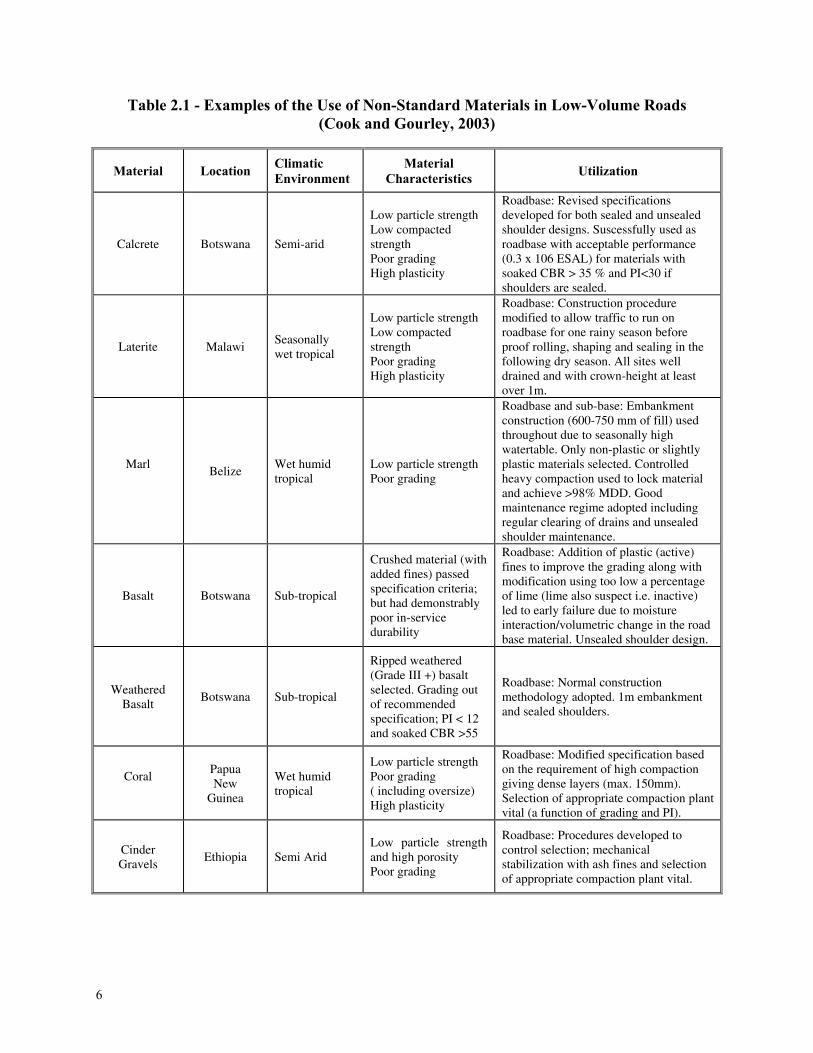
Chapter 2 Background and Information Search Introduction The performance of a pavement depends on many factors such as the structural adequacy of the pavement, the properties of the materials used, traffic loading, climate conditions and the construction method. For flexible pavements, the quality of base material is one of the most important factors. Previous research has found that much of the distress that flexible pavements experience can be traced to problems encountered in the base materials. Local materials may be out-of-specification with respect to the standard specifications for roadway base/subbase. Under the current TxDOT specification (Item 247), a base material can be considered out-of-specification for a variety of reasons (inadequate gradation, inadequate plasticity, inadequate strength etc.). In many cases, local base supplies miss the standard specification by a small margin. Since the criteria in Item 247 are experienced-based, some of the parameters used to classify a base material may be less significant than others. With appropriate treatment or structural design, many of these out-of-specification materials can perform adequately for low-volume roads (Arora et al., 1986; Greening and Rolt, 1997; Cook and Grourley, 2003). These materials should be capable of providing low-cost base and subbase in roads that are subjected to low traffic levels but high axle loads (Bullen, 2003). As the first task of the research project, an extensive literature review on the use of locally available materials for roadway base or subbase was conducted. The results from the information search are documented in this chapter. History and Current Status of Using Local Materials During the past two decades, a large number of research projects have been conducted throughout the world to utilize the locally available base materials. Table 2.1 shows examples of the use of non-standard local materials in low volume roads in different places in the world.
6
Table 2.1 - Examples of the Use of Non-Standard Materials in Low-Volume Roads (Cook and Gourley, 2003)
Material Location Climatic Environment
Material Characteristics
Utilization
Calcrete Botswana Semi-arid
Low particle strength Low compacted strength Poor grading High plasticity
Roadbase: Revised specifications developed for both sealed and unsealed shoulder designs. Suscessfully used as roadbase with acceptable performance (0.3 x 10⁶ ESAL) for materials with soaked CBR > 35 % and PI<30 if shoulders are sealed.
Laterite Malawi Seasonally wet tropical
Low particle strength Low compacted strength Poor grading High plasticity
Roadbase: Construction procedure modified to allow traffic to run on roadbase for one rainy season before proof rolling, shaping and sealing in the following dry season. All sites well drained and with crown-height at least over 1m.
Marl
Belize Wet humid tropical
Low particle strength Poor grading
Roadbase and sub-base: Embankment construction (600-750 mm of fill) used throughout due to seasonally high watertable. Only non-plastic or slightly plastic materials selected. Controlled heavy compaction used to lock material and achieve >98% MDD. Good maintenance regime adopted including regular clearing of drains and unsealed shoulder maintenance.
Basalt Botswana Sub-tropical
Crushed material (with added fines) passed specification criteria; but had demonstrably poor in-service durability
Roadbase: Addition of plastic (active) fines to improve the grading along with modification using too low a percentage of lime (lime also suspect i.e. inactive) led to early failure due to moisture interaction/volumetric change in the road base material. Unsealed shoulder design.
Weathered Basalt
Botswana Sub-tropical
Ripped weathered (Grade III +) basalt selected. Grading out of recommended specification; PI < 12 and soaked CBR >55
Roadbase: Normal construction methodology adopted. 1m embankment and sealed shoulders.
Coral
Papua New
Guinea
Wet humid tropical
Low particle strength Poor grading ( including oversize) High plasticity
Roadbase: Modified specification based on the requirement of high compaction giving dense layers (max. 150mm). Selection of appropriate compaction plant vital (a function of grading and PI).
Cinder Gravels
Ethiopia Semi Arid Low particle strength and high porosity Poor grading
Roadbase: Procedures developed to control selection; mechanical stabilization with ash fines and selection of appropriate compaction plant vital.
7
Studies conducted by the UK Department for International Development (DFID) and others have shown that, with appropriate design, the use of local materials can play a crucial role in terms of cost saving, pavement performance, resource management and environment protection (Cook and Gourley, 2003; Bullen, 2003). The Ministry of Works and Communications of Botswana (MOWC) and the UK Transport Research Laboratory (TRL) carried out a research program on the performance of calcrete (caliche) road base materials in the Kalahari region of southern Africa between 1978 and 1993 (Greening and Rolt, 1997). Based on the results from that study, Cook and Gourley (2003) proposed an evaluation procedure as a decision making tool in the context of using sub-standard materials for low volume roads. Potential calcrete sources were defined as being highly variable in character and frequently out of standard specification in terms of gradation, plasticity, particle strength, and moisture susceptibility. A capacity to breakdown under compaction was also noted. Since there were no similar calcrete roads existed to use for performance data gathering at that time, additional laboratory tests were conducted to quantify the moisture susceptibility and its impact on compacted strength. The evaluation showed significant uncertainty as to the long-term performance due to sensitivity of fine calcrete to wetting. In the light of this significant risk, it was decided that mechanical and chemical stabilization options could be included in further studies. A recommendation for long-term trials was made, incorporating both stabilized and un-stabilized calcrete bases. The trials comprised of four sections with un-stabilized calcrete and one section each of lime, cement and mechanically stabilized fine calcrete. Construction and in service performance were monitored for 13 years. It was found that the four types of calcrete as road base could be recommended within the defined road environment, such as natural environment factors, project-related factors and design response factors. Appropriate specifications and guidelines for use were drawn up by Cook and Gourley (2003). Another study was also conducted on the same stretch of road to develop performance models. The primary measure of pavement performance considered was the volume of traffic that the pavement was able to carry before reaching a defined “failure” condition at which rehabilitation was required. The design traffic for the road was taken as 0.5 million ESALs (equivalent single axle loads). But in the experiment, many of the trial sections did not reach the terminal condition. The performance models were developed relating rut depth to traffic volume (Greening and Rolt, 1997). A survey of seven contracts in that region indicated that the cost of constructing a calcrete base was about 85% less as compared with hauled-in crushed stone. The use of sand as subbase material also resulted in considerable savings. Most of the calcrete materials were suitable for use in the subbase but the use of the abundant sources of Kalahari sand resulted in savings in haulage costs. Savings of approximately £34,000 per kilometer was expected when local material was available adjacent to construction sites in the region (Greening and Rolt, 1997). A research study was conducted on a highway in northern Belize to investigate the suitability of local calcareous materials, known as marls, for road bases (Woodbridge, 1999). The marls comprised of high-purity carbonate materials containing mainly silt-sized particles and fall outside the gradation, plasticity, and strength specifications normally required for bases. Despite the good performance of existing marl pavements in Belize and Mexico, there were concerns
8
about the low wet strength, poor gradation, and relatively high plasticity of the marls. Subsequently, the TRL carried out a full laboratory investigation followed by a field trial in 1978, using three marls substituted for the crushed stone base used in a major project. The gradation of the stockpiled marls was outside the recommended gradation envelope for mechanically stable natural gravel. Gradations determined on marl samples taken after compaction were even finer grained than the stockpiled marl samples, and therefore, further outside the recommended gradation envelope. The marls contained a high proportion of fines, but did not show high plasticity. The plasticity index of the material exceeded 6, and the liquid limit exceeded 25. Under these criteria, the marls were of marginal quality as base materials. The un-soaked California bearing-ratio (CBR) values of the marls were very high and comparable to the crushed stone but their soaked CBR values were much lower. Considering the cost savings, the Santa Cruz marl was selected for stabilization with 5% cement. The performance of the cement-stabilized marl base was excellent. A number of cracks developed in the early years did not increase. The low values of rut depth and deflection testified to the high strength of the base. In 1992, field samples yielded unconfined compressive strength (UCS) values averaging 1300 psi (9 MPa) for the fresh stabilized marl. It was also found that the material became more water resistant. This result indicated that it was possible to use a much wider range of marls if they were stabilized. Another example concerning cost benefit is from Northeastern Thailand where the most available local materials were lateritic soil, and gravel and silty sand. The place had encountered the problem of material deficiency for many years, especially crushed rock for base and subbase course. A research was conducted on the use of local materials as base course for low volume road design and construction (Ruenkrairergsa, 1980). For the relatively low traffic volume of most routes and for the problem of material shortage associated with the financial status of the country, an approach using the local materials was applied to the design and construction of the road network in this area. The approach mainly included:
Conducting researches on local materials and their stabilization to develop the more suitable specifications.
Determining how to use different local materials on the basis of the new specifications For fined grained or high PI lateritic soil, 3% to 5% of cement is adopted to achieve an
unconfined compressive strength of 250 psi which is related to a CBR value of more than 100% in this case.
In the United States, a large number of studies have been conducted on low volume roads. The first comprehensive guideline for low volume road design and construction was developed by Arora et al. (1986) for the Federal Highway Administration (FHWA). Considerations to traffic, environmental factors, subgrade preparation, compaction and curing were also provided in that guideline. Hall and Bettis (2000) summarized and compared all available design procedures used in the United States for low volume roads. Their study indicated that in many cases, “normal” design methods often provide substantial, and perhaps unwarranted, structural sections for low volume roads, and comprehensive low-volume road design procedures were needed.
9
In Texas, more than 60% of base materials used in roadway construction during the period from September 1, 2005 to August 31, 2006 are classified as Grade 4 defined by Item 247. Even though in some instances Grade 4 was used to strengthen the specifications, in most cases the Grade 4 was used to relax some of the requirements of Item 247. These locally available materials have been used not only for low volume roads but also for major roads in some districts. Perceived difficulties of using sub-standard locally available materials still exist. A number of factors combine to pose a major challenge to the implementation of them. These factors include:
Standards and Specifications. Insufficient research has been carried out to justify changes in the current standards and specifications which are usually conservative and seek to establish material property limits which will provide materials of undoubted quality. Where research has been carried out, limited funding is made available for effective dissemination and implementation of changes is often inadequate.
Engineering Uncertainty. There is still reluctance to use sub-standard materials and
related mix/structural design and construction technology because of a perceived risk of problems or even failure.
Comprehensive guidelines or specifications for the use of sub-standard locally available materials for roadway base and subbase need to be developed. These guidelines or specifications should cover the issues on material characterization, stabilizer selection and application, cost-benefit analysis, construction QA/QC and initial road performance monitoring as well as pavement design incorporating the concept, defined road environment, as called by Cook and Gourley (2003). Factors Affecting Strength, Stiffness and Permanent Deformation The structural integrity of a flexible pavement section is controlled by several parameters. In most classical structural design programs (such as FPS19 or Texas Triaxial), the design thickness of the layers are (directly or indirectly) estimated based on the criteria that the stresses at the interfaces of the hot mix and base and the base and subgrade are low enough so that the cracking and rutting will not be an issue. The traffic volume is also a major consideration. For a given traffic condition, the thicker the layers overlying the base, the thicker the base layer and the stiffer the subgrade are, the lower the base layer stresses will be. This indicates that not only the quality of base should be considered in the decision to use local materials, the stiffness of the subgrade and the thickness of the hot mix should also be considered. Assuming that the untreated local materials have lower moduli than those hauled-in, several strategies can be followed to replace hauled-in materials with local ones. These strategies include:
1. Use the local base materials but as a thicker layer, 2. Use the same thickness of local base but thicken the hot mix asphalt and/or improve the
stiffness of the subgrade layer,
10
3. Place the local material on top of the subgrade but cover it with a thinner layer of hauled-in, high-quality base, and
4. Mix the local material with limited amount of imported high quality aggregate. By adding chemical additives to the local material, its strength, stiffness, resistance to permanent deformation, can be improved provided it is placed on the appropriated subgrade. An extremely strong mix is not desirable because of potential for cracking, and a weak mix will impact the structural capacity of the road. As the concentration of appropriately selected additives increases, the strength and modulus of the stabilized material generally increase as well. Different materials are impacted differently with the type and concentration of the additives. The optimum moisture content (OMC) and the maximum dry density (MDD) are also impacted by the addition of the stabilizers. A thorough investigation of the behavior of the mixtures with the change in material and type of stabilizer should be considered. Since the economy is of big concern in this project, most probably the best solution is to add just enough additives to improve the local material to act similar to the imported higher-quality base, rather than resorting to a strong and stiff stabilized layer. Aggregate Shape and Size The aggregate particle shape is characterized by three different properties: angularity, form, and surface texture. Angularity expresses the sharpness or roundness of the aggregate corners. Form expresses the dimension of the aggregates, and texture refers to the small scale asperities. Lekarp et al. (2000) showed that gravel (rough particle) had a higher resilient modulus than the crushed limestone. But many other researchers believe that crushed aggregate with angular to sub-angular shaped particles provides better load spreading properties and a higher resilient modulus than uncrushed gravel with sub-rounded or rounded particles. Barksdale and Itani (1989) studied the influence of aggregate shape and surface characteristics on aggregate rutting. They concluded that blade shaped crushed aggregate is slightly more susceptible to rutting than the other types of crushed aggregate. Compaction The resilient response of a base material is affected by the degree of compaction, degree of saturation, moisture content during compaction, and method of compaction (Nazarian et al., 1996). Thompson (1989) stated that for a given degree of saturation, soils compacted to the maximum dry density yield higher resilient moduli. Resilient moduli are greater on the dry side of optimum than on the wet side. If allowed to rest before testing, the specimens compacted at higher degree of saturation exhibit a significant increase in strength due to the thixotropic effect. This effect is significant on specimens compacted on the wet side, as compared to the dry side of the optimum. As such, the degree of saturation plays a major role in the resilient response of granular materials subjected to repeated loading (Nazarian et al., 1996).
11
Dry Density Hicks and Monismith (1971) found the effect of density to be greater for partially crushed than for fully crushed aggregates. They found that the resilient modulus increased with relative density for the partially crushed aggregate tested, whereas it remained almost unchanged when the aggregate was fully crushed. They further reported that the significance of changes in density decreased as the fines content of the granular material increased. Barksdale and Itani (1989) reported that the resilient modulus increased markedly with increasing density only at low values of mean normal stress. At high stress levels, the effect of density was found to be less pronounced. At densities above the optimum value, the resilient modulus is not very sensitive to density. Resistance to permanent deformation in granular materials under repetitive loading appears to be highly improved as a result of increased density. Barksdale (1972) studied the behavior of several granular materials and observed an average of 185% more permanent axial strain when the material was compacted at 95% instead of 100% of maximum compaction density. Allen (1973) reported an 80% reduction in total plastic strain in crushed limestone and a 22% reduction in gravel as the specimen density was increased from Proctor to modified Proctor density. For rounded aggregates, this decrease in strain with increasing density is not considered to be significant, as these aggregates are initially of a higher relative density than angular aggregates for the same compaction effort. Fines Content Studies demonstrating the variation in response of granular materials subjected to repeated axial stresses indicate that the fines content (percent passing No.200 sieve) can also affect the resilient behavior. Hicks and Monismith (1971) observed some reduction in resilient modulus with increasing fines content for the partially crushed aggregates tested, whereas the effect was reported to be the opposite when the aggregates were fully crushed. The variation of fines content in the range of 2-10% was reported to have a minor influence on resilient modulus. Yet, a dramatic drop of about 60% in resilient modulus was noted by Barksdale and Itani (1989), when the amount of fines increased from 0 to 10%. Gradation and Grain Size Kolisoja (1997) showed that for aggregates with similar grain size distribution and the same fines content, the resilient modulus increased with increasing maximum particle size. As the size of the particle increases, the particle to particle contact decreases resulting in less total deformation and consequently higher stiffness. Thom and Brown (1988) concluded that uniformly graded aggregates were only slightly stiffer than well-graded aggregates. They further indicated that the influence of gradation on the permanent deformation depends on the level of compaction. Lekarp et al. (2000) argued that the effect of gradation on permanent deformation was more significant than compaction, with the highest plastic strain resistance for the densest mix.
12
Moisture Content The amount of moisture present in most untreated granular materials has been found to influence the resilient response of the material in both the laboratory and the in-situ conditions. Studies of the behavior of granular materials at high degrees of saturation have showed that the resilient modulus is highly dependent on moisture content, with the modulus decreasing with growing saturation level (Lekarp et al., 2000). Dawson et al. (2000) studied a range of well-graded unbound aggregates and found that below the optimum moisture content stiffness tends to increase with increasing moisture level, apparently due to development of suction. Beyond the optimum moisture content, as the material becomes more saturated and excess pore water pressure is developed, the effect changes to the opposite and stiffness starts to decline fairly rapidly. As moisture content increases and saturation is approached, positive pore pressure may develop under rapid applied loads. Excessive pore pressure reduces the effective stress, resulting in diminishing permanent deformation resistance of the material. The combination of a high degree of saturation and low permeability due to poor drainage leads to high pore pressure, low effective stress, and consequently, low stiffness and low deformation resistance. Thompson and Naumann (1993) reported the results from repeated load triaxial tests on the crushed stone from the AASHTO Road Test at varying degrees of saturation. In all cases, the samples experienced a substantial increase in permanent deformation after soaking. It was suggested that one reason for the observed increase was development of transient pore pressures in the soaked samples. Stress State The resilient modulus increases considerably with increasing confining pressure and sum of principal stresses (Lekarp et al., 2000). An increase of about 50% in resilient modulus was observed by Smith and Nair (1973) when the sum of principal stresses increased from 10 psi to 20 psi. Compared to confining pressure, deviator or shear stress is said to be much less influential on resilient modulus of the material. The accumulation of axial permanent strain is directly related to deviator stress and inversely related to confining pressure. Several researchers have reported that permanent deformation in granular materials is principally governed by some form of stress ratio consisting of both deviator and confining stresses. Lekarp and Dawson (1997) argued that failure in granular materials under repeated loading is a gradual process and not a sudden collapse as in static failure tests. Therefore, ultimate shear strength and stress levels that cause sudden failure are of no great interest for analysis of material behavior when the increase in permanent strain is incremental.
13
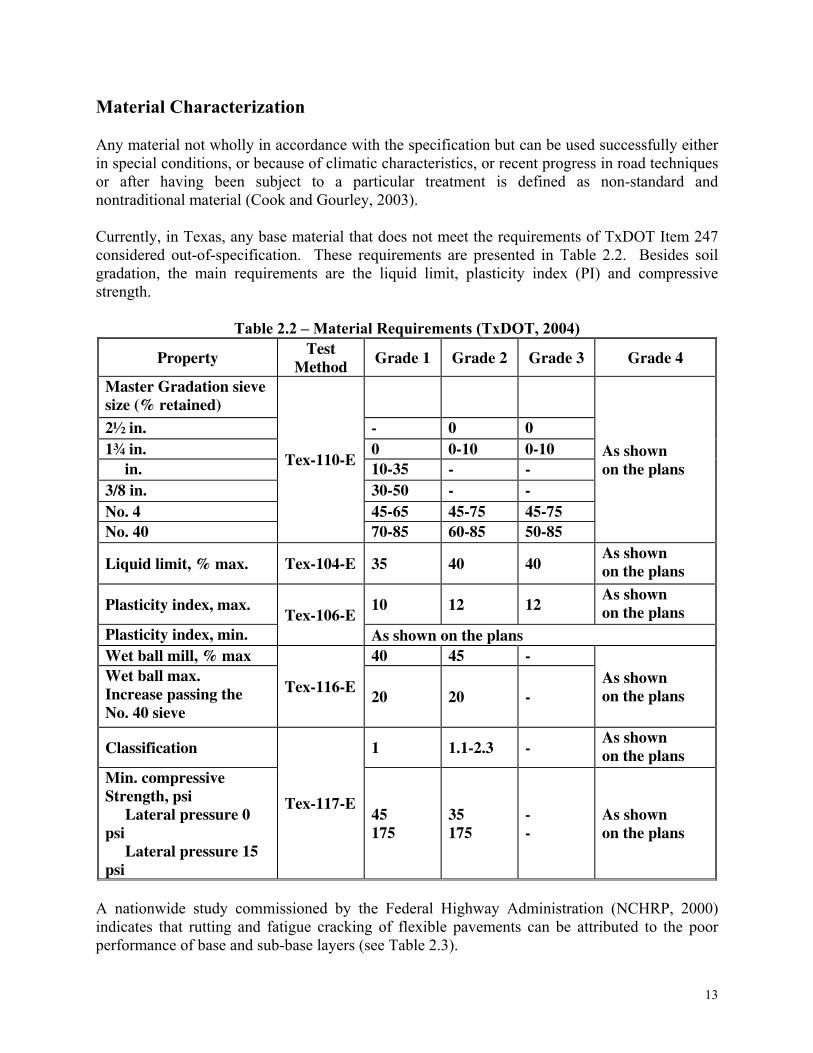
Material Characterization Any material not wholly in accordance with the specification but can be used successfully either in special conditions, or because of climatic characteristics, or recent progress in road techniques or after having been subject to a particular treatment is defined as non-standard and nontraditional material (Cook and Gourley, 2003). Currently, in Texas, any base material that does not meet the requirements of TxDOT Item 247 considered out-of-specification. These requirements are presented in Table 2.2. Besides soil gradation, the main requirements are the liquid limit, plasticity index (PI) and compressive strength.
Table 2.2 – Material Requirements (TxDOT, 2004)
Property Test Method Grade 1 Grade 2 Grade 3 Grade 4
Master Gradation sieve size (% retained)
Tex-110-E
As shown on the plans
2½ in. - 0 0 1¾ in. 0 0-10 0-10 ��� in. 10-35 - - 3/8 in. 30-50 - - No. 4 45-65 45-75 45-75 No. 40 70-85 60-85 50-85
Liquid limit, % max. Tex-104-E 35 40 40 As shown on the plans
Plasticity index, max. Tex-106-E
10 12 12 As shown on the plans
Plasticity index, min. As shown on the plans Wet ball mill, % max
Tex-116-E
40 45 - As shown on the plans
Wet ball max. Increase passing the No. 40 sieve
20 20 -
Classification
Tex-117-E
1 1.1-2.3 - As shown on the plans
Min. compressive Strength, psi Lateral pressure 0 psi Lateral pressure 15 psi
45 175
35 175
- -
As shown on the plans
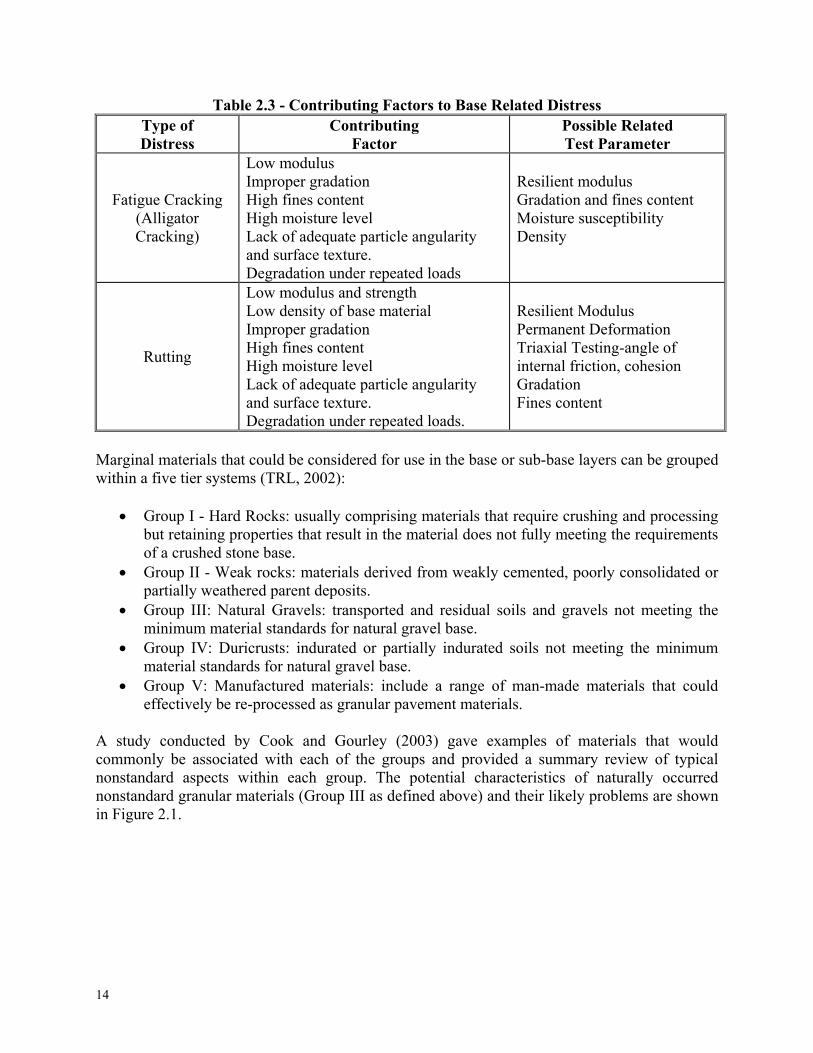
A nationwide study commissioned by the Federal Highway Administration (NCHRP, 2000) indicates that rutting and fatigue cracking of flexible pavements can be attributed to the poor performance of base and sub-base layers (see Table 2.3).
14
Table 2.3 - Contributing Factors to Base Related Distress Type of Distress
Contributing Factor
Possible Related Test Parameter
Fatigue Cracking (Alligator Cracking)
Low modulus Improper gradation High fines content High moisture level Lack of adequate particle angularity and surface texture. Degradation under repeated loads
Resilient modulus Gradation and fines content Moisture susceptibility Density
Rutting
Low modulus and strength Low density of base material Improper gradation High fines content High moisture level Lack of adequate particle angularity and surface texture. Degradation under repeated loads.
Resilient Modulus Permanent Deformation Triaxial Testing-angle of internal friction, cohesion Gradation Fines content
Marginal materials that could be considered for use in the base or sub-base layers can be grouped within a five tier systems (TRL, 2002):
Group I - Hard Rocks: usually comprising materials that require crushing and processing but retaining properties that result in the material does not fully meeting the requirements of a crushed stone base.
Group II - Weak rocks: materials derived from weakly cemented, poorly consolidated or partially weathered parent deposits.
Group III: Natural Gravels: transported and residual soils and gravels not meeting the minimum material standards for natural gravel base.
Group IV: Duricrusts: indurated or partially indurated soils not meeting the minimum material standards for natural gravel base.
Group V: Manufactured materials: include a range of man-made materials that could effectively be re-processed as granular pavement materials.
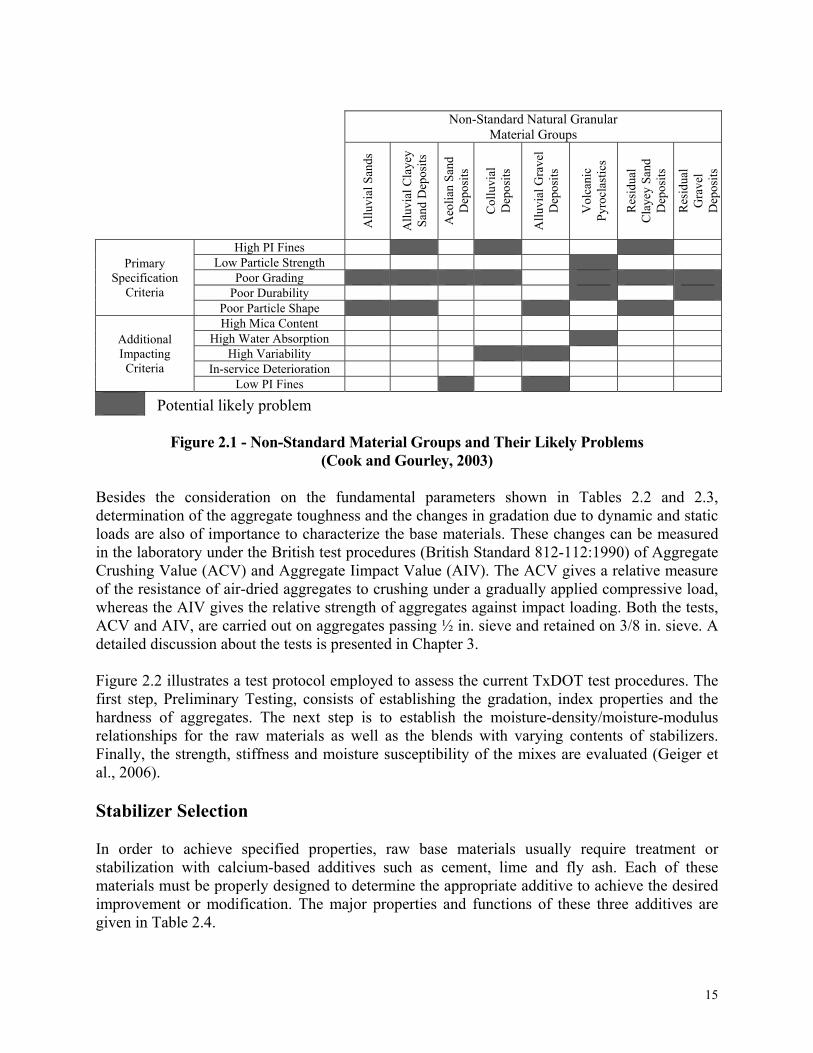
A study conducted by Cook and Gourley (2003) gave examples of materials that would commonly be associated with each of the groups and provided a summary review of typical nonstandard aspects within each group. The potential characteristics of naturally occurred nonstandard granular materials (Group III as defined above) and their likely problems are shown in Figure 2.1.
15
Potential likely problem
Figure 2.1 - Non-Standard Material Groups and Their Likely Problems (Cook and Gourley, 2003)
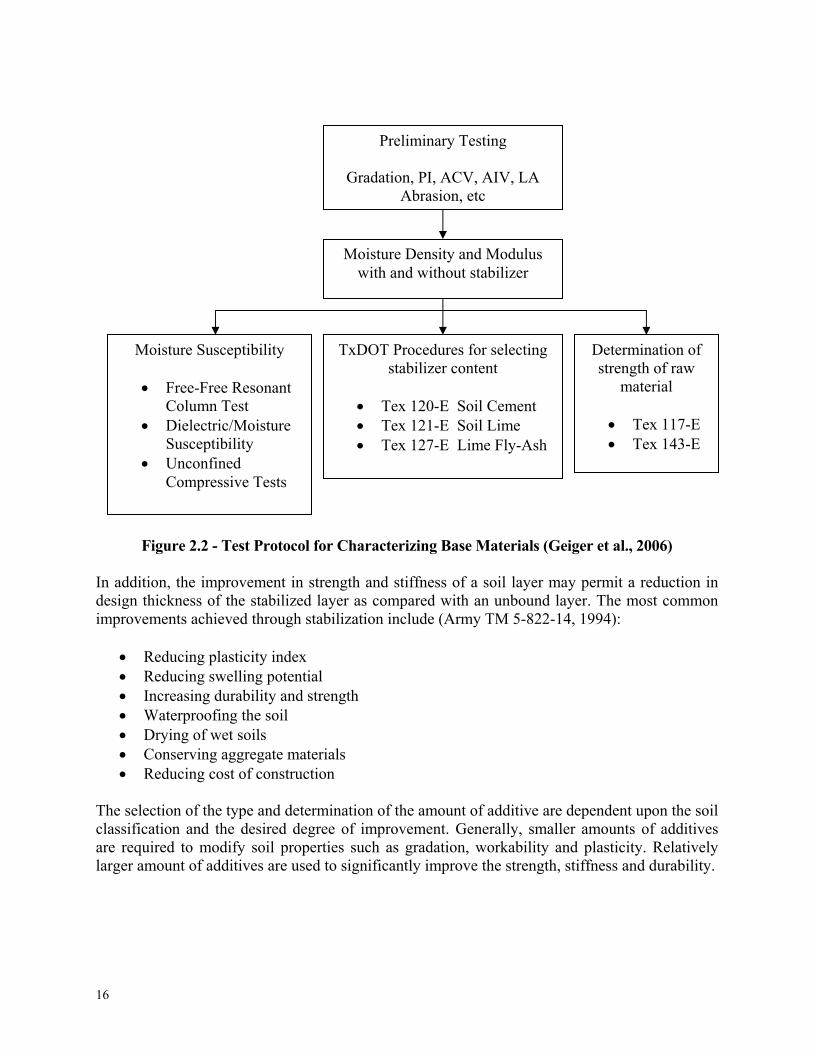
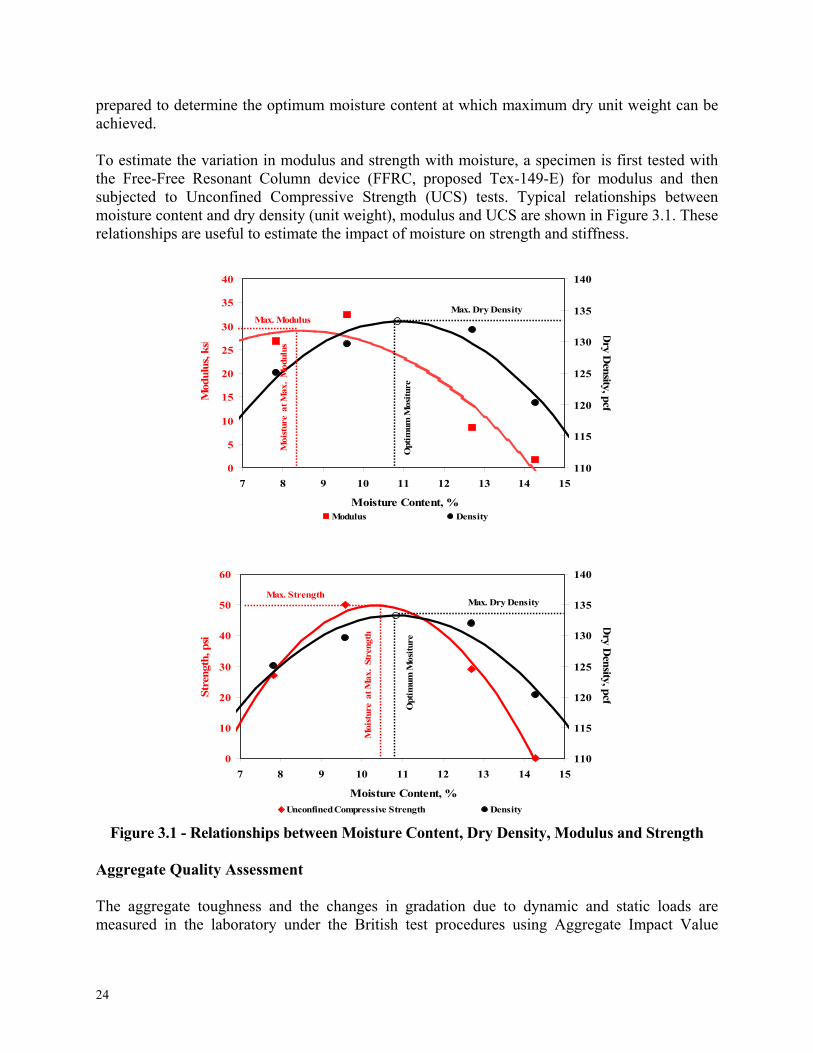
Besides the consideration on the fundamental parameters shown in Tables 2.2 and 2.3, determination of the aggregate toughness and the changes in gradation due to dynamic and static loads are also of importance to characterize the base materials. These changes can be measured in the laboratory under the British test procedures (British Standard 812-112:1990) of Aggregate Crushing Value (ACV) and Aggregate Iimpact Value (AIV). The ACV gives a relative measure of the resistance of air-dried aggregates to crushing under a gradually applied compressive load, whereas the AIV gives the relative strength of aggregates against impact loading. Both the tests, ACV and AIV, are carried out on aggregates passing ½ in. sieve and retained on 3/8 in. sieve. A detailed discussion about the tests is presented in Chapter 3. Figure 2.2 illustrates a test protocol employed to assess the current TxDOT test procedures. The first step, Preliminary Testing, consists of establishing the gradation, index properties and the hardness of aggregates. The next step is to establish the moisture-density/moisture-modulus relationships for the raw materials as well as the blends with varying contents of stabilizers. Finally, the strength, stiffness and moisture susceptibility of the mixes are evaluated (Geiger et al., 2006). Stabilizer Selection In order to achieve specified properties, raw base materials usually require treatment or stabilization with calcium-based additives such as cement, lime and fly ash. Each of these materials must be properly designed to determine the appropriate additive to achieve the desired improvement or modification. The major properties and functions of these three additives are given in Table 2.4.
Non-Standard Natural Granular Material Groups
All
uvia
l San
ds
All
uvia
l Cla
yey
San
d D
epos
its
Aeo
lian
San
d D
epos
its
Col
luvi
al
Dep
osit
s
All
uvia
l Gra
vel
Dep
osit
s
Vol
cani
c P
yroc
last
ics
Res
idua
l C
laye
y S
and
Dep
osit
s
Res
idua
l G
rave
l D
epos
its
Primary Specification
Criteria
High PI Fines Low Particle Strength
Poor Grading Poor Durability
Poor Particle Shape
Additional Impacting Criteria
High Mica Content High Water Absorption
High Variability In-service Deterioration
Low PI Fines
16
Figure 2.2 - Test Protocol for Characterizing Base Materials (Geiger et al., 2006) In addition, the improvement in strength and stiffness of a soil layer may permit a reduction in design thickness of the stabilized layer as compared with an unbound layer. The most common improvements achieved through stabilization include (Army TM 5-822-14, 1994):
Reducing plasticity index Reducing swelling potential Increasing durability and strength Waterproofing the soil Drying of wet soils Conserving aggregate materials Reducing cost of construction
The selection of the type and determination of the amount of additive are dependent upon the soil classification and the desired degree of improvement. Generally, smaller amounts of additives are required to modify soil properties such as gradation, workability and plasticity. Relatively larger amount of additives are used to significantly improve the strength, stiffness and durability.
Preliminary Testing
Gradation, PI, ACV, AIV, LA Abrasion, etc
Moisture Density and Modulus with and without stabilizer
TxDOT Procedures for selecting stabilizer content
Tex 120-E Soil Cement Tex 121-E Soil Lime Tex 127-E Lime Fly-Ash
Moisture Susceptibility
Free-Free Resonant Column Test
Dielectric/Moisture Susceptibility
Unconfined Compressive Tests
Determination of strength of raw
material
Tex 117-E Tex 143-E
17
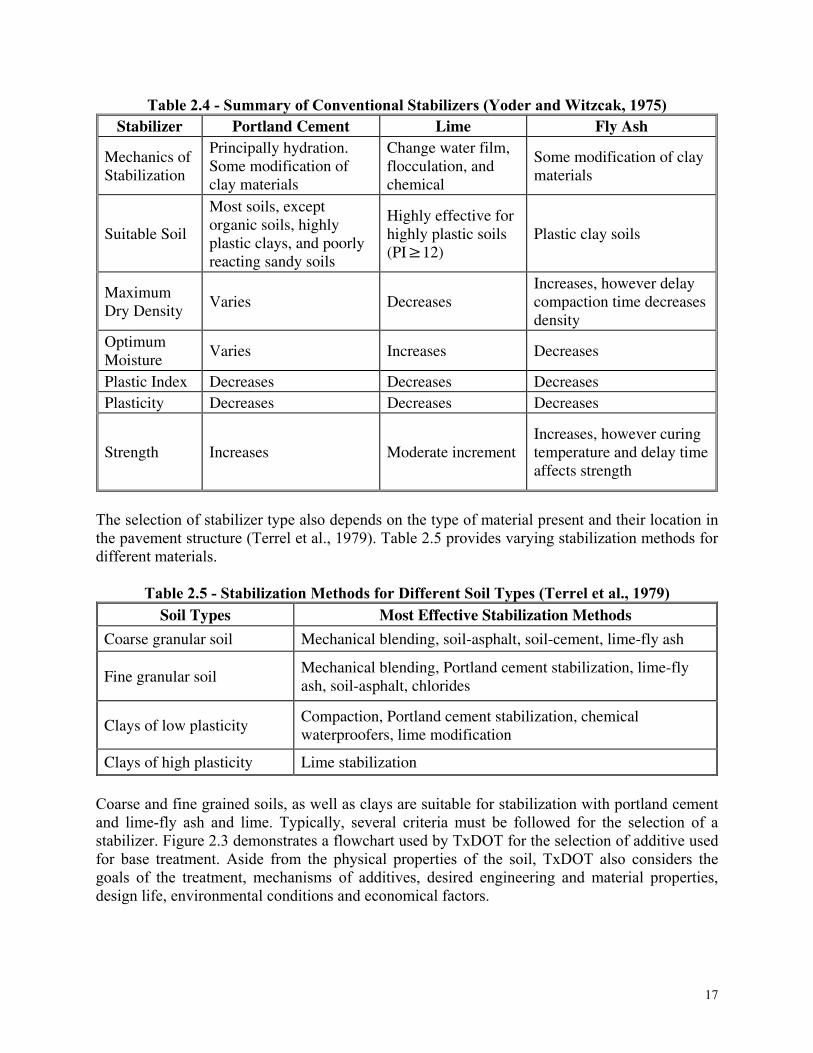
Table 2.4 - Summary of Conventional Stabilizers (Yoder and Witzcak, 1975) Stabilizer Portland Cement Lime Fly Ash
Mechanics of Stabilization
Principally hydration. Some modification of clay materials
Change water film, flocculation, and chemical
Some modification of clay materials
Suitable Soil
Most soils, except organic soils, highly plastic clays, and poorly reacting sandy soils
Highly effective for highly plastic soils (PI≥12)
Plastic clay soils
Maximum Dry Density
Varies Decreases Increases, however delay compaction time decreases density
Optimum Moisture
Varies Increases Decreases
Plastic Index Decreases Decreases Decreases Plasticity Decreases Decreases Decreases
Strength Increases Moderate increment Increases, however curing temperature and delay time affects strength
The selection of stabilizer type also depends on the type of material present and their location in the pavement structure (Terrel et al., 1979). Table 2.5 provides varying stabilization methods for different materials.
Table 2.5 - Stabilization Methods for Different Soil Types (Terrel et al., 1979) Soil Types Most Effective Stabilization Methods
Coarse granular soil Mechanical blending, soil-asphalt, soil-cement, lime-fly ash
Fine granular soil Mechanical blending, Portland cement stabilization, lime-fly ash, soil-asphalt, chlorides
Clays of low plasticity Compaction, Portland cement stabilization, chemical waterproofers, lime modification
Clays of high plasticity Lime stabilization
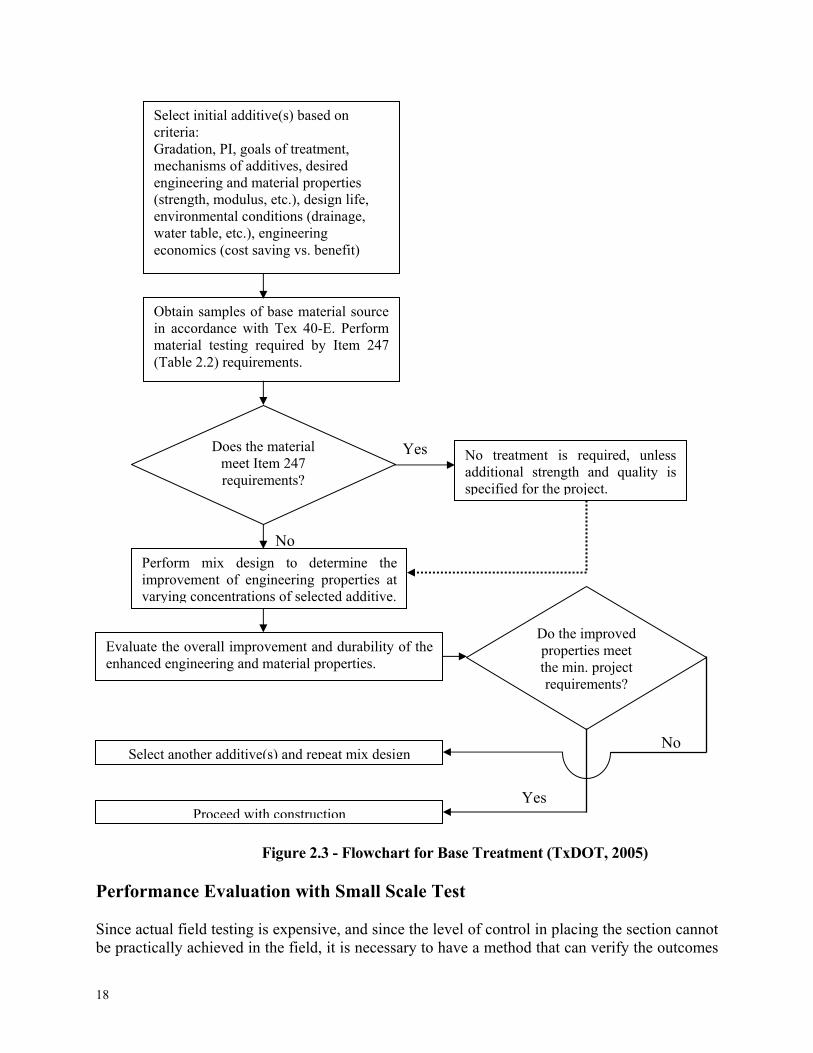
Coarse and fine grained soils, as well as clays are suitable for stabilization with portland cement and lime-fly ash and lime. Typically, several criteria must be followed for the selection of a stabilizer. Figure 2.3 demonstrates a flowchart used by TxDOT for the selection of additive used for base treatment. Aside from the physical properties of the soil, TxDOT also considers the goals of the treatment, mechanisms of additives, desired engineering and material properties, design life, environmental conditions and economical factors.
18
Yes No No Yes
Figure 2.3 - Flowchart for Base Treatment (TxDOT, 2005) Performance Evaluation with Small Scale Test Since actual field testing is expensive, and since the level of control in placing the section cannot be practically achieved in the field, it is necessary to have a method that can verify the outcomes
Select initial additive(s) based on criteria: Gradation, PI, goals of treatment, mechanisms of additives, desired engineering and material properties (strength, modulus, etc.), design life, environmental conditions (drainage, water table, etc.), engineering economics (cost saving vs. benefit)
Obtain samples of base material source in accordance with Tex 40-E. Perform material testing required by Item 247 (Table 2.2) requirements.
Does the material meet Item 247 requirements?
No treatment is required, unless additional strength and quality is specified for the project.
Perform mix design to determine the improvement of engineering properties at varying concentrations of selected additive.
Evaluate the overall improvement and durability of the enhanced engineering and material properties.
Select another additive(s) and repeat mix design
Proceed with construction
Do the improved properties meet the min. project requirements?
19
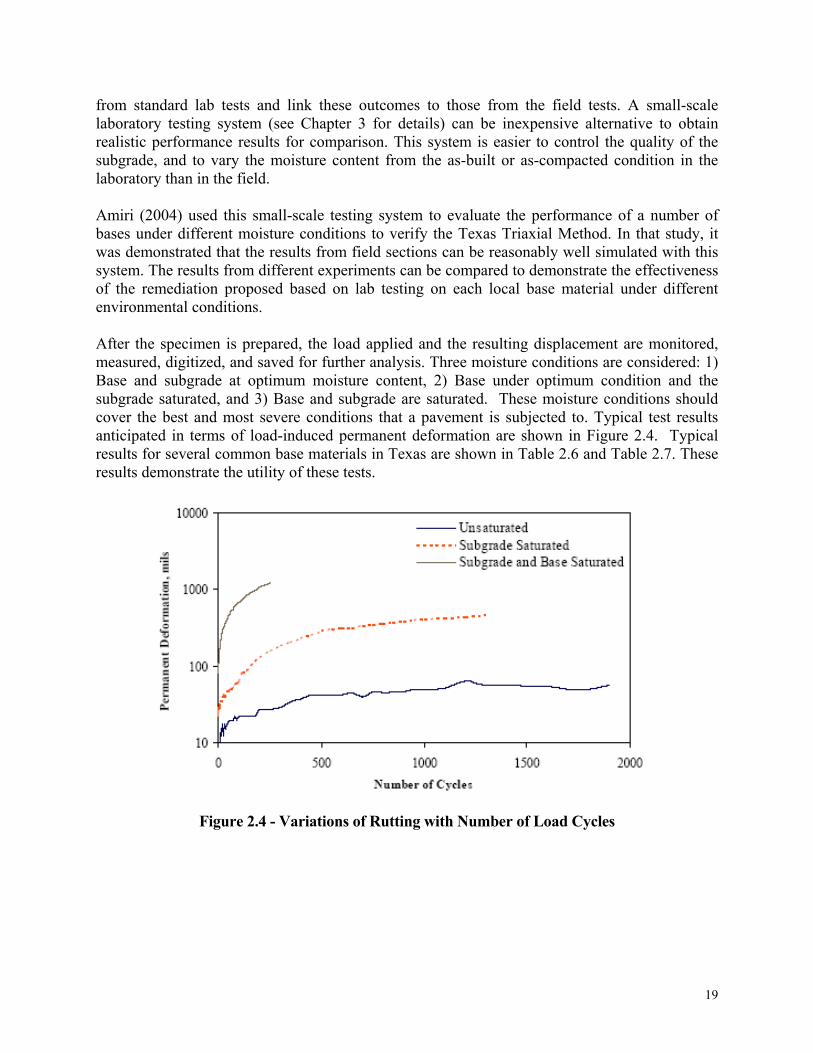
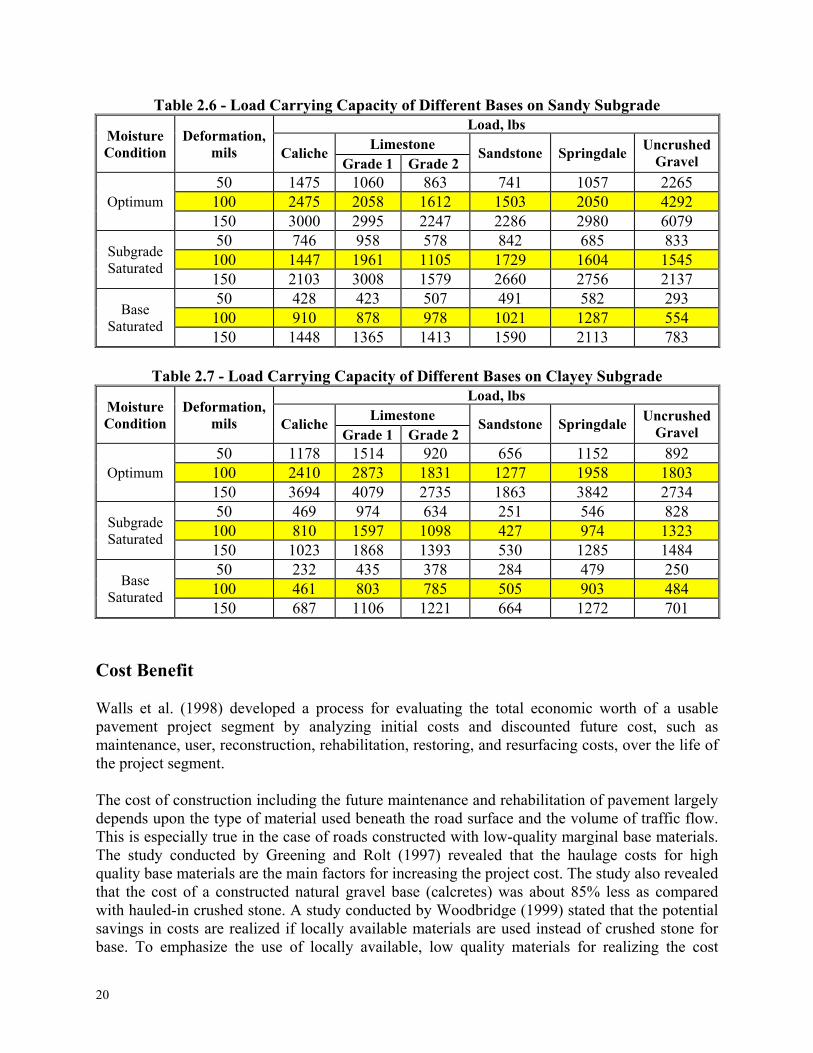
from standard lab tests and link these outcomes to those from the field tests. A small-scale laboratory testing system (see Chapter 3 for details) can be inexpensive alternative to obtain realistic performance results for comparison. This system is easier to control the quality of the subgrade, and to vary the moisture content from the as-built or as-compacted condition in the laboratory than in the field. Amiri (2004) used this small-scale testing system to evaluate the performance of a number of bases under different moisture conditions to verify the Texas Triaxial Method. In that study, it was demonstrated that the results from field sections can be reasonably well simulated with this system. The results from different experiments can be compared to demonstrate the effectiveness of the remediation proposed based on lab testing on each local base material under different environmental conditions. After the specimen is prepared, the load applied and the resulting displacement are monitored, measured, digitized, and saved for further analysis. Three moisture conditions are considered: 1) Base and subgrade at optimum moisture content, 2) Base under optimum condition and the subgrade saturated, and 3) Base and subgrade are saturated. These moisture conditions should cover the best and most severe conditions that a pavement is subjected to. Typical test results anticipated in terms of load-induced permanent deformation are shown in Figure 2.4. Typical results for several common base materials in Texas are shown in Table 2.6 and Table 2.7. These results demonstrate the utility of these tests.
Figure 2.4 - Variations of Rutting with Number of Load Cycles
20
Table 2.6 - Load Carrying Capacity of Different Bases on Sandy Subgrade
Moisture Condition
Deformation, mils
Load, lbs
CalicheLimestone
Sandstone Springdale Uncrushed
Gravel Grade 1 Grade 2
Optimum 50 1475 1060 863 741 1057 2265 100 2475 2058 1612 1503 2050 4292 150 3000 2995 2247 2286 2980 6079
Subgrade Saturated
50 746 958 578 842 685 833 100 1447 1961 1105 1729 1604 1545 150 2103 3008 1579 2660 2756 2137
Base Saturated
50 428 423 507 491 582 293 100 910 878 978 1021 1287 554 150 1448 1365 1413 1590 2113 783
Table 2.7 - Load Carrying Capacity of Different Bases on Clayey Subgrade
Moisture Condition
Deformation, mils
Load, lbs
CalicheLimestone
Sandstone Springdale Uncrushed
Gravel Grade 1 Grade 2
Optimum 50 1178 1514 920 656 1152 892 100 2410 2873 1831 1277 1958 1803 150 3694 4079 2735 1863 3842 2734
Subgrade Saturated
50 469 974 634 251 546 828 100 810 1597 1098 427 974 1323 150 1023 1868 1393 530 1285 1484
Base Saturated
50 232 435 378 284 479 250 100 461 803 785 505 903 484 150 687 1106 1221 664 1272 701
Cost Benefit Walls et al. (1998) developed a process for evaluating the total economic worth of a usable pavement project segment by analyzing initial costs and discounted future cost, such as maintenance, user, reconstruction, rehabilitation, restoring, and resurfacing costs, over the life of the project segment. The cost of construction including the future maintenance and rehabilitation of pavement largely depends upon the type of material used beneath the road surface and the volume of traffic flow. This is especially true in the case of roads constructed with low-quality marginal base materials. The study conducted by Greening and Rolt (1997) revealed that the haulage costs for high quality base materials are the main factors for increasing the project cost. The study also revealed that the cost of a constructed natural gravel base (calcretes) was about 85% less as compared with hauled-in crushed stone. A study conducted by Woodbridge (1999) stated that the potential savings in costs are realized if locally available materials are used instead of crushed stone for base. To emphasize the use of locally available, low quality materials for realizing the cost
21
benefit, Arora et al. (1986) compared the cost analysis of treated road materials with the non-stabilized materials. They concluded that soil stabilization treatments are the best technique to realize potential benefits The materials used for base and subbase in western Qeensland, Australia which were deemed nonstandard and later performed satisfactorily in service were Winton sandstone, Silcrete, Kopi limestone, Ferricrete, Calcrete, Loams (clayey), Ridge gravels, loams (sandy), and White rock. The use of white rock on the Cunningham Highway was not thought to be possible, as grading specifications could not be met and the white rock degraded under compaction. The material breakdown, however, allowed the manufacture of a well-graded, strong, impermeable product that performed well in service. The use of the locally available aggregate instead of a river gravel blend was reported to have saved more than Aust$ 15,000/km on the basis of the savings in transport costs alone. As a result, specifications were written to allow better use of the material.

22
23
Chapter 3 Testing Procedures Introduction The suitability of using marginal materials in base construction is often assured by performing different laboratory tests which help in determining their physical and engineering properties, as well as compaction characteristics. This chapter gives a brief description of the laboratory tests that were performed to assess the quality of these materials. Index Properties Soil index tests are conducted to determine the reasons for the material being considered out-of-specifications/low-quality. The similar information about higher-quality hauled-in or processed material is also obtained for comparison. Sieve Analysis and Gradation The particle size analysis is conducted as per Tex 110-E to determine the composition of particles in a material sample. Atterberg Limits The liquid limit, plastic limit and plasticity index of soils are used with other soil properties to correlate with engineering behavior such as compressibility, permeability, compactibility, shrink-swell and shear strength. These tests are conducted as per Tex 104-E, Tex 105-E and Tex 106-E. Moisture Density Tex-113-E procedure is carried out to determine the relationship between water content and the dry mass (density) of base materials. At least four 6 in. (diameter) by 8 in. (height) specimens are
24
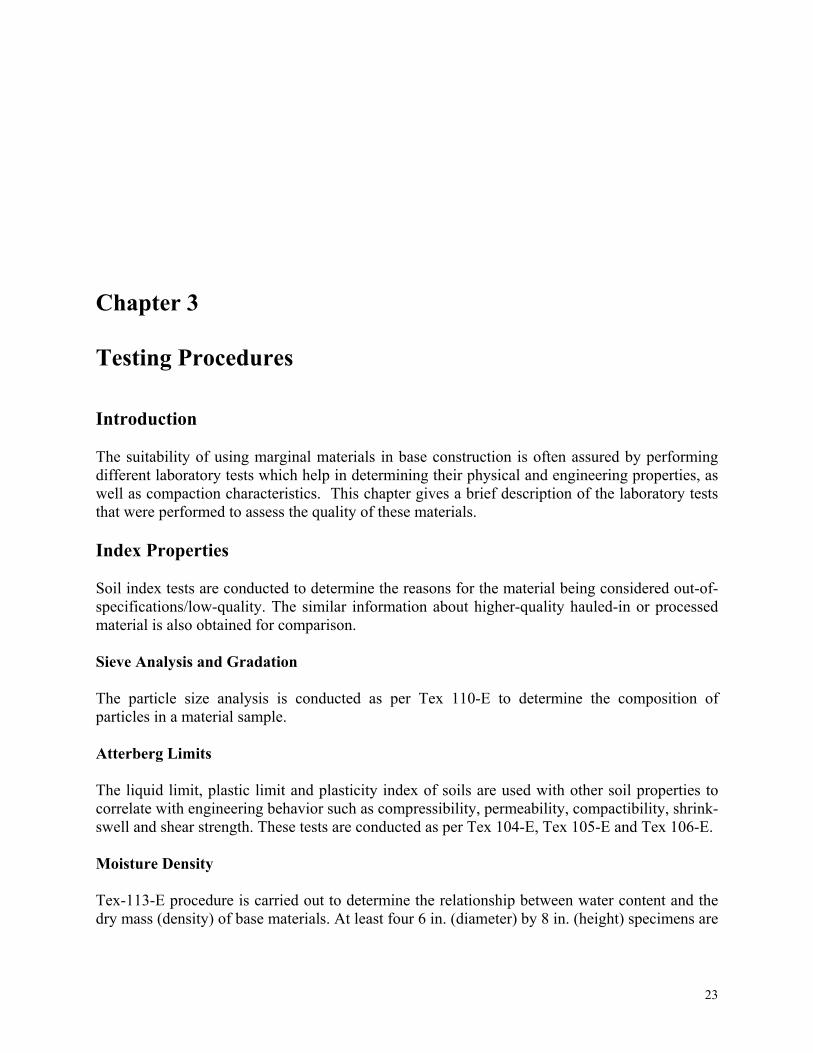
prepared to determine the optimum moisture content at which maximum dry unit weight can be achieved. To estimate the variation in modulus and strength with moisture, a specimen is first tested with the Free-Free Resonant Column device (FFRC, proposed Tex-149-E) for modulus and then subjected to Unconfined Compressive Strength (UCS) tests. Typical relationships between moisture content and dry density (unit weight), modulus and UCS are shown in Figure 3.1. These relationships are useful to estimate the impact of moisture on strength and stiffness.
Figure 3.1 - Relationships between Moisture Content, Dry Density, Modulus and Strength Aggregate Quality Assessment The aggregate toughness and the changes in gradation due to dynamic and static loads are measured in the laboratory under the British test procedures using Aggregate Impact Value
0
5
10
15
20
25
30
35
40
7 8 9 10 11 12 13 14 15
Moisture Content, %
Mod
ulu
s, k
si
110
115
120
125
130
135
140
Dry D
ensity, p
cf
Modulus Density
Moi
stur
e a
t Max
. M
odul
us
Opt
imum
Mos
itur
e
Max. ModulusMax. Dry Density
0
10
20
30
40
50
60
7 8 9 10 11 12 13 14 15
Moisture Content, %
Str
engt
h, p
si
110
115
120
125
130
135
140
Dry D
ensity, p
cf
Unconfined Compressive Strength Density
Max. Strength
Moi
stur
e a
t Max
. St
reng
th
Opt
imum
Mos
itur
e
Max. Dry Density
25
(AIV) and Aggregate Crushing Value (ACV). The AIV (See Figure 3.2a) of aggregates is performed as per BS 812-112 and the ACV (See Figure 3.2 b) is conducted as per BS 812-110.
a) AIV Test b) ACV Test
Figure 3.2 - Aggregate Impact Value and Aggregate Crushing Value Test Setups For AIV, a coarse aggregate sample contained within a mold is used to perform the test. The sample is subjected to successive blows from a falling hammer to simulate its resistance to rapid loading. The resulting sample is sieved with the AIV being the amount of fines passing the No. 8 sieve (2.36 mm); and, expressed as a percentage of the initial sample weight. The AIV is given by the following equation:
100%1M2M
AIV (3.1)
Where M1 is the mass of test specimen and M2 is the mass of the specimen passing No. 8 sieve. The ACV is a value which indicates the ability of an aggregate to resist crushing. The lower the figure is, the stronger the aggregate or the greater its ability to resist crushing will be. A sample of aggregates passing ½ in sieve and retained on 3/8 in. sieve is placed in a steel mold and a steel plunger is inserted into the mold on top of the aggregate. The aggregate is then subjected to a force rising to 90 kip (400 kN) over a period of 10 minutes. This test is typically performed by placing in a concrete crushing apparatus. The fine material, which is produced and passes the No. 8 sieve (2.36 mm) sieve, is represented as a percentage of the original mass. This percentage is the aggregate crushing value (ACV). The ACV is also calculated by using Equation (3.1). Triaxial Compression Test A conventional triaxial test using more than three specimens is normally used to determine the shear strength parameters of soil. The test comprises shearing a single specimen to failures at several elevated lateral pressures, while measuring the corresponding deviator stresses at which

26
the failures occur. Two types of compression tests are advocated to determine the strength parameters: Texas Triaxial Test (Tex-117-E) and Standard Triaxial Test (Tex-143-E). Tex-117-E is a well-known procedure in Texas, in which the specimens are subjected to capillary wetting prior to being tested. Procedure Tex-143-E is a revised Tex-117-E adopted by TxDOT. The major difference of Tex-143-E from Tex-117-E is that the specimens are cured only for 24 hours at room temperature without subjecting capillary conditioning. Repeated Load Triaxial Test Besides traffic load and environmental conditions, pavement performance is related to the resilient modulus and permanent deformation of each layer in a pavement. One of laboratory methods advocated for determining these two parameters is the repeated load triaxial test as per AASHTO T-307. The procedure and setup for this test are shown in Figures 3.3 and 3.4. The testing system consists of a loading frame with a crosshead mounted hydraulic actuator. A load cell is attached to the actuator to measure the applied load. The specimen is housed in a triaxial cell where confining pressure is applied. As the actuator applies the repeated load, specimen deformation is measured by a set of Linear Variable Differential Transducers (LVDT’s). A data acquisitions system records all data during testing. Resilient Modulus ` The resilient modulus determined from the repeated load triaxial test is defined as the ratio of the repeated axial deviator stress to the recoverable or resilient axial strain:
M r =d r (3.2)
Where Mr is the resilient modulus, σd is the deviator stress, and εr is the resilient (recoverable) strain in the vertical direction (see Figure 3.5). The load cycle duration, when using a hydraulic loading device, is 1 second that includes 0.1 second load duration and a 0.9 second rest period. The test is started by applying 1000 repetitions of a load equivalent to a maximum axial stress of 15 psi at a confining pressure of 15 psi. This is followed by a sequence of loadings with varying confining pressures and deviator stresses. A combination of confining pressures of 3, 5, 10, 15 and 20 psi and deviatoric stresses of 1, 2, 3, 5, 6, 9, 10, 15, 20, 30, and 40 psi are used. To utilize the results in design, a model can be described in the form of:
E = k 1 ck2 d
k3 (3.3)
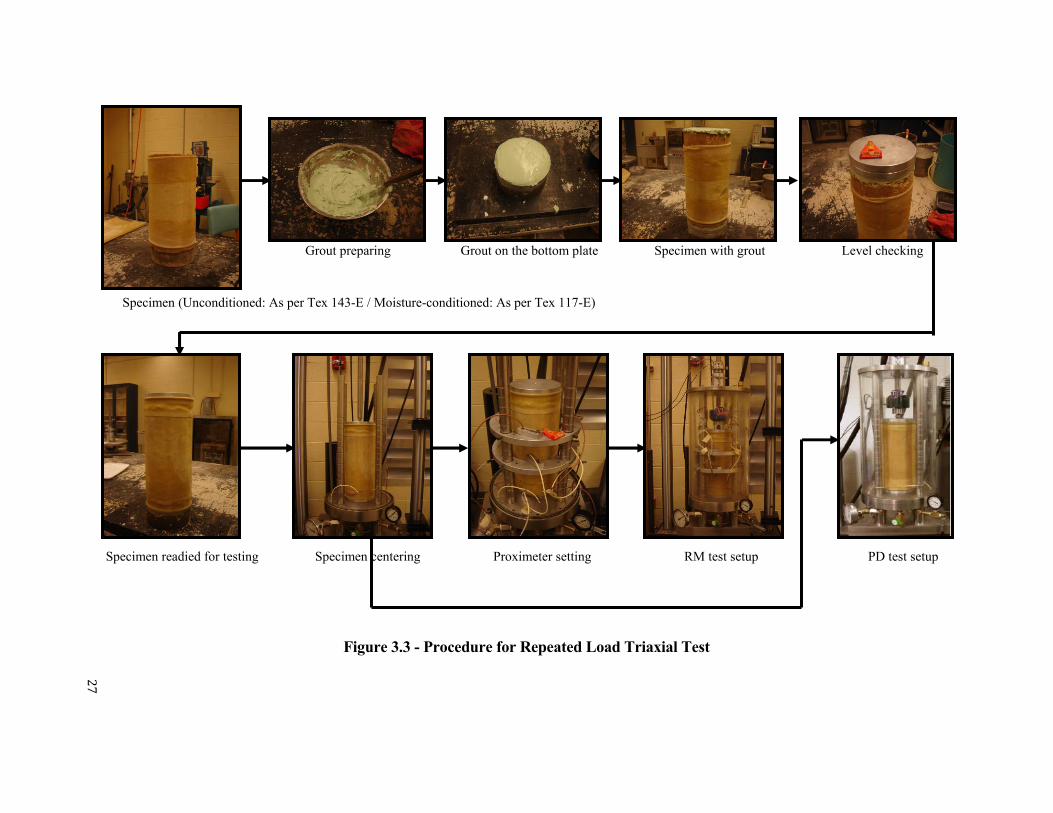
27
Grout preparing Grout on the bottom plate Specimen with grout Level checking Specimen (Unconditioned: As per Tex 143-E / Moisture-conditioned: As per Tex 117-E) Specimen readied for testing Specimen centering Proximeter setting RM test setup PD test setup
Figure 3.3 - Procedure for Repeated Load Triaxial Test
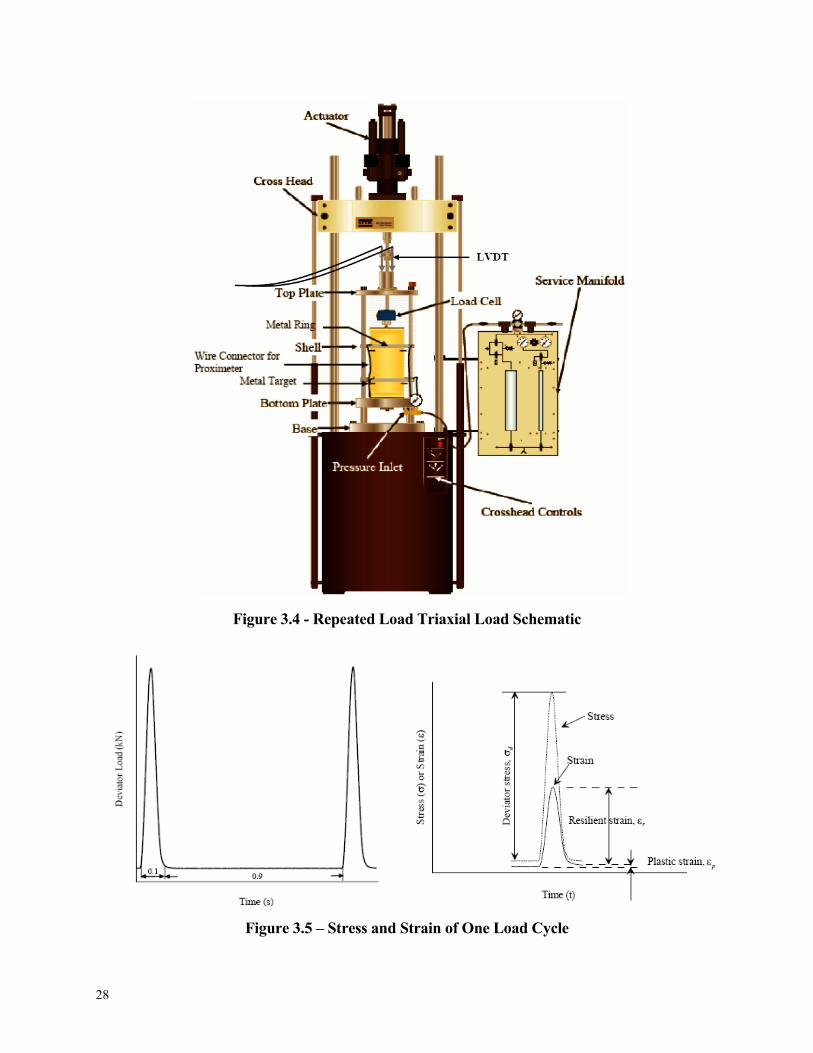
28
Figure 3.4 - Repeated Load Triaxial Load Schematic
Figure 3.5 – Stress and Strain of One Load Cycle
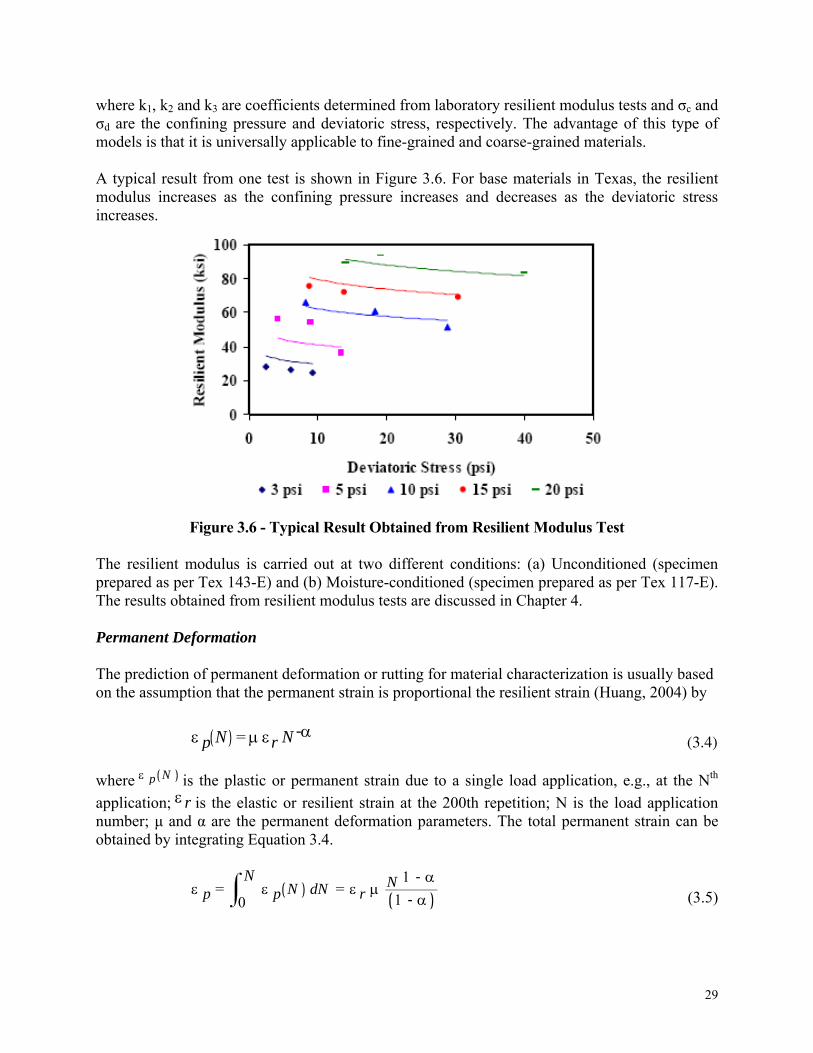
29
where k1, k2 and k3 are coefficients determined from laboratory resilient modulus tests and σc and σd are the confining pressure and deviatoric stress, respectively. The advantage of this type of models is that it is universally applicable to fine-grained and coarse-grained materials. A typical result from one test is shown in Figure 3.6. For base materials in Texas, the resilient modulus increases as the confining pressure increases and decreases as the deviatoric stress increases.
Figure 3.6 - Typical Result Obtained from Resilient Modulus Test
The resilient modulus is carried out at two different conditions: (a) Unconditioned (specimen prepared as per Tex 143-E) and (b) Moisture-conditioned (specimen prepared as per Tex 117-E). The results obtained from resilient modulus tests are discussed in Chapter 4. Permanent Deformation The prediction of permanent deformation or rutting for material characterization is usually based on the assumption that the permanent strain is proportional the resilient strain (Huang, 2004) by
p N = r N - (3.4)
where p N is the plastic or permanent strain due to a single load application, e.g., at the Nth
application; r is the elastic or resilient strain at the 200th repetition; N is the load application number; μ and α are the permanent deformation parameters. The total permanent strain can be obtained by integrating Equation 3.4.
p = p N dN
0
N= r
N 1 - 1 - (3.5)
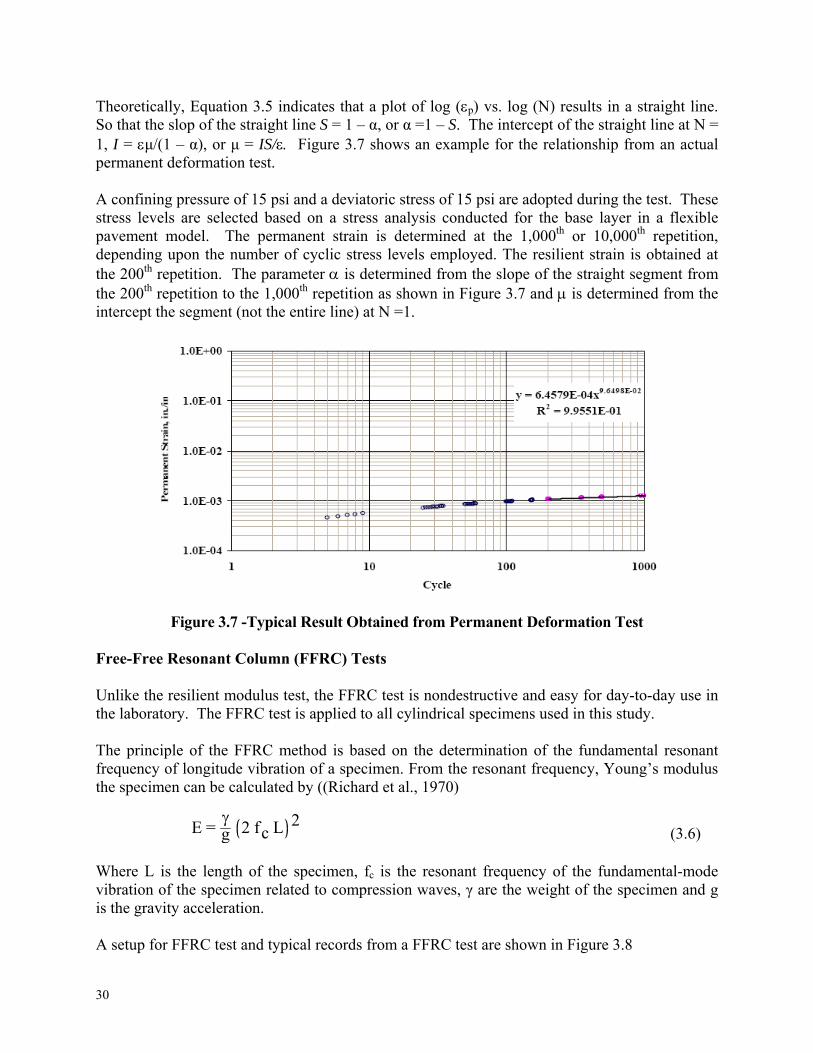
30
Theoretically, Equation 3.5 indicates that a plot of log (p) vs. log (N) results in a straight line. So that the slop of the straight line S = 1 – α, or α =1 – S. The intercept of the straight line at N = 1, I = μ/(1 – α), or μ = IS/ Figure 3.7 shows an example for the relationship from an actual permanent deformation test. A confining pressure of 15 psi and a deviatoric stress of 15 psi are adopted during the test. These stress levels are selected based on a stress analysis conducted for the base layer in a flexible pavement model. The permanent strain is determined at the 1,000th or 10,000th repetition, depending upon the number of cyclic stress levels employed. The resilient strain is obtained at the 200th repetition. The parameter is determined from the slope of the straight segment from the 200th repetition to the 1,000th repetition as shown in Figure 3.7 and is determined from the intercept the segment (not the entire line) at N =1.
Figure 3.7 -Typical Result Obtained from Permanent Deformation Test
Free-Free Resonant Column (FFRC) Tests Unlike the resilient modulus test, the FFRC test is nondestructive and easy for day-to-day use in the laboratory. The FFRC test is applied to all cylindrical specimens used in this study. The principle of the FFRC method is based on the determination of the fundamental resonant frequency of longitude vibration of a specimen. From the resonant frequency, Young’s modulus the specimen can be calculated by ((Richard et al., 1970)
E =g 2 fc L 2
(3.6) Where L is the length of the specimen, fc is the resonant frequency of the fundamental-mode vibration of the specimen related to compression waves, γ are the weight of the specimen and g is the gravity acceleration. A setup for FFRC test and typical records from a FFRC test are shown in Figure 3.8
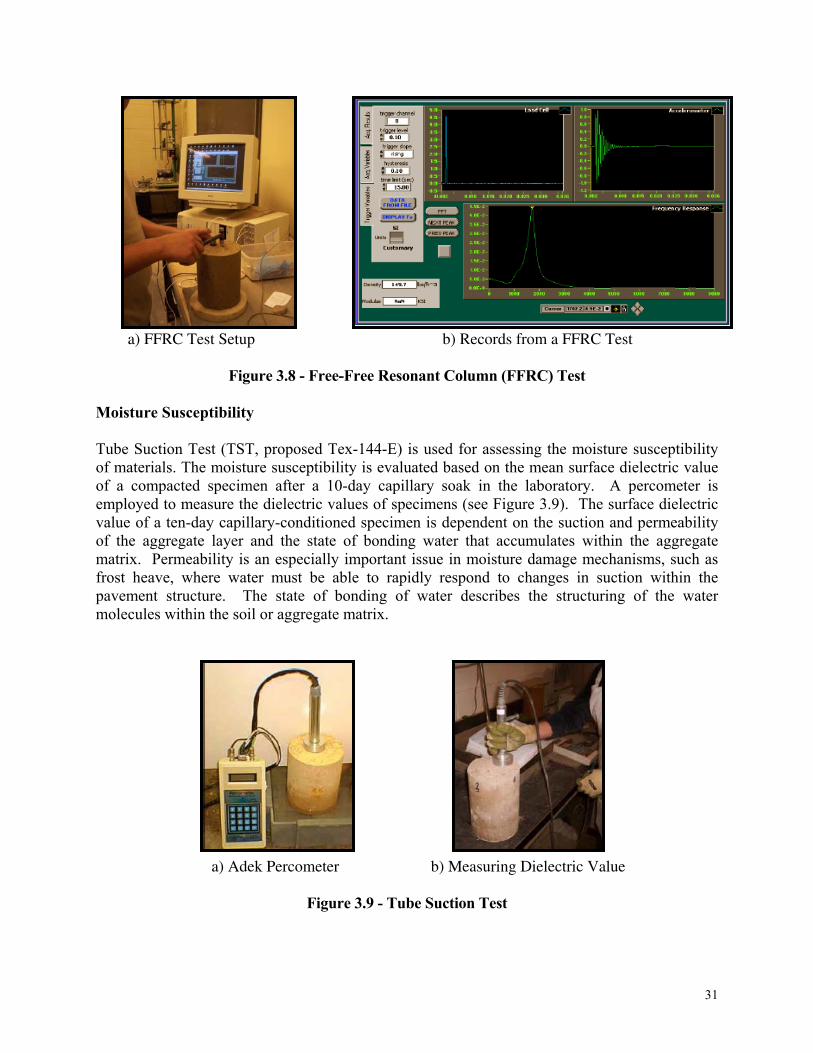
31
a) FFRC Test Setup b) Records from a FFRC Test
Figure 3.8 - Free-Free Resonant Column (FFRC) Test Moisture Susceptibility Tube Suction Test (TST, proposed Tex-144-E) is used for assessing the moisture susceptibility of materials. The moisture susceptibility is evaluated based on the mean surface dielectric value of a compacted specimen after a 10-day capillary soak in the laboratory. A percometer is employed to measure the dielectric values of specimens (see Figure 3.9). The surface dielectric value of a ten-day capillary-conditioned specimen is dependent on the suction and permeability of the aggregate layer and the state of bonding water that accumulates within the aggregate matrix. Permeability is an especially important issue in moisture damage mechanisms, such as frost heave, where water must be able to rapidly respond to changes in suction within the pavement structure. The state of bonding of water describes the structuring of the water molecules within the soil or aggregate matrix.
a) Adek Percometer b) Measuring Dielectric Value
Figure 3.9 - Tube Suction Test
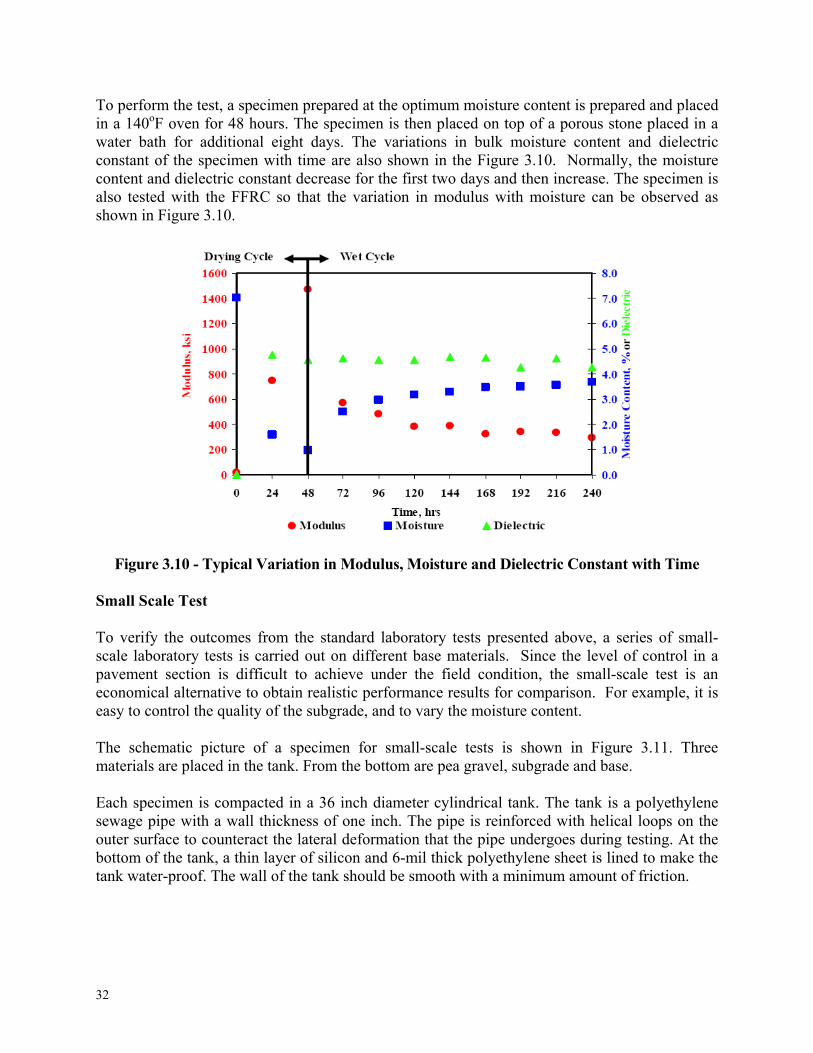
32
To perform the test, a specimen prepared at the optimum moisture content is prepared and placed in a 140oF oven for 48 hours. The specimen is then placed on top of a porous stone placed in a water bath for additional eight days. The variations in bulk moisture content and dielectric constant of the specimen with time are also shown in the Figure 3.10. Normally, the moisture content and dielectric constant decrease for the first two days and then increase. The specimen is also tested with the FFRC so that the variation in modulus with moisture can be observed as shown in Figure 3.10.
Figure 3.10 - Typical Variation in Modulus, Moisture and Dielectric Constant with Time
Small Scale Test To verify the outcomes from the standard laboratory tests presented above, a series of small-scale laboratory tests is carried out on different base materials. Since the level of control in a pavement section is difficult to achieve under the field condition, the small-scale test is an economical alternative to obtain realistic performance results for comparison. For example, it is easy to control the quality of the subgrade, and to vary the moisture content. The schematic picture of a specimen for small-scale tests is shown in Figure 3.11. Three materials are placed in the tank. From the bottom are pea gravel, subgrade and base. Each specimen is compacted in a 36 inch diameter cylindrical tank. The tank is a polyethylene sewage pipe with a wall thickness of one inch. The pipe is reinforced with helical loops on the outer surface to counteract the lateral deformation that the pipe undergoes during testing. At the bottom of the tank, a thin layer of silicon and 6-mil thick polyethylene sheet is lined to make the tank water-proof. The wall of the tank should be smooth with a minimum amount of friction.
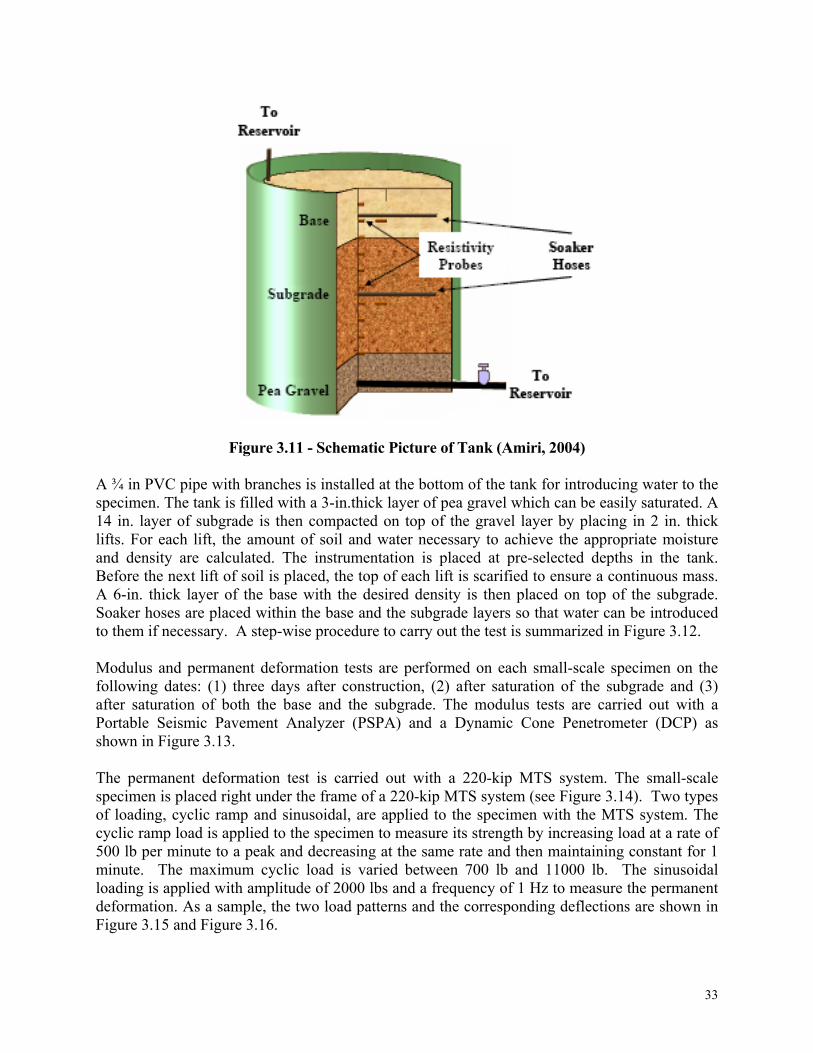
33
Figure 3.11 - Schematic Picture of Tank (Amiri, 2004)
A ¾ in PVC pipe with branches is installed at the bottom of the tank for introducing water to the specimen. The tank is filled with a 3-in.thick layer of pea gravel which can be easily saturated. A 14 in. layer of subgrade is then compacted on top of the gravel layer by placing in 2 in. thick lifts. For each lift, the amount of soil and water necessary to achieve the appropriate moisture and density are calculated. The instrumentation is placed at pre-selected depths in the tank. Before the next lift of soil is placed, the top of each lift is scarified to ensure a continuous mass. A 6-in. thick layer of the base with the desired density is then placed on top of the subgrade. Soaker hoses are placed within the base and the subgrade layers so that water can be introduced to them if necessary. A step-wise procedure to carry out the test is summarized in Figure 3.12. Modulus and permanent deformation tests are performed on each small-scale specimen on the following dates: (1) three days after construction, (2) after saturation of the subgrade and (3) after saturation of both the base and the subgrade. The modulus tests are carried out with a Portable Seismic Pavement Analyzer (PSPA) and a Dynamic Cone Penetrometer (DCP) as shown in Figure 3.13. The permanent deformation test is carried out with a 220-kip MTS system. The small-scale specimen is placed right under the frame of a 220-kip MTS system (see Figure 3.14). Two types of loading, cyclic ramp and sinusoidal, are applied to the specimen with the MTS system. The cyclic ramp load is applied to the specimen to measure its strength by increasing load at a rate of 500 lb per minute to a peak and decreasing at the same rate and then maintaining constant for 1 minute. The maximum cyclic load is varied between 700 lb and 11000 lb. The sinusoidal loading is applied with amplitude of 2000 lbs and a frequency of 1 Hz to measure the permanent deformation. As a sample, the two load patterns and the corresponding deflections are shown in Figure 3.15 and Figure 3.16.
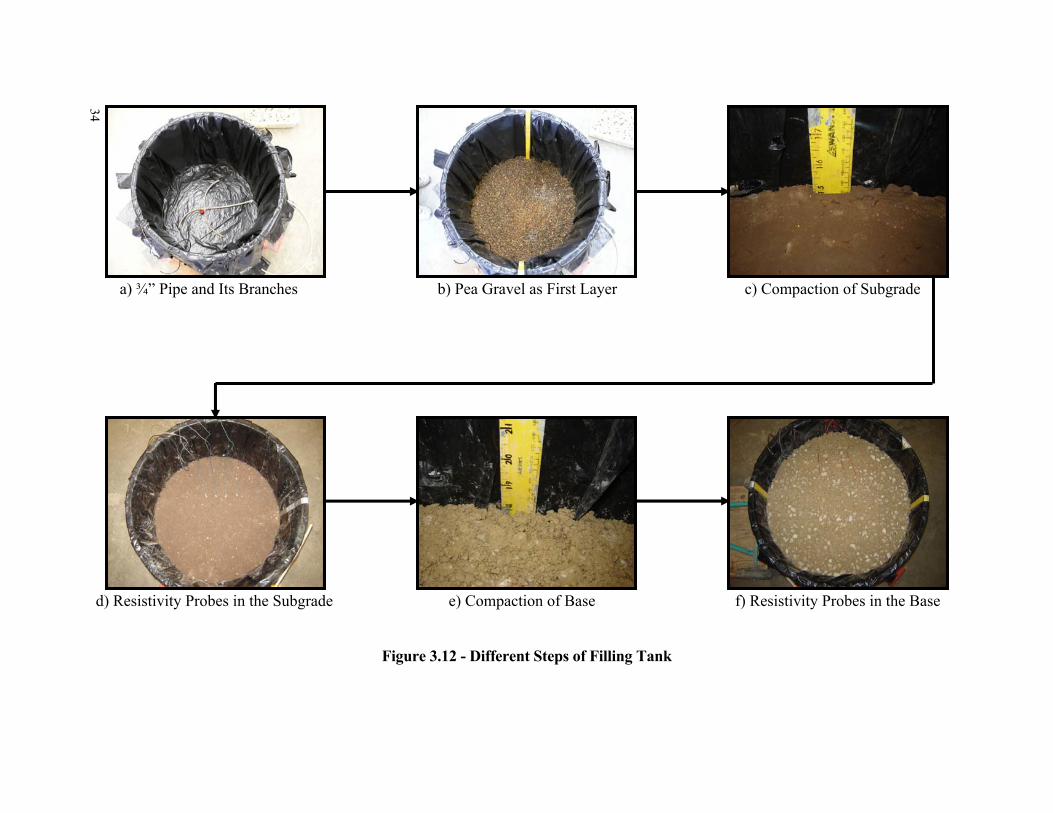
34
a) ¾” Pipe and Its Branches b) Pea Gravel as First Layer c) Compaction of Subgrade d) Resistivity Probes in the Subgrade e) Compaction of Base f) Resistivity Probes in the Base
Figure 3.12 - Different Steps of Filling Tank
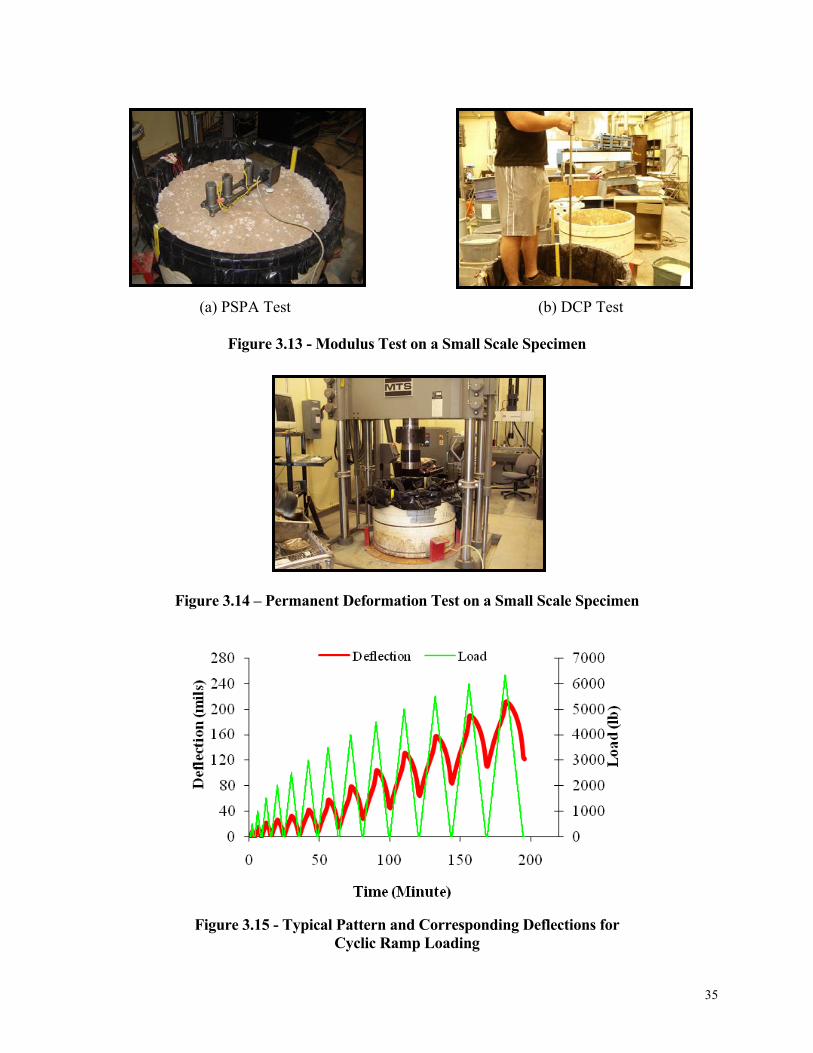
35
(a) PSPA Test (b) DCP Test
Figure 3.13 - Modulus Test on a Small Scale Specimen
Figure 3.14 – Permanent Deformation Test on a Small Scale Specimen
Figure 3.15 - Typical Pattern and Corresponding Deflections for
Cyclic Ramp Loading
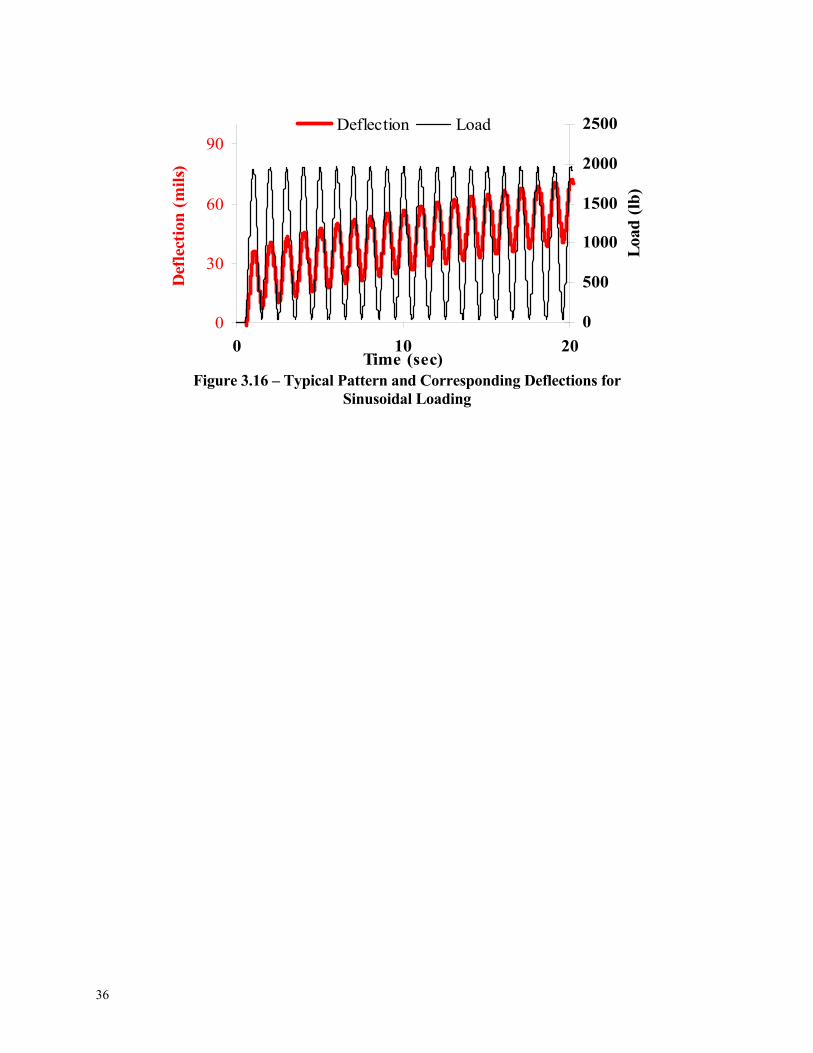
36
0
30
60
90
0 10 20Time (sec)
Def
lect
ion
(m
ils)
0
500
1000
1500
2000
2500
Loa
d (
lb)
Deflection Load
Figure 3.16 – Typical Pattern and Corresponding Deflections for Sinusoidal Loading
37
Chapter 4 Results from Laboratory and Field Tests Introduction The laboratory test program as discussed in Chapter 3 was conducted on representative materials collected from different districts. Materials were subjected to various tests to determine their index properties, compaction characteristics, strength, resilient modulus and permanent deformation. Results from these tests are presented in this chapter. In addition, results from field monitoring tests are also included to validate the results from the laboratory tests. Material Selection A survey was conducted to understand the extent of the use of local base materials and to identify the districts that could benefit from the outcome of this study. Responses were received from 19 districts. Beaumont, Lufkin and Houston do not use their local materials at all, since suitable base materials do not exist in these districts. Sixteen districts have used local materials for roadway base/subbase construction. Out of the 16 districts, 14 districts have used local materials both for low volume roads and for major roads. In seven districts, Abilene, Brownwood, Dallas, Lubbock, Odessa, San Angelo and San Antonio, all roadways are constructed with local base materials. Based on the interaction with the districts and the PMC of the project, nine materials from four districts were selected and used to develop guidelines for using local materials for roadway base construction. These districts are concentrated in the central and north Texas. In addition, El Paso limestone, as our local material, was also tested to help in developing appropriate test protocol and procedures. The sources and rock types of these materials are summarized in Table 4.1.
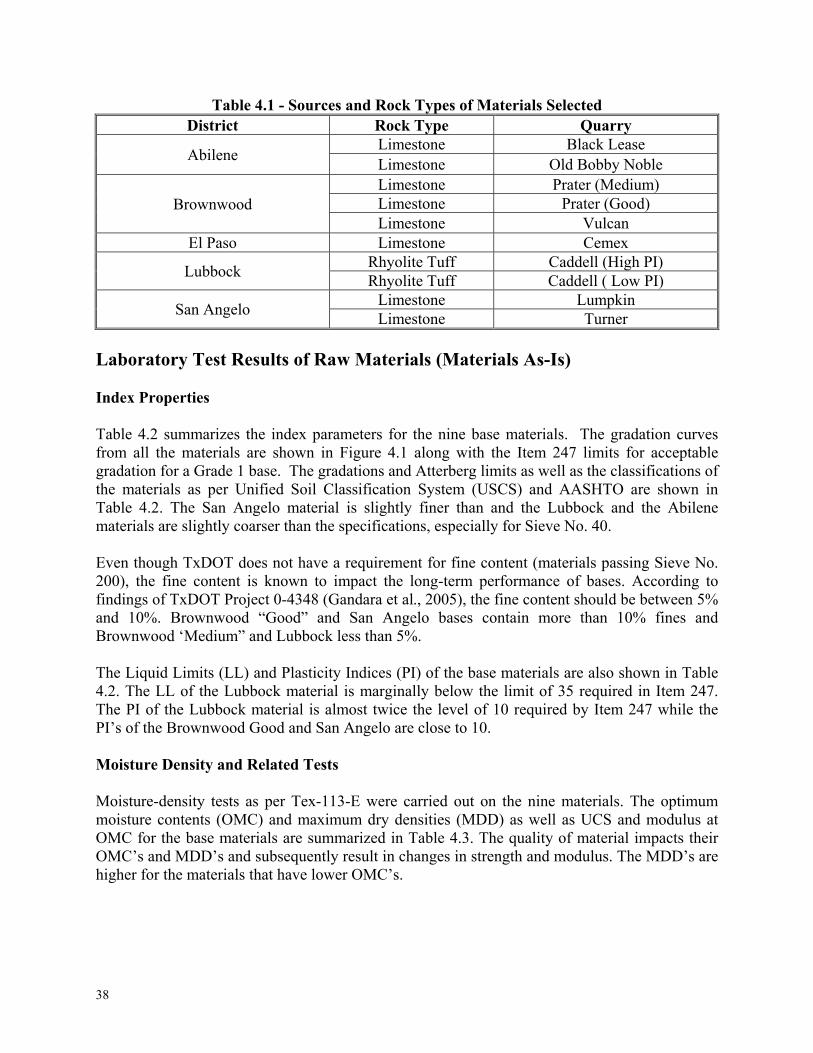
38
Table 4.1 - Sources and Rock Types of Materials Selected District Rock Type Quarry
Abilene Limestone Black Lease Limestone Old Bobby Noble
Brownwood Limestone Prater (Medium) Limestone Prater (Good) Limestone Vulcan
El Paso Limestone Cemex
Lubbock Rhyolite Tuff Caddell (High PI) Rhyolite Tuff Caddell ( Low PI)
San Angelo Limestone Lumpkin Limestone Turner
Laboratory Test Results of Raw Materials (Materials As-Is) Index Properties Table 4.2 summarizes the index parameters for the nine base materials. The gradation curves from all the materials are shown in Figure 4.1 along with the Item 247 limits for acceptable gradation for a Grade 1 base. The gradations and Atterberg limits as well as the classifications of the materials as per Unified Soil Classification System (USCS) and AASHTO are shown in Table 4.2. The San Angelo material is slightly finer than and the Lubbock and the Abilene materials are slightly coarser than the specifications, especially for Sieve No. 40. Even though TxDOT does not have a requirement for fine content (materials passing Sieve No. 200), the fine content is known to impact the long-term performance of bases. According to findings of TxDOT Project 0-4348 (Gandara et al., 2005), the fine content should be between 5% and 10%. Brownwood “Good” and San Angelo bases contain more than 10% fines and Brownwood ‘Medium” and Lubbock less than 5%. The Liquid Limits (LL) and Plasticity Indices (PI) of the base materials are also shown in Table 4.2. The LL of the Lubbock material is marginally below the limit of 35 required in Item 247. The PI of the Lubbock material is almost twice the level of 10 required by Item 247 while the PI’s of the Brownwood Good and San Angelo are close to 10. Moisture Density and Related Tests Moisture-density tests as per Tex-113-E were carried out on the nine materials. The optimum moisture contents (OMC) and maximum dry densities (MDD) as well as UCS and modulus at OMC for the base materials are summarized in Table 4.3. The quality of material impacts their OMC’s and MDD’s and subsequently result in changes in strength and modulus. The MDD’s are higher for the materials that have lower OMC’s.
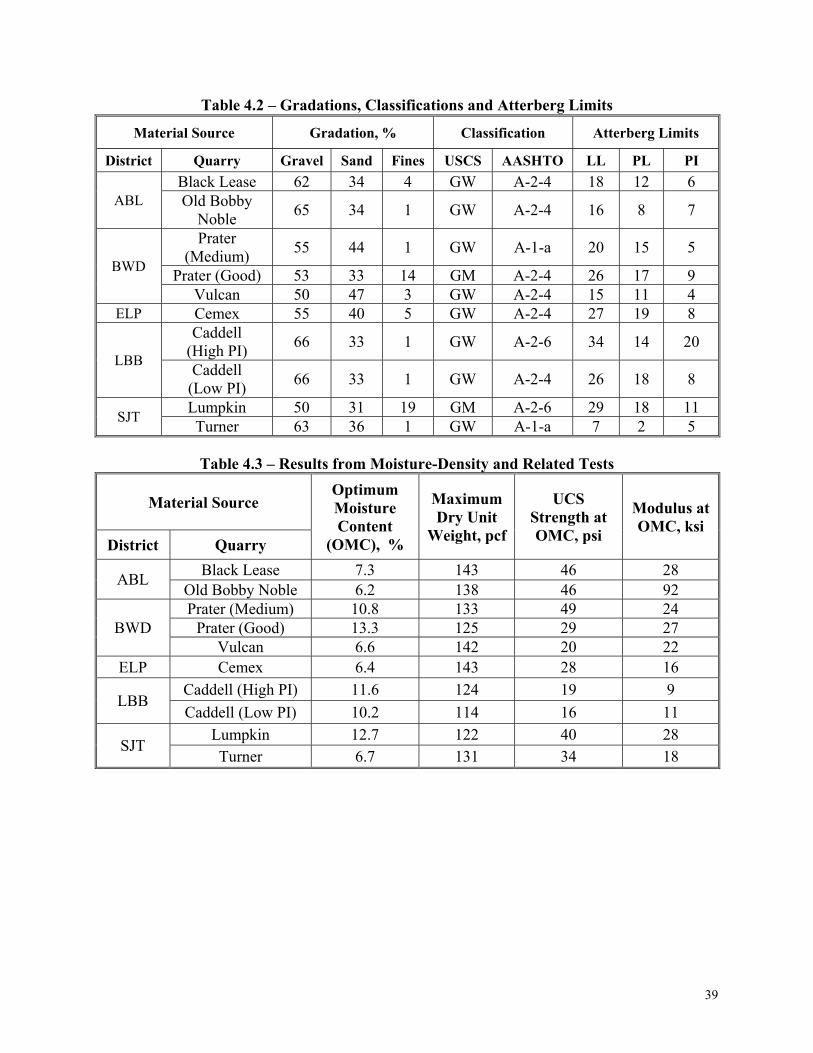
39
Table 4.2 – Gradations, Classifications and Atterberg Limits
Table 4.3 – Results from Moisture-Density and Related Tests
Material Source
Optimum Moisture Content
(OMC), %
Maximum Dry Unit
Weight, pcf
UCS Strength at OMC, psi
Modulus at OMC, ksi
District Quarry
ABL Black Lease 7.3 143 46 28
Old Bobby Noble 6.2 138 46 92
BWD Prater (Medium) 10.8 133 49 24
Prater (Good) 13.3 125 29 27 Vulcan 6.6 142 20 22
ELP Cemex 6.4 143 28 16
LBB Caddell (High PI) 11.6 124 19 9
Caddell (Low PI) 10.2 114 16 11
SJT Lumpkin 12.7 122 40 28 Turner 6.7 131 34 18
Material Source Gradation, % Classification Atterberg Limits
District Quarry Gravel Sand Fines USCS AASHTO LL PL PI
ABL Black Lease 62 34 4 GW A-2-4 18 12 6 Old Bobby
Noble 65 34 1 GW A-2-4 16 8 7
BWD
Prater (Medium)
55 44 1 GW A-1-a 20 15 5
Prater (Good) 53 33 14 GM A-2-4 26 17 9 Vulcan 50 47 3 GW A-2-4 15 11 4
ELP Cemex 55 40 5 GW A-2-4 27 19 8
LBB
Caddell (High PI)
66 33 1 GW A-2-6 34 14 20
Caddell (Low PI)
66 33 1 GW A-2-4 26 18 8
SJT Lumpkin 50 31 19 GM A-2-6 29 18 11 Turner 63 36 1 GW A-1-a 7 2 5
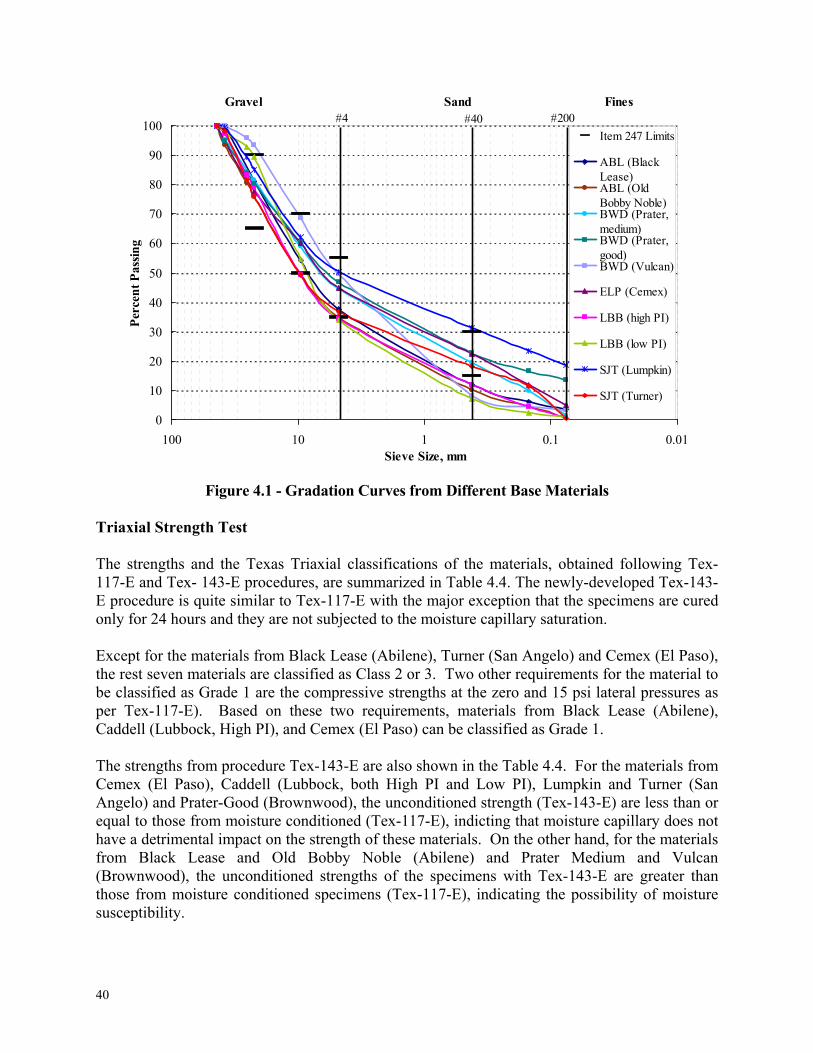
40
Figure 4.1 - Gradation Curves from Different Base Materials Triaxial Strength Test The strengths and the Texas Triaxial classifications of the materials, obtained following Tex-117-E and Tex- 143-E procedures, are summarized in Table 4.4. The newly-developed Tex-143-E procedure is quite similar to Tex-117-E with the major exception that the specimens are cured only for 24 hours and they are not subjected to the moisture capillary saturation. Except for the materials from Black Lease (Abilene), Turner (San Angelo) and Cemex (El Paso), the rest seven materials are classified as Class 2 or 3. Two other requirements for the material to be classified as Grade 1 are the compressive strengths at the zero and 15 psi lateral pressures as per Tex-117-E). Based on these two requirements, materials from Black Lease (Abilene), Caddell (Lubbock, High PI), and Cemex (El Paso) can be classified as Grade 1. The strengths from procedure Tex-143-E are also shown in the Table 4.4. For the materials from Cemex (El Paso), Caddell (Lubbock, both High PI and Low PI), Lumpkin and Turner (San Angelo) and Prater-Good (Brownwood), the unconditioned strength (Tex-143-E) are less than or equal to those from moisture conditioned (Tex-117-E), indicting that moisture capillary does not have a detrimental impact on the strength of these materials. On the other hand, for the materials from Black Lease and Old Bobby Noble (Abilene) and Prater Medium and Vulcan (Brownwood), the unconditioned strengths of the specimens with Tex-143-E are greater than those from moisture conditioned specimens (Tex-117-E), indicating the possibility of moisture susceptibility.
0
10
20
30
40
50
60
70
80
90
100
0.010.1110100Sieve Size, mm
Per
cen
t P
assi
ng
Item 247 Limits
ABL (BlackLease)ABL (OldBobby Noble)BWD (Prater,medium)BWD (Prater,good)BWD (Vulcan)
ELP (Cemex)
LBB (high PI)
LBB (low PI)
SJT (Lumpkin)
SJT (Turner)
#4 #40 #200FinesGravel Sand
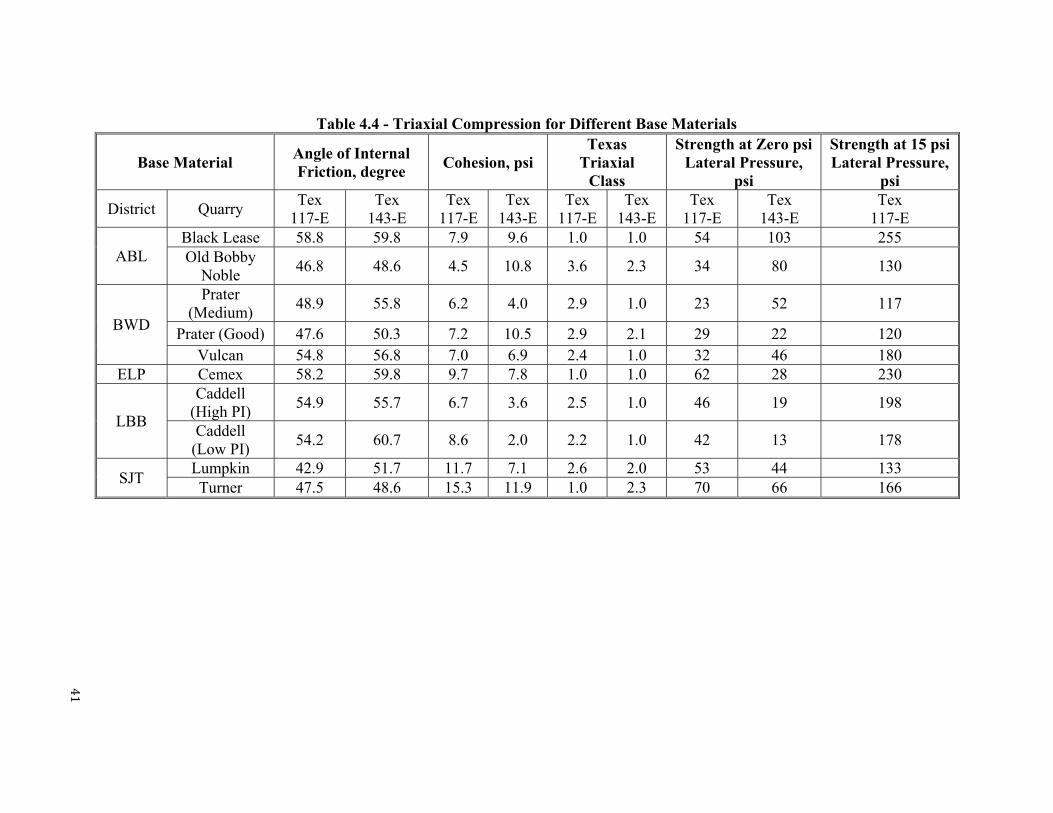
41
Table 4.4 - Triaxial Compression for Different Base Materials
Base Material Angle of Internal Friction, degree
Cohesion, psi Texas
Triaxial Class
Strength at Zero psi Lateral Pressure,
psi
Strength at 15 psi Lateral Pressure,
psi
District Quarry Tex
117-E Tex
143-E Tex
117-E Tex
143-E Tex
117-E Tex
143-E Tex
117-E Tex
143-E Tex
117-E
ABL Black Lease 58.8 59.8 7.9 9.6 1.0 1.0 54 103 255 Old Bobby
Noble 46.8 48.6 4.5 10.8 3.6 2.3 34 80 130
BWD
Prater (Medium)
48.9 55.8 6.2 4.0 2.9 1.0 23 52 117
Prater (Good) 47.6 50.3 7.2 10.5 2.9 2.1 29 22 120 Vulcan 54.8 56.8 7.0 6.9 2.4 1.0 32 46 180
ELP Cemex 58.2 59.8 9.7 7.8 1.0 1.0 62 28 230
LBB
Caddell (High PI)
54.9 55.7 6.7 3.6 2.5 1.0 46 19 198
Caddell (Low PI)
54.2 60.7 8.6 2.0 2.2 1.0 42 13 178
SJT Lumpkin 42.9 51.7 11.7 7.1 2.6 2.0 53 44 133 Turner 47.5 48.6 15.3 11.9 1.0 2.3 70 66 166
42
The results of the tests relevant to Item 247 are summarized in Table 4.5. Based on this table, the El Paso material is classified as Grade 1. The Lubbock (High PI) base does not meet the plasticity, and Texas Triaxial Classification requirements. The Abilene (Black Lease) material does not meet the gradation, whereas the Abilene (Old Bobby Noble) material fails to meet gradation, classification and strength requirements. The three Brownwood mixes do not pass the gradation and strength requirements. The San Angelo (Lumpkin) material does not meet the plasticity and strength criteria, whereas the San Angelo (Turner) material fails to satisfy the gradation as well as the strength requirements. Material Considered Out-of-Specification Table 4.5 summarizes the results from the laboratory tests on the ten materials and compares them with the requirements provided by TxDOT Specification Item 247 for a Grade 1 base. Each number in the parentheses in the table represents that the material is out-of-specification for that particular requirement. Based on Table 4.5, it can be concluded:
El Paso material passes all requirements for a Grade 1 base. Abilene (Black Lease) material passes all requirements for a Grade 1 base except for
gradation which is just slightly out-of-limit for No. 40 sieve. Materials from Abilene (Old Bobby Noble), Lubbock (High PI and Low PI), Brownwood
(Medium, Good and Vulcan) and San Angelo (Lumpkin) are more or less out-of-specification.
Based on the amount of out-of-specification and in consideration of the difference in material sampling at the pit and the errors in specimen preparation and testing, we considered the material from Black Lease in Abilene District and the material from Turner in San Angelo District as Grade 1 materials. Remedial Measures To ensure that the materials classified as out-of-specification can be economically improved to meet the requirements for Grade 1, the following remedial measures were adopted:
Chemical treatment for Lubbock (High PI), Brownwood “Medium” and Brownwood (Vulcan) materials,
Gradation modification for San Angelo (Lumpkin) material, and Both chemical treatment and gradation modification for Abilene (Old Bobby Noble) and
Brownwood “Good” materials. Since, the properties of two different Lubbock base materials are close to each other; only one of the Lubbock materials was treated with calcium-based additive to observe its impact on strength and stiffness of materials. In addition, El Paso limestone, as our local material, was also treated with different additives to help in developing appropriate test protocol and procedures.
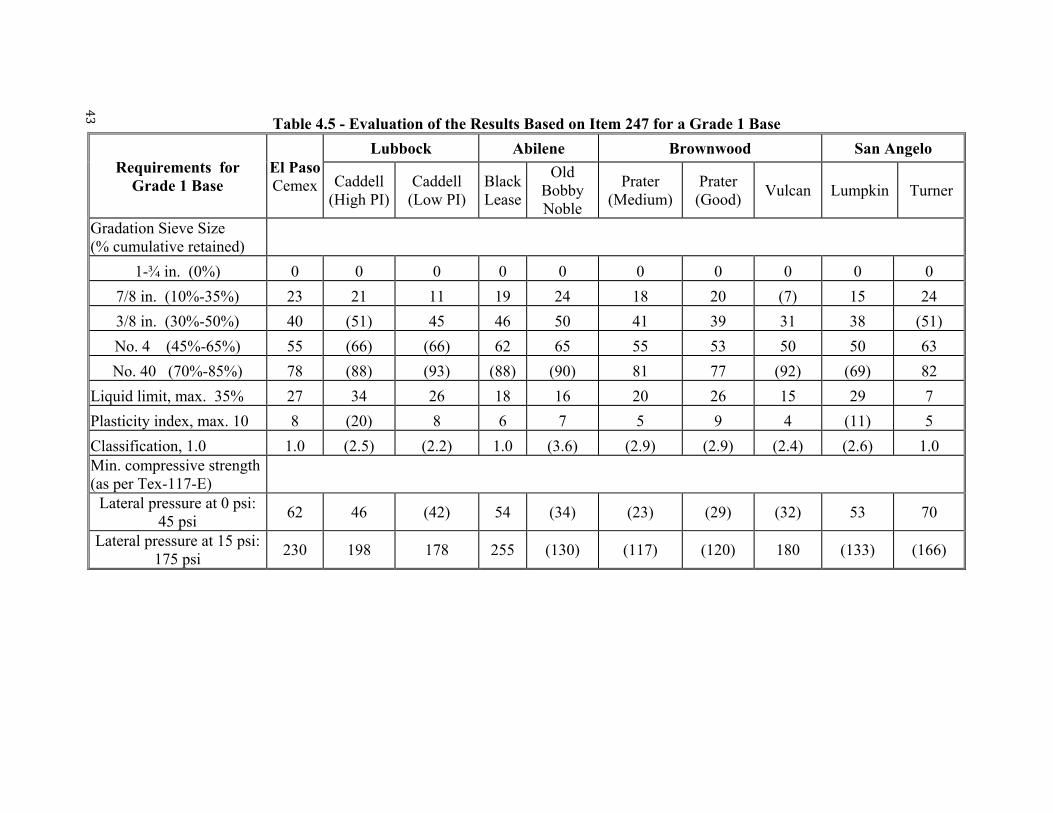
43
Table 4.5 - Evaluation of the Results Based on Item 247 for a Grade 1 Base
Requirements for Grade 1 Base
El Paso Cemex
Lubbock Abilene Brownwood San Angelo
Caddell (High PI)
Caddell (Low PI)
BlackLease
Old Bobby Noble
Prater (Medium)
Prater (Good)
Vulcan Lumpkin Turner
Gradation Sieve Size (% cumulative retained)
1-¾ in. (0%) 0 0 0 0 0 0 0 0 0 0
7/8 in. (10%-35%) 23 21 11 19 24 18 20 (7) 15 24
3/8 in. (30%-50%) 40 (51) 45 46 50 41 39 31 38 (51)
No. 4 (45%-65%) 55 (66) (66) 62 65 55 53 50 50 63
No. 40 (70%-85%) 78 (88) (93) (88) (90) 81 77 (92) (69) 82
Liquid limit, max. 35% 27 34 26 18 16 20 26 15 29 7
Plasticity index, max. 10 8 (20) 8 6 7 5 9 4 (11) 5
Classification, 1.0 1.0 (2.5) (2.2) 1.0 (3.6) (2.9) (2.9) (2.4) (2.6) 1.0 Min. compressive strength (as per Tex-117-E)
Lateral pressure at 0 psi: 45 psi
62 46 (42) 54 (34) (23) (29) (32) 53 70
Lateral pressure at 15 psi: 175 psi
230 198 178 255 (130) (117) (120) 180 (133) (166)
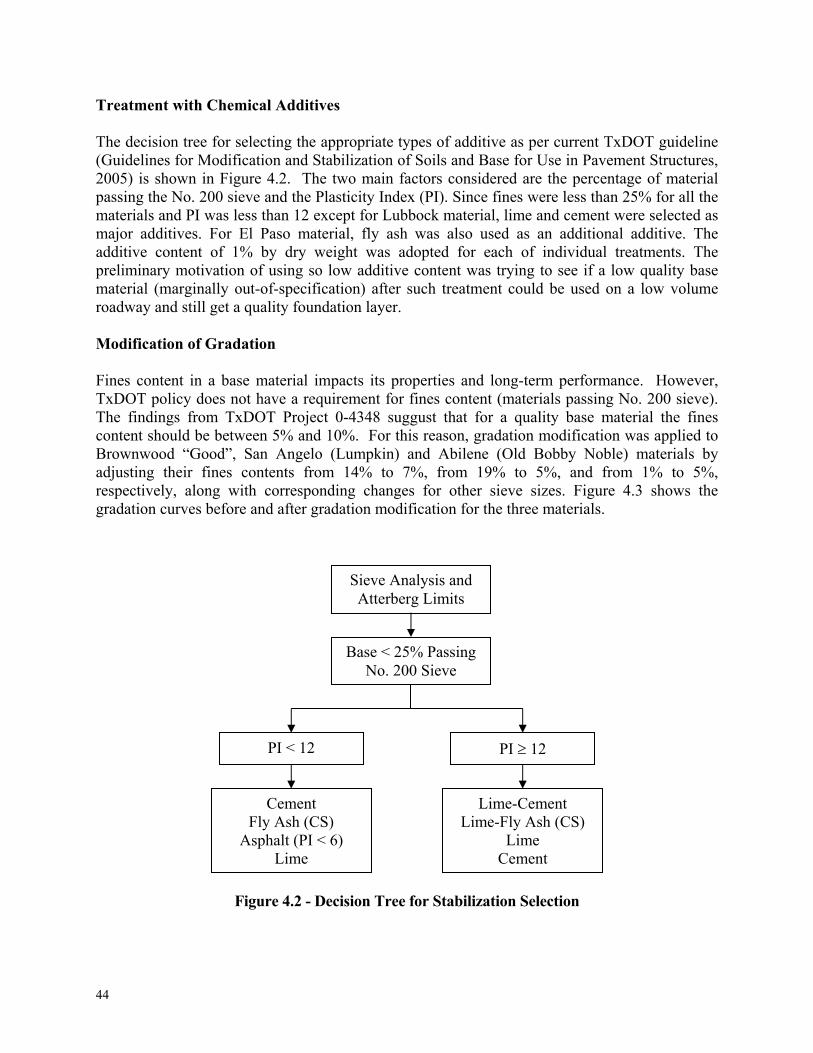
44
Treatment with Chemical Additives The decision tree for selecting the appropriate types of additive as per current TxDOT guideline (Guidelines for Modification and Stabilization of Soils and Base for Use in Pavement Structures, 2005) is shown in Figure 4.2. The two main factors considered are the percentage of material passing the No. 200 sieve and the Plasticity Index (PI). Since fines were less than 25% for all the materials and PI was less than 12 except for Lubbock material, lime and cement were selected as major additives. For El Paso material, fly ash was also used as an additional additive. The additive content of 1% by dry weight was adopted for each of individual treatments. The preliminary motivation of using so low additive content was trying to see if a low quality base material (marginally out-of-specification) after such treatment could be used on a low volume roadway and still get a quality foundation layer. Modification of Gradation Fines content in a base material impacts its properties and long-term performance. However, TxDOT policy does not have a requirement for fines content (materials passing No. 200 sieve). The findings from TxDOT Project 0-4348 suggust that for a quality base material the fines content should be between 5% and 10%. For this reason, gradation modification was applied to Brownwood “Good”, San Angelo (Lumpkin) and Abilene (Old Bobby Noble) materials by adjusting their fines contents from 14% to 7%, from 19% to 5%, and from 1% to 5%, respectively, along with corresponding changes for other sieve sizes. Figure 4.3 shows the gradation curves before and after gradation modification for the three materials.
Figure 4.2 - Decision Tree for Stabilization Selection
Sieve Analysis and Atterberg Limits
Base < 25% Passing No. 200 Sieve
PI < 12
Cement Fly Ash (CS)
Asphalt (PI < 6) Lime
Lime-Cement Lime-Fly Ash (CS)
Lime Cement
PI 12
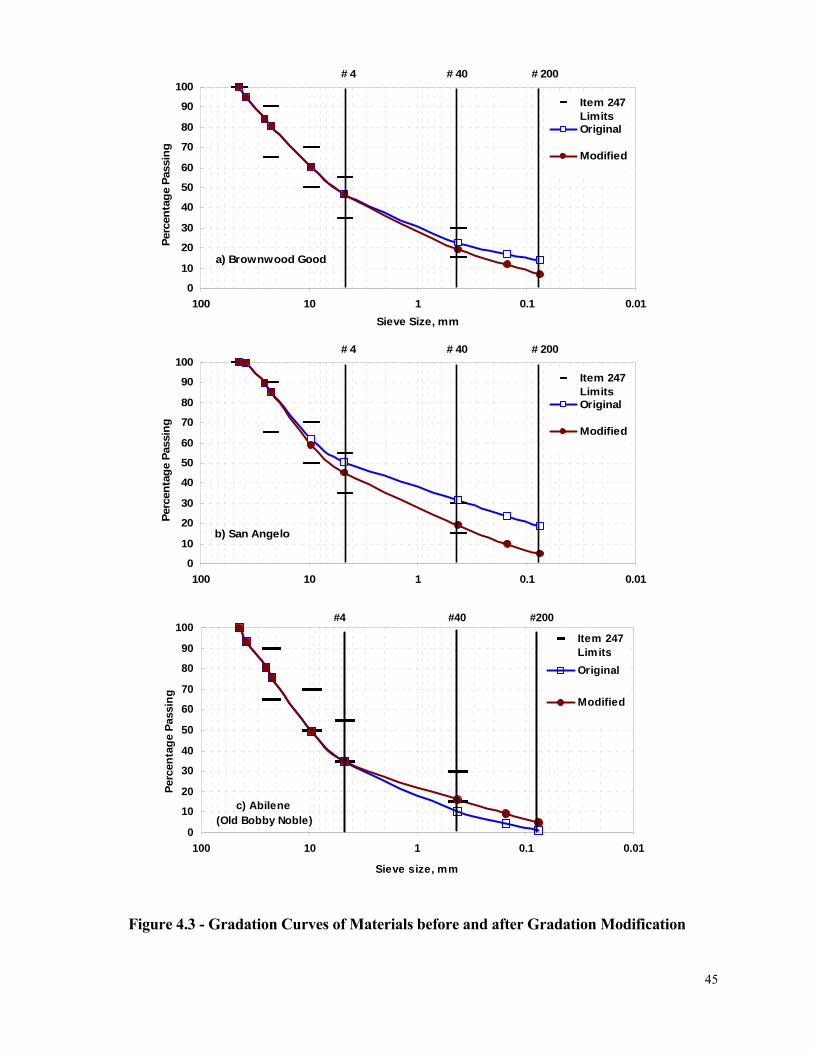
45
Figure 4.3 - Gradation Curves of Materials before and after Gradation Modification
0
10
20
30
40
50
60
70
80
90
100
0.010.1110100
Sieve Size, mm
Per
cen
tag
e P
assi
ng
Item 247LimitsOriginal
Modified
# 4 # 40 # 200
a) Brownwood Good
0
10
20
30
40
50
60
70
80
90
100
0.010.1110100
Sieve Size, mm
Per
cen
tag
e P
assi
ng
Item 247LimitsOriginal
Modified
# 4 # 40 # 200
b) San Angelo
0
10
20
30
40
50
60
70
80
90
100
0.010.1110100
Sieve size, mm
Per
cen
tag
e P
assi
ng
Item 247Limits
Original
Modified
#4 #40 #200
c) Abilene (Old Bobby Noble)
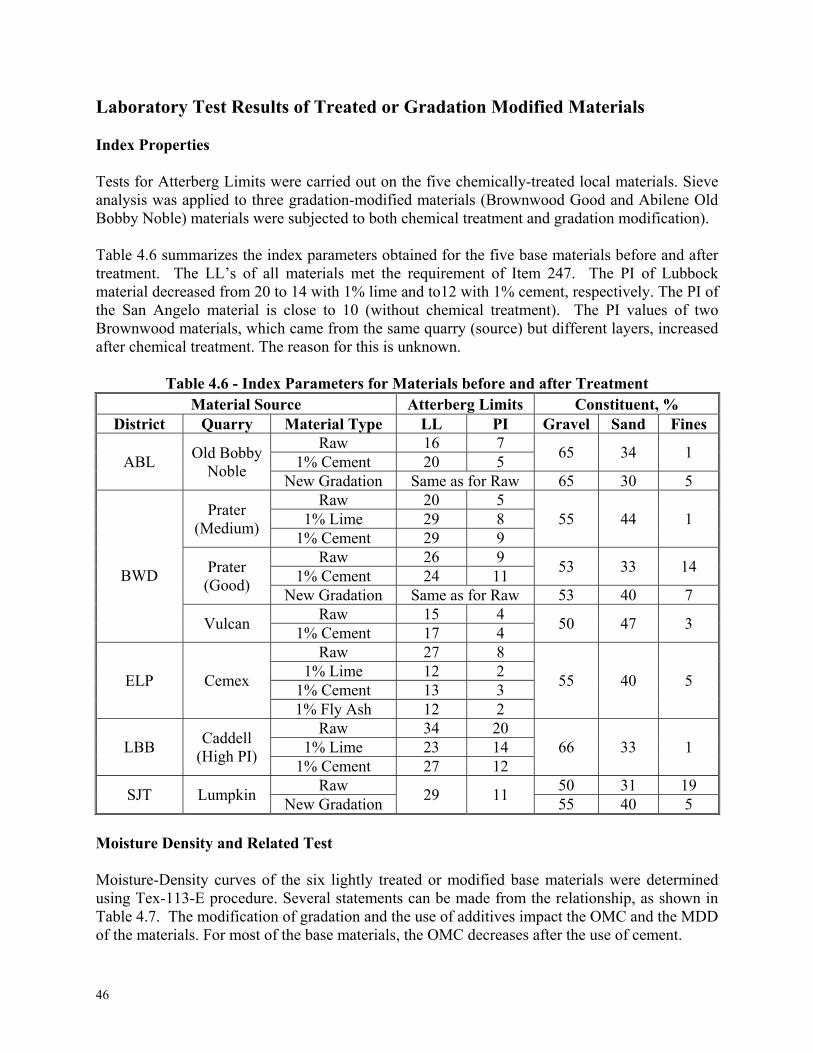
46
Laboratory Test Results of Treated or Gradation Modified Materials Index Properties Tests for Atterberg Limits were carried out on the five chemically-treated local materials. Sieve analysis was applied to three gradation-modified materials (Brownwood Good and Abilene Old Bobby Noble) materials were subjected to both chemical treatment and gradation modification). Table 4.6 summarizes the index parameters obtained for the five base materials before and after treatment. The LL’s of all materials met the requirement of Item 247. The PI of Lubbock material decreased from 20 to 14 with 1% lime and to12 with 1% cement, respectively. The PI of the San Angelo material is close to 10 (without chemical treatment). The PI values of two Brownwood materials, which came from the same quarry (source) but different layers, increased after chemical treatment. The reason for this is unknown.
Table 4.6 - Index Parameters for Materials before and after Treatment Material Source Atterberg Limits Constituent, %
District Quarry Material Type LL PI Gravel Sand Fines
ABL Old Bobby
Noble
Raw 16 7 65 34 1
1% Cement 20 5 New Gradation Same as for Raw 65 30 5
BWD
Prater (Medium)
Raw 20 5 55 44 1 1% Lime 29 8
1% Cement 29 9
Prater (Good)
Raw 26 9 53 33 14
1% Cement 24 11 New Gradation Same as for Raw 53 40 7
Vulcan Raw 15 4
50 47 3 1% Cement 17 4
ELP Cemex
Raw 27 8
55 40 5 1% Lime 12 2
1% Cement 13 3 1% Fly Ash 12 2
LBB Caddell
(High PI)
Raw 34 20 66 33 1 1% Lime 23 14
1% Cement 27 12
SJT Lumpkin Raw
29 11 50 31 19
New Gradation 55 40 5 Moisture Density and Related Test Moisture-Density curves of the six lightly treated or modified base materials were determined using Tex-113-E procedure. Several statements can be made from the relationship, as shown in Table 4.7. The modification of gradation and the use of additives impact the OMC and the MDD of the materials. For most of the base materials, the OMC decreases after the use of cement.
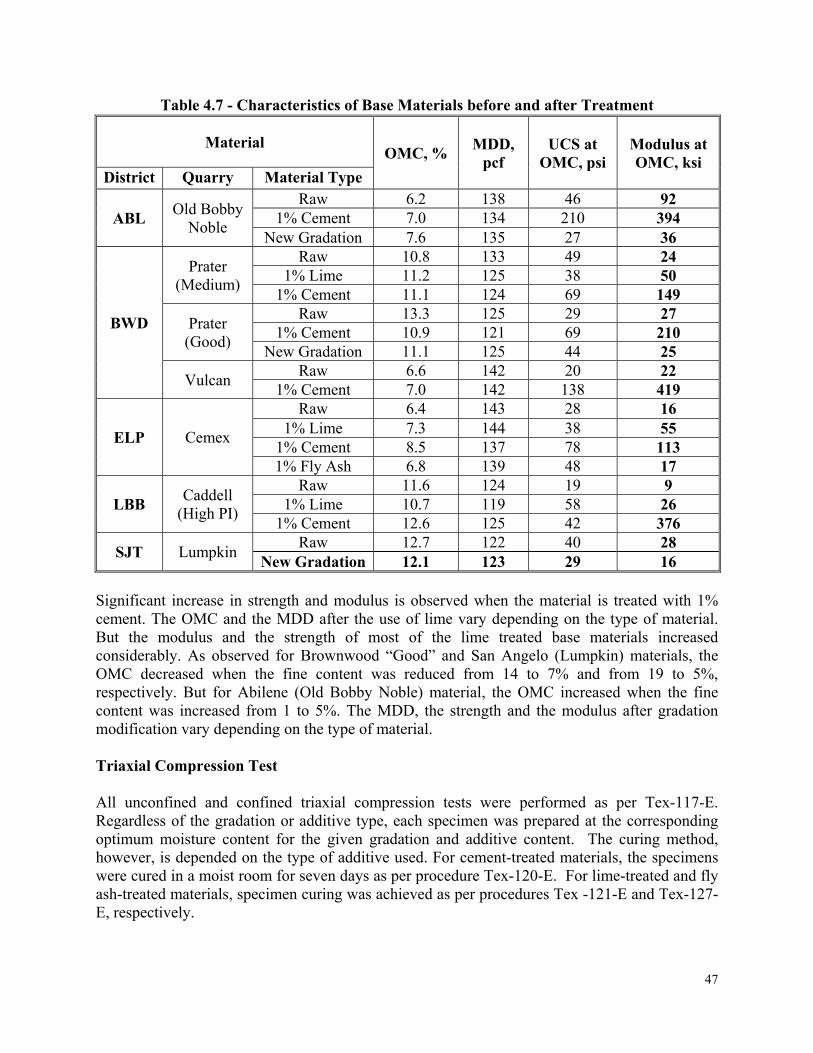
47
Table 4.7 - Characteristics of Base Materials before and after Treatment
Significant increase in strength and modulus is observed when the material is treated with 1% cement. The OMC and the MDD after the use of lime vary depending on the type of material. But the modulus and the strength of most of the lime treated base materials increased considerably. As observed for Brownwood “Good” and San Angelo (Lumpkin) materials, the OMC decreased when the fine content was reduced from 14 to 7% and from 19 to 5%, respectively. But for Abilene (Old Bobby Noble) material, the OMC increased when the fine content was increased from 1 to 5%. The MDD, the strength and the modulus after gradation modification vary depending on the type of material. Triaxial Compression Test All unconfined and confined triaxial compression tests were performed as per Tex-117-E. Regardless of the gradation or additive type, each specimen was prepared at the corresponding optimum moisture content for the given gradation and additive content. The curing method, however, is depended on the type of additive used. For cement-treated materials, the specimens were cured in a moist room for seven days as per procedure Tex-120-E. For lime-treated and fly ash-treated materials, specimen curing was achieved as per procedures Tex -121-E and Tex-127-E, respectively.
Material OMC, %
MDD, pcf
UCS at OMC, psi
Modulus at OMC, ksi
District Quarry Material Type
ABL Old Bobby
Noble
Raw 6.2 138 46 92 1% Cement 7.0 134 210 394
New Gradation 7.6 135 27 36
BWD
Prater (Medium)
Raw 10.8 133 49 24 1% Lime 11.2 125 38 50
1% Cement 11.1 124 69 149
Prater (Good)
Raw 13.3 125 29 27 1% Cement 10.9 121 69 210
New Gradation 11.1 125 44 25
Vulcan Raw 6.6 142 20 22
1% Cement 7.0 142 138 419
ELP Cemex
Raw 6.4 143 28 16 1% Lime 7.3 144 38 55
1% Cement 8.5 137 78 113 1% Fly Ash 6.8 139 48 17
LBB Caddell
(High PI)
Raw 11.6 124 19 9 1% Lime 10.7 119 58 26
1% Cement 12.6 125 42 376
SJT Lumpkin Raw 12.7 122 40 28
New Gradation 12.1 123 29 16
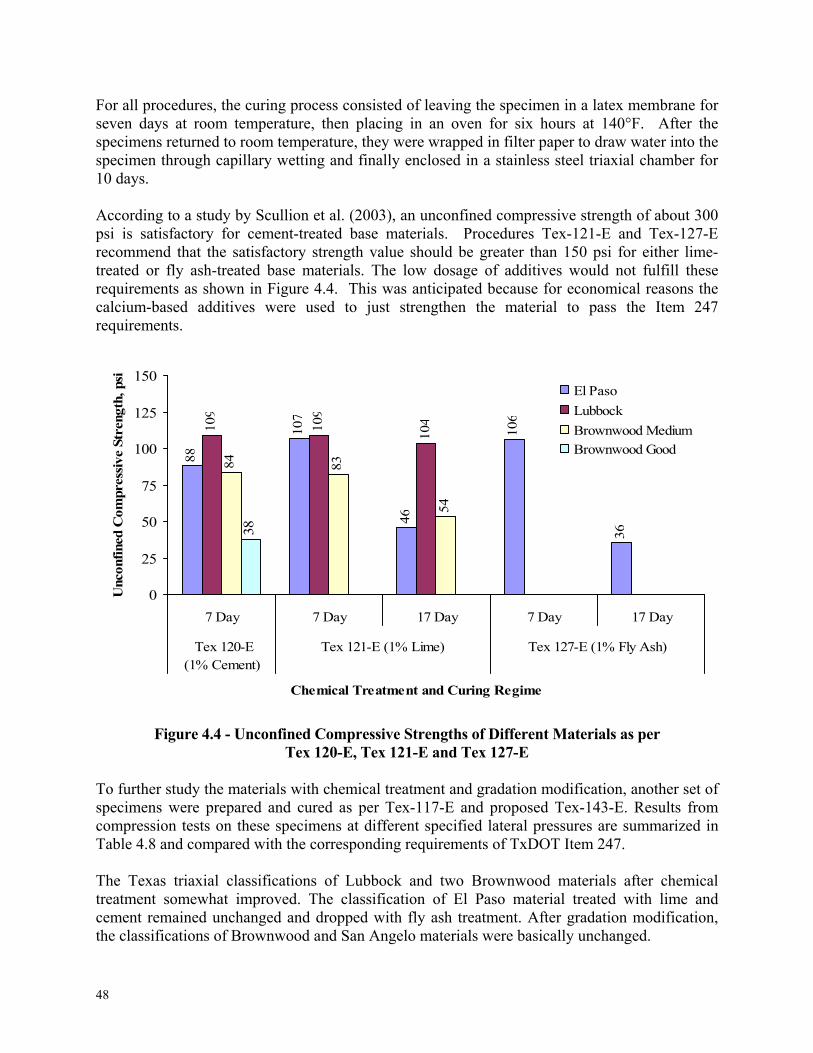
48
88
107
46
106
36
109
109
104
84 83
54
38
0
25
50
75
100
125
150
7 Day 7 Day 17 Day 7 Day 17 Day
Tex 120-E (1% Cement)
Tex 121-E (1% Lime) Tex 127-E (1% Fly Ash)
Chemical Treatment and Curing Regime
Unc
onfi
ned
Com
pres
sive
Str
engt
h, p
si
El Paso
Lubbock
Brownwood Medium
Brownwood Good
For all procedures, the curing process consisted of leaving the specimen in a latex membrane for seven days at room temperature, then placing in an oven for six hours at 140°F. After the specimens returned to room temperature, they were wrapped in filter paper to draw water into the specimen through capillary wetting and finally enclosed in a stainless steel triaxial chamber for 10 days. According to a study by Scullion et al. (2003), an unconfined compressive strength of about 300 psi is satisfactory for cement-treated base materials. Procedures Tex-121-E and Tex-127-E recommend that the satisfactory strength value should be greater than 150 psi for either lime-treated or fly ash-treated base materials. The low dosage of additives would not fulfill these requirements as shown in Figure 4.4. This was anticipated because for economical reasons the calcium-based additives were used to just strengthen the material to pass the Item 247 requirements.
Figure 4.4 - Unconfined Compressive Strengths of Different Materials as per
Tex 120-E, Tex 121-E and Tex 127-E To further study the materials with chemical treatment and gradation modification, another set of specimens were prepared and cured as per Tex-117-E and proposed Tex-143-E. Results from compression tests on these specimens at different specified lateral pressures are summarized in Table 4.8 and compared with the corresponding requirements of TxDOT Item 247. The Texas triaxial classifications of Lubbock and two Brownwood materials after chemical treatment somewhat improved. The classification of El Paso material treated with lime and cement remained unchanged and dropped with fly ash treatment. After gradation modification, the classifications of Brownwood and San Angelo materials were basically unchanged.
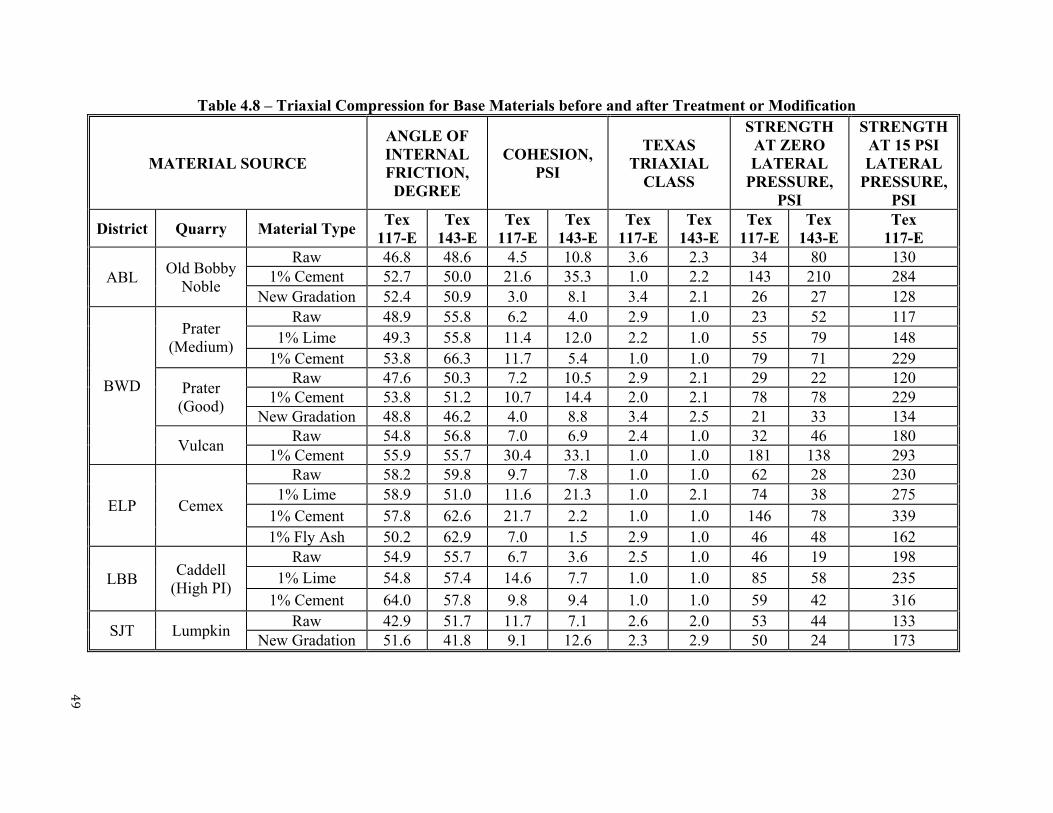
49
Table 4.8 – Triaxial Compression for Base Materials before and after Treatment or Modification
MATERIAL SOURCE
ANGLE OF INTERNAL FRICTION,
DEGREE
COHESION, PSI
TEXAS TRIAXIAL
CLASS
STRENGTH AT ZERO LATERAL
PRESSURE, PSI
STRENGTH AT 15 PSI LATERAL
PRESSURE, PSI
District Quarry Material Type Tex
117-E Tex
143-E Tex
117-E Tex
143-E Tex
117-E Tex
143-E Tex
117-E Tex
143-E Tex
117-E
ABL Old Bobby
Noble
Raw 46.8 48.6 4.5 10.8 3.6 2.3 34 80 130 1% Cement 52.7 50.0 21.6 35.3 1.0 2.2 143 210 284
New Gradation 52.4 50.9 3.0 8.1 3.4 2.1 26 27 128
BWD
Prater (Medium)
Raw 48.9 55.8 6.2 4.0 2.9 1.0 23 52 117 1% Lime 49.3 55.8 11.4 12.0 2.2 1.0 55 79 148
1% Cement 53.8 66.3 11.7 5.4 1.0 1.0 79 71 229
Prater (Good)
Raw 47.6 50.3 7.2 10.5 2.9 2.1 29 22 120 1% Cement 53.8 51.2 10.7 14.4 2.0 2.1 78 78 229
New Gradation 48.8 46.2 4.0 8.8 3.4 2.5 21 33 134
Vulcan Raw 54.8 56.8 7.0 6.9 2.4 1.0 32 46 180
1% Cement 55.9 55.7 30.4 33.1 1.0 1.0 181 138 293
ELP Cemex
Raw 58.2 59.8 9.7 7.8 1.0 1.0 62 28 230 1% Lime 58.9 51.0 11.6 21.3 1.0 2.1 74 38 275
1% Cement 57.8 62.6 21.7 2.2 1.0 1.0 146 78 339 1% Fly Ash 50.2 62.9 7.0 1.5 2.9 1.0 46 48 162
LBB Caddell
(High PI)
Raw 54.9 55.7 6.7 3.6 2.5 1.0 46 19 198 1% Lime 54.8 57.4 14.6 7.7 1.0 1.0 85 58 235
1% Cement 64.0 57.8 9.8 9.4 1.0 1.0 59 42 316
SJT Lumpkin Raw 42.9 51.7 11.7 7.1 2.6 2.0 53 44 133
New Gradation 51.6 41.8 9.1 12.6 2.3 2.9 50 24 173
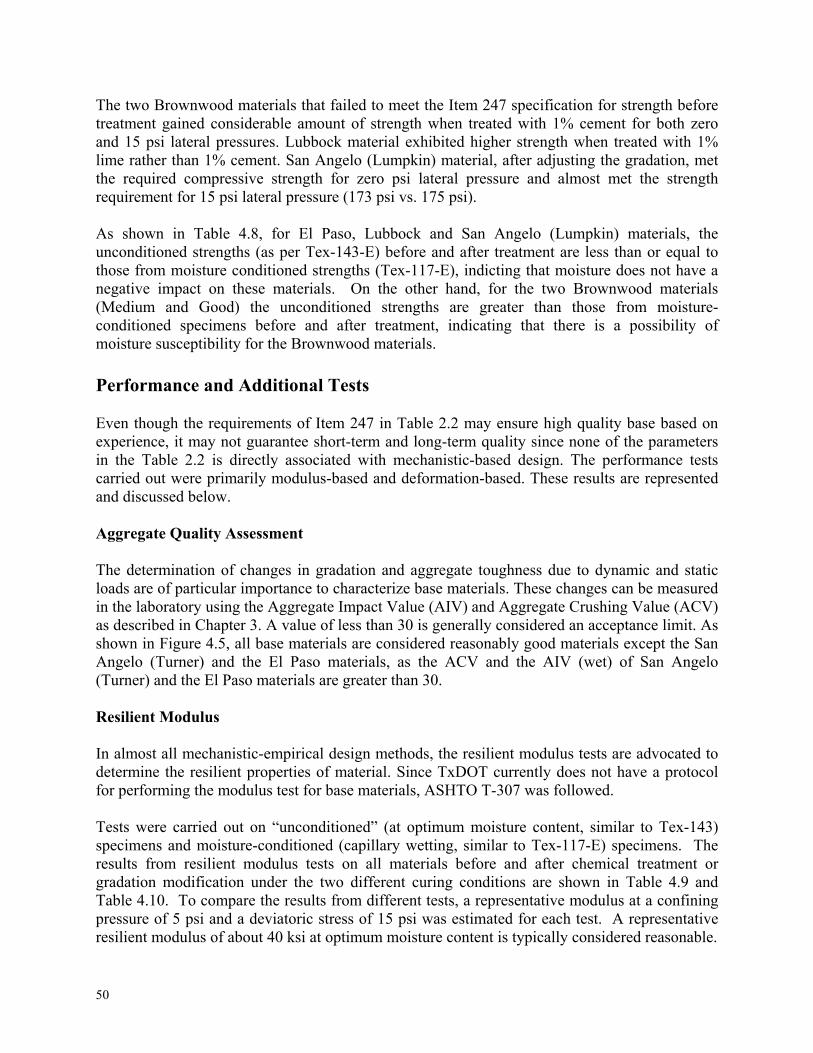
50
The two Brownwood materials that failed to meet the Item 247 specification for strength before treatment gained considerable amount of strength when treated with 1% cement for both zero and 15 psi lateral pressures. Lubbock material exhibited higher strength when treated with 1% lime rather than 1% cement. San Angelo (Lumpkin) material, after adjusting the gradation, met the required compressive strength for zero psi lateral pressure and almost met the strength requirement for 15 psi lateral pressure (173 psi vs. 175 psi). As shown in Table 4.8, for El Paso, Lubbock and San Angelo (Lumpkin) materials, the unconditioned strengths (as per Tex-143-E) before and after treatment are less than or equal to those from moisture conditioned strengths (Tex-117-E), indicting that moisture does not have a negative impact on these materials. On the other hand, for the two Brownwood materials (Medium and Good) the unconditioned strengths are greater than those from moisture-conditioned specimens before and after treatment, indicating that there is a possibility of moisture susceptibility for the Brownwood materials. Performance and Additional Tests Even though the requirements of Item 247 in Table 2.2 may ensure high quality base based on experience, it may not guarantee short-term and long-term quality since none of the parameters in the Table 2.2 is directly associated with mechanistic-based design. The performance tests carried out were primarily modulus-based and deformation-based. These results are represented and discussed below. Aggregate Quality Assessment The determination of changes in gradation and aggregate toughness due to dynamic and static loads are of particular importance to characterize base materials. These changes can be measured in the laboratory using the Aggregate Impact Value (AIV) and Aggregate Crushing Value (ACV) as described in Chapter 3. A value of less than 30 is generally considered an acceptance limit. As shown in Figure 4.5, all base materials are considered reasonably good materials except the San Angelo (Turner) and the El Paso materials, as the ACV and the AIV (wet) of San Angelo (Turner) and the El Paso materials are greater than 30. Resilient Modulus In almost all mechanistic-empirical design methods, the resilient modulus tests are advocated to determine the resilient properties of material. Since TxDOT currently does not have a protocol for performing the modulus test for base materials, ASHTO T-307 was followed. Tests were carried out on “unconditioned” (at optimum moisture content, similar to Tex-143) specimens and moisture-conditioned (capillary wetting, similar to Tex-117-E) specimens. The results from resilient modulus tests on all materials before and after chemical treatment or gradation modification under the two different curing conditions are shown in Table 4.9 and Table 4.10. To compare the results from different tests, a representative modulus at a confining pressure of 5 psi and a deviatoric stress of 15 psi was estimated for each test. A representative resilient modulus of about 40 ksi at optimum moisture content is typically considered reasonable.
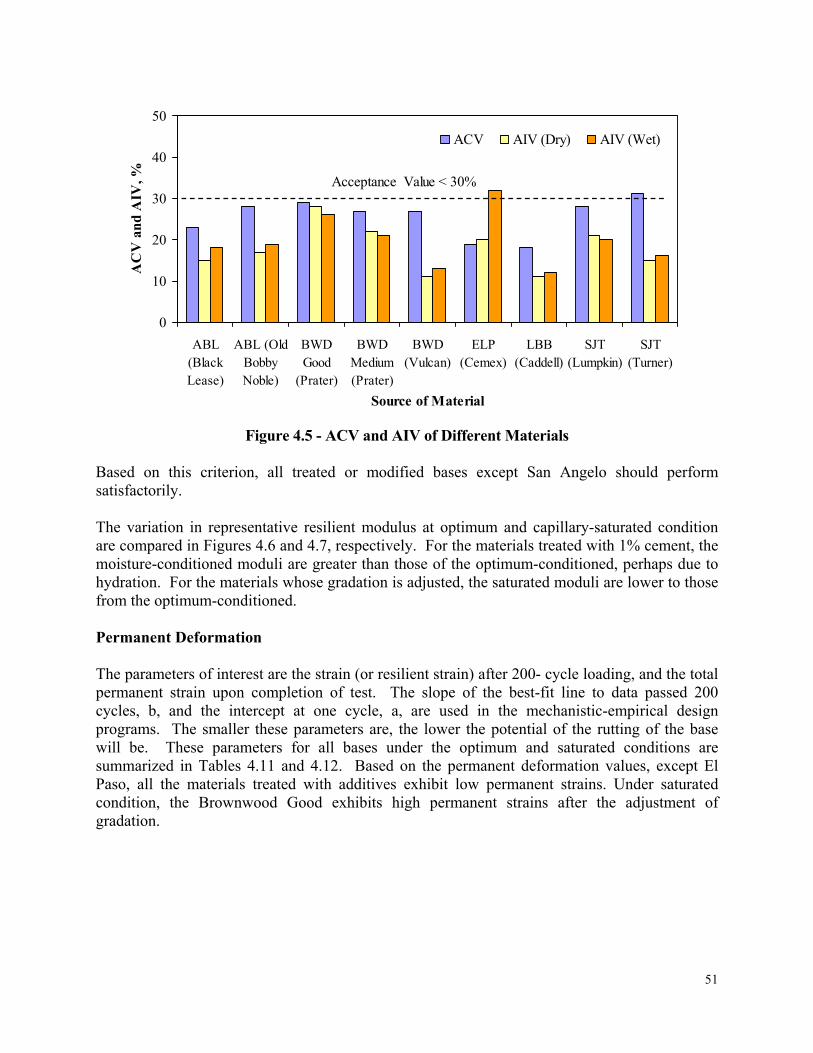
51
Figure 4.5 - ACV and AIV of Different Materials Based on this criterion, all treated or modified bases except San Angelo should perform satisfactorily. The variation in representative resilient modulus at optimum and capillary-saturated condition are compared in Figures 4.6 and 4.7, respectively. For the materials treated with 1% cement, the moisture-conditioned moduli are greater than those of the optimum-conditioned, perhaps due to hydration. For the materials whose gradation is adjusted, the saturated moduli are lower to those from the optimum-conditioned. Permanent Deformation The parameters of interest are the strain (or resilient strain) after 200- cycle loading, and the total permanent strain upon completion of test. The slope of the best-fit line to data passed 200 cycles, b, and the intercept at one cycle, a, are used in the mechanistic-empirical design programs. The smaller these parameters are, the lower the potential of the rutting of the base will be. These parameters for all bases under the optimum and saturated conditions are summarized in Tables 4.11 and 4.12. Based on the permanent deformation values, except El Paso, all the materials treated with additives exhibit low permanent strains. Under saturated condition, the Brownwood Good exhibits high permanent strains after the adjustment of gradation.
0
10
20
30
40
50
ABL(BlackLease)
ABL (OldBobbyNoble)
BWDGood
(Prater)
BWDMedium(Prater)
BWD(Vulcan)
ELP(Cemex)
LBB(Caddell)
SJT(Lumpkin)
SJT(Turner)
Source of Material
AC
V a
nd
AIV
, %ACV AIV (Dry) AIV (Wet)
Acceptance Value < 30%
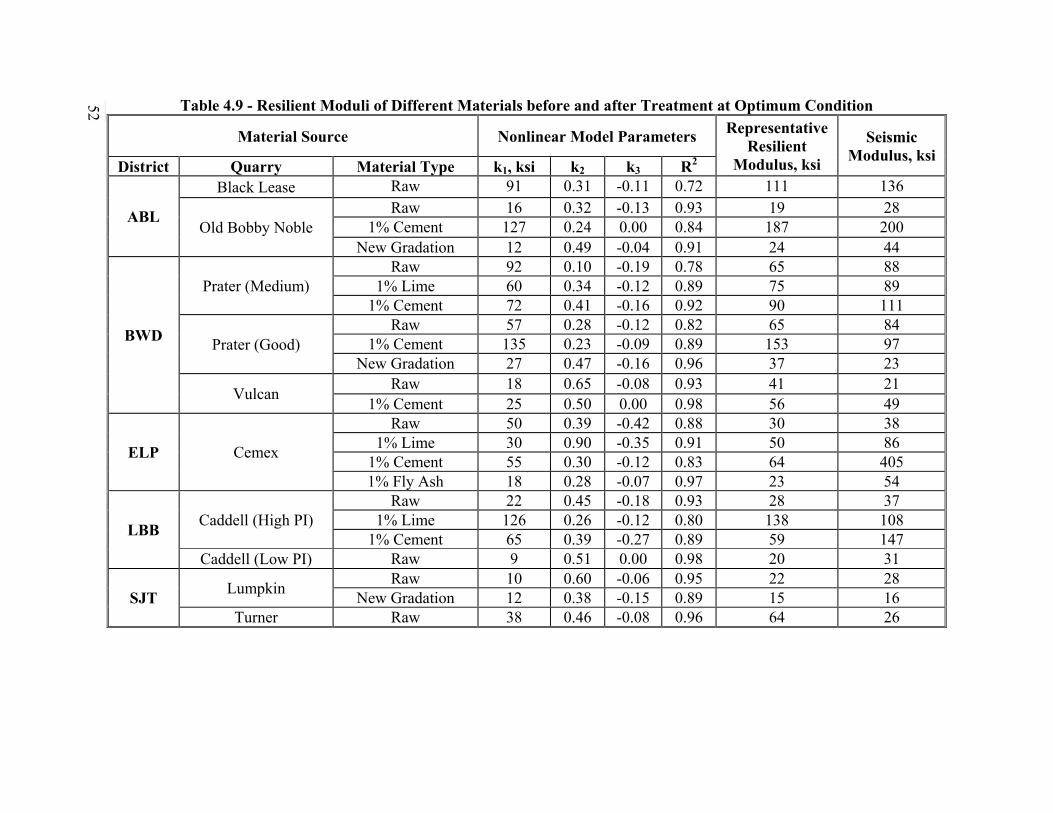
52 Table 4.9 - Resilient Moduli of Different Materials before and after Treatment at Optimum Condition
Material Source Nonlinear Model Parameters Representative Resilient
Modulus, ksi
Seismic Modulus, ksi
District Quarry Material Type k1, ksi k2 k3 R2
ABL
Black Lease Raw 91 0.31 -0.11 0.72 111 136
Old Bobby Noble Raw 16 0.32 -0.13 0.93 19 28
1% Cement 127 0.24 0.00 0.84 187 200 New Gradation 12 0.49 -0.04 0.91 24 44
BWD
Prater (Medium) Raw 92 0.10 -0.19 0.78 65 88
1% Lime 60 0.34 -0.12 0.89 75 89 1% Cement 72 0.41 -0.16 0.92 90 111
Prater (Good) Raw 57 0.28 -0.12 0.82 65 84
1% Cement 135 0.23 -0.09 0.89 153 97 New Gradation 27 0.47 -0.16 0.96 37 23
Vulcan Raw 18 0.65 -0.08 0.93 41 21
1% Cement 25 0.50 0.00 0.98 56 49
ELP Cemex
Raw 50 0.39 -0.42 0.88 30 38 1% Lime 30 0.90 -0.35 0.91 50 86
1% Cement 55 0.30 -0.12 0.83 64 405 1% Fly Ash 18 0.28 -0.07 0.97 23 54
LBB Caddell (High PI)
Raw 22 0.45 -0.18 0.93 28 37 1% Lime 126 0.26 -0.12 0.80 138 108
1% Cement 65 0.39 -0.27 0.89 59 147 Caddell (Low PI) Raw 9 0.51 0.00 0.98 20 31
SJT Lumpkin
Raw 10 0.60 -0.06 0.95 22 28 New Gradation 12 0.38 -0.15 0.89 15 16
Turner Raw 38 0.46 -0.08 0.96 64 26
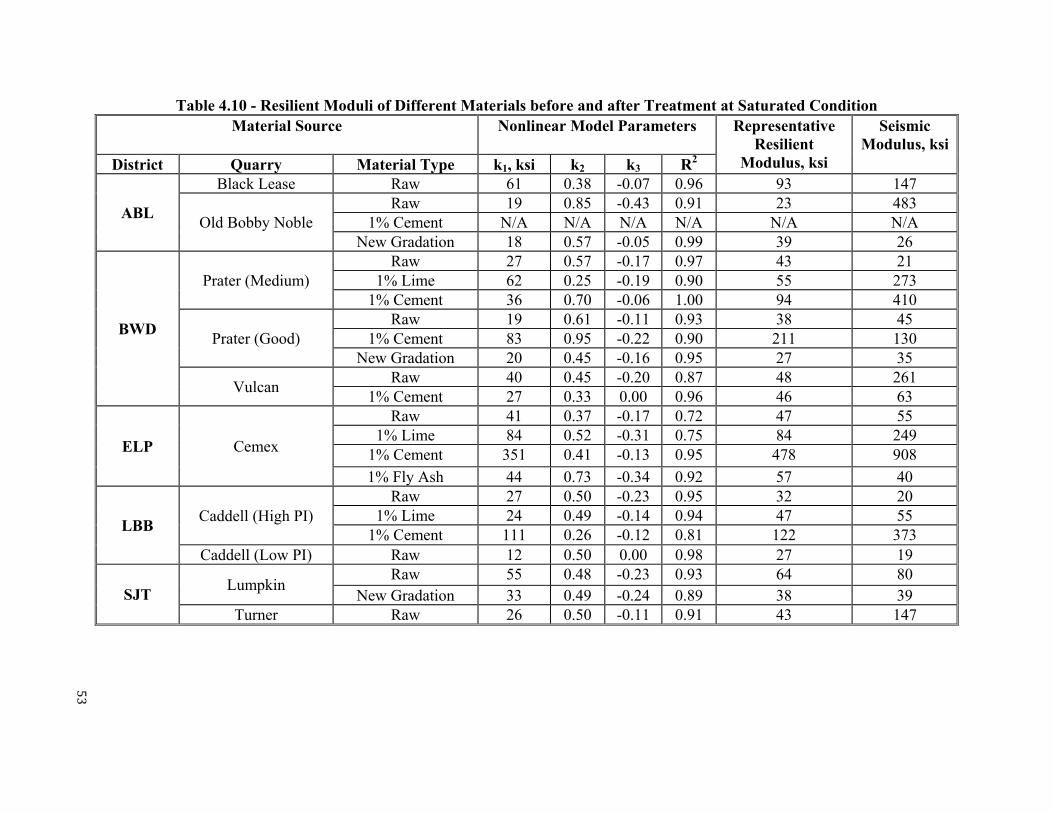
53
Table 4.10 - Resilient Moduli of Different Materials before and after Treatment at Saturated Condition Material Source Nonlinear Model Parameters Representative
Resilient Modulus, ksi
Seismic Modulus, ksi
District Quarry Material Type k1, ksi k2 k3 R2
ABL
Black Lease Raw 61 0.38 -0.07 0.96 93 147
Old Bobby Noble Raw 19 0.85 -0.43 0.91 23 483
1% Cement N/A N/A N/A N/A N/A N/A New Gradation 18 0.57 -0.05 0.99 39 26
BWD
Prater (Medium) Raw 27 0.57 -0.17 0.97 43 21
1% Lime 62 0.25 -0.19 0.90 55 273 1% Cement 36 0.70 -0.06 1.00 94 410
Prater (Good) Raw 19 0.61 -0.11 0.93 38 45
1% Cement 83 0.95 -0.22 0.90 211 130 New Gradation 20 0.45 -0.16 0.95 27 35
Vulcan Raw 40 0.45 -0.20 0.87 48 261
1% Cement 27 0.33 0.00 0.96 46 63
ELP Cemex
Raw 41 0.37 -0.17 0.72 47 55 1% Lime 84 0.52 -0.31 0.75 84 249
1% Cement 351 0.41 -0.13 0.95 478 908
1% Fly Ash 44 0.73 -0.34 0.92 57 40
LBB Caddell (High PI)
Raw 27 0.50 -0.23 0.95 32 20 1% Lime 24 0.49 -0.14 0.94 47 55
1% Cement 111 0.26 -0.12 0.81 122 373 Caddell (Low PI) Raw 12 0.50 0.00 0.98 27 19
SJT Lumpkin
Raw 55 0.48 -0.23 0.93 64 80 New Gradation 33 0.49 -0.24 0.89 38 39
Turner Raw 26 0.50 -0.11 0.91 43 147
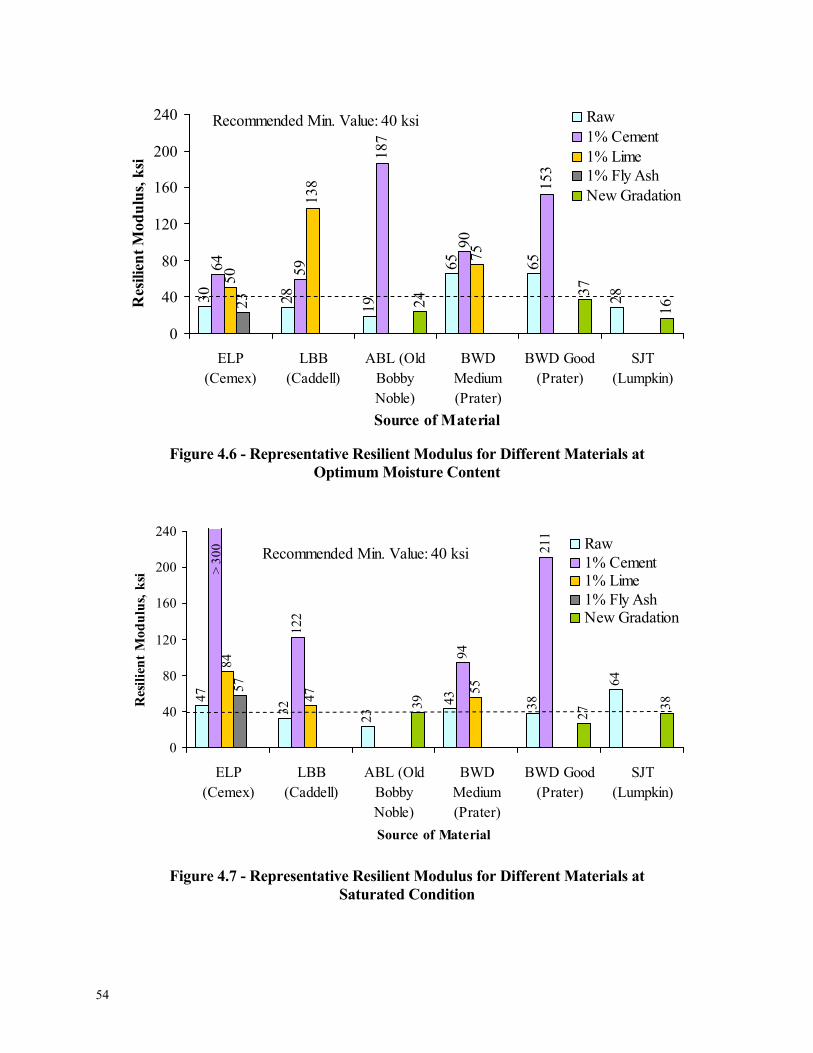
54
Figure 4.6 - Representative Resilient Modulus for Different Materials at Optimum Moisture Content
Figure 4.7 - Representative Resilient Modulus for Different Materials at Saturated Condition
30 28
19
65 65
28
64 59
187
90
153
50
138
75
23 24
37
16
0
40
80
120
160
200
240
ELP(Cemex)
LBB(Caddell)
ABL (OldBobbyNoble)
BWDMedium(Prater)
BWD Good(Prater)
SJT(Lumpkin)
Source of Material
Res
ilien
t M
odu
lus,
ksi
Raw1% Cement1% Lime1% Fly AshNew Gradation
Recommended Min. Value: 40 ksi
47
32
23
43 38
64
122
94
211
84
47
5557
39
27
38
0
40
80
120
160
200
240
ELP(Cemex)
LBB(Caddell)
ABL (OldBobbyNoble)
BWDMedium(Prater)
BWD Good(Prater)
SJT(Lumpkin)
Source of Material
Res
ilie
nt
Mod
ulu
s, k
si
Raw1% Cement1% Lime1% Fly AshNew Gradation
> 30
0 Recommended Min. Value: 40 ksi
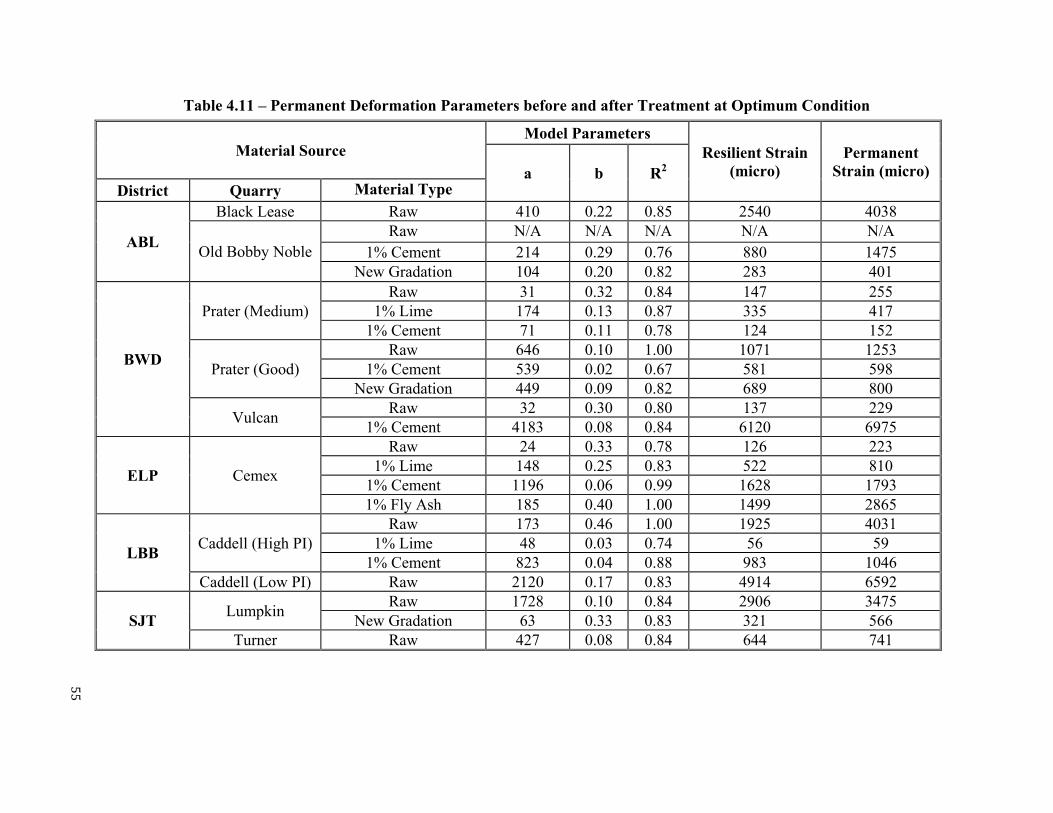
55
Table 4.11 – Permanent Deformation Parameters before and after Treatment at Optimum Condition
Material Source Model Parameters
Resilient Strain (micro)
Permanent Strain (micro) a b R2
District Quarry Material Type
ABL
Black Lease Raw 410 0.22 0.85 2540 4038
Old Bobby Noble Raw N/A N/A N/A N/A N/A
1% Cement 214 0.29 0.76 880 1475 New Gradation 104 0.20 0.82 283 401
BWD
Prater (Medium) Raw 31 0.32 0.84 147 255
1% Lime 174 0.13 0.87 335 417 1% Cement 71 0.11 0.78 124 152
Prater (Good) Raw 646 0.10 1.00 1071 1253
1% Cement 539 0.02 0.67 581 598 New Gradation 449 0.09 0.82 689 800
Vulcan Raw 32 0.30 0.80 137 229
1% Cement 4183 0.08 0.84 6120 6975
ELP Cemex
Raw 24 0.33 0.78 126 223 1% Lime 148 0.25 0.83 522 810
1% Cement 1196 0.06 0.99 1628 1793 1% Fly Ash 185 0.40 1.00 1499 2865
LBB Caddell (High PI)
Raw 173 0.46 1.00 1925 4031 1% Lime 48 0.03 0.74 56 59
1% Cement 823 0.04 0.88 983 1046 Caddell (Low PI) Raw 2120 0.17 0.83 4914 6592
SJT Lumpkin
Raw 1728 0.10 0.84 2906 3475 New Gradation 63 0.33 0.83 321 566
Turner Raw 427 0.08 0.84 644 741
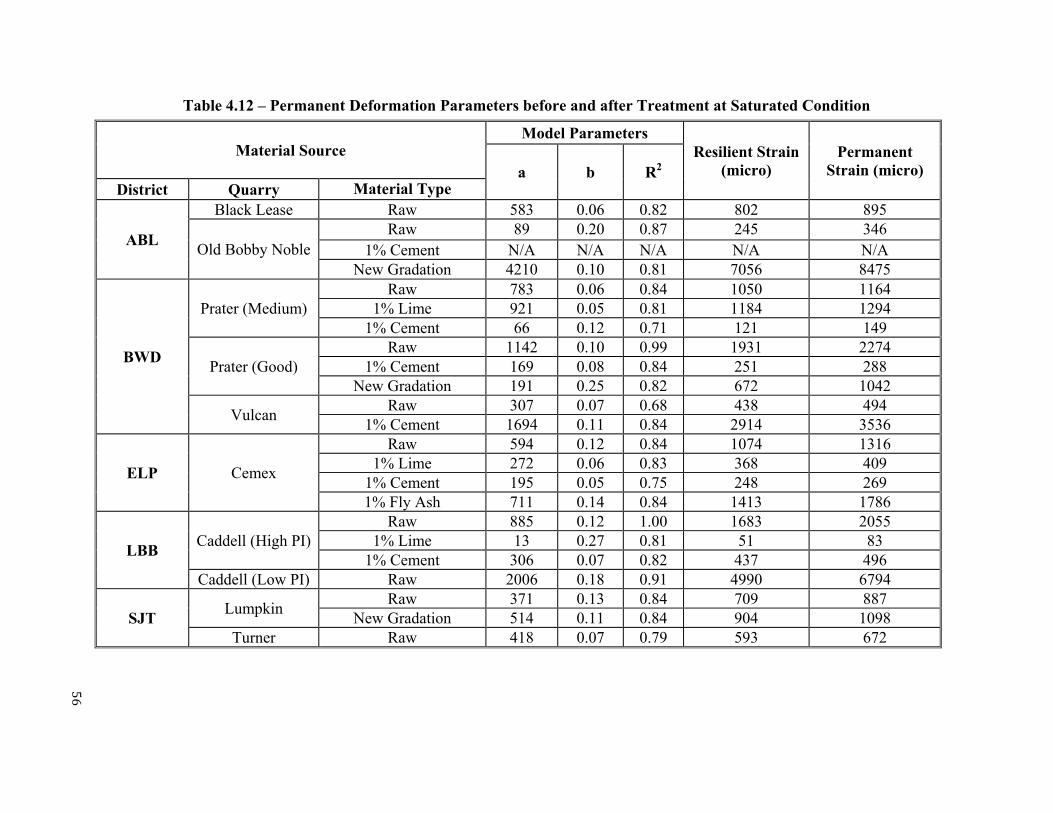
56
Table 4.12 – Permanent Deformation Parameters before and after Treatment at Saturated Condition
Material Source Model Parameters
Resilient Strain (micro)
Permanent Strain (micro) a b R2
District Quarry Material Type
ABL
Black Lease Raw 583 0.06 0.82 802 895
Old Bobby Noble Raw 89 0.20 0.87 245 346
1% Cement N/A N/A N/A N/A N/A New Gradation 4210 0.10 0.81 7056 8475
BWD
Prater (Medium) Raw 783 0.06 0.84 1050 1164
1% Lime 921 0.05 0.81 1184 1294 1% Cement 66 0.12 0.71 121 149
Prater (Good) Raw 1142 0.10 0.99 1931 2274
1% Cement 169 0.08 0.84 251 288 New Gradation 191 0.25 0.82 672 1042
Vulcan Raw 307 0.07 0.68 438 494
1% Cement 1694 0.11 0.84 2914 3536
ELP Cemex
Raw 594 0.12 0.84 1074 1316 1% Lime 272 0.06 0.83 368 409
1% Cement 195 0.05 0.75 248 269 1% Fly Ash 711 0.14 0.84 1413 1786
LBB Caddell (High PI)
Raw 885 0.12 1.00 1683 2055 1% Lime 13 0.27 0.81 51 83
1% Cement 306 0.07 0.82 437 496 Caddell (Low PI) Raw 2006 0.18 0.91 4990 6794
SJT Lumpkin
Raw 371 0.13 0.84 709 887 New Gradation 514 0.11 0.84 904 1098
Turner Raw 418 0.07 0.79 593 672
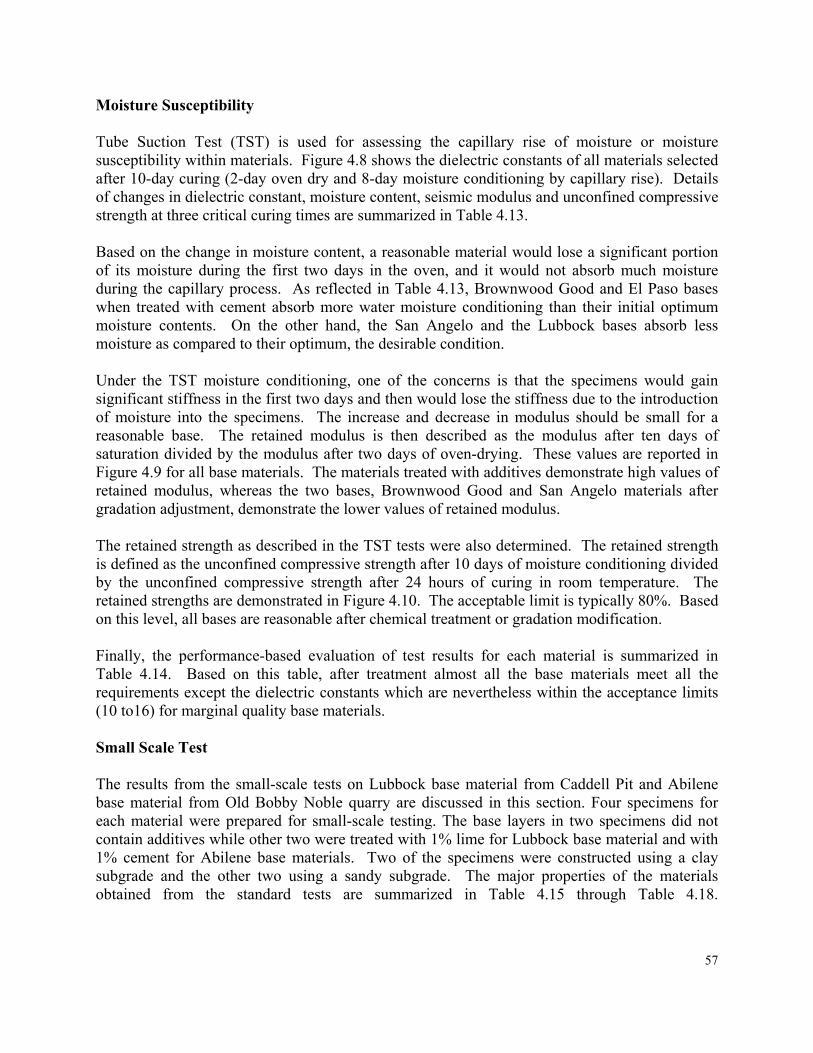
57
Moisture Susceptibility Tube Suction Test (TST) is used for assessing the capillary rise of moisture or moisture susceptibility within materials. Figure 4.8 shows the dielectric constants of all materials selected after 10-day curing (2-day oven dry and 8-day moisture conditioning by capillary rise). Details of changes in dielectric constant, moisture content, seismic modulus and unconfined compressive strength at three critical curing times are summarized in Table 4.13. Based on the change in moisture content, a reasonable material would lose a significant portion of its moisture during the first two days in the oven, and it would not absorb much moisture during the capillary process. As reflected in Table 4.13, Brownwood Good and El Paso bases when treated with cement absorb more water moisture conditioning than their initial optimum moisture contents. On the other hand, the San Angelo and the Lubbock bases absorb less moisture as compared to their optimum, the desirable condition. Under the TST moisture conditioning, one of the concerns is that the specimens would gain significant stiffness in the first two days and then would lose the stiffness due to the introduction of moisture into the specimens. The increase and decrease in modulus should be small for a reasonable base. The retained modulus is then described as the modulus after ten days of saturation divided by the modulus after two days of oven-drying. These values are reported in Figure 4.9 for all base materials. The materials treated with additives demonstrate high values of retained modulus, whereas the two bases, Brownwood Good and San Angelo materials after gradation adjustment, demonstrate the lower values of retained modulus. The retained strength as described in the TST tests were also determined. The retained strength is defined as the unconfined compressive strength after 10 days of moisture conditioning divided by the unconfined compressive strength after 24 hours of curing in room temperature. The retained strengths are demonstrated in Figure 4.10. The acceptable limit is typically 80%. Based on this level, all bases are reasonable after chemical treatment or gradation modification. Finally, the performance-based evaluation of test results for each material is summarized in Table 4.14. Based on this table, after treatment almost all the base materials meet all the requirements except the dielectric constants which are nevertheless within the acceptance limits (10 to16) for marginal quality base materials. Small Scale Test The results from the small-scale tests on Lubbock base material from Caddell Pit and Abilene base material from Old Bobby Noble quarry are discussed in this section. Four specimens for each material were prepared for small-scale testing. The base layers in two specimens did not contain additives while other two were treated with 1% lime for Lubbock base material and with 1% cement for Abilene base materials. Two of the specimens were constructed using a clay subgrade and the other two using a sandy subgrade. The major properties of the materials obtained from the standard tests are summarized in Table 4.15 through Table 4.18.
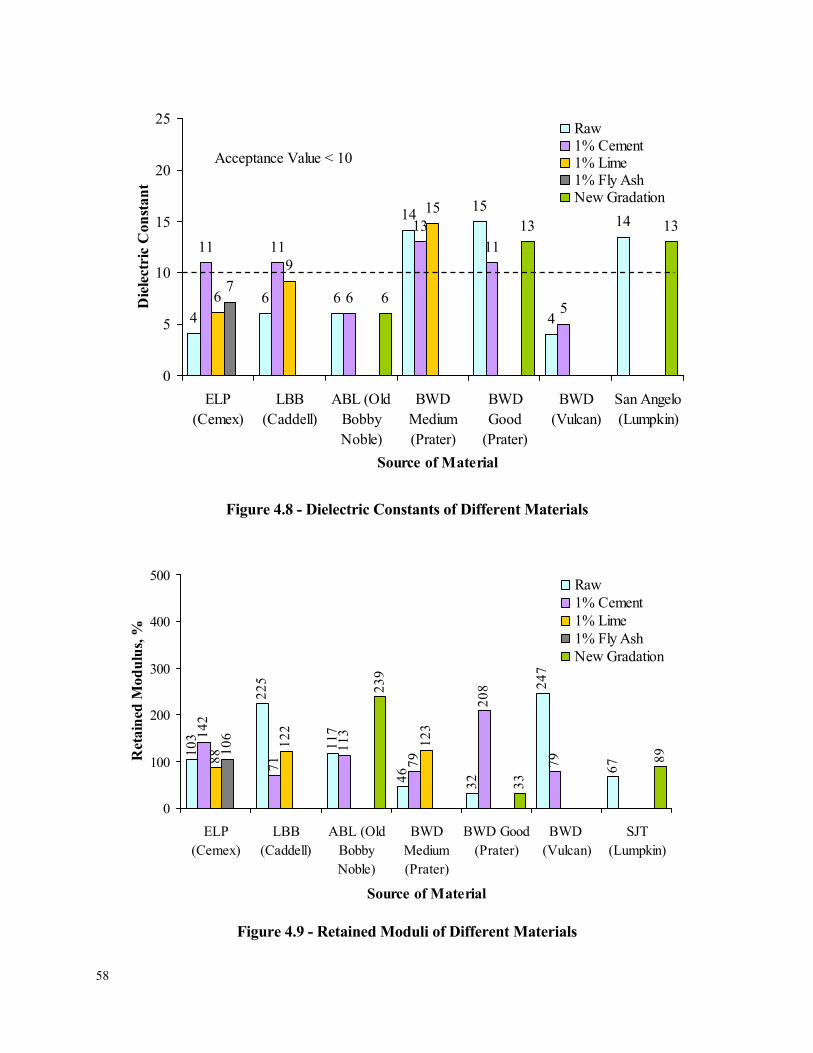
58
Figure 4.8 - Dielectric Constants of Different Materials
Figure 4.9 - Retained Moduli of Different Materials
46 6
1415
4
14
11 11
6
1311
56
9
15
76
13 13
0
5
10
15
20
25
ELP(Cemex)
LBB(Caddell)
ABL (OldBobbyNoble)
BWDMedium(Prater)
BWDGood
(Prater)
BWD(Vulcan)
San Angelo(Lumpkin)
Source of Material
Die
lect
ric
Con
stan
tRaw1% Cement1% Lime1% Fly AshNew Gradation
Acceptance Value < 10
103
225
117
46 32
247
67
142
71
113
79
208
7988
122
123
106
239
33
89
0
100
200
300
400
500
ELP(Cemex)
LBB(Caddell)
ABL (OldBobbyNoble)
BWDMedium(Prater)
BWD Good(Prater)
BWD (Vulcan)
SJT(Lumpkin)
Source of Material
Ret
ain
ed M
odu
lus,
%
Raw1% Cement1% Lime1% Fly AshNew Gradation
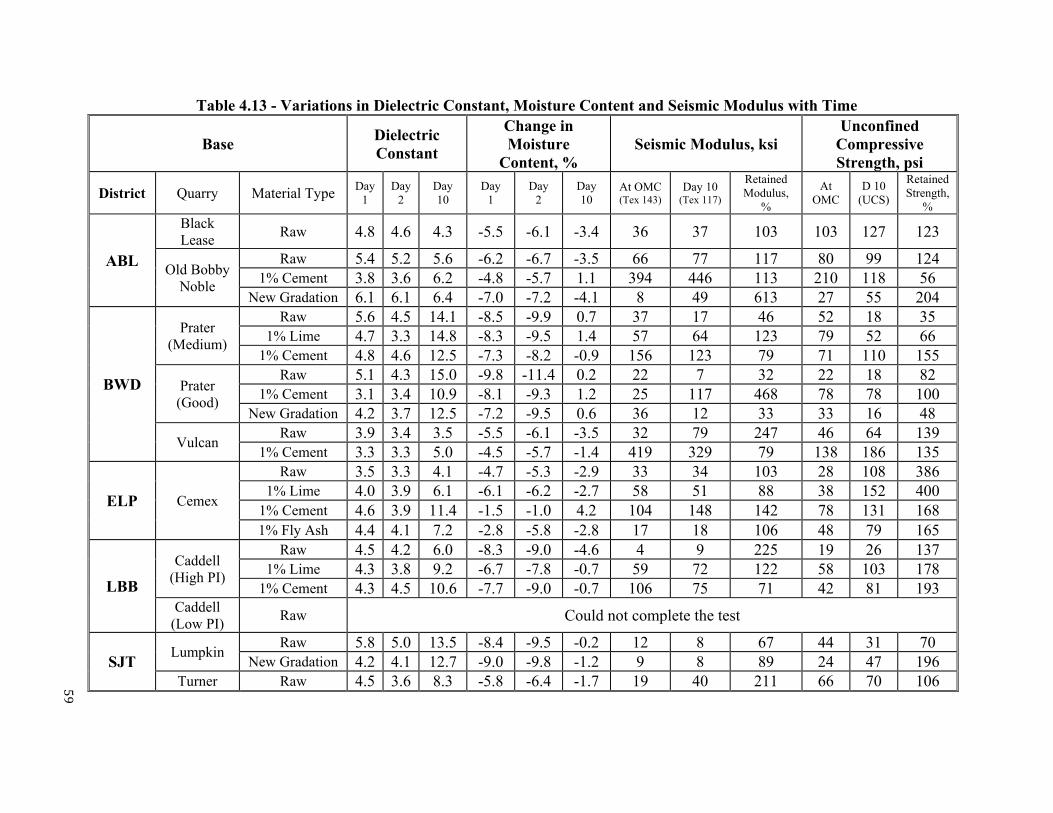
59
Table 4.13 - Variations in Dielectric Constant, Moisture Content and Seismic Modulus with Time
Base Dielectric Constant
Change in Moisture
Content, % Seismic Modulus, ksi
Unconfined Compressive Strength, psi
District Quarry Material Type Day 1
Day 2
Day 10
Day 1
Day 2
Day 10
At OMC (Tex 143)
Day 10 (Tex 117)
Retained Modulus,
%
At OMC
D 10 (UCS)
Retained Strength,
%
ABL
Black Lease
Raw 4.8 4.6 4.3 -5.5 -6.1 -3.4 36 37 103 103 127 123
Old Bobby Noble
Raw 5.4 5.2 5.6 -6.2 -6.7 -3.5 66 77 117 80 99 124 1% Cement 3.8 3.6 6.2 -4.8 -5.7 1.1 394 446 113 210 118 56
New Gradation 6.1 6.1 6.4 -7.0 -7.2 -4.1 8 49 613 27 55 204
BWD
Prater (Medium)
Raw 5.6 4.5 14.1 -8.5 -9.9 0.7 37 17 46 52 18 35 1% Lime 4.7 3.3 14.8 -8.3 -9.5 1.4 57 64 123 79 52 66
1% Cement 4.8 4.6 12.5 -7.3 -8.2 -0.9 156 123 79 71 110 155
Prater (Good)
Raw 5.1 4.3 15.0 -9.8 -11.4 0.2 22 7 32 22 18 82 1% Cement 3.1 3.4 10.9 -8.1 -9.3 1.2 25 117 468 78 78 100
New Gradation 4.2 3.7 12.5 -7.2 -9.5 0.6 36 12 33 33 16 48
Vulcan Raw 3.9 3.4 3.5 -5.5 -6.1 -3.5 32 79 247 46 64 139
1% Cement 3.3 3.3 5.0 -4.5 -5.7 -1.4 419 329 79 138 186 135
ELP Cemex
Raw 3.5 3.3 4.1 -4.7 -5.3 -2.9 33 34 103 28 108 386 1% Lime 4.0 3.9 6.1 -6.1 -6.2 -2.7 58 51 88 38 152 400
1% Cement 4.6 3.9 11.4 -1.5 -1.0 4.2 104 148 142 78 131 168 1% Fly Ash 4.4 4.1 7.2 -2.8 -5.8 -2.8 17 18 106 48 79 165
LBB
Caddell (High PI)
Raw 4.5 4.2 6.0 -8.3 -9.0 -4.6 4 9 225 19 26 137 1% Lime 4.3 3.8 9.2 -6.7 -7.8 -0.7 59 72 122 58 103 178
1% Cement 4.3 4.5 10.6 -7.7 -9.0 -0.7 106 75 71 42 81 193 Caddell
(Low PI) Raw Could not complete the test
SJT Lumpkin
Raw 5.8 5.0 13.5 -8.4 -9.5 -0.2 12 8 67 44 31 70 New Gradation 4.2 4.1 12.7 -9.0 -9.8 -1.2 9 8 89 24 47 196
Turner Raw 4.5 3.6 8.3 -5.8 -6.4 -1.7 19 40 211 66 70 106
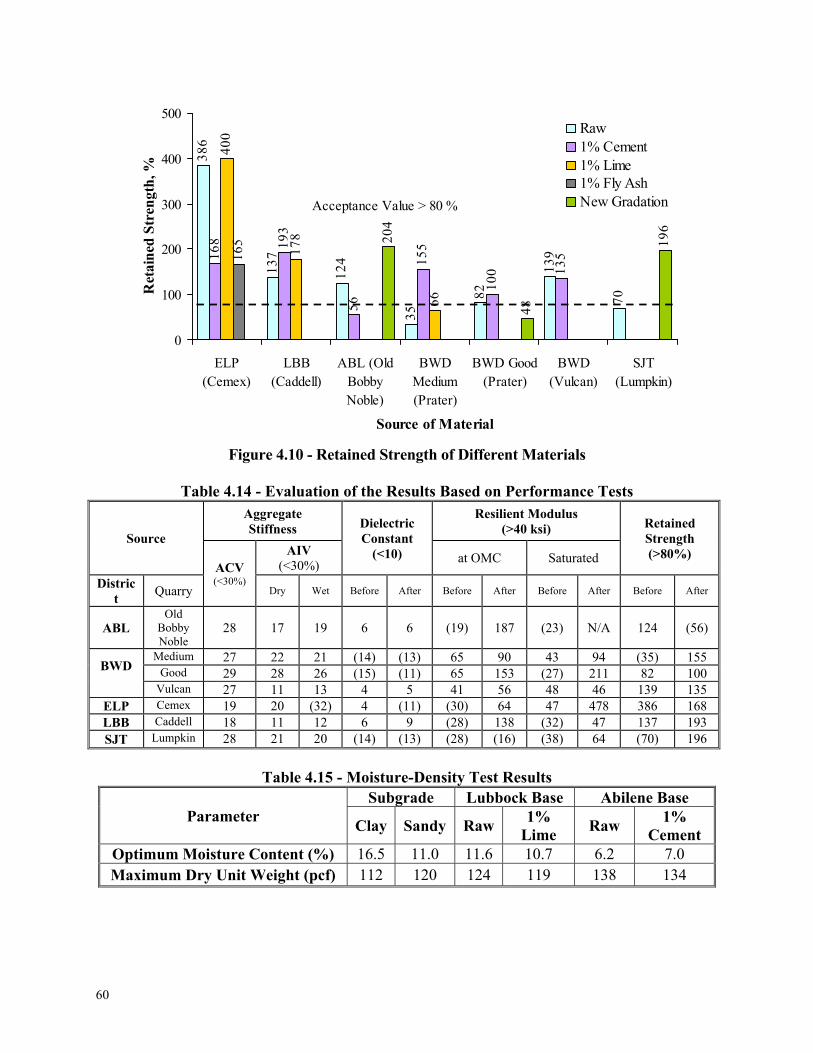
60
Figure 4.10 - Retained Strength of Different Materials
Table 4.14 - Evaluation of the Results Based on Performance Tests
Source
Aggregate Stiffness Dielectric
Constant (<10)
Resilient Modulus (>40 ksi) Retained
Strength (>80%)
ACV (<30%)
AIV (<30%)
at OMC Saturated
District
Quarry Dry Wet Before After Before After Before After Before After
ABL Old
Bobby Noble
28 17 19 6 6 (19) 187 (23) N/A 124 (56)
BWD
Medium 27 22 21 (14) (13) 65 90 43 94 (35) 155 Good 29 28 26 (15) (11) 65 153 (27) 211 82 100
Vulcan 27 11 13 4 5 41 56 48 46 139 135 ELP Cemex 19 20 (32) 4 (11) (30) 64 47 478 386 168 LBB Caddell 18 11 12 6 9 (28) 138 (32) 47 137 193 SJT Lumpkin 28 21 20 (14) (13) (28) (16) (38) 64 (70) 196
Table 4.15 - Moisture-Density Test Results
Parameter Subgrade Lubbock Base Abilene Base
Clay Sandy Raw 1%
Lime Raw
1% Cement
Optimum Moisture Content (%) 16.5 11.0 11.6 10.7 6.2 7.0 Maximum Dry Unit Weight (pcf) 112 120 124 119 138 134
386
137
124
35
82
139
70
168 19
3
56
155
100 13
5
400
178
66
165 20
4
48
196
0
100
200
300
400
500
ELP(Cemex)
LBB(Caddell)
ABL (OldBobbyNoble)
BWDMedium(Prater)
BWD Good(Prater)
BWD(Vulcan)
SJT(Lumpkin)
Source of Material
Ret
ain
ed S
tren
gth
, %Raw1% Cement1% Lime1% Fly AshNew GradationAcceptance Value > 80 %
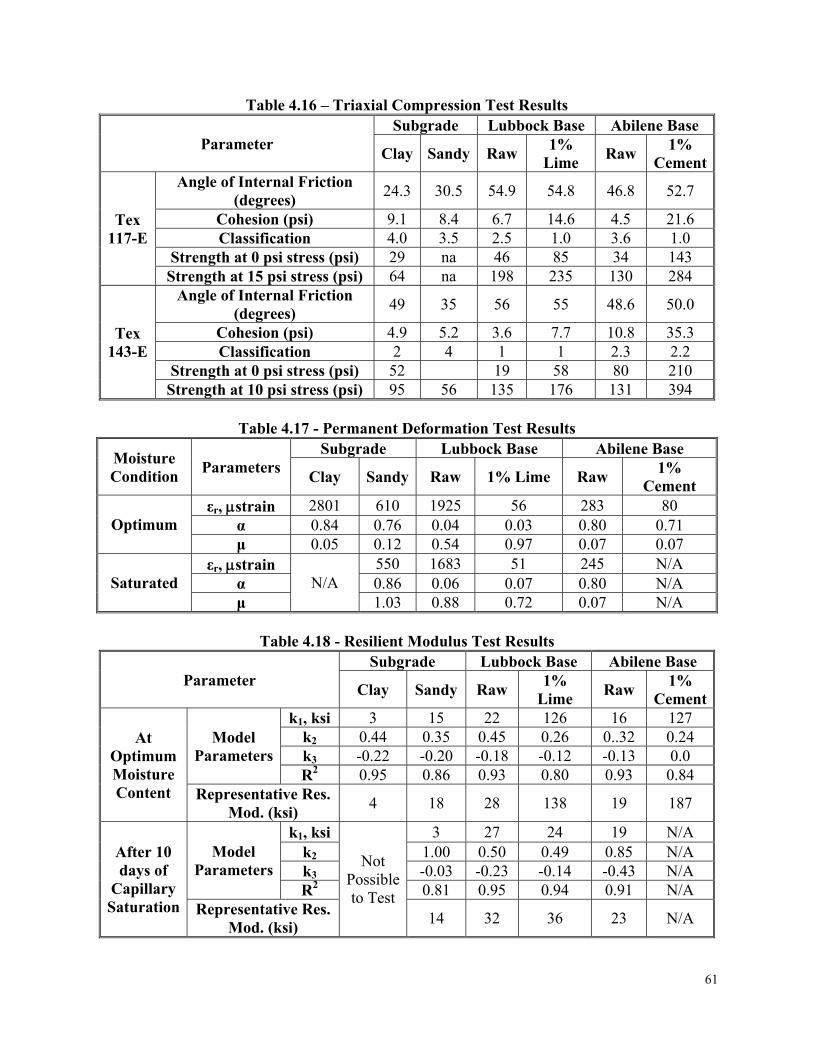
61
Table 4.16 – Triaxial Compression Test Results
Parameter Subgrade Lubbock Base Abilene Base
Clay Sandy Raw 1%
Lime Raw
1% Cement
Tex 117-E
Angle of Internal Friction (degrees)
24.3 30.5 54.9 54.8 46.8 52.7
Cohesion (psi) 9.1 8.4 6.7 14.6 4.5 21.6 Classification 4.0 3.5 2.5 1.0 3.6 1.0
Strength at 0 psi stress (psi) 29 na 46 85 34 143 Strength at 15 psi stress (psi) 64 na 198 235 130 284
Tex 143-E
Angle of Internal Friction (degrees)
49 35 56 55 48.6 50.0
Cohesion (psi) 4.9 5.2 3.6 7.7 10.8 35.3 Classification 2 4 1 1 2.3 2.2
Strength at 0 psi stress (psi) 52 19 58 80 210 Strength at 10 psi stress (psi) 95 56 135 176 131 394
Table 4.17 - Permanent Deformation Test Results
Moisture Condition
Parameters Subgrade Lubbock Base Abilene Base
Clay Sandy Raw 1% Lime Raw 1%
Cement
Optimum εr, strain 2801 610 1925 56 283 80
α 0.84 0.76 0.04 0.03 0.80 0.71 μ 0.05 0.12 0.54 0.97 0.07 0.07
Saturated εr, strain
N/A 550 1683 51 245 N/A
α 0.86 0.06 0.07 0.80 N/A μ 1.03 0.88 0.72 0.07 N/A
Table 4.18 - Resilient Modulus Test Results
Parameter Subgrade Lubbock Base Abilene Base
Clay Sandy Raw 1%
Lime Raw
1% Cement
At Optimum Moisture Content
Model Parameters
k1, ksi 3 15 22 126 16 127 k2 0.44 0.35 0.45 0.26 0..32 0.24 k3 -0.22 -0.20 -0.18 -0.12 -0.13 0.0 R2 0.95 0.86 0.93 0.80 0.93 0.84
Representative Res. Mod. (ksi)
4 18 28 138 19 187
After 10 days of
Capillary Saturation
Model Parameters
k1, ksi
Not Possible to Test
3 27 24 19 N/A k2 1.00 0.50 0.49 0.85 N/A k3 -0.03 -0.23 -0.14 -0.43 N/A R2 0.81 0.95 0.94 0.91 N/A
Representative Res. Mod. (ksi)
14 32 36 23 N/A
62
The results from modulus tests on the base layer of each small-scale specimen are summarized in Tables 4.19 and 4.20. These results indicate that the bases treated with 1% lime or 1% cement are significantly stiffer than in its virgin state, which is consistent with the results from the laboratory tests. As an example, the load-deflection curves from the three moisture conditions for specimens of Lubbock base material are summarized in Figure 4.11. Assuming that 100 mils of deformation correspond to failure, the loads at failure are summarized in Table 4.21. Under the optimum moisture condition, the base stabilized with 1% lime carried substantially more load as compared to the base without stabilization. This pattern was also observed for the other two moisture conditions. Permanent deformations from the small-scale tests are included in Table 4.22. The permanent deformation or resilient deformation (rutting) after 200 cycles of loading is substantially less for the base treated either with 1% lime or with 1% cement under the optimum condition. Under the subgrade-saturated condition, the specimens on sandy subgrade performed better. Again, the resilient deformations are less for the treated bases. When both the base and subgrade became moist, the resilient deformations are much higher than the optimum condition for all cases. However, for the lime-treated samples, the resilient deformations are less than 100 mils. Based on this study, it can be concluded that the results from the small-scale tests are reflective of the performance of the bases in the condition similar to that in the field, and that the treatment of a local base material with small amount additive will provide a better-performing pavement.
Table 4.19 – PSPA Test Results
Status
Modulus, ksi
Lubbock Abilene
Raw 1% Lime Raw 1% Cement
Sandy
SG Clay SG
Sandy SG
Clay SG
Sandy SG
Clay SG
Sandy SG
Clay SG
Optimum 75 81 120 155 93 100 240 419 SG Saturated 56 67 104 108 89 56 175 286
Base Saturated 44 36 75 86 45 NA 135 243
Table 4.20 - DCP Test Results
Status Modulus, ksi
Lubbock Abilene Raw 1% Lime Raw 1% Cement
Sandy
SG Clay SG
Sandy SG
Clay SG
Sandy SG
Clay SG
Sandy SG
Clay SG
Optimum 11 15 22 23 16 22 30 38 SG Saturated 12 14 23 22 10 22 21 41
Base Saturated 14 11 19 19 7 8 18 26
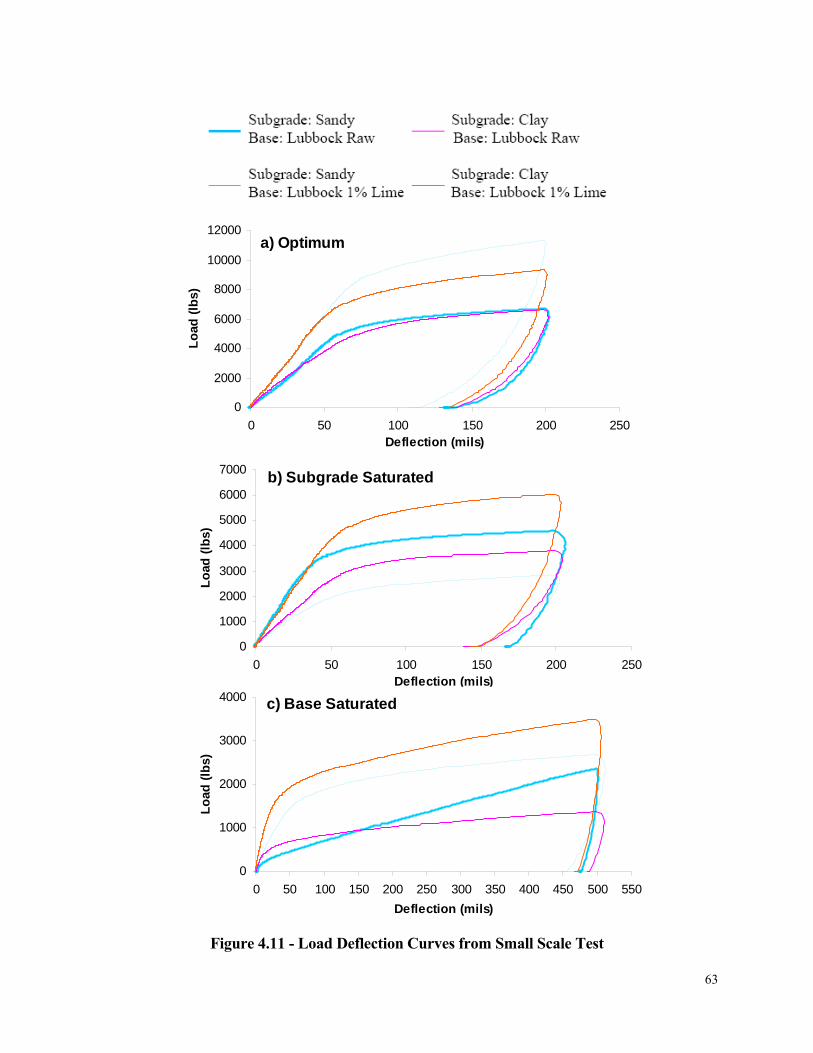
63
b) Subgrade Saturated
0
1000
2000
3000
4000
5000
6000
7000
0 50 100 150 200 250Deflection (mils)
Lo
ad (
lbs)
c) Base Saturated
0
1000
2000
3000
4000
0 50 100 150 200 250 300 350 400 450 500 550
Deflection (mils)
Lo
ad (
lbs)
Figure 4.11 - Load Deflection Curves from Small Scale Test
a) Optimum
0
2000
4000
6000
8000
10000
12000
0 50 100 150 200 250Deflection (mils)
Lo
ad (
lbs)
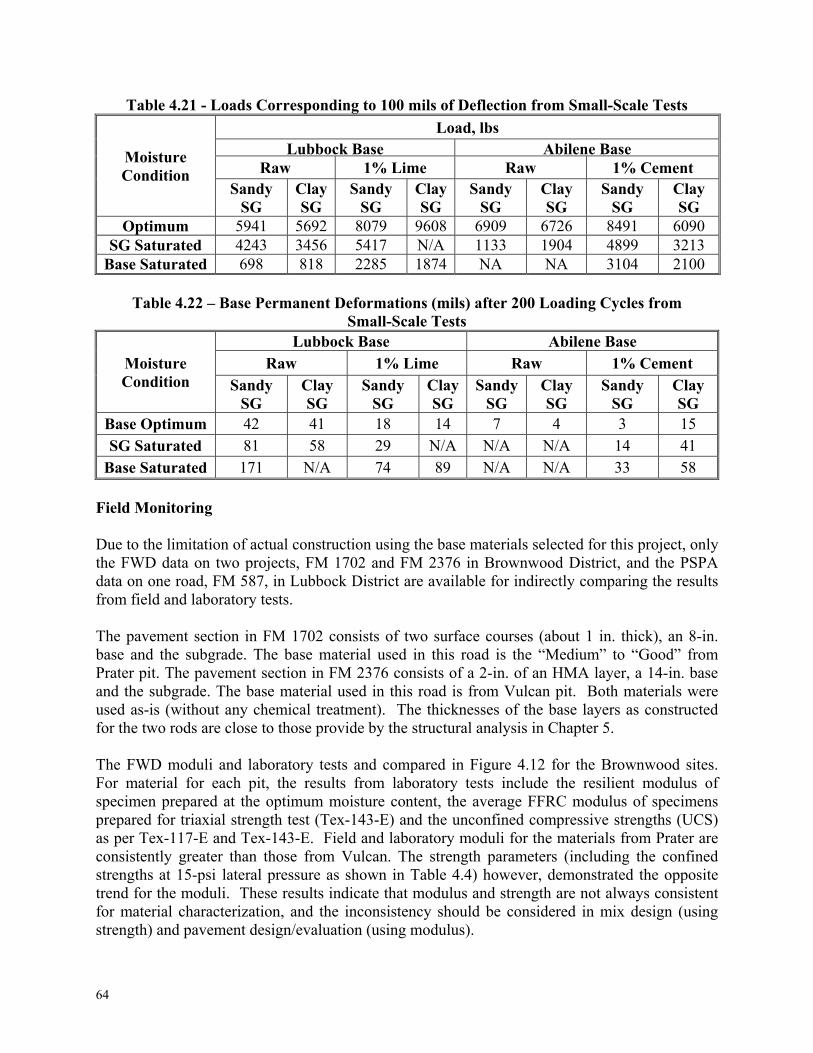
64
Table 4.21 - Loads Corresponding to 100 mils of Deflection from Small-Scale Tests
Moisture Condition
Load, lbs Lubbock Base Abilene Base
Raw 1% Lime Raw 1% Cement Sandy
SG ClaySG
Sandy SG
Clay SG
Sandy SG
Clay SG
Sandy SG
Clay SG
Optimum 5941 5692 8079 9608 6909 6726 8491 6090 SG Saturated 4243 3456 5417 N/A 1133 1904 4899 3213
Base Saturated 698 818 2285 1874 NA NA 3104 2100
Table 4.22 – Base Permanent Deformations (mils) after 200 Loading Cycles from Small-Scale Tests
Moisture Condition
Lubbock Base Abilene Base Raw 1% Lime Raw 1% Cement
Sandy SG
Clay SG
Sandy SG
Clay SG
Sandy SG
Clay SG
Sandy SG
Clay SG
Base Optimum 42 41 18 14 7 4 3 15 SG Saturated 81 58 29 N/A N/A N/A 14 41
Base Saturated 171 N/A 74 89 N/A N/A 33 58 Field Monitoring Due to the limitation of actual construction using the base materials selected for this project, only the FWD data on two projects, FM 1702 and FM 2376 in Brownwood District, and the PSPA data on one road, FM 587, in Lubbock District are available for indirectly comparing the results from field and laboratory tests. The pavement section in FM 1702 consists of two surface courses (about 1 in. thick), an 8-in. base and the subgrade. The base material used in this road is the “Medium” to “Good” from Prater pit. The pavement section in FM 2376 consists of a 2-in. of an HMA layer, a 14-in. base and the subgrade. The base material used in this road is from Vulcan pit. Both materials were used as-is (without any chemical treatment). The thicknesses of the base layers as constructed for the two rods are close to those provide by the structural analysis in Chapter 5. The FWD moduli and laboratory tests and compared in Figure 4.12 for the Brownwood sites. For material for each pit, the results from laboratory tests include the resilient modulus of specimen prepared at the optimum moisture content, the average FFRC modulus of specimens prepared for triaxial strength test (Tex-143-E) and the unconfined compressive strengths (UCS) as per Tex-117-E and Tex-143-E. Field and laboratory moduli for the materials from Prater are consistently greater than those from Vulcan. The strength parameters (including the confined strengths at 15-psi lateral pressure as shown in Table 4.4) however, demonstrated the opposite trend for the moduli. These results indicate that modulus and strength are not always consistent for material characterization, and the inconsistency should be considered in mix design (using strength) and pavement design/evaluation (using modulus).
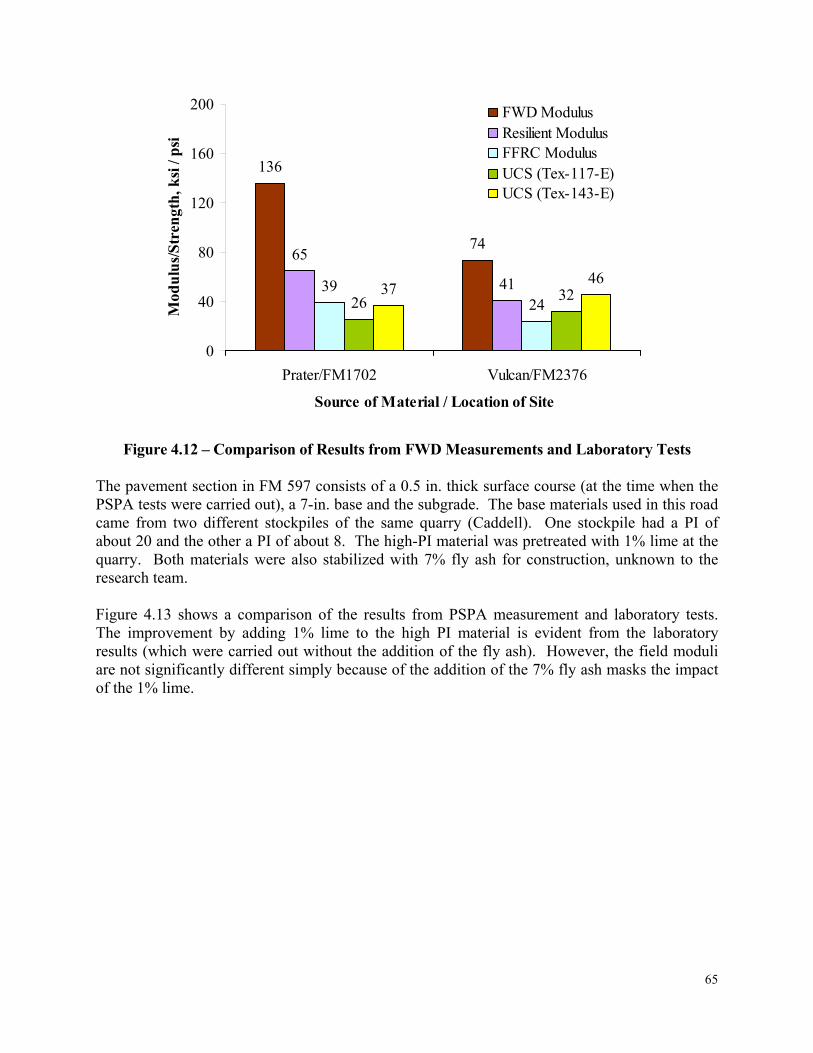
65
Figure 4.12 – Comparison of Results from FWD Measurements and Laboratory Tests
The pavement section in FM 597 consists of a 0.5 in. thick surface course (at the time when the PSPA tests were carried out), a 7-in. base and the subgrade. The base materials used in this road came from two different stockpiles of the same quarry (Caddell). One stockpile had a PI of about 20 and the other a PI of about 8. The high-PI material was pretreated with 1% lime at the quarry. Both materials were also stabilized with 7% fly ash for construction, unknown to the research team. Figure 4.13 shows a comparison of the results from PSPA measurement and laboratory tests. The improvement by adding 1% lime to the high PI material is evident from the laboratory results (which were carried out without the addition of the fly ash). However, the field moduli are not significantly different simply because of the addition of the 7% fly ash masks the impact of the 1% lime.
136
7465
41392426 3237
46
0
40
80
120
160
200
Prater/FM1702 Vulcan/FM2376
Source of Material / Location of Site
Mod
ulu
s/S
tren
gth
, ksi
/ p
si
FWD ModulusResilient ModulusFFRC ModulusUCS (Tex-117-E)UCS (Tex-143-E)
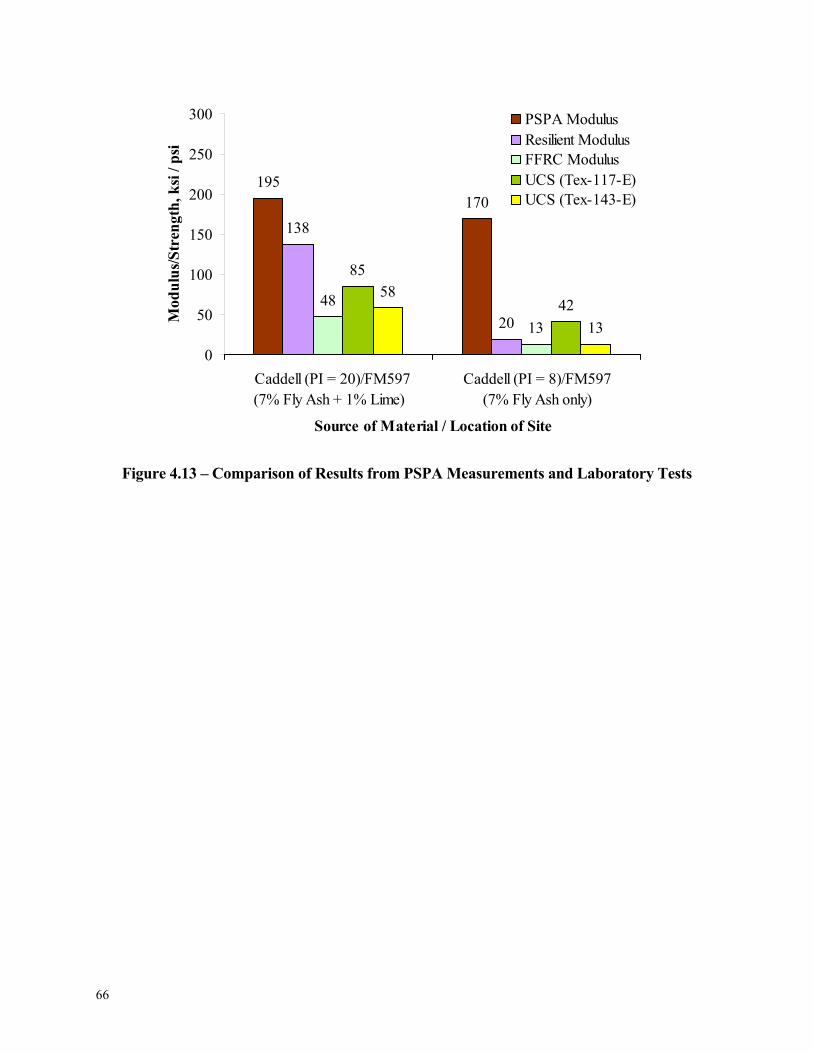
66
Figure 4.13 – Comparison of Results from PSPA Measurements and Laboratory Tests
195170
138
20
48
13
85
4258
13
0
50
100
150
200
250
300
Caddell (PI = 20)/FM597 (7% Fly Ash + 1% Lime)
Caddell (PI = 8)/FM597 (7% Fly Ash only)
Source of Material / Location of Site
Mod
ulu
s/S
tren
gth
, ksi
/ p
si
PSPA ModulusResilient ModulusFFRC ModulusUCS (Tex-117-E)UCS (Tex-143-E)
67
Chapter 5 Structural Analysis and Cost Evaluation Introduction
The purpose of a pavement is to carry traffic safely, conveniently and economically over its design life. The pavement must have adequate thickness to ensure that the stresses and strains due to traffic loads at all levels in the pavement and subgrade are within acceptable limits. Aside from the structural adequacy, the economical feasibility of a given project is also very important. In the context of pavement design, structural adequacy and economic feasibility should be considered. For structural analysis, a sensitivity study was conducted to identify the parameters that impact the pavement performance the most. Since the major structural distress in low-volume roads is rutting, this type of distress is emphasized in this study. Also the equivalent thicknesses of two sets of base layers, one with high-quality material and the other one with local low-quality material, were determined to evaluate the costs between the two alternatives. Finally, the feasibility of using the lower-quality local materials as a subbase was explored. Structural Analysis Figure 5.1 shows the critical stresses and strains that are used to quantify the fatigue cracking of the surface layer and the rutting of subgrade. In most classical structural design programs (such as FPS19 or Texas Triaxial), the design thicknesses of the layers are directly or indirectly estimated based on the criteria that the stresses at the interfaces between the surface layer and base and between the base and subgrade are low enough so that the cracking of the surface layer and rutting of the subgrade will not be an issue. For a given traffic condition, the thicker the layers overlying the base, the thicker the base layer and the stiffer the subgrade are, the lower the classical critical stresses and strains will be. With these design algorithms, the rutting of subgrade can be controlled by replacing a good quality base with a thicker low-quality base.
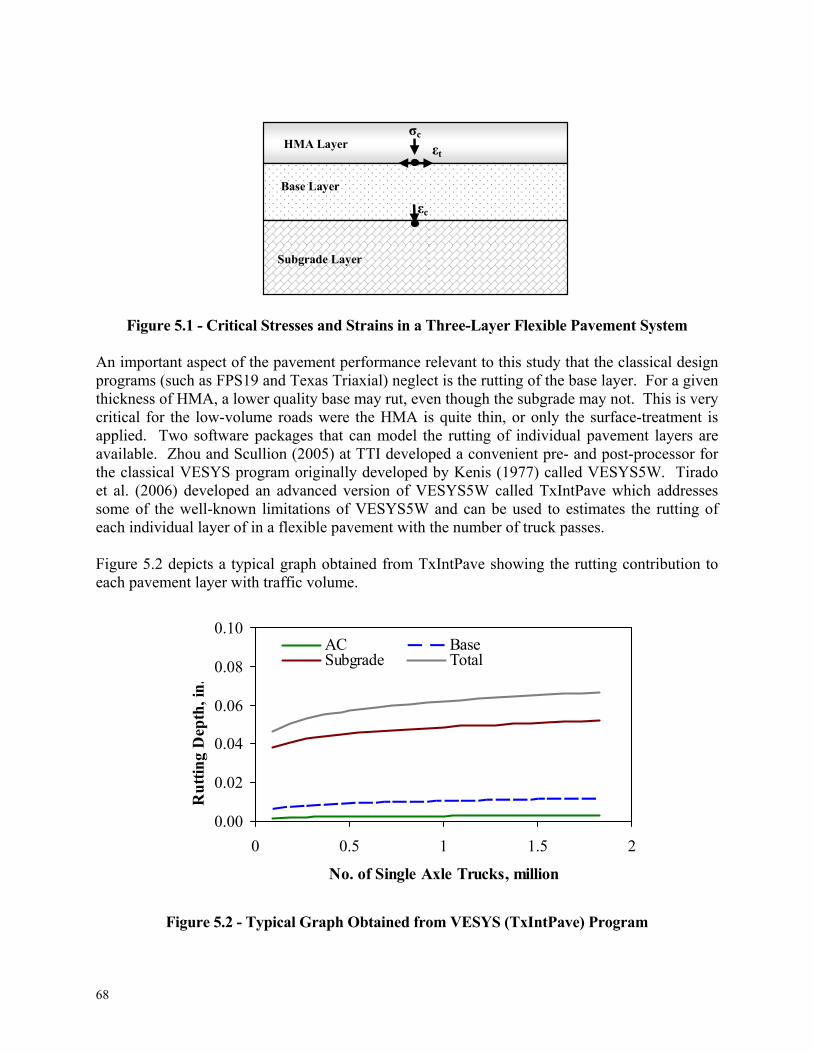
68
εt
εc
HMA Layer
Base Layer
Subgrade Layer
σc
0.00
0.02
0.04
0.06
0.08
0.10
0 0.5 1 1.5 2
No. of Single Axle Trucks, million
Ru
ttin
g D
epth
, in
.
AC BaseSubgrade Total
Figure 5.1 - Critical Stresses and Strains in a Three-Layer Flexible Pavement System
An important aspect of the pavement performance relevant to this study that the classical design programs (such as FPS19 and Texas Triaxial) neglect is the rutting of the base layer. For a given thickness of HMA, a lower quality base may rut, even though the subgrade may not. This is very critical for the low-volume roads were the HMA is quite thin, or only the surface-treatment is applied. Two software packages that can model the rutting of individual pavement layers are available. Zhou and Scullion (2005) at TTI developed a convenient pre- and post-processor for the classical VESYS program originally developed by Kenis (1977) called VESYS5W. Tirado et al. (2006) developed an advanced version of VESYS5W called TxIntPave which addresses some of the well-known limitations of VESYS5W and can be used to estimates the rutting of each individual layer of in a flexible pavement with the number of truck passes. Figure 5.2 depicts a typical graph obtained from TxIntPave showing the rutting contribution to each pavement layer with traffic volume.
Figure 5.2 - Typical Graph Obtained from VESYS (TxIntPave) Program

69
The parameters of interest in TxIntPave for base layer are modulus parameters (k1, k2 and k3) that can be obtained from resilient modulus test, and permanent deformation parameters α and μ (see Equations 3.3 and 3.5). Other parameters influencing the rutting of pavement structure are the thicknesses of surface layer (seal coat or HMA) and base layer and the modulus of the subgrade. Sensitivity Analysis An extensive sensitivity analysis was carried out to understand which parameters contribute the most to the rutting of the base layer. The pavement related parameters used in the sensitivity study are summarized in Tables 5.1 and 5.2. For each parameter a range and a baseline value are assigned. The baseline values are considered as “typical” for Texas. The range covers the possible values that should be expected for corresponding materials. The traffic related parameters used in this analysis are shown in Table 5.3 where the Average Daily Traffic (ADT) is specified as 250 for low volume loads. Two categories of bases are considered: low quality and high quality (meets requirements of TxDOT Item 247 for Grade 1). Similarly, two types of subgrade are considered: weak (most likely to represent the East Texas) and strong (most likely to represent the West Texas).
Table 5.1 - TxIntPave Input Parameters for Base Layer
Parameter Resilient Modulus
Parameters Permanent Deformation
Parameters k1, ksi k2 k3
Range 10 to 50 (Low Quality) 50 to150 (High Quality)
0.1 to 0.5
-0.5 to -0.1
0.5 to 0.9 0.01 to 0.50
Baseline Value
30 (Low Quality) 100 (High Quality)
0.3 -0.3 0.7 0.05
Table 5.2 – Typical Properties of Reference Pavement Layers
Layer Modulus, ksi Poisson’s
Ratio Thickness, in.
Range Baseline Value Range Baseline Value AC 300 0.33 1 to 7 1
Base 30 (low quality), 100 (high quality) 0.35 6 to 18 12
Subgrade 4 to 20 (weak)
10 to 50 (strong) 12 (weak) 30 (strong)
0.35 N/A
Table 5.3 - Traffic Related Parameters
ADT (with 0% growth rate) 250 Tire Configuration Dual
Vehicle Type Single Axle Tire Pressure 70 psi
Axle Type Single 18 k Tire Spacing 13.5 in.
Analysis Period 20 years Tire Radius 4.5 in.
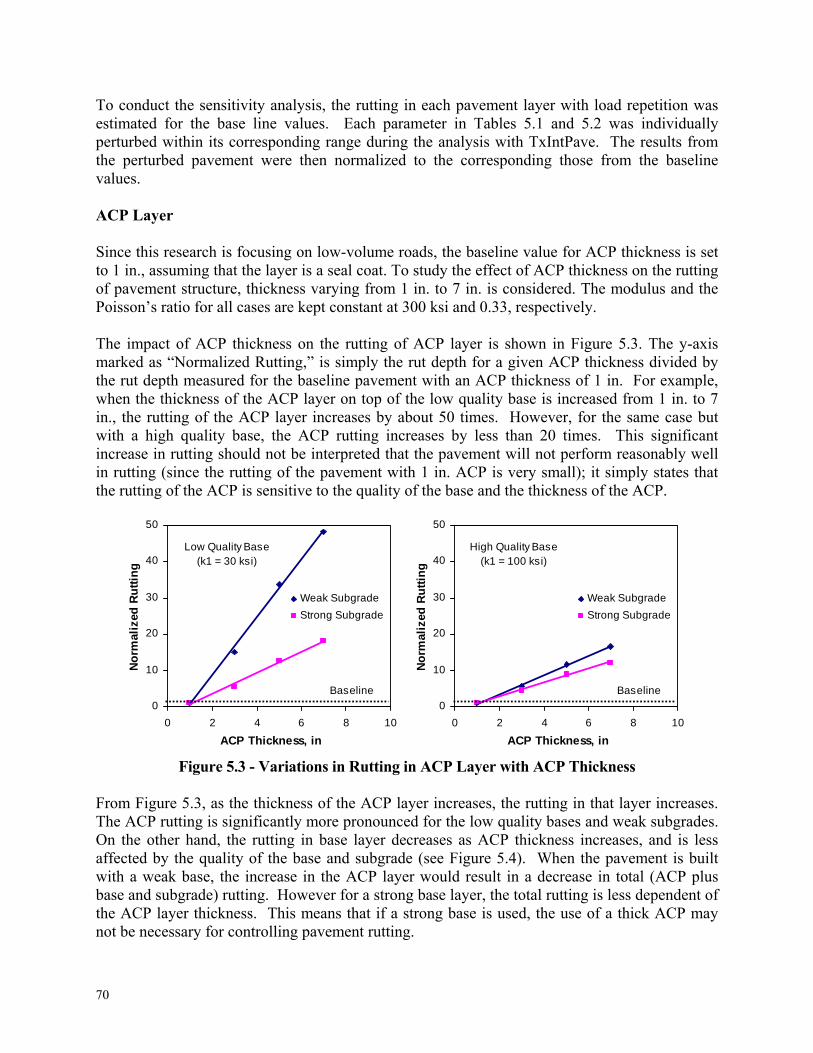
70
To conduct the sensitivity analysis, the rutting in each pavement layer with load repetition was estimated for the base line values. Each parameter in Tables 5.1 and 5.2 was individually perturbed within its corresponding range during the analysis with TxIntPave. The results from the perturbed pavement were then normalized to the corresponding those from the baseline values. ACP Layer Since this research is focusing on low-volume roads, the baseline value for ACP thickness is set to 1 in., assuming that the layer is a seal coat. To study the effect of ACP thickness on the rutting of pavement structure, thickness varying from 1 in. to 7 in. is considered. The modulus and the Poisson’s ratio for all cases are kept constant at 300 ksi and 0.33, respectively. The impact of ACP thickness on the rutting of ACP layer is shown in Figure 5.3. The y-axis marked as “Normalized Rutting,” is simply the rut depth for a given ACP thickness divided by the rut depth measured for the baseline pavement with an ACP thickness of 1 in. For example, when the thickness of the ACP layer on top of the low quality base is increased from 1 in. to 7 in., the rutting of the ACP layer increases by about 50 times. However, for the same case but with a high quality base, the ACP rutting increases by less than 20 times. This significant increase in rutting should not be interpreted that the pavement will not perform reasonably well in rutting (since the rutting of the pavement with 1 in. ACP is very small); it simply states that the rutting of the ACP is sensitive to the quality of the base and the thickness of the ACP.
Figure 5.3 - Variations in Rutting in ACP Layer with ACP Thickness From Figure 5.3, as the thickness of the ACP layer increases, the rutting in that layer increases. The ACP rutting is significantly more pronounced for the low quality bases and weak subgrades. On the other hand, the rutting in base layer decreases as ACP thickness increases, and is less affected by the quality of the base and subgrade (see Figure 5.4). When the pavement is built with a weak base, the increase in the ACP layer would result in a decrease in total (ACP plus base and subgrade) rutting. However for a strong base layer, the total rutting is less dependent of the ACP layer thickness. This means that if a strong base is used, the use of a thick ACP may not be necessary for controlling pavement rutting.
0
10
20
30
40
50
0 2 4 6 8 10
ACP Thickness, in
No
rmal
ized
Ru
ttin
g
Weak Subgrade
Strong Subgrade
Low Quality Base (k1 = 30 ksi)
Baseline
0
10
20
30
40
50
0 2 4 6 8 10
ACP Thickness, in
No
rmal
ized
Ru
ttin
g
Weak Subgrade
Strong Subgrade
High Quality Base (k1 = 100 ksi)
Baseline
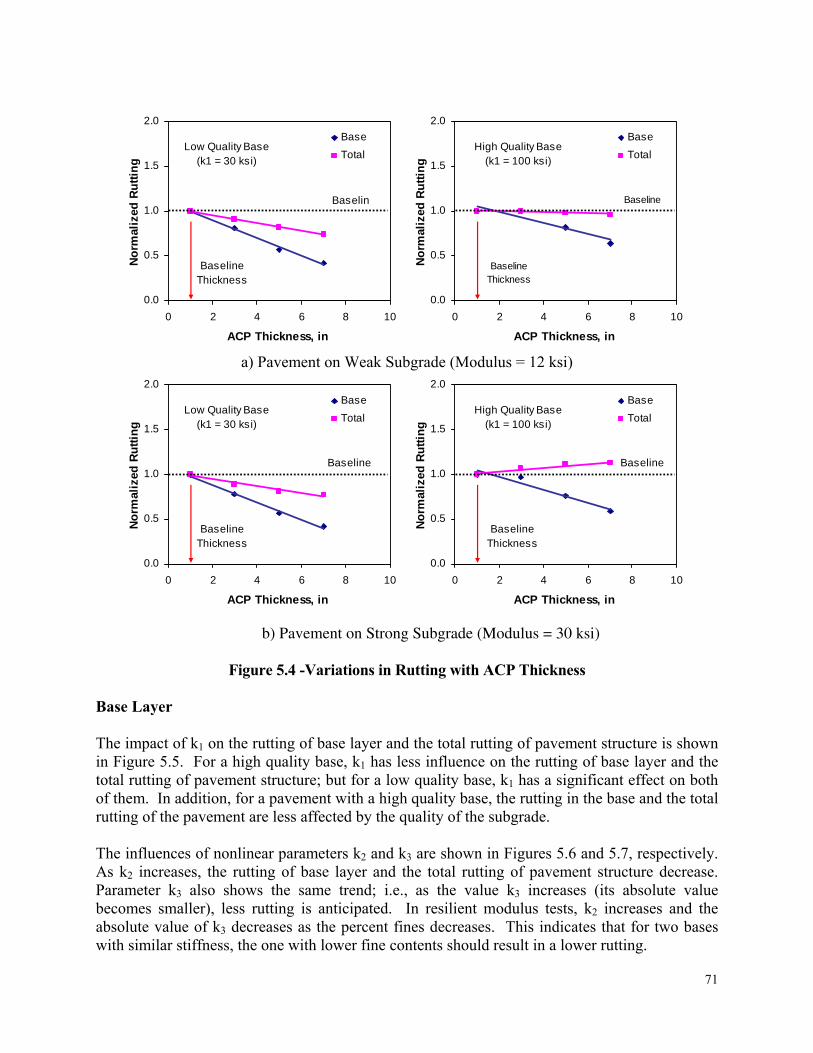
71
a) Pavement on Weak Subgrade (Modulus = 12 ksi)
b) Pavement on Strong Subgrade (Modulus = 30 ksi)
Figure 5.4 -Variations in Rutting with ACP Thickness Base Layer The impact of k1 on the rutting of base layer and the total rutting of pavement structure is shown in Figure 5.5. For a high quality base, k1 has less influence on the rutting of base layer and the total rutting of pavement structure; but for a low quality base, k1 has a significant effect on both of them. In addition, for a pavement with a high quality base, the rutting in the base and the total rutting of the pavement are less affected by the quality of the subgrade. The influences of nonlinear parameters k2 and k3 are shown in Figures 5.6 and 5.7, respectively. As k2 increases, the rutting of base layer and the total rutting of pavement structure decrease. Parameter k3 also shows the same trend; i.e., as the value k3 increases (its absolute value becomes smaller), less rutting is anticipated. In resilient modulus tests, k2 increases and the absolute value of k3 decreases as the percent fines decreases. This indicates that for two bases with similar stiffness, the one with lower fine contents should result in a lower rutting.
0.0
0.5
1.0
1.5
2.0
0 2 4 6 8 10
ACP Thickness, in
No
rmal
ized
Ru
ttin
gBase
TotalLow Quality Base
(k1 = 30 ksi)
Baselin
Baseline Thickness
0.0
0.5
1.0
1.5
2.0
0 2 4 6 8 10
ACP Thickness, in
No
rmal
ized
Ru
ttin
g
Base
TotalHigh Quality Base
(k1 = 100 ksi)
Baseline
Baseline Thickness
0.0
0.5
1.0
1.5
2.0
0 2 4 6 8 10
ACP Thickness, in
No
rmal
ized
Ru
ttin
g
Base
TotalLow Quality Base
(k1 = 30 ksi)
Baseline
Baseline Thickness
0.0
0.5
1.0
1.5
2.0
0 2 4 6 8 10
ACP Thickness, in
No
rmal
ized
Ru
ttin
g
Base
TotalHigh Quality Base
(k1 = 100 ksi)
Baseline
Baseline Thickness
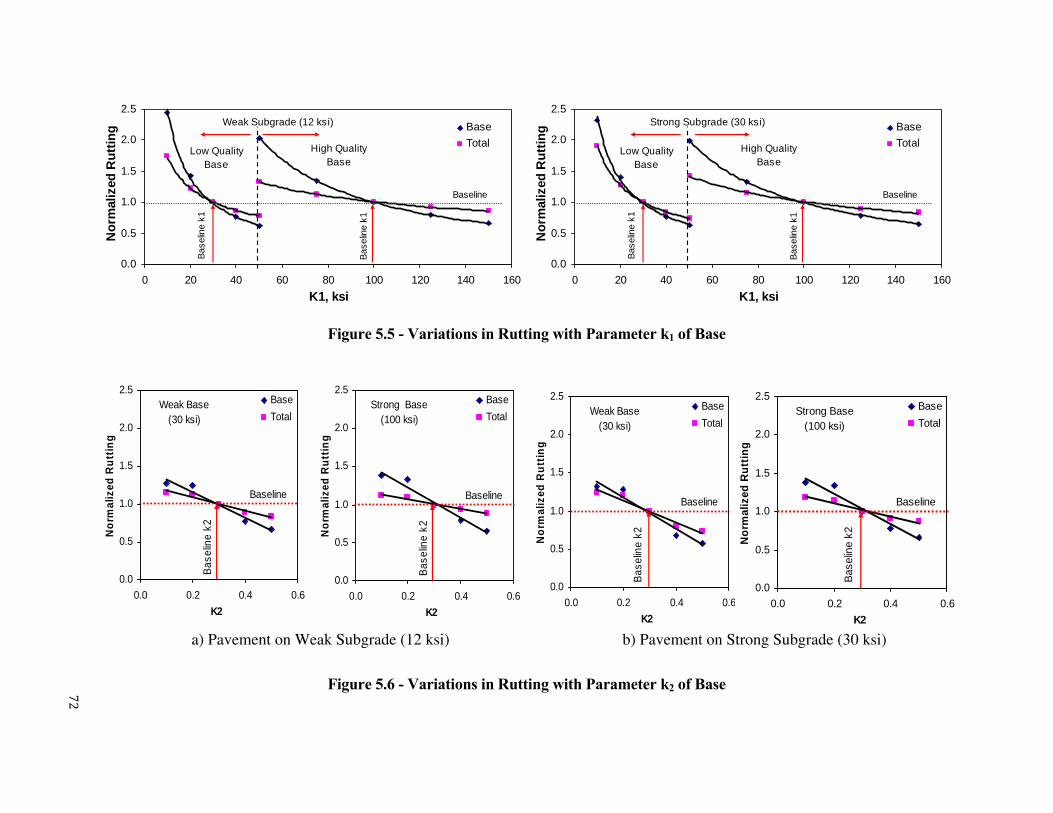
72
0.0
0.5
1.0
1.5
2.0
2.5
0.0 0.2 0.4 0.6
K2
No
rmal
ized
Ru
ttin
g
Base
TotalWeak Base
(30 ksi)
Bas
elin
e k2
Baseline
0.0
0.5
1.0
1.5
2.0
2.5
0.0 0.2 0.4 0.6
K2
No
rmal
ized
Ru
ttin
g
Base
TotalStrong Base
(100 ksi)B
asel
ine
k2
Baseline
0.0
0.5
1.0
1.5
2.0
2.5
0.0 0.2 0.4 0.6
K2
No
rmal
ized
Ru
ttin
g
Base
TotalWeak Base
(30 ksi)
Bas
elin
e k2
Baseline
0.0
0.5
1.0
1.5
2.0
2.5
0.0 0.2 0.4 0.6
K2
No
rmal
ized
Ru
ttin
g
Base
TotalStrong Base
(100 ksi)
Bas
elin
e k2
Baseline
Figure 5.5 - Variations in Rutting with Parameter k1 of Base
a) Pavement on Weak Subgrade (12 ksi) b) Pavement on Strong Subgrade (30 ksi)
Figure 5.6 - Variations in Rutting with Parameter k2 of Base
0.0
0.5
1.0
1.5
2.0
2.5
0 20 40 60 80 100 120 140 160
K1, ksi
No
rmal
ized
Ru
ttin
g Base
Total
Strong Subgrade (30 ksi)
Low Quality Base
High Quality Base
Baseline
Bas
elin
e k1
Bas
elin
e k1
0.0
0.5
1.0
1.5
2.0
2.5
0 20 40 60 80 100 120 140 160
K1, ksi
No
rmal
ized
Ru
ttin
g Base
Total
Weak Subgrade (12 ksi)
Low Quality Base
High Quality Base
BaselineB
asel
ine
k1
Bas
elin
e k1
73
The impacts of μ and α on the rutting of base layer and the total rutting of pavement structure are shown in Figures 5.8 and 5.9, respectively. With the increase in α, the rutting of both, the base layer and the overall pavement structure decreases. Significant increase in rutting is observed when α is lower than 0.7. As μ increases, the rut depth in the base layer and the overall pavement structure increases as well. Significant increase in rutting is observed when μ is greater than 0.1. The impact of base thickness on the rutting of pavement structure is shown in Figure 5.10. For a weak base, increase in base thickness results in more rutting in the base layer as well as the total rutting of pavement structure. On the other hand, for a strong base, increase in base thickness decreases the total rutting of pavement structure. Utilization of Subbase One possible way to utilize the lower quality local materials is to use them as a subbase layer. For simplicity, it is assumed that the base course consists of a 6-in. thick high quality (HQ) layer over a 6-in. thick low quality (LQ) layer and that the values of k1 are 100 ksi for the high quality layer and 30 ksi for the low quality layer. The influences of α and μ on the rutting of the combined base and subbase course are shown in Figures 5.11 and 5.12, respectively. For comparison, the results from analyses on the base course of the same thickness but consisting of low quality material only and high quality material only are also included these two figures. The results shown in Figures 5.11 and 5.12 indicate that the use of a low quality material as the subbase does not result in a significant rutting increase in the entire base course as compared with the rutting for the base course built with a high quality material only. This statement is almost independent of the subgrade modulus. Practically speaking, as long as the top 8 in. to 10 in. of the base is high quality and rut resistant, the reminder of the base thickness is only necessary to control the rutting of subgrade and can be potentially of the lower quality. Even though these results are not verified in this study, a number of cases in TxDOT database of successful pavements points to the same conclusions. Subgrade The impact of subgrade modulus on the rutting of base and overall pavement structure is shown in Figure 5.13. As the modulus of the subgrade increases, the total rutting of the pavement structure decreases. The quality of subgrade has little influence on the rutting of the base layer. But it impacts the total rutting of the pavement structure, mostly due to increase in the subgrade rutting. In general, the conclusions from this sensitivity study can be summarized in Table 5.4:
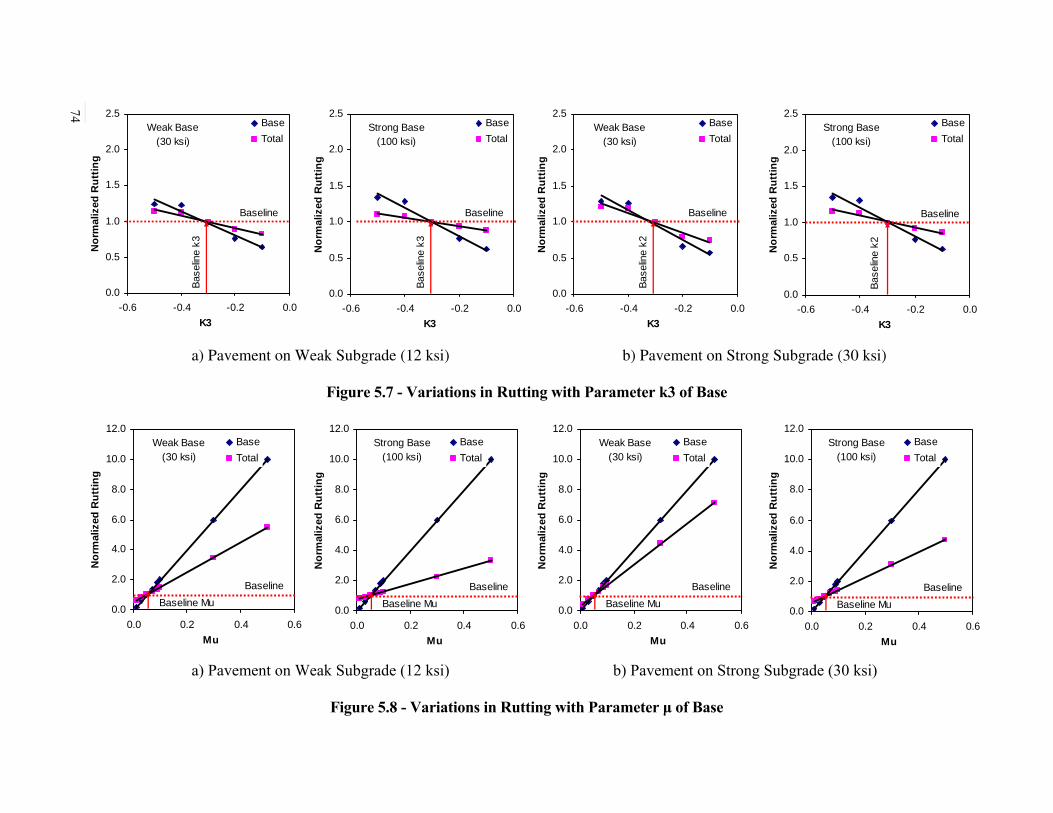
74
0.0
0.5
1.0
1.5
2.0
2.5
-0.6 -0.4 -0.2 0.0
K3
No
rmal
ized
Ru
ttin
g
Base
TotalWeak Base
(30 ksi)
Bas
elin
e k3
Baseline
0.0
0.5
1.0
1.5
2.0
2.5
-0.6 -0.4 -0.2 0.0
K3N
orm
aliz
ed R
utt
ing
Base
TotalStrong Base
(100 ksi)
Bas
elin
e k3
Baseline
0.0
0.5
1.0
1.5
2.0
2.5
-0.6 -0.4 -0.2 0.0
K3
No
rmal
ized
Ru
ttin
g
Base
TotalWeak Base
(30 ksi)
Bas
elin
e k2
Baseline
0.0
0.5
1.0
1.5
2.0
2.5
-0.6 -0.4 -0.2 0.0
K3
No
rmal
ized
Ru
ttin
g
Base
TotalStrong Base
(100 ksi)
Bas
elin
e k2
Baseline
0.0
2.0
4.0
6.0
8.0
10.0
12.0
0.0 0.2 0.4 0.6
Mu
No
rmal
ized
Ru
ttin
g
Base
Total
Weak Base (30 ksi)
Baseline Mu
Baseline
0.0
2.0
4.0
6.0
8.0
10.0
12.0
0.0 0.2 0.4 0.6
Mu
No
rmal
ized
Ru
ttin
g
Base
Total
Strong Base (100 ksi)
Baseline Mu
Baseline
0.0
2.0
4.0
6.0
8.0
10.0
12.0
0.0 0.2 0.4 0.6
Mu
No
rmal
ized
Ru
ttin
g
Base
Total
Weak Base (30 ksi)
Baseline Mu
Baseline
0.0
2.0
4.0
6.0
8.0
10.0
12.0
0.0 0.2 0.4 0.6
Mu
No
rmal
ized
Ru
ttin
g
Base
Total
Strong Base (100 ksi)
Baseline Mu
Baseline
a) Pavement on Weak Subgrade (12 ksi) b) Pavement on Strong Subgrade (30 ksi)
Figure 5.7 - Variations in Rutting with Parameter k3 of Base
a) Pavement on Weak Subgrade (12 ksi) b) Pavement on Strong Subgrade (30 ksi)
Figure 5.8 - Variations in Rutting with Parameter μ of Base
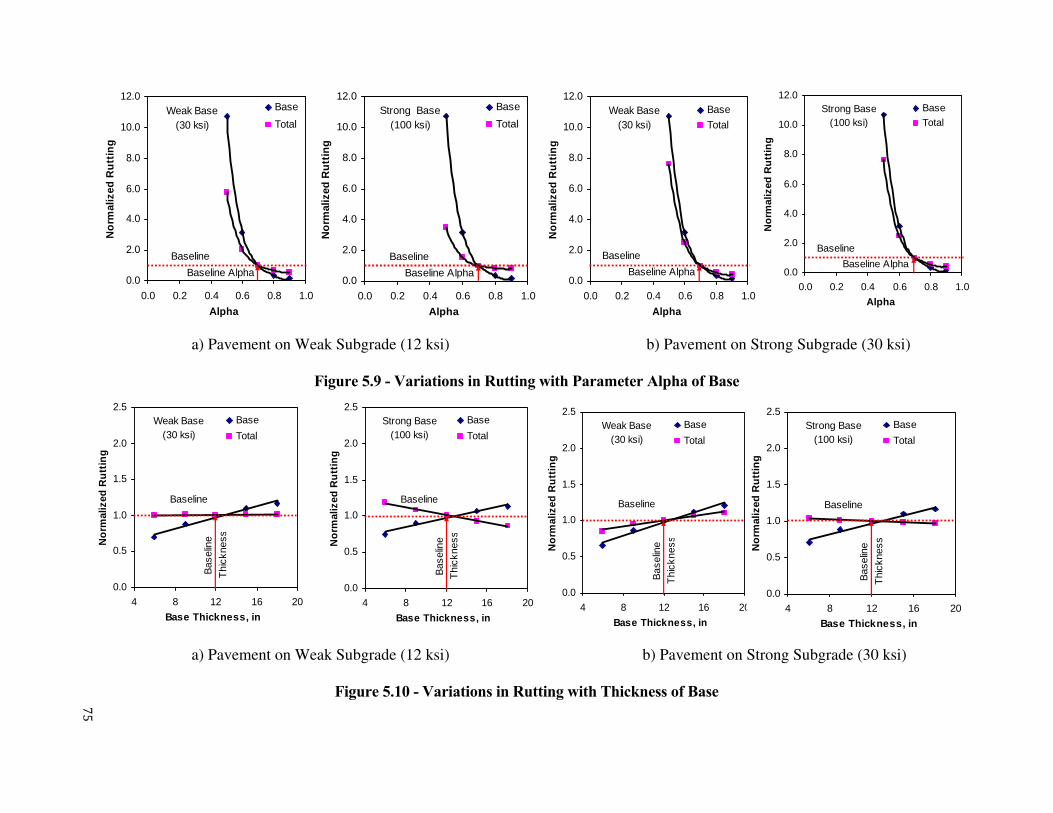
75
0.0
2.0
4.0
6.0
8.0
10.0
12.0
0.0 0.2 0.4 0.6 0.8 1.0
Alpha
No
rmal
ized
Ru
ttin
gBase
TotalWeak Base
(30 ksi)
Baseline Alpha
Baseline
0.0
2.0
4.0
6.0
8.0
10.0
12.0
0.0 0.2 0.4 0.6 0.8 1.0
AlphaN
orm
aliz
ed R
utt
ing
Base
TotalStrong Base
(100 ksi)
Baseline Alpha
Baseline
0.0
2.0
4.0
6.0
8.0
10.0
12.0
0.0 0.2 0.4 0.6 0.8 1.0
Alpha
No
rmal
ized
Ru
ttin
g
Base
TotalWeak Base
(30 ksi)
Baseline Alpha
Baseline
0.0
2.0
4.0
6.0
8.0
10.0
12.0
0.0 0.2 0.4 0.6 0.8 1.0
Alpha
No
rmal
ized
Ru
ttin
g
Base
TotalStrong Base
(100 ksi)
Baseline Alpha
Baseline
0.0
0.5
1.0
1.5
2.0
2.5
4 8 12 16 20
Base Thickness, in
No
rmal
ized
Ru
ttin
g
Base
Total
Weak Base (30 ksi)
Bas
elin
e
Baseline
Thi
ckne
ss
0.0
0.5
1.0
1.5
2.0
2.5
4 8 12 16 20
Base Thickness, in
No
rmal
ized
Ru
ttin
g
Base
Total
Strong Base (100 ksi)
Bas
elin
e
Baseline
Thi
ckne
ss
0.0
0.5
1.0
1.5
2.0
2.5
4 8 12 16 20
Base Thickness, in
No
rmal
ized
Ru
ttin
g
Base
Total
Weak Base (30 ksi)
Bas
elin
e
Baseline
Thi
ckne
ss
0.0
0.5
1.0
1.5
2.0
2.5
4 8 12 16 20
Base Thickness, in
No
rmal
ized
Ru
ttin
g
Base
Total
Strong Base (100 ksi)
Bas
elin
e
Baseline
Thi
ckne
ss
a) Pavement on Weak Subgrade (12 ksi) b) Pavement on Strong Subgrade (30 ksi)
Figure 5.9 - Variations in Rutting with Parameter Alpha of Base
a) Pavement on Weak Subgrade (12 ksi) b) Pavement on Strong Subgrade (30 ksi)
Figure 5.10 - Variations in Rutting with Thickness of Base
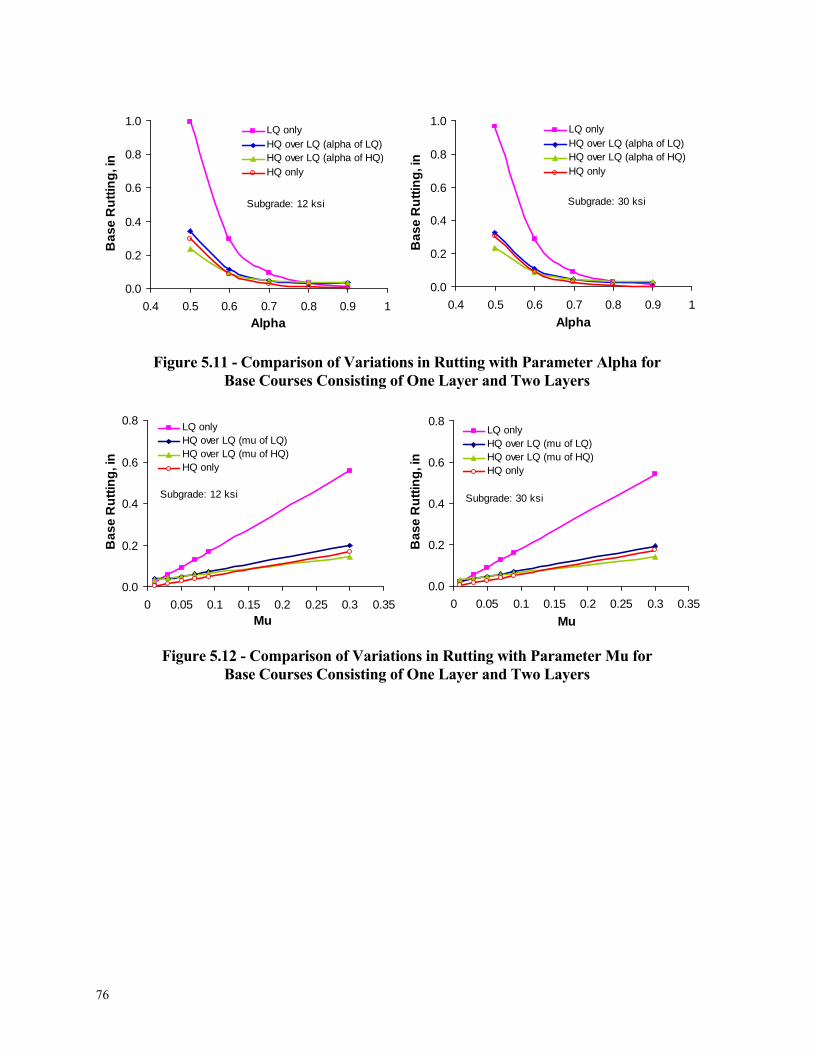
76
Figure 5.11 - Comparison of Variations in Rutting with Parameter Alpha for
Base Courses Consisting of One Layer and Two Layers
Figure 5.12 - Comparison of Variations in Rutting with Parameter Mu for Base Courses Consisting of One Layer and Two Layers
0.0
0.2
0.4
0.6
0.8
1.0
0.4 0.5 0.6 0.7 0.8 0.9 1
Alpha
Ba
se
Ru
ttin
g, i
n
LQ onlyHQ over LQ (alpha of LQ)HQ over LQ (alpha of HQ)HQ only
Subgrade: 12 ksi
0.0
0.2
0.4
0.6
0.8
1.0
0.4 0.5 0.6 0.7 0.8 0.9 1
Alpha
Ba
se
Ru
ttin
g, i
n
LQ onlyHQ over LQ (alpha of LQ)HQ over LQ (alpha of HQ)HQ only
Subgrade: 30 ksi
0.0
0.2
0.4
0.6
0.8
0 0.05 0.1 0.15 0.2 0.25 0.3 0.35Mu
Ba
se
Ru
ttin
g, i
n
LQ onlyHQ over LQ (mu of LQ)HQ over LQ (mu of HQ)HQ only
Subgrade: 12 ksi
0.0
0.2
0.4
0.6
0.8
0 0.05 0.1 0.15 0.2 0.25 0.3 0.35
Mu
Ba
se
Ru
ttin
g, i
nLQ onlyHQ over LQ (mu of LQ)HQ over LQ (mu of HQ)HQ only
Subgrade: 30 ksi
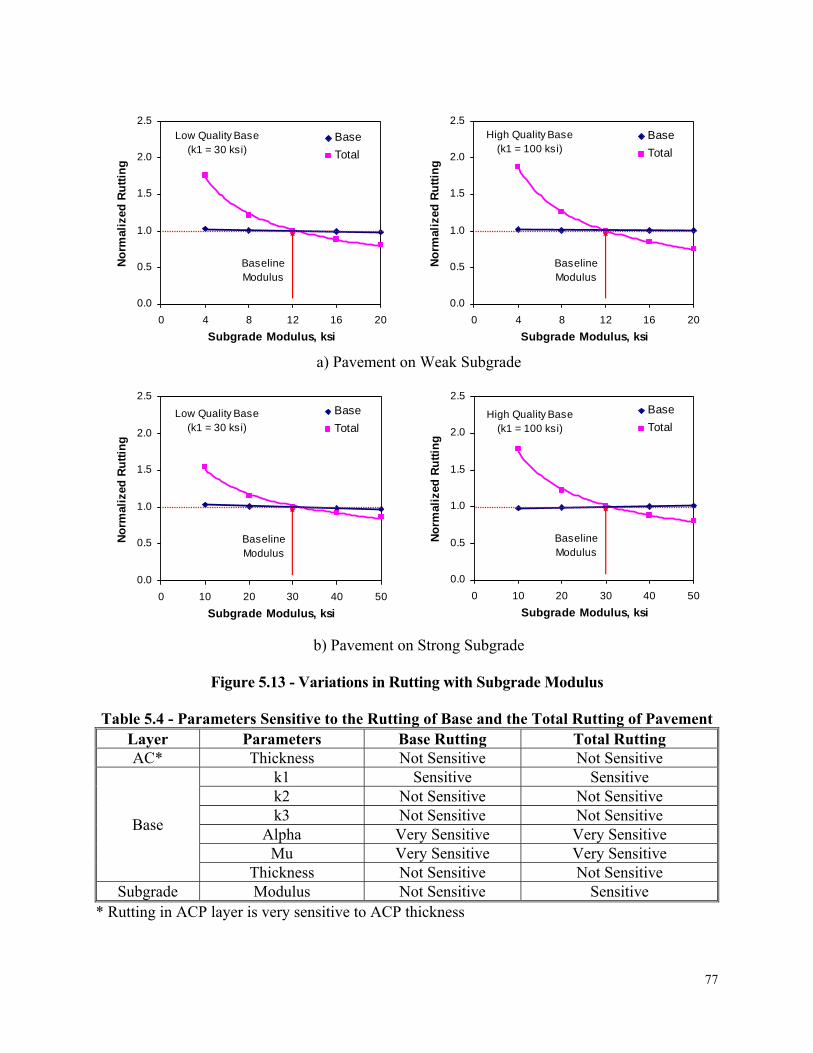
77
a) Pavement on Weak Subgrade
b) Pavement on Strong Subgrade
Figure 5.13 - Variations in Rutting with Subgrade Modulus Table 5.4 - Parameters Sensitive to the Rutting of Base and the Total Rutting of Pavement
Layer Parameters Base Rutting Total Rutting AC* Thickness Not Sensitive Not Sensitive
Base
k1 Sensitive Sensitive k2 Not Sensitive Not Sensitive k3 Not Sensitive Not Sensitive
Alpha Very Sensitive Very Sensitive Mu Very Sensitive Very Sensitive
Thickness Not Sensitive Not Sensitive Subgrade Modulus Not Sensitive Sensitive
* Rutting in ACP layer is very sensitive to ACP thickness
0.0
0.5
1.0
1.5
2.0
2.5
0 4 8 12 16 20
Subgrade Modulus, ksi
No
rmal
ized
Ru
ttin
gBase
Total
Low Quality Base (k1 = 30 ksi)
Baseline Modulus
0.0
0.5
1.0
1.5
2.0
2.5
0 4 8 12 16 20
Subgrade Modulus, ksi
No
rmal
ized
Ru
ttin
g
Base
Total
High Quality Base (k1 = 100 ksi)
Baseline Modulus
0.0
0.5
1.0
1.5
2.0
2.5
0 10 20 30 40 50
Subgrade Modulus, ksi
No
rmal
ized
Ru
ttin
g
Base
TotalLow Quality Base
(k1 = 30 ksi)
Baseline Modulus
0.0
0.5
1.0
1.5
2.0
2.5
0 10 20 30 40 50
Subgrade Modulus, ksi
No
rmal
ized
Ru
ttin
g
Base
TotalHigh Quality Base
(k1 = 100 ksi)
Baseline Modulus
78
Determination of Equivalent Layer Thickness The main principle of structural equivalency is that the pavements constructed with high-quality material and low-quality material should experience the same amount of surface layer fatigue cracking, subgrade rutting as well as experiencing acceptable rutting in the base and pavement structure. The first two modes of failure can be checked using the FPS19. While the rutting of the base and pavement structure can only be checked using VESYS or TxIntPave. The first step in the equivalency analysis is to determine the thickness of base layer when pavement is constructed with high-quality/hauled-in material. FPS19 program can be used for this purpose. The thickness of the base and possibly HMA can be adjusted then to achieve the equivalency in remaining life as discussed below. Fatigue Cracking of HMA In principle for two alternative pavement sections to experience the same amount of fatigue cracking, the tensile strains at the bottoms of their respective HMA layers should be the same (see Figure 5.1). For a low-volume road with surface treatment, the fatigue cracking of the surface layer is not of a concern. However, if an HMA layer greater than 2 in. to 3 in. is considered for the high quality base, the thickness of the HMA has to be increased for the low quality base to achieve equivalency in the relevant tensile strains. A simple software package developed under Project 0-5223 can be used for this purpose. Rutting of Subgrade In principle for two alternative pavement sections to experience the same amount of subgrade rutting, the compressive strains at the top of their respective subgrade layers should be the same (see Figure 5.1). For a low-volume road with surface treatment, this can be achieved by increasing the thickness of the low quality base relative to the high quality base. A more expensive alternative is to increase the thickness of the HMA layer. The same simple software package discussed for fatigue cracking can also be used for subgrade rutting equivalency. Rutting of Base As indicated before, the thickening of the base layer with a low quality material may increase the rutting of the base in particular and the pavement system in general. As such, checking for this problem is crucial. Unfortunately, a simple equivalency relationship between the strains as discussed for the other two modes of failure is not available. Preferably, either VESYS5W or TxIntPave should be used. In the absence of these software packages, an approximate method is recommended to estimate the rutting of the base and the pavement system for roads with very thin HMA or surface treatment. The equation for calculating the accumulated permanent strain of each individual layer, p, after N applications of load can be written as
1
1Nrp (5.1)
79
where r is called the elastic or resilient strain and and are permanent deformation parameters obtained from laboratory tests as discussed in Chapter 3. The resilient strain, for a layered elastic system can be approximated as
rr M
(5.2)
where is the representative vertical compressive stress in the layer and Mr is the representative resilient modulus calculated as discussed in Chapter 3. An extensive parametric study conducted by Gautum (2008) indicates that the most appropriate depth in the base to calculate these two parameters is 7 in. (or the actual thicknesses for bases that are thinner than 7 in.) for base and 12.5 in for subgrade. After the resilient strain for each layer is determined, the rutting in each layer, which is the product of permanent strain (from Equation 5.1) and the actual layer thickness, can be obtained. For estimating the rutting of the subgrade, Gautum (2008) proposes a subgrade thickness of 25 in. The total rutting in a pavement is then determined by summing the rutting of the base and subgrade. As an example, the base rut depths obtained from TxIntPave and the approximate method are compared in Figure 5.14. The results are fairly closed for base thicknesses of greater than 6 in. (up to 18 in.) and for the base moduli ranging from 30 ksi to 70 ksi. For strong base (modulus of 150 ksi), the rutting is under estimated when base thickness is 6 in. or less. Based on this discussion, a flow chart for determining equivalent base thickness is shown in Figure 5.15 with the following criteria:
If the rutting of high-quality material is greater than 0.5 inch, the thickness of base layer for low-quality material is adjusted until the rutting of low-quality material becomes the same or close to the rutting of high-quality material.
If the rutting of high-quality material is less than 0.5 inch, the thickness of base layer for
low-quality is adjusted until the rutting of low-quality material becomes close to 0.5 in.
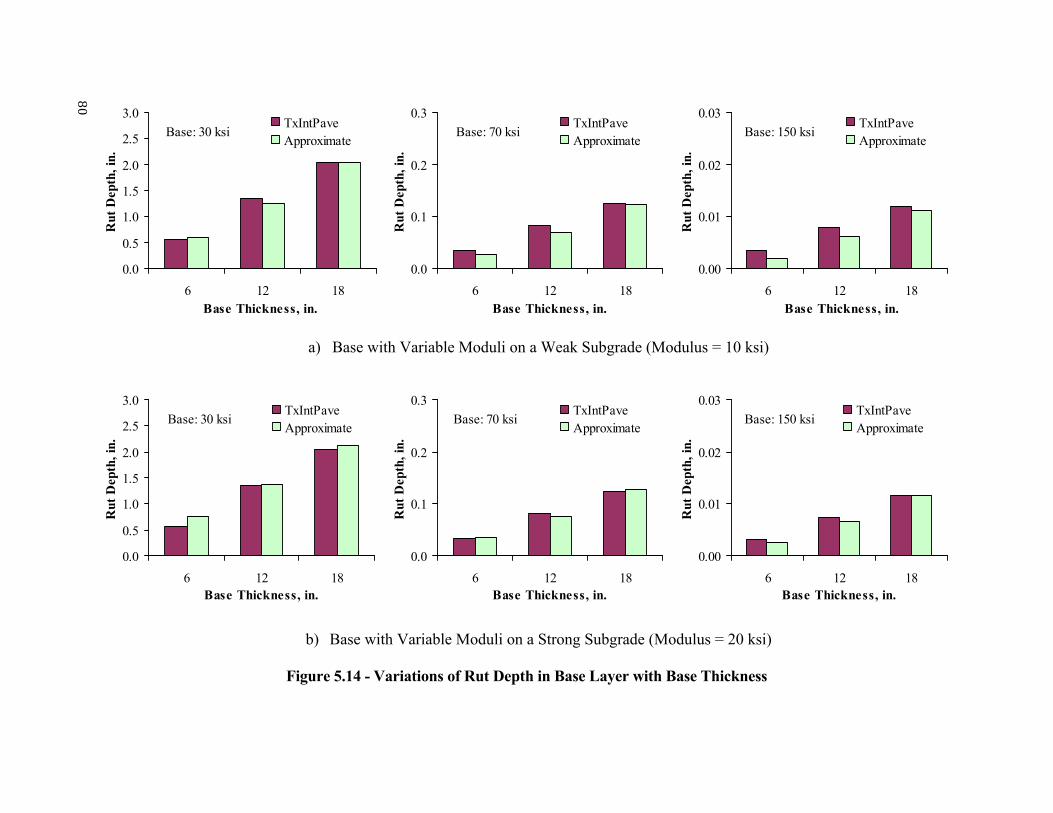
80
a) Base with Variable Moduli on a Weak Subgrade (Modulus = 10 ksi)
b) Base with Variable Moduli on a Strong Subgrade (Modulus = 20 ksi)
Figure 5.14 - Variations of Rut Depth in Base Layer with Base Thickness
0.0
0.5
1.0
1.5
2.0
2.5
3.0
6 12 18Base Thickness, in.
Rut
Dep
th, i
n.TxIntPaveApproximate
Base: 30 ksi
0.0
0.1
0.2
0.3
6 12 18Base Thickness, in.
Rut
Dep
th, i
n.
TxIntPaveApproximate
Base: 70 ksi
0.00
0.01
0.02
0.03
6 12 18Base Thickness, in.
Rut
Dep
th, i
n.
TxIntPaveApproximate
Base: 150 ksi
0.0
0.5
1.0
1.5
2.0
2.5
3.0
6 12 18Base Thickness, in.
Rut
Dep
th, i
n.
TxIntPaveApproximate
Base: 30 ksi
0.0
0.1
0.2
0.3
6 12 18Base Thickness, in.
Rut
Dep
th, i
n.TxIntPaveApproximate
Base: 70 ksi
0.00
0.01
0.02
0.03
6 12 18Base Thickness, in.
Rut
Dep
th, i
n.
TxIntPaveApproximate
Base: 150 ksi

81
No
Yes
Figure 5.15 - Flow Chart for Determining Equivalent Base Thickness
High-quality Low-quality
Obtain base thickness from FPS 19 program
Use the approximate analysis program
Obtain resilient strain (εr1) at 7 in. from the top of base layer if base thickness > 7 in.; otherwise obtain
the strain at the bottom of base layer
Obtain resilient strain (εr2) in the middle of subgrade
Obtain permanent deformation in base layer
Obtain permanent deformation in subgrade
Obtain rutting in AC layer if AC thickness > 2 inches
Assume base thickness
Obtain total rutting for high-quality material (R1) Obtain total rutting for low-quality material (R2)
Is R2 = R1 if R1 > 0.5 in.? or
Is R2 0.5 in. if R1< 0.5 in.?
Obtain base thickness for low-quality material
Base Materials
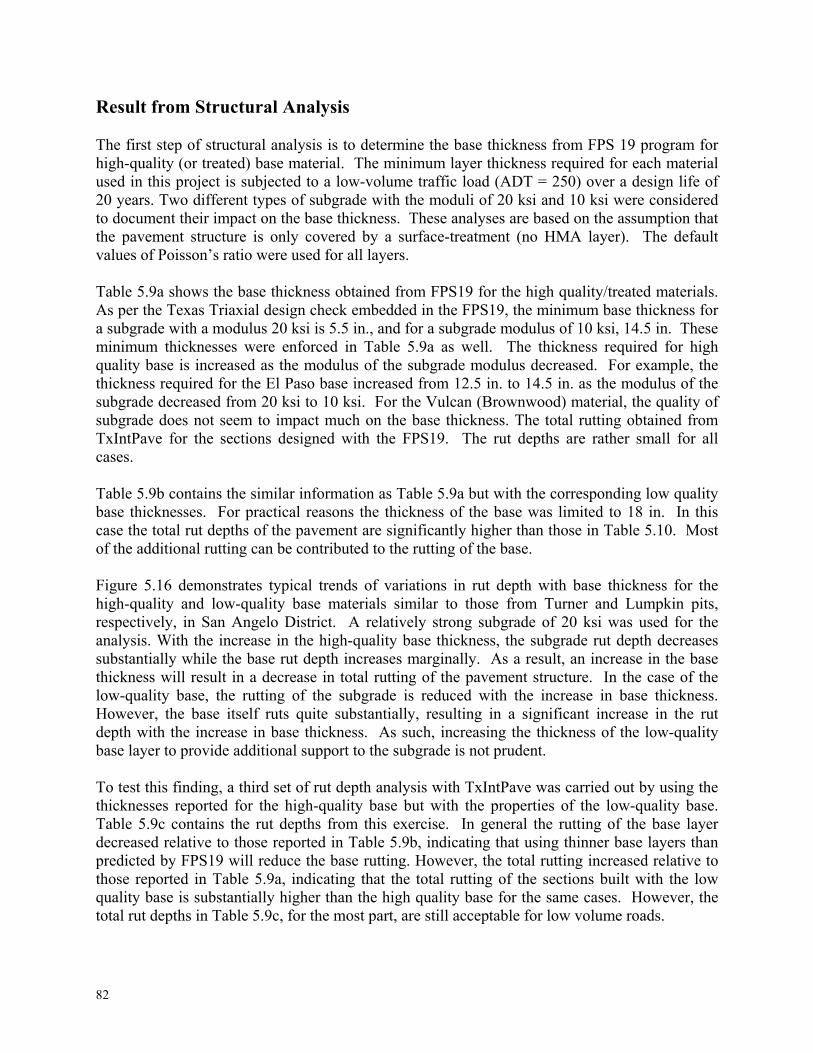
82
Result from Structural Analysis The first step of structural analysis is to determine the base thickness from FPS 19 program for high-quality (or treated) base material. The minimum layer thickness required for each material used in this project is subjected to a low-volume traffic load (ADT = 250) over a design life of 20 years. Two different types of subgrade with the moduli of 20 ksi and 10 ksi were considered to document their impact on the base thickness. These analyses are based on the assumption that the pavement structure is only covered by a surface-treatment (no HMA layer). The default values of Poisson’s ratio were used for all layers. Table 5.9a shows the base thickness obtained from FPS19 for the high quality/treated materials. As per the Texas Triaxial design check embedded in the FPS19, the minimum base thickness for a subgrade with a modulus 20 ksi is 5.5 in., and for a subgrade modulus of 10 ksi, 14.5 in. These minimum thicknesses were enforced in Table 5.9a as well. The thickness required for high quality base is increased as the modulus of the subgrade modulus decreased. For example, the thickness required for the El Paso base increased from 12.5 in. to 14.5 in. as the modulus of the subgrade decreased from 20 ksi to 10 ksi. For the Vulcan (Brownwood) material, the quality of subgrade does not seem to impact much on the base thickness. The total rutting obtained from TxIntPave for the sections designed with the FPS19. The rut depths are rather small for all cases. Table 5.9b contains the similar information as Table 5.9a but with the corresponding low quality base thicknesses. For practical reasons the thickness of the base was limited to 18 in. In this case the total rut depths of the pavement are significantly higher than those in Table 5.10. Most of the additional rutting can be contributed to the rutting of the base. Figure 5.16 demonstrates typical trends of variations in rut depth with base thickness for the high-quality and low-quality base materials similar to those from Turner and Lumpkin pits, respectively, in San Angelo District. A relatively strong subgrade of 20 ksi was used for the analysis. With the increase in the high-quality base thickness, the subgrade rut depth decreases substantially while the base rut depth increases marginally. As a result, an increase in the base thickness will result in a decrease in total rutting of the pavement structure. In the case of the low-quality base, the rutting of the subgrade is reduced with the increase in base thickness. However, the base itself ruts quite substantially, resulting in a significant increase in the rut depth with the increase in base thickness. As such, increasing the thickness of the low-quality base layer to provide additional support to the subgrade is not prudent. To test this finding, a third set of rut depth analysis with TxIntPave was carried out by using the thicknesses reported for the high-quality base but with the properties of the low-quality base. Table 5.9c contains the rut depths from this exercise. In general the rutting of the base layer decreased relative to those reported in Table 5.9b, indicating that using thinner base layers than predicted by FPS19 will reduce the base rutting. However, the total rutting increased relative to those reported in Table 5.9a, indicating that the total rutting of the sections built with the low quality base is substantially higher than the high quality base for the same cases. However, the total rut depths in Table 5.9c, for the most part, are still acceptable for low volume roads.
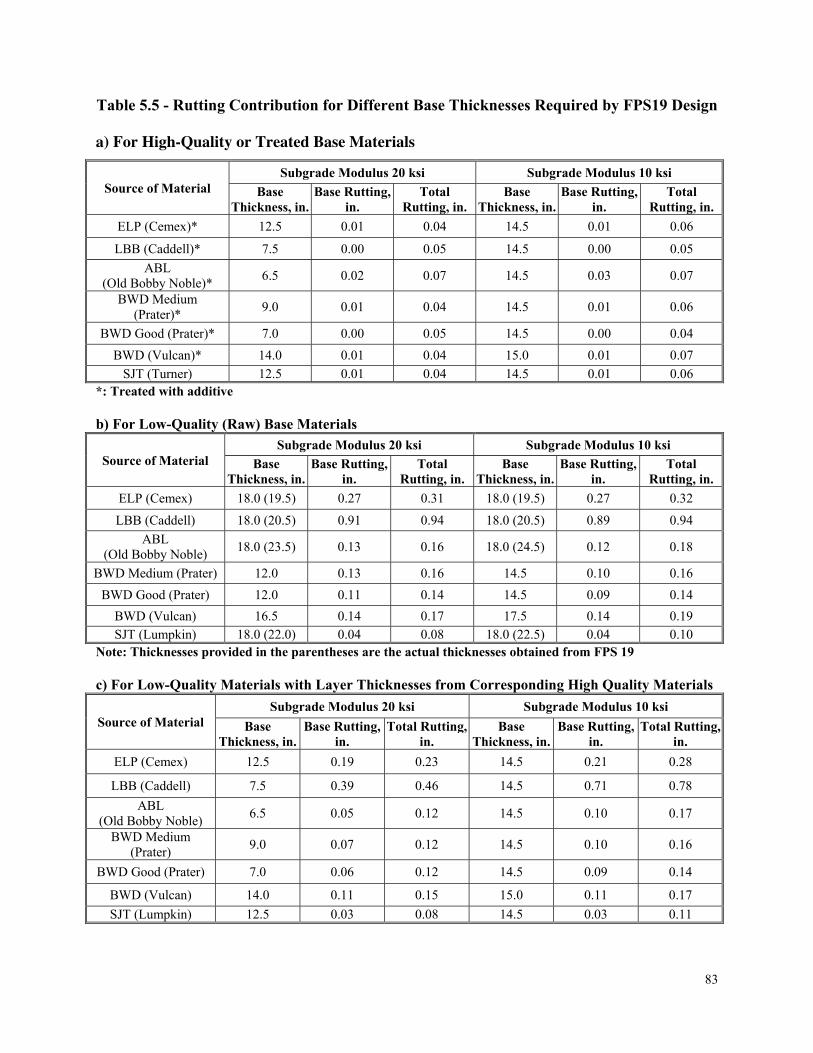
83
Table 5.5 - Rutting Contribution for Different Base Thicknesses Required by FPS19 Design
a) For High-Quality or Treated Base Materials
*: Treated with additive b) For Low-Quality (Raw) Base Materials
Note: Thicknesses provided in the parentheses are the actual thicknesses obtained from FPS 19 c) For Low-Quality Materials with Layer Thicknesses from Corresponding High Quality Materials
Source of Material Subgrade Modulus 20 ksi Subgrade Modulus 10 ksi
Base Thickness, in.
Base Rutting, in.
Total Rutting, in.
Base Thickness, in.
Base Rutting, in.
Total Rutting, in.
ELP (Cemex)* 12.5 0.01 0.04 14.5 0.01 0.06
LBB (Caddell)* 7.5 0.00 0.05 14.5 0.00 0.05
ABL (Old Bobby Noble)*
6.5 0.02 0.07 14.5 0.03 0.07
BWD Medium (Prater)*
9.0 0.01 0.04 14.5 0.01 0.06
BWD Good (Prater)* 7.0 0.00 0.05 14.5 0.00 0.04
BWD (Vulcan)* 14.0 0.01 0.04 15.0 0.01 0.07
SJT (Turner) 12.5 0.01 0.04 14.5 0.01 0.06
Source of Material Subgrade Modulus 20 ksi Subgrade Modulus 10 ksi
Base Thickness, in.
Base Rutting,in.
Total Rutting, in.
Base Thickness, in.
Base Rutting, in.
Total Rutting, in.
ELP (Cemex) 18.0 (19.5) 0.27 0.31 18.0 (19.5) 0.27 0.32
LBB (Caddell) 18.0 (20.5) 0.91 0.94 18.0 (20.5) 0.89 0.94
ABL (Old Bobby Noble)
18.0 (23.5) 0.13 0.16 18.0 (24.5) 0.12 0.18
BWD Medium (Prater) 12.0 0.13 0.16 14.5 0.10 0.16
BWD Good (Prater) 12.0 0.11 0.14 14.5 0.09 0.14
BWD (Vulcan) 16.5 0.14 0.17 17.5 0.14 0.19 SJT (Lumpkin) 18.0 (22.0) 0.04 0.08 18.0 (22.5) 0.04 0.10
Source of Material Subgrade Modulus 20 ksi Subgrade Modulus 10 ksi
Base Thickness, in.
Base Rutting,in.
Total Rutting, in.
Base Thickness, in.
Base Rutting, in.
Total Rutting,in.
ELP (Cemex) 12.5 0.19 0.23 14.5 0.21 0.28
LBB (Caddell) 7.5 0.39 0.46 14.5 0.71 0.78
ABL (Old Bobby Noble)
6.5 0.05 0.12 14.5 0.10 0.17
BWD Medium (Prater)
9.0 0.07 0.12 14.5 0.10 0.16
BWD Good (Prater) 7.0 0.06 0.12 14.5 0.09 0.14
BWD (Vulcan) 14.0 0.11 0.15 15.0 0.11 0.17
SJT (Lumpkin) 12.5 0.03 0.08 14.5 0.03 0.11
84
Figure 5.16 - Typical Trend of Rut Depth for Bases of High and Low Quality Materials
Cost Analysis To better understand the savings between the costs of construction using local materials and hauled-in materials, especially when treatment or modification of gradation is involved, several associated costs such as material cost, construction cost and transportation cost should be considered. Figure 5.17 shows a simple program developed in excel to evaluate the cost of construction using local base material for roadway base and subbase as discussed next. Appendix A contains detailed explanation about this program. Methodology of Cost Analysis The first step in cost analysis is to locate the sources of the high-quality and the low-quality/local base materials. The main consideration in the analysis is that the travel distance to haul in the high-quality base material is farther than the travel distance for the low-quality/local base material. Based on this criterion, it is assumed that the transportation cost for the high-quality base material is more than the transportation cost for the low-quality/local base material. The second step of the analysis consists of estimating the volume of the material that is needed to construct the base knowing the length, width and the thickness of the base layer. The most important parameters in the cost analysis are the cost of material, the cost of construction and the cost of transportation. It is assumed that the material cost of the low-quality/ local base material is lower than the cost of the high-quality/hauled in base material. Since, as discussed in Chapter 4, the low-quality/local base material generally requires treatment to improve its properties, it is assumed that the construction cost of pavements with the low-quality/local base material is higher than the construction cost with the high-quality/hauled-in base material. Finally, with all the parameters mentioned above, the total costs of the high-quality/hauled-in materials and the low-quality/local materials are determined. Based on the total cost, cost saving using the high-quality or low-quality/local base material is analyzed. A graph that provides the breakeven point on the extra distant that the high quality base should be hauled is also provided (see Figure 5.17).
0.00
0.05
0.10
0.15
0.20
0.25
4 8 12 16 20Base Thickness, in.
Ru
t D
epth
, in
.Base (High Quality: 70 ksi)Subgrade (20 ksi)Total
0.0
0.5
1.0
1.5
2.0
2.5
4 8 12 16 20
Base Thickness, in.
Ru
t D
epth
, in
.
Base (Low Quality: 30 ksi)Subgrade (20 ksi)Total

85
1) Project Information ExampleSample ID: I 10 Sample 1Sample Date: 7/25/2008Controlling CSJ: 000-00-000County: El PasoDistrict: El PasoSampled by: Biraj GautamSample Location (Quarry): CemexDistance For Hauling High Quality Base, mile 50Distance For Hauling Local Base, mile 50
2. Pavement SectionLength of the pavement section, mileNumber of lanesWidth of the lane, ft.Width of the shoulder, ft.
3. Base Layer InformationThickness of base layer, inDensity of base, lb/ft3
4. Cost InformationMaterial cost per SY for 12 in. base, $Construction cost per SY, $Transportation cost per ton per mile, $
5. Results
Total Cost
Local base is 4% more expensive. Therefore, High Quality Base is more economical
Breakeven Point for Hauling High Quality
Base is 48 miles
0.257 9
10
7 6High Quality Base Local Base
7030
2124
Local BaseHigh Quality Base8 12
3,534,119$ 3,685,267$
135 135
High Quality Base Local Base
-2
0
2
4
6
8
10
0 20 40 60 80 100 120 140 160
Distance for Hauling High Quality Base, mile
Cos
t S
avin
g fo
r U
sin
g L
ocal
Bas
e p
er S
Y, $
Figure 5.17 – Worksheet of Cost Analysis for Roadway Base Construction with
Low and High Quality Materials

86
87
Chapter 6 Guidelines and Protocols Introduction
The main purpose of this chapter is to provide guidelines and strategies for using local materials in the base and/or subbase construction of low-volume roads. To establish test procedures and guidelines, nine base materials from five TxDOT districts were collected and tested. The major laboratory tests on these materials include:
Triaxial Compression Tube Suction related such as retained strength, retained modulus, moisture change and
dielectric constant Resilient Modulus and Permanent Deformation Small-scale performance simulation
Based on the results (see Chapter 4), the chemical treatment or gradation modification or both were applied to six materials to ensure that the materials classified as out-of-specification can be economically improved to meet or be close to the requirements for Grade 1 of Item 247. The decision for selecting the appropriate types of additive was based on the current TxDOT guidelines (Guidelines for Modification and Stabilization of Soils and Base for Use in Pavement Structures, 2005) and the gradation modification was based on the findings from TxDOT Project 0-4348. Guidelines and Test Protocols The requirements for Grade 1 base materials by TxDOT Item 247 are the basis of evaluating and using local pit materials for roadway base and subbase. The flow chart of activities is shown in Figure 6.1 and detailed step by step process in the following paragraphs. Two strategies are
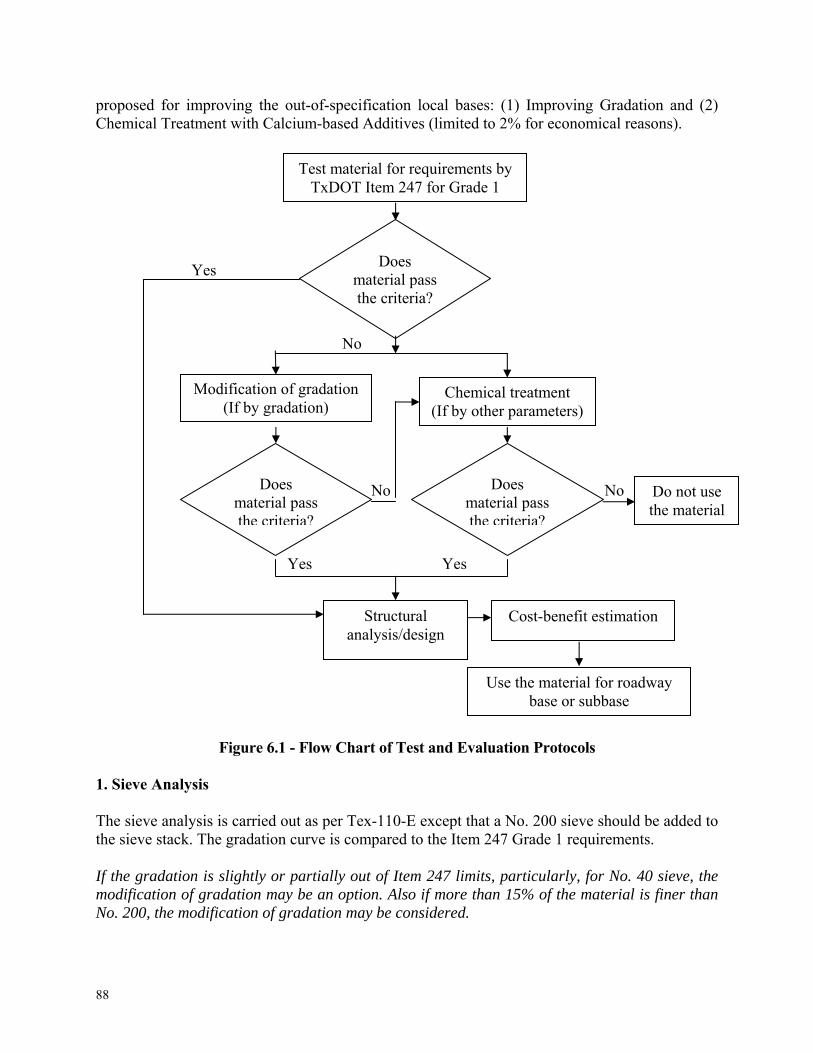
88
proposed for improving the out-of-specification local bases: (1) Improving Gradation and (2) Chemical Treatment with Calcium-based Additives (limited to 2% for economical reasons). Yes No No No Yes Yes
Figure 6.1 - Flow Chart of Test and Evaluation Protocols
1. Sieve Analysis The sieve analysis is carried out as per Tex-110-E except that a No. 200 sieve should be added to the sieve stack. The gradation curve is compared to the Item 247 Grade 1 requirements. If the gradation is slightly or partially out of Item 247 limits, particularly, for No. 40 sieve, the modification of gradation may be an option. Also if more than 15% of the material is finer than No. 200, the modification of gradation may be considered.
Test material for requirements by TxDOT Item 247 for Grade 1
Does material pass the criteria?
Modification of gradation (If by gradation)
Chemical treatment (If by other parameters)
Does material pass the criteria?
Does material pass the criteria?
Structural analysis/design
Cost-benefit estimation
Use the material for roadway base or subbase
Do not use the material
89
2. Atterberg Limits Liquid Limit (LL) and Plastic Limit (PL) of material sample are tested as per Tex 104-E and Tex-105-E. Plasticity Index (PI) of the material is calculated as per Tex-106-E. The LL should be less than 35 and the PI should be less than 10. If LL or PI or both are out of these limits, chemical treatment is recommended. 3. Moisture-Density Moisture-density (MD) test is carried out as per Tex-113-E to obtain the optimum moisture content and the maximum dry density. Optional Step: To estimate the variations in strength with moisture, the specimens prepared for developing the MD curves can be cured for 24 hours and subjected to unconfined compressive strength (UCS) testing as per Tex-117-E. If the UCS at optimum is significantly less than the limits set for strength at 0 psi lateral pressure, treatment is recommended. 4. Strength Testing for compressive strength of a specimen should conform to procedure Tex-117-E. Strength testing as per proposed Tex-143 is optional. If one of the strengths at 0 and 15 psi lateral pressures as per Tex-117-E does not meet the requirement of Item 247, chemical treatment is recommended. 5. Moisture Susceptibility The retained strength defined as the ratio of the strength obtained from zero lateral pressure after moisture conditioning as per Tex-117-E and strength at zero lateral pressure after 24 hrs of curing at room temperature (similar to Tex-143) should be the primary parameter for assessing the moisture susceptibility. The retained unconfined compressive strength should be greater than 80%. If the retained strength is less than 80%, chemical treatment is recommended. Tube Suction Test (TST) as per Tex-144-E is recommended for secondary assessing the moisture susceptibility of untreated material through dielectric constant measurement. If dielectric constant is greater than 16, chemical treatment is recommended, depending upon the strength values as per Tex 117-E. 6. Resilient Modulus and Permanent Deformation In order to ensure the performance of the local base, the resilient modulus and permanent deformation tests should be mandatory. Depending on the availability of the equipment, these
90
tests should be carried out in-house or should be performed by a commercial laboratory. These values are required for structural analysis. The additional cost associated with this task is justified to ensure that the local base will not experience excessive permanent deformation. The resilient modulus test should be performed as per AASHTO T-307. A representative1 resilient modulus greater than 40 ksi is recommended. The modulus test can be performed with a free-free resonant column (FFRC) device as per Tex-149-E as a preliminary estimate. A seismic modulus of at least 80 ksi is proposed at this time. The permanent deformation should be conducted as per NCHRP 1-29. The primary reason for conducting the permanent deformation tests is to obtain parameters needed for assessing the rutting of the base as discussed before. As such it is difficult to set acceptable limits. Usually, permanent deformation in excess of 2% may be considered excessive without structural analysis as discussed in Step 8. 7a. Chemical Treatment Determine the type and amount of additives as discussed below. Repeat Steps 3 through 6. a) Type of Additive - The decision tree (see Figure 6.2) for selecting the appropriate types of additive as per current TxDOT guidelines (Guidelines for Modification and Stabilization of Soils and Base for Use in Pavement Structures, 2005) should be followed. The two main factors considered are the percentage of material passing the No. 200 sieve and the Plasticity Index (PI). If the PI is greater than 10 by a large margin, the use of lime is recommended. b) Amount of Additive – For economical reasons, the percentage of additive should not exceed 2% by dry weight of the material being tested. Since the amount of additives used is small, the strength parameters of the treated materials should be obtained as per Tex-117-E (instead of Tex-120-E or Tex-121-E or Tex-127-E) with specified limits reflected in Item 247. If the treated material does not satisfy the strength requirements of Item 247, the use of greater amount of additives can be considered, if deemed economical. In that case, procedures Tex-120-E, Tex- 121-E or Tex-127-E may be conducted depending on the type of additives used.
1 Representative modulus is estimated at a confining pressure and a deviatoric stress representative of the middle of the base layer due to an 18-kip equivalent single axle load. The typical values of the confining pressure and deviatoric stress of 15 psi and 15 psi, are recommended for a typical base.
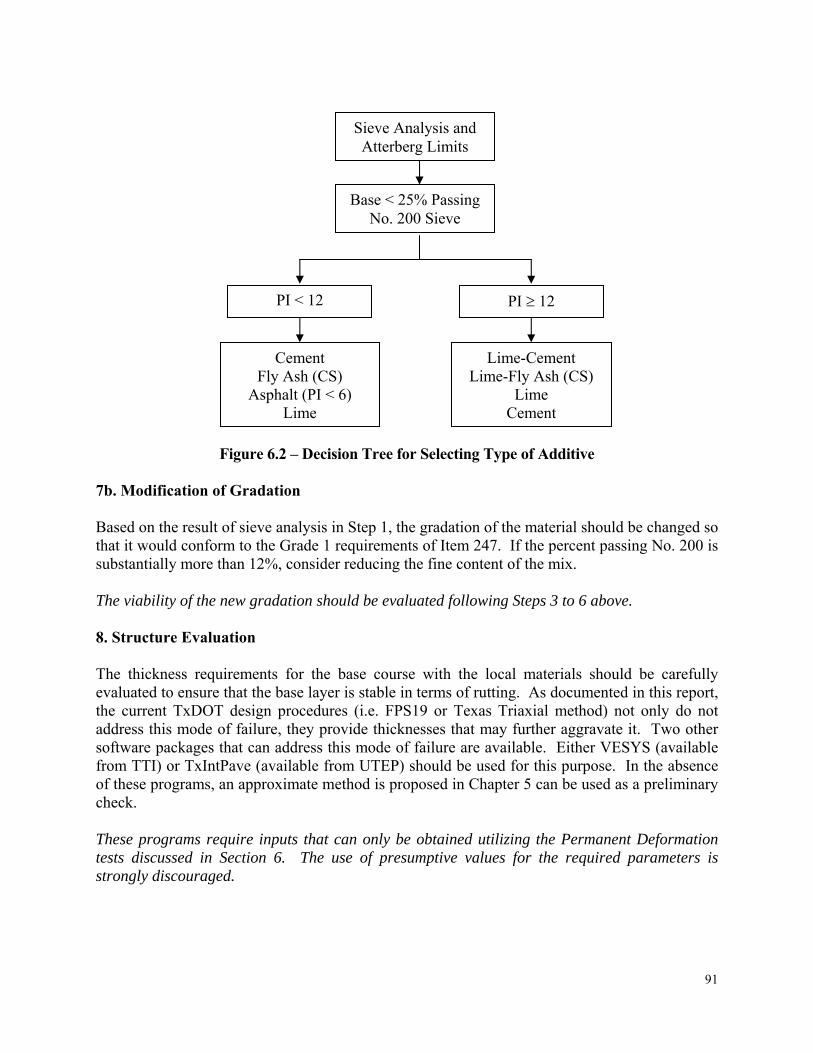
91
Figure 6.2 – Decision Tree for Selecting Type of Additive 7b. Modification of Gradation Based on the result of sieve analysis in Step 1, the gradation of the material should be changed so that it would conform to the Grade 1 requirements of Item 247. If the percent passing No. 200 is substantially more than 12%, consider reducing the fine content of the mix. The viability of the new gradation should be evaluated following Steps 3 to 6 above. 8. Structure Evaluation The thickness requirements for the base course with the local materials should be carefully evaluated to ensure that the base layer is stable in terms of rutting. As documented in this report, the current TxDOT design procedures (i.e. FPS19 or Texas Triaxial method) not only do not address this mode of failure, they provide thicknesses that may further aggravate it. Two other software packages that can address this mode of failure are available. Either VESYS (available from TTI) or TxIntPave (available from UTEP) should be used for this purpose. In the absence of these programs, an approximate method is proposed in Chapter 5 can be used as a preliminary check. These programs require inputs that can only be obtained utilizing the Permanent Deformation tests discussed in Section 6. The use of presumptive values for the required parameters is strongly discouraged.
Base < 25% Passing No. 200 Sieve
PI < 12
Cement Fly Ash (CS)
Asphalt (PI < 6) Lime
Lime-Cement Lime-Fly Ash (CS)
Lime Cement
PI 12
Sieve Analysis and Atterberg Limits
92
9. Cost Analysis The cost of additional processing and construction steps of the local bases (either through change in gradation or chemical treatment) should be compared with the additional cost of the transportation of the high-quality bases. Due to the extremely volatile costs of construction materials and fuel, it would be difficult to provide rigid guidelines. A worksheet, specifically developed for this purpose (see Appendix A for its user manual), can be used to determine the cost effectiveness of the use of local bases. 10. Use of Local Materials as Subbase For bases thinner than 12 in., the use of the local materials without appropriate modification is not prudent. If the base is thicker than 12 in., the structural and economical feasibility of using the local material as is as a subbase should be explored. Structural analysis as part of this research indicates that most of the base rutting occurs in the top 7 in. of the base, and that a subbase layer with local materials between the base and subgrade do not significantly impact the performance of the pavement.
93
Chapter 7 Summary and Conclusions
The use of high-quality materials is generally required to satisfy conventional specifications for unbound granular materials in pavements. The source of these materials can be a long distance from the construction site, resulting in high transportation costs. The use of local sources of marginal materials or the use of low-quality materials is not allowed if they do not comply with existing specifications. Since the reserves of high-quality materials are diminishing in many areas, it is necessary to develop strategies for utilizing local materials. In this research project, we attempted to first characterize marginal materials from several local pits to determine the reasons for these materials being considered low-quality or out-of-specification. TxDOT Item 247 for a Grade 1 base was considered as the target. The materials that failed to meet the requirements of this target were then treated with calcium-based additives or their gradations were modified to “improve” their quality. The decision for selecting the appropriate types of additive was based on the current TxDOT guidelines (Guidelines for Modification and Stabilization of Soils and Base for Use in Pavement Structures, 2005) and the gradation modification was based on the findings from TxDOT Project 0-4348. Since Item 247 does not contain performance-based criteria, the strength, modulus and permanent deformation characteristics of these materials were studied to estimate the performance of these materials. These performance parameters were used in several structural analysis software packages to judge when and how to utilize the local materials instead of higher quality, hauled-in, materials. Based on the results of this evaluation, preliminary guidelines and test protocols were developed. Based on the knowledge gained so far, the following observations were obtained for low-quality and treated base materials:
For all the cement-treated base materials (with 1% cement) and most of the lime-treated base materials, the strength values at 0 psi lateral pressure and 15 psi lateral pressure met the Item 247 minimum strength requirements of 45 psi and 180 psi, respectively.
For most materials, the change in gradation did not significantly improve the quality of low-quality local material.
94
Although most of the raw, gradation-modified and treated materials passed the retained modulus of 80% and the retained strength of 80%, the retained modulus and the retained modulus largely depended upon the type of material.
The dielectric constants for the materials with increased fines content showed higher values than the ones obtained from raw materials; whereas for the materials with reduced fines content, the dielectric constants showed lower values than those obtained from raw materials. For most of the materials treated with 1% cement or 1% lime, the dielectric constants showed higher values as compared with the ones obtained from raw materials.
Most of the raw materials did not meet the resilient modulus of 40 ksi. The resilient modulus of 40 ksi for cement-treated and lime-treated materials was readily achieved. For most materials, the resilient modulus of cement-treated base was found out to be higher than the ones obtained from lime-treated base materials.
The equivalent thicknesses of base layer were determined by using the resilient modulus and permanent deformation parameters obtained from laboratory test. The permanent deformation test parameters α and μ of the base layer controls the amount of rutting that a section experiences. It is of utmost importance to obtain these parameters before replacing a high-quality base with lower quality local bases.
The current pavement design algorithms (e.g. FPS19 or Texas Triaxial Design check) should be used with utmost care to replace a high-quality base with a lower quality base. These algorithms tend to provide base thicknesses that are over conservative. More advanced analysis with either VESYS or TxIntPave is required to ensure the stability of the low quality base.
The utilization of the lower quality local materials as a subbase layer seems feasible and advantageous. The top 6 in. to 8 in. of the base layer placed on the low-volume road with thin surfacing or surface treatment seems to contribute to the rutting. As such for bases thicker than 12 in. the use of the low quality local base as subbase, especially for strong subgrades, is recommended.
95
References
Allen J. (1973) “The Effect of Non-Constant Lateral Pressures of the Resilient Response of Granular Materials” Ph.D. Dissertation, Department of Civil and Environmental Engineering, University of Illinois at Urbana-Champaign, Urbana, Illinois.
Allen J. and Thompson M. R. (1974), “Resilient Response of Granular Materials Subjected to Time Dependent Lateral Stresses”, Transportation Research Record 510, Transportation Research Board, National Research Council, Washington, D.C., pp. 1-13.
Amiri, H. (2004), “Impact of Moisture Variation on Stiffness of Response of Pavements through Small Scale Models”, Mater Thesis, Department of Civil Engineering, University of Texas at El Paso, El Paso, Texas.
Army TM 5-822-14, (1994), “Soil Stabilization for Pavements”. Air Force AFJMAN 32-1019, Department of the Army, the NAVY and the Air Force.
Arora P. L., Crowther L. and Akhter G. (1986) “Soil Stabilization for Low-volume Roads”, Sheladia Associates, Inc. and Federal Highway Administration.
Barksdale R. D. (1972), “Laboratory Evaluation of Rutting in Base Course Materials”, Proceedings of the 3rd International Conference on the Structural Design of Asphalt Pavements, London, vol. 1, pp. 161-174.
Barksdale R. D. (2001), “The Aggregate Handbook”, National Stone Association, Sheridan Books, Inc., Elliot Place, Washington, D. C.
Barksdale R. D. and Itani S. Y. (1989), “Influence of Aggregate Shape on Base Behavior”, Transportation Research Record 1227, Transportation Research Board, National Research Council, Washington, D.C., pp. 173-182.
Boyce J. R., Brown S. F. and Pell P. S. (1976), “The Resilient Behavior of a Granular Material Under Repeated Loading”, Proceedings of the 8th Australian Road Research Board Conference on Material Construction and Maintenance, Perth, Australia, Vol. 8, Part 3, pp. 1-12.
Brown S. F. and Hyde A. F. L. (1975), “Significance of Cyclic Confining Stress in Repeated Load Triaxial Testing of Granular Material”, Transportation Research Record 537, Transportation Research Board, National Research Council, Washington, D.C., pp. 49-58.
96
Bullen F. (2003), “Design and Construction of Low-Cost, Low-Volume Roads in Australia”, Paper No. LVR8-1116, TRR 1819, School of Engineering, University of Tasmania, Hobart, Australia.
Cook J. R. and Gourley, C. S. (2003), “A Framework for the Appropriate Use of Marginal Materials”, World Road Association-(PIARC), Technical Committee C12 Seminar Mongolia.
Gandara J. A., Kancherla A., Alvarado G., Nazarian S. and Scullion T. (2005), “Impact of Aggregate Gradation on Base Material Performance”, Research Report 0-4358-2, The University of Texas at El Paso, El Paso, Texas.
Geiger A., Yuan D., Nazarian S. and Abdallah I. (2006) “Effects of Pulverization on Properties of Stabilized Bases”, Research Report 0-5223-1, The University of Texas at El Paso, El Paso, Texas.
Greening P. A. K. and Rolt J. (1997), “The Use of Marginal Materials for Road Bases in Kalahari Region of Southern Africa”, International Symposium on Thin Pavements, Surface Treatments and Unbound Roads, University of New Brunswick, Canada.
Gourley C. S. and Greening, P. A. K. (1997), “Use of Sub-standard Laterite Gravels as Road Base Materials in Southern Africa”, International Symposium on Thin Pavements, Surface Treatments and Unbound Roads, University of New Brunswick, Canada.
Hall K. D. and Bettis J. W. (2000), “Development of Comprehensive Low-Volume Pavement Design Procedures”, Mack-Blackwell Rural Transportation Center Report No. 1070.
Hicks R.G., and Monismith C. L. (1971), “Factors Influencing the Resilient Properties of Granular Materials”, Highway Research Record 345, Highway Research Board, National Research Council, Washington, D.C., pp. 15-31.
Huang Y. H. (2004), “Pavement Analysis and Design”, Prentice-Hall, Inc., Englewood Cliffs, New Jersey.
Kenis W.J. (1977) “Predictive Design Procedures, VESYS Users Manual, An Interim Design Method for Flexible Pavements Using the VESYS Structural Subsystem,” Final Report FHWA-RD-77-154, Federal Highway Administration, Washington, D.C.
Kolisoja P. (1997), “Resilient Deformation Characteristics of Granular Materials”, Ph.D. Dissertation, Tampere University of Technology, Publication No 223, Tampere, Finland.
Lekarp F. and Dawson A. R. (1997), “Analysis of Permanent Deformation Behavior of Unbound Granular Materials”, Paper presented at the International Symposium on Thin Pavements, Surface Treatments, Unbound Roads, Fredericton, New Brunswick, Canada.
Lekarp F., Isacsson U. and Dawson A. R. (2000), “State of the Art. I: Resilient Response of Unbound Aggregates”, Journal of Transportation Engineering, Vol. 126, No.1, pp. 66-75.
Nazarian, S., Pezo, R. and Picornell, P. (1996), “Testing Methodology For Resilient Modulus of Base Materials”, Research Report 1336-1, Center for Geotechnical and Highway Materials Research, The University of Texas at El Paso, El Paso, Texas.
97
Nunan T. A. and Humphrey D. N. (1990),” A Review and Experimentation of Gravel Stabilization Methods, executive”, Technical services division, Technical report 90-2, Department of Civil Engineering, University of Maine, Orono, Maine.
Richard, Jr., F. E., Woods, R. D., and Hall Jr., J. R., (1970), “Vibrations of Soils and Foundations”, Prentice-Hall, Inc., Englewood Cliffs, New Jersey.
Ruenkrairergsa, T. (1980), “Geotechnical Aspects of Low Volume Road Design and Construction in Northeastern Thailand”, Second International Conference on Low Volume Roads, Iowa, USA.
Scullion T., Guthrie S. and Stephen Sebesta, S. (2003), “Field Performance and Design Recommendations for Full Depth Recycling in Texas”, Report 4182-1, Texas Transportation Institute, the Texas A&M University System.
Smith W. S., and Nair K. (1973), “Development of Procedures for Characterization of Untreated Granular Base Course and Asphalt Treated Base Course Materials”, Report No. FHWA-RD-74-61, Federal Highway Administration, Washington, D.C.
Terrel R. L., Epps, J. A., Barenberg E. J., Mitchell J. K. and Thompson, M. R. (1979), “Soil Stabilization in Pavement Structures, A User’s Manual, Volume 2, Mix Design Considerations”, Report No. FHWA-IP-80-2, Federal Highway Administration, Washington, D.C.
Thom, N. H., and Brown S. F. (1988), “The Effect of Grading and Density on the Mechanical Properties of a Crushed Dolomitic Limestone”, Proceedings of the 14th Australian Road Research Board Conference, Sydney, Part 7, pp. 94-100.
Thompson M. R. (1989) “Factors Affecting the Resilient Moduli of Soils and Granular Materials, Workshop on Resilient Modulus Testing, Oregon State University, Corvallis.
Thompson M. R., and Naumann D. (1993)” Rutting Rate Analyses of the AASHO Road Test Flexible Pavements”, Transportation Research Record 1384, Transportation Research Board, National Research Council, Washington, D.C.
TRL, 2003. “A guide to the selection and use of road construction materials”, Transport Research Laboratory Report (R6898) to DFID.
Walls III, J. and Smith, M.R. (1998), “Life Cycle Cost Analysis in Pavement Design-Interim Technical Bulletin”, Report No. FHWA-SA-98-079, Federal Highway Administration, Washington D.C.
Woodbridge, M.E. (1999), “Use of Soft Limestone for Road-Base Construction in Belize”, Seventh International Conference on Low-Volume Roads, Baton Rouge, Louisiana, USA.
Yoder, E.J. and Witzcak, M.W. (1975), Principles of Pavement Design, Second Edition, New York: John Wiley and Sons.
Zhou F. and Scullion T. (2005) “Asphalt Pavement Performance Analysis Tool: VESYS5W,” Report 9-1502-01-5, Texas Transportation Institute, College Station, TX.

98
99
Appendix A
Cost Evaluation Tool Manual

100
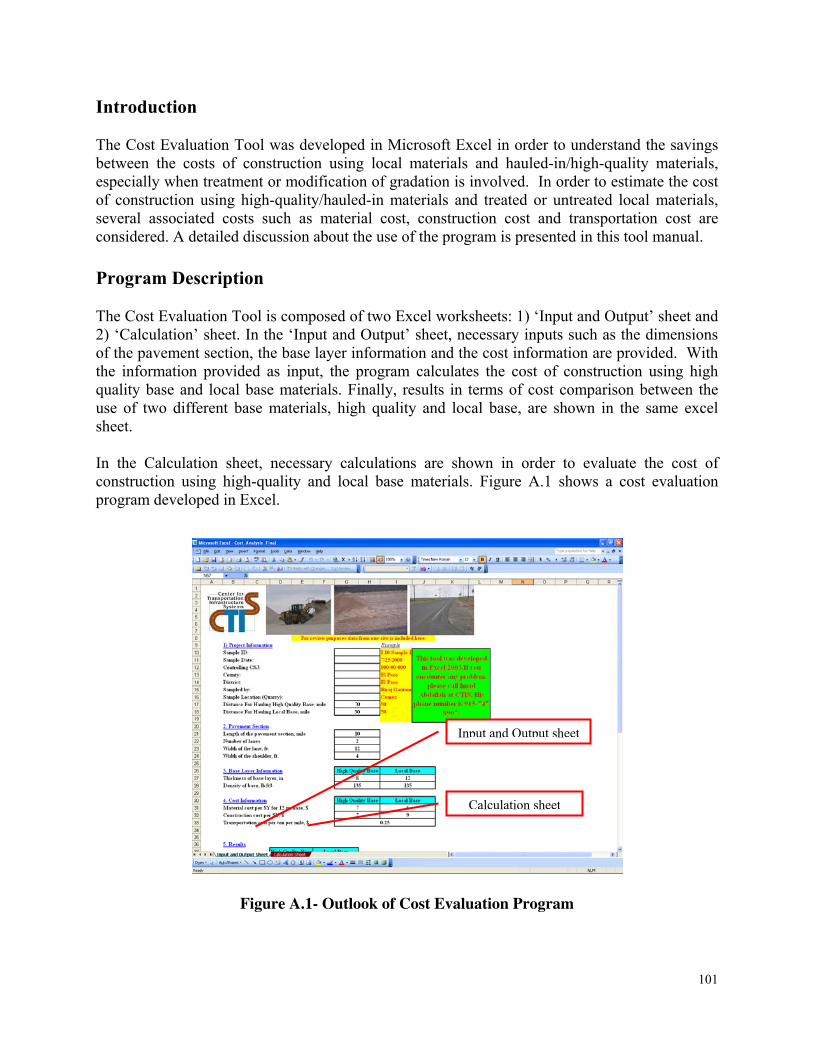
101
Introduction The Cost Evaluation Tool was developed in Microsoft Excel in order to understand the savings between the costs of construction using local materials and hauled-in/high-quality materials, especially when treatment or modification of gradation is involved. In order to estimate the cost of construction using high-quality/hauled-in materials and treated or untreated local materials, several associated costs such as material cost, construction cost and transportation cost are considered. A detailed discussion about the use of the program is presented in this tool manual. Program Description The Cost Evaluation Tool is composed of two Excel worksheets: 1) ‘Input and Output’ sheet and 2) ‘Calculation’ sheet. In the ‘Input and Output’ sheet, necessary inputs such as the dimensions of the pavement section, the base layer information and the cost information are provided. With the information provided as input, the program calculates the cost of construction using high quality base and local base materials. Finally, results in terms of cost comparison between the use of two different base materials, high quality and local base, are shown in the same excel sheet. In the Calculation sheet, necessary calculations are shown in order to evaluate the cost of construction using high-quality and local base materials. Figure A.1 shows a cost evaluation program developed in Excel.
Figure A.1- Outlook of Cost Evaluation Program
Input and Output sheet
Calculation sheet
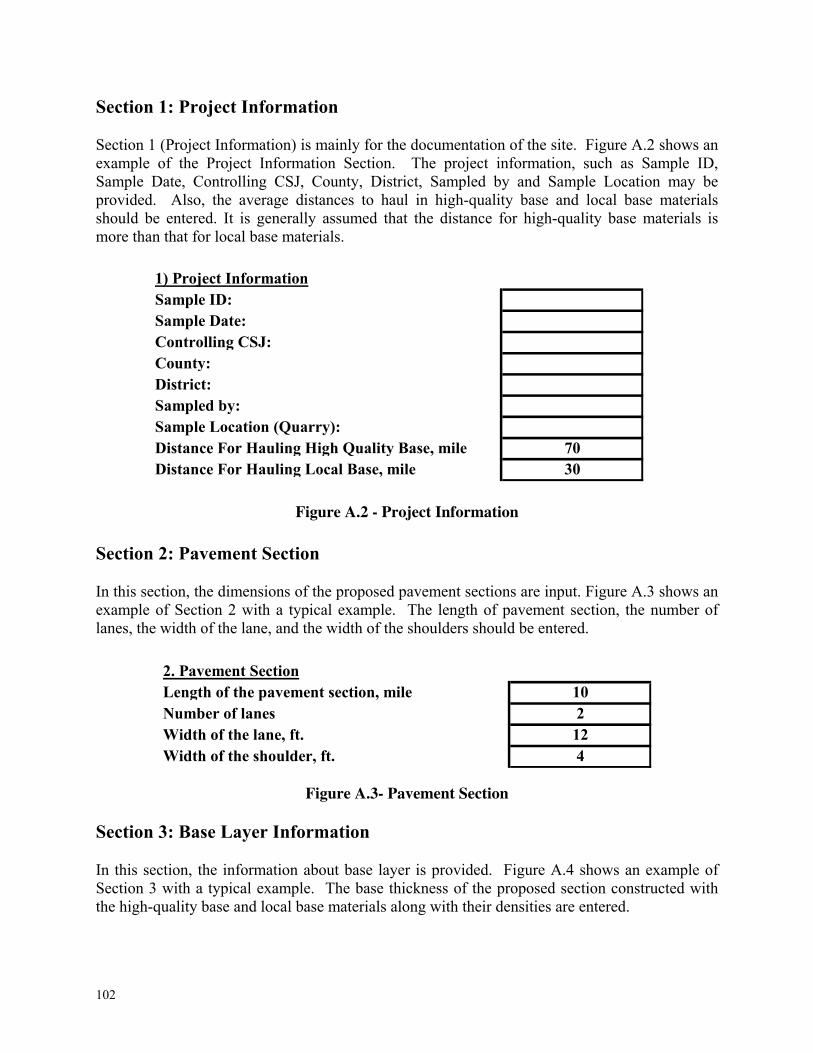
102
1) Project InformationSample ID:Sample Date:Controlling CSJ:County:District:Sampled by:Sample Location (Quarry):Distance For Hauling High Quality Base, mileDistance For Hauling Local Base, mile
7030
Section 1: Project Information Section 1 (Project Information) is mainly for the documentation of the site. Figure A.2 shows an example of the Project Information Section. The project information, such as Sample ID, Sample Date, Controlling CSJ, County, District, Sampled by and Sample Location may be provided. Also, the average distances to haul in high-quality base and local base materials should be entered. It is generally assumed that the distance for high-quality base materials is more than that for local base materials.
Figure A.2 - Project Information
Section 2: Pavement Section In this section, the dimensions of the proposed pavement sections are input. Figure A.3 shows an example of Section 2 with a typical example. The length of pavement section, the number of lanes, the width of the lane, and the width of the shoulders should be entered.
Figure A.3- Pavement Section
Section 3: Base Layer Information In this section, the information about base layer is provided. Figure A.4 shows an example of Section 3 with a typical example. The base thickness of the proposed section constructed with the high-quality base and local base materials along with their densities are entered.
2. Pavement SectionLength of the pavement section, mileNumber of lanesWidth of the lane, ft.Width of the shoulder, ft.
2124
10
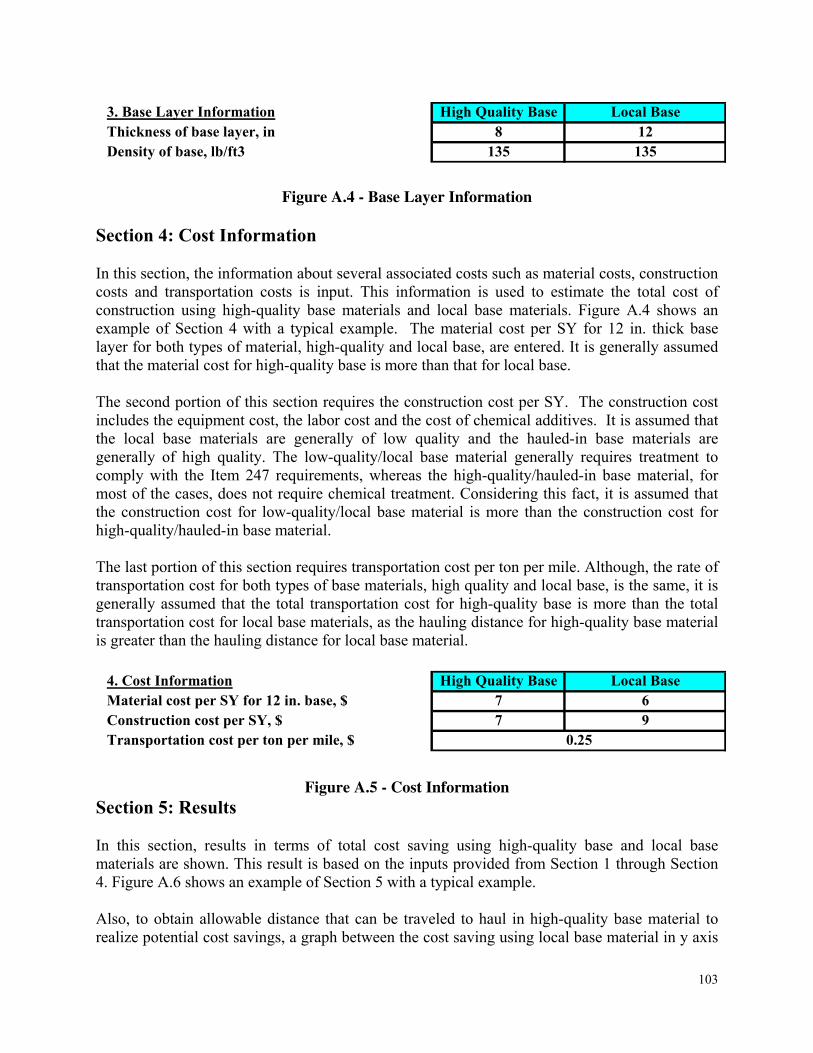
103
3. Base Layer InformationThickness of base layer, inDensity of base, lb/ft3 135 135
Local BaseHigh Quality Base8 12
4. Cost InformationMaterial cost per SY for 12 in. base, $Construction cost per SY, $Transportation cost per ton per mile, $
High Quality Base Local Base
0.257 97 6
Figure A.4 - Base Layer Information
Section 4: Cost Information In this section, the information about several associated costs such as material costs, construction costs and transportation costs is input. This information is used to estimate the total cost of construction using high-quality base materials and local base materials. Figure A.4 shows an example of Section 4 with a typical example. The material cost per SY for 12 in. thick base layer for both types of material, high-quality and local base, are entered. It is generally assumed that the material cost for high-quality base is more than that for local base. The second portion of this section requires the construction cost per SY. The construction cost includes the equipment cost, the labor cost and the cost of chemical additives. It is assumed that the local base materials are generally of low quality and the hauled-in base materials are generally of high quality. The low-quality/local base material generally requires treatment to comply with the Item 247 requirements, whereas the high-quality/hauled-in base material, for most of the cases, does not require chemical treatment. Considering this fact, it is assumed that the construction cost for low-quality/local base material is more than the construction cost for high-quality/hauled-in base material. The last portion of this section requires transportation cost per ton per mile. Although, the rate of transportation cost for both types of base materials, high quality and local base, is the same, it is generally assumed that the total transportation cost for high-quality base is more than the total transportation cost for local base materials, as the hauling distance for high-quality base material is greater than the hauling distance for local base material.
Figure A.5 - Cost Information
Section 5: Results In this section, results in terms of total cost saving using high-quality base and local base materials are shown. This result is based on the inputs provided from Section 1 through Section 4. Figure A.6 shows an example of Section 5 with a typical example. Also, to obtain allowable distance that can be traveled to haul in high-quality base material to realize potential cost savings, a graph between the cost saving using local base material in y axis
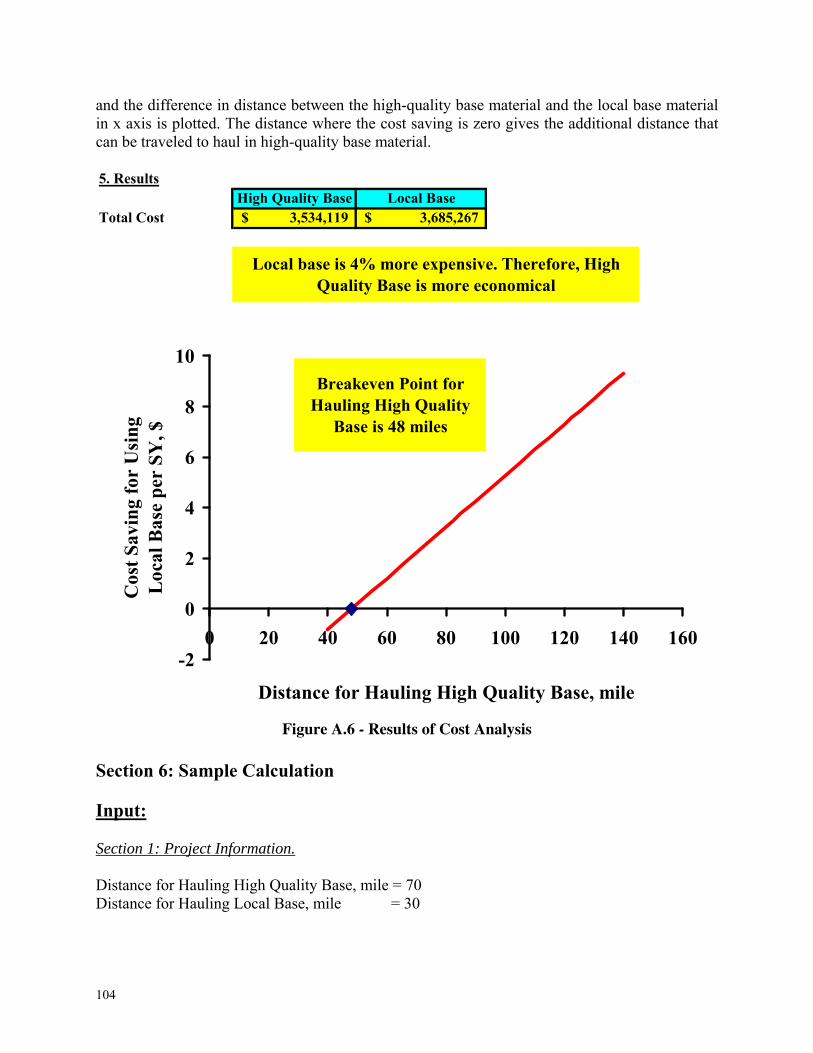
104
5. Results
Total Cost 3,534,119$ 3,685,267$ High Quality Base Local Base
Local base is 4% more expensive. Therefore, High Quality Base is more economical
Breakeven Point for Hauling High Quality
Base is 48 miles
-2
0
2
4
6
8
10
0 20 40 60 80 100 120 140 160
Distance for Hauling High Quality Base, mile
Cos
t S
avin
g fo
r U
sin
g L
ocal
Bas
e p
er S
Y, $
and the difference in distance between the high-quality base material and the local base material in x axis is plotted. The distance where the cost saving is zero gives the additional distance that can be traveled to haul in high-quality base material.
Figure A.6 - Results of Cost Analysis Section 6: Sample Calculation Input: Section 1: Project Information. Distance for Hauling High Quality Base, mile = 70 Distance for Hauling Local Base, mile = 30
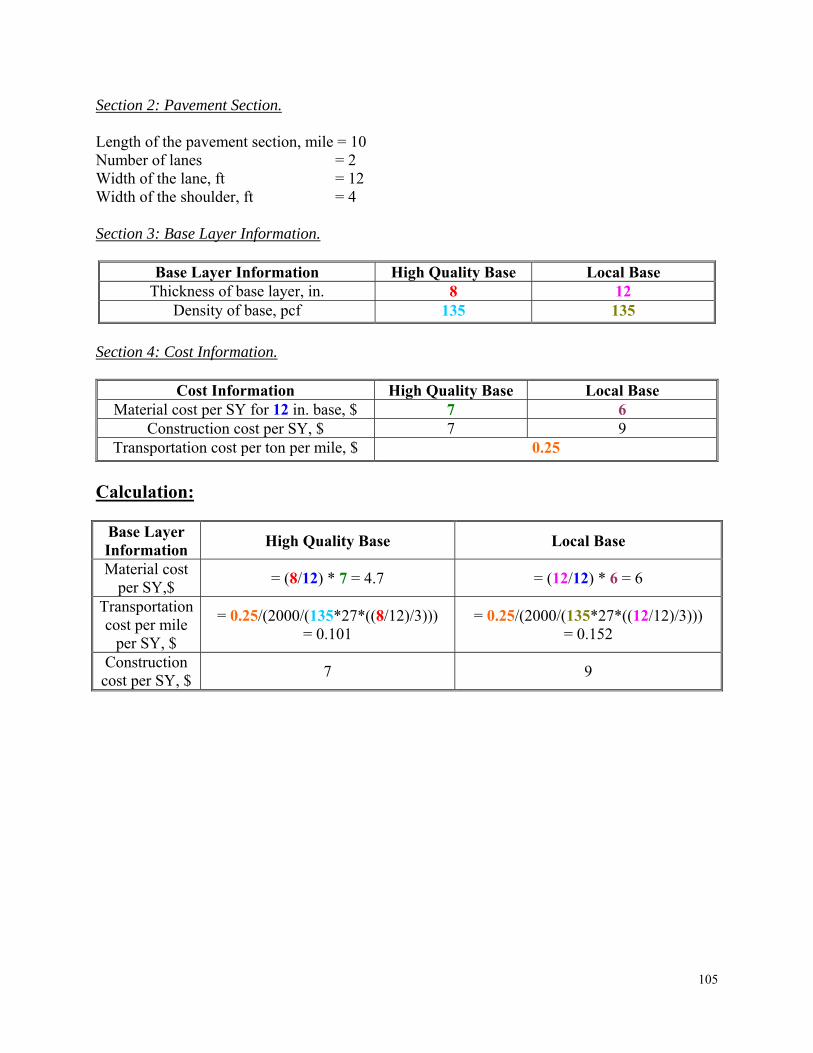
105
Section 2: Pavement Section. Length of the pavement section, mile = 10 Number of lanes = 2 Width of the lane, ft = 12 Width of the shoulder, ft = 4 Section 3: Base Layer Information.
Base Layer Information High Quality Base Local Base Thickness of base layer, in. 8 12
Density of base, pcf 135 135
Section 4: Cost Information.
Cost Information High Quality Base Local Base Material cost per SY for 12 in. base, $ 7 6
Construction cost per SY, $ 7 9 Transportation cost per ton per mile, $ 0.25
Calculation:
Base Layer Information
High Quality Base Local Base
Material cost per SY,$
= (8/12) * 7 = 4.7 = (12/12) * 6 = 6
Transportation cost per mile
per SY, $
= 0.25/(2000/(135*27*((8/12)/3))) = 0.101
= 0.25/(2000/(135*27*((12/12)/3))) = 0.152
Construction cost per SY, $
7 9

106
Related Documents