Guide for Planning, Executing, & Presenting ACT-SO Science Projects (Version 1)

Welcome message from author
This document is posted to help you gain knowledge. Please leave a comment to let me know what you think about it! Share it to your friends and learn new things together.
Transcript
Guide for
Planning, Executing, &
Presenting ACT-SO
Science Projects
(Version 1)
For more information, please visit: www.ActSoNewJersey.org
New Jersey Today's Youth...Tomorrow's Legends
2
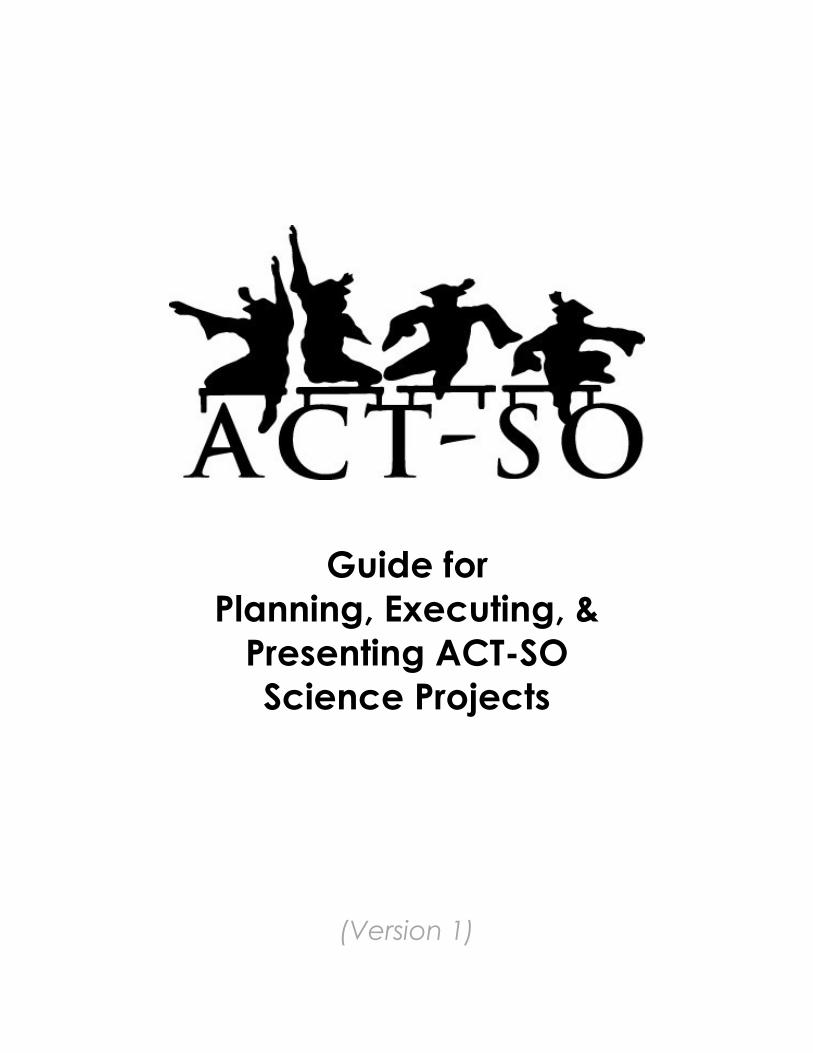
Table of Contents
Page
Thinking About Entering the ACT-SO Science Competition 3
What Science Judges Look For 3
Choosing a Topic 4
The Scientific Method 4
You’re Ready to Go 15
Where did this packet come from 15
Requirements 16
Safety Procedures 17
Science Papers Format 18
Figure 1 19
Figure 2 20
Figure 3 21
For more information, please visit: www.ActSoNewJersey.org
New Jersey Today's Youth...Tomorrow's Legends
3
Are You Thinking About Entering the ACT-SO Science
Competition?
ACT-SO national science judges were very impressed with the students who competed in the science categories and with the projects they presented. As a result, the science judges would like to see even more students compete in the science categories. The information provided here is meant to assist students in planning, executing, and presenting projects in the science category at future ACT-SO competitions. Throughout this text, you will find tips, which appear in bold text. You should take these tips to heart. They are not suggestions. They are, in fact, instructions for making your project stand out as a really good project. Follow these tips and you will not go wrong. Here’s the first tip: Start early. By starting your project early, you will have time to really examine your topic and know your information backward and forward. By starting early, you will have time to decide whether or not your topic is too broad or too narrow and adjust your topic accordingly. By starting early, you will have time to recover from mistakes, adjust your procedure, if necessary, or get additional equipment, if needed. So start early. Do a little each day. Remember, “It’s hard by the yard. It’s a cinch by the inch.” If you start early, time is on your side.
Science Judges Want to See Experiments,
Not Demonstrations
A demonstration does not an experiment make. OK, this sounds like Shakespeare but there is a lot of truth in this statement. What’s the difference between a demonstration and a science experiment? A demonstration is a showing of how something works or how it is used. An experiment is a process undertaken to discover something not yet known or a process designed to find out if something is effective. A project entitled “How an Electromagnet Works” is a demonstration. How an electromagnet works is common knowledge. A project like this would be a repeat of work which has already been done and appears in many middle and high school science books. On the other hand, a project entitled “The Effect of Different Metals on the Amount of Magnetic Force Produced by an Electromagnet” is an experiment. In this experiment, you are actually testing different metals to see what effect they have on the strength of an electromagnet. Here’s another example. A project entitled “How Does Insulation Work?” is a demonstration. There have been many books written which will tell you exactly how insulation works. A project like this would not bring out any new knowledge. But a project entitled “Which Type of Clothing Material Is the Best Insulator?” is an experiment. In this experiment, you are testing the insulating quality of different materials. You are testing or investigating the insulating properties of different materials. Don’t misunderstand what I am saying. If you are interested in performing an experiment which deals with insulation, then knowing how insulation works is very important. But it is important
For more information, please visit: www.ActSoNewJersey.org
New Jersey Today's Youth...Tomorrow's Legends
4
because it will serve as background information about how insulation works. From that background information you will be able to generate ideas about what aspects of insulation you would like to test. Here’s a tip. Demonstrations do not meet the criteria of a science experiment and will receive low marks at the ACT-SO competition. Before you start your science project, talk to your science and math teacher to ensure that what you are doing is an experiment, not a demonstration.
Choosing a Topic
Choose a topic that will interest and challenge you. Do not be afraid to try something new. You can learn about it along the way. Remember that complicated-looking projects do not guarantee a win. Simple topics can actually turn into great projects. At most science fairs, students with simple projects who "know their stuff" will win over students with complicated projects who do not really know their topic and/or who are not good presenters. Notice I said “simple”, not “easy.” Easy topics such as "Which soda tastes best?" will not impress the judges unless you know the ingredients and chemical makeup of each soda tested and can point to which of those ingredients is responsible for people preferring one soda taste over another. Let’s pretend that our topic will be “The Effect of Water on the Growth of Tagetes Erecta.” What the heck are “tagetes erecta”? They are African marigolds. Here’s a tip. Science judges like to see that you know the scientific names associated with all of the materials you will use in your experiment. So, although it may sound a little pretentious, use the scientific name and only the scientific name in your research report and on your presentation backboard. Now I realize that “tagetes erecta” may be a little hard to say over and over during your presentation. So to get around this, at the beginning of your presentation, you can say, “The title of my experiment is ‘The Effect of Water on the Growth of Tagetes Erecta’ otherwise known as African marigolds.” Then you can drop the scientific name after that and just talk about marigolds.
The Scientific Method
The scientific method is a procedure scientists use to answer questions and explore observations. Scientists use an experiment to search for cause and effect relationships in nature. That means scientists design experiments so that changes to one item cause something else to change in a predictable, observable, and quantifiable way. These changing quantities are called variables. Variables are a key element of the scientific method. Let’s talk about the components of the scientific method. The components of the scientific method include (1) purpose, (2) hypothesis, (3) materials, (4) procedure, (5) data, (6) results and analysis, and (7) conclusions.
Purpose
For more information, please visit: www.ActSoNewJersey.org
New Jersey Today's Youth...Tomorrow's Legends
5
The Purpose section should appear in both your research report and on your science presentation backboard. The Purpose section should take up at least 2 pages in your research report. For your science project presentation, you should condense the information from your Purpose section into two paragraphs. Use the library and the Internet to get background information on the subject you have chosen. Science judges like to see that you understand the theory behind your experiment. So go to the library and look up information so you have a good understanding of what is already known about the subject of your science project. Look for important concepts and equations that explain how and why your experimental results turn out the way they do. Find equations that help you predict the outcome of your experiment. Learn as much as you can about any math, physics or chemistry facts and concepts which are important to your fully understanding your project. Also, periodically discuss with your science teachers any questions you have or problems you have encountered with your science project in order to get their feedback. The Purpose section should include information on why your topic is important (e.g., Is it important to the environment? How so? Why does the topic pique your curiosity? Why are you curious?). The Purpose section should also discuss what you are going to do and how what you are going to do relates to the importance of your topic and/or helps satisfy your curiosity. Within the Purpose section you must identify your independent, dependent, and control variables. There is no need to go into a lot of detailed explanation. Simply identify and list your independent, dependent, and control variables. Notice, I just brought up a new subject – the subject of variables. Unless you have a really unique experiment, virtually all experiments have three types of variables. They are:
1. An independent variable 2. A dependent variable 3. A control variable
The independent variable is the thing you are changing or manipulating. In this case, it would be the amount of water. When you are conducting your experiment, you need to make sure the only thing you change is the independent variable. In so doing, you are only measuring the impact of that single change. The dependent variable is the thing you are trying too measure. In this case, it’s the height of the tagetes erecta. The control variable is what you do not change. In this example, you are keeping the amount of sunlight the same for all the tagetes erecta. So, the control variable is … that’s right – the control variable is sunlight. You can have more than one control variable. For instance, if you were going to ensure that all the plants were exposed to the same amount of sunlight, fresh air, and plant food, then your control variables would be sunlight, fresh air, and plant food. Here’s a tip. You should know more information than what you put on the presentation board and in your research report. Here’s an example. If your topic is “The Effect of Water on the Growth of Tagetes Erecta”, you should be absolutely clear about how photosynthesis works.
For more information, please visit: www.ActSoNewJersey.org
New Jersey Today's Youth...Tomorrow's Legends
6
You won’t necessarily explain how photosynthesis works on your presentation board, but I can guarantee you that at least one judge will ask you about photosynthesis. If you mention carbohydrates and chlorophyll in the research report (and you should) or on your presentation board, you should know what a carbohydrate is and how it is formed. You should also become very knowledgeable about chlorophyll. You should know if tagetes erecta are annuals or perennials. You should know how tall the tagetes erecta will grow (12 to 14 inches) and how long it takes to get to that height (approximately 70 days from the time the seed is planted in soil). By taking these steps you will not only know something about your topic, you may find what techniques and equipment are best for investigating your topic. You will also have a better understanding of why the results of your experiment turned out the way they did. You will be able to answer the judges’ questions. Lastly, you will have enough knowledge to make a prediction of what will occur in your experiment.
Hypothesis A hypothesis MUST be included in your research report and on your science project presentation board. A hypothesis is a fancy term for making a prediction. It’s an educated guess concerning the outcome of your experiment. You must state your hypothesis in a way that you can readily measure. But you’re not done yet. You have to say why you think your hypothesis is correct. Use the If, then format. Say why you believe your prediction will be correct. Here’s an example:
“If I give tagetes erecta half the recommended amount of water, then they will grow to half the height of the tagetes erecta which received the fully recommended amount of water. I believe the tagetes erecta which receive half the recommended amount of water will grow to half the height of the tagetes erecta which receive the fully recommended amount of water, because all plants which have chlorophyll use the energy in sunlight to convert carbon dioxide from the air and water from the soil to produce carbohydrates. Carbohydrates (along with fats and proteins) are the substances necessary for plant growth. So, by giving some plants half the water they need, they will only be able to produce half the food they need and will therefore grow to half the height of the plants which received the fully recommended amount of water.”
Notice what the text in quotes did. First it tells everyone what you think will happen. Two, you told everyone how much you think the plants will grow. By saying how much, you have expressed your hypothesis in a measurable (quantifiable) way. Three, the text tells everyone why you think the experiment will give the results you predict. Lastly the text tells everyone that you have based your prediction on knowledge you gained when you were researching information on this subject. This research information is what you used to develop your Purpose section.
Materials This is where you list the supplies and equipment you needed to conduct your
For more information, please visit: www.ActSoNewJersey.org
New Jersey Today's Youth...Tomorrow's Legends
7
experiment. A section titled “Materials” must appear on your project presentation board and in your research report. Just listing the supplies and equipment is all that is really necessary. What do you list? Everything !!! If we use the example of measuring the growth of tagetes erecta, your materials list might look like this:
• 40, 1-liter plastic potting plants – I’ll discuss why the number “40” is important later.
• 40, tagetis erectum seeds
• 2, 8-liter bags of potting mix (this is the soil you will use to place the seeds in)
• Tap water
• 1, graduated beaker which holds at least 300 ml of water
• 1, cm ruler
• 1, No. 2 pencil
• 20 sheets of notebook paper (to record the results)
• A 10’ x 12’ room with windows so that the tagetes erecta will be exposed to sunlight
• A table or other hard surface
• Software (Microsoft Excel) which will (1) calculate statistics such as the median height and average deviation and (2) draw graphs, tables, and charts
Notice how I was very specific about the materials. I didn’t just say, “pots for plants.” I said what type of pots. I also said how big the pots were (e.g., the volume of the pots). In this case, the pot’s capacity was 1 liter. You want to be sure to use the same material each time you conduct the experiment. In this example, you do not want to put one tagetis erectum seed in a 2 liter clay pot and another tagetis erectum seed in a 1 liter plastic pot. You don’t want to measure the height of some tagetes erecta in centimeters (cm) and other tagetes erecta in inches. You want to conduct your experiment the same way every time. Also, you want to use the same material because using different material could cause the results to be different (Scientists call this “introducing other variables”). In other words, you want to see how water affects plant growth. If you use the same material you won’t have to worry about whether the results you get are different because you used clay pots for some tagetes erecta and plastic pots for other tagetes erecta. By using the same materials, you can say that your results are only due to the fact you changed the amount of water you gave the plants. Recall, in this case, water is your independent variable. Here’s a tip. All measurements must be taken in the metric system (grams (or kilograms), centimeters (or meters), milliliters (liters), and seconds). Science fair judges do not like to see inches, ounces, or gallons used in any experiment. If you have a science project in the earth and space sciences where the measurements taken are typically larger than grams, centimeters, and milliliters, your measurement units will most likely be kilograms, meters, liters, and seconds.
Procedure Now that you have come up with a hypothesis, you need to develop a procedure for testing whether it is true or false. The procedure must appear in your research report and on your presentation board. The procedure involves changing your independent variable and
For more information, please visit: www.ActSoNewJersey.org
New Jersey Today's Youth...Tomorrow's Legends
8
measuring the impact this change has on the dependent variable. All the controlled variables must remain constant. Scientists run experiments more than once to verify that results are consistent. In other words, you must verify that you obtain essentially the same results every time you repeat the experiment with the same value for your independent variable. This insures that the answer to your question is not just an accident. Each time that you perform your experiment is called a run or a trial. Every good experiment also compares different groups of trials with each other. Such a comparison helps insure that the changes you see when you change the independent variable are in fact caused by the independent variable. There are two types of trial groups: experimental groups and control groups. The experimental group consists of the trials where you change the independent variable. For example, if your question asks if giving tagetes erecta half the recommended amount of water will affect their growth, then the experimental group consists of all trials in which the plants receive half the recommended amount of water. In many experiments it is important to perform a trial with the independent variable at a special setting for comparison with the other trials. This trial is referred to as a control group. The control group consists of all those trials where you leave the independent variable in its natural state. In our example, it would be important to run trials in which the plants get the recommended amount of water. These trials with the plants receiving the fully recommended amount of water provide a basis for comparison, and would insure that any changes you observed when you gave the experimental group half the recommended amount of water are, in fact, caused by the different amounts of water and not due to something else. However, not every experiment is like our plant example. In another kind of experiment, many groups of trials are performed at different values of the independent variable. For example, if your question asks whether an electric motor turns faster if you increase the voltage, you might do an experimental group of 15 trials at 1.5 volts, another group of 15 trials at 2.0 volts, 15 trials at 2.5 volts, and so on. In such an experiment you are comparing the experimental groups to each other, rather than comparing them to a single control group. You must evaluate whether your experiment is more like the plant example, which requires a special control group, or more like the motor example that does not. Remember, whether or not your experiment has a control group, every experiment has a number of control variables. Control variables are those variables which we don't want to change while we conduct our experiment, and they must be the same in every trial and every group of trials. In our plant example, we would want to make sure the room temperature, the amount of light, and the amount of plant food available to all plants were the same for every trial. Even though an experiment measuring the effect of voltage on the motor's speed of rotation may not have a control group, it still has control variables: the same brand and type of motor is used for every trial and the load on the motor is kept the same. A little advance preparation can ensure that your experiment will run smoothly and that you will minimize (or eliminate) unexpected surprises at the last minute. You will need to prepare a
For more information, please visit: www.ActSoNewJersey.org
New Jersey Today's Youth...Tomorrow's Legends
9
detailed procedure for your experiment so you can ensure consistency from beginning to end. Think about it as writing a recipe for your experiment. A clear procedure also makes it much easier for someone else to test your experiment, if they are interested in verifying how you got your results. The key elements of the procedure for an experiment are as follows:
• The procedure must tell how you will change your one and only independent variable and how you will measure that change.
• The procedure must explain how you will measure the resulting change in the dependent variable or variables.
• If applicable, the procedure should explain how the control variables will be maintained as a constant value.
• The procedure should specify how many times you intend to repeat your experiment, so you can verify that your results are reproducible.
Here’s a tip. You should have at least 15 trials for the experimental group and at least 15 trials for the control group. Science fair judges like to see between 15 and 20 trials for each group. Why? In most cases, 15 to 20 trials will give you information which will be significant. What do I mean by significant? Well, let’s just say that the more trials you run, the more likely it is that your data and the statistics you compute based on the data represent real differences between the experimental and control groups and didn’t just happen by chance or didn’t just happen because you conducted the experiment only two or three times. So that’s why in the Materials section I said that we needed 40 planting pots and 40 tagetis erectum seeds. I wanted to have 20 trials for the experimental group and 20 trials for the control group. Ok. Let’s see what our procedure would look like for our African marigolds (I mean, tagetes erecta). Sample Procedure:
1. Place a cm ruler in each pot. 2. Fill each pot with potting mix until the potting mix reaches the 11 cm mark on the ruler. 3. Remove the ruler and tap the bottom of the pot on a table or other hard surface three
times to compact the potting mix. 4. Plant one tagetis erectum seed in each pot so that the seed is two cm below the top of
the soil. 5. Number each pot in the control group from 1 to 20. 6. Number each pot in the experimental group from 21 to 40. 7. Place the numbered pots in a room with windows. 8. Water the plants every other day. Use the graduated beaker to place 240 ml of water in
each one of the pots numbered 1 to 20 (the control group). Use the graduated cylinder to place 120 ml of water in each one of the pots numbered 20 to 40 (the experimental group).
9. Every third day, record the growth of the tagetis erectum in each pot. Record the height in cm.
10. Stop the experiment after 70 days. (Remember, from your research you found that it takes about 70 days for the tagetes erecta to grow to their full height.)
For more information, please visit: www.ActSoNewJersey.org
New Jersey Today's Youth...Tomorrow's Legends
10
Here’s a tip. Just in case you missed the tip in the Materials section, I’ll repeat it here. All measurements must be taken in the metric system (grams (or kilograms), centimeters (or meters), milliliters (liters), and seconds). Science judges do not like to see inches, ounces, or gallons used in any experiment. If you have a science project in the earth and space sciences where the measurements taken are typically larger than grams, centimeters, and milliliters, your measurement units will most likely be kilograms, meters, liters, and seconds.
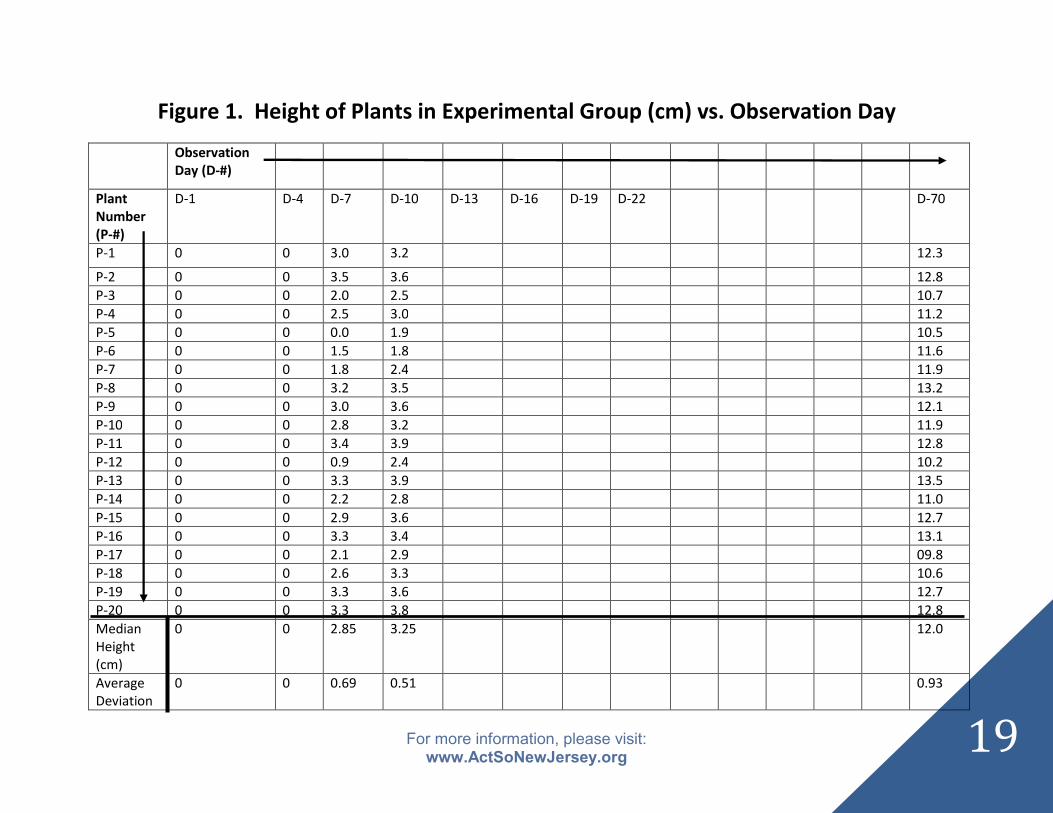
Data Now that you have gotten all of the materials and planted your seeds, you are ready to conduct your experiment and record your data. When you record your data, be sure to put it in a form which is easy to read. Also, make sure the observations you record are legible. There is nothing more frustrating than looking back at your records and not being able to read your own handwriting. The data must appear in your research report and on your presentation board. For this experiment, there are many ways to record data. Look at Figure 1 and Figure 2 to see what I did. You’ll find these and any other figures at the very end of this document. Notice what I did. The title of the first chart is “Height of Plants in Experimental Group (cm) vs. Observation Day.” There are two things which are important in this title. First, I’m telling you that I am going to record the height of the plants for each observation day. Second, I’m telling you what units I’m going to use to record the plant heights. In this case, I’m using cm. Also within the table, each column is labeled and each row is labeled. Since I already told you that I am measuring the heights in cm, it is not necessary to put units next to the numbers in the cells of the table. The title already told you that the heights recorded in each cell are in cm. Here’s a tip. You must label your charts, tables, and graphs so that they clearly show what you are recording. If the chart, table, or graph contains measurements, be sure to include the units of the measurement somewhere on the chart, table, or graph. The best place to put the units is in the title of the chart, table, or graph. Now that I have all these numbers, what am I going to do with them? Let’s calculate some statistics. Calculating statistics will help us make sense out of the data and help us determine if our hypothesis was correct. For these types of numbers it is best to calculate the median height and average deviation for the control group on each observation day and the median height and average deviation for the experimental group on each observation day. The median is the midpoint in a distribution. For example, suppose you have 5 numbers (1.0, 2.0, 2.5, 2.7, 1.5, and 1.7). If we take these numbers and put them in order from high value to low value, the median would be the 3rd value (the value which is right in the middle of the 5 numbers when they are ordered from high value to low value). The median gives you a ball-park value of the observations you took. The median is a useful statistic to use if you have a lot of data and you want to find out what the typical value of the data is. In our science experiment the units associated with the median height will be cm. Now let’s talk about what the average deviation. The average deviation will tell you how much different the observations are from each other on any given observation day. For example, suppose you have 5 numbers (1.0, 2.0, 2.5, 2.7, 1.5, and 1.7). These numbers don’t differ that much from each other. The average deviation for this set of numbers is 0.40. Now let’s look at
For more information, please visit: www.ActSoNewJersey.org
New Jersey Today's Youth...Tomorrow's Legends
11
another set of 5 numbers (1.5, 1.0, 3.0, 7.0, and 9.0). The average deviation for these numbers is 2.7. The average deviation of the second set of numbers (2.7) is larger than the average deviation of the first set of numbers (0.40) because the numbers in the second set are not that close to each other. They are more spread out. But we’ll talk more about these statistics in the Results and Analysis section and Conclusion section. Who cares if he numbers are spread out? You do. The average deviation is a mathematical tool to help us assess how far the values are spread above and below the median. A high average deviation shows that the data are widely spread (less reliable) and a low standard deviation shows that the data are clustered closely around the mean (more reliable). Here’s a tip. A common assumption of statistics-users is that data are "normally" distributed. Many pages have been written by others on this topic. I'm going to leave you in the dark (like many statistics-users) about what this assumption means and how you test it. There are several good courses and books that would include these topics. Also, you can go to your math teacher to find out more about what normal distribution means. The good news is that there are statistics you can use even if you aren’t sure if the data you collect are normally distributed. Statistics that provide useful information even if applied to not-"normally" distributed data are call robust statistics. Median and average deviation are considered robust statistics. So, when it is useful to calculate statistics and you don’t know if your data are normally distributed, be sure to calculate the median and the average deviation. I also have another figure. Figure 3 is a plot of the median height values for the experimental and control groups. Why did I choose to plot the median values? Why didn’t I plot all the data points? That’s a good question. Let’s think about it for a minute. If we look at the data points for the experimental group, we have measurements for 20 plants and we are going to take measurements every three days up to and including day 70. So that means we take 20 measurements on 24 different occasions. That’s 480 observations for just the experimental group. You have another 480 observations for the control group. If we tried to put that many data points on a graph, the only thing we would do is to make a graph which looks like spaghetti! So we’ve got to simplify our data presentation. If we plot the median height value for each day, then, we’ve reduced the number of points from 480 to 70 for the control group and from 480 to 70 for the experimental group. Also notice that the axes of the graph are labeled. The abscissa (the x-axis) is labeled “Observation Day.” The ordinate (the y-axis) is labeled “Median Height (cm).” Notice I put “cm” in parenthesis in the graph’s title and on the ordinate. This is to inform the reader that the data will be presented in terms of cm. Always, always, always specify your units on any chart, table, or graph you present. There may be other types of calculations you can make. For example, you could calculate the growth rate of the tagetes erecta. Discuss the possibilities with your science and math teachers. Also, you will see in Figure 3 that I did not plot the median height for each observation day. I did that to save time. You should not take this short-cut. If you were doing this experiment, you would have a figure which shows the median height on each observation day.
Results and Analysis
For more information, please visit: www.ActSoNewJersey.org
New Jersey Today's Youth...Tomorrow's Legends
12
The Results and Analysis section must appear in both your research report and on your presentation board. In the graphs and charts which appear in the Data section, you have statistics. In the Results and Analysis section you should state the formulas (or equations) for the statistics you used. Come on, you didn’t think you were going to get away with no equations in your report, did you? This is where you go to a statistics book and look up the formula for any statistics you use. In our case, I need to place the formulas for the median and average deviation into the Results and Analysis section of my research report. There is no need to place the statistical formulas on your presentation board. However, you should be sure that any statistics you calculate are placed on your presentation board. Here’s a tip. Although you don’t have to place the formulas for the statistics on your presentation board, you are responsible for knowing how these statistics work and what they mean. In general, you should check with your math and/or science teacher to ensure that you have a good understanding of any formula or equation which you present in your research report. It is very likely that a science fair judge will ask you to explain what the statistic or formula means. So become comfortable with any and all equations which you have used. That also means that you should know if a particular statistic should be written with units associated with it. Median should always be expressed with units. In our experiment, the units are cm. Average deviation never has units. When you look at the formulas for median and average deviation, you will understand why. Ask your math teacher for help in understanding these statistics and any other statistics which you may use in your particular experiment. Here’s another tip. If your science project falls into the mathematics category, you want to include mathematical equations in both your research report as well as on your presentation board. In your research report, you want to include virtually all equations which help to explain your purpose, procedure, and results. On your presentation board, place only those equations in your Purpose section which are crucial to making whatever point you want to make in your Purpose section. For your Procedure, Data, and Results sections on your presentation board, do the same thing. Ask your math and science teachers for advice on what equations you should include in these sections. Now that you have taken your observations and you have calculated statistics, you are ready to look at your statistics and think about what all these numbers mean. As I mentioned in the Data section, you have a lot of data. It’s very hard to look at that much data and make sense out of it. That’s where statistics come in. Statistics help us make sense out of the data. Statistics allow us to reason mathematically from data in order to make some statement about the data. So, instead of looking at all the data (that’s 480 observations for the experimental group and 480 observations for the control group), let’s look at what our statistics are telling us. If we look at the statistics, we find that
• The plants in the control group started growing above the surface of the soil sooner than the experimental group. The control group broke through the soil surface on day 4. The experimental group did not appear above the soil surface until day 7.
• On any given observation day, the plants in the control group were usually taller than the plants in the experimental group. For example, on day 10, the median height for the control group was 5.0 cm. On day 10, the median height for the experimental group was

For more information, please visit: www.ActSoNewJersey.org
New Jersey Today's Youth...Tomorrow's Legends
13
3.25 cm. By day 70, the control group had a median height of 24.6 cm which was more than double the median height of the control group (12.0 cm). One notable exception to this trend was on day 7. On day 7 both groups had a median height of 2.85 cm.
• The average deviation for the control group was usually higher than the average deviation for the experimental group.
Notice how this analysis works. I made general statements backed up by numbers. For example, I said that the plants in the experimental group were usually taller than the plants in the control group. And then I gave a specific example with specific numbers. As often as you can, back up anything you say with numbers. You worked hard to get these numbers, you should use them. Plus the numbers help you back up your statement with facts. The statement is an assertion. It’s what you believe to be true. The numbers are the facts to back up your assertion (or what you believe to be true). Also notice that I discussed exceptions. For instance, most of the time, the median height of the control group was larger than the median height of the experimental group. This was not the case on day 7. Within your research report, you should explain the reason for this exception. For these data you can see that plant number 26, 30, 32, 35, 36, and 38, grew slowly for the first 4 days. That’s the easy answer. In addition to stating the easy answer, you should go beyond stating the easy (and obvious) answer. You can see in your data that these plants were noticeably smaller than the rest of the plants in the control group, but why? Try to figure out what caused this noticeably smaller growth. Was it due to the fact that perhaps someone didn’t open the blinds on that side of the room, so these plants did not get the same amount of sun for a period of time? Were there some other reasons? If so, you should present them in your research report. By the way, the Results and Analysis section in your research report should be at least one page. Here’s a tip. The Results and Analysis section in your research report should talk about general trends, exceptions, and the reason for the exceptions. The Results and Analysis section on your presentation board should be a condensed version of the Results and Analysis section in your research report. On your presentation board you probably will not have enough space to explain the exceptions, just note them on your presentation board. However, you should be prepared to discuss the exceptions and the reason for the exceptions with the judges. Believe me, they will ask you about them. Here’s another tip. Results from experiments dealing with medicine and health may have exceptions. For example, all microbes (which you believe are the same type of microbe) in a particular sample may not respond to the same amount of UV radiation in the same way. The fact that the microbes responded differently to the same amount of UV radiation could be due to the fact that some microbes in the sample were contaminated. A different response could occur because one or more of the control variables were not controlled (like you thought they were) in every single experiment run. Unless you are working in a highly controlled laboratory environment, exceptions will occur. So don’t think your experiment is a failure just because you see a few exceptions. What the science fair judges are looking for is for you to explain why the exceptions occurred. If you are not sure why the exceptions occurred, give reasons why you think the exceptions occurred. The science fair judges also want you to talk about ways to revise your experiment to minimize these exceptions.
For more information, please visit: www.ActSoNewJersey.org
New Jersey Today's Youth...Tomorrow's Legends
14
Conclusion A Conclusion section must be in both your research report as well as on your presentation board. Because space is limited on your presentation board, the conclusions on your presentation board should be a condensed version of the Conclusion section in your research report. Your conclusions summarize how your results support or contradict your original hypothesis. Were the results what you expected? Why or why not? Include key background facts from your Purpose section and from information you learned when you were researching your topic to help explain your results as needed. Make sure you perform a hypothesis check. A hypothesis check is a statement that says whether you proved or disproved your hypothesis. (Engineering, mathematics, and computer science projects should state whether they met their design criteria.) State the relationship between the independent and dependent variable. For example, based on your data and the statistics which you calculated, is the relationship between independent and dependent variables (which you stated in your hypothesis) true? Why are why not? You should also summarize and evaluate your experimental procedure, making comments about its success and effectiveness. Suggest changes in the procedure (or design) and/or possibilities for further study. If the results of your experiment did not support your hypothesis, don't change or manipulate your results to fit your original hypothesis, simply explain why things did not go as expected. If you think you need additional experimentation, describe what you think should happen next. Scientific research is an ongoing process, and by discovering that your hypothesis is not true, you have already made huge advances in your learning that will lead you to ask more questions that lead to new experiments. Science fair judges do not care about whether you prove or disprove your hypothesis; they care about how much you learned. Here’s a tip. Remember to always include a hypothesis check in your Conclusion section and make sure it appears in your research report as well as on your presentation board. Here’s another tip. Science fair judges like to see that you have ideas about how the project could be improved or ideas for future research. Make sure you put these ideas in your research report and on your presentation board (if you have space) and be prepared to talk about these ideas when the judges interview you.
Bibliography
You must include a bibliography in your research report, but you do not have to include a bibliography on your science project presentation board. A bibliography is a listing of the books, science journals, and Internet sources you use in designing, carrying out, and understanding your science fair project. Notice that I not only listed the Internet as a source, but also books, and science journals. In your research report and on your science project presentation board, it

For more information, please visit: www.ActSoNewJersey.org
New Jersey Today's Youth...Tomorrow's Legends
15
is very important to have more than just Internet sources to include in your bibliography. It’s OK to use Internet articles in your bibliography, but you must use other information (like books and journal articles) in your bibliography. Why? Because before a book or journal article is printed, it must be reviewed by knowledgeable scientists. Internet articles do not always go through this type of rigorous scientific review. By including information from books and science journals, you are telling the science fair judges that you have gone to the trouble of finding reputable and scientifically sound information. Here’s a tip: Science judges do not want to see a bibliography made up of only Internet sources. You should have no more than three Internet articles listed in your bibliography. For each Internet citation, you should have a least two other types of citations. So, for example, if you have three Internet articles listed in your bibliography, you should have at least six other types of citations (e.g., books and journal articles) for a total of at least 9 citations in your bibliography.
You’re Ready to Go
Don’t forget to rehearse your presentation. Ask your science and math teachers to listen to your presentation and ask them to critique how you present. They may stop you with questions. Be sure to write any good question down, especially if you don’t know the answer. Work with your science or math teacher to find the answer before you make your ACT-SO presentation. Get others to listen to your presentation. They may not know anything about science, but they can tell you if you are speaking loudly enough, or if you look nervous, or if you are not looking them in the eye when you talk to them. Here’s a tip: Be sure to rehearse your presentation in front of others. If you have trouble getting someone to listen to your presentation, stand in front of a mirror and give it to yourself. Looking at yourself giving the presentation will give you practice looking someone in the eye when you are talking to them and will let you see how others (especially the science fair judges) will see you.
Well, that’s it. If you follow the advice given, you will learn a lot and have a fine presentation at ACT-SO. Good luck.
Where Did This Information Come From?
The information you have just read summarizes the advice and knowledge of ACT-SO science judges representing NOAA (National Oceanic and Atmospheric Administration), Dow Chemical, NASA and Lockheed Martin. The websites www.sciencebuddies.org and www.physics.csbsju.edu/stats/descriptive2.html were also useful references. This document was reformatted by Shaun Adams, New Brunswick, NJ ACT-SO Chairperson.

For more information, please visit: www.ActSoNewJersey.org
New Jersey Today's Youth...Tomorrow's Legends
16
Requirements
Biology/Microbiology, Chemistry/Biochemistry, Computer Science, Earth/Space Sciences, Engineering, Mathematics, Medicine/Health and Physics
1. Only one (1) project can be entered per area.
2. Six (6) copies of a typed 8-½ inch by 11 inch, double-spaced scientific paper must
accompany the project to be submitted. The content of the paper, which should not exceed five (5) pages, should include: a short introduction describing the background and purpose of the work, an experimental section including both methods and results, and a concluding section discussing the results and their implications. Tables, graphs, charts, maps, photographs, raw statistical data, etc. should be included whenever possible. They must also include references used and acknowledgements of any individuals who served as direct academic resources. The student’s name, page number and unit name and number must be on the top of each page. Six (6) copies of the supporting documents, as well as the six copies of the paper must be submitted on or before the specified deadline.
NOTE: The deadline for submission of National registration documents is the first Friday in May. No materials or copies will be accepted at the National Competition.
3. The contestant is to make an oral presentation explaining his or her project. The oral
presentation should not exceed five (5) minutes. This time limit does not include the time required for the judges to ask question and for the contestant to respond to the judges’ questions.
4. Contestants are responsible for providing their own equipment. 5. The NAACP ACT-SO Program will provide electrical power and display tables. 6. Contestants must submit a Science Verification Form from a qualified scientist or science
teacher with an earned professional degree or license. This person can also serve as a coach, working closely with the student during the course of the project to ensure the accuracy of the student’s research and qualifications for entry.
Scientific Projects will be judged by the following criteria:
• Quality of Research (40 pts) 1. Scientific Approach/Method 2. Validity of Information 3. Validity of Conclusion(s)
• Depth of Understanding (40 pts) 1. Oral Presentation 2. Knowledge Gained and Creativity 3. Thoroughness 4. Individual Work
For more information, please visit: www.ActSoNewJersey.org
New Jersey Today's Youth...Tomorrow's Legends
17
• Written Report (10 pts)
• Visual Presentation (10 pts)
ACT-SO Safety Procedures
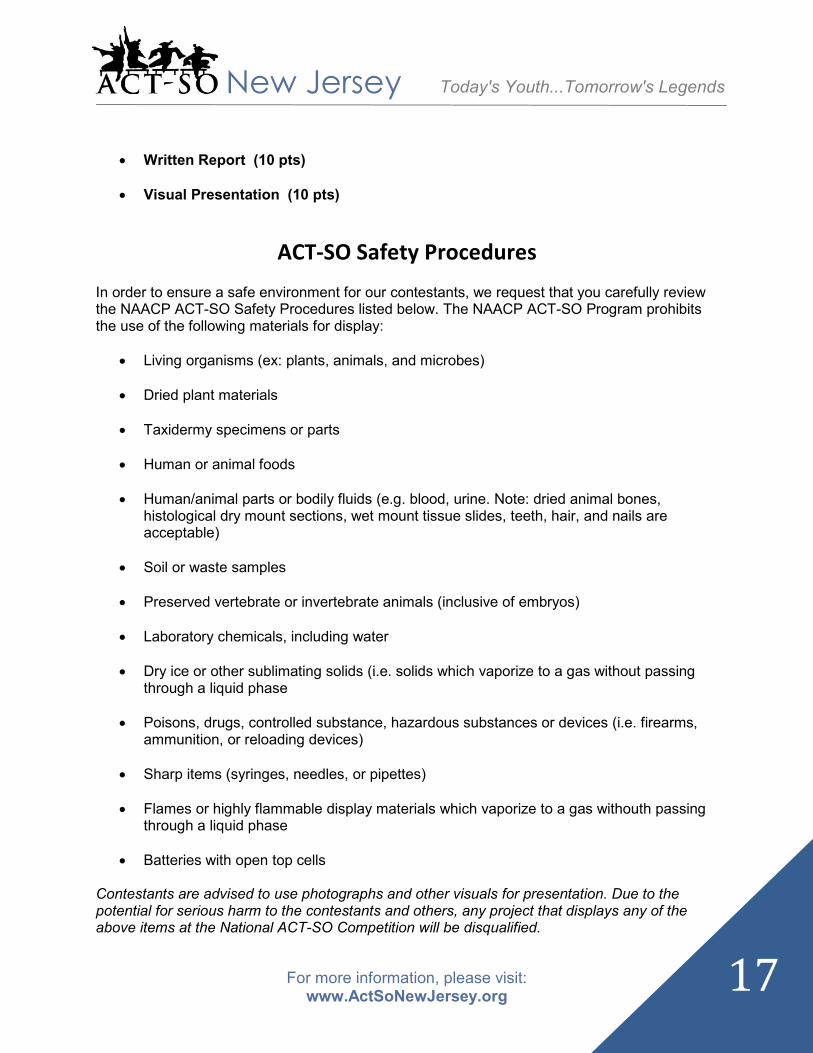
In order to ensure a safe environment for our contestants, we request that you carefully review the NAACP ACT-SO Safety Procedures listed below. The NAACP ACT-SO Program prohibits the use of the following materials for display:
• Living organisms (ex: plants, animals, and microbes)
• Dried plant materials
• Taxidermy specimens or parts
• Human or animal foods
• Human/animal parts or bodily fluids (e.g. blood, urine. Note: dried animal bones, histological dry mount sections, wet mount tissue slides, teeth, hair, and nails are acceptable)
• Soil or waste samples
• Preserved vertebrate or invertebrate animals (inclusive of embryos)
• Laboratory chemicals, including water
• Dry ice or other sublimating solids (i.e. solids which vaporize to a gas without passing through a liquid phase
• Poisons, drugs, controlled substance, hazardous substances or devices (i.e. firearms, ammunition, or reloading devices)
• Sharp items (syringes, needles, or pipettes)
• Flames or highly flammable display materials which vaporize to a gas withouth passing through a liquid phase
• Batteries with open top cells Contestants are advised to use photographs and other visuals for presentation. Due to the potential for serious harm to the contestants and others, any project that displays any of the above items at the National ACT-SO Competition will be disqualified.
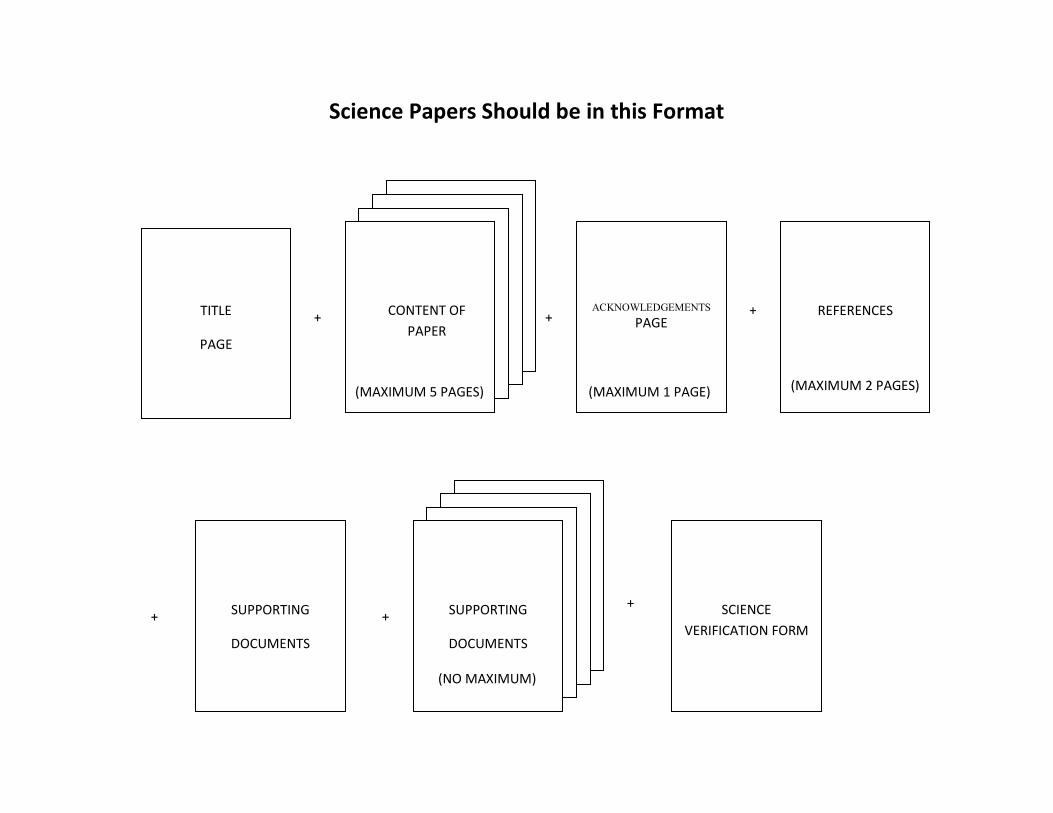
Science Papers Should be in this Format
+
TITLE
PAGE
CONTENT OF
PAPER
SCIENCE
VERIFICATION FORM
SUPPORTING
DOCUMENTS
REFERENCES
ACKNOWLEDGEMENTS
PAGE
SUPPORTING
DOCUMENTS
+ +
+ + +
(MAXIMUM 5 PAGES) (MAXIMUM 1 PAGE) (MAXIMUM 2 PAGES)
(NO MAXIMUM)
For more information, please visit: www.ActSoNewJersey.org
19
Figure 1. Height of Plants in Experimental Group (cm) vs. Observation Day
Observation
Day (D-#)
Plant
Number
(P-#)
D-1 D-4 D-7 D-10 D-13 D-16 D-19 D-22 D-70
P-1 0 0 3.0 3.2 12.3
P-2 0 0 3.5 3.6 12.8
P-3 0 0 2.0 2.5 10.7
P-4 0 0 2.5 3.0 11.2
P-5 0 0 0.0 1.9 10.5
P-6 0 0 1.5 1.8 11.6
P-7 0 0 1.8 2.4 11.9
P-8 0 0 3.2 3.5 13.2
P-9 0 0 3.0 3.6 12.1
P-10 0 0 2.8 3.2 11.9
P-11 0 0 3.4 3.9 12.8
P-12 0 0 0.9 2.4 10.2
P-13 0 0 3.3 3.9 13.5
P-14 0 0 2.2 2.8 11.0
P-15 0 0 2.9 3.6 12.7
P-16 0 0 3.3 3.4 13.1
P-17 0 0 2.1 2.9 09.8
P-18 0 0 2.6 3.3 10.6
P-19 0 0 3.3 3.6 12.7
P-20 0 0 3.3 3.8 12.8
Median
Height
(cm)
0 0 2.85 3.25 12.0
Average
Deviation
0 0 0.69 0.51 0.93

For more information, please visit: www.ActSoNewJersey.org
20
Figure 2. Height of Plants in Control Group (cm) vs. Observation Day
Observation
Day (D-#)
Plant
Number
(P-#)
D-1 D-4 D-7 D-10 D-13 D-16 D-19 D-22 D-70
P-21 0 2.7 4.0 6.7 26.7
P-22 0 2.0 3.5 5.6 25.2
P-23 0 1.5 2.9 4.7 24.3
P-24 0 2.1 3.7 6.2 25.4
P-25 0 1.3 2.9 4.3 22.8
P-26 0 0.6 1.8 4.1 20.9
P-27 0 1.8 3.1 5.2 23.6
P-28 0 2.2 3.6 6.0 26.0
P-29 0 1.6 2.9 5.6 25.8
P-30 0 0.7 1.8 4.8 24.3
P-31 0 1.6 2.4 4.8 24.6
P-32 0 0.4 2.1 5.3 25.7
P-33 0 2.0 4.2 6.8 27.0
P-34 0 1.7 3.3 5.5 26.2
P-35 0 0.9 1.6 4.0 23.8
P-36 0 0.8 1.5 3.6 22.4
P-37 0 1.3 2.1 4.2 24.6
P-38 0 0.4 0.9 3.3 19.2
P-39 0 1.7 2.6 4.8 24.6
P-40 0 1.9 2.8 5.3 25.7
Median
Height
(cm)
0 1.60 2.85 5.00 24.6
Average
Deviation
0 0.51 0.73 0.78 1.37
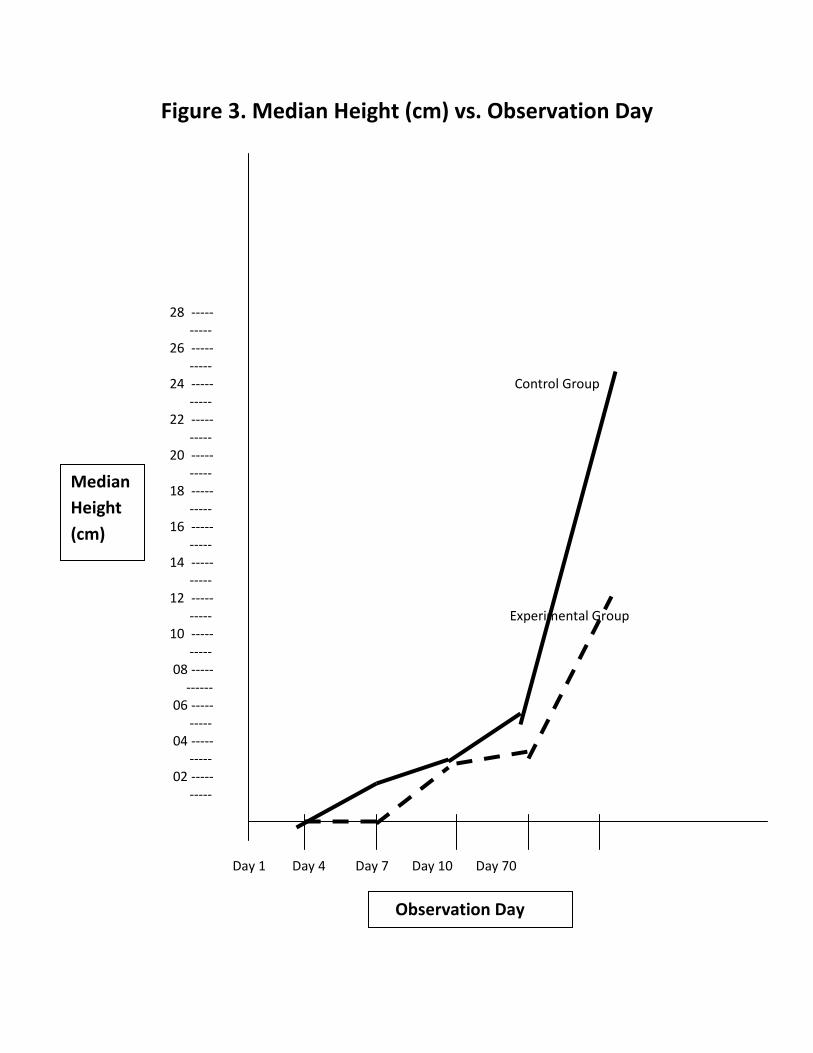
Figure 3. Median Height (cm) vs. Observation Day
28 -----
-----
26 -----
-----
24 ----- Control Group
-----
22 -----
-----
20 -----
-----
18 -----
-----
16 -----
-----
14 -----
-----
12 -----
----- Experimental Group
10 -----
-----
08 -----
------
06 -----
-----
04 -----
-----
02 -----
-----
Day 1 Day 4 Day 7 Day 10 Day 70
Median
Height
(cm)
Observation Day
Related Documents