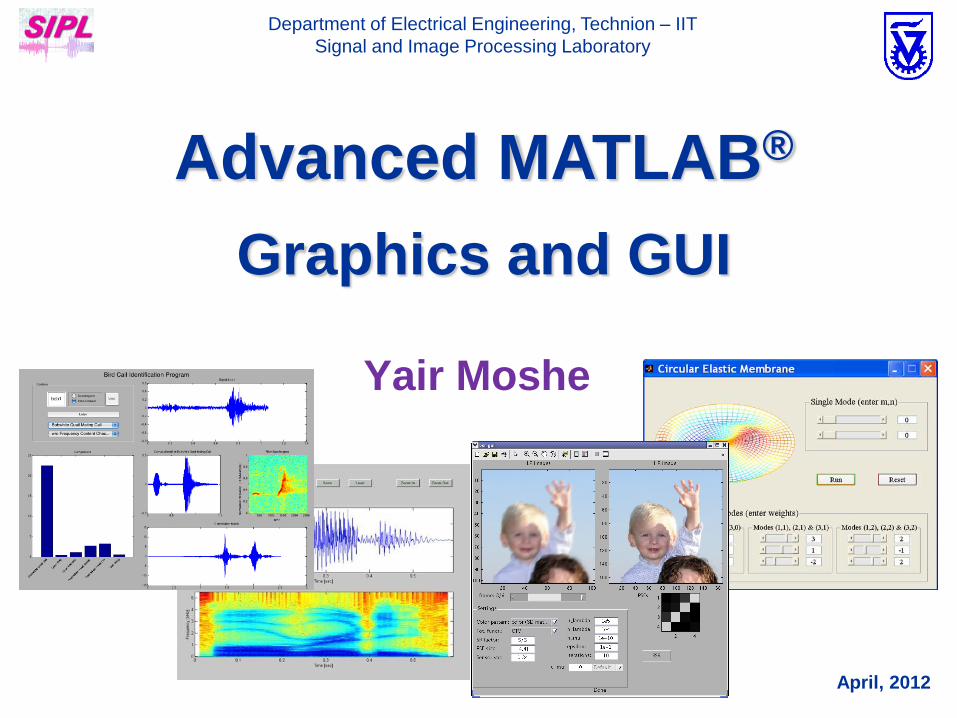
Yair Moshe Department of Electrical Engineering, Technion – IIT Signal and Image Processing Laboratory April, 2012 Advanced MATLAB ® Graphics and GUI

Welcome message from author
This document is posted to help you gain knowledge. Please leave a comment to let me know what you think about it! Share it to your friends and learn new things together.
Transcript
Yair Moshe
Department of Electrical Engineering, Technion – IIT
Signal and Image Processing Laboratory
April, 2012
Advanced MATLAB®
Graphics and GUI
2
Outline
• Graphics
• Animation
• Image and Video
• Handle Graphics Objects
• Creating GUI using GUIDE
3
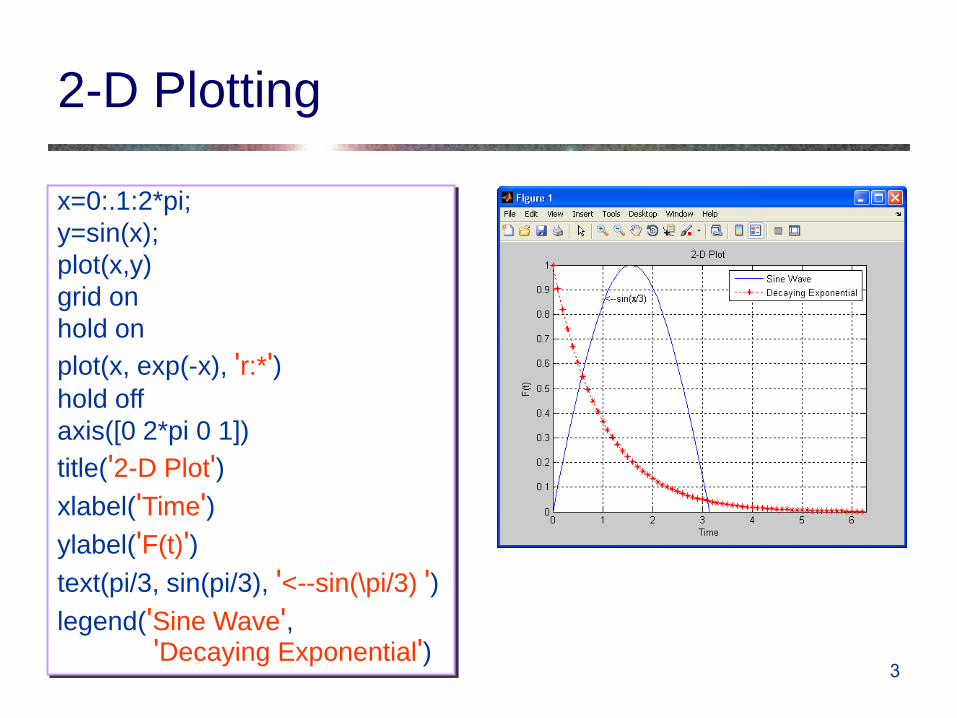
2-D Plotting
x=0:.1:2*pi;
y=sin(x);
plot(x,y)
grid on
hold on
plot(x, exp(-x), 'r:*') hold off
axis([0 2*pi 0 1])
title('2-D Plot')
xlabel('Time')
ylabel('F(t)')
text(pi/3, sin(pi/3), '<--sin(\pi/3) ')
legend('Sine Wave', 'Decaying Exponential')

4
Line Specification
Specifier Line Color Specifier Marker
r red . point
g green o circle
b blue x cross
c cyan + plus
m magenta * asterix
y yellow s square
k black d diamond
w white v triangle down
Specifier Line Style ^ triangle up
- solid < triangle left
-- dashed > triangle right
: dotted p pentagram
:. dash-dot h hexagram

5
The Figure Window
The figure window contains useful actions in its menu
and toolbars:
• Zooming in and out
• Panning
• Rotating 3-D axes (and other camera actions)
• Copying & pasting
• Plot Edit Mode
• Plot tools (interactive plotting) – Figure Palette
– Plot Browser
– Property Inspector
• Data Cursor Mode
• Data brushing and linking
6
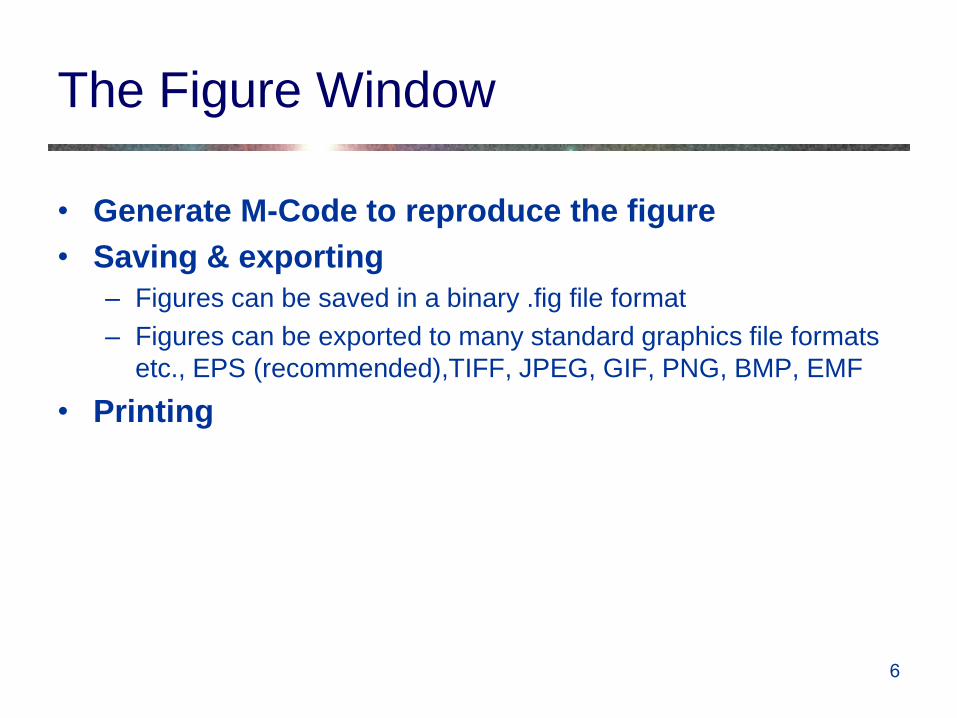
The Figure Window
• Generate M-Code to reproduce the figure
• Saving & exporting
– Figures can be saved in a binary .fig file format
– Figures can be exported to many standard graphics file formats
etc., EPS (recommended),TIFF, JPEG, GIF, PNG, BMP, EMF
• Printing

7
Subplots & Scales for Axes
subplot(2,2,1)
x=0:.1:2*pi;
plot(x, exp(-x))
subplot(2,2,2)
semilogy(x, exp(-x))
subplot(2,2,3)
t = 0:900;
z1 = 1000*exp(-0.005*t);
z2 = sin(0.005*t);
plotyy(t,z1,t,z2,'semilogy','plot');
subplot(2,2,4)
plot(peaks)

8
Data Brushing and Linking
• Data Brushing
– Manually select observations on an interactive data display
– Can select, remove, and replace individual data values
• Data Linking
– Linked plots visibly respond to changes in the current workspace
variables they display and vice versa
• Each one of these tools is useful by itself but when
used together they are very powerful
9
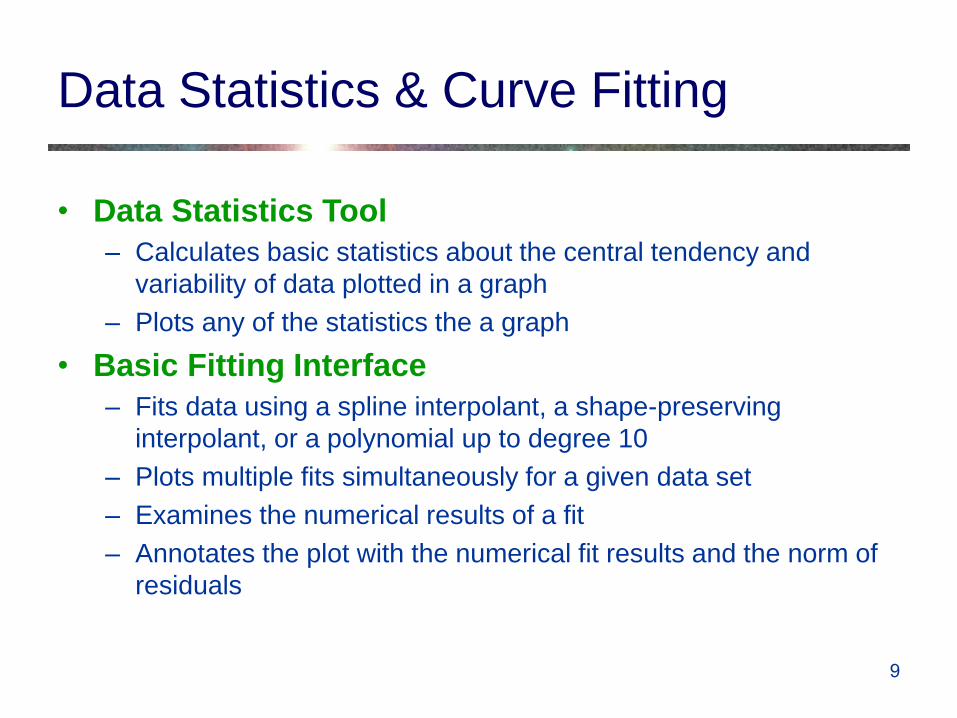
Data Statistics & Curve Fitting
• Data Statistics Tool
– Calculates basic statistics about the central tendency and
variability of data plotted in a graph
– Plots any of the statistics the a graph
• Basic Fitting Interface
– Fits data using a spline interpolant, a shape-preserving
interpolant, or a polynomial up to degree 10
– Plots multiple fits simultaneously for a given data set
– Examines the numerical results of a fit
– Annotates the plot with the numerical fit results and the norm of
residuals
10
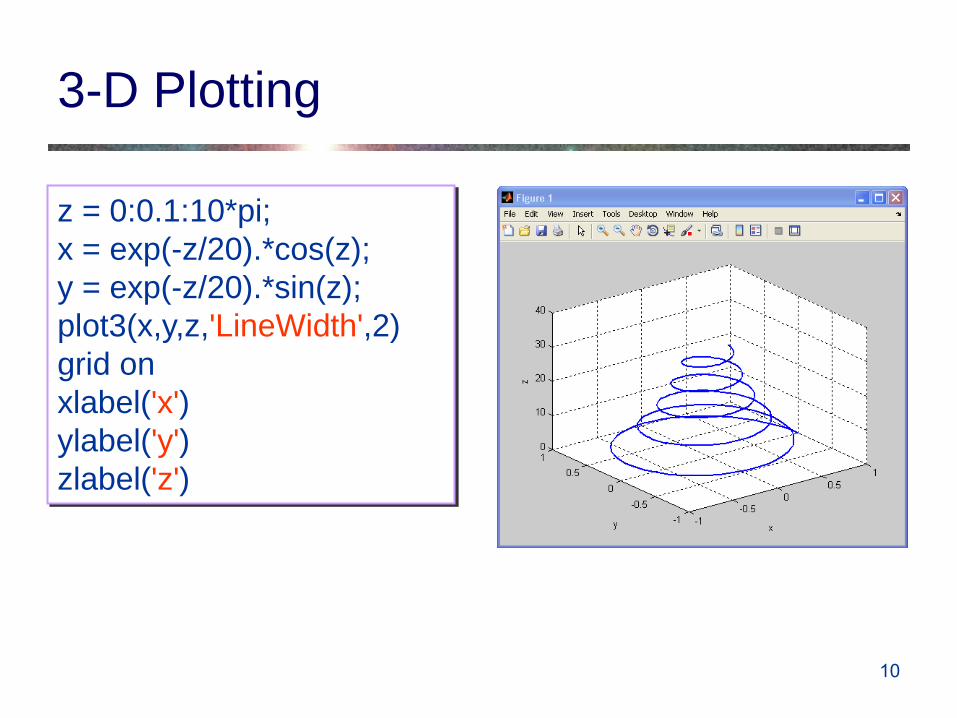
3-D Plotting
z = 0:0.1:10*pi;
x = exp(-z/20).*cos(z);
y = exp(-z/20).*sin(z);
plot3(x,y,z,'LineWidth',2)
grid on
xlabel('x')
ylabel('y')
zlabel('z')
11
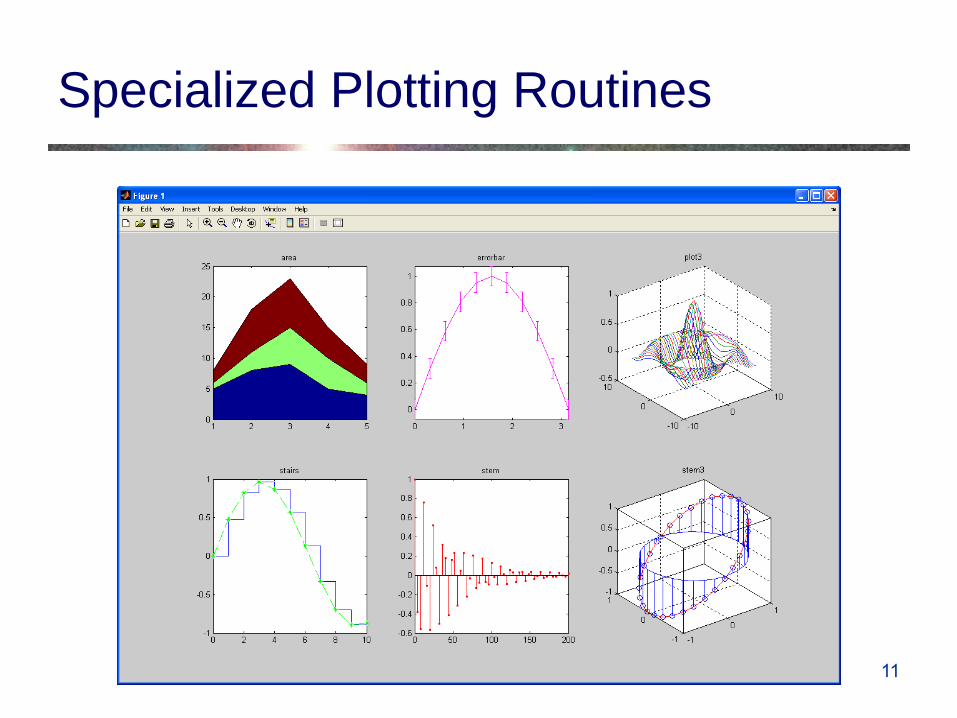
Specialized Plotting Routines

12
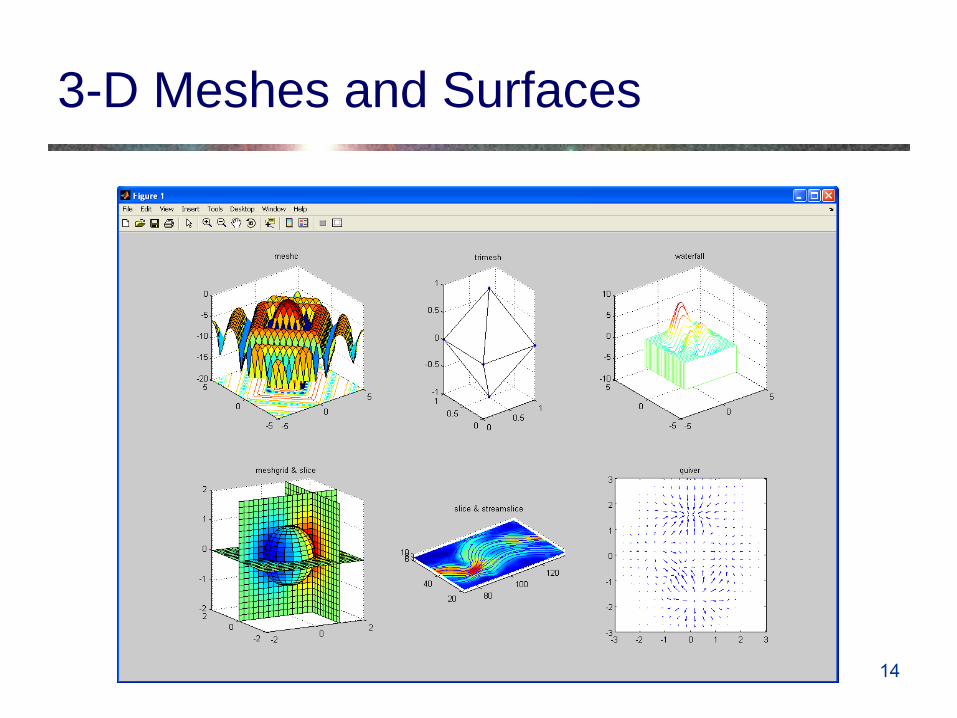
3-D Meshes and Surfaces

13
3-D Meshes and Surfaces
14
3-D Meshes and Surfaces

15
Outline
• Graphics
• Animation
• Image and Video
• Handle Graphics Objects
• Creating GUI using GUIDE
16
Animation
MATLAB provides two ways of generating moving,
animated graphics:
1. On the fly - Continually erase and then redraw the
objects on the screen, making incremental
changes with each redraw
2. Frame by frame capture and playback - Save a
number of different pictures and then play them
back as a movie

17
On the Fly Animation, 1st example
% initialize surface object
x = -pi:0.1:pi;
xsize = size(x,2);
f = zeros(xsize);
for y = 1:xsize
f(:,y) = cos(y/xsize*pi) + sin(x);
end
% draw surface first time
hSurface = surface(f, 'LineStyle', 'none');
view(3); % set the default 3D view

18
On the Fly Animation, 1st example
% function drawing loop
for j=0:0.01:10
% update surface function
for y = 1:xsize
f(:,y) = cos(y/xsize*pi+j) + sin(x+j);
end
% update surface ZData
set(hSurface, 'ZData', f);
drawnow;
end

19
On the Fly Animation, 2nd example
t = 0:pi/20:2*pi;
y = exp(sin(t));
h = plot(t,y,'YDataSource','y');
for k = 1:.1:10
y = exp(sin(t.*k));
refreshdata(h,'caller') % Evaluate y in the function workspace
drawnow; pause(.1)
end

20
Frame by Frame Animation
[x,y] = meshgrid([-10:0.5:10]);
for j = 1:15
z = besselj(0, (j-1)*0.2 + sqrt(x.^2 +y.^2));
surf(x,y,z)
axis([-10 10 -10 10 -.5 1])
M(j) = getframe;
end
frame_order = [1:15 14:-1:1];
number_repeats = 5;
movie(M, [number_repeats frame_order]);
Example of frame by frame movie creation and playing:

21
Outline
• Graphics
• Animation
• Image and Video
• Handle Graphics Objects
• Creating GUI using GUIDE
22
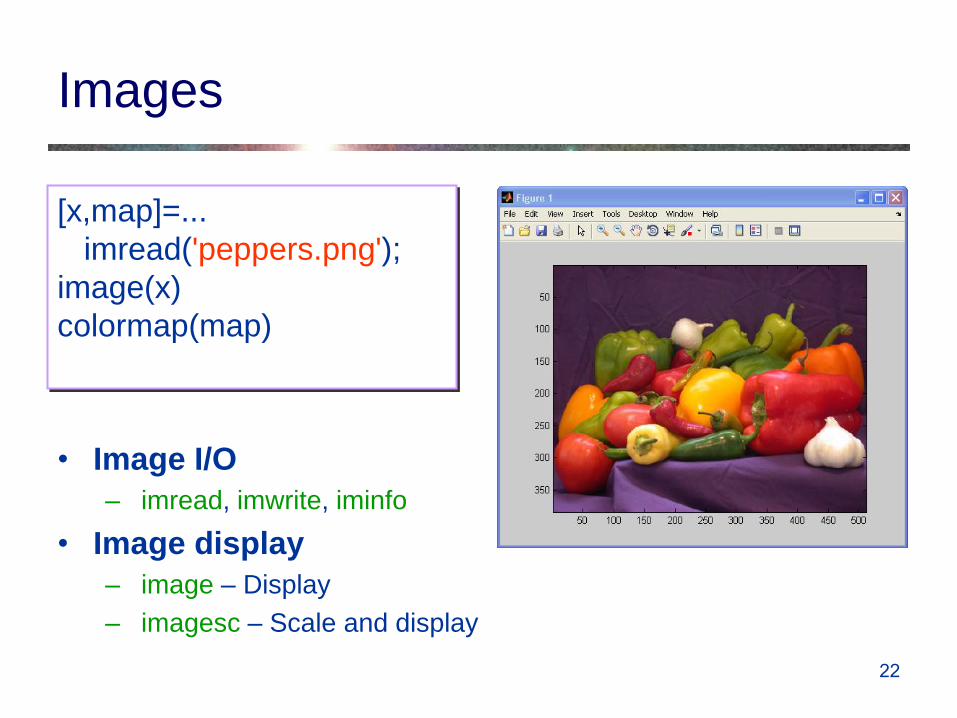
Images
[x,map]=...
imread('peppers.png');
image(x)
colormap(map)
• Image I/O
– imread, imwrite, iminfo
• Image display
– image – Display
– imagesc – Scale and display
23
Images
• Image display
– imshow – Display
– subimage – Display multiple images in a single figure even if
they have different colormaps
• Image exploration
– imtool – Provides tools for pixel information, pixel region,
distance, image information, adjust contrast, crop image, and
display range

24
Video
• Media Player (from Simulink)
– mplay - View video from MATLAB workspace, multimedia file, or
Simulink model
• AVI
– aviread, avifile, addframe, close, aviinfo – Allows frame-by-
frame manipulation of AVI files, old an not recommended
25
Video
• Video reader & writer
– VideoReader, VideoWriter - Read and write video data from a
file
– Replaces counterpart AVI functions
– VideoReader replaces mmreader
– VideoWriter supports 'Motion JPEG AVI‘, ‘Motion JPEG 2000’,
'Uncompressed AVI‘, ‘MPEG-4’ (H.264)

26
Video I/O example
% Open input and output files
inFile = VideoReader('xylophone.mpg');
outFile = VideoWriter('out.avi', 'Motion JPEG AVI');
open(outFile);
% Read one frame at a time
for k = 1 : inFile.NumberOfFrames
curFrame = read(inFile, k);
outFrame = curFrame * 2;
writeVideo(outFile, outFrame); % Write to output file
% Show input and output
…
end
close (outFile);

27
Computer Vision System Toolbox
hvfr = vision.VideoFileReader('viplanedeparture.avi');
hp = vision.VideoPlayer;
while ~isDone(hvfr)
videoFrame = step(hvfr);
step(hp, videoFrame);
end
release(hp);
release(hvfr);
Example of reading and playing a video:

28
Outline
• Graphics
• Animation
• Image and Video
• Handle Graphics Objects
• Creating GUI using GUIDE

29
Handle Graphics Objects
• Handle Graphics is an object-oriented structure for
creating, manipulating and displaying graphics
• Graphics objects are the basic drawing elements
used in MATLAB
• Every graphics object has:
– A unique identifier, called a handle
– A set of characteristics, called properties

30
Graphics Objects Hierarchy
Objects are organized into a hierarchy:

31
Core Graphics Objects
Axes (2-D) Patch
Surface
Axes (3-D)
Image
Figure Line Text
32
Composite Graphics Objects
• Composite Objects are core objects that have been grouped together to provide a more convenient interface
• Plot objects – areaseries, barseries, contourgroup, errorbarseries, lineseries,
quivergroup, scattergroup, stairseries, stemseries, surfaceplot
• Group objects – hggroup – Enables to control visibility or selectability of a group
of objects
– hgtransform – Enables to transform (etc., rotate, translate, scale) a group of objects
• Annotation objects – Created in a hidden axes that extends the full size of the figure
– Enables to specify the locations anywhere in the figure using normalized coordinates
33
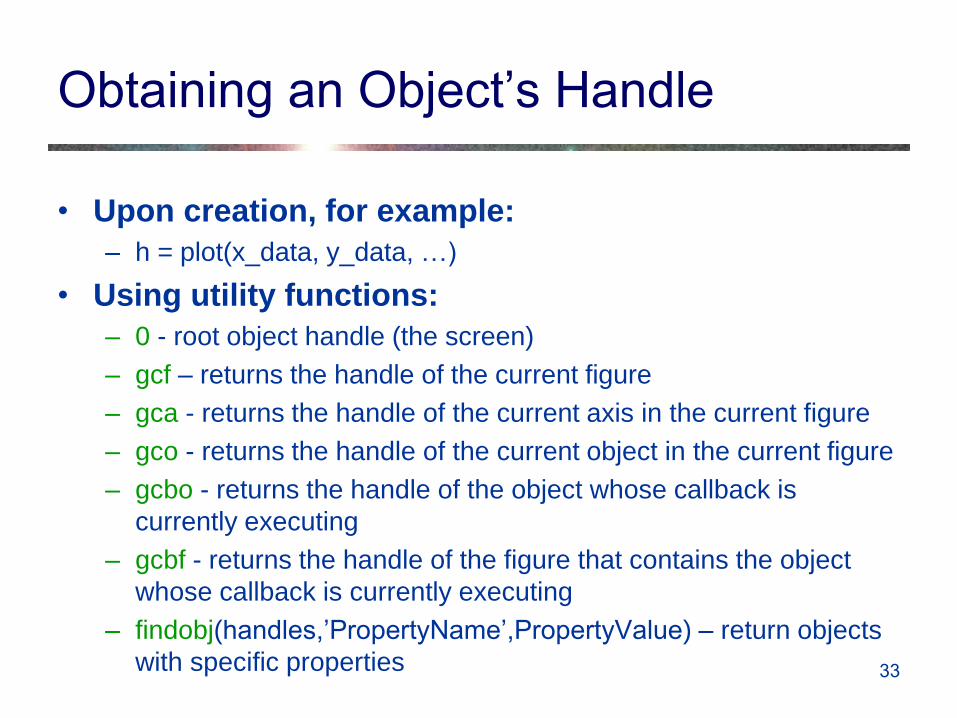
Obtaining an Object’s Handle
• Upon creation, for example:
– h = plot(x_data, y_data, …)
• Using utility functions:
– 0 - root object handle (the screen)
– gcf – returns the handle of the current figure
– gca - returns the handle of the current axis in the current figure
– gco - returns the handle of the current object in the current figure
– gcbo - returns the handle of the object whose callback is
currently executing
– gcbf - returns the handle of the figure that contains the object
whose callback is currently executing
– findobj(handles,’PropertyName’,PropertyValue) – return objects
with specific properties

34
Setting and Getting Properties
• Return a list of all object properties and their current values: – get(handle)
• Return current value of an object property: – get(handle, ‘PropertyName’)
– Example: get(gcf, 'Color')
• Return a list of all user-settable object properties and their current values: – set(handle)
• Return a list of all possible values for an object property: – set(handle,’PropertyName’)
– Example: set(gca, 'XDir')
• Set an object property to a new value: – set(handle, ‘PropertyName’, ‘NewPropertyValue’)
– Example: set(gca, 'XDir', 'Reverse')
• All the above can also be done (but not at runtime) using the Property Editor
35
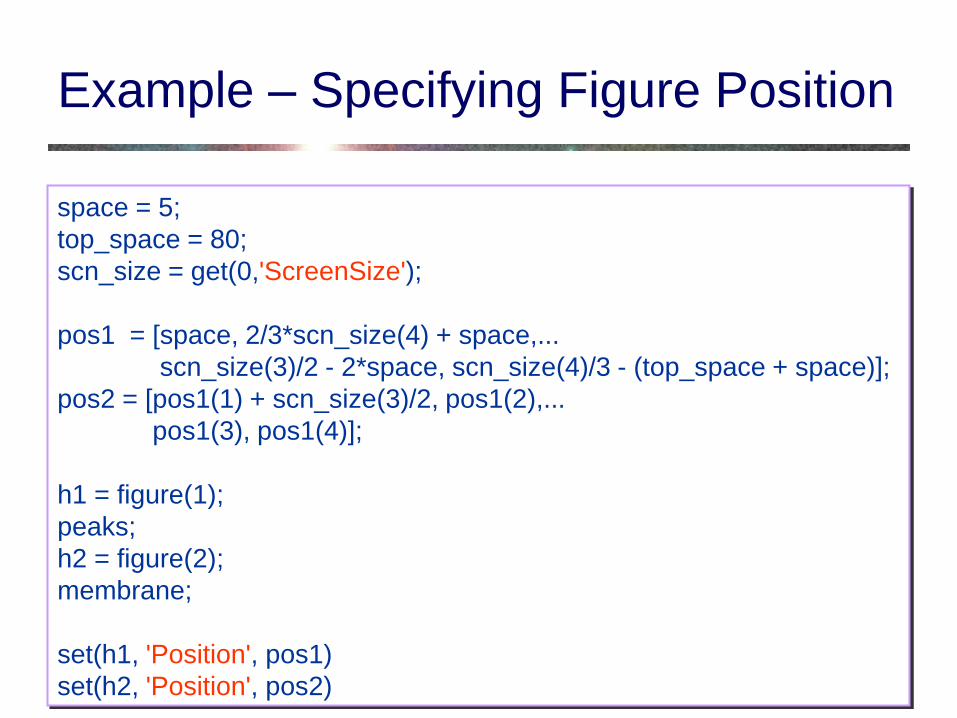
Example – Specifying Figure Position
space = 5;
top_space = 80;
scn_size = get(0,'ScreenSize');
pos1 = [space, 2/3*scn_size(4) + space,...
scn_size(3)/2 - 2*space, scn_size(4)/3 - (top_space + space)];
pos2 = [pos1(1) + scn_size(3)/2, pos1(2),...
pos1(3), pos1(4)];
h1 = figure(1);
peaks;
h2 = figure(2);
membrane;
set(h1, 'Position', pos1)
set(h2, 'Position', pos2)

36
Example – Background Image
% Create background axes and move them to the background
hback = axes('units','normalized','position',[0 0 1 1]);
uistack(hback,'bottom');
% Load background image and display it
[back map]=imread('sipl.gif');
image(back)
colormap(map)
% Turn the handlevisibility off so that we don't inadvertently plot into
% the axes again. Also, make the axes invisible
set(hback,'handlevisibility','off','visible','off')
% Now we can use the figure as required
axes('position',[0.1,0.1,0.85,0.35])
plot(rand(10))

37
Outline
• Graphics
• Animation
• Image and Video
• Handle Graphics Objects
• Creating GUI using GUIDE

38
What is GUIDE?
• GUIDE is MATLAB’s Graphical User Interface (GUI)
Development Environment
• GUIDE stores GUIs in two files:
– .fig file - Contains a complete description of the GUI figure layout
and the GUI components
• Changes to this file are made in the Layout Editor
– .m file - Contains the code that controls the GUI
• Initialization code and callbacks
• You can program the behavior of the GUI in this file using the M-file
Editor
39
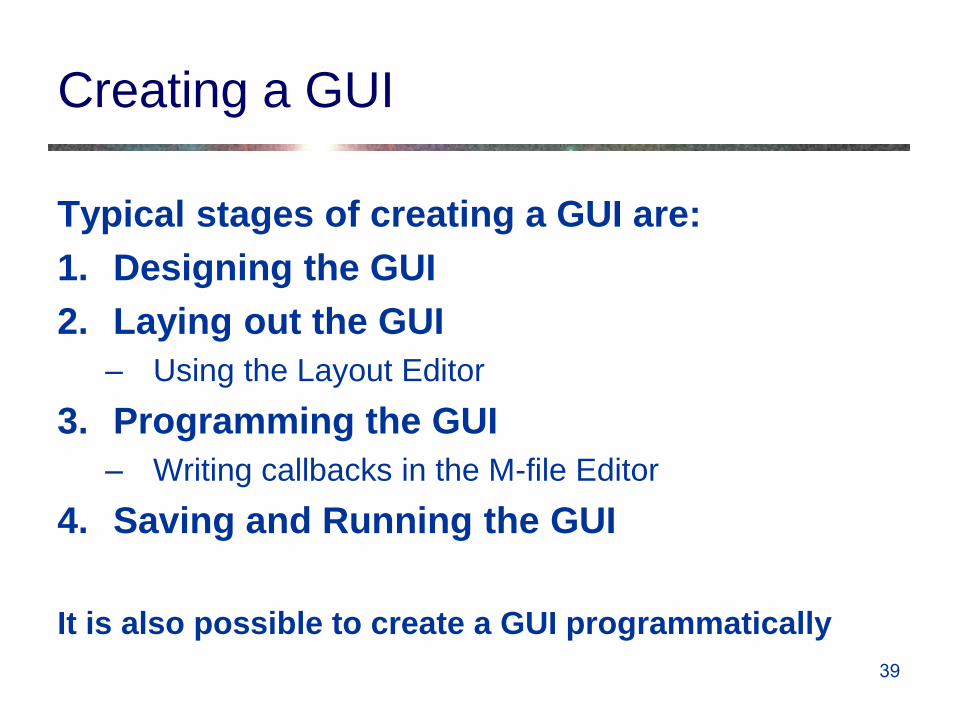
Creating a GUI
Typical stages of creating a GUI are:
1. Designing the GUI
2. Laying out the GUI
– Using the Layout Editor
3. Programming the GUI
– Writing callbacks in the M-file Editor
4. Saving and Running the GUI
It is also possible to create a GUI programmatically

40
The Layout Editor
Component
Palette
Align
Objects
M-file
Editor
Run GUI
Object Browser
Property
Inspector
Layout Area
Resize
Box
Menu
Editor
Tab Order
Editor
Toolbar
Editor

41
Hands-On GUIDE Example

42
Callbacks
• A callback is a function that executes when a
specific event occurs on a graphics object
– Also called event handler in some programming languages
• A property of a graphics object
– All objects: ButtonDownFnc, CreateFnc, DeleteFnc
– User interface controls: Callback, KeyPressFcn,
– Figure: CloseRequestFcn, KeyPressFcn, KeyReleaseFcn,
ResizeFcn, WindowButtonDownFcn, WindowButtonMotionFcn,
WindowButtonUpFcn, WindowKeyPressFcn,
WindowKeyReleaseFcn, WindowScrollWheelFcn
– …
• Stored in the GUI’s M-file
43
Writing Callbacks
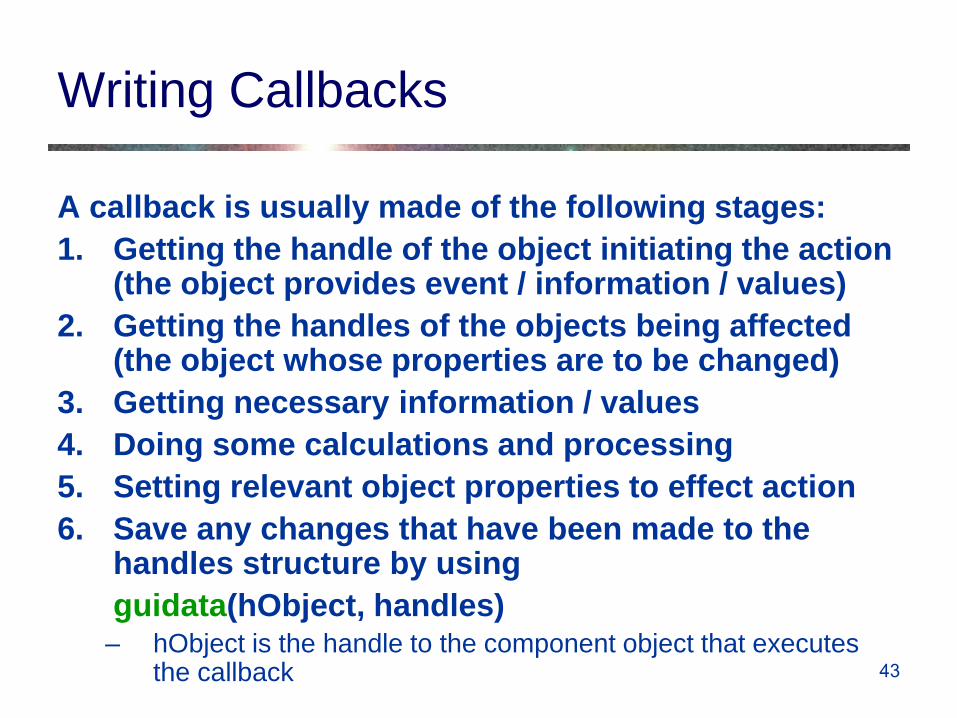
A callback is usually made of the following stages:
1. Getting the handle of the object initiating the action (the object provides event / information / values)
2. Getting the handles of the objects being affected (the object whose properties are to be changed)
3. Getting necessary information / values
4. Doing some calculations and processing
5. Setting relevant object properties to effect action
6. Save any changes that have been made to the handles structure by using
guidata(hObject, handles) – hObject is the handle to the component object that executes
the callback

44
Writing Callbacks
% --- Executes on button press in plot_button.
function plot_button_Callback(hObject, eventdata, handles)
% hObject handle to plot_button (see GCBO)
% eventdata reserved - to be defined in a future version of MATLAB
% handles structure with handles and user data (see GUIDATA)
% Get user input from GUI
f1 = str2double(get(handles.f1_input,'String'));
f2 = str2double(get(handles.f2_input,'String'));
t = eval(get(handles.t_input,'String'));
% Calculate data
…
% Create frequency plot
axes(handles.frequency_axes) % Select the proper axes
plot(f,m(1:257))
xlabel('Frequency');
set(handles.frequency_axes,'XMinorTick','on')
grid on
…
Callback from example:

45
Managing Data
• Most GUIs generate or use data specific to the
application
• GUI components often need to communicate data to
one another
• Several basic mechanism serve this need:
– UserData property
– Application data (getappdata, setappdata, isappdata, rmappdata)
– Using the handles structure (guidata)
– Nested functions
• It is also possible to make several different GUIs work
together
– Communicate by setting each other’s properties or by returning
outputs

46
Image Processing Modular Tools
• Many of the interactive tools of the Image Processing
Toolbox are modular and can be combined into your
custom GUI
– For image processing applications
– imcontrast, imcolormaptool, imcrop, imdisplayrange, imdistline,
imageinfo, immagbox, imoverview, impixelinfo, impixelregion,
impixelregionpanel, imsave, imscrollpane
47
More Information
• MATLAB user manuals – Graphics, 3-D Visualization, Creating Graphical User Interfaces, Image Processing Toolbox, Image Acquisition Toolbox, Video and Image Processing Blockset, …
• Marchand P., Holland T. O., Graphics and GUIs with MATLAB, 3ed, 2003, CRC Press
• Smith T. S., MATLAB Advanced GUI Development, 2006, Dog Ear Publishing
Documents from Mathworks can be found at: http://www.mathworks.com/help/index.html
Most of this info can also be found in MATLAB Help

48
Related Documents