Gui in Matlab Group : 4

Gui in matlab :
Aug 13, 2015
Welcome message from author
This document is posted to help you gain knowledge. Please leave a comment to let me know what you think about it! Share it to your friends and learn new things together.
Transcript

Gui in Matlab Group : 4
Topics
About gui How to create gui with Guide
How to Create a Simple GUI Programmatically
What Is a GUI?A graphical user interface (GUI) is a graphical display in one or more
windows containing controls, called components, that enable a user to perform
interactive tasks .
The user of the GUI does not have to create a script or
type commands at the command line to accomplish the tasks .
Unlike coding
programs to accomplish tasks, the user of a GUI need not understand the
details of how the tasks are performed.
GUI components can include menus, toolbars, push buttons, radio buttons,
list boxes, and sliders—just to name a few. GUIs created using MATLAB
tools can also perform any type of computation, read and write data files,
communicate with other GUIs, and display data as tables or as plots.
Sample Gui figure

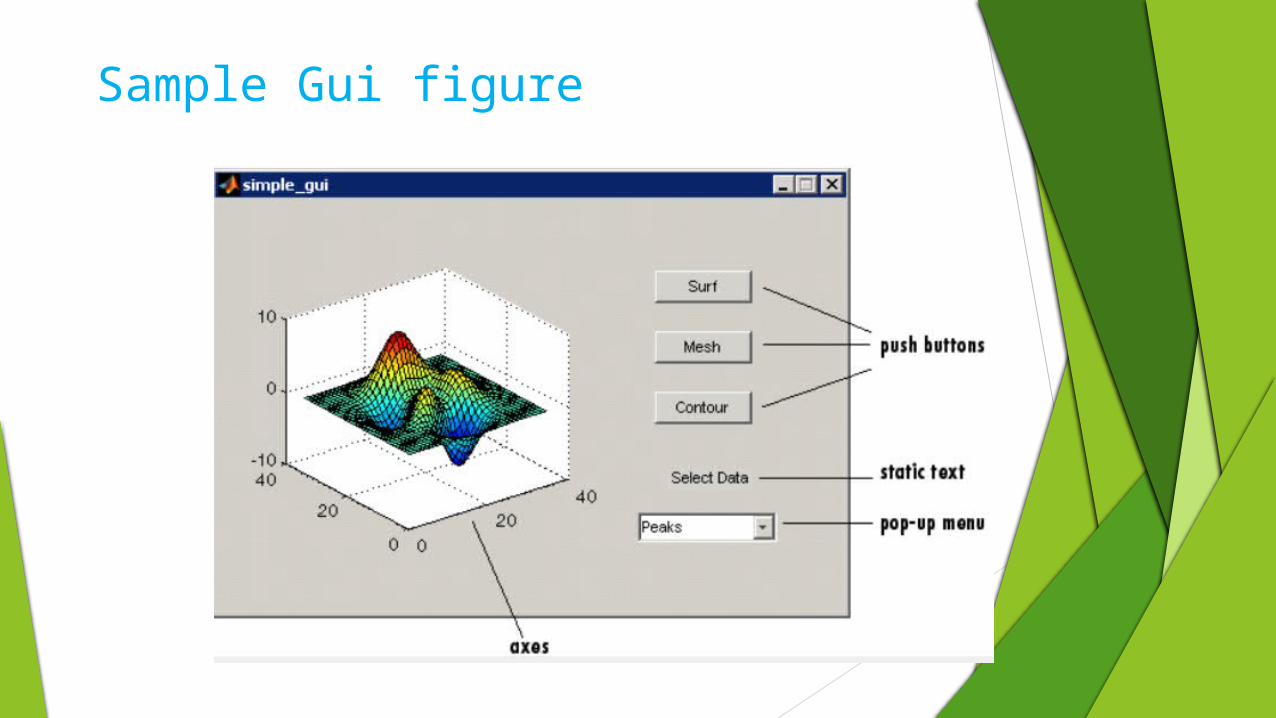
What in pervious figure ?
The GUI contains
•An axes component
•Apop-up menu listing three data sets that correspond to MATLAB
functions: peaks, membrane,andsinc
•Astatic text component to label the pop-up menu
•Three buttons that provide different kinds of plots: surface, mesh, and
contour
When you click a push button, the axes component displays the selected data
set using the specified type of 3-D plot
Where Do I Start?
Before starting to construct a GUI you have to design it. At a minimum,
You have to decide:
•Who the GUI users will be
•What you want the GUI to do
•How users will interact with the GUI
•What components the GUI requires to function
When designing any software, you need to understand the purposes a new
GUI needs to satisfy. You or the GUI’s potential users should document user
requirements as completely and precisely as possible before starting or build
it. This includes specifying the inputs, outputs, displays, and behaviors of the
GUI and the application it controls. After you design a GUI, you need to
program each of its controls to operate correctly and consistently. Finally, you
should test the completed or prototype GUI to make sure that it behaves as
intended under realistic conditions. (Or better yet, have someone else test it.)
If testing reveals design or programming flaws, iterate the design until the
GUI works to your satisfaction. The following diagram illustrates the main
aspects of this process.
Ways to Build MATLAB GUI
Use GUIDE (GUI Development Environment), an interactive GUI construction kit.
-------------------------------------------------------------------
•Create code files that generate GUIs as functions or scripts (programmatic GUI construction).
What Is GUIDE?GUIDE, the MATLAB Graphical User Interface Development Environment,
provides a set of tools for creating graphical user interfaces (GUIs). These
tools greatly simplify the process of laying out and programming GUIs.
Type guide to open
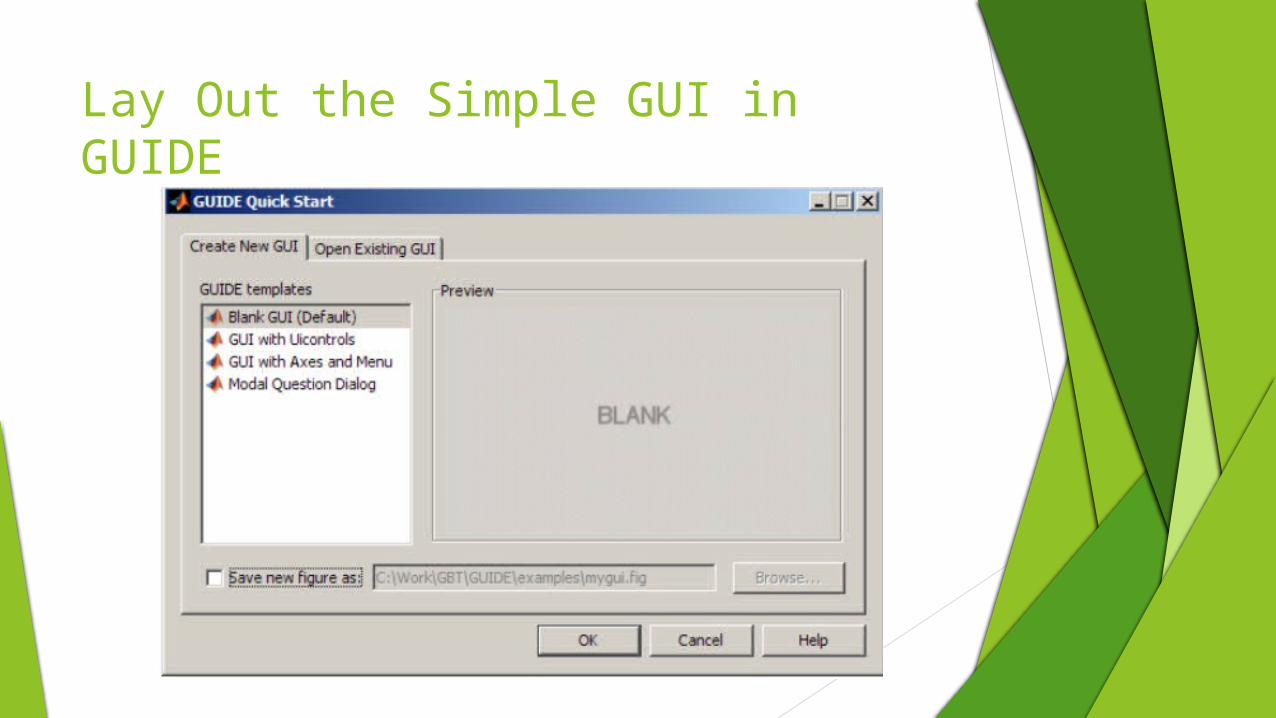
Lay Out the Simple GUI in GUIDE
Open a New GUI in the GUIDE Layout Editor
1-Start GUIDE by typing guide at the MATLAB prompt.
Lay Out the Simple GUI in GUIDE
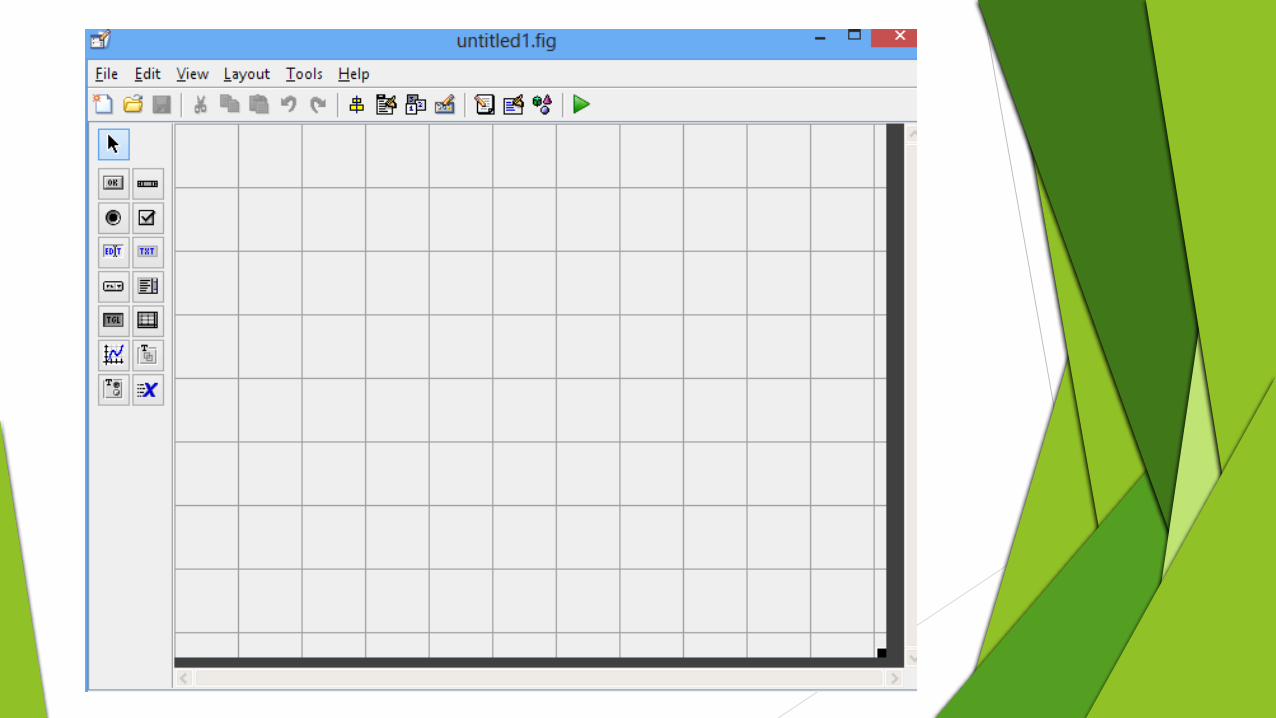
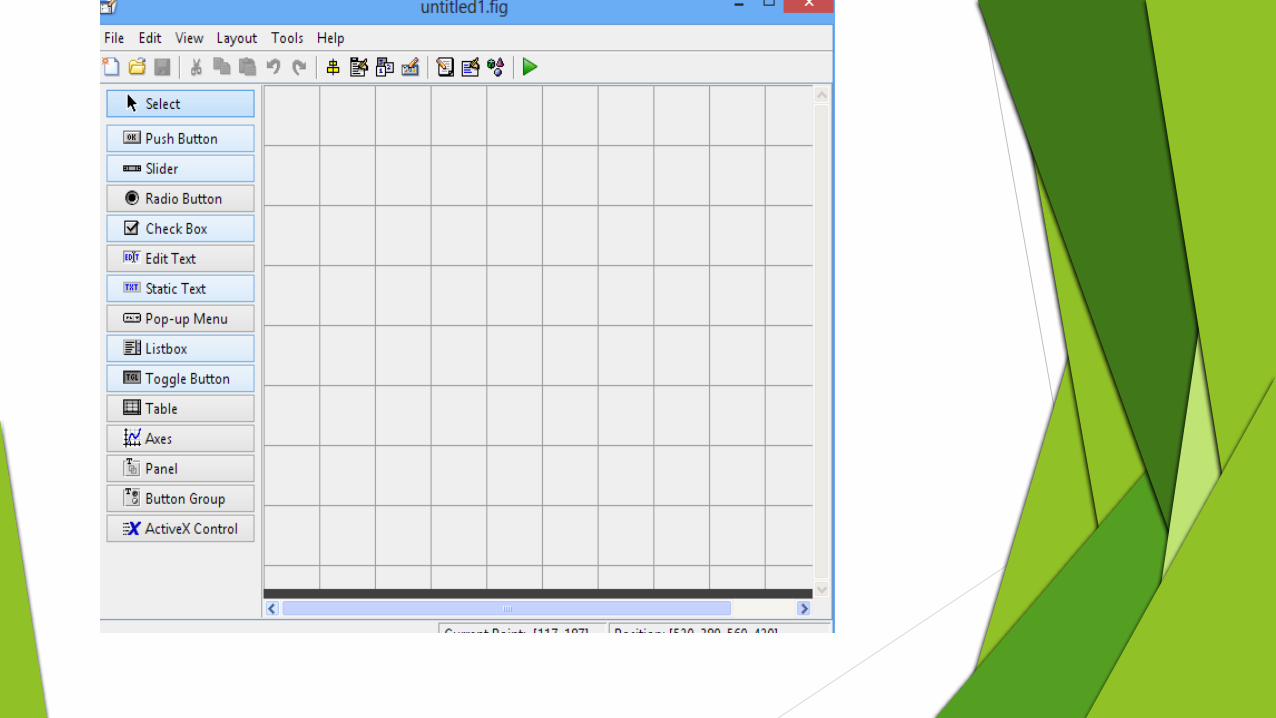
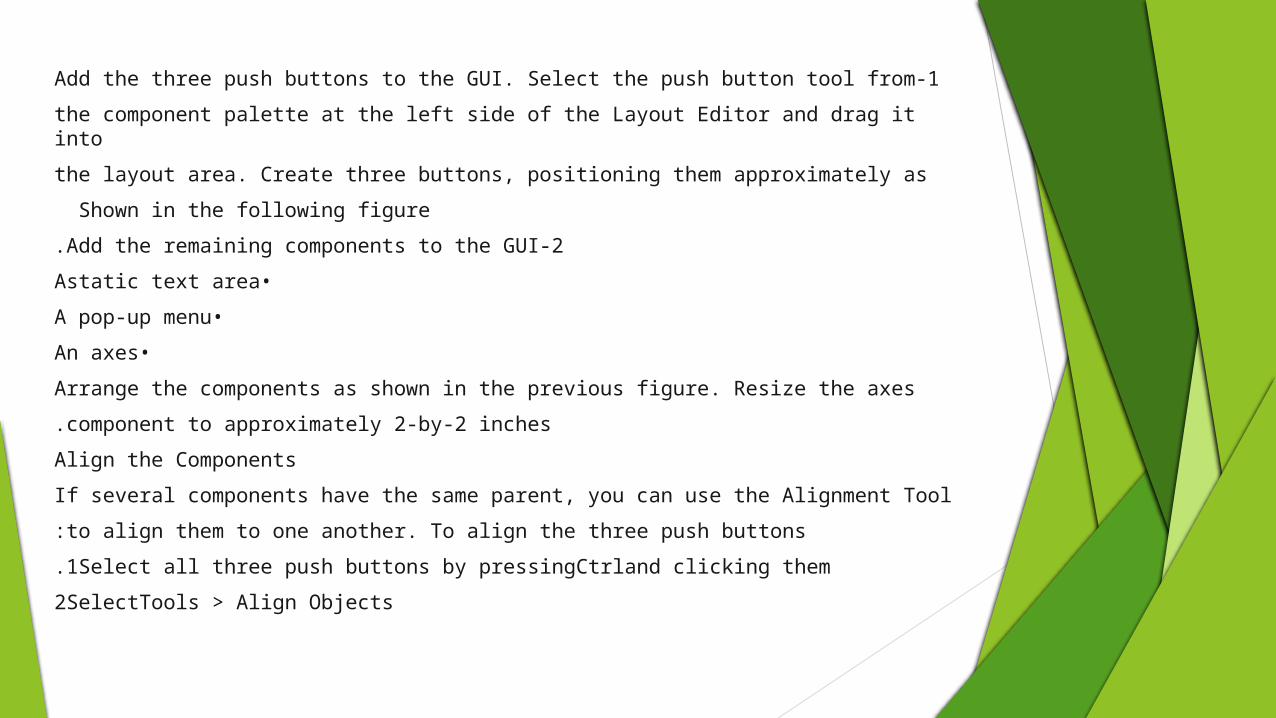
1-Add the three push buttons to the GUI. Select the push button tool from
the component palette at the left side of the Layout Editor and drag it into
the layout area. Create three buttons, positioning them approximately as
Shown in the following figure
2-Add the remaining components to the GUI.
•Astatic text area
•A pop-up menu
•An axes
Arrange the components as shown in the previous figure. Resize the axes
component to approximately 2-by-2 inches.
Align the Components
If several components have the same parent, you can use the Alignment Tool
to align them to one another. To align the three push buttons:
1Select all three push buttons by pressingCtrland clicking them.
2SelectTools > Align Objects
3-Make these settings in the Alignment Tool:
•Left-aligned in the horizontal direction.
•20 pixels spacing between push buttons in the vertical direction.
4 -click ok 4
Label the Push Buttons
SelectView > Property Inspector.
Align the Components
If several components have the same parent, you can use the Alignment Tool
to align them to one another. To align the three push buttons:
1-Select all three push buttons by pressing Ctrl and clicking them.
2-SelectTools > Align Objects.
3-Make these settings in the Alignment Tool:
•Left-aligned in the horizontal direction.
•20 pixels spacing between push buttons in the vertical direction
How to Create a SimpleGUI Programmatically
Create the Simple Programmatic GUI Code File
Almost all MATLAB functions work in GUIs. Many functions add components
to GUIs or modify their behavior, others assist in laying out GUIs, and still
others manage data within GUIs.
When you create the simple programmatic GUI code file, you start by creating
a function file (as opposed to a script file, which contains a sequence of
MATLAB commands but does not define functions.)
1-At the MATLAB prompt, type edit. MATLAB opens a blank document in
the Editor.
2-Type the following statement into the Editor. This function statement
is the first line in the file.
function simple_gui2
3-Type these comments into the file following the function statement. They
display at the command line in response to the help command. Follow
them by a blank line, which MATLAB requires to terminate the help text.
%SIMPLE_GUI2 Select a data set from the pop-up menu, then
%click one of the plot-type push buttons. Clicking the button
%plots the selected data in the axes.
(Leave a blank line here)
4-Add an end statement at the end of the file. This end statement matches
The function statement. Your file now looks like this.
function simple_gui2
%SIMPLE_GUI2 Select a data set from the pop-up menu, then
%click one of the plot-type push buttons. Clicking the button
%plots the selected data in the axes.
end
5-Save the file in your current folder or at a location that is on your MATLAB
path.
The next section, “Lay Out the Simple Programmatic GUI” on page 3-6, shows
you how to add components to your GUI.
The next section, “Lay Out the Simple Programmatic GUI” on page 3-6, shows
you how to add components to your GUI.
Create a Figure for a Programmatic GUI
In MATLAB software, a GUI is a figure. This first step creates the figure and
Positionsiton the screen.It also makes the GUI invisible so that the GUI
user cannot see the components being added or initialized. When the GUI has
all its components and is initialized, the example makes it visible. Add the
following lines before the end statement currently in your file:
%Create and then hide the GUI as it is being constructed.
f = figure('Visible','off','Position',[360,500,450,285]);
The call to the figure function uses two property/value pairs. The Position
property is a four-element vector that specifies the location of the GUI on the
screen and its size: [distance from left, distance from bottom, width, height].
Default units are pixels.
The next topic, “Add Components to a Programmatic GUI” , shows
you how to add the push buttons, axes, and other components to the GUI
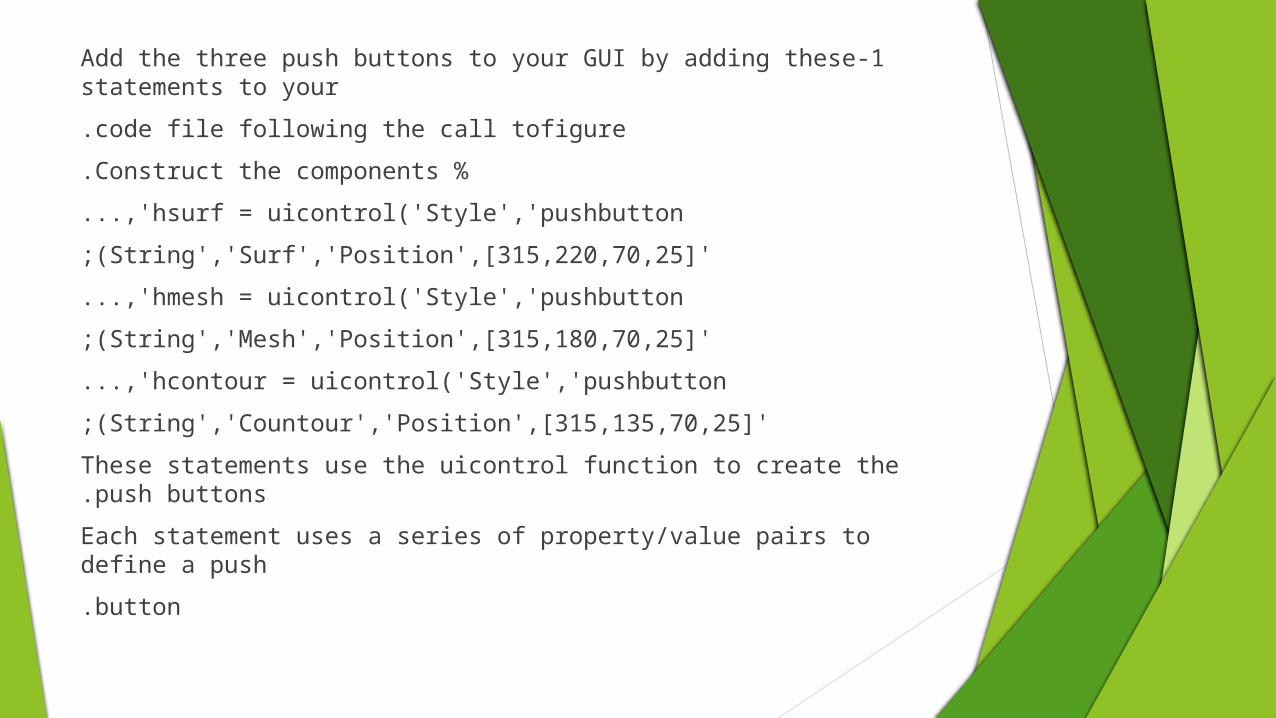
1-Add the three push buttons to your GUI by adding these statements to your
code file following the call tofigure.
%Construct the components.
hsurf = uicontrol('Style','pushbutton...,'
'String','Surf','Position',[315,220,70,25];)
hmesh = uicontrol('Style','pushbutton...,'
'String','Mesh','Position',[315,180,70,25];)
hcontour = uicontrol('Style','pushbutton...,'
'String','Countour','Position',[315,135,70,25];)
These statements use the uicontrol function to create the push buttons.
Each statement uses a series of property/value pairs to define a push
button.
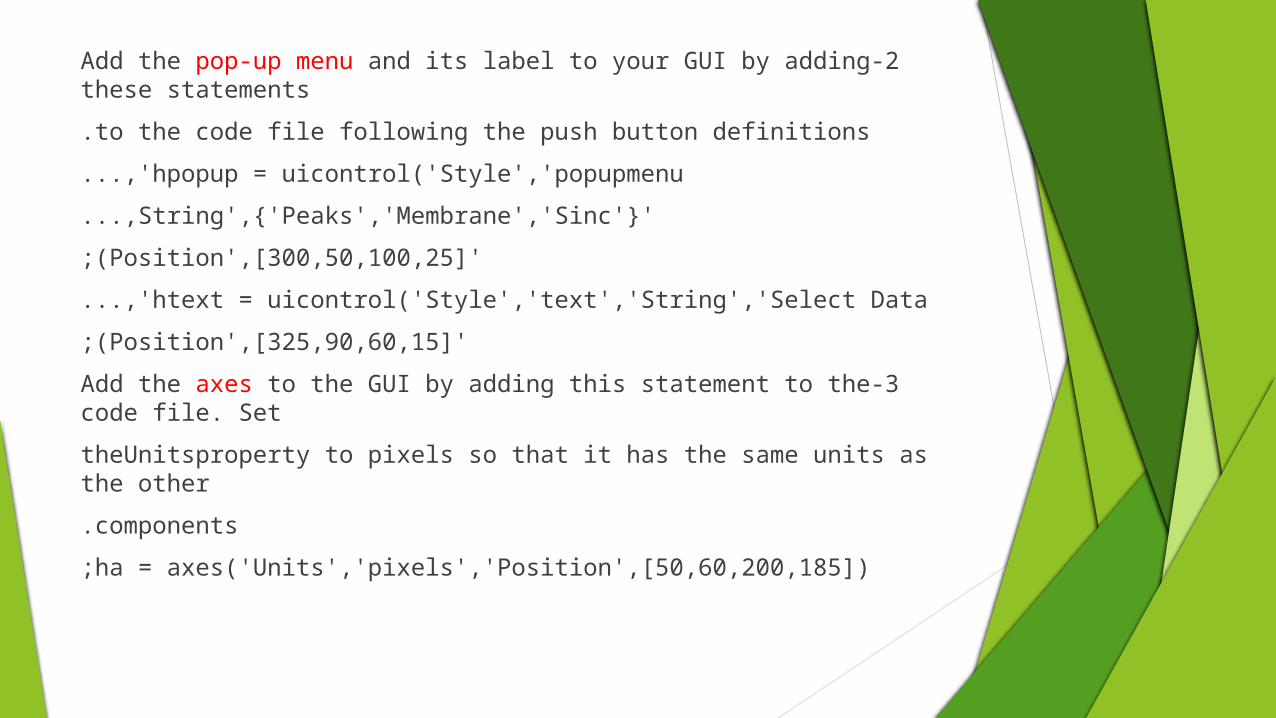
2-Add the pop-up menu and its label to your GUI by adding these statements
to the code file following the push button definitions.
hpopup = uicontrol('Style','popupmenu...,'
'String',{'Peaks','Membrane','Sinc'}...,
'Position',[300,50,100,25];)
htext = uicontrol('Style','text','String','Select Data...,'
'Position',[325,90,60,15];)
3-Add the axes to the GUI by adding this statement to the code file. Set
theUnitsproperty to pixels so that it has the same units as the other
components.
ha = axes('Units','pixels','Position',[50,60,200,185]);
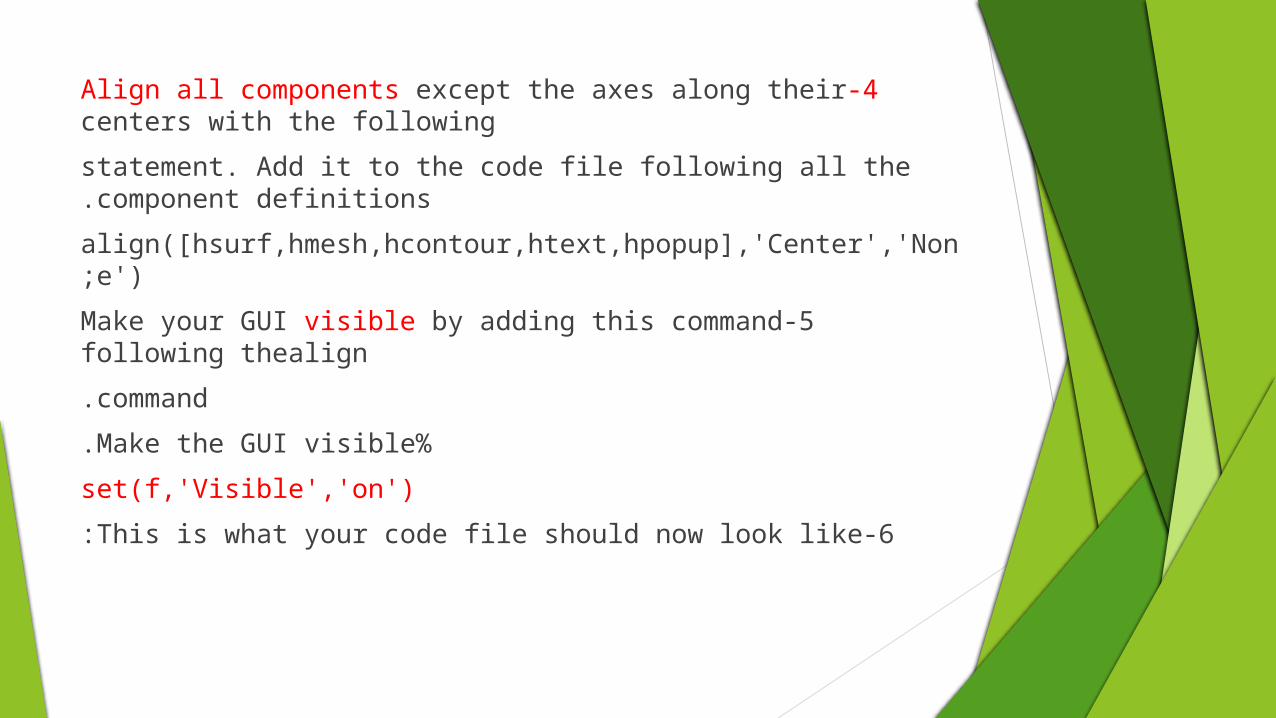
4-Align all components except the axes along their centers with the following
statement. Add it to the code file following all the component definitions.
align([hsurf,hmesh,hcontour,htext,hpopup],'Center','None');
5-Make your GUI visible by adding this command following thealign
command.
%Make the GUI visible.
set(f,'Visible','on')
6-This is what your code file should now look like:
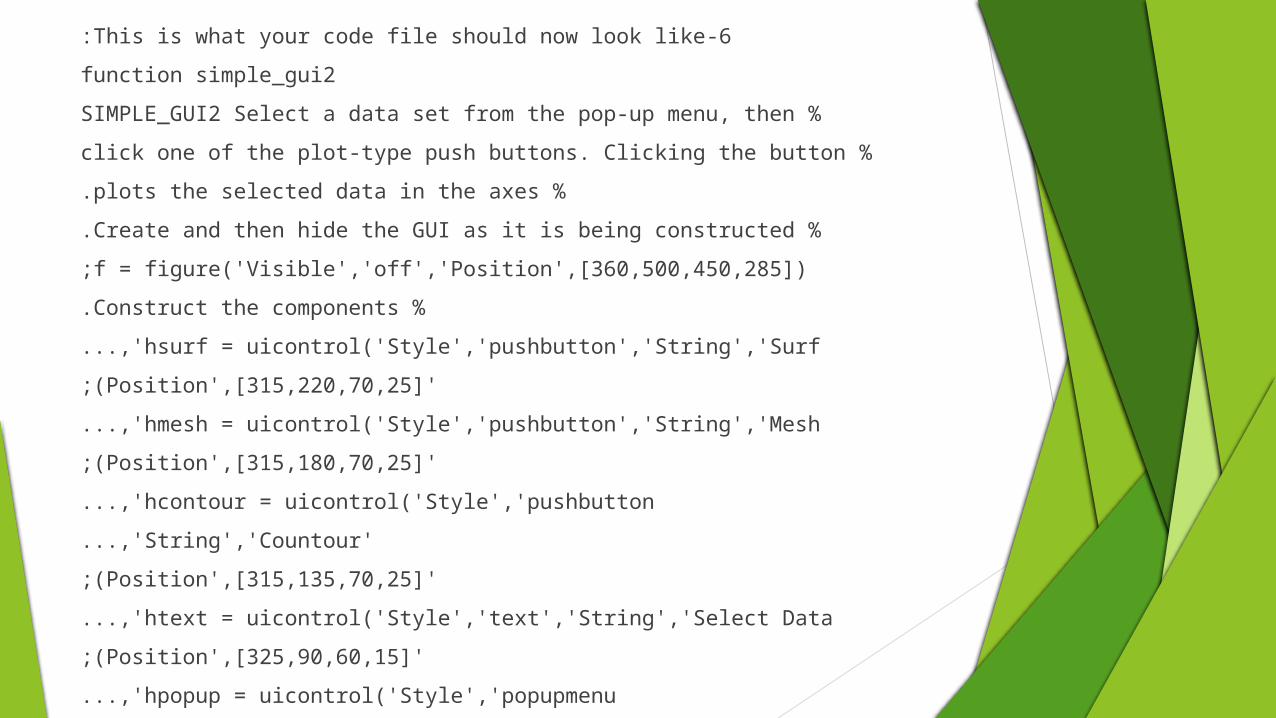
6-This is what your code file should now look like:
function simple_gui2
%SIMPLE_GUI2 Select a data set from the pop-up menu, then
%click one of the plot-type push buttons. Clicking the button
%plots the selected data in the axes.
%Create and then hide the GUI as it is being constructed.
f = figure('Visible','off','Position',[360,500,450,285]);
%Construct the components.
hsurf = uicontrol('Style','pushbutton','String','Surf...,'
'Position',[315,220,70,25];)
hmesh = uicontrol('Style','pushbutton','String','Mesh...,'
'Position',[315,180,70,25];)
hcontour = uicontrol('Style','pushbutton...,'
'String','Countour...,'
'Position',[315,135,70,25];)
htext = uicontrol('Style','text','String','Select Data...,'
'Position',[325,90,60,15];)
hpopup = uicontrol('Style','popupmenu...,'
'String',{'Peaks','Membrane','Sinc'}...,
'Position',[300,50,100,25];)
ha = axes('Units','Pixels','Position',[50,60,200,185]);
align([hsurf,hmesh,hcontour,htext,hpopup],'Center','None');
%Make the GUI visible.
set(f,'Visible','on')
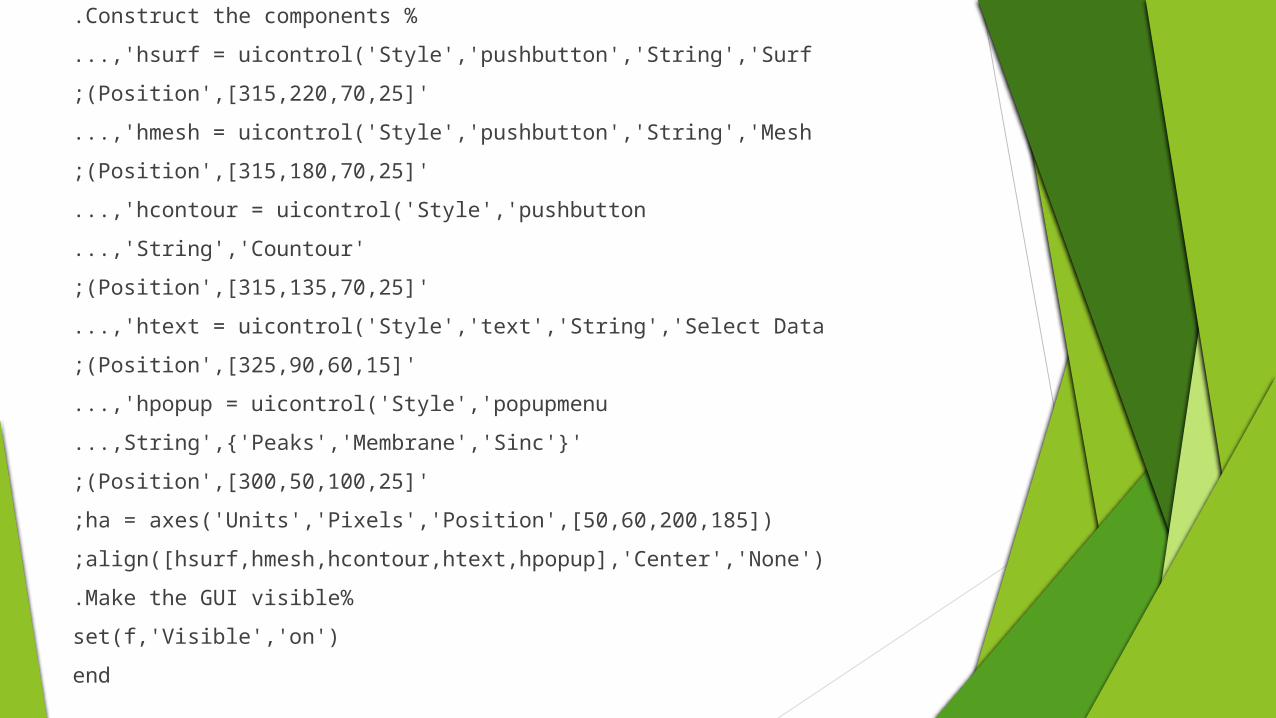
end
Related Documents