Original Research Article 1 2 Mahatma Gandhi National Rural Employment 3 Guarantee Scheme (MGNREGS)-Aquaculture 4 Convergence: An Experience from Tripura, India 5 6 ABSTRACT 7 Being purposed at understanding the utilization efficiency of excavated and/or reclaimed ponds as 8 newly created assets under the MGNREGS, the present study was conducted at Dhalai district of 9 Tripura state (India) with the objectives to: i) comprehend the physical performance of pond 10 excavation and reclamation works under MGNREGS; and ii) peruse the nature of harnessing of the 11 created assets at beneficiary level during post work execution phase of the scheme. While the first 12 objective was addressed through utilizing secondary information, the second one was attained 13 through administering separate sets of pre-tested structured interview schedule over 92 MGNREGS 14 beneficiaries and 27 functionaries remained responsible for effective implementation of the scheme. 15 Study revealed that the district had executed 16717 no. of works combining both pond excavation and 16 reclamation jobs during 2012-13 to 2016-17, of which the shares of pond excavation and reclamation 17 works were 81.77% and 18.23%, respectively. Despite such good physical performance in work 18 execution, very poor accrual of average annual fish productivity (414.25 kg ha-1) was recorded at the 19 fish ponds of beneficiaries. It lagged by 5.98 times from the state average and 5.74 times from the 20 average of even Dhalai district, where the study was conducted. Although 66.30% of the beneficiaries 21 of MGNREGS had no previous experience of culture fisheries as they became first ever owners of 22 pond, a staggering 67.39% of them didn’t receive any knowledge vis-a-vis skill enabling training on 23 scientific aquaculture, which led to disappointing extents of their knowledge (34.75%) and adoption 24 (32.85%) of scientific aquaculture. Garrett ranking revealed ‘lack of systematic and timely supply of 25 critical inputs from the Fisheries Department’ and ‘lack of training facilities’ to be the two prime 26 perceived constraints of the beneficiary respondents. The two most important suggestions emanated 27 from them were: ‘timely provisioning of critical inputs from the Dept. of Fisheries’ and ‘arranging of 28 more longer duration hands-on training programmes to make those really worthy for the fish farmers’. 29 30 Key words: Dhalai, MGNREGS-aquaculture convergence, pond excavation/reclamation, Tripura 31 INTRODUCTION 32 In view of ensuring social protection, livelihood security, inclusive growth and democratic 33 empowerment of the rural poor, the National Rural Employment Guarantee Act (NREGA) was 34 launched in India on September 7, 2005. Thereafter, it was renamed as ‘Mahatma Gandhi National 35 Rural Employment Guarantee Act’ (MGNREGA) on October 2, 2009. The said Act was made 36 operational as ‘Mahatma Gandhi National Rural Employment Guarantee Scheme’ (MGNREGS) as a 37 classified Centrally Sponsored Scheme. After it was first launched at Anantpur district of Andhra 38 Pradesh, all the rural districts of the country were brought under its umbrella by April 1, 2008 [1]. The 39 Act provided a legal guarantee for 100 days of wage employment in a year to every demanding rural 40 household whose adult members would be agreeable to carry out unskilled manual work [2] and, in 41 the process, to assist them in promoting their livelihood security [3]. Generation of livelihood resource 42 base for the rural poor for enhancing their economic activities and, thus, enabling them to lead a 43 decent life in sustainable manner also constituted the other fundamental purpose of 44

Welcome message from author
This document is posted to help you gain knowledge. Please leave a comment to let me know what you think about it! Share it to your friends and learn new things together.
Transcript
Original Research Article 1
2
Mahatma Gandhi National Rural Employment 3
Guarantee Scheme (MGNREGS)-Aquaculture 4
Convergence: An Experience from Tripura, India 5
6
ABSTRACT 7
Being purposed at understanding the utilization efficiency of excavated and/or reclaimed ponds as 8 newly created assets under the MGNREGS, the present study was conducted at Dhalai district of 9 Tripura state (India) with the objectives to: i) comprehend the physical performance of pond 10 excavation and reclamation works under MGNREGS; and ii) peruse the nature of harnessing of the 11 created assets at beneficiary level during post work execution phase of the scheme. While the first 12 objective was addressed through utilizing secondary information, the second one was attained 13 through administering separate sets of pre-tested structured interview schedule over 92 MGNREGS 14 beneficiaries and 27 functionaries remained responsible for effective implementation of the scheme. 15 Study revealed that the district had executed 16717 no. of works combining both pond excavation and 16 reclamation jobs during 2012-13 to 2016-17, of which the shares of pond excavation and reclamation 17 works were 81.77% and 18.23%, respectively. Despite such good physical performance in work 18 execution, very poor accrual of average annual fish productivity (414.25 kg ha-1) was recorded at the 19 fish ponds of beneficiaries. It lagged by 5.98 times from the state average and 5.74 times from the 20 average of even Dhalai district, where the study was conducted. Although 66.30% of the beneficiaries 21 of MGNREGS had no previous experience of culture fisheries as they became first ever owners of 22 pond, a staggering 67.39% of them didn’t receive any knowledge vis-a-vis skill enabling training on 23 scientific aquaculture, which led to disappointing extents of their knowledge (34.75%) and adoption 24 (32.85%) of scientific aquaculture. Garrett ranking revealed ‘lack of systematic and timely supply of 25 critical inputs from the Fisheries Department’ and ‘lack of training facilities’ to be the two prime 26 perceived constraints of the beneficiary respondents. The two most important suggestions emanated 27 from them were: ‘timely provisioning of critical inputs from the Dept. of Fisheries’ and ‘arranging of 28 more longer duration hands-on training programmes to make those really worthy for the fish farmers’. 29 30 Key words: Dhalai, MGNREGS-aquaculture convergence, pond excavation/reclamation, Tripura 31
INTRODUCTION 32
In view of ensuring social protection, livelihood security, inclusive growth and democratic 33 empowerment of the rural poor, the National Rural Employment Guarantee Act (NREGA) was 34 launched in India on September 7, 2005. Thereafter, it was renamed as ‘Mahatma Gandhi National 35 Rural Employment Guarantee Act’ (MGNREGA) on October 2, 2009. The said Act was made 36 operational as ‘Mahatma Gandhi National Rural Employment Guarantee Scheme’ (MGNREGS) as a 37 classified Centrally Sponsored Scheme. After it was first launched at Anantpur district of Andhra 38 Pradesh, all the rural districts of the country were brought under its umbrella by April 1, 2008 [1]. The 39 Act provided a legal guarantee for 100 days of wage employment in a year to every demanding rural 40 household whose adult members would be agreeable to carry out unskilled manual work [2] and, in 41 the process, to assist them in promoting their livelihood security [3]. Generation of livelihood resource 42 base for the rural poor for enhancing their economic activities and, thus, enabling them to lead a 43 decent life in sustainable manner also constituted the other fundamental purpose of44
the scheme [2,4]. Works like excavation of ponds/percolation tanks/canal, renovation/de-silting of 45 existing ponds/old canals etc. were very much remained under the scope of permissible works of the 46 scheme to trigger creation of rural infrastructure [5]. It was specifically envisaged that after completion 47 of works under the scheme to create those assets, effective rendering of both fund and technical 48 know-how support were to be obligatorily extended during its post-work execution phase towards 49 improving the livelihoods. And for such things to happen, instilling convergence with the resources of 50 other programmes/schemes available with the Panchayats and/or other state line departments was 51 envisaged. For fisheries related sector, it was also exemplified that the state fisheries departments 52 were to arrange for capacity building, supply of livelihood components in the form of fingerlings, 53 manures, etc. by mobilizing available funds of other on-going schemes [6]. 54
Fishery holds a vital place in the socio-economic fabric of the native people of Tripura, which is one 55 amongst the north-eastern states to cover an area of 10,486 km2 and support 36,71,032 population 56 [7]. Fish plays a formidable role in its economic growth along with providing employment opportunities 57 and food security to the people [8]. Here, fish is regarded as a crucial component of daily diet by its 95 58 per cent inhabitants [9]. Considering its importance, the state had adopted strategy for both vertical as 59 well as horizontal expansion of its aquaculture sector [10]. And in order to achieve that, making use of 60 MGNREGS fund started taking place in the state. While enhancement of productive performances of 61 the available water bodies through promoting scientific fish culture was assumed to aid in vertical 62 expansion, the horizontal expansion on the other hand was envisioned to be achieved through 63 increasing the area under culture fisheries by way of effective convergence between various available 64 resources out of relevant schemes/programmes. Due emphasis was also given on revitalization of the 65 existing unproductive water bodies in the form of performing necessary reclamation of those [11]. And 66 there remained the significance of MGNREGS for the Tripura state. 67
There occurred, commendable execution of works concerning creation as well as reclamation of 68 ponds by utilizing Mahatma Gandhi National Rural Employment Guarantee Scheme (MGNREGS) 69 fund in the state of Tripura [10] to set the opportune stage for it in raising its aquaculture production by 70 efficiently harnessing those built up assets in the form of practicing culture fisheries by the beneficiary 71 pond owning class. And supposedly that might have caused improvement in the quality of life of 72 those otherwise poor rural gentry through eligibly contribute in ensuring their household nutritional 73 security and enhancing their income efficiency as well, subject to the condition that steady input, 74 advisory, training and, technical know-how support are provided to them from the relevant institutional 75 source(s). It is un-refutable a fact that more there would be the attainment of the said conditionality, 76 greater would emerge the possibility of real success of MGNREGS-Aquaculture convergence in 77 accordance with its envisioned purpose. In the face of scant studies on the mannerism through which 78 MGNREGS could register its influence over those neo-breed of beneficiary aquaculturists in Tripura 79 during post work execution phase of the scheme, what had been the perceived constraints of those 80 aquaculturists in appropriately harnessing the created opportunity under the aegis of MGNREGS, and 81 how can a better synergy be brought about between MGNREGS and aquaculture, thus, formed the 82 basis of present study, which was carried out with the objectives: i) to comprehend the physical 83 performance of pond excavation and reclamation works under MGNREGS; and ii) to peruse the 84 nature of harnessing of the created assets at beneficiary level during post work execution phase of 85 the scheme. 86
METHODOLOGY 87
Research Setting 88
The ex post facto study was conducted during September, 2018 to January, 2019 in five out of eight 89 existing blocks of the Dhalai district of Tripura wherein, highest number of work relating to 90 excavation/reclamation of water bodies under the aegis of MGNREGS was performed. The blocks 91 were Ambassa, Salema, Durgachowmuhani, Manu and Chawmanu. From each of those selected 92 blocks, two villages were randomly pooled. Thus, altogether 10 villages found selection for the 93 conduct of primary survey. 94
Sampling 95
For collection of primary data, 92 nos. of MGNREGS supported aquaculturists were selected through 96 probability proportionate to size (PPS) sampling at 10% level of probability. Moreover, 27 no. of 97 various levels of functionaries relevant to enhancement of the efficiency of productive performance of 98 the pond niches during post work execution phase of MGNREGS in the areas under investigation like 99 State Fisheries Department (05 no.), Gram Panchayat/Village Council Institution (10 no.) and Block 100
Development Office (12 no.) were also included. Thus, total number of respondents stood out to be 101 119. 102
Data Collection 103
Data was collected from both primary and secondary sources. Primary data was collected through 104 personal interview of the selected respondents by separately administering pre-tested structured 105 interview schedules for the beneficiary pond owning respondents and functionaries representing 106 various institutions. Collection of secondary data, however, was made by utilizing both official report 107 and web information [12, 13]. 108
Method of Analysis 109
Analyses and interpretations of collected data were done in the following manner: 110
Fish productivity in water bodies of the respondents 111
The fish productivity was calculated by firstly working out culture period vis-a-vis study period wise 112 production performances of fish for each respondent along with the corresponding area as was 113 devoted by them for obtaining that production. Then the mean values of production and area at 114 aggregate level for the entire study period was calculated for each of those respondents as well as all 115 of them as a whole to finally work out the realization of average fish productivity in kg ha-1 for the 116 entire tenure of five years of the study- individually and cumulatively as well. 117
Annual income from MGNREGS supported water bodies and surroundings 118
Annual income from MGNREGS support was estimated in terms of average annual income accrued 119 through both culture fisheries and pond dyke based small horticulture and/or fringe growing of 120 plantation crops. 121
Extent of adoption of scientific aquaculture practices 122
It was measured by resorting to the scale [14] containing 18 critical activity statements distributed 123 over six major domains viz., ‘pond preparation’ (contained four critical activity statements); 'liming' 124 (contained two critical activity statements); ‘manuring and fertilization of the pond’ (contained three 125 critical activity statements); ‘stocking’ (contained four critical activity statements); ‘supplementary 126 feeding' (contained three critical activity statements); and 'water exchange and quality monitoring' 127 (contained two critical activity statements). The scale was administered on a three point continuum 128 ranging between full scale adoption and non-adoption through partial adoption, for which the assigned 129 scores were 3, 1 and 2 respectively. The summated score value, combining all critical activity 130 statements, determined a respondent’s total adoption score. Maximum and minimum possible score 131 for a respondent to obtain could be 54 signifying very high level of adoption, and 18 signifying very 132 poor level of adoption, respectively. On the basis of adoption score, adoption index (in percentage) 133 was separately computed for each of all the six identified domains in the following manner: 134
135 136
Then, overall adoption index was calculated in the following manner: 137 138 Then overall adoption index was calculated in the following manner: 139
140
141
Knowledge about scientific aquaculture practices 142
Knowledge of respondents was measured in line with the yes/no type knowledge test scale [14] 143 containing 38 critical activity statements distributed over five major domains viz., ‘pond preparation’ 144 (contained six statements); 'liming' (contained six statements); ‘fertilization of the pond’ (contained 145 eight statements); ‘stocking’ (contained seven statements); and ‘post stocking' (contained eleven 146 statements). Whereas, the affirmative response against a statement was assigned with '1' score 147 value, negative response was assigned with '0' score value. Thus, knowledge score of a given 148 respondent could range between ‘0’ to ‘38’. The summated score value obtained from each of all the 149 statements determined a respondent’s total knowledge score; where zero indicating no knowledge 150 and 38 indicating very high knowledge. On the basis of knowledge score, knowledge index (in 151 percentage) was computed for each of all the five identified domains by using the following formula: 152
Adoption score obtained combining all domains Overall adoption index = × 100 Maximum obtainable score combining all domains
Mean score obtained in a particular domain Adoption index = × 100 Maximum obtainable score in that domain
100 (Rij - 0.5) Nj
Mean score obtained in a particular domain 153 Knowledge index = × 100 154 Maximum obtainable score in that domain 155 156
Then, overall knowledge index was calculated in the following manner: 157
158 Knowledge score obtained combining all domains 159 Overall knowledge index = × 100 160 Maximum obtainable score combining all domains 161
Training exposure on scientific aquaculture practices 162
It was quantified in two stages. First, to determine whether or not they were provided with any 163 training, while ‘1’ score values was assigned against affirmative response, ‘0’ score value was 164 assigned against the negative values. Then, by employing percentage analyses of the affirmative 165 cases, duration of training as well as training areas were summarized for interpretation. 166
Perceived constraints inhibiting productive performance 167
Ranking, as an expression of respondents' assigned priority about their feeling against a set of 168 structured statements with respect to perceived constraints to inhibit productive performance of the 169 aquatic niches being owned by the respondents, was done to classify the responses in order of 170 perceived importance. For that purpose, Garrett ranking technique was utilized [15]. Respondents 171 were asked to rank altogether twelve linked statements. The orders of respondents' assigned merit 172 were then converted into ranks by using the following formula: 173 174
Percentage Position = 175
Where, 176 Rij = Rank given for ith item by jth individual 177 Nj = Number of items ranked by jth individual 178 179
The percentage position of each rank was converted into scores by referring to the Garrett's table 180 [15]. Subsequently, the scores of individual respondents was added together for each of the 181 constraint statement and divided by the total number of respondents for whom the scores was added. 182 Finally, the mean scores for all constraint statements were arranged in the order of their ranks. 183
For quantifying the perception of functionaries in matters of addressing the issues by them relating to 184 ‘skill training on scientific aquaculture practices’, ‘conduct of demonstrations/field days’, and ‘critical 185 input support in timely manner’ to enhance productive performance of the pond niches during post 186 work execution phase, percentage analysis was done. 187
RESULTS AND DISCUSSION 188
Physical performance of pond excavation and reclamation works 189
In terms of overall physical performance of work execution combining both excavation and 190 reclamation of ponds under the scheme during 2012-13 to 2016-17, the district under study was 191 observed to be the top performer among the eight constituent districts of the state with 16717 no. of 192 works executed therein and thus it had a share of 18.86% towards the overall 88610 no. of executed 193 works across whole of the state (Table 1). Out of that impressive achievement, the share of works 194 relating to excavation of new ponds and reclamation / de-silting of existing ones was 13670 no. (i.e. 195 81.77%) and 3047 no. (i.e.18.23%), respectively. 196
Table1: Status of overall physical performance of works during 2012-13 to 2016-17 197
District Excavation works (No.) Reclamation works (No.) All Works (No.) Rank
West Tripura 7248 (59.45)
4944 (40.55)
12192 (13.75)
III
Dhalai 13670 (81.77)
3047 (18.23)
16717 (18.86)
I
Gomati 7373 (58.97)
5131 (41.03)
12504 (14.13)
II
Khowai 6928 5251 12179 IV
(56.88) (43.11) (13.74)
North Tripura 7619 (66.98)
3756 (33.02)
11375 (12.84)
V
Sepahijala 5696 (58.59)
4026 (41.41)
9722 (10.97)
VI
South Tripura 5614 (65.07)
3014 (34.93)
8628 (9.74)
VII
Unokoti 4215 (79.63)
1078 (20.37)
5293 (5.97)
VIII
Total 58363 (65.87)
30247 (34.13)
88610 (100.00)
-
Note: Figure in the parenthesis indicates percentage to all works respective to corresponding district. 198 Source: Authors’ own calculation on the basis of information gathered from the website of Ministry of 199 Rural Development, Government of India pertaining to 2012-13 to 2017-18. Available on http:// 200 mgnregawebb4.nic.in/netnrega/writereaddata/citizen_out/wrkstatlink_30_05_1718ALL.html. 201
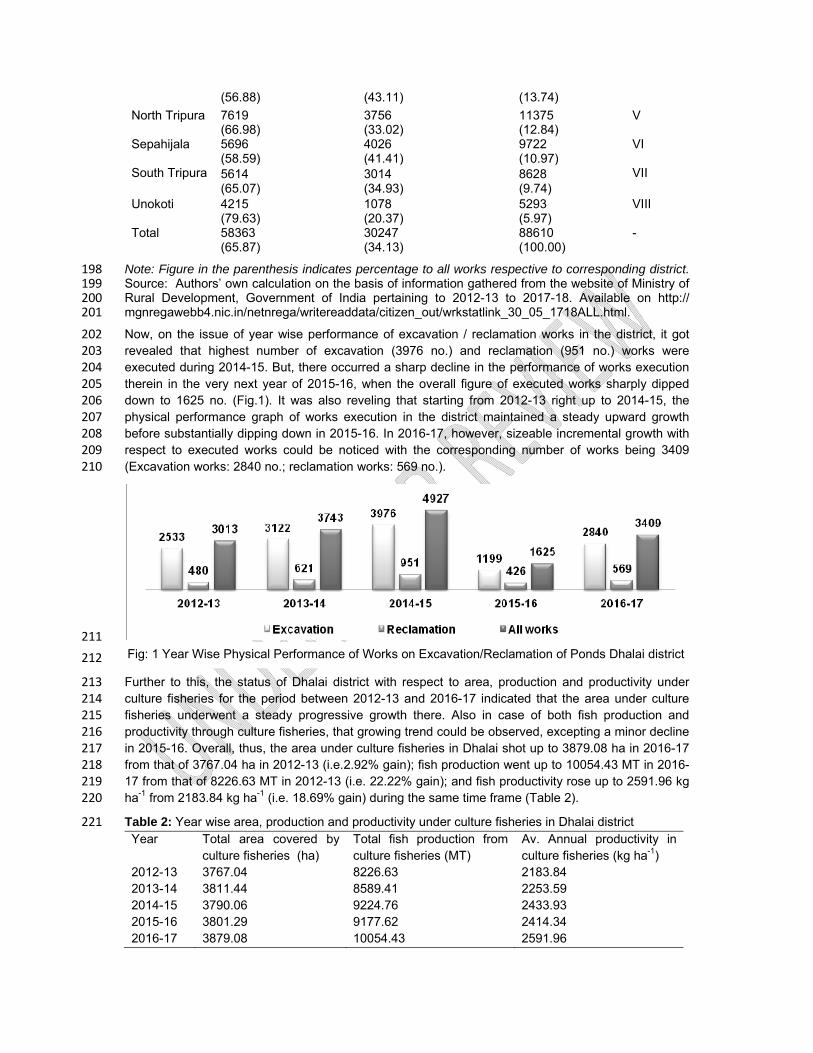
Now, on the issue of year wise performance of excavation / reclamation works in the district, it got 202 revealed that highest number of excavation (3976 no.) and reclamation (951 no.) works were 203 executed during 2014-15. But, there occurred a sharp decline in the performance of works execution 204 therein in the very next year of 2015-16, when the overall figure of executed works sharply dipped 205 down to 1625 no. (Fig.1). It was also reveling that starting from 2012-13 right up to 2014-15, the 206 physical performance graph of works execution in the district maintained a steady upward growth 207 before substantially dipping down in 2015-16. In 2016-17, however, sizeable incremental growth with 208 respect to executed works could be noticed with the corresponding number of works being 3409 209 (Excavation works: 2840 no.; reclamation works: 569 no.). 210
211
212
Further to this, the status of Dhalai district with respect to area, production and productivity under 213 culture fisheries for the period between 2012-13 and 2016-17 indicated that the area under culture 214 fisheries underwent a steady progressive growth there. Also in case of both fish production and 215 productivity through culture fisheries, that growing trend could be observed, excepting a minor decline 216 in 2015-16. Overall, thus, the area under culture fisheries in Dhalai shot up to 3879.08 ha in 2016-17 217 from that of 3767.04 ha in 2012-13 (i.e.2.92% gain); fish production went up to 10054.43 MT in 2016-218 17 from that of 8226.63 MT in 2012-13 (i.e. 22.22% gain); and fish productivity rose up to 2591.96 kg 219 ha-1 from 2183.84 kg ha-1 (i.e. 18.69% gain) during the same time frame (Table 2). 220
Table 2: Year wise area, production and productivity under culture fisheries in Dhalai district 221 Year Total area covered by
culture fisheries (ha) Total fish production from culture fisheries (MT)
Av. Annual productivity in culture fisheries (kg ha-1)
2012-13 3767.04 8226.63 2183.84 2013-14 3811.44 8589.41 2253.59 2014-15 3790.06 9224.76 2433.93 2015-16 3801.29 9177.62 2414.34 2016-17 3879.08 10054.43 2591.96
Fig: 1 Year Wise Physical Performance of Works on Excavation/Reclamation of Ponds Dhalai district
Overall 19048.91 45272.85 2376.66 Tripura 128190.15 317654.82 2477.99
In other way to express that by way of remaining in the same track to eligibly address the already 222 adopted strategy of the state for horizontal expansion of its area under aquaculture, a stage could 223 also be simultaneously set in the district for creation of an enabling environment for the vertical 224 expansion of its fisheries sector by way of all required integration of technology mediated good 225 aquaculture practices. 226
Socio-personal profile of the beneficiary respondents 227
Majority (63.04%) were found to be occupying below poverty line (BPL) category; and majority of 228 them (59.78%) were belonging to old age group category (>45 years). Contextual to caste categories, 229 while large majority (65.22%) was from Scheduled Tribe (ST) community, 27.17% of their counterpart 230 had their belongingness with Scheduled Caste (SC) community, and (5.44%) with Other Backward 231 Community (OBC). Whereas, 45.65% respondents were found to be comprising of 4-6 family 232 members, 42.39% of their counterparts were having up to 3 members. Majority (51.09%) were having 233 no background of any formal education, 20.65% were found to be up to primary level of education, 234 16.30 per cent up to middle level (i.e. Class VIII standard), 6.52% up to secondary level (i.e. Class X 235 standard), and 4.34% up to higher secondary level (i.e. Class XII standard). With respect to land 236 holding category, an overwhelming majority (80.43%) were found to be placed under marginal land 237 holding category with their holding size up to 1 ha of land (Table 3). 238
Table 3: Socio-personal profile of beneficiary respondents (n=92) 239
Sl. No.
Variables Categories Beneficiaries Frequency Percentage
1. Economic well being status
BPL 58 63.04 APL 34 36.96
2. Age Young (18 ≤ 35 years) 12 13.04 Middle (>35 to 45 years) 25 27.17 Old (> 45 years) 55 59.78
3 Caste General Caste 2 2.17 Other Backward Community 5 5.44 Scheduled Tribe 60 65.22 Scheduled Caste 25 27.17
4. Size of family Up to 3 members 39 42.39 4-6 members 42 45.65 7-9 members 9 9.78 >9 members 3 3.26
5. Level of education No formal education 47 51.09
Up to Primary 19 20.65 Up to Middle school 15 16.30 Up to Secondary 6 6.52 Up to Higher Secondary 4 4.35 Graduate 1 1.09
6. Land holding Size Marginal (up to 1 ha) 74 80.43 Small (1-2 ha) 14 15.22
Medium (2-4 ha) 4 4.35
7. Annual family income (�/ year)
≤ �1,00,000 10 10.87 > �1,00,000 ≤ �2,00,000 20 21.74 > �2,00,000 ≤ �3,00,000 24 26.09 > �3,00,000 ≤ �4,00,000 15 16.30 > �4,00,000 ≤ �5,00,000 16 17.39 > � 5,00,000 7 7.61
8. Experience in fish culture activities (yr)
Little experience (≤ 5 yr) 66 71.74 Moderate experience (6-10 yr) 23 25.00 Good experience (11-15 yr) 2 2.17 Very good experience (>16yr) 1 1.09
9. Share of fisheries to total income (%)
1-10 54 58.69 10.1- 20 34 36.96
*Average annual fish productivity was worked out by combining corresponding data between 2012-13 and 2016-17
Sl. No.
Variables Categories Beneficiaries Frequency Percentage
20.1-30 4 4.35 10. Material possession
status Low (<14.51) 12 13.05 Moderate (14.51 to 22.32) 71 77.17 High (>22.32) 9 9.78
11. Self confidence High 27 29.35 Moderate 64 69.56 Very little 1 1.09
12. Achievement motivation
Low (<13.94) 9 9.78 Medium (13.94 to 19.34) 60 65.22 High (>19.34) 23 25.00
13. Economic motivation Low (<8.08) 0 0.00
Medium (8.08 to11.12) 80 86.96 High (>11.12) 12 13.04
14. Information management behavior
Low (<30.02) 16 17.40 Medium ( 30.02 to 38.74) 66 71.74
High (>38.74) 10 10.86
While 10.87% were found to be having their annual family income <�1,00,000/-, 21.74% were found 240 being placed to the income range category between �100000-�200000/-, 26.09% to the income 241 range category between �200000-�300000/-,16.30% between �300000-�400000/-, and 17.39% 242 between �400000-�500000/-. Relative to the respondents' experience in fisheries activities, gross 243 majority (71.74%) were found to have little experience (≤5 years) and 25.00% of them were having 244 moderate experience (6 to 10 years). While for majority (58.69%) of the respondents, the share of 245 income from culture fisheries appeared to be ranging between only 1-10%, for 36.96% of their 246 counterpart that was in the range of 10.1-20%. In terms of status of material possession, majority 247 (77.17%) were found to be placed in the moderate category. Majority of the respondents were also 248 found to be at moderate levels in cases of self confidence (69.56%), achievement motivation 249 (65.22%), and economic motivation (86.96%). Further, relating to information management behavior, 250 majority (71.74%) was observed to be placed under medium category (Table 3). 251
Fish productivity in water bodies of the respondents 252
Table 4: Comparison of fish productivity 253
Average annual fish productivity from culture fisheries (kg ha-1)* Tripura Dhalai Ponds of MGNREGS
beneficiary respondents Shortfall
From state average
From district average
2477.99 2376.66 414.25 5.98 times 5.74 times
254
The worked out five years’ aggregate level average fish productivity of the beneficiary respondents 255 between 2012-13 and 2016-17 gave rise to the development of a genuine concern. In sharp contrast 256 to the state average (2477.99 kg ha-1) as well as the average of Dhalai district (2376.66 kg ha-1), 257 where the study was conducted, it was noted that the accrual of average fish productivity by the 258 beneficiary respondents from their water bodies was too low. And with the level of respondents’ fish 259 productivity being only 414.25 kg ha-1 during that reference period, it lagged behind by 5.98 times 260 from the state average and 5.74 times from that of Dhalai district i.e. the locale of the study (Table 4). 261
Annual income from MGNREGS supported water bodies and pond surroundings 262
Table 5: Annual Income from MGNREGS supported water bodies and pond surroundings 263
Annual income from water bodies (�)
Frequency Percentage Average annual income (�)
≤ 500 10 10.87 1157
501-1000 21 22.83 1001-1500 29 31.52
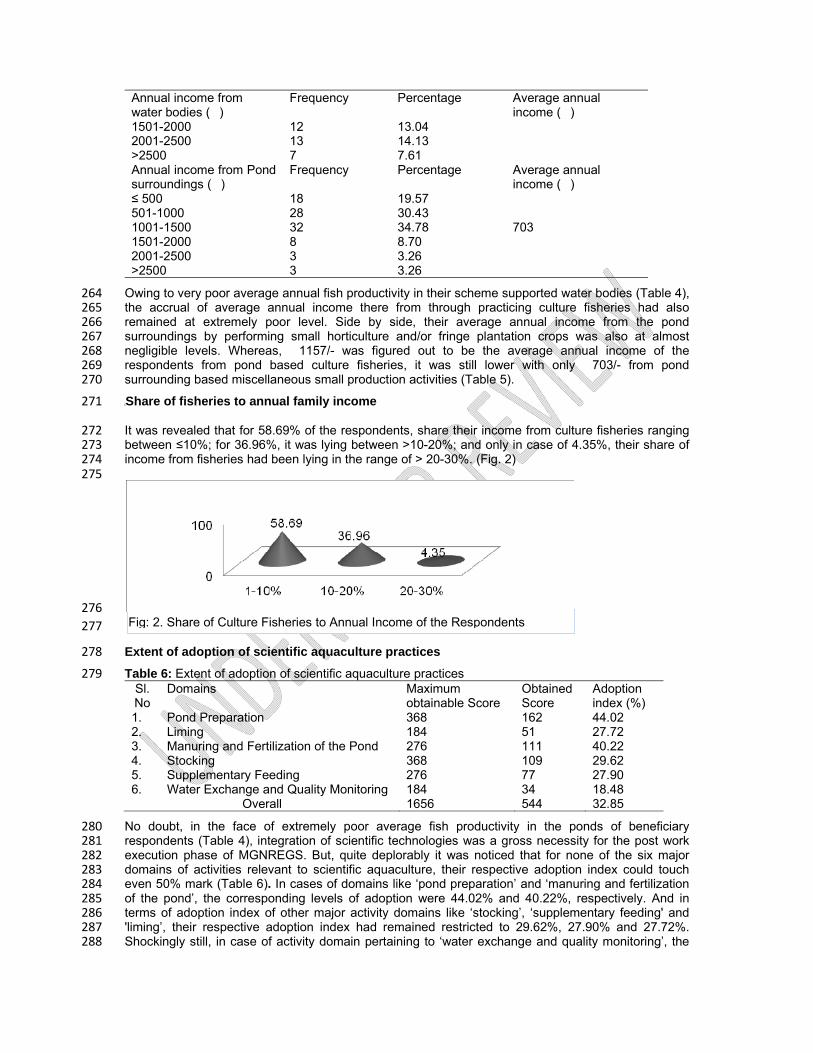
Fig: 2. Share of Culture Fisheries to Annual Income of the Respondents
Annual income from water bodies (�)
Frequency Percentage Average annual income (�)
1501-2000 12 13.04 2001-2500 13 14.13 >2500 7 7.61 Annual income from Pond surroundings (�)
Frequency Percentage Average annual income (�)
≤ 500 18 19.57 703
501-1000 28 30.431001-1500 32 34.78 1501-2000 8 8.70 2001-2500 3 3.26 >2500 3 3.26
Owing to very poor average annual fish productivity in their scheme supported water bodies (Table 4), 264 the accrual of average annual income there from through practicing culture fisheries had also 265 remained at extremely poor level. Side by side, their average annual income from the pond 266 surroundings by performing small horticulture and/or fringe plantation crops was also at almost 267 negligible levels. Whereas, �1157/- was figured out to be the average annual income of the 268 respondents from pond based culture fisheries, it was still lower with only �703/- from pond 269 surrounding based miscellaneous small production activities (Table 5). 270
[Share of fisheries to annual family income 271
It was revealed that for 58.69% of the respondents, share their income from culture fisheries ranging 272 between ≤10%; for 36.96%, it was lying between >10-20%; and only in case of 4.35%, their share of 273 income from fisheries had been lying in the range of > 20-30%. (Fig. 2) 274 275
276
277
Extent of adoption of scientific aquaculture practices 278
Table 6: Extent of adoption of scientific aquaculture practices 279 Sl.No
Domains Maximum obtainable Score
Obtained Score
Adoption index (%)
1. Pond Preparation 368 162 44.02 2. Liming 184 51 27.72 3. Manuring and Fertilization of the Pond 276 111 40.22 4. Stocking 368 109 29.62 5. Supplementary Feeding 276 77 27.90 6. Water Exchange and Quality Monitoring 184 34 18.48
Overall 1656 544 32.85
No doubt, in the face of extremely poor average fish productivity in the ponds of beneficiary 280 respondents (Table 4), integration of scientific technologies was a gross necessity for the post work 281 execution phase of MGNREGS. But, quite deplorably it was noticed that for none of the six major 282 domains of activities relevant to scientific aquaculture, their respective adoption index could touch 283 even 50% mark (Table 6). In cases of domains like ‘pond preparation’ and ‘manuring and fertilization 284 of the pond’, the corresponding levels of adoption were 44.02% and 40.22%, respectively. And in 285 terms of adoption index of other major activity domains like ‘stocking’, ‘supplementary feeding' and 286 'liming’, their respective adoption index had remained restricted to 29.62%, 27.90% and 27.72%. 287 Shockingly still, in case of activity domain pertaining to ‘water exchange and quality monitoring’, the 288
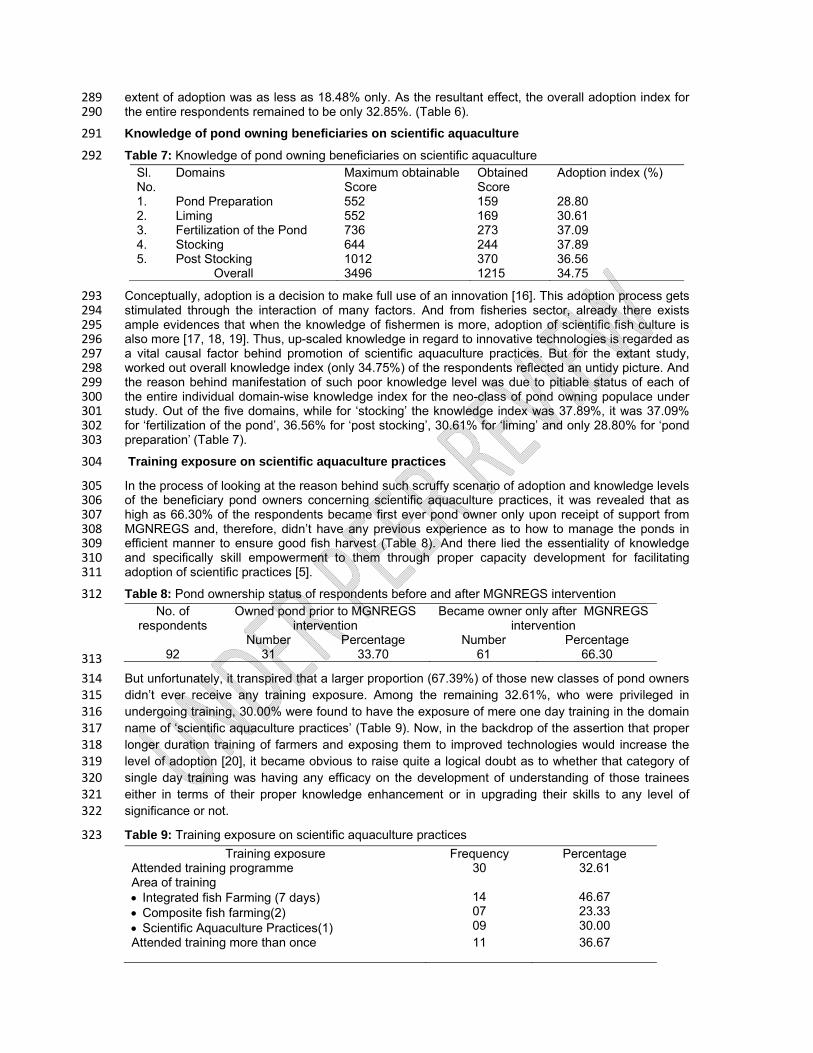
extent of adoption was as less as 18.48% only. As the resultant effect, the overall adoption index for 289 the entire respondents remained to be only 32.85%. (Table 6). 290
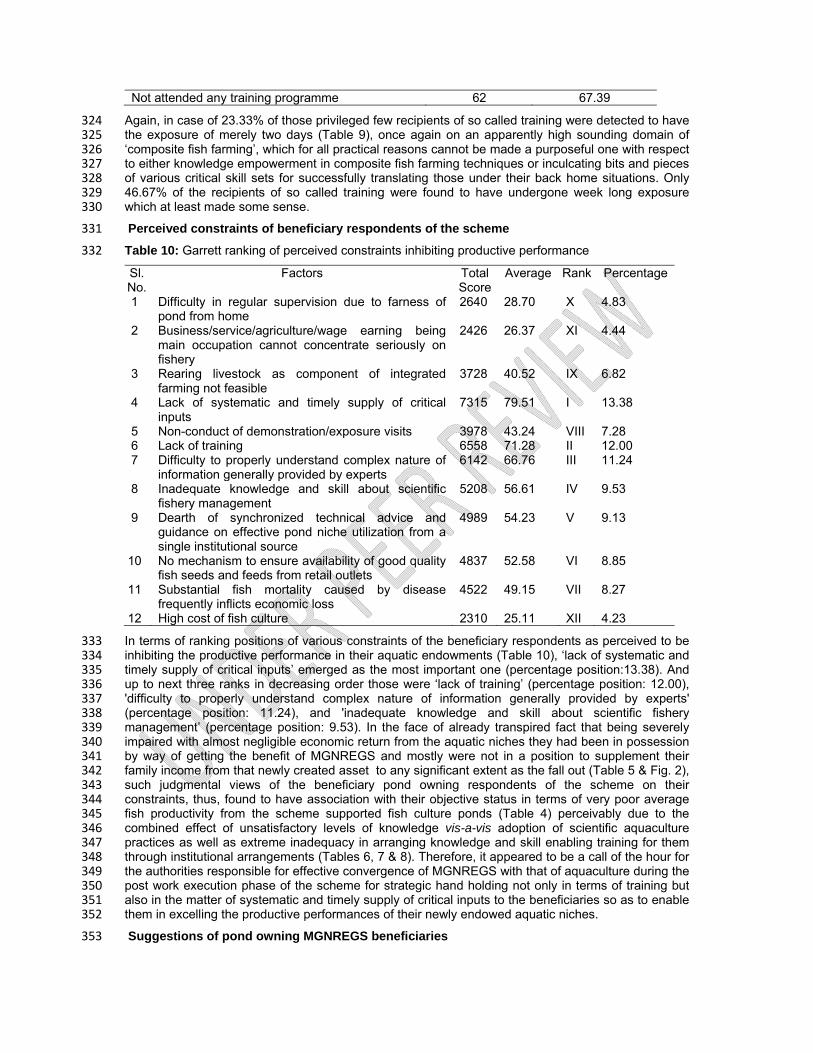
Knowledge of pond owning beneficiaries on scientific aquaculture 291
Table 7: Knowledge of pond owning beneficiaries on scientific aquaculture 292
Sl. No.
Domains Maximum obtainable Score
Obtained Score
Adoption index (%)
1. Pond Preparation 552 159 28.80 2. Liming 552 169 30.61 3. Fertilization of the Pond 736 273 37.09 4. Stocking 644 244 37.89 5. Post Stocking 1012 370 36.56
Overall 3496 1215 34.75
Conceptually, adoption is a decision to make full use of an innovation [16]. This adoption process gets 293 stimulated through the interaction of many factors. And from fisheries sector, already there exists 294 ample evidences that when the knowledge of fishermen is more, adoption of scientific fish culture is 295 also more [17, 18, 19]. Thus, up-scaled knowledge in regard to innovative technologies is regarded as 296 a vital causal factor behind promotion of scientific aquaculture practices. But for the extant study, 297 worked out overall knowledge index (only 34.75%) of the respondents reflected an untidy picture. And 298 the reason behind manifestation of such poor knowledge level was due to pitiable status of each of 299 the entire individual domain-wise knowledge index for the neo-class of pond owning populace under 300 study. Out of the five domains, while for ‘stocking’ the knowledge index was 37.89%, it was 37.09% 301 for ‘fertilization of the pond’, 36.56% for ‘post stocking’, 30.61% for ‘liming’ and only 28.80% for ‘pond 302 preparation’ (Table 7). 303
Training exposure on scientific aquaculture practices 304
In the process of looking at the reason behind such scruffy scenario of adoption and knowledge levels 305 of the beneficiary pond owners concerning scientific aquaculture practices, it was revealed that as 306 high as 66.30% of the respondents became first ever pond owner only upon receipt of support from 307 MGNREGS and, therefore, didn’t have any previous experience as to how to manage the ponds in 308 efficient manner to ensure good fish harvest (Table 8). And there lied the essentiality of knowledge 309 and specifically skill empowerment to them through proper capacity development for facilitating 310 adoption of scientific practices [5]. 311
Table 8: Pond ownership status of respondents before and after MGNREGS intervention 312
No. of respondents
Owned pond prior to MGNREGS intervention
Became owner only after MGNREGS intervention
Number Percentage Number Percentage 92 31 33.70 61 66.30
313
But unfortunately, it transpired that a larger proportion (67.39%) of those new classes of pond owners 314 didn’t ever receive any training exposure. Among the remaining 32.61%, who were privileged in 315 undergoing training, 30.00% were found to have the exposure of mere one day training in the domain 316 name of ‘scientific aquaculture practices’ (Table 9). Now, in the backdrop of the assertion that proper 317 longer duration training of farmers and exposing them to improved technologies would increase the 318 level of adoption [20], it became obvious to raise quite a logical doubt as to whether that category of 319 single day training was having any efficacy on the development of understanding of those trainees 320 either in terms of their proper knowledge enhancement or in upgrading their skills to any level of 321 significance or not. 322
Table 9: Training exposure on scientific aquaculture practices 323
Training exposure Frequency Percentage Attended training programme 30 32.61 Area of training Integrated fish Farming (7 days) Composite fish farming(2) Scientific Aquaculture Practices(1)
14 07 09
46.67 23.33 30.00
Attended training more than once 11 36.67
Not attended any training programme 62 67.39
Again, in case of 23.33% of those privileged few recipients of so called training were detected to have 324 the exposure of merely two days (Table 9), once again on an apparently high sounding domain of 325 ‘composite fish farming’, which for all practical reasons cannot be made a purposeful one with respect 326 to either knowledge empowerment in composite fish farming techniques or inculcating bits and pieces 327 of various critical skill sets for successfully translating those under their back home situations. Only 328 46.67% of the recipients of so called training were found to have undergone week long exposure 329 which at least made some sense. 330
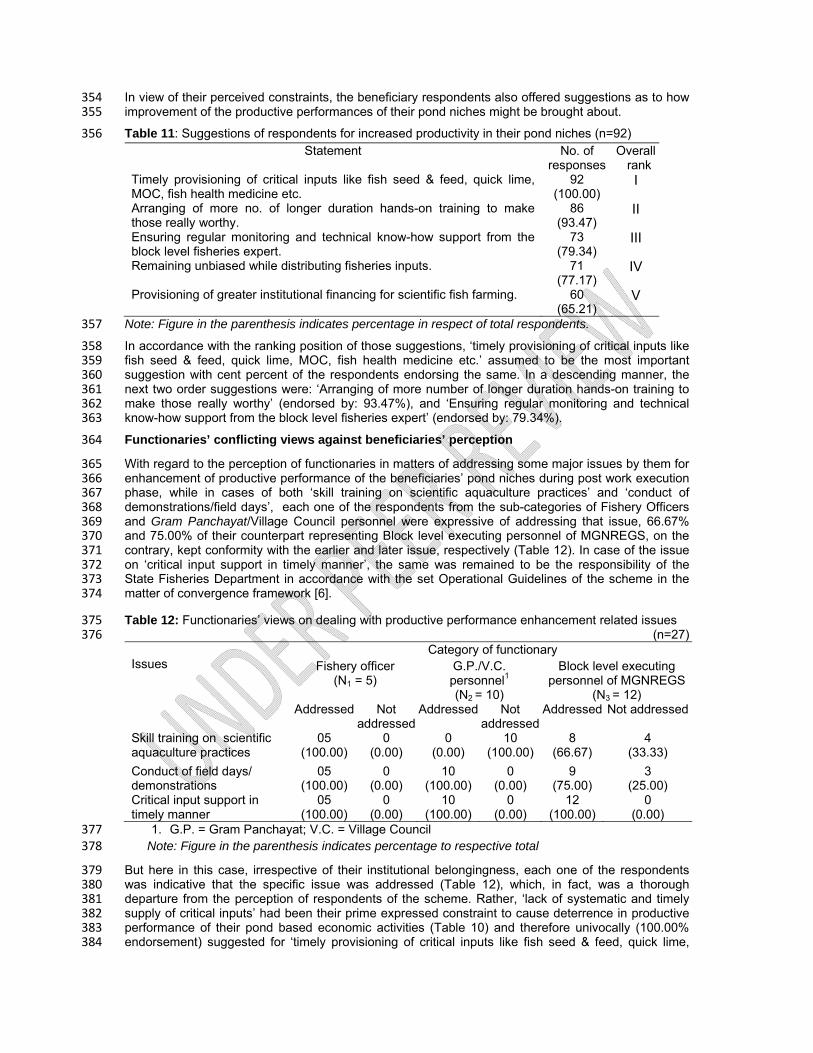
Perceived constraints of beneficiary respondents of the scheme 331
Table 10: Garrett ranking of perceived constraints inhibiting productive performance 332
Sl. No.
Factors Total Score
Average Rank Percentage
1 Difficulty in regular supervision due to farness of pond from home
2640 28.70 X 4.83
2 Business/service/agriculture/wage earning being main occupation cannot concentrate seriously on fishery
2426 26.37 XI 4.44
3 Rearing livestock as component of integrated farming not feasible
3728 40.52 IX 6.82
4 Lack of systematic and timely supply of critical inputs
7315 79.51 I 13.38
5 Non-conduct of demonstration/exposure visits 3978 43.24 VIII 7.28 6 Lack of training 6558 71.28 II 12.00 7 Difficulty to properly understand complex nature of
information generally provided by experts6142 66.76 III 11.24
8 Inadequate knowledge and skill about scientific fishery management
5208 56.61 IV 9.53
9 Dearth of synchronized technical advice and guidance on effective pond niche utilization from a single institutional source
4989 54.23 V 9.13
10 No mechanism to ensure availability of good quality fish seeds and feeds from retail outlets
4837 52.58 VI 8.85
11 Substantial fish mortality caused by disease frequently inflicts economic loss
4522 49.15 VII 8.27
12 High cost of fish culture 2310 25.11 XII 4.23
In terms of ranking positions of various constraints of the beneficiary respondents as perceived to be 333 inhibiting the productive performance in their aquatic endowments (Table 10), ‘lack of systematic and 334 timely supply of critical inputs’ emerged as the most important one (percentage position:13.38). And 335 up to next three ranks in decreasing order those were ‘lack of training’ (percentage position: 12.00), 336 'difficulty to properly understand complex nature of information generally provided by experts' 337 (percentage position: 11.24), and 'inadequate knowledge and skill about scientific fishery 338 management’ (percentage position: 9.53). In the face of already transpired fact that being severely 339 impaired with almost negligible economic return from the aquatic niches they had been in possession 340 by way of getting the benefit of MGNREGS and mostly were not in a position to supplement their 341 family income from that newly created asset to any significant extent as the fall out (Table 5 & Fig. 2), 342 such judgmental views of the beneficiary pond owning respondents of the scheme on their 343 constraints, thus, found to have association with their objective status in terms of very poor average 344 fish productivity from the scheme supported fish culture ponds (Table 4) perceivably due to the 345 combined effect of unsatisfactory levels of knowledge vis-a-vis adoption of scientific aquaculture 346 practices as well as extreme inadequacy in arranging knowledge and skill enabling training for them 347 through institutional arrangements (Tables 6, 7 & 8). Therefore, it appeared to be a call of the hour for 348 the authorities responsible for effective convergence of MGNREGS with that of aquaculture during the 349 post work execution phase of the scheme for strategic hand holding not only in terms of training but 350 also in the matter of systematic and timely supply of critical inputs to the beneficiaries so as to enable 351 them in excelling the productive performances of their newly endowed aquatic niches. 352
Suggestions of pond owning MGNREGS beneficiaries 353
In view of their perceived constraints, the beneficiary respondents also offered suggestions as to how 354 improvement of the productive performances of their pond niches might be brought about. 355
Table 11: Suggestions of respondents for increased productivity in their pond niches (n=92) 356
Statement No. of responses
Overall rank
Timely provisioning of critical inputs like fish seed & feed, quick lime, MOC, fish health medicine etc.
92 (100.00)
I
Arranging of more no. of longer duration hands-on training to make those really worthy.
86 (93.47)
II
Ensuring regular monitoring and technical know-how support from the block level fisheries expert.
73 (79.34)
III
Remaining unbiased while distributing fisheries inputs. 71 (77.17)
IV
Provisioning of greater institutional financing for scientific fish farming. 60 (65.21)
V
Note: Figure in the parenthesis indicates percentage in respect of total respondents. 357
In accordance with the ranking position of those suggestions, ‘timely provisioning of critical inputs like 358 fish seed & feed, quick lime, MOC, fish health medicine etc.’ assumed to be the most important 359 suggestion with cent percent of the respondents endorsing the same. In a descending manner, the 360 next two order suggestions were: ‘Arranging of more number of longer duration hands-on training to 361 make those really worthy’ (endorsed by: 93.47%), and ‘Ensuring regular monitoring and technical 362 know-how support from the block level fisheries expert’ (endorsed by: 79.34%). 363
Functionaries’ conflicting views against beneficiaries’ perception 364
With regard to the perception of functionaries in matters of addressing some major issues by them for 365 enhancement of productive performance of the beneficiaries’ pond niches during post work execution 366 phase, while in cases of both ‘skill training on scientific aquaculture practices’ and ‘conduct of 367 demonstrations/field days’, each one of the respondents from the sub-categories of Fishery Officers 368 and Gram Panchayat/Village Council personnel were expressive of addressing that issue, 66.67% 369 and 75.00% of their counterpart representing Block level executing personnel of MGNREGS, on the 370 contrary, kept conformity with the earlier and later issue, respectively (Table 12). In case of the issue 371 on ‘critical input support in timely manner’, the same was remained to be the responsibility of the 372 State Fisheries Department in accordance with the set Operational Guidelines of the scheme in the 373 matter of convergence framework [6]. 374
Table 12: Functionaries’ views on dealing with productive performance enhancement related issues 375 (n=27) 376
Issues
Category of functionary Fishery officer
(N1 = 5) G.P./V.C. personnel1
(N2 = 10)
Block level executing personnel of MGNREGS
(N3 = 12) Addressed Not
addressed Addressed Not
addressedAddressed Not addressed
Skill training on scientific aquaculture practices
05 (100.00)
0 (0.00)
0 (0.00)
10 (100.00)
8 (66.67)
4 (33.33)
Conduct of field days/ demonstrations
05 (100.00)
0 (0.00)
10 (100.00)
0 (0.00)
9 (75.00)
3 (25.00)
Critical input support in timely manner
05 (100.00)
0 (0.00)
10 (100.00)
0 (0.00)
12 (100.00)
0 (0.00)
1. G.P. = Gram Panchayat; V.C. = Village Council 377 Note: Figure in the parenthesis indicates percentage to respective total 378
But here in this case, irrespective of their institutional belongingness, each one of the respondents 379 was indicative that the specific issue was addressed (Table 12), which, in fact, was a thorough 380 departure from the perception of respondents of the scheme. Rather, ‘lack of systematic and timely 381 supply of critical inputs’ had been their prime expressed constraint to cause deterrence in productive 382 performance of their pond based economic activities (Table 10) and therefore univocally (100.00% 383 endorsement) suggested for ‘timely provisioning of critical inputs like fish seed & feed, quick lime, 384
MOC, fish health medicine etc.’ for ensuring increased productivity in their scheme supported water 385 bodies (Table 11). On the issue like ‘skill training on scientific aquaculture practices’ also the 386 perception of the respondents grossly varied from the expressed views of the Fisheries Officers. 387 Rather, for the beneficiary respondents, ‘lack of training facilities’ emerged out to be the second most 388 important inhibiting factor towards improving the productive performance of their pond based 389 economic activities (Table 10) and accordingly 93.47% of them were suggestive of ‘arranging of more 390 number of longer duration hands-on training to make those really worthy’ (Table 11). 391
CONCLUSION 392
Though the opportune stage has been created through commendable execution of works relating to 393 excavation and reclamation of water bodies in the district, much is still to be done if the issue of 394 convergence of MGNREGS with aquaculture sector of the district is to meaningfully address during 395 the post work execution phase, so that the beneficiary pond owning class, characterized by very high 396 intensity of disadvantageous communities, is truly enabled to efficiently harness those built up assets 397 as a genuine livelihood means for them to improve the quality of their lives. 398
RECOMMENDATION 399
Contextual to the quite noticeable insufficiency in the knowledge and adoption levels of the pond 400 owning beneficiaries of the scheme in the matter of scientific aquaculture practices coupled extreme 401 dearth of providing systematic knowledge and skill enabling training to them, and lack of systematic 402 and timely supply of critical inputs, it is being strongly advocated to take up strategic interventions in 403 devotedly organizing in situ demonstrations and tailor made longer duration skill enabling trainings on 404 relevant domains of good practices alongside rendering regular expert advisory/knowhow support and 405 timely providing of critical inputs like fish seed & feed, quick lime, MOC, fish health medicine etc. as 406 per the fitment of requirements of the target populace. 407
COMPETING INTEREST 408
No competing interests do exist. 409
CONSENT 410
The first author being the student worker and all the remaining authors being the members of her 411 Advisory Committee, it is being consented jointly in favour of publishing of the paper. 412
ETHICAL APPROVAL 413
Not Applicable 414
REFERENCES 415
1. Koyu, B., Sarkar, A., Singh, R., Singh, RJ. (2017). Is MGNREGA a myth for Arunachal Pradesh? 416 Field evidence. Economic Affairs. 62(2): 313-319. 417
2. Ministry of Rural Development, Govt. of India, (2008). National Rural Employment Guarantee Act 418 (2005): Operational Guidelines (3rd Edn.). Department of Rural Development, Govt. of India. New 419 Delhi. 1- 4. 420 Available: https://nrega.nic.in/Nrega_guidelinesEng.pdf (Accessed 12 March 2018). 421
3. Mondal, S. (2013). Text Book of Agricultural Extension with Global Innovations. Kalyani 422 Publishers, New Delhi. 203-207. 423
4. Koyu, B. (2015). An evaluative study on the impact of MGNREGA in Arunachal Pradesh. M.Sc. 424 (Agri.) Thesis. Submitted to School of Social Sciences, College of Post-Graduate Studies, 425 Central Agricultural University, Umiam, Meghalaya, India. 39-40. 426
5. Ijardar, RS. (2017). Influence of MGNREGA on Aquaculture: A case study in West Tripura. 427 M.F.Sc. Thesis submitted to Department of Extension and Social Sciences, College of Fisheries, 428 Central Agricultural University (Imphal), Lembucherra, Tripura, India.1-4. 429
6. Ministry of Rural Development, Govt. of India. (2013). Mahatma Gandhi National Rural 430 Employment Guarantee Act (2005): Operational Guidelines (4th Edn.). Department of Rural 431 Development, Govt. of India, New Delhi. 181-223. 432
7. Census of India. (2011). Provisional Population Totals: Figures at a Glance. Ministry of Home 433 Affairs, Government of India, New Delhi. 434 http://censusindia.gov.in/2011-prov-results/prov_data_products_tripura.html. 435
8. Saha, B., Pandit, A. (2014). Fish farming practices of Tripura: A socio – economic perspective. 436 J. Inland Fish. Soc. India. 46(2): 41-47. 437
9. Debnath, B., Biradar, RS., Pandey, SK., Krishnan , M., Shyam, S., Salim, SS. (2013). Present 438 status and prospects of fisheries resources, fish seed and fish availability in Tripura. Journal of 439 Fisheries, Economics and Development. 14 (1): 30-41. 440
10. Ijardar, RS., Sarkar, A., Upadhyay, AD., Biswas, P., Singh, YJ. (2017) Performance of 441 MGNREGS - Aquaculture convergence: A study in Tripura, India. International Journal of Stress 442 and Management. 8(4): 574-580. 443
11. Directorate of Fisheries, Govt. of Tripura, (2014). Mandate of the Department. Web location: 444 http://fisheries.tripura.gov.in/mandate.htm (Accessed 26 April 2018). 445
12. Ministry of Rural Development. (2018).The MGNREGA: Status of Work Completion (State: 446 Tripura). Government of India, New Delhi. Available:http://mgnregawebb4.nic.in/ 447 netnrega/writereaddata/citizen_out/wrkstatlink_30_05_1718ALL.html (Accessed 20 March 2019). 448
13. Directorate of Fisheries, Govt. of Tripura (2018). District and year wise status of area and 449 production under culture fisheries in Tripura. 1-2. 450
14. Saha, B., Singh, NN., Pandey, DK. (2010). Knowledge and Adoption of Improved Practices of 451 Carp Production at Tripura in India: Intramural Project Report, Central Agricultural University, 452 Imphal. 25-26. 453
15. Garrett, HE., Woodworth, RS. (1969). Statistics in Psychology and Education. Vakils, Fetter and 454 Simons Pvt. Ltd. Bombay. 329. 455
16. Rogers, EM. (1983). Diffusion of Innovations. (3rd Edn.). The Free Press, New York. 21-22. 456 17. Haque, A. (1981). Study of some factors related to the adoption of recommended species of fish 457
in composite fish culture. Doctoral thesis, BCKV, Mohanpur, India. 69-73. 458 18. Talukdar, PK., Sontaki, BS. (2005). Correlates of Adoption of Composite Fish Culture Practices 459
by Fish Farmers of Assam, India. The Journal of - Agricultural-Science. 1(1): 12-18. 460 19. Goswami, B., Mukhopadhyay, SB., Dana, SS. (2015). A study on Factors Influencing the 461
Adoption Behaviour of Fish Farmers with Special Reference to Scientific Fish Culture in West 462 Bengal, India. International Journal of Bio-resource and Stress Management. 3(3): 362-367. 463
20. Singh, AK., Singh GP., Singh, B. (2002). Correlates of Farmers’ knowledge of improved chickpea 464 production technology. Indian Journal of Extension Education. 38 (3&4): 162-167. 465
ABBREVIATIONS 466 MGNREGA MGNREGS
Mahatma Gandhi National Rural Employment Guarantee Act Mahatma Gandhi National Rural Employment Guarantee Scheme
% Percentage Kg Kilogram Ha Hectare PPS Probability Proportionate to Size Sampling Vis-a-vis In Relation to Viz. Namely MT Metric tone BPL Below Poverty Line ST Schedule Tribe SC Schedule Caste OBC Other Backward Classes GP Gram Panchayat VC Village Council etc. Et cetera no. Number 467
468
469
470
471
472
Related Documents